Embed Size (px)
Citation preview

Kenya Monthly Economic Review, November 2009 1
MONTHLY ECONOMIC REVIEWNOVEMBER 2009
The Monthly Economic Review, prepared by the Central Bank ofKenya starting with the June 1997 edition, is available on the internet
at:http://www.centralbank.go.ke
Information in the Monthly Economic Review is provided for publicinformation and may be reproduced with due acknowledgment.
Enquiries concerning this publication should be addressed to: TheDirector, Research Department, Central Bank of Kenya, P. O. Box
60000-00200, Nairobi. email: [email protected]
CONTENTS
Overview ............................................................................... 2
1. Trends in Various Measures of Inflation ............................ 7
2. Developments in Money, Credit and Interest Rates .......... 10
3. Performance of the Real Sector ...................................... 15
4. Developments in the Balance of Payments and Exchange
Rates .............................................................................. 23
5. Developments in the Banking Sector.............................. 28
6. Government Budget Performance ................................... 34
7. Developments in Public Debt ......................................... 38
8. Activity in the Stock Market ........................................... 43
9. Balance Sheet of the Central Bank of Kenya .................. 45

2 Kenya Monthly Economic Review, November 2009
Inflation
GovernmentFiscal
Operations
OVERVIEW
This Monthly Economic Review highlights recent economic
developments through November 2009. It highlights developments in
money, credit and banking, inflation, interest rates and the shilling
exchange rate. It also highlights developments in the real sector,
Government budgetary operations, public debt and balance of payments.
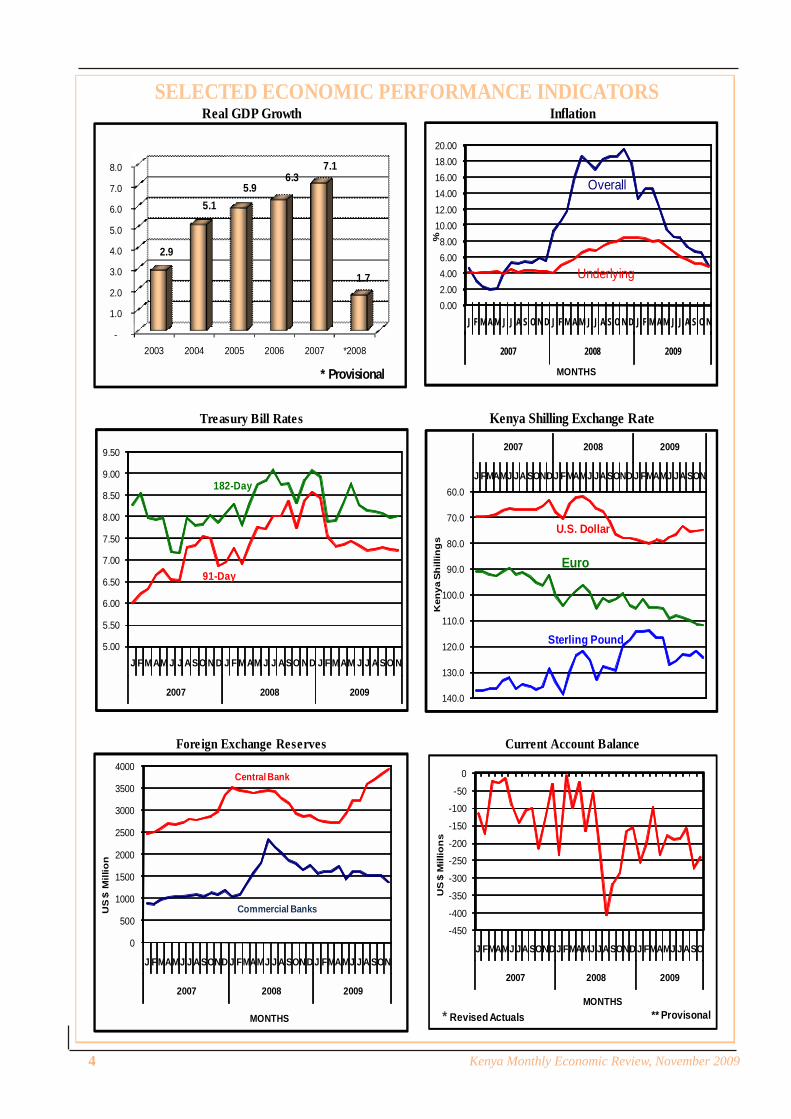
Economic growth stagnated in the third quarter of 2009 at 0.0 percent
with the level of output of goods and services remaining equal to that
experienced in the same quarter of 2008. This was as a result of various
shocks including the persistent drought which adversely affected the
agricultural and electricity sectors and the rising fuel prices which
suppressed the transport and manufacturing sectors. Agriculture, which
constitutes 23.4 percent of GDP, declined by 3.5 percent during the
third quarter of 2009 while Manufacturing, Transport and
communications, and Construction, which together account for about
25.0 percent of GDP also declined during the quarter by 2.4, 1.8 and
1.12 percent, respectively. The above decreases were counteracted by
increases in some sectors, with the hotels and restaurants sector leading
by 44.4 percent increase. Other shocks included the global economic
crisis and the lag effects of the post election crisis experienced in 2008.
Growth rates during the first and second quarter of 2009 were equivalent
to 4.0 and 2.1 percent, respectively.
The overall 12-month inflation decelerated over the year to November
2009 from 17.8 percent in December 2008 to 5.0 percent in November
2009, a level last recorded in December 2007. The annual average
inflation was comparatively high at 10.2 percent in November 2009.
12-month inflation excluding food, energy and transport edged down
gradually from 8.1 percent in October 2008 to 4.8 percent in November
2009.
The central Government budgetary operations in the five months of the
fiscal year 2009/10 resulted in a deficit of Ksh 38.2 billion or 1.6 percent
of GDP on commitment basis compared with a deficit of Ksh 26.4 bil-
Real GDPGrowth
Introduction

Kenya Monthly Economic Review, November 2009 3
Public DebtDevelopments
Balance ofPayments
ExchangeRates
InterestRates
MonetaryExpansion
lion or 1.2 percent of GDP in a similar period of 2008/09. The budget
deficit during the period was well within the programmed target of 2.3
percent of GDP on a commitment basis.
Kenya’s public and publicly guaranteed debt increased by 2.9 percent
in the first five months of fiscal year 2009/10 to stand at Ksh 1,084.2
billion in November 2009 from Ksh 1,053.7 billion in June 2009
representing 44.1 percent of GDP. The external debt to GDP ratio
decreased from 22.4 percent in June 2009 to 21.2 percent in November
2009 while the domestic debt to GDP ratio increased from 21.7 percent
to 22.9 percent during the period.
Money supply, M3, grew by 14.8 percent in the year to November 2009
compared with 19.4 percent in a corresponding period in 2008, and
remained below the projected 15.1 percent growth in November 2009.
In the month of November 2009, the MPC lowered the Central Bank
Rate (CBR) to 7.0 percent from 7.75 percent in October 2009. Other
short term and long term interest rates trended upwards in November
2009 with exception of savings deposits and 91-day Treasury bill rate
that declined by 14 and 2 basis points respectively.
Kenya’s balance of payments position improved from a surplus of US$
30 million in the year to October 2008 to a surplus of US$ 369 million in
the year to October 2009. The improvement reflected the surplus in the
capital and financial account which offset the current account deficit.
The Kenya shilling depicted mixed performance against major world
currencies. It strengthened against the US dollar but weakened against
the Sterling Pound, the Japanese Yen and the Euro in November 2009.
Against the US dollar, the shilling exchanged at Ksh 74.74 per US dollar
in November 2009 compared with Ksh 75.24 per US dollar in October
2009.
4 Kenya Monthly Economic Review, November 2009
Foreign Exchange Reserves Current Account Balance
SELECTED ECONOMIC PERFORMANCE INDICATORS
Kenya Shilling Exchange RateTreasury Bill Rates
InflationReal GDP Growth
-
1.0
2.0
3.0
4.0
5.0
6.0
7.0
8.0
2003 2004 2005 2006 2007 *2008
2.9
5.1 5.9
6.3 7.1
1.7
* Provisional
0.002.004.006.008.00
10.0012.0014.0016.0018.0020.00
J F M A M J J A S O N D J F M A M J J A S O N D J F M AM J J A S O N
2007 2008 2009
%
MONTHS
Overall
Underlying
60.0
70.0
80.0
90.0
100.0
110.0
120.0
130.0
140.0
J FMAMJ JASONDJ FMAMJ JASONDJ FMAMJ JASON
2007 2008 2009K
enya
Sh
illin
gs
U.S. Dollar
Euro
Sterling Pound
0
500
1000
1500
2000
2500
3000
3500
4000
J FMAMJ J ASOND J FMAMJ J A SONDJ FMAMJ J A SON
2007 2008 2009
US
$ M
illio
n
MONTHS
Commercial Banks
Central Bank
5.00
5.50
6.00
6.50
7.00
7.50
8.00
8.50
9.00
9.50
J F MAM J J ASO N D J F MAM J J ASO ND J F MAM J J A SO N
2007 2008 2009
182-Day
91-Day
* Revised Actuals ** Provisonal
-450
-400
-350
-300
-250
-200
-150
-100
-50
0
J FMAMJ JASONDJ FMAMJ JASONDJ FMAMJ JASO
2007 2008 2009
US
$ M
illio
ns
MONTHS

Kenya Monthly Economic Review, November 2009 5
SELECTED ANNUAL ECONOMIC INDICATORS
Sources: Kenya National Bureau of Statistics, Treasury, Central Bank of Kenya and Nairobi StockExchange
* Provisional.** Revised to reflect data in Economic Survey 2008.*** Fiscal year to June 30th.**** Figures in parentheses refer to official reserves in terms of average of current year of imports of goods and non-factor services.¹ Previously M3XT² Previously M3X3 Revised
INDICATOR 2000 2001 2002 2003 2004 2005 2006 2007 2008*
1. POPULATION*People in Millions 29.53 30.90 32.20 33.20 34.20 35.10 36.10 37.20 38.30Growth (% ) 3.00 4.64 4.21 3.11 2.54 2.50 2.85 3.05 1.03
2. NATIONAL ACCOUNTS** GDP at Basic Prices (Ksh m) 858,919 906,874 918,914 1,006,062 1,132,850 1,261,527 1,443,981 1,610,831 1,852,263GDP at Market Prices (Ksh m):
At Current Prices 967,838 1,020,022 1,035,374 1,131,783 1,274,328 1,415,724 1,622,434 1,825,960 2,099,798At Constant 2001 Market Prices 982,855 1,020,022 1,025,584 1,055,658 1,109,541 1,175,081 1,249,331 1,338,039 1,360,626Real GDP Growth (% ) 0.60 4.50 0.60 2.90 5.10 5.91 6.32 7.10 1.69
Per Capita Income Real 2001 prices (Ksh) 33,283 33,767 31,828 31,825 32,443 33,478 34,608 35,969 35,5253. GROSS NATIONAL SAVINGS (% of GDP at mkt prices)\3 12.9 10.0 8.1 10.1 12.2 13.4 14.9 13.1 14.8 4. GROSS DOMESTIC SAVINGS ( % of GDP at mkt prices)\3 6.7 4.4 4.0 4.8 6.6 7.2 7.2 5.8 7.95. GROSS DOMESTIC INVESTMENTS ( % of GDP at mkt prices) 17.4 18.8 14.9 16.4 17.1 16.9 18.0 19.1 19.26. CONSUMER PRICE INFLATION (URBAN) 1997 BASE
Av erage Annual Inflation 10.01 5.87 1.96 9.82 11.62 10.31 14.45 9.76 26.24 Twelv e-month Inflation (Dec-Dec) * Revised 11.89 1.78 4.10 8.35 16.25 7.56 15.59 12.03 27.72
7. STOCK MARKETNairobi Stock Exchange Price Index (1966=100) 1,913.40 1,355.10 1,362.90 2,737.60 2,945.58 3,973.04 5,645.65 5,444.83 3,521.18Trade Turnover (% ) 0.17 0.17 0.50 0.89 0.92 0.88 1.70 1.29 0.29
8. GOVERNMENT BUDGET (Ksh bn) ***Revenue and Grants 182.69 216.39 203.44 228.16 270.92 303.85 331.21 383.59 457.67Expenditure 175.12 232.92 225.76 255.28 289.54 298.13 368.65 405.20 534.84Budget Deficit (-) / Surplus (+) 7.57 (16.53) (22.32) (27.11) (18.62) 5.72 (37.44) (21.61) (77.17)Budget Deficit ( % of GDP) 0.81 (1.66) (2.19) (2.51) (1.54) 0.42 (2.39) (1.18) (3.68)
9. MONEY AND CREDIT (Ksh bn)(end period)Liquidity (L)¹ 435.47 462.13 521.20 569.43 633.92 712.32 834.16 992.42 1,092.01Money Supply (M3)² 360.01 368.39 406.01 453.35 513.16 565.49 666.84 797.54 901.13Reserve Money 77.73 79.12 88.45 87.52 101.05 106.23 124.16 155.62 163.59Total Domestic Credit 331.29 334.00 364.93 405.20 473.61 498.66 575.76 668.90 808.50
Gov ernment 76.45 89.08 108.61 133.85 132.34 122.16 137.81 137.40 155.32 Private sector and other public sector 254.85 244.93 256.33 271.41 341.27 376.50 437.94 531.49 653.18
10. BALANCE OF PAYMENTS (US$ m)**Overall Balance 108.21 166.38 3.26 413.33 38.85 280.11 616.44 939.56 (479.42)
Current Account (237.48) (383.39) (117.69) 146.20 -131.76 -252.32 -510.44 -1,034.48 -1,978.35Capital and Financial Account 416.21 348.20 (31.67) 537.82 239.52 765.99 884.59 2,229.58 1,171.72
11. FOREIGN EXCHANGE RESERVES (US$ m) End Period 1,398.72 1,459.35 1,612.69 1,888.04 2,078.40 2,534.16 3,331.30 4,556.97 4,640.78Official 897.42 1,063.82 1,066.99 1,479.75 1,518.73 1,798.82 2,415.27 3,354.85 2,875.46 Months of imports**** (2.8) (3.2) (3.3) (4.2) (3.4) (3.2) (3.5) (4.0) (2.7)Commercial Banks 501.30 395.53 545.70 408.28 559.67 735.34 916.03 1,202.12 1,765.32
12. PUBLIC DEBT (US$ bn) End Period*** 7.58 7.85 8.09 9.39 9.14 9.84 10.68 12.04 13.46
Domestic 2.50 2.80 3.30 3.90 3.85 4.14 4.84 6.08 6.66As % of GDP 24.09 22.25 23.11 26.81 25.32 23.40 23.18 23.56 21.15
External 5.08 5.05 4.79 5.49 5.29 5.70 5.84 5.96 6.80As % of GDP 42.21 40.13 36.99 37.72 36.64 32.21 27.93 23.09 21.61
13. EXCHANGE RATE (Ksh/US$) (Annual Average) 76.20 78.60 78.70 75.93 79.28 75.55 72.10 67.32 69.18

6 Kenya Monthly Economic Review, November 2009
SELECTED MONTHLY ECONOMIC INDICATORS
Sources: Kenya National Bureau of Statistics, Treasury, Nairobi Stock Exchange and Central Bank of Kenya
* Underlying inflation excluding food, energy and transport and communications** Data on Government budget for 2008/09 fiscal year remain provisional until publication in the Annual Economic Survey*** Figures in parentheses refer to official reserves in terms of average of current year imports of goods and non-factor services.**** Excludes IMF funds on-lent to the Govt by the CBK, which is included in external public debt.1 Previously M3XT2 Previously M3X
SELECTED MONTHLY ECONOMIC INDICATORS INDICATOR Nov Dec May June July Aug Sep Oct Nov1. INFLATION (%)
CPI 134.77 134.69 141.16 140.18 139.77 139.94 140.51 141.21 141.51Overall Inflation 12-month ov erall inflation 19.55 17.80 9.57 8.57 8.41 7.34 6.72 6.60 5.00 Av erage annual ov erall inflation 15.18 16.18 15.86 15.05 14.30 13.37 12.39 11.41 10.24Underlying Inflation* 12-month underly ing inflation 8.48 8.44 7.43 6.70 6.18 5.64 5.16 5.17 4.84 Av erage annual underly ing inflation 5.05 4.96 5.90 6.03 6.15 6.25 6.29 6.37 6.44
2. INTEREST RATES (%) 91-day Treasury bill interest rate 8.39 8.59 7.45 7.33 7.22 7.25 7.29 7.26 7.22 Ov erdraft interest rate 13.85 14.39 14.13 14.41 13.94 13.90 13.76 14.03 14.24
3. STOCK MARKET Nairobi Stock Ex change Price Index 3,341.00 3,521.18 2,852.57 3,294.56 3,273.10 3,102.68 3,005.41 3,083.63 3,189.55 Turnov er (%) 0.52 0.29 0.49 0.61 0.48 0.45 0.37 0.49 0.64
4. GOVERNMENT BUDGET** (Ksh bn.)Rev enue 184.15 236.60 449.64 511.35 40.08 74.82 128.90 170.83 208.56 Ex penses 210.51 241.70 515.70 621.91 44.77 98.61 159.30 210.69 246.75 Budget Deficit (-) / Surplus (+) (26.36) (5.10) (66.06) (110.56) (4.69) (23.79) (30.40) (39.86) (38.18)
5. MONEY AND CREDIT (Ksh bn.)Liquidity (L)¹ 1,082.96 1,091.93 1,139.47 1,166.93 1,199.96 1,212.12 1,218.18 1,243.84 1243.5Money Supply (M3)² 890.20 901.05 928.60 950.24 973.62 982.85 986.90 1,006.01 1022.3Reserv e Money 160.65 163.59 160.40 159.94 157.95 156.88 163.49 163.45 178.2Total Domestic Credit 805.03 806.04 835.18 854.03 858.79 871.46 880.7 900.0 931.3 Gov ernment 157.93 155.32 162.55 173.87 176.02 183.19 187.1 192.3 216.4 Priv ate sector and other public sector 647.10 650.72 672.63 680.16 682.77 688.27 693.5 707.7 708.7
6. MONEY AND CREDIT (Annual % Change)Liquidity (L)¹ 15.71 12.38 7.1 13.5 15.1 15.9 15.9 15.6 14.8Money Supply (M3)² 7.49 7.49 10.6 13.0 14.4 15.0 14.8 13.9 14.8Reserv e Money 4.03 4.03 8.8 4.6 3.7 3.3 7.1 4.0 10.9Total Domestic Credit 22.56 22.85 18.7 21.7 18.9 17.8 13.8 12.7 15.7 Gov ernment (4.60) 13.01 38.1 30.3 26.9 26.1 24.8 19.6 37.0 Priv ate and other public sector 31.71 25.45 14.8 19.7 17.0 15.7 11.2 11.0 10.5
7. BALANCE OF PAYMENTS (US$ m) Overall Balance (59.13) 6.14 41.20 84.39 3.61 62.03 116.95 104.63 Current Account (178.01) (148.04) (179.62) (188.77) (185.20) (157.20) (270.86) (239.49)
Trade Balance (546.76) (528.18) (422.82) (446.29) (419.60) (415.36) (532.83) (584.97) Capital and Financial Account 118.88 154.18 220.82 273.16 181.59 219.42 387.81 344.12
8. FOREIGN EXCHANGE RESERVES (US$ m) 4,523.43 4,640.78 4,370.19 4,821.67 4,830.14 5,125.15 5,235.15 5,346.66 5319.81Official*** 2,869.33 2,875.46 2,928.94 3,219.52 3,215.85 3,275.65 3,707.96 3,810.00 3934.28
Months of imports cover 2.81 2.75 2.95 3.26 3.33 3.83 4.01 4.13 4.27Commercial banks 1,654.11 1,765.32 1,441.25 1,602.15 1,614.29 1,534.33 1,527.18 1,536.00 1385.53
9. PUBLIC DEBT (US$ bn) 11.37 12.50 12.9 13.7 13.9 14.1 14.4 14.6 14.4 Domestic 5.80 5.87 6.25 6.72 6.93 7.18 7.34 7.54 7.48 As % of GDP 20.66 20.60 20.70 21.67 22.05 22.62 22.65 23.20 22.91 External 5.58 6.63 6.62 6.94 6.95 6.95 7.07 7.03 6.93 As % of GDP 19.89 23.27 21.95 22.36 22.12 21.92 21.80 21.77 21.21
10. GROSS DOMESTIC DEBT (Ksh bn)**** 451.39 456.20 489.34 518.51 530.53 547.21 550.69 567.13 562.93 11. AVERAGE EXCHANGE RATE
Ksh/US$ 78.18 78.22 79.63 77.85 76.75 76.37 75.60 75.24 74.7Ksh/Pound Sterling 119.59 117.42 116.98 127.22 125.58 126.34 123.57 121.65 124.1Ksh/ 100 Yen 80.71 85.37 80.76 80.61 81.29 80.49 82.70 83.38 83.8Ksh/Euro 99.33 104.07 105.08 109.03 108.02 108.83 110.01 111.25 111.7
20092008

Kenya Monthly Economic Review, November 2009 7
TRENDS IN VARIOUS MEASURES OF INFLATION
OverallInflation
UnderlyingInflation
TABLE 1.1: UNDERLYING AND OVERALL INFLATION (%)
Sources: Kenya National Bureau of Statistics and Central Bank of Kenya
CHART 1A: UNDERLYING AND OVERALL INFLATION (%)
Sources: Kenya National Bureau of Statistics and Central Bank of Kenya
Overall 12-month inflation has remained within the single digit level from May 2009.
This is a positive development coming from the heightened inflation experienced in
2008 and part of 2009. In November 2009 the rate fell to 5.0 percent from 6.6
percent in October 2009 following decreases in the prices of most categories of
goods and services. The CPI for the alcohol and tobacco and the fuel and power
baskets, however, went up, while a few other baskets experienced only marginal
increases.
12-month underlying inflation declined from 8.1 percent in October 2008 to 5.2
percent in October 2009 and further down to 4.8 percent in November 2009. This
was mainly due to recovery from the 2008 crisis as well as falling prices of housing
for the “Nairobi Lower” income group and the stagnation of the housing prices for
the “Nairobi Middle/ Upper” income group.
Table 1.1 and Chart 1A depict trends in overall and underlying inflation between
August 2008 and November 2009.
0369
1 21 51 82 12 42 73 03 3
Jan
Feb
Mar Ap
r
May
June July
Aug
Sep
Oct
Nov
Dec
Jan
Feb
Mac Ap
r
May Ju
n Jul
Ago
Sep
Oct
Nov
2 0 0 8 2 0 0 9
Perc
ent (
%)
1 2 - m o n th s U n d e r ly in g I n fla tio n A v e r a g e A n n u a l U n d e r ly in g I n fla tio n1 2 - m o n th s O v e r a l l I n fla tio n A v e r a g e A n n u a l O v e r a l l I n fla tio n
Aug Sep Oct Nov Dec Jun Jul Aug Sep Oct NovUnderlying Inflation12-month 7.45 7.93 8.06 8.48 8.44 6.70 6.18 5.64 5.16 5.17 4.84Average annual 4.76 4.78 4.88 5.05 4.96 6.03 6.15 6.25 6.29 6.37 6.44Growth over one month 0.66 0.81 0.35 0.56 0.35 0.27 0.06 0.15 0.34 0.37 0.25Growth over 3 months 2.19 2.03 1.84 1.73 1.26 1.28 0.58 0.48 0.56 0.87 0.97Overall Inflation12-month 18.31 18.64 18.62 19.55 17.80 8.57 8.41 7.34 6.72 6.60 5.00Average annual 11.87 12.96 14.05 15.18 16.18 15.05 14.30 13.37 12.39 11.41 10.24Growth over one month 1.12 0.99 0.61 1.74 -0.06 -0.69 -0.30 0.12 0.41 0.50 0.21Growth over 3 months 2.09 1.20 1.97 2.75 3.38 1.55 -0.22 -1.52 -0.87 0.24 1.04
20092008

8 Kenya Monthly Economic Review, November 2009
TRENDS IN VARIOUS MEASURES OF INFLATION
Inflation byIncomeGroups
Source: Kenya National Bureau of Statistics and Central Bank of Kenya
CHART 1B: 12-MONTH INFLATION BY INCOME GROUPS
InflationAcross
Goods &Services
Categories
All the various income groups experienced falling 12-month inflation rates in
November 2009 with the “rest of Kenya” income group recording the largest decline,
equivalent to 1.98 percent from 8.06 percent in October 2009 to 6.08 percent in
November 2009. In this income group, the category with the highest decline in CPI
was the food and non-alcoholic drinks group which dropped by 1.22 points. The
“Combined Nairobi” income group’s inflation declined from 4.49 percent in October
2009 to 3.4 percent in November 2009. The easing reflected largely in the “Nairobi
lower” income group’s inflation which declined from 4.19 percent in October 2009
to 2.93 percent in November 2009 on account of lower costs of housing, household
goods and services and personal goods and services. The “Nairobi Middle/ Upper”
income group’s inflation fell marginally during the same period. Details on inflation
by income groups are shown in Table 1.2 and Chart 1B below.
The 12-month inflation across goods and services in November 2009 was varied
with some categories experiencing increased inflation, others declining inflation while
others remained constant. The food and non-alcoholic drinks, housing, household
goods and services, and personal goods and services categories all experienced
declining inflation from 9.2 percent, 6.9 percent, 2.0 percent and 7.6 percent
respectively in October 2009 to 6.2 percent, 5.1 percent, 1.0 percent and 6.7 percent,
respectively, in November 2009. This was mainly influenced by lower food prices
outside Nairobi and falling cost of housing in Nairobi. Alcohol and tobacco category
experienced the largest increase in 12- month inflation equivalent to 3.6 percent
from 5.5 percent in October 2009 to 9.1 percent in November 2009. Medical goods
and services category’s inflation remained constant at 8.0 percent in November
2009.
0
3
6
9
1 2
1 5
1 8
2 1
2 4
Jan-
07
Feb-
07
Mar
-07
Apr
-07
May
-07
Jun-
07
Jul-0
7
Aug
-07
Sep
-07
Oct
-07
Nov
-07
Dec
-07
Jan-
08
Feb-
08
Mar
-08
Apr
-08
May
-08
Jun-
08
Jul-0
8
Aug
-08
Sep
-08
Oct
-08
Nov
-08
Dec
-08
Jan-
09
Feb-
09
Mar
-09
Apr
-09
May
-09
Jun-
09
Jul-0
9
Aug
-09
Sep
-09
Oct
-09
Nov
-09
Perc
ent
N a i r o b i L o w e r N a i r o b i M i d d l e / U p p e r N a ir o b i C o m b i n e d R e s t o f U r b a n T o w n s
Source: Kenya National Bureau of Statistics and Central Bank of Kenya
1/ The Nairobi income group combines Nairobi lower and Nairobi middle/upper income groups.
TABLE 1.2: 12-MONTH INFLATION BY INCOME GROUPS (%)
Aug Sep Oct Nov Dec Jun Jul Aug Sep Oct NovNairobi Lower 20.22 20.66 21.08 21.66 18.46 7.52 5.98 4.56 3.72 4.19 2.93Nairobi Middle/Upper 12.38 11.18 11.30 11.92 10.56 7.31 7.13 6.88 6.07 5.84 5.65Nairobi Income \1 18.71 18.81 19.18 19.77 16.95 7.48 6.19 4.98 4.15 4.49 3.43Rest of Urban Towns 18.04 18.52 18.24 19.39 18.38 9.30 9.92 8.95 8.48 8.06 6.08
20092008

Kenya Monthly Economic Review, November 2009 9
TRENDS IN VARIOUS MEASURES OF INFLATION
Nov-09
Food and drink, 6.20
Medical goods & services, 8.00
Personal goods & services, 6.70
Alcohol & Tobacco, 9.10
Recr & education, 4.90
Clothing & footwear, 4.50
H/hold goods & services, 1.00
Transport & comm, 2.60
Fuel & Power, -8.10
Housing , 5.10
-12 -10 -8 -6 -4 -2 0 2 4 6 8 10 12Inflation (%)
InflationOutlook
Source: Kenya National Bureau of Statistics
TABLE 1.3: 12-MONTH INFLATION ACROSS THE CPI CATEGORIES OF GOODS ANDSERVICES
Source: Kenya National Bureau of Statistics
CHART 1C: 12-MONTH INFLATION ACROSS THE CPI CATEGORIES OF GOODS AND SERVICES
Table 1.3 and Chart 1C below show inflation developments across all the ten
categories of goods and services covered in the CPI.
Despite the current food security situation in the country which indicates that over
ten million Kenyans are affected by famine, inflation is expected to remain stable
due to the rainfall currently being experienced in many parts of the country.
Nairobi Rest of Combined
Goods and Services LowerMiddle/
UpperUrban Towns weights
Weight (31.9) (8.0) (60.1) (100) Aug Sep Oct Nov Dec Jun Jul Aug Sep Oct Nov
Food and drink 55.70 31.90 50.20 50.50 25.78 26.25 26.29 28.36 25.88 11.39 11.97 10.70 9.76 9.24 6.25 Housing 11.90 31.70 9.00 11.70 6.55 8.01 7.66 8.65 8.61 8.24 7.94 7.72 6.81 6.91 5.06 Recr & education 4.60 7.30 6.60 6.00 4.49 4.65 4.31 4.48 4.36 4.89 4.80 4.67 4.48 4.63 4.87 H/hold goods & services 5.00 4.70 6.40 5.80 9.72 9.94 11.36 12.14 12.27 7.21 6.31 4.70 3.69 1.98 0.96 Clothing & footwear 9.20 7.40 9.10 9.00 5.77 5.50 5.73 5.84 5.92 3.92 3.77 3.46 3.72 3.99 4.52 Transport & comm 5.10 10.20 5.50 5.70 14.77 13.74 13.70 8.72 7.38 1.61 1.62 1.33 1.73 1.72 2.57 Fuel & Power 3.50 2.20 4.80 4.20 31.23 31.84 28.65 27.06 17.07 (5.28) (9.69) (12.41) (12.19) (9.92) (8.09) Medical goods & services 0.90 1.30 2.00 1.60 7.72 8.54 8.37 8.90 9.52 9.25 8.84 8.35 7.66 7.99 8.00 Personal goods & services 2.30 1.90 2.60 2.40 8.11 8.63 9.31 9.89 9.43 10.14 9.73 8.69 8.11 7.61 6.74 Alcohol & Tobacco 1.80 1.40 3.80 3.00 16.30 15.90 15.78 14.48 13.88 6.87 4.37 3.69 3.30 5.47 9.14 * Numbers in parentheses are income group weights
2008 2009
I n c o m e G r o u p s*

10 Kenya Monthly Economic Review, November 2009
Source: Central Bank of Kenya
DEVELOPMENTS IN MONEY, CREDIT AND
INTEREST RATESMonetary
Aggregates
CHART 2A: ANNUAL PERCENTAGE CHANGE IN MONEY SUPPLY
Money supply, M31, grew by 14.8 percent in the year to November 2009 compared
with 19.4 percent in a corresponding period in 2008, and remained below the
projected 15.1 percent growth for November 2009. Broad money, M2, that is, M3
excluding foreign currency deposits, grew by 17.1 percent in November 2009
compared with 16.8 percent in November 2008 (Table 2.1 and Chart 2A).
TABLE 2.1: MONEY SUPPLY AND ITS SOURCES (Ksh billion)
1 Effective September 2008, the CBK adopted a harmonized definition of monetary aggregatesto conform to those of the East Africa Community partner states. Consequently, M3X hasnow been renamed M3 denoting extended broad money.
Source: Central Bank of Kenya
0
4
8
12
16
20
24
28
JAN
FEB
MAR
APR
MAY
JUN JUL
AUG
SEP
OCT
NOV
DEC
JAN
FEB
MAR
APR
MAY
JUN JUL
AUG
SEP
OCT
NOV
DEC
JAN
FEB
MAR
APR
MAY
JUNE JU
LAU
GSE
POC
TNO
V
2007 2008 2009
Perc
ent
Overall Liquidity (L) Money Supply (M2) Broad Money Supply (M3)
Nov-08 Nov-092007 2008 2009 12 months 12 months
Nov Nov Nov %age change %age change1. Money supply, M3 (2+3) 2/ 745.3 890.2 1022.3 19.4 14.8
1.1 Money supply, M2 3/ 643.1 751.2 879.5 16.8 17.11.2 Money supply, M1 360.5 393.4 441.0 9.1 12.11.3 Currency outside banks 87.3 91.3 93.7 4.7 2.6
2. Net foreign assets 4/ 219.3 258.5 266.3 17.9 3.0Central Bank 170.4 200.6 224.8 17.7 12.0Banking Institutions 48.9 57.9 41.5 18.5 -28.3
3. Net domestic assets (3.1+3.2) 525.9 631.7 756.0 20.1 19.73.1 Domestic credit (3.1.1+3.1.2) 656.8 805.0 931.3 22.6 15.7
3.1.1 Government (net) 165.5 157.9 216.4 -4.6 37.03.1.2 Private sector and other public sector 491.3 647.1 714.9 31.7 10.5
3.2 Other assets net (3-3.1) -130.9 -173.4 -175.3 32.4 1.1Memorandum items1. Overall liquidity, L 1/ 935.9 1083.0 1243.5 15.7 14.82. Reserve money 140.5 160.7 178.2 14.3 10.9
Currency outside banks 87.3 91.3 93.7 4.7 2.6Bank reserves 53.3 69.3 84.5 30.1 21.9
4/ Net Foreign Assets at current exchange rate to the US dollar.
Absolute and percentage changes may not necessarily add up due to rounding1/ Overall liquidity, L, comprises M3 and non banking public holding of Government securities is comparab le to M3XT in the past publications.2/ Broader money, M3, comprises M2 and residents foreign currency deposits with local banks. It is comparable to M3X in the past publications. Foreign currency deposits are valued at current exchange rate from July 2008.3/ Broad money, M2, comprises currency outside banking institutions, and all private and other public sector holdings of demand savings and time deposits. It excludes central and local Government deposits with banking institutions.
Kenya Monthly Economic Review, November 2009 11
MONEY, INTEREST RATES AND CREDIT
Source: Central Bank of Kenya
CreditDevelopments
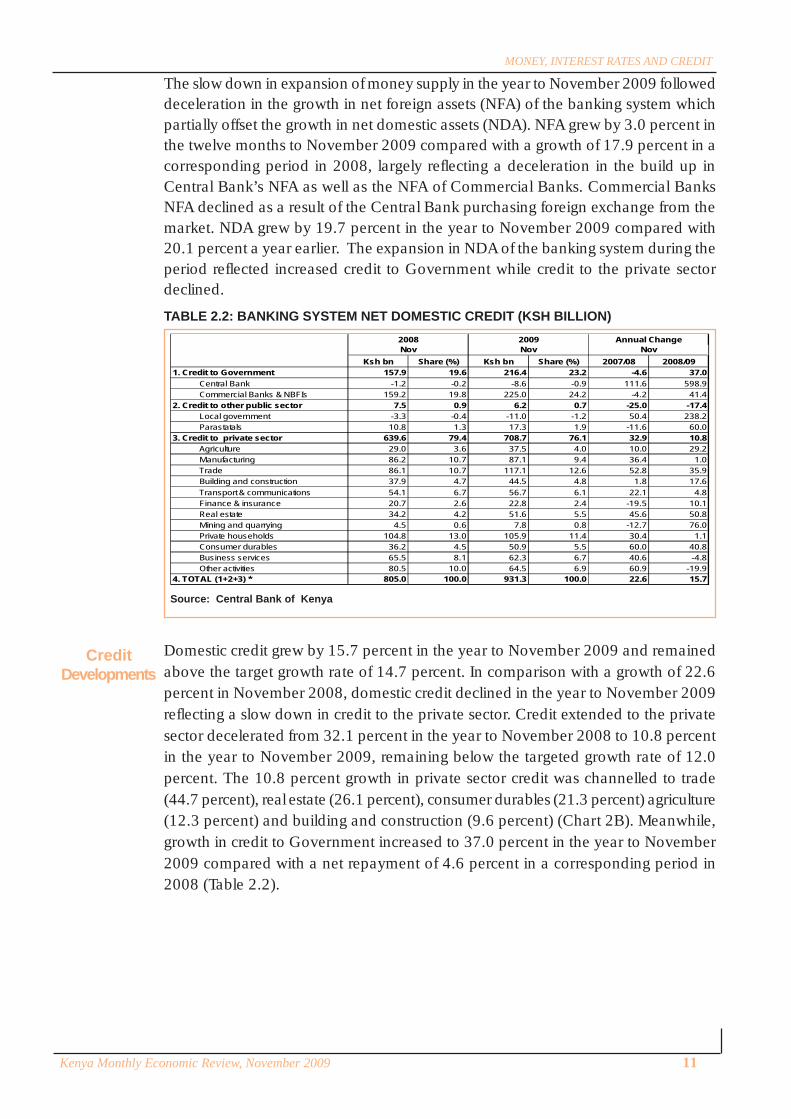
The slow down in expansion of money supply in the year to November 2009 followed
deceleration in the growth in net foreign assets (NFA) of the banking system which
partially offset the growth in net domestic assets (NDA). NFA grew by 3.0 percent in
the twelve months to November 2009 compared with a growth of 17.9 percent in a
corresponding period in 2008, largely reflecting a deceleration in the build up in
Central Bank’s NFA as well as the NFA of Commercial Banks. Commercial Banks
NFA declined as a result of the Central Bank purchasing foreign exchange from the
market. NDA grew by 19.7 percent in the year to November 2009 compared with
20.1 percent a year earlier. The expansion in NDA of the banking system during the
period reflected increased credit to Government while credit to the private sector
declined.
Domestic credit grew by 15.7 percent in the year to November 2009 and remained
above the target growth rate of 14.7 percent. In comparison with a growth of 22.6
percent in November 2008, domestic credit declined in the year to November 2009
reflecting a slow down in credit to the private sector. Credit extended to the private
sector decelerated from 32.1 percent in the year to November 2008 to 10.8 percent
in the year to November 2009, remaining below the targeted growth rate of 12.0
percent. The 10.8 percent growth in private sector credit was channelled to trade
(44.7 percent), real estate (26.1 percent), consumer durables (21.3 percent) agriculture
(12.3 percent) and building and construction (9.6 percent) (Chart 2B). Meanwhile,
growth in credit to Government increased to 37.0 percent in the year to November
2009 compared with a net repayment of 4.6 percent in a corresponding period in
2008 (Table 2.2).
TABLE 2.2: BANKING SYSTEM NET DOMESTIC CREDIT (KSH BILLION)
Ksh bn Share (%) Ksh bn Share (%) 2007/08 2008/091. Credit to Government 157.9 19.6 216.4 23.2 -4.6 37.0
Central Bank -1.2 -0.2 -8.6 -0.9 111.6 598.9Commercial Banks & NBFIs 159.2 19.8 225.0 24.2 -4.2 41.4
2. Credit to other public sector 7.5 0.9 6.2 0.7 -25.0 -17.4Local government -3.3 -0.4 -11.0 -1.2 50.4 238.2Parastatals 10.8 1.3 17.3 1.9 -11.6 60.0
3. Credit to private sector 639.6 79.4 708.7 76.1 32.9 10.8Agriculture 29.0 3.6 37.5 4.0 10.0 29.2Manufacturing 86.2 10.7 87.1 9.4 36.4 1.0Trade 86.1 10.7 117.1 12.6 52.8 35.9Building and construction 37.9 4.7 44.5 4.8 1.8 17.6Transport & communications 54.1 6.7 56.7 6.1 22.1 4.8Finance & insurance 20.7 2.6 22.8 2.4 -19.5 10.1Real estate 34.2 4.2 51.6 5.5 45.6 50.8Mining and quarrying 4.5 0.6 7.8 0.8 -12.7 76.0Private households 104.8 13.0 105.9 11.4 30.4 1.1Consumer durables 36.2 4.5 50.9 5.5 60.0 40.8Business services 65.5 8.1 62.3 6.7 40.6 -4.8Other activities 80.5 10.0 64.5 6.9 60.9 -19.9
4. TOTAL (1+2+3) * 805.0 100.0 931.3 100.0 22.6 15.7
Annual ChangeNov
2009Nov
2008Nov

12 Kenya Monthly Economic Review, November 2009
MONEY, INTEREST RATES AND CREDIT
ReserveMoney
Source: Central Bank of Kenya
CHART 2C: TRENDS IN RESERVE MONEY AND NET FOREIGN ASSETS
TABLE 2.3: RESERVE MONEY AND ITS SOURCES (Ksh billion)
Reserve money increased by 10.9 percent to Ksh 178.2 billion in November 2009
from Ksh 160.7 billion in November 2008 (Table 2.3). The increase in reserve money
was largely due to bank reserves which grew by 21.9 percent. At Ksh 178.2 billion in
November 2009, reserve money was Ksh 9.7 billion above target.
2007 2008 2009 2009Nov Nov Nov 2007/08 2008/09 Nov Target Deviation
1. Net Foreign Assets 170.4 200.6 224.8 17.7 12.0 228.2 -3.42. Net Domestic Assets -29.9 -40.0 -46.6 33.7 16.6 -51.3 4.7
2.1 Government Borrowing (net) -0.6 -1.2 -8.6 111.6 598.9 -4.4 -4.22.2 Advances & Discounts -11.3 0.7 0.0 -106.3 -100.0 0.1 -0.12.3 Other Domestic Assets (net) -20.4 -41.9 -40.7 105.3 -2.9 -55.5 14.8
3. Reserve Money 140.5 160.7 178.2 14.3 10.9 168.5 9.73.1 Currency outside banks 87.3 91.3 93.7 4.7 2.6 104.3 -10.73.2 Bank reserves 53.3 69.3 84.5 30.1 21.9 64.2 20.3
Change (%)
100
120
140
160
180
200
220
240
JAN
FEB
MAR
APR
MAY
JUNE JULY AUG
SEPT OC
TNO
VDE
CJA
NFE
BMA
RAP
RMA
YJU
NE JULY AUG
SEP
OCT
NOV
DEC
JAN
FEB
MAR
APR
MAY
JUNE JULY AUG
SEPT OC
TNO
V
2007 2008 2009
Ksh B
illion
RM NFA
Source: Central Bank of Kenya
Source: Central Bank of Kenya
CHART 2B: SHARE OF CREDIT TO THE PRIVATE SECTOR IN THE TWELVEMONTHS TO NOVEMBER 2009 (Ksh billion)
-18 -13 -8 -3 2 7 12 17 22 27
Other activitiesBusiness services
ManufacturingPrivate households
Finance & insuranceTransport & communications
Mining and quarryingBuilding and construction
AgricultureConsumer durables
Real estateTrade
Ksh billion
Share (%)
44.7
25.1
21.3
12.3
9.6
4.9
3.7
3.0
1.6
1.3
-4.6

Kenya Monthly Economic Review, November 2009 13
MONEY, INTEREST RATES AND CREDIT
InterestRates
Source: Central Bank of Kenya
TABLE 2.4: INTEREST RATES (%)
Lending andDepositRates
Net foreign assets (NFA) of the Central Bank, rose by 12.0 percent to Ksh 224.8
billion in the year to November 2009. The rise in NFA of the Central Bank reflected
interbank purchases of foreign exchange to boost the level of gross reserves.
Net domestic assets (NDA) of the Central Bank declined by 16.6 percent to Ksh -
46.6 billion in the year to November 2009, down from Ksh -40.0 billion in the
previous year. The decline in NDA was due to accumulation of deposits of the
Government that offset increases in other domestic assets.
On net basis, Government accumulated deposits of Ksh 7.3 billion in November
2009, while net indebtedness of Central Bank to commercial banks declined by Ksh
0.7 billion. Other domestic assets net of other liabilities increased by 2.9 percent.
The Central Bank Rate (CBR) was reduced by 75 basis points from 7.75 percent to
7.0 percent in November 2009. The short term and long term interest rates trended
upwards in November 2009. The average interbank rate increased from 2.57 percent
in October 2009 to 3.11 percent in November 2009 (Table 2.4). The rise in the
interbank rate was as a result of increased activities in the interbank market with high
volumes traded in the month of November compared with October 2009. The
reverse repo rate remained at 4.36 percent in November 2009 as per the last trading
rate in October 29, 2009. The Central Bank was not in the market in the month of
November 2009. Meanwhile, the 91-day Treasury bill rate edged downwards
marginally from 7.26 percent in October 2009 to 7.22 percent in November 2009.
Whereas, the 182-Treasury bills rate increased slightly from 7.98 percent to 8.02
percent during the period.
Commercial banks average lending rate and deposit rates increased marginally in
the November 2009. The average lending rate increased by 9 basis point to 14.87
percent in November 2009 while the overall deposit rate increased by 1 basis point
to 5.04 percent. Consequently, the interest rate spread widened to 9.83 percent in
November 2009 from 9.75 percent in October 2009.
Aug Sep Oct Nov Dec July Aug Sept Oct Nov
91-day Treasury bill rate 8.017 8.36 7.75 8.39 8.59 7.24 7.25 7.29 7.26 7.22
Overdraft rate 13.11 13.43 13.91 13.85 14.40 13.94 13.90 13.76 14.03 14.24
Interbank rate 6.92 6.70 6.81 6.83 6.66 2.69 3.68 3.38 2.57 3.11
Repo rate 6.35 6.06 6.03 6.26 6.23 6.18 6.18 6.18 6.18 6.18
Reverse Repo rate 3.31 4.29 4.01 3.17 4.36
Average lending rate (1) 13.66 13.66 14.12 14.32 14.87 14.79 14.76 14.74 14.78 14.87
Average deposit rate (2) 4.65 4.62 4.65 4.86 4.89 5.09 5.00 5.05 5.03 5.04
0 to 3 - month deposit 5.39 5.19 5.39 5.89 5.68 5.98 5.93 6.05 5.83 5.94
Savings deposits 1.68 1.73 1.74 1.61 1.65 1.67 1.65 1.65 1.85 1.71
Spread (1-2) 9.01 9.04 9.47 9.46 9.98 9.70 9.76 9.69 9.75 9.83
20092008

14 Kenya Monthly Economic Review, November 2009
MONEY, INTEREST RATES AND CREDIT
Source: Central Bank of Kenya
CHART 2D : TRENDS IN INTEREST RATES
0.00
2.00
4.00
6.00
8.00
10.00
12.00
14.00
16.00
Jan
Feb
Mar Ap
rM
ay Jun
July
Aug
Sep Oct
Nov
Dec Ja
nFe
bM
ar Apr
May Ju
nJu
lA
ugS
ep Oct
Nov
Dec Ja
nFe
bM
ar Apr
May Ju
nJu
lyA
ugS
ep Oct
Nov
2007 20 08 2009
Per
cent
I n terb an k ra te Average lend ing ra te Averag e d ep osit ra te 91-day Treasury b ill S pread

Kenya Monthly Economic Review, November 2009 15
PERFORMANCE OF THE REAL SECTOR
Overview During the third quarter of 2009, the economy experienced zero economic growth
with the GDP for the quarter standing at Ksh 361.0 billion compared with Ksh
361.2 billion for the same quarter in 2008. This followed mixed sectoral performances
during the quarter. Of significance was the decline in the value added of key sectors
including agriculture and forestry, manufacturing, electricity and water supply,
transport and communication and construction which declined, respectively, by 3.5
percent, 2.4 percent, 7.4 percent, 1.8 percent and 1.1 percent. Agriculture and forestry
and the electricity sectors contracted following the persistent drought, while the
manufacturing, construction and transport and communications sectors were affected
by the high energy prices and the global economic recession. The decline was
counteracted by growth in sectors such as hotels and restaurants, financial
intermediation, education, other services, real estate, public administration and
defence and the wholesale and retail trade sector which expanded during the quarter
by 44.4 percent, 8.9 percent, 3.7 percent, 3.2 percent, 2.7 percent, 2.7 percent, and
1.8 percent, respectively, thus resulting in 0.0 percent overall growth. (Table 3.1,
Chart 3A and Chart 3B).
CHART 3A: REAL GDP GROWTH IN THE FIRST QUARTERS
-
2.0
4.0
6.0
8.0
10.0
July Sept' 2003
July Sept' 2004
July Sept' 2005
July Sept' 2006
July Sept' 2007
July Sept' 2008
July Sept' 2009
6.5
3.2
8.4 8.2
6.7
3.2
0.0
Source: Kenya National Bureau of Statistics

16 Kenya Monthly Economic Review, November 2009
PERFORMANCE IN THE REAL SECTOR
Tea
Agriculture
Source: Kenya National Bureau of Statistics
Share in Real GDP 2003 2004 2005 2006 2007 2008*in 2007 (%)
Agriculture, Forestry & Fishing 24.44 2.4 3.8 6.7 2.6 2.1 (3.7) Mining & Quarrying 0.47 3.5 -0.3 2.7 4.1 12.9 3.2 Manufacturing 9.78 6.0 4.5 4.7 6.3 6.5 3.8 Electricity and water supply 2.25 14.0 3.0 -0.1 -1.4 9.1 5.2 Wholesale and retail trade, repairs 9.88 1.5 8.5 5.6 11.6 11.5 5.1 Hotels & Restaurants 1.56 -20.3 38.8 13.3 14.9 16.3 (36.1) Building & Construction 3.01 1.0 4.4 7.5 6.3 6.9 8.3 Transport & Communications 11.71 3.5 7.0 9.0 11.4 15.1 3.1 Financial intermediation 3.69 1.5 1.4 5.6 4.8 6.7 3.1 Real estate, renting and business services 5.31 2.3 3.0 3.4 3.9 3.5 3.7 Public administration and defense 3.35 0.6 0.2 -1.3 -1.6 -2.0 0.6 Education 5.63 9.7 2.0 0.7 0.3 3.7 5.8 Health and social work 2.19 2.8 3.8 3.2 3.3 3.2 3.6 Other community, social and personal services 3.72 -0.0 3.7 3.0 4.3 3.4 3.0 Private households with employed persons 0.31 2.0 2.0 2.0 2.0 2.0 2.0 Less : Financial services indirectly measured -0.90 -3.3 4.7 4.3 5.1 2.7 (7.5) Total GDP at basic 2001 prices 86.40 3.1 3.9 5.2 5.6 6.2 (0.1) Taxes less subsidies on products 13.60 1.3 14.8 11.0 11.2 13.4 6.7 Real GDP at 2001 market prices 100.00 2.9 5.1 5.9 6.3 7.1 1.7
The agricultural sector had mixed performance in the year to October 2009.
Insufficient rainfall in most parts of the country caused general crop failure which
affected food security, necessitating importation of basic food commodities. The
more resilient crops, however, did well despite the deteriorating weather conditions
and the delayed El-Niño rains which were expected in most parts of the country
early in the last quarter of 2009. Selected performances of agricultural output are as
shown in Table 3.2.
Cumulative tea production fell from 273,490.0 metric tonnes in January – October
2008 to 242,214.5 metric tonnes in the period January – October 2009, equivalent
to 11.4 percent decrease. However, output increased to 32,759.6 metric tonnes in
October 2009 from 27,430.0 metric tonnes in September 2009 reflecting the onset
of the high season which falls between September and December and which is
attributed to the short rains experienced both in the east and west of the Rift. The tea
output in October 2009 was 7.2 percent lower than the 35,307.0 metric tonnes
produced in October 2008. During the month of October 2009, the average price of
Kenyan tea was at US$ 2.79 per kilogram or 21.8 percent higher than US$ 2.29 per
kilogram in October 2008.
TABLE 3.1 GROWTH RATES FOR REAL GROSS DOMESTIC PRODUCT AND RELATEDAGGREGATES (%)
Source: Tea Board of Kenya, Horticultural Crops Development Authority and Sugar Board of Kenya
TABLE 3.2: OUTPUT GROWTH OF MAJOR CROPS
2 0 0 7 2 0 0 8 J a n -O c t 2 0 0 8 J a n -O c t 2 0 0 9T e a O u tp u t (M e tr i c to n n e s ) 3 6 9 ,6 0 6 .1 8 3 4 5 ,8 1 8 .0 0 2 7 3 ,4 9 0 .0 0 2 4 2 ,2 1 4 .4 8
G ro wth ( % ) 1 9 .0 % -6 .4 4 % -1 1 .3 3 % -1 1 .4 4 %
H o r tic u lt u re O u tp u t (M e tr i c to n n e s ) 1 9 2 ,1 4 7 .4 5 1 9 3 ,1 1 7 .0 6 1 6 4 ,3 5 0 .0 8 1 5 1 ,8 5 7 .3 5
G ro wth ( % ) 1 7 .7 % 0 .5 0 % 4 .7 % -7 .6 0 %
C o ff e e O u tp u t (M e tr i c to n n e s ) 5 2 ,2 6 8 .0 0 3 8 ,7 0 5 .0 0 3 3 ,1 7 4 .0 0 4 5 ,2 9 2 .0 0
G ro wth ( % ) 3 .4 % - 2 5 .9 5 % -3 1 .0 0 % 3 6 .5 3 %
S u g a r C a n e O u tp u t (M e tr i c to n n e s ) 5 ,2 0 4 ,2 1 4 .0 0 4 ,9 9 1 ,0 9 7 .0 0 4 ,1 0 3 ,7 0 6 .0 0 4 ,5 5 8 ,3 1 6 .5 5
G ro wth ( % ) 5 .4 8 % -4 .1 0 % -5 .2 5 % 1 1 .0 8 %
C U M U L A T IV E

Kenya Monthly Economic Review, November 2009 17
PERFORMANCE IN THE REAL SECTOR
Dairy
Coffee
Sugarcane
CHART 3C: HORTICULTURE EXPORTS
Horticultural export volumes declined by 7.6 percent to 151,857.4 metric tonnes in
January – October 2009, from 164,350.1 metric tonnes in a similar period in 2008.
This followed a reduction in the export volumes of flowers and vegetables which
were affected by the unfavourable weather conditions experienced all over the
country. Fruit exports increased to 382.7 metric tonnes in October 2009 from 274.2
metric tonnes in September 2009 which was also the lowest level of fruit export
volumes experienced in any month since October 2005. The declining trend of flower
exports, especially roses which was a consequence of depressed demand from Kenya’s
traditional markets began to recover from September 2009. Cumulative exported
vegetables for the period January – October 2009 decreased as a result of the dry
weather conditions to reach 60,042.0 metric tonnes from 70,321.5 metric tonnes
for the same period in the previous year. Largely on account of the reduced volumes
exported, the value of horticultural exports fell by Ksh 8.8 billion or 17.6 percent in
the period January – October 2009, from Ksh 49.9 billion in January – October
2008. Details on the performance of the horticultural sub-sector are provided in
Chart 3C.
Cumulative coffee production for the period January – October 2009 amounted to
45,292.0 metric tonnes. This was 12,118.0 metric tonnes, or 36.5 percent above
the amount produced during the same period in the previous year. On average,
monthly production during the period was 4,529.2 metric tonnes compared with
3,317.4 metric tonnes in the previous year. From the beginning of the year, coffee
output responded well to improved export prices, reaching a peak of US $ 3.39 per
kilogram in August 2009, and falling marginally to US $ 3.19 in October 2009.
Cumulative prices increased marginally from US $ 2.3 per kilogram in January –
October 2008 to US $ 2.5 per kilogram in January – October 2009.
Total sugarcane deliveries in the period January – October 2009 increased by11.1
percent to 4,558,316.6 metric tonnes compared with deliveries of 4,103,706 metric
tonnes in the same period in 2008.
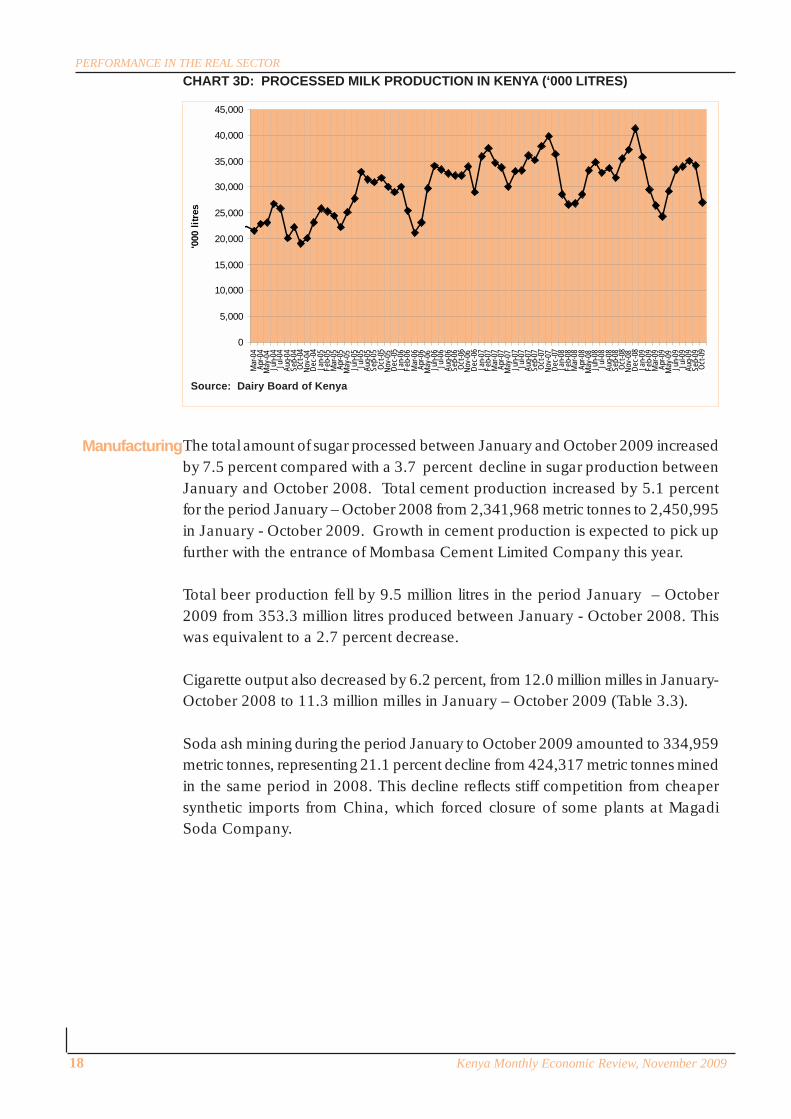
Cumulative volume of milk received in the formal sector declined from 312,454,563.5
litres between January and October 2008 to 308,708,563.5 litres between January
and October 2009 due to persistent drought (Chart 3D).
47.3%
13.1%
39.5%
PERCENTAGE SHARE OF TOTAL EXPORT QUANTITY Jan- Oct ' 2009
Flowers Quantity share Fruits Quantity share Vegetables Quantity share
61.9%
5.2%
32.9%
PERCENTAGE SHARE OF TOTAL EXPORT VALUE KSHS Jan-Oct' 2009
Flowers value share Fruits value share Vegetables value shareSource: Horticultural Crops Development Authority
Horticulture
18 Kenya Monthly Economic Review, November 2009
PERFORMANCE IN THE REAL SECTOR
The total amount of sugar processed between January and October 2009 increased
by 7.5 percent compared with a 3.7 percent decline in sugar production between
January and October 2008. Total cement production increased by 5.1 percent
for the period January – October 2008 from 2,341,968 metric tonnes to 2,450,995
in January - October 2009. Growth in cement production is expected to pick up
further with the entrance of Mombasa Cement Limited Company this year.
Total beer production fell by 9.5 million litres in the period January – October
2009 from 353.3 million litres produced between January - October 2008. This
was equivalent to a 2.7 percent decrease.
Cigarette output also decreased by 6.2 percent, from 12.0 million milles in January-
October 2008 to 11.3 million milles in January – October 2009 (Table 3.3).
Soda ash mining during the period January to October 2009 amounted to 334,959
metric tonnes, representing 21.1 percent decline from 424,317 metric tonnes mined
in the same period in 2008. This decline reflects stiff competition from cheaper
synthetic imports from China, which forced closure of some plants at Magadi
Soda Company.
CHART 3D: PROCESSED MILK PRODUCTION IN KENYA (‘000 LITRES)
0
5,000
10,000
15,000
20,000
25,000
30,000
35,000
40,000
45,000
Mar
-04
Apr-0
4M
ay-0
4Ju
n-04
Jul-0
4Au
g-04
Sep-
04Oc
t-04
Nov-
04De
c-04
Jan-
05Fe
b-05
Mar
-05
Apr-0
5M
ay-0
5Ju
n-05
Jul-0
5Au
g-05
Sep-
05Oc
t-05
Nov-
05De
c-05
Jan-
06Fe
b-06
Mar
-06
Apr-0
6M
ay-0
6Ju
n-06
Jul-0
6Au
g-06
Sep-
06Oc
t-06
Nov-
06De
c-06
Jan-
07Fe
b-07
Mar
-07
Apr-0
7M
ay-0
7Ju
n-07
Jul-0
7Au
g-07
Sep-
07Oc
t-07
Nov-
07De
c-07
Jan-
08Fe
b-08
Mar
-08
Apr-0
8M
ay-0
8Ju
n-08
Jul-0
8Au
g-08
Sep-
08Oc
t-08
Nov-
08De
c-08
Jan-
09Fe
b-09
Mar
-09
Apr-0
9M
ay-0
9Ju
n-09
Jul-0
9Au
g-09
Sep-
09Oc
t-09
'000
lit
res
Manufacturing
Source: Dairy Board of Kenya

Kenya Monthly Economic Review, November 2009 19
PERFORMANCE IN THE REAL SECTOR
TABLE 3.4: ENERGY SECTOR PERFORMANCE
Source: Kenya National Bureau of Statistics
2 0 0 7 2 0 0 8 J a n -O ct'2 0 0 8 J a n -O ct'2 0 0 9E le c tric ity S u p p ly (G e n e ra tio n) O u tp u t (K W H M i llio n s ) 6 , 2 8 7 .6 8 5 , 6 9 4 .0 5 4 ,7 6 1 . 65 4 , 6 0 9 .8 6
G row th % 8 . 0% -9 . 4% -9 .1 % -3 . 2 %O f w h ic h :
H y d ro -p o w e r G e n e ra tio n (K W H M i llio n s ) 3 , 5 8 4 .7 6 3 , 2 4 0 .4 4 2 ,7 2 6 . 06 1 , 9 4 5 .8 6 G row th (% ) 1 8 . 9% -9 . 6% -8 .5 % -2 8 . 6 %
G e o -Th e rm a l G e n e ra tio n (K W H M i llio n s ) 9 9 1 .1 2 1 , 0 3 8 .7 9 8 4 6 . 63 1 , 1 0 6 .1 5 G row th (% ) -5 . 2% 4 . 8% 2 .9 % 3 0 . 7 %
The rm a l (K W H M i ll io n s ) 1 , 7 1 1 .9 2 1 , 4 1 4 .8 8 1 ,1 8 9 . 01 1 , 6 3 8 .3 2 G row th (% ) -2 . 9% -1 7 . 4% -1 7 .2 % 3 7 . 8 %
C o n s u m p tio n o f e le c tr ic ity (K W H M i llio n s ) 5 , 1 2 5 .8 0 5 , 3 0 0 .7 0 4 ,4 1 3 . 80 4 , 3 8 5 .5 0 G ro w th % 8 . 1% 3 . 4% 3 .8 % -0 . 6 %
C o n s u m p tio n o f F u e ls ( M e tric To n n e s ) 3 , 1 21 , 7 0 0 .0 0 2 , 8 5 3 ,9 0 0 2 , 3 57 2 ,0 3 7 G ro w th % 1 1 . 2% -8 . 6% -1 0 .4 % -1 3 . 6 %
M u rb a n c ru d e o il a v e ra g e p ric e (U S $ p e r b a rre l) 7 2 .4 6 9 7 .8 6 1 0 8 . 08 5 9 .7 1 G row th % 1 1 . 6% 3 5 . 0% 5 7 .3 % -4 4 . 8 %
* P ro vis i o n a lN A : N o t A v a i la b le
C U M U L A T I V EC U M U L A T I V E
Electricity generated in the current year to October 2009 fell by 3.2 percent from
4,761.7 million Kilowatt hours generated over a similar period in 2008 (Table 3.4).
Cumulative Geo-Thermal and Thermal power increased by 30.7 percent and 37.8
percent, respectively, in January – October 2009, somehow compensating for the
28.6 percent decline in hydro-power generation which was as a result of inadequate
rainfall experienced in areas which feed the hydro power stations.
Consumption of electricity fell marginally by 0.6 percent from 4,413.8 million Kilowatt
hours between January and October 2008, to 4,385.5 million Kilowatt hours between
January and October 2009.
Similarly, cumulative fuel consumption declined from 2,357 metric tonnes in the
period January – October 2008 to 2,037 metric tonnes between January and October
2009, equivalent to 13.6 percent decline.
Source: Kenya Sugar Board, Magadi Soda Co. and Kenya Revenue Authority
TABLE 3.3: PRODUCTION OF SELECTED MANUFACTURED GOODS
EnergySector
2 0 0 7 2 0 0 8 J a n - O c t ' 2 0 0 8 J a n - O c t ' 2 0 0 9P r o c e s s e d s u g a r O u t p u t ( M T ) 5 2 0 , 4 0 4 5 0 7 , 2 7 7 4 1 8 , 5 4 3 4 4 9 ,8 0 3
G r o w th % 9 . 4 % - 2 . 5 % - 3 .6 9 % 7 . 4 7 %C e m e n t p r o d u c t i o n O u t p u t ( M T ) 2 , 5 4 5 , 6 6 1 3 ,1 3 4 , 5 7 1 2 ,3 4 1 , 9 6 8 2 , 4 6 0 , 9 9 5 * O u t p u t G r o w t h % 1 7 .1 % 2 3 . 1 % 1 0 . 7 % 5 . 0 8 %S o d a a s h O u t p u t ( M T ) 3 8 6 , 5 9 8 5 1 3 , 4 1 5 4 2 4 , 3 1 7 3 3 4 ,9 5 9
G r o w th % 3 . 4 % 3 2 . 8 % 3 9 . 5 % - 2 1 .1 %M i l k O u t p u t ( '0 0 0 l i t r e s ) 4 2 3 , 1 1 1 3 9 0 , 9 6 3 3 1 2 , 4 5 4 3 0 8 ,7 0 9
G r o w th % 1 7 . 5 % - 7 . 6 % - 9 . 9 % - 1 .2 %B e e r
O u t p u t ( '0 0 0 l i t r e s ) 3 7 9 , 4 8 5 4 2 6 , 7 3 3 3 5 3 , 2 8 0 3 4 3 ,7 6 0 G r o w th % 3 5 . 3 % 1 2 . 5 % 1 3 . 4 % - 2 .7 %
C i g a r e t t e s O u t p u t ( M i l l e s ) 1 5 , 4 7 5 , 3 1 0 1 4 ,7 8 6 , 4 0 7 1 2 ,0 1 2 , 0 4 5 1 1 , 2 6 3 ,0 9 1
G r o w th % 2 5 . 8 % - 4 . 5 % - 3 . 8 % - 6 .2 %M T = M e t r i c t o n n e s * P r o v i s i o n a l
C U M U L A T I V E

20 Kenya Monthly Economic Review, November 2009
PERFORMANCE IN THE REAL SECTOR
Tourism
In the fuel sub-sector, average international crude oil prices declined by 44.8 percent
from US $ 108.1 per barrel in the period January – October 2008, to US $ 59.7 per
barrel in January – October 2009.
The tourism sector grew by 24.2 percent during the second quarter of 2009 compared
with 37.0 percent decline in the second quarter of the previous year, and is expected
to grow further in the subsequent periods given that the total arrivals between January
and October 2009 have already surpassed the total number of arrivals between
January and December 2008. The high tourism season which begins in June took
off well with arrivals increasing steadily from 69,059 visitors in June 2009 to peak at
100,314 visitors in August 2009. The total number of visitors for the period January
– October 2009 increased by 36.0 percent to 768,844, from 565,348 in the same
period a year earlier. The cruise season resumed in October 2009, with a total of
287 persons arriving via cruise ships, making the total cruise ships arrivals in the
year to reach 12,096 people (Table 3.5). Tourism earnings improved compared to
the earlier months of the year but trailed the previous years by 14.4 percent. Total
earnings in January – October 2009 amounted to US$ 458.5 million compared to
US$ 535.4 million in January –October 2008.
In January – October 2009, a total of 362,866 arrivals were from Europe which
accounted for 47.2 percent of the total visitors. This was equivalent to 55.5 percent
increase in the number of tourists compared to the 233,361 tourists who visited
between January 2008 and October 2008 (Table 3.6). Similarly, arrivals from
America, Asia, the Oceanic region and Africa increased respectively by 35.2 percent,
24.0 percent, 26.9 percent and 10.5 percent. Arrivals via cruise ships increased by
236.6 percent from 3,594 persons in January – October 2008 to 12,096 persons in
January – October 2009.
2007 2008 Jan -Oct 2008 Jan -Oct 2009 Jan -Oct
2009 % S h are
Jan - Oct 2009 % Gro wth
C R U ISE 2,837 6 ,877 3,194 12,096 1.6% 278.7%
M IAM 276,298 112 ,517 75,339 132,544 17.2% 75.9%
JK IA 769,597 609 ,606 486,815 624,204 81.2% 28.2%
TOTAL 1,048,732 729 ,000 565,348 768,844 100 .0% 36.0%Cr uise sh ips - En tr y th r ough p or t of M om b a s a ; JKIA - En t r y th r ough Jom o
TABLE 3.5: TOURIST ARRIVALS BY POINT OF ENTRY
Source: Kenya Tourism Board

Kenya Monthly Economic Review, November 2009 21
PERFORMANCE IN THE REAL SECTOR
Sources: Kenya Ports Authority and Kenya Pipeline Company
TABLE 3.7: THROUGHPUT IN SELECTED TRANSPORT FACILITIES
2 0 0 7 2 0 0 8 J a n -O c t 2 0 0 8 Ja n - O c t 2 0 09
M o m b asa P o rt C arg o T h ro u g h p u t O u tp u t (M T) E q u iv a le n t 15 ,960 ,4 65 16 ,414 ,729 13 ,48 1 ,388 15 , 409 ,677
O u tp u t G ro wt h % 1 0.70% 2. 85% 2. 29% 14.3 0%N u m b e r o f p assen g ers T h ro ' JK IAInc o m ing 1 ,478 ,8 49 1 ,7 57 ,475 1 ,216 , 263 1 ,107 ,4 19* G ro w th (% ) -0 .70% 18. 84% -0 . 88% -8 .95%O utg o ing 1 ,480 ,6 20 1 ,4 76 ,851 1 ,216 , 942 1 ,144 ,2 23* G ro w th % -1 .30% -0 . 25% -1 . 57% -5 .98%K en y a P ip e l in e o i l T h ro u g h p u t O u tp u t ('000 litre s ) 3 ,962 ,2 79 3 ,8 59 ,481 3 , 219 ,156 3 ,570 ,2 11 O u t pu t G row th % 3.60% -2 . 59% -3 . 71% 1 0.91%K en y a R even u e A u th o rity (E xc ise tax o n a i rtim e) K s hs m ill io n 5 ,9 62 6 ,528 5 ,589 5 ,9 53 O u t pu t G row th % 2 8.60% 9. 50% 14. 70% 6.51%
M T = M e tric to nne s* P ro v is io na l
C U M U L A T IV E
The volume of cargo throughput handled by Kenya Ports Authority (KPA) at the
port of Mombasa increased by 14.3 percent from 13,481,388 metric tonnes in
January – October 2008 to 15,409,677 metric tonnes in January – October
2009. Of this, total imports constituted 86.2 percent, total exports constituted
13.2 percent while transit shipments constituted 0.6 percent, equivalent to
13,281,020 metric tonnes, 2,036,525 metric tonnes and 92,132 metric tonnes,
respectively. Similarly, cargo transported via Kenya Pipeline Company (KPC)
increased by 10.9 percent during the same period. In the transport and
telecommunicaton sector, excise duty on airtime rose by 6.5 percent, from Ksh
5,589.2 million in the period January – October 2008 to Ksh 5,953.1 million in
January – October 2009 Table 3.7.
TABLE 3.6: TOTAL ARRIVALS BY CONTINENT
Source: Kenya Tourism Board
Transportand Tele-
communications
REGION
2007 2008 Jan-Oct 2008 Jan-Oct 2009
Jan - Oct'2009 %
Share Jan- Oct' 2009
% GrowthAfrica 212,501 207,737 166,985 184,586 24.0% 10.5%America 132,651 97,771 79,190 107,037 13.9% 35.2%Asia 103,443 94,496 71,054 88,091 11.5% 24.0%Europe 578,312 308,123 233,361 362,866 47.2% 55.5%Oceanic 18,975 13,963 11,164 14,168 1.8% 26.9%Cruise 2,850 7,400 3,594 12,096 1.6% 236.6%Total 1,048,732 729,490 565,348 768,844 100.0% 36.0%

22 Kenya Monthly Economic Review, November 2009
PERFORMANCE IN THE REAL SECTOR
Building &Construction
Industry
Source: Kenya Revenue Authority (KRA)
CHART 3E: EXCISE TAX ON AIRTIME
0
100
200
300
400
500
600
700
Jan-0
4Fe
b-04
Mar-0
4Ap
r-04
May-0
4Ju
n-04
Jul-04
Aug-0
4Se
p-04
Oct-0
4No
v-04
Dec-0
4Ja
n-05
Feb-0
5Ma
r-05
A pr-0
5Ma
y-05
Jun-0
5Jul
-05Au
g-05
Sep-0
5Oc
t-05
Nov-0
5De
c-05
Jan-0
6Fe
b-06
Mar-0
6A p
r-06
May-0
6Ju
n-06
Jul-06
Aug-0
6Se
p-06
Oct-0
6No
v-06
Dec-0
6Ja
n-07
Feb-0
7Ma
r-07
A pr-0
7Ma
y-07
Jun-0
7Jul
-07Au
g-07
Sep-0
7Oc
t-07
Nov-0
7De
c-07
Jan-0
8Fe
b-08
Mar-0
8A p
r-08
May-0
8Ju
n-08
Jul-08
Aug-0
8Se
p-08
Oct-0
8No
v-08
Dec-0
8Ja
n-09
Feb-0
9Ma
r-09
A pr-0
9Ma
y-09
Jun-0
9Jul
-09Au
g-09
Sep-0
9Oc
t-09
KSHS
MIL
LION
CHART 3F: CEMENT PRODUCTION AND CONSUMPTION
1 0 0 ,0 0 0
1 2 0 ,0 0 0
1 4 0 ,0 0 0
1 6 0 ,0 0 0
1 8 0 ,0 0 0
2 0 0 ,0 0 0
2 2 0 ,0 0 0
2 4 0 ,0 0 0
2 6 0 ,0 0 0
2 8 0 ,0 0 0
3 0 0 ,0 0 0
Jan
Feb
Mar
Apr
May Ju
nJu
lAu
gS
ep Oct
Nov
Dec Jan
Feb
Mar
Apr
May Ju
nJu
lAu
gS
ep Oct
Nov
Dec Jan
Feb
Mar
Apr
May Ju
nJu
lAu
gS
ep Oct
Nov
Dec Jan
Feb
Mar
Apr
May Ju
nJu
lAu
gS
ep Oct
Nov
Dec Jan
Feb
Mar
Apr
May Ju
nJu
lAu
gS
ep Oct
2 00 5 2 00 6 2 0 0 7 2 0 0 8 2 0 09
Met
ric T
onne
s
C e m e n t C o n s u m p t io n
C e m e n t P r o d u c t io n
Source: Kenya National Bureau of Statistics
Cement consumption increased by 10.9 percent from 1,839,387 metric tonnes in
the first ten months of 2008 to 2,039,720 metric tonnes in the same period in 2009,
reflecting increased economic activity in the industry.

Kenya Monthly Economic Review, November 2009 23
Source: Central Bank of Kenya
DEVELOPMENTS IN THE BALANCE OF
PAYMENTS AND EXCHANGE RATESOverview
CurrentAccount
TABLE 4.1: BALANCE OF PAYMENTS (US$ M)
Kenya’s balance of payments position reflected developments in the global economy
which is on a slow recovery albeit activity remaining below pre-crisis levels. The
surplus in the balance of payments improved from US$ 30 million in the year to
October 2008 to US$ 369 million in the year to October 2009. The improvement
was supported by increased surplus in the capital and financial account which offset
the current account deficit.
The deficit in the current account widened by 27.8 percent from US$ 1,792 million
in the year to October 2008 to US$ 2,290 million in the year to October 2009. The
merchandise account which improved due to a lower import bill was countered by a
contraction in services. The deficit on the merchandise account narrowed from US$
6,177 million in the year to October 2008 to US$ 5,660 million in the year to October
2009 while the surplus on the services account declined from US$ 4,385 million to
US$ 3,371 million over the same period (Table 4.2).
The value of imports declined by 9.6 percent from US$ 11,151 million in October
2008, to US$ 10,081 million in October 2009 reflecting a lower oil import bill on
account of low prices of international crude oil during the review period. Oil prices
have ranged between US$ 70 and US$ 80 a barrel. The potential for higher import
prices is not high due to large excess capacity that currently exists and high inventory
in oil production. Imports of manufactured goods and chemicals also declined while
Year to October 2009*Year to Q1 Q2 Q3 Q4 Year to Absolute
ITEM Oct 2008* Nov-Jan Feb-Apr May-Jul Aug-Oct Oct 2009* Change
1. OVERALL BALANCE 30 -160 123 122 284 369 3402. CURRENT ACCOUNT -1792 -570 -498 -554 -668 -2290 -498 2.1 Goods -6177 -1571 -1268 -1289 -1533 -5660 516 Exports (fob) 4975 1105 1084 1104 1129 4421 -554 Imports (cif) 11151 2676 2352 2392 2662 10081 -1070 2.2 Services 4385 1000 770 735 866 3371 -1014 Non-factor services (net) 2089 579 379 368 483 1810 -280 Income (net) -50 -23 -12 -24 -21 -80 -30 Current Transfers 2345 444 403 391 403 1641 -704 3. CAPITAL & FINANCIAL ACCOUNT 1822 411 622 676 951 2659 837 3.1 Capital Tranfers (net) 317 47 106 70 31 254 -63 3.2 Financial Account 1505 364 516 606 920 2405 900memo:Gross Reserves 4735 4348 4620 4830 5347 5347 612 Official 2928 2769 2888 3216 3810 3810 882 imports cover** 2.9 2.7 2.9 3.3 4.1 4.1 1.3 imports cover*** 3.5 3.2 3.3 3.6 4.1 4.1 0.6 Commercial Banks 1806 1579 1733 1614 1536 1536 -270
MerchandiseAccount

24 Kenya Monthly Economic Review, November 2009
BALANCE OF PAYMENTS AND EXCHANGE RATE DEVELOPMENTS
Direction ofTrade
ServicesAccount
those of machinery and transport equipment increased. Imports of machinery typically
pick up during upturns in domestic economic activity.
The value of merchandise exports in the year to October 2009 declined by 11.1
percent to US$ 4,421 million. This development reflects low global demand which is
still below its pre-crisis levels. Commodity prices were broadly stable in early 2009
and started to pick up in the second quarter of the year. With the exception of
coffee and re exports, exports in all the major categories declined. Earnings from
exports of horticulture and manufactured goods which were lower during the review
period reflected reduced export volumes. The improvement in earnings of coffee
exports reflected increased exports volume and prices.
Receipts from non-factor services declined by 13.4 percent in the year to October
2009 reflecting reduced receipts for freight and travel related services. Transfers to
non-governmental organizations and remittances were also lower in the year to
October 2009. As a result, net current transfers declined by 30 percent to US$
1,641 million.
The main destination countries for Kenya’s merchandise exports during the year to
October2009 were Uganda (13.1 percent), United Kingdom (10.8 percent), Tanzania
(9.0percent), and Netherlands (7.5percent). Overall, African countries absorbed 47.7
percent of Kenya’s merchandise exports. Exports to EAC region declined from US$
1,180 million to US$ 1,153 million in the year to October 2009 and in proportion to
total exports grew from 23.7 percent to 26.1 percent. Similarly, exports to COMESA
region decreased from US$ 1,578 million to US$ 1,435 million in 2009 accounting
for 32.5 percent of total exports (Table 4.3).
TABLE 4.2: BALANCE ON CURRENT ACCOUNT (US$ M)
Year to October 2009*Year to Q1 Q2 Q3 Q4 Year to Absolute
ITEM Oct 2008* Nov-Jan Feb-Apr May-Jul Aug-Oct Oct 2009* Change2. CURRENT ACCOUNT -1792 -570 -498 -554 -668 -2290 -498 2.1 Goods -6177 -1571 -1268 -1289 -1533 -5660 516 Exports (fob) 4975 1105 1084 1104 1129 4421 -554 Coffee 157 33 54 67 48 202 45 Tea 877 224 186 214 225 848 -29 Horticulture 762 165 175 170 159 668 -93 Oil products 113 27 16 23 33 99 -14 Manufactured Goods 626 129 131 122 130 512 -114 Raw Materials 326 50 63 53 45 211 -115 Re-exports 275 61 64 74 82 281 6 Other 1840 416 395 382 407 1601 -239 Imports (cif) 11151 2676 2352 2392 2662 10081 -1070 Oil 3056 434 452 508 637 2031 -1025 Chemicals 1441 324 332 323 319 1299 -143 Manufactured Goods 1567 400 295 319 388 1402 -165 Machinery & Transport Equipment 2917 895 730 669 812 3105 188 Other 2169 623 542 574 506 2245 76 2.2 Services 4385 1000 770 735 866 3371 -1014 Non-factor services (net) 2089 579 379 368 483 1810 -280 of which tourism 762 176 143 126 171 615 -147 Income (net) -50 -23 -12 -24 -21 -80 -30 of which official interest -126 -29 -19 -28 -18 -93 33 Current T ransfers 2345 444 403 391 403 1641 -704 Private (net) 2109 448 403 391 403 1644 -465 Public (net) 236 -3 0 0 0 -3 -240 * Provisional.
Source: Central Bank of Kenya
Kenya Monthly Economic Review, November 2009 25
BALANCE OF PAYMENTS AND EXCHANGE RATE DEVELOPMENTS
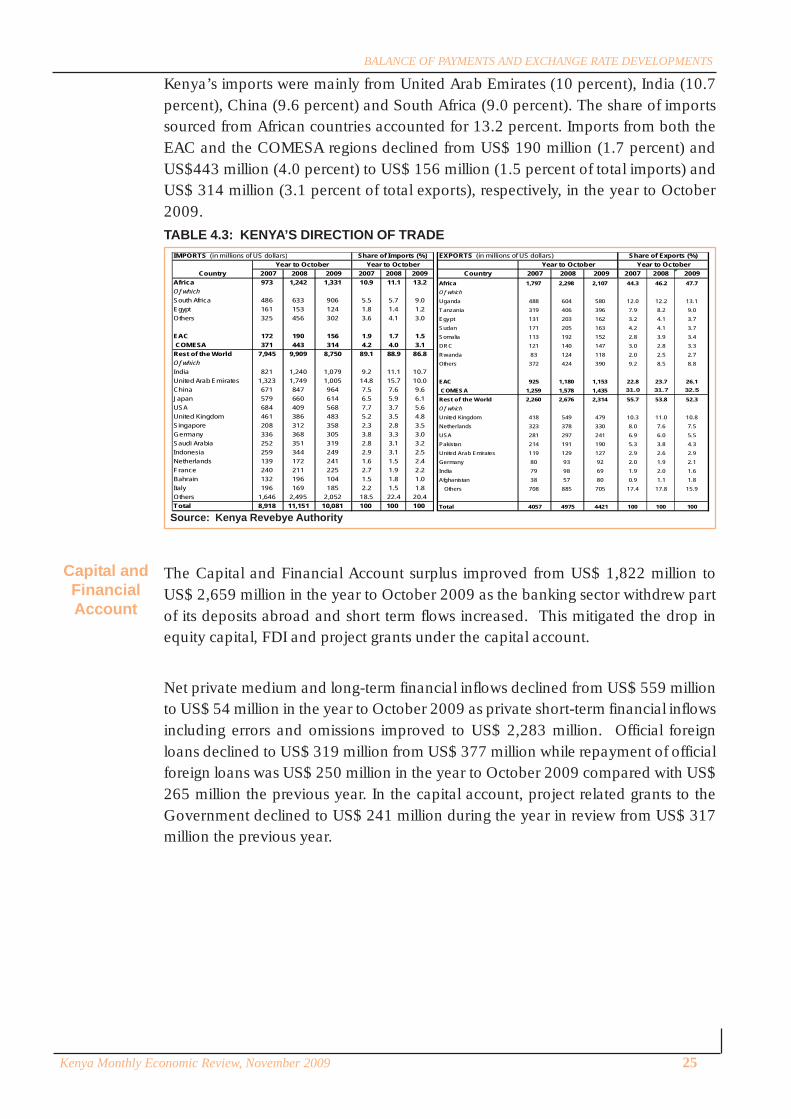
Kenya’s imports were mainly from United Arab Emirates (10 percent), India (10.7
percent), China (9.6 percent) and South Africa (9.0 percent). The share of imports
sourced from African countries accounted for 13.2 percent. Imports from both the
EAC and the COMESA regions declined from US$ 190 million (1.7 percent) and
US$443 million (4.0 percent) to US$ 156 million (1.5 percent of total imports) and
US$ 314 million (3.1 percent of total exports), respectively, in the year to October
2009.
The Capital and Financial Account surplus improved from US$ 1,822 million to
US$ 2,659 million in the year to October 2009 as the banking sector withdrew part
of its deposits abroad and short term flows increased. This mitigated the drop in
equity capital, FDI and project grants under the capital account.
Net private medium and long-term financial inflows declined from US$ 559 million
to US$ 54 million in the year to October 2009 as private short-term financial inflows
including errors and omissions improved to US$ 2,283 million. Official foreign
loans declined to US$ 319 million from US$ 377 million while repayment of official
foreign loans was US$ 250 million in the year to October 2009 compared with US$
265 million the previous year. In the capital account, project related grants to the
Government declined to US$ 241 million during the year in review from US$ 317
million the previous year.
Source: Kenya Revebye Authority
TABLE 4.3: KENYA’S DIRECTION OF TRADEIMPORTS (in millions of US dollars) EXPORTS (in millions of US dollars)
Country 2007 2008 2009 2007 2008 2009 Country 2007 2008 2009 2007 2008 2009Africa 973 1,242 1,331 10.9 11.1 13.2 Africa 1,797 2,298 2,107 44.3 46.2 47.7Of which Of whichSouth Africa 486 633 906 5.5 5.7 9.0 Uganda 488 604 580 12.0 12.2 13.1Egypt 161 153 124 1.8 1.4 1.2 Tanzania 319 406 396 7.9 8.2 9.0Others 325 456 302 3.6 4.1 3.0 Egypt 131 203 162 3.2 4.1 3.7
Sudan 171 205 163 4.2 4.1 3.7EAC 172 190 156 1.9 1.7 1.5 Somalia 113 192 152 2.8 3.9 3.4 COMESA 371 443 314 4.2 4.0 3.1 DRC 121 140 147 3.0 2.8 3.3Rest of the World 7,945 9,909 8,750 89.1 88.9 86.8 Rwanda 83 124 118 2.0 2.5 2.7Of which Others 372 424 390 9.2 8.5 8.8India 821 1,240 1,079 9.2 11.1 10.7United Arab Emirates 1,323 1,749 1,005 14.8 15.7 10.0 EAC 925 1,180 1,153 22.8 23.7 26.1China 671 847 964 7.5 7.6 9.6 COMESA 1,259 1,578 1,435 31.0 31.7 32.5Japan 579 660 614 6.5 5.9 6.1 Rest of the World 2,260 2,676 2,314 55.7 53.8 52.3USA 684 409 568 7.7 3.7 5.6 Of whichUnited Kingdom 461 386 483 5.2 3.5 4.8 United Kingdom 418 549 479 10.3 11.0 10.8Singapore 208 312 358 2.3 2.8 3.5 Netherlands 323 378 330 8.0 7.6 7.5Germany 336 368 305 3.8 3.3 3.0 USA 281 297 241 6.9 6.0 5.5Saudi Arabia 252 351 319 2.8 3.1 3.2 Pakistan 214 191 190 5.3 3.8 4.3Indonesia 259 344 249 2.9 3.1 2.5 United Arab Emirates 119 129 127 2.9 2.6 2.9Netherlands 139 172 241 1.6 1.5 2.4 Germany 80 93 92 2.0 1.9 2.1France 240 211 225 2.7 1.9 2.2 India 79 98 69 1.9 2.0 1.6Bahrain 132 196 104 1.5 1.8 1.0 Afghanistan 38 57 80 0.9 1.1 1.8Italy 196 169 185 2.2 1.5 1.8 Others 708 885 705 17.4 17.8 15.9Others 1,646 2,495 2,052 18.5 22.4 20.4Total 8,918 11,151 10,081 100 100 100 Total 4057 4975 4421 100 100 100
Share of Imports (%) Share of Exports (%)Year to October Year to October Year to October Year to October
Capital andFinancialAccount

26 Kenya Monthly Economic Review, November 2009
BALANCE OF PAYMENTS AND EXCHANGE RATE DEVELOPMENTS
Source: Central Bank of Kenya
Source: Central Bank of Kenya
ForeignExchangeReserves
Total foreign exchange held by the banking system increased by 17.6 percent from
US$ 4,524 million at the end of November 2008 to US$ 5,320 million at the end of
November 2009. The increase was wholly in official foreign exchange reserves held
by the Central Bank, from US$ 2,869 million (3.4months of import cover) at the
end of November 2008 to US$ 3,934 million (4.3 months of import cover) at the
end of November 2009 (Table 4.5 and Chart 4A). The accumulation of official
reserves comprised of interbank purchases, exogenous shock facility and special
drawing rights allocation from the IMF.
Foreign exchange assets of commercial banks declined from US$ 1,655 million at
the end of November 2008 to US$ 1,368 million at end of November 2009 reflecting
a reduction in deposits held with banks abroad. Other foreign assets of commercial
banks include shares and securities, foreign loans and other accounts receivable.
TABLE 4.4.: BALANCE ON CAPITAL AND FINANCIAL ACCOUNT (US$ M)
Year to October 2009*Year to Q1 Q2 Q3 Q4 Year to Absolute
ITEM Oct 2008* Nov-Jan Feb-Apr May-Jul Aug-Oct Oct 2009* Change3. CAPITAL & FINANCIAL ACCOUNT 1822 411 622 676 951 2659 837 3.1 Capital T ranfers (net) 317 47 106 70 31 254 -63 3.2 Financial Account 1505 364 516 606 920 2405 900 Official, medium & long-term 112 -10 60 50 -31 69 -44 Inflows 377 47 118 114 40 319 -58 Outflows -265 -57 -58 -65 -71 -250 15 Private, medium & long-term (net) 559 -36 -283 51 322 54 -505 Commercial Banks (net) 6 -26 -290 57 342 82 77 Other private medium & long-term (net) 553 -10 8 -6 -20 -29 -582 Short-term (net) incl. errors & omissions 833 410 739 505 630 2283 1449* Provisional.
Oct 08 Nov 08 Dec 08 Apr 09 May 09 Jun 09 Jul 09 Aug 09 Sep 09 Oct 09 Nov 091. Gross Foreign Exchange Reserves 4,735 4,524 4,641 4,620 4,370 4,822 4,830 4,810 5,235 5,347 5,320of which:
Official 2,928 2,869 2,875 2,888 2,929 3,219 3,216 3,276 3,708 3,810 3,934 imports cover* 3.6 3.4 3.4 3.3 3.3 3.6 3.6 3.6 4.1 4.1 4.3Commercial Banks 1,807 1,655 1,766 1,733 1,441 1,602 1,614 1,534 1,527 1,536 1,386
2. Residents' foreign currency deposits 1,714 1,867 1,810 1,702 1,698 1,912 1,967 2,064 1,920 1,917 2,006*Based on 36 month average of imports of goods and non-factor services
0
1,000
2,000
3,000
4,000
5,000
6,000
7,000
J F M A M J J A S O N D J F M A M J J A S O N D J F M A M J J A S O N D J F M A M J J A S O N
2006 2007 2008 2009
Gross Reserves
Commercial Banks' Reserves
Official Reserves
4 months import cover (based on 3-year average of imports of goods and non-factor services)
TABLE 4.5: FOREIGN EXCHANGE RESERVES AND RESIDENTS' FOREIGN CURRENCYDEPOSITS (END OF PERIOD, US$ MILLION)
CHART 4A: FOREIGN EXCHANGE RESERVES (US$ MILLION)
Source: Central Bank of Kenya

Kenya Monthly Economic Review, November 2009 27
BALANCE OF PAYMENTS AND EXCHANGE RATE DEVELOPMENTS
The Kenya Shilling depicted mixed performance against major world currencies,
strengthening against the US dollar but weakening against the Euro, the Sterling
Pound and the Japanese Yen (Table 4.6). The shilling gained against the US dollar
following an increase in inflows especially from tourism and a general weakening
dollar rate in the international foreign exchange market. Against the US dollar, the
shilling appreciated to exchange at an average of Ksh 74.74 per US dollar in
November 2009 compared with Ksh 75.24 per US dollar in October 2009. The
shilling, however, depreciated against the Euro, the Sterling Pound and the Japanese
Yen to exchange respectively, at Ksh 111.68 per Euro, Ksh 124.14 per Sterling Pound
and Ksh 83.79 per 100 Japanese Yen in November 2009 compared with Ksh 111.25
per Euro, Ksh 121.65 per Sterling Pound and Ksh 83.38 per 100 Japanese Yen in
October 2009 (Table 4.6 and Charts 4B).
Against the regional currencies, the Kenya shilling appreciated marginally against
the Tanzania Shilling and depreciated against Uganda Shilling respectively to trade
at Tsh 17.75 per Kenya shilling and Ush 25.16 per Kenya shilling in November 2009
compared with Tsh 17.50 per Kenya shilling and Ush 25.27 per Kenya shilling in
October 2009.
ExchangeRates
Source: Central Bank of Kenya
CHART 4B: KENYA SHILLING EXCHANGE RATE
TABLE 4.6: KENYA SHILLING EXCHANGE RATE
Source: Central Bank of Kenya
US Dollar 66.70 67.68 71.41 76.66 78.18 78.04 76.75 76.37 75.60 75.24 74.74 -0.67
Pound Sterling 132.62 127.97 128.58 129.38 119.59 116.53 125.58 126.34 123.57 121.65 124.14 2.05
100 Japanese Yen 62.43 61.92 67.00 76.77 80.71 85.42 81.29 80.49 82.70 83.38 83.79 0.49
Uganda Shilling* 24.36 24.00 23.07 23.89 24.49 25.07 27.52 27.14 26.07 25.27 25.16 -0.43
Tanzania Shilling* 17.65 18.00 16.27 16.12 16.05 16.64 17.25 17.28 17.32 17.50 17.75 1.39
Euro 105.18 101.40 102.73 101.67 99.33 105.56 108.02 108.83 110.01 111.25 111.68 0.39
Euro per US dollar 0.634 0.667 0.695 0.754 0.787 0.739 0.711 0.702 0.687 0.676 0.669 -1.06
* Units of currency per Kenya shilling
% change Nov 09-Oct 09
2008
Jul Aug
2009
OctAug SepJulOct NovSep DecNov
50
70
90
110
130
150
Jan
Feb
Mar
Apr
May
Jun Jul
Aug
Sep
Oct
Nov
Dec
Jan
Feb
Mar
Apr
May
Jun Jul
Aug
Sep
Oct
Nov
Dec
Jan
Feb
Mar
Apr
May
Jun Jul
Aug
Sep
Oct
Nov
Dec
Jan
Feb
Mar
Apr
May
Jun Jul
Aug
Sep
Oct
Nov
2006 2007 2008 2009Shilling/US Dollar Shilling/Pound Sh illing/Euro

28 Kenya Monthly Economic Review, November 2009
Profitability
Capital &Reserves
DepositLiabilites
DEVELOPMENTS IN THE BANKING SECTOROverview
Loans &Advances
Structure ofthe Balance
Sheet
During the period ended 30th November 2009, the Kenyan Banking sector registered
significant growth in asset base largely supported by growth in deposits, injection of
capital and retention of profits. The level of non-performing loans increased marginally
but the sector registered high capital adequacy and liquidity ratios.
The Kenyan-banking sector comprised of 44 commercial banks, 2 mortgage finance
companies, 1 deposit taking microfinance institution and 127 foreign exchange
bureaus.
The banking sector aggregate balance sheet expanded by 13.1 percent from Ksh
1,194.4 billion to Ksh 1,350.4 billion in November 2009. The main components of
the balance sheet were net loans and advances, government securities and
placements, which accounted for 53.0 percent, 22.0 percent and 7.0 percent of total
assets respectively.
The banking sector gross loans and advances increased from Ksh. 679.8 billion in
November 2008 to Ksh. 757.5 billion in November 2009 representing 11.4 percent
growth. The growth was attributed to increased economic activities in the households
and corporate sectors. Loans and advances net of provisions stood at Ksh 716.1
billion in November 2009, up from Ksh 637.3 billion registered in November 2008.
Deposits from customers were the main source of funding for the banking sector,
accounting for 77.0 per cent of total funding liabilities. The deposits expanded by
13.4 percent from Ksh 911.2 billion in November 2008 to Ksh 1,033.1 billion in
November 2009, on account of receipts from exports and remittances from abroad.
The banking sector recorded stronger capital levels in November 2009, with total
capital increasing by 20.0 percent from Ksh 144.3 billion in November 2008 to Ksh
173.1 billion, while shareholders’ funds increased by 20.4 percent from Ksh 159.7
billion in November 2008 to Ksh 192.2 billion. As a result, the ratios of total and
core capital to total risk-weighted assets improved from 18.1 percent and 16.1 percent
to 19.5 percent and 17.2 percent in November 2009 respectively. The increase in
capital was attributed to capital injections by some institutions and retention of profits.
In the eleven months period to November 2009, the sector registered a 12.7 percent
growth in pre-tax profits, from Ksh 40.2 billion achieved in November 2008 to Ksh
45.3 billion in November 2009. As a result, the annualised return on assets increased
from 2.8 percent to 2.9 percent in November 2009. However, the return on equity
declined to 25.7 percent in November 2009 from 27.5 percent in November 2008
largely due to higher proportionate growth in equity. Total income increased by
15.1 percent from Ksh 134.4 billion to Ksh 154.7 billion in November 2009, while
total expenses increased by 16.2 percent from Ksh 94.2 billion to Ksh 109.5 billion.
Interest on loans and advances, driven by growth in loans, fees and commissions
and government securities were the main sources of income accounting for 54 percent,
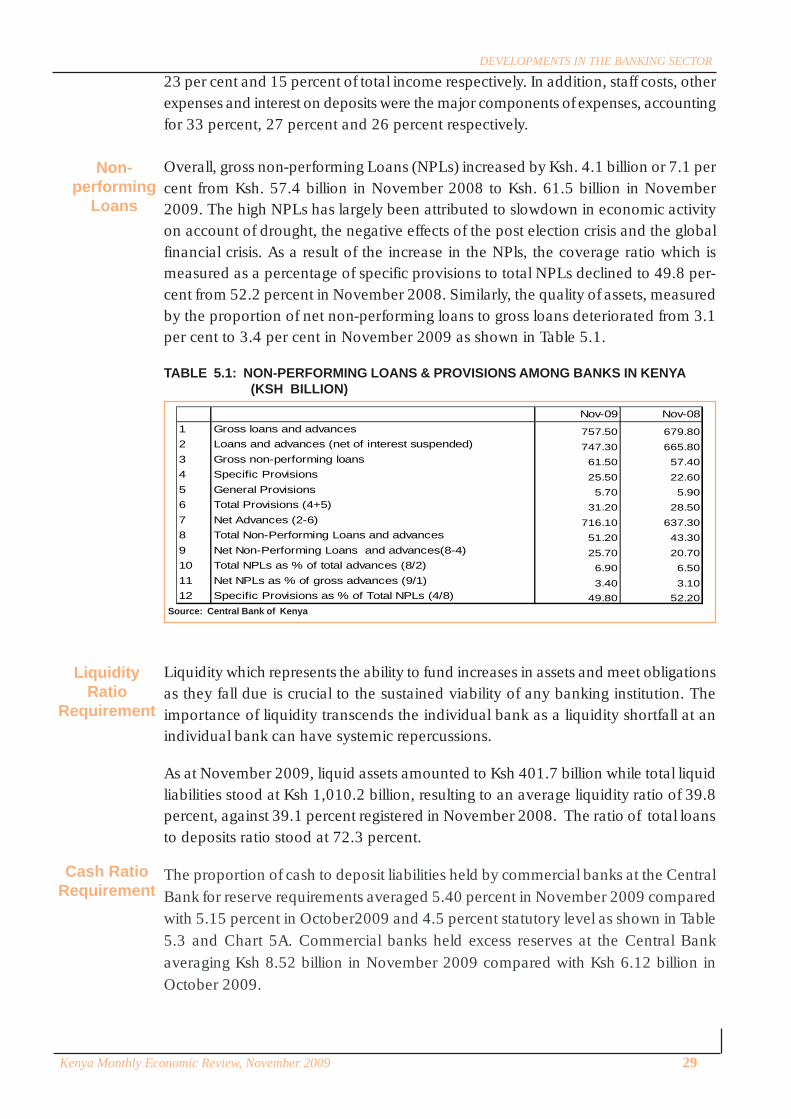
Kenya Monthly Economic Review, November 2009 29
DEVELOPMENTS IN THE BANKING SECTOR
Source: Central Bank of Kenya
TABLE 5.1: NON-PERFORMING LOANS & PROVISIONS AMONG BANKS IN KENYA(KSH BILLION)
Non-performing
Loans
LiquidityRatio
Requirement
Cash RatioRequirement
23 per cent and 15 percent of total income respectively. In addition, staff costs, other
expenses and interest on deposits were the major components of expenses, accounting
for 33 percent, 27 percent and 26 percent respectively.
Overall, gross non-performing Loans (NPLs) increased by Ksh. 4.1 billion or 7.1 per
cent from Ksh. 57.4 billion in November 2008 to Ksh. 61.5 billion in November
2009. The high NPLs has largely been attributed to slowdown in economic activity
on account of drought, the negative effects of the post election crisis and the global
financial crisis. As a result of the increase in the NPls, the coverage ratio which is
measured as a percentage of specific provisions to total NPLs declined to 49.8 per-
cent from 52.2 percent in November 2008. Similarly, the quality of assets, measured
by the proportion of net non-performing loans to gross loans deteriorated from 3.1
per cent to 3.4 per cent in November 2009 as shown in Table 5.1.
Liquidity which represents the ability to fund increases in assets and meet obligations
as they fall due is crucial to the sustained viability of any banking institution. The
importance of liquidity transcends the individual bank as a liquidity shortfall at an
individual bank can have systemic repercussions.
As at November 2009, liquid assets amounted to Ksh 401.7 billion while total liquid
liabilities stood at Ksh 1,010.2 billion, resulting to an average liquidity ratio of 39.8
percent, against 39.1 percent registered in November 2008. The ratio of total loans
to deposits ratio stood at 72.3 percent.
The proportion of cash to deposit liabilities held by commercial banks at the Central
Bank for reserve requirements averaged 5.40 percent in November 2009 compared
with 5.15 percent in October2009 and 4.5 percent statutory level as shown in Table
5.3 and Chart 5A. Commercial banks held excess reserves at the Central Bank
averaging Ksh 8.52 billion in November 2009 compared with Ksh 6.12 billion in
October 2009.
Nov-09 Nov-081 Gross loans and advances 757.50 679.802 Loans and advances (net of interest suspended) 747.30 665.803 Gross non-performing loans 61.50 57.404 Specific Provisions 25.50 22.605 General Provisions 5.70 5.906 Total Provisions (4+5) 31.20 28.507 Net Advances (2-6) 716.10 637.308 Total Non-Performing Loans and advances 51.20 43.309 Net Non-Performing Loans and advances(8-4) 25.70 20.7010 Total NPLs as % of total advances (8/2) 6.90 6.5011 Net NPLs as % of gross advances (9/1) 3.40 3.1012 Specific Provisions as % of Total NPLs (4/8) 49.80 52.20

30 Kenya Monthly Economic Review, November 2009
DEVELOPMENTS IN THE BANKING SECTOR
KEPSSKenya
ShillingsFlows
CHART 5A: COMMERCIAL BANKS’ CASH AND LIQUIDITY RATIOS
TABLE 5.2 : CASH AND LIQUIDITY RATIOS* (%)
Source: Central Bank of Kenya
Kenya Electronic Payments and Settlement System (KEPSS) moved a volume of
56,900 transaction messages worth Ksh 1,430 billion in November 2009 compared
with a volume of 55,440 transaction messages valued at Ksh 1,481 billion moved in
October 2009 representing 3.4 percent decrease in value and 2.6 percent increase
in volume, respectively. The increase in KEPSS usage is attributable to successful
value capping implementation process.
During the twelve months period to November 30, 2009, the value moved averaged
Ksh 46.22 million per transaction, while the average value moved per day was
approximately Ksh 59.04 billion (Table 5.3 and Chart 5B). Direct settlements through
KEPSS in November 2009 averaged 98.5 percent of the total settlements, while
indirect payments (ACH Net settlement) averaged 1.5 percent.
Oct Nov Dec June July Aug Sept Oct NovCommercial Banks Actual Average Liquidity 39.37 37.55 37.18 41.37 41.70 41.33 41.34 41.60 40.19 Minimum Liquidity Ratio 20.0 20.00 20.00 20.00 20.00 20.00 20.00 20.00 20.00 Actual Cash Ratio - All Banks 6.26 6.23 5.57 5.67 4.95 4.84 5.40 5.15 5.40 Minimum Cash Ratio Requirement 6.00 6.00 5.00 5.00 4.50 4.50 4.50 4.50 4.50NBFIs Actual Average Liquidity Ratio 26.57 27.12 26.82 24.59 24.83 23.93 23.38 22.89 24.61 Minimum Liquidity Ratio 20.00 20.00 20.00 20.00 20.00 20.00 20.00 20.00 20.00 Actual Cash Ratio 6.00 6.00 5.00 5.00 4.50 4.50 4.50 4.50 4.50 Minimum Cash Ratio Requirement 6.00 6.00 5.00 5.00 4.50 4.50 4.50 4.50 4.50
* Monthly average liquidity and cash ratios** Commercial banks and NBFIs observed a daily minimum of 6% cash ratio effective from 1st July 2003 to 30th Nov 2008.** Commercial banks and NBFIs observed a daily minimum of 5% cash ratio effective 1st Dec 2008*** Ratio includes NBFIs and Mortgage companies
2008 2009
5
10
15
20
25
30
35
40
45
50
4.0
4.5
5.0
5.5
6.0
6.5
7.0
Aug-0
5Oc
t-05
Dec-0
5Fe
b-06
A pr-0
6Ju
n-06
Aug-0
6Oc
t-06
Dec-0
6Fe
b-07
A pr-0
7Ju
n-07
Aug-0
7Oc
t-07
Dec-0
7Fe
b-08
A pr-0
8Ju
n-08
Aug-0
8Oc
t-08
Dec-0
8Fe
b-09
Apr-0
9Ju
n-09
Aug-0
9Oc
t-09
Liquid
ity R
atio
Cash
Rati
o
Actual Cash Ratio Cash Ratio RequirementActualAverage Liquidity Minimum Liquidity Ratio
Source: Central Bank of Kenya

Kenya Monthly Economic Review, November 2009 31
DEVELOPMENTS IN THE BANKING SECTOR
TABLE 5.3: TRENDS IN MONTHLY FLOWS THROUGH KEPSS
Source: Central Bank of Kenya
CHART 5B: TRENDS IN MONTHLY FLOWS THROUGH KEPSS
Source: Central Bank of Kenya
Third partyMessages
Multiple third parties Message Type (MT 102) increased by 157.1 percent from 1,639
transaction messages in October 2009 to 4,214 transaction messages in November
2009. Similarly, single third party Message Type (MT 103) increased by 8.3 percent
from 45,940 transaction messages to 49,759 transaction messages in the same period.
Overall, total third party messages through KEPSS increased by 13.4 percent from
47,579 transaction messages in October 2009 to 53,973 transaction messages in
November 2009.
Compared with November 2008, multiple third parties messages (MT 102) increased
by 492.7 percent from 711 transaction messages to 4,214 transaction messages in
November 2009, while single third party messages (MT 103) increased by 465.2
percent from 8,804 transaction messages to 49,759 transaction messages (Table 5.4
and Chart 5C).
Of which indirect{NSI (Ksh bn)} Value (bn) Transactions
Jan-08 1,256 78 23,773 0.05 22 57 1,081Feb-08 985 62 23,278 0.04 21 47 1,108Mar-08 891 60 20,920 0.04 18 49 1,162Apr-08 1,220 107 24,684 0.05 22 55 1,122May-08 1,895 94 19,730 0.10 21 90 940Jun-08 2,601 115 22,387 0.12 20 130 1,119Jul-08 1,864 75 24,599 0.08 23 81 1,070Aug-08 1,327 59 20,593 0.06 21 63 981Sep-08 1,367 76 23,494 0.06 22 62 1,068Oct-08 1,344 85 23,635 0.06 20 67 1,182Nov-08 1,225 57 22,718 0.05 21 58 1,082Dec-08 1,293 94 24,131 0.05 20 65 1,207Jan-09 1,376 68 25,330 0.05 21 66 1,206Feb-09 1,236 64 20,710 0.06 19 65 1,090Mar-09 1,235 82 23,752 0.05 22 56 1,080Apr-09 1,077 997 22,485 0.05 20 54 1,124May-09 1,064 994 24,024 0.04 20 53 1,201Jun-09 1,032 80 21,977 0.05 21 49 1,047Jul-09 1,185 75 25,650 0.05 23 52 1,115Aug-09 1,127 69 23,001 0.05 21 54 1,095Sep-09 1,198 90 24,552 0.05 21 57 1,169Oct-09 1,481 27 55,440 0.03 21 71 2,640Nov-09 1,430 21 56,900 0.03 21 68 2,710
Total value moved per month (bn)
No. of Transactions
Average value per transaction (bn)
Days worked
Per day
0
500
1000
1500
2000
2500
3000
Aug-0
5Se
p-05
Oct-0
5No
v-05
Dec-0
5Jan
-06Feb
-06Ma
r-06
A pr-0
6Ma
y-06
Jun-06
Jul-06
Aug-0
6Se
p-06
Oct-0
6No
v-06
Dec-0
6Jan
-07Feb
-07Ma
r-07
A pr-0
7Ma
y-07
Jun-07
Jul-07
Aug-0
7Se
p-07
Oct-0
7No
v-07
Dec-0
7Jan
-08Feb
-08Ma
r-08
A pr-0
8Ma
y-08
Jun-08
Jul-08
Aug-0
8Se
p-08
Oct-0
8No
v-08
Dec-0
8Jan
-09Feb
-09Ma
r-09
Apr-0
9Ma
y-09
Jun-09
Jul-09
Aug-0
9Se
p-09
Oct-0
9No
v-09
Value
moved
(Kshs
bn)

32 Kenya Monthly Economic Review, November 2009
DEVELOPMENTS IN THE BANKING SECTOR
DomesticForeign
CurrencyFlows
CHART 5C: TRENDS IN MT102 AND MT103 THROUGH KEPSS
Source: Central Bank of Kenya
TABLE 5.4: TRENDS IN MT102 AND MT103 THROUGH KEPSS
Source: Central Bank of Kenya
MT102 MT103 Total2008 January 877 6,300 7,177
February 724 6,318 7,042March 684 6,637 7,321April 781 8,457 9,238May 708 7,393 8,101June 718 7,503 8,221July 764 8,268 9,032August 696 7,839 8,535September 791 8,481 9,272October 751 8,803 9,554November 711 8,804 9,515December 766 11,009 11,775
2009 January 786 9,815 10,601February 740 9,376 10,116March 929 10,832 11,761April 758 10,671 11,429May 852 10,351 11,203Jun 866 11,194 12,060Jul 879 12,778 13,657Aug 875 11,511 12,386Sep 813 13,740 14,553Oct 1639 45,940 47,579Nov 4214 49,759 53,973
0
10000
20000
30000
40000
50000
60000
Aug
Sep
Oct
Nov
Dec
Jan
Feb
Mar
Apr
May
Jun Jul
Aug
Sep
Oct
Nov
Dec
Jan
Feb
Mar
Apr
May
Jun Jul
Aug
Sep
Oct
Nov
Dec
Jan
Feb
Mar
Apr
May
Jun Jul
Aug
Sep
Oct
Nov
Dec
Jan
Feb
Mar
Apr
May
Jun Jul
Aug
Sep
Oct
Nov
2005 2006 2007 2008
Numb
er of
mess
ages
MT102 MT103 Total
Inter-bank transfers (MT 202) accounted for 57.8 percent on average of the total
value moved through KEPSS in November 2009, while third party messages
accounted for 42.2 percent. The total number of third party messages (MT 102 and
MT 103) grew by 467.2 percent from 9,515 messages in November 2008 to 53,973
messages in November 2009.
Domestic Foreign Currency messages through KEPSS increased by 14.0 percent
from 3,551 transaction messages in October 2009 to 4,050 transaction messages in
November 2009. The corresponding value in Kenya Shillings equivalent moved in
this period also increased by 35.1 percent from Ksh 30.3 billion to Ksh 40.9 billion.
The US dollar accounted for 90.9 percent of the value moved (Chart 5D), while the
Sterling Pound and the Euro accounted for 2.9 percent and 6.2 percent, respectively.

Kenya Monthly Economic Review, November 2009 33
DEVELOPMENTS IN THE BANKING SECTOR
Source: Central Bank of Kenya
CHART 5D: DOMESTIC FOREIGN CURRENCY CHEQUE CLEARING KENYA SHILLINGEQUIVALENT FLOW THROUGH KEPSS
0
5000
10000
15000
20000
25000
30000
35000
40000
45000
Oct-0
6No
v-06
Dec-0
6Ja
n-07
Feb-0
7Ma
r-07
Apr-0
7Ma
y-07
Jun-0
7Ju
l-07
Aug-0
7Se
p-07
Oct-0
7No
v-07
Dec-0
7Ja
n-08
Feb-0
8Ma
r-08
Apr-0
8Ma
y-08
Jun-0
8Ju
l-08
Aug-0
8Se
p-08
Oct-0
8No
v-08
Dec-0
8Ja
n-09
Feb-0
9Ma
r-09
Apr-0
9Ma
y-09
Jun-0
9Ju
l-09
Aug-0
9Se
p-09
Oct-0
9No
v-09
Kshs
milli
on
US Dollar Sterling Pound Euro Total

34 Kenya Monthly Economic Review, November 2009
Source: Treasury
TABLE 6.2: COMPOSITION OF GOVERNMENT REVENUE (Ksh billion)
Revenue
GOVERNMENT BUDGET PERFORMANCE
Source: Treasury
Central Government budgetary operations in the five months of the fiscal year
2009/10 resulted in a deficit of Ksh 38.2 billion on commitment basis compared
with a deficit of Ksh 26.4 billion in a similar period of 2008/09 (Table 6.1). The
deficit-to-GDP ratio increased from 1.2 percent to 1.6 percent on commitment basis
while the budget deficit on cash basis decreased from 1.7 percent to 1.6 percent of
GDP during the period. The budget deficit during the period was within the
programmed target of 3.2 percent of GDP on commitment basis. The performance
of the Government budget during the period, however, reflected lower than budgeted
Government expenditure.
Government revenue and grants increased from Ksh 184.2 billion in the five months
of fiscal year 2008/09 to Ksh 208.6 billion in the same period of fiscal year 2009/10
against a target of Ksh 223.6 billion. The shortfall in total revenue was in tax revenue,
Appropriations-in-Aid (AIA), and external grants that were Ksh 5.1 billion, Ksh 5.0
billion and 5.0 billion below target, respectively. However, the share of Government
revenue and grants in GDP was 8.5 percent during the period.
TABLE 6.1: STATEMENT OF CENTRAL GOVERNMENT BUDGETARY OPERATIONS (Ksh Bn)
FY 2008/09
Nov NovOver (+) / Below (-)
Actual Provisional Target Target1. TOTAL REVENUE 184.2 208.6 223.6 -15.0 Revenue 180.3 204.5 214.5 -10.0
Tax Revenue 165.6 184.8 189.9 -5.1 Non Tax Revenue 2.6 5.8 5.7 0.0 Appropriations-in-Aid 12.1 13.9 18.9 -5.0 External Grants 3.9 4.1 9.1 -5.02. TOTAL EXPENSES 210.5 246.7 302.4 -55.7 Recurrent Expenses 164.4 194.4 206.9 -12.4 Development Expenses 46.1 52.3 95.5 -43.23. DEFICIT ON A COMMITMENT BASIS (1-2) -26.4 -38.2 -78.9 -40.7
As % of GDP -1.2 -1.6 -3.24. ADJUSTMENT TO CASH BASIS -11.2 0.0 0.0 0.05. DEFICIT ON A CASH BASIS -37.6 -38.2 -78.9 -40.7
As % of GDP -1.7 -1.6 -3.26. DISCREPANCY:Exp. (+) / Rev. (-) -1.3 12.7 0.07. FINANCING 36.4 50.9 78.9 -28.0 Domestic (Net) 34.1 51.9 65.6 -13.7
External (Net) 2.3 -1.1 9.3 -10.3Capital Receipts (privatisation) 0.0 0.0 4.0 -4.0Others 0.0 0.0 0.0 0.0Financing gap 0.0 0.0 0.0 0.0
FY 2009/10
Nov-08 Nov-09 ChangeKsh bn Ksh bn
1. Revenue (2+3+4) 180.3 204.5 24.22. Tax Revenue 165.6 184.8 19.2
Income Tax 62.8 73.1 10.3Value Added Tax 53.1 57.1 4.0Import Duty 14.3 16.5 2.2Excise Duty 26.4 29.8 3.4Others 8.9 8.3 -0.6
3. Appropriations-in-Aid 12.1 13.9 1.94. Other Revenue 2.6 5.8 3.15. External Grants 3.9 4.1 0.2TOTAL RECEIPTS (1+5) 184.2 208.6 24.4

Kenya Monthly Economic Review, November 2009 35
PERFORMANCE OF THE GOVERNMENT BUDGET
Expenditureand NetLending
Source: Treasury
CHART 6A: COMPOSITION OF GOVERNMENT RECEIPTS
Tax revenue increased from Ksh 180.3 billion in the five months of the fiscal year
2008/09 to Ksh 204.5 billion in the current period, representing a growth of 13.4
percent in the tax proceeds, following increases in income and value added taxes
during the period. Similarly, Appropriation-in-Aid (AIA) increased by Ksh 1.9 billion
while non-tax revenue increased by Ksh 3.1 billion.
Following these developments, the percentage of tax revenue in total revenue
decreased from 89.9 percent in the five months of the fiscal year 2008/09 to 88.6
percent in a similar period in the fiscal year 2009/10 (Chart 6A). The share of non-
tax revenue increased from 1.4 percent to 2.8 percent during the same period, while
the proportion of AIA increased from 6.6 percent to 6.7 percent.
During the five months of the fiscal year 2009/10, Government expenditure and net
lending increased by 17.2 percent, from Ksh 210.5 billion in a similar period in the
fiscal year 2008/09 to Ksh 246.7 billion (Table 6.3). This rise was due to increases of
18.2 percent and 13.5 percent in recurrent and development expenditures,
respectively.
The recurrent expenditure increased by Ksh 30.0 billion, attributed to increases of
Ksh 7.5 billion in wages and salaries, interest payments of Ksh 7.5 billion and Ksh
15.0 billion in other expenses. Development expenditure increased by Ksh 6.2 billion,
from Ksh 46.1 billion to Ksh 52.3 billion in the period.
As a result of these developments, the percentage of development expenditure in
total expenditure decreased from 21.9 percent in the five months of the fiscal year
2008/09 to 21.2 percent in a similar period in the fiscal year in 2009/10, while
recurrent expenditure increased from 78.1 percent to 78.8 percent (Chart 6B).
Income Tax34.1%
Value Added Tax
28.8%Import Duty
7.8%
Excise Duty14.4%
Other Revenue
12.8%
External Grants2.1%
COMPOSITION OF GOVERNMENTRECEIPTS
NOVEMBER 2008
Income Tax35.0%
Value Added Tax
27.4%
Import Duty7.9%
Excise Duty14.3%
Other Revenue
13.4%External Grants2.0%
COMPOSITION OF GOVERNMENTRECEIPTS
NOVEMBER 2009

36 Kenya Monthly Economic Review, November 2009
PERFORMANCE OF THE GOVERNMENT BUDGET
Sources: Treasury and Central Bank of Kenya
Financing
Source: Treasury
TABLE 6.3: GOVERNMENT EXPENDITURE (Ksh billion)
Source: Treasury
CHART 6B: COMPOSITION OF GOVERNMENT EXPENDITURE
TABLE 6.4: GOVERNMENT BORROWING REQUIREMENTS & SOURCES (Ksh billion)
During the five months of 2009/10, budgetary operations of the Government resulted
in a financing requirement of Ksh 51.9 billion compared with Ksh 43.8 billion in a
similar period of 2008/09 (Table 6.4). The financing requirement comprised Ksh
50.9 billion to finance the budget deficit and Ksh 1.1 billion reduction of external
debt. The financing requirement was sourced through net domestic borrowing of
Ksh 40.1 billion and draw down in Government deposits by Ksh 11.9 billion.
Nov-08 Nov-09 MovementKsh bn Ksh bn
1.Recurrent 164.4 194.4 30.0Salaries & Wages 64.8 72.3 7.5Total Interest 20.5 28.0 7.5
of which Domestic* 18.8 25.8 7.0Foreign interest due 1.7 2.2 0.5
Others 79.1 94.2 15.02. Development 46.1 52.3 6.2TOTAL EXPENSES 210.5 246.7 36.2*Includes commission and other charges paid to CBK and other agencies
Salaries & Wages30.8%
Interest payment
9.7%
Other Recurrent
Expenditure37.6%
Development Expenditure
21.9%
COMPOSITION OF GOVERNMENTEXPENSES NOVEMBER 2008
Salaries & Wages29.3%
Interest payment11.3%
Other Recurrent
Expenditure38.2%
Development Expenditure
21.2%
COMPOSITION OF GOVERNMENT EXPENSES NOVEMBER 2009
I. FINANCING REQUIREMENTS Nov-08 Nov-09Ksh bn Ksh bn
1. Budget deficit 36.4 50.92. External debt reduction 0.0 1.13. Domestic debt reduction 7.4 0.0 3.1 Central Bank (incl. items in transit) 7.4 0.0 3.2 Commercial banks (net of deposits) 0.0 0.0 3.3 Non-bank sources 0.0 0.04. Increase in GoK deposits at CBK 0.0 0.0
TOTAL 43.8 51.9
II. FINANCING SOURCES Nov-08 Nov-09Ksh bn Ksh bn
1. Budget surplus 0.0 0.02. External debt increase 2.3 0.03. Increase in domestic debt 14.8 40.1 3.1 Central Bank 0.0 3.1 3.2 Commercial banks 10.3 33.4 3.3 Non-bank sources 4.5 3.64. Reduction in GoK deposits at CBK 26.8 11.95. Privatisation proceeds 0.0 0.0
TOTAL 43.8 51.9

Kenya Monthly Economic Review, November 2009 37
PERFORMANCE OF THE GOVERNMENT BUDGET
Source: Central Bank of Kenya
Outlook forFY 2009/10
GovernmentBorrowingfrom the
Central Bank
TABLE 6.5: GOVERNMENT INDEBTEDNESS TO THE CENTRAL BANK (Ksh billion)
Government indebtedness to the Central Bank increased from Ksh 39.5 billion in
November 2008 to Ksh 43.7 billion in November 2009. The rise in Government
indebtedness during the period was attributed to an increases of Ksh 5.9 billion in
the Government overdraft at Central Bank . Meanwhile, Government reduced other
outstanding debt as follows: Ksh 1.1 billion in the Pre-1997 Government overdraft
at Central Bank, Ksh 0.4 billion in IMF funds on-let to Government and Ksh 0.2
billion in cleared items in transit.
The budget estimates for the fiscal year 2009/10, project Government revenue
excluding external grants at Ksh 568.9 billion (22.4 percent of GDP). External grants
are estimated at Ksh 35.3 billion (1.4 percent of GDP) during the fiscal year. Similarly,
Government expenditure is estimated at Ksh 772.4 billion or 30.3 percent of GDP
and comprise Ksh 509.1 billion (19.9 percent of GDP) in recurrent expenditure, Ksh
261.3 billion (10.3 percent of GDP) in development expenditure and Ksh 2.0 billion
in civil contingency fund.
The overall budget deficit including grants is therefore estimated at Ksh 168.2 billion
(6.6 percent of GDP) in 2009/10. The deficit is to be financed through net external
borrowing of Ksh 50.2 billion (2.0 percent of GDP), net domestic borrowing of Ksh
109.5 billion (4.3 percent of GDP), privatization proceeds of Ksh 6.0 billion and net
refinancing costs of Telkom totalling Ksh 2.5 billion.
2008 2009Nov Nov
Total Credit 39.5 43.7 4.21. Overdraft 3.9 9.8 5.92. Rediscounted securities 0.0 0.0 0.0 Treasury bills 0.0 0.0 0.0 Treasury bonds 0.0 0.0 0.03. Pre-1997 Government Overdraft at CBK 34.4 33.3 -1.14. IMF funds onlent to Government 0.9 0.5 -0.45. Cleared items in transit 0.2 0.1 -0.2Memorandum Authorised overdraft limit 14.8 21.0 9.7 Amount utilised to date 3.9 9.8 9.8 Amount available 10.9 11.2 -0.1
Movement

38 Kenya Monthly Economic Review, November 2009
TreasuryBills
DomesticDebt
TABLE 7.1: KENYA’S PUBLIC DEBT (Ksh billion)
Sources: Treasury and Central Bank of Kenya
DEVELOPMENTS IN PUBLIC DEBT
Overall Debt Kenya’s public and publicly guaranteed debt increased by 2.9 percent in the first five
months of fiscal year 2009/10 to stand at Ksh 1,084.2 billion in November 2009
from Ksh 1,053.7 billion in June 2009 (Table 7.1). This represented 44.1 percent of
GDP, which was higher than 41.3 percent of GDP recorded in a similar period of
2008/09, following a slower growth in GDP. The external debt to GDP ratio decreased
from 22.4 percent in June 2009 to 21.2 percent in November 2009 while the domestic
debt to GDP ratio increased from 21.7 percent to 22.9 percent during the period.
Public domestic debt increased by 8.6 percent during the five months of the fiscal
year 2009/10 from Ksh 518.5 billion in June 2009 to Ksh 562.9 billion in November
2009 (Table 7.2). The rise in domestic debt during the period followed increases of
Ksh 20.9 billion in Treasury bills (excluding Repos), Ksh 20.3 billion in Treasury
bonds and Ksh 3.2 billion in other domestic debt. Government overdraft at Central
bank, which is the main component of other domestic debt, increased from Ksh 5.1
billion in June 2009 to Ksh 9.8 billion in November 2009.
Treasury bills increased from Ksh 116.8 billion in June 2009 to Ksh 137.7 billion in
November 2009 (Table 7.3). As a proportion to gross domestic debt, the share of
Treasury bills increased from 22.5 percent to 24.5 percent during the period while
the Treasury bills held by commercial banks rose from Ksh 74.6 billion to Ksh 104.5
billion. In terms of category, the share of the 91-day Treasury bills decreased from
4.9 percent to 4.5 percent, while that of the 182-day Treasury bills in total Government
securities increased from 19.5 percent to at 22.0 percent during the period (Table
7.5). This indicates a shift in demand to the longer maturities on account of the
higher return of the latter.
Jun-08 Dec-08 Mar-09 June-09 Jul-09 Aug-09* Sep-09 Oct-09* Nov-09** Change2009/10
Bilateral 153.2 187.2 182.7 185.9 185.5 184.8 184.8 184.5 189.5 -1.5Multilateral*** 268.2 305.9 307.9 327.1 324.5 323.1 323.1 322.7 308.0 -4.4Commercial Banks 0.0 0.0 0.0 0.0 0.0 0.0 0.0 0.0 0.0 0.0Export Credit 18.5 22.3 23.1 22.1 22.1 22.1 22.1 22.1 23.7 0.0Sub-Total 440.0 515.4 513.6 535.1 532.1 530.1 530.0 529.3 521.2 -5.9(As a % of GDP) 21.6 23.3 22.3 22.4 22.1 21.9 21.8 21.8 21.2(As a % of total debt) 50.5 53.0 52.0 50.8 50.1 49.2 49.0 48.3 48.1
DOMESTIC\Banks 228.8 254.1 263.4 290.8 292.8 306.3 310.5 325.1 331.0 40.2 Central Bank 46.4 49.4 40.6 40.1 37.6 40.3 41.6 42.9 43.4 3.3 Commercial Banks 182.5 204.7 222.8 250.7 255.1 266.0 268.9 282.2 287.6 36.8Non-banks 199.2 198.9 208.8 225.1 235.6 238.5 237.7 239.4 229.1 4.0
Non-bank Financial Inst. 0.7 0.7 1.1 1.0 0.8 0.8 0.8 0.8 0.9 -0.2Other Non-bank Sources 198.5 198.2 207.8 224.1 234.8 237.7 236.9 238.6 228.2 4.1
Non-residents 2.6 3.2 2.7 2.6 2.2 2.4 2.5 2.6 2.9 0.3Sub-Total 430.6 456.2 474.9 518.5 530.5 547.2 550.7 567.1 562.9 44.4
(As a % of GDP) 21.1 20.6 20.6 21.7 22.1 22.6 22.6 23.2 23.0GRAND TOTAL 870.6 971.6 988.5 1053.7 1062.7 1077.3 1075.7 1091.0 1084.2 30.5 (As a % of GDP) 42.8 43.9 42.9 44.0 44.2 44.5 44.2 44.6 44.1
** External Debt Provisional
1/ Domestic Debt is reported on gross basis
EXTERNAL
* External Debt Revised
***Includes IMF Loans.

Kenya Monthly Economic Review, November 2009 39
DEVELOPMENTS IN PUBLIC DEBT
TABLE 7.2: GOVERNMENT GROSS DOMESTIC DEBT (Ksh billion)
Source: Central Bank of Kenya
TABLE 7.3: OUTSTANDING TREASURY BILLS BY HOLDER (Ksh billion)
Source: Central Bank of Kenya
TreasuryBonds
Treasury bonds increased by 5.6 percent from Ksh 360.7 billion in June 2009 to Ksh
381.0 billion in November 2009 (Table 7.4). The percentage of Treasury bonds in
total domestic debt decreased from 69.6 percent to 67.7 percent during the period.
Commercial banks were the largest investors accounting for 48.1 percent of the
value of outstanding Treasury bonds as at November 2009, followed by pension
funds at 16.8 percent.
In terms of maturity, the 5-year Treasury bonds accounted for the largest proportion
of outstanding Government securities during the period, increasing from 11.1 percent
in June 2009 to 12.9 percent in November 2009 while the 10-year Treasury bonds
accounted for 11.0 percent of outstanding Government securities. The percentage
of Treasury bonds with maturities of between 10-years and 20-years increased from
27.0 percent to 29.1 percent during the period following successful issuance of longer
dated Treasury bonds. Following the increase in outstanding Treasury bonds during
the period, the average maturity profile of domestic debt (by days to maturity) stood
at 3 years and 10 months in November 2009 from 3 years 7 months in June 2009.
Dec % Jun % July % Aug % Sep % Oct % Nov %Total stock of Domestic Debt (A+B) 456.2 100.0 518.5 100.0 530.5 100.0 547.2 100.0 550.7 100.0 547.2 100.0 562.9 100.0 44.4
A. Government Securities 440.7 96.6 511.6 98.7 526.1 99.2 540.2 98.7 542.4 98.5 557.5 101.9 552.9 98.2 41.3
1. Treasury Bills (excluding Repo Bills) 87.5 19.2 116.8 22.5 120.8 22.8 127.6 23.3 122.2 22.2 133.6 24.4 137.7 24.5 20.9
Banking institutions 42.1 9.2 74.6 14.4 79.6 15.0 83.9 15.3 81.3 14.8 92.8 17.0 104.5 18.6 29.8
Others 45.3 9.9 42.2 8.1 41.2 7.8 43.7 8.0 40.9 7.4 40.7 7.4 33.3 5.9 -8.9
2. Treasury Bonds 318.6 69.8 360.7 69.6 371.2 70.0 378.5 69.2 386.1 70.1 389.9 71.3 381.0 67.7 20.3
Banking institutions 162.6 35.6 176.0 33.9 175.5 33.1 182.1 33.3 187.5 34.1 189.3 34.6 183.1 32.5 7.1
Others 156.0 34.2 184.8 35.6 195.7 36.9 196.4 35.9 198.5 36.1 200.5 36.6 198.0 35.2 13.2
3. Long term Stocks 0.8 0.2 0.8 0.1 0.8 0.1 0.8 0.1 0.8 0.1 0.8 0.1 0.8 0.1 0.0
Banking institutions 0.0 0.0 0.0 0.0 0.0 0.0 0.0 0.0 0.0 0.0 0.0 0.0 0.0 0.0 0.0
Others 0.8 0.2 0.8 0.1 0.8 0.1 0.8 0.1 0.8 0.1 0.8 0.1 0.8 0.1 0.0
4. Pre-1997 Government Overdraft at CBK 33.9 7.4 33.3 6.4 33.3 6.3 33.3 6.1 33.3 6.1 33.3 6.1 33.3 5.9 0.0
Of which: Repo T/Bills 33.9 7.4 33.3 6.4 33.3 6.3 33.3 6.1 33.3 6.1 33.3 6.1 33.3 5.9 0.0
B. Others: 15.5 3.4 6.9 1.3 4.4 0.8 7.0 1.3 8.3 1.5 9.6 1.8 10.1 1.8 3.2
Of which CBK overdraft to Government 15.1 3.3 5.1 1.0 3.9 0.7 6.1 1.1 8.0 1.5 9.3 1.7 9.8 1.7 4.7From January 2001 domestic debt is reported on a gross basis i.e. without netting out government deposits and Treasury advances to parastatals
2008 Change Jun-09- Nov -09
2009
Holders June % Jul % Aug % Sep % Oct % Nov %Banking Institutions 74.6 63.9 79.6 65.9 83.9 65.8 81.3 66.6 92.8 69.5 104.5 76.9 Central Bank 0.0 0.0 0.0 0.0 0.0 0.0 0.0 0.0 0.0 0.0 0.0 0.0 Comm. Banks 74.6 63.9 79.6 65.9 83.9 65.8 81.3 66.6 92.8 69.5 104.5 75.8 NBFIs 0.0 0.0 0.0 0.0 0.0 0.0 0.0 0.0 0.0 0.0 0.0 0.0Insurance Companies 17.0 14.6 15.8 13.1 15.9 12.4 15.1 12.3 14.9 11.1 13.0 9.4Parastatals 2.3 2.0 2.5 2.1 3.2 2.5 3.7 3.0 3.9 2.9 3.8 2.8 Of which: NSSF 0.0 0.0 0.0 0.0 0.0 0.0 0.0 0.0 0.0 0.0 0.0 0.0Pension Funds 7.0 6.0 6.9 5.7 7.1 5.6 6.5 5.3 7.4 5.5 0.0 0.0Others 15.8 13.6 16.0 13.2 17.5 13.7 15.6 12.8 14.5 10.9 16.4 11.9Total* 116.8 100.0 120.8 100.0 127.6 100.0 122.2 100.0 133.6 100.0 137.7 100.9* Excludes repurchase order bills
2009

40 Kenya Monthly Economic Review, November 2009
DEVELOPMENTS IN PUBLIC DEBT
MaturityProfile ofTreasuryBills andBonds
ExternalDebt
TABLE 7.4: OUTSTANDING TREASURY BONDS BY HOLDER (Ksh billion)
Source: Central Bank of Kenya
Source: Central Bank of Kenya
TABLE 7.5: OUTSTANDING TREASURY BILLS AND BONDS (Ksh billion)
GovernmentLong-term
Stocks
Compositionof External
Debt byCreditor
During the first five months of the fiscal year 2009/10, Government long term stocks
remained unchanged at Ksh 0.8 billion or 0.1 percent of total domestic debt as there
were neither new issues nor redemptions of the instrument.
Cumulative redemptions of Government securities from December 2009 to February
2010 will comprise Ksh 60.5 billion in Treasury bills and Ksh 19.7 billion in Treasury
bonds. Treasury bills maturities in the period will comprise Ksh 23.5 billion and Ksh
37.0 billion in 91-days and 182-days Treasury bills, respectively.
Kenya’s external debt decreased by 2.6 percent from Ksh 535.1 billion (USD 6.94
billion) in June 2009 to Ksh 521.2 billion (USD 6.93 billion) in November 2009
following strengthening of the shilling against the US dollar (Table 7.1). The decline
in external debt followed external loans disbursement of Ksh 6.5 billion and
revaluation gains of Ksh 12.7 billion which was less than the repayments of Ksh 7.9
billion.
The percentage of external debt owed to multilateral creditors (including IMF)
decreased from 61.1 percent of total external debt to 59.1 percent during the period.
However, the percentage of external debt owed to bilateral creditors and that which
is contracted through export credits increased from 34.7 percent and 4.1 percent,
Holders Oct % Nov % Dec % July % Aug % Sep % Oct % Nov %Banking Institutions 161.3 51.2 165.8 51.7 163.3 51.3 176.3 47.5 182.9 48.3 188.4 48.8 190.2 48.8 183.9 48.3 Central Bank 0.0 0.0 0.0 0.0 0.0 0.0 0.0 0.0 0.0 0.0 0.0 0.0 0.0 0.0 0.0 0.0 Comm. Banks 160.6 51.0 165.1 51.4 162.6 51.0 175.5 47.3 182.1 48.1 187.5 48.6 189.3 48.6 183.7 48.1 NBFIs 0.7 0.2 0.7 0.2 0.7 0.2 0.8 0.2 0.8 0.2 0.8 0.2 0.8 0.2 0.8 0.2Insurance Companies 32.1 10.2 32.4 10.1 32.4 10.2 39.2 10.6 41.6 11.0 42.9 11.1 44.0 11.3 43.4 11.4Parastatals 29.4 9.3 29.5 9.2 29.5 9.2 31.8 8.6 31.0 8.2 29.7 7.7 28.8 7.4 28.3 7.4 Of which: NSSF 12.4 3.9 12.5 3.9 12.5 3.9 15.9 4.3 16.5 4.4 15.9 4.1 15.8 4.0 15.3 4.0Building Societies 0.6 0.2 0.6 0.2 0.6 0.2 0.5 0.1 0.5 0.1 0.5 0.1 0.5 0.1 0.4 0.1Pensions Fund 37.1 11.8 37.6 11.7 37.6 11.8 55.3 14.9 59.2 15.6 60.8 15.7 64.1 16.5 64.1 16.8Others 54.6 17.3 55.1 17.2 55.2 17.3 68.0 18.3 63.3 16.7 63.8 16.5 62.3 16.0 60.8 16.0
Total 315.0 100.0 320.9 100.0 318.6 100.0 371.2 100.0 378.5 100.0 386.1 100.0 389.9 100.0 381.0 100.0
20092008
Oct % Nov % Dec % July % Aug % Sep % Oct % Nov % 91-Day 21.3 5.3 20.1 4.9 18.5 4.6 26.9 5.5 30.3 6.0 22.8 4.5 23.1 4.4 23.5 4.5
182-Day 68.6 16.9 68.6 16.7 68.9 17.0 93.9 19.1 97.3 19.2 99.4 19.5 110.4 21.1 114.3 22.01-Year 12.1 3.0 18.0 4.4 12.5 3.1 12.6 2.6 12.6 2.5 12.6 2.5 12.6 2.4 6.7 1.32-Year 31.3 7.7 31.3 7.6 34.5 8.5 45.2 9.2 45.2 8.9 53.2 10.5 53.2 10.2 51.9 10.03-Year 19.8 4.9 19.8 4.8 19.8 4.9 12.8 2.6 9.6 1.9 5.8 1.1 5.8 1.1 5.8 1.14-Year 16.5 4.1 16.5 4.0 16.5 4.1 12.9 2.6 12.9 2.6 12.9 2.5 7.3 1.4 7.3 1.45-Year 48.7 12.0 48.7 11.9 48.7 12.0 52.8 10.7 63.2 12.5 66.7 13.1 66.7 12.7 66.7 12.96-Year 45.6 11.3 45.6 11.1 45.6 11.2 38.8 7.9 38.8 7.7 38.8 7.6 38.8 7.4 37.1 7.17-Year 24.2 6.0 24.2 5.9 24.2 5.9 24.2 4.9 24.2 4.8 24.2 4.8 24.2 4.6 24.2 4.78-Year 17.9 4.4 17.9 4.4 17.9 4.4 17.9 3.6 17.9 3.5 17.9 3.5 17.9 3.4 17.9 3.59-Year 12.6 3.1 12.6 3.1 12.6 3.1 12.6 2.6 12.6 2.5 12.6 2.5 12.6 2.4 12.6 2.4
10-Year 39.4 9.7 39.4 9.6 39.4 9.7 57.0 11.6 57.0 11.3 57.0 11.2 57.0 10.9 57.0 11.011-Year 4.0 1.0 4.0 1.0 4.0 1.0 4.0 0.8 4.0 0.8 4.0 0.8 4.0 0.8 4.0 0.812-Year 8.8 2.2 8.8 2.1 8.8 2.2 28.5 5.8 28.5 5.6 28.5 5.6 28.5 5.4 28.5 5.515-Year 32.1 7.9 32.1 7.8 32.1 7.9 42.3 8.6 42.3 8.4 42.3 8.3 51.7 9.9 51.7 10.020-Year 1.9 0.5 1.9 0.5 1.9 0.5 9.5 1.9 9.5 1.9 9.5 1.9 9.5 1.8 9.5 1.8Total 404.8 100.0 409.6 100.0 406.1 100.0 492.0 100.0 506.1 100.0 508.3 100.0 523.4 100.0 518.8 100.0
20092008

Kenya Monthly Economic Review, November 2009 41
DEVELOPMENTS IN PUBLIC DEBT
Source: Treasury
CHART 7A: COMPOSITION OF EXTERNAL DEBT
Source: Treasury
CHART 7B: EXTERNAL DEBT BY CREDITOR
respectively, in June 2009 to 36.4 percent and 4.6 percent in November 2009 (Chart
7A).
As shown in Chart 7B, external debt owed to IDA and Japan remained unchanged
at USD 3.1 billion and USD 1.2 billion, respectively, in November 2009. The two
remained the largest multilateral and bilateral creditors to Kenya during the period.
The percentage of external debt held in US dollars and in other currencies including
SDRs decreased from 27.9 percent and 8.3 percent in June 2009, respectively, to
27.8 percent and 6.8 percent in November 2009. However the external debt
proportion held in Japanese Yen and Euro increased from 25.5 percent and 32.5
percent respectively to 26.6 percent and 33.1 during the period (Chart 7C). The
external debt proportion held in Sterling Pounds remained unchanged at 5.8 percent
in November 2009.
Bilateral34.7%
Multilateral61.1%
Commercial Banks0.0%
Export Credit4.1%
JUNE 2009
Bilateral36.4%
Multilateral59.1%
Commercial Banks0.0%
Export Credit4.6%
November 2009
0.0
0.5
1.0
1.5
2.0
2.5
3.0
3.5
IDA
JAPA
N
AD
B/A
DF
FRA
NC
E
IMF
GER
MA
NY
ITA
LY
EEC
/EIB
USA
BEL
GIU
M
NET
HER
LAN
DS
CO
MM
BA
NK
S
UK
OTH
ERS
Am
ount
(US
D B
illio
n)

42 Kenya Monthly Economic Review, November 2009
DEVELOPMENTS IN PUBLIC DEBT
Outlook forthe FY 2009/
10
Public DebtService
Source: Treasury
CHART 7C: EXTERNAL DEBT DISTRIBUTION BY CURRENCY
Cumulative Government expenditure on interest and other charges on domestic
debt increased from Ksh 13.5 billion in the first five months of fiscal year 2008/09 to
Ksh 19.6 billion in a similar period of the fiscal year 2009/10. The rise in debt service
reflected a higher stock of debt. Consequently, the percentage of domestic interest in
ordinary Government revenue increased from 10.3 percent to 13.5 percent during
the period. External debt service increased from Ksh 8.1 billion to Ksh 10.0 billion.
The external debt service in the period comprised Ksh 7.7 billion in principal
repayments and Ksh 2.3 billion in interest payments.
The budget estimates for 2009/10 projects Government domestic borrowing at Ksh
109.5 billion (4.3 percent of GDP) and external borrowing at Ksh 50.2 billion (2.0
percent of GDP. However, as indicated in the Budget Strategy Paper for 2009/10 to
2011/12, gross domestic debt-to-GDP ratio is projected to increase from 22.7 percent
in June 2009 to 24.2 percent in June 2010 as GDP is expected to grow at a faster
rate compared with domestic debt. Consequently, external debt-to-GDP ratio is
expected to increase from 22.0 percent to 23.9 percent during the period, which
will, however, be lower than the 24.1 percent in June 2009.
YEN25.5%
ST£5.8%
USD27.9%
EURO32.5%
OTHERS8.3%
CURRENCY COMPOSITION OF EXTERNAL DEBT- JUNE 2009
YEN26.6%
ST£5.8%USD
27.8%
EURO33.1%
OTHERS6.8%
CURRENCY COMPOSITION OF EXTERNAL DEBT- NOVEMBER 2009

Kenya Monthly Economic Review, November 2009 43
Performance at the stock market in November 2009 was mixed, with improvement
in the equities market segment and a slowdown in the bond market segment (Table
8.1).
The number of shares traded increased by 30.7 percent from 303.3 million in October
2009 to 396.4 million in November 2009. Equity turnover increased by Ksh 125.6
million (2.8 percent), from Ksh 4,521.0 million in October 2009 to Ksh 4,646.6
million in November 2009. The market capitalization increased by Ksh 41.9 billion
(5.3 percent), from Ksh 784.0 billion in October 2009 to Ksh 825.8 billion in
November 2009. The increase in market capitalization is attributed to the increase in
price of most counters. The NSE 20 Share Index rose by 105.9 points (3.4 percent)
to close at 3189.6 points in November 2009. Market liquidity ratio increased by 15
basis points to 0.64 percent in November 2009 from 0.49 percent in October 2009
reflecting an increase in the number of shares traded. The equities market
performance remained subdued, with all indicators below the pre-global financial
crisis levels.
EquityMarket
Source: Nairobi Stock Exchange
TABLE 8.1: SELECTED STOCK MARKET INDICATORS
ACTIVITY IN THE STOCK MARKET
Month NSE 20 Share Index
(1966=100)
Number of Shares Traded ( Millions)
Equities Turnover
(Ksh Millions)
Market Capitalization (Ksh Billions)
Bond Turnover (Ksh
Millions)
August 08 4,648.78 490.81 7,490.20 1,081.86 18,490.36 September 08 4,180.40 485.30 6,787.80 972.30 22,611.94 October-08 3,386.65 393.50 3,642.40 764.90 4,344.11 November-08 3,341.00 290.94 3,723.72 791.60 6,319.71 December-08 3,521.18 170.86 4,617.11 853.67 7,473.44 January-09 3,198.90 177.55 2,624.39 777.45 12,458.82 February-09 2,474.75 150.64 1,645.28 611.49 12,555.25 March-09 2,805.03 207.39 2,414.12 688.67 18,520.00 April-09 2,800.10 215.56 2,549.12 683.03 1,370.00May-09 2,852.57 308.00 3,087.67 693.44 22,310.00 June-09 3,294.56 377.56 4,126.87 821.78 21,600.00July-09 3,273.10 296.19 3,261.63 826.75 16,650.00August-09 3,102.68 280.89 3,149.21 785.28 12,890.00September-09 3,005.41 231.69 3,547.59 771.63 20,930.00October-09 3,083.63 303.30 4,520.97 783.97 22,380.00November-09 3,189.55 396.36 4,646.57 825.84 14,940.00

44 Kenya Monthly Economic Review, November 2009
ACTIVITY IN THE STOCK MARKET
The Commercial and Services sector dominated the market trading 292.2 million
shares during the month. The most traded share in the sector was Safaricom which
traded 282.5 million shares. The Finance and Investment sector traded 64.6 million
shares. The most active stock was Equity Bank which traded 39.6 million shares.
The Industrial and Allied sector traded 37.2 million shares with Mumias Sugar trading
12.2 million shares. The agricultural sector traded 2.1 million shares.
The bond market turnover decreased by 33 percent, with bonds worth Ksh 14,940
million traded in November 2009, compared with Ksh 22,380 million worth of bonds
traded in October 2009.
Source: Nairobi Stock Exchange
CHART 8A: NSE 20 SHARE INDEX (1966=100)
Bond Market
22002400260028003000320034003600380040004200440046004800500052005400560058006000
Jan
Feb
Mar
Apr
May
June
July
Aug
Sep
tO
ctN
ovD
ec Jan
Feb
Mar
Apr
May
June
July
Aug
Sep
tO
ctN
ovD
ec Jan
Feb
Mar
Apr
May
June
July
Aug
Sep Oct
Nov
Dec Ja
nFe
bM
arA
prM
ayJu
neJu
lyA
ugS
ep Oct
Nov
2006 2007 2008 2009

Kenya Monthly Economic Review, November 2009 45
ACTIVITY IN THE STOCK MARKET
BALANCE SHEET OF THE CENTRAL BANK OF KENYA
(KENYA SHILLINGS MILLION)
Source: Central Bank of Kenya
Nov-09 Nov-08 Nov 08/Nov 09
Movement
ASSETS 317,650 269,913 47,737
Foreign Ex change 265,900 224,019 41,881
Adv ances and Discounts to Banks 0 1,082 (1,082)
Discounted Gov ernment Securities 18 11 7
Gov ernment Accounts 43,711 39,503 4,208
Gov ernment of Keny a Ov erdraft 9,829 3,895 5,934
Clearing Account 71 240 (169)
IMF funds on-lent to Gov ernment 482 929 (447)
Frozen Gov ernment Accounts 33,329 34,439 (1,110)
Other assets 8,021 5,298 2,723
Debtors 4,951 3,941 1,010
Retirement Benefits Assets 1,425 55 1,370
Building and Equipment 1,193 1,025 168
Prepaid Leases 273 277 (4)
Intangible assets 179 0 179
LIABILITIES 317,650 269,913 47,737
Currency in Circulation 116,068 108,550 7,518
Repo Securities 0 310 (310)
Deposits 168,587 127,792 40,795
Banks - Keny a 62,113 52,106 10,007
Ex ternal 91 90 1
Non-Bank Financial Institutions 0 0 0
Other Public Entities and Project A/Cs 13,051 11,532 1,519
International Monetary Fund 37,332 21,339 15,993
Gov ernment of Keny a 52,292 40,739 11,553
Local Banks Forex Settlement Fund 3,708 1,986 1,722
Other Liabilities 1,784 4,197 (2,413)
Capital and Reserv es 31,211 29,064 2,147
Capital 5,000 1,500 3,500
General Reserv e Fund 26,982 7,759 19,223
Surplus b/f from prev ious y ear (177) 8,995 (9,172)
Period's Surplus (3,735) 10,810 (14,545)
Div idend pay able 3,141 0 3,141

46 Kenya Monthly Economic Review, November 2009
NOTES ON THE BALANCE SHEET
Asset
Liabilites
Foreign exchange reserves of the Bank increased by Ksh 41,881 million to
Ksh 265,900 million in November 2009 from Ksh 224,019 million in November
2008 reflecting forex purchases from the interbank market.
Government accounts increased by Ksh 4,208 million to Ksh 43,711 million in
November 2009 from Ksh 39,503 million in November 2008. The increase was
wholly in the overdraft which increased by Ksh 5,934 million. This was partly
offset by a decline of Ksh 1,110 million in non-interest bearing Government debt,
a reduction by Ksh 169 million in clearing account balances due and repayment
of Ksh 447 million on IMF funds on-lent to government.
Other assets increased by Ksh 2,723 million in the year to November 2009 on
account of increases in the value of retirement benefits by Ksh 1,370 million,
debtors by Ksh 1,010 million and value of property and equipment by Ksh 168
million. Prepaid leases, however, declined by Ksh 4 million.
Currency in circulation increased by Ksh 7,518 million to Ksh 116,068 million
in November 2009 from Ksh 108,550 million in November 2008.
The stock of repo securities fell by Ksh 310 million in the year to November
2009, following repayment of outstanding loans secured with the securities by
commercial banks.
Deposits increased by Ksh 40,795 million to Ksh 168,587 million in November
2009 on account of Ksh 11,553 million increase in Government of Kenya deposits,
increase of Ksh 15,993 million in IMF deposits held with the Bank and Ksh 1,722
million increase in local banks forex settlement balances, Ksh 10,007 million
increase in commercial banks’ deposits at the Central Bank and Ksh 1,519 million
increase in other public entities and project account deposits.
Other liabilities and provisions declined by Ksh 2,413 million to Ksh 1,784
million in the year to November 2009.
Capital and reserves increased by Ksh 2,147 million to Ksh 31,211 million in
the year to November 2009, mainly due to increases of Ksh 19,223 million in the
general reserve fund and Ksh 3,141 in the dividend payable. The increases were
partially offset by a decline in period’s surplus of the Bank and in the surplus
brought forward from the previous year.

![Monthly Economic Reviewbsl.gov.sl/MER February 2020- Final.pdf · Monthly Economic Review February 2020 Publisher: The Monthly Economic Review [MER] is published by the Research Department,](https://img.pdfslide.net/doc/110x75/5fba3d20bddd3601b021cd66/monthly-economic-february-2020-finalpdf-monthly-economic-review-february-2020.jpg)