Embed Size (px)
Citation preview
Contingency Ranking and Screening of an IEEE Bus-6 Case System with
Distributed Generation
John Christopher T. Adina
John Mark L. Gonzales
Jonathan John C. Lacsa
Julius Patrick L. Fontanilla
Engr. Michael C. Pacis
Adviser
Mapua Institute of Technology
Muralla, Intramuros, Manila
1 40th IIEE Annual National Convention, 2nd EE Faculty Research Colloquium, SMX Mall of Asia

CONTENTS 1. Introduction 2. Problem Statement 3. Objectives 4. Methodology 5. Results and Discussion 6. Conclusion 7. Recommendations
2
Introduction
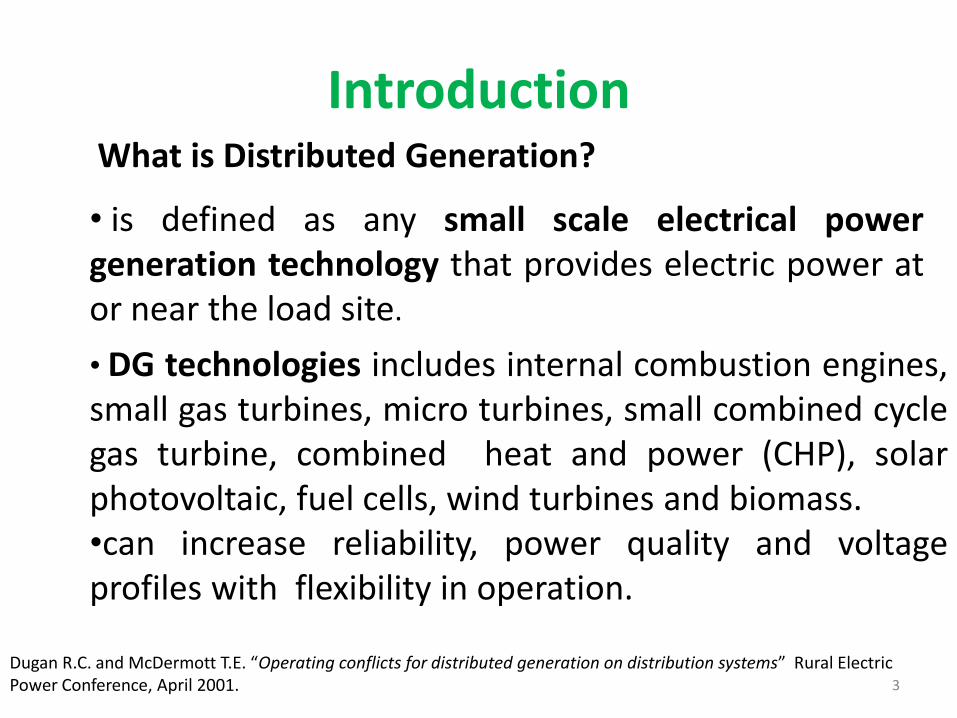
• is defined as any small scale electrical power generation technology that provides electric power at or near the load site.
• DG technologies includes internal combustion engines, small gas turbines, micro turbines, small combined cycle gas turbine, combined heat and power (CHP), solar photovoltaic, fuel cells, wind turbines and biomass. •can increase reliability, power quality and voltage profiles with flexibility in operation.
3
What is Distributed Generation?
Dugan R.C. and McDermott T.E. “Operating conflicts for distributed generation on distribution systems” Rural Electric Power Conference, April 2001.
Introduction
4
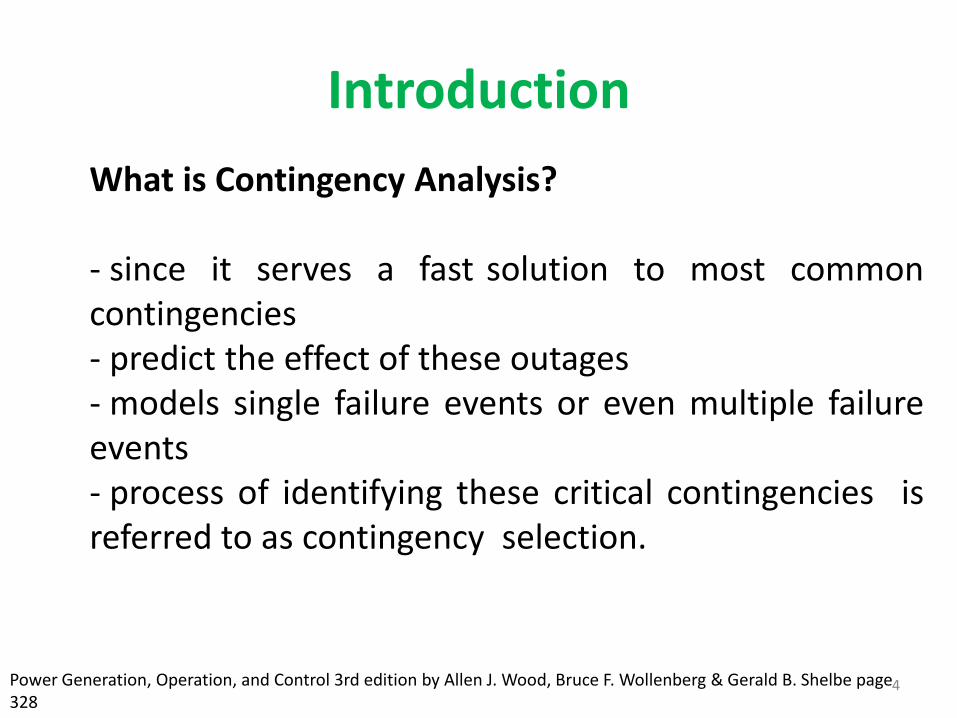
What is Contingency Analysis? - since it serves a fast solution to most common contingencies - predict the effect of these outages - models single failure events or even multiple failure events - process of identifying these critical contingencies is referred to as contingency selection.
Power Generation, Operation, and Control 3rd edition by Allen J. Wood, Bruce F. Wollenberg & Gerald B. Shelbe page 328
Problem Statement
5
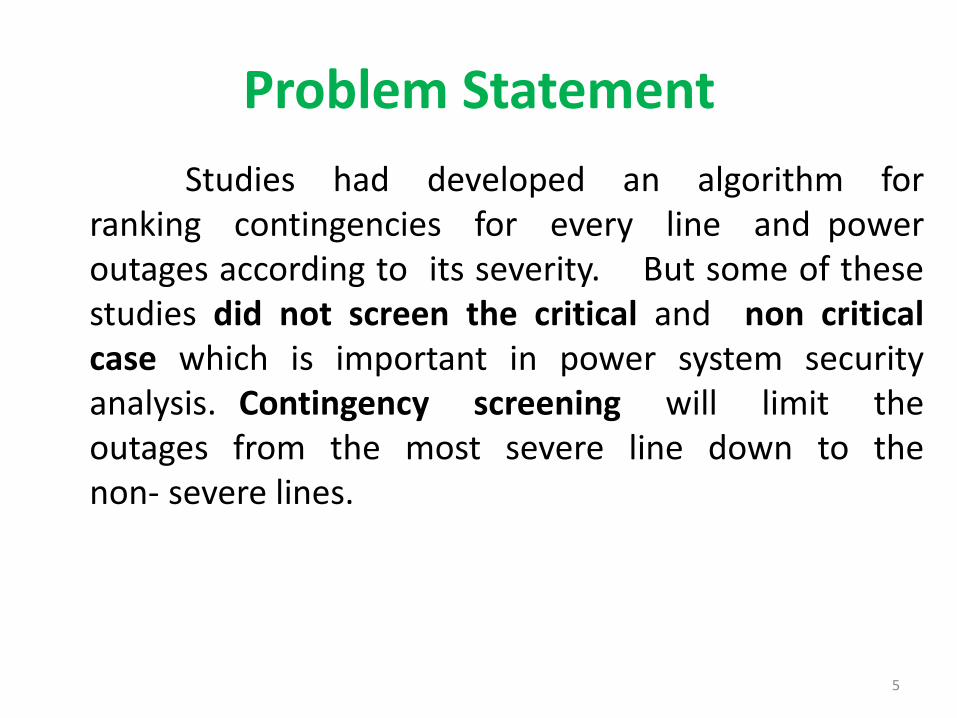
Studies had developed an algorithm for ranking contingencies for every line and power outages according to its severity. But some of these studies did not screen the critical and non critical case which is important in power system security analysis. Contingency screening will limit the outages from the most severe line down to the non- severe lines.
Objectives
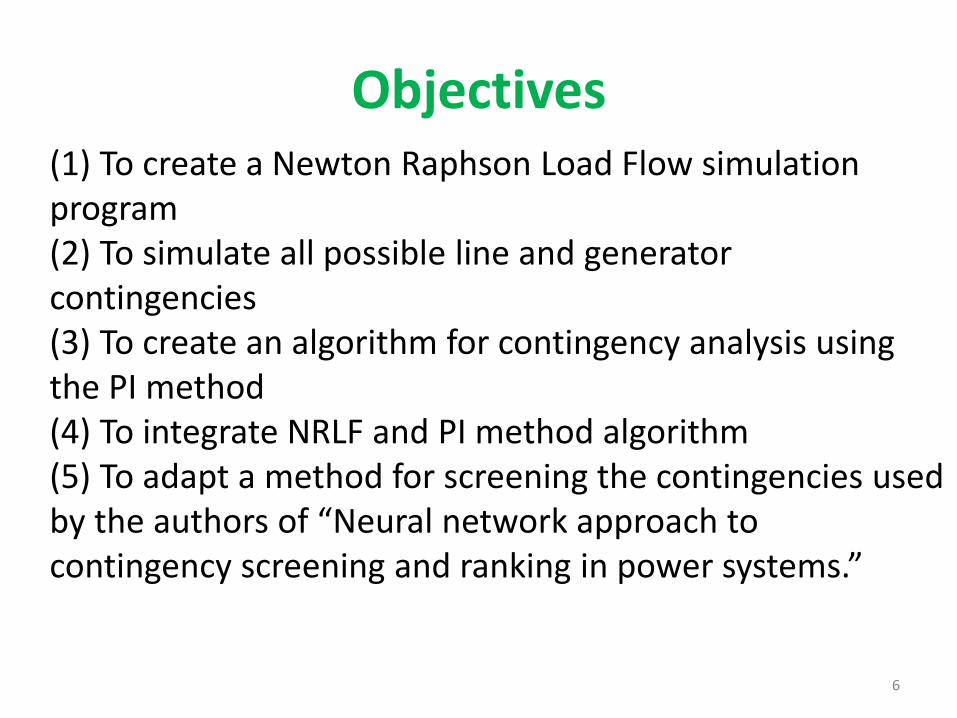
6
(1) To create a Newton Raphson Load Flow simulation program (2) To simulate all possible line and generator contingencies (3) To create an algorithm for contingency analysis using the PI method (4) To integrate NRLF and PI method algorithm (5) To adapt a method for screening the contingencies used by the authors of “Neural network approach to contingency screening and ranking in power systems.”
Performance Indices (PI)
7
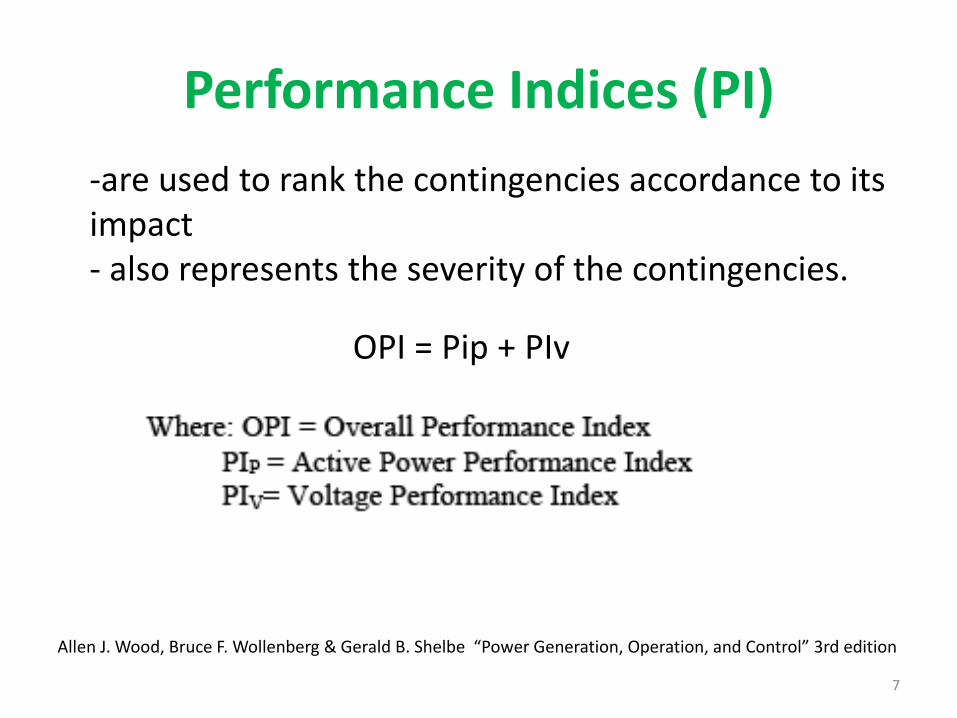
-are used to rank the contingencies accordance to its impact - also represents the severity of the contingencies.
Allen J. Wood, Bruce F. Wollenberg & Gerald B. Shelbe “Power Generation, Operation, and Control” 3rd edition
OPI = Pip + PIv
Performance Indices (PI)
8
C. I. Faustino Agreira, J. A. Dias Pinto, “Contingency Screening and Ranking Algorithm Using Two Different Sets of Security Performance Indices”. 2003 IEEE Bologna PowerTech Conference, June 23-26, Bologna, Italy
Performance Indices (PI)
9
C. I. Faustino Agreira, J. A. Dias Pinto, “Contingency Screening and Ranking Algorithm Using Two Different Sets of Security Performance Indices”. 2003 IEEE Bologna PowerTech Conference, June 23-26, Bologna, Italy
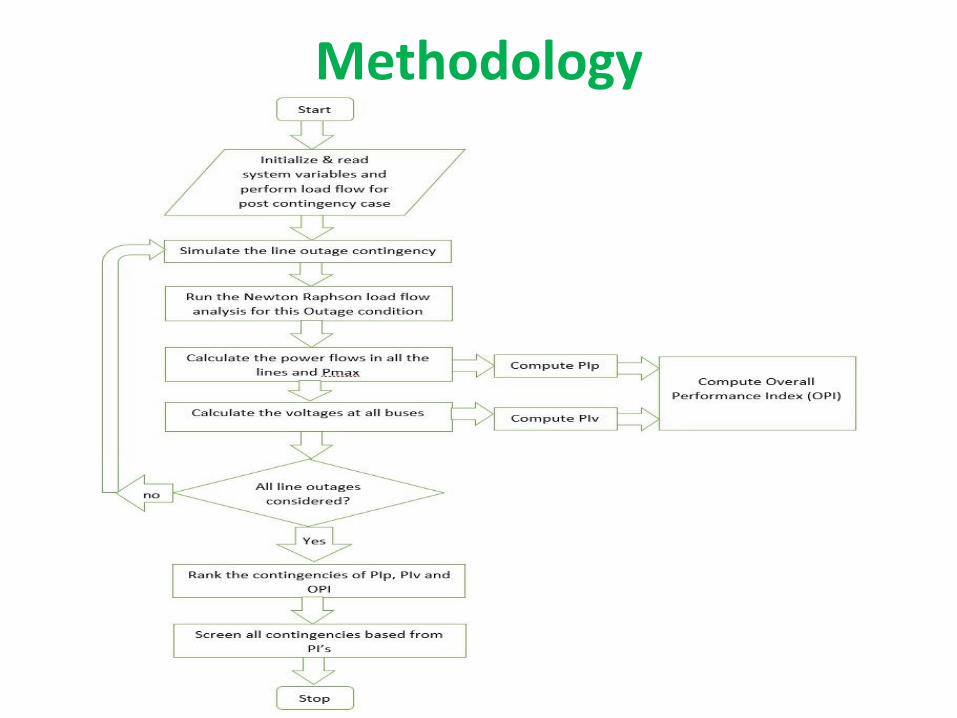
Methodology
10
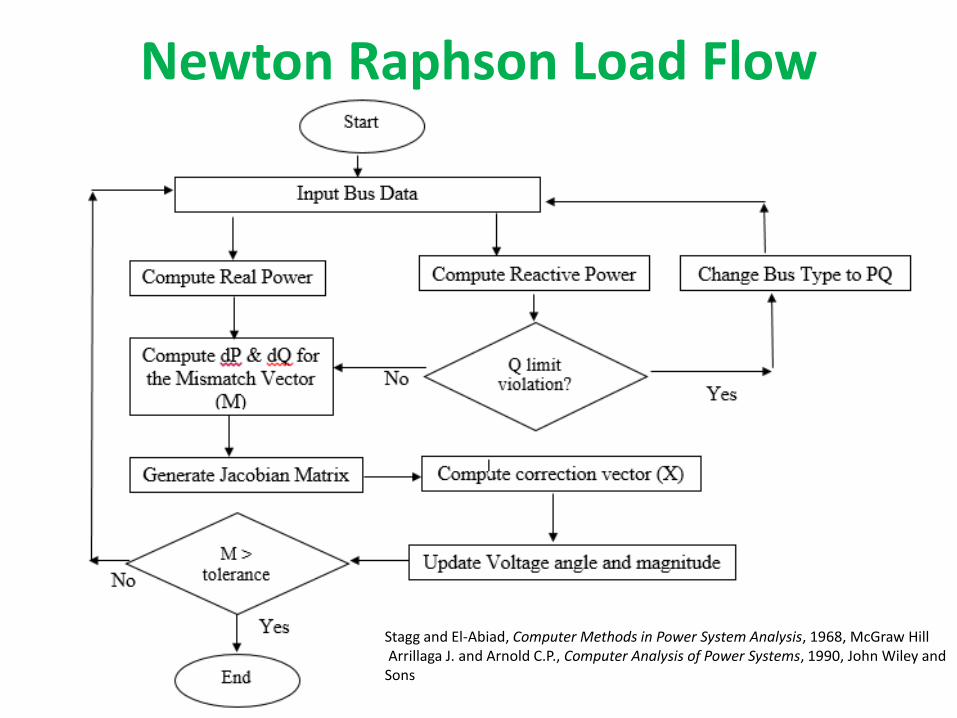
Newton Raphson Load Flow
11
Stagg and El-Abiad, Computer Methods in Power System Analysis, 1968, McGraw Hill Arrillaga J. and Arnold C.P., Computer Analysis of Power Systems, 1990, John Wiley and Sons
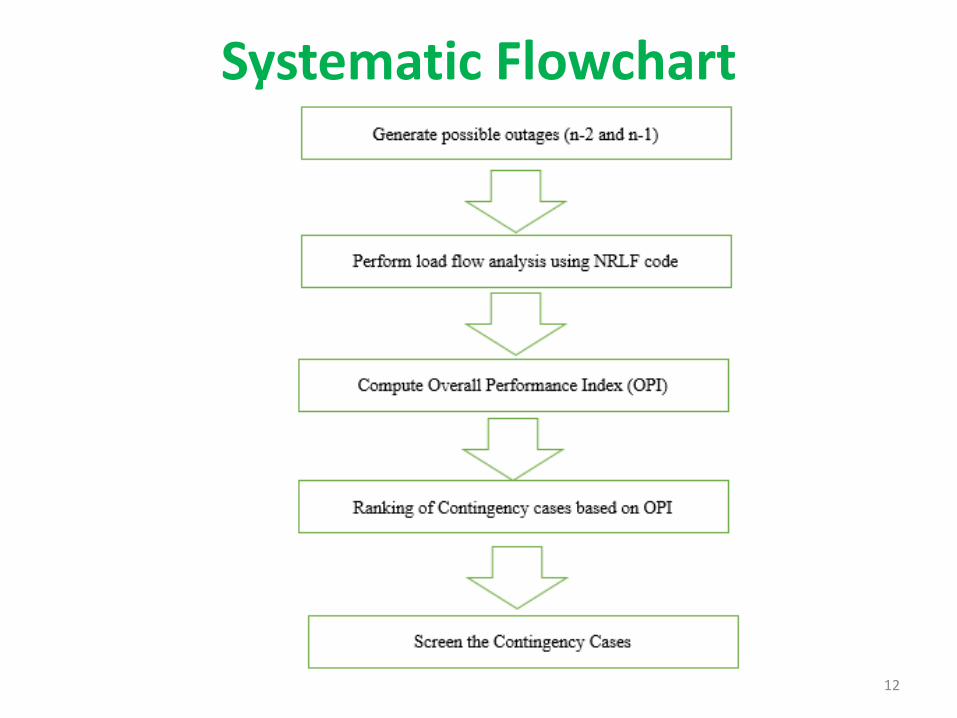
Systematic Flowchart
12
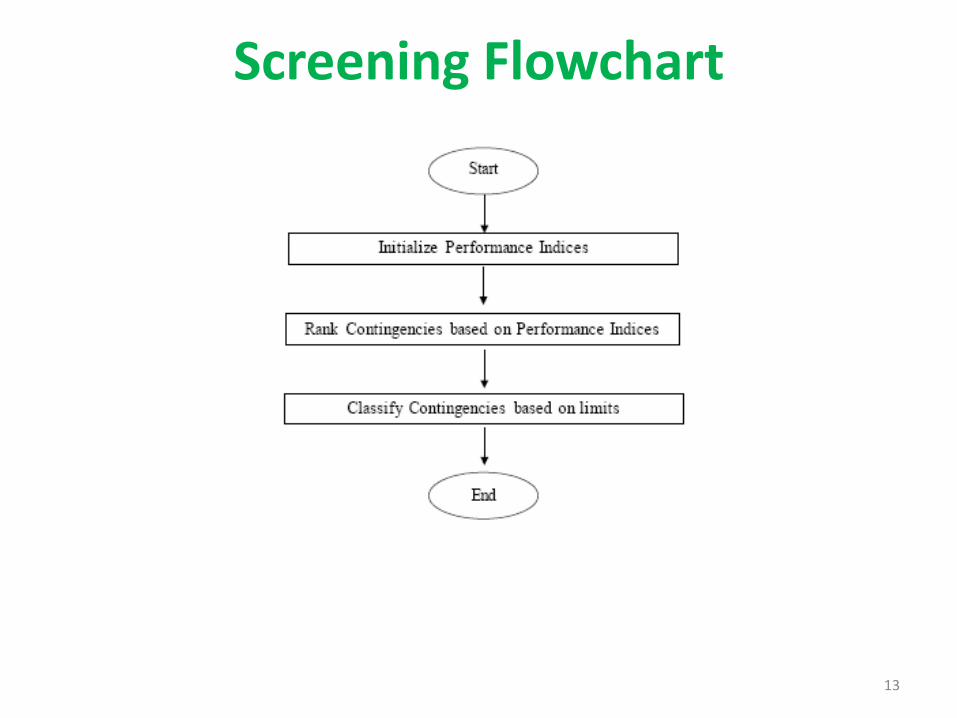
Screening Flowchart
13
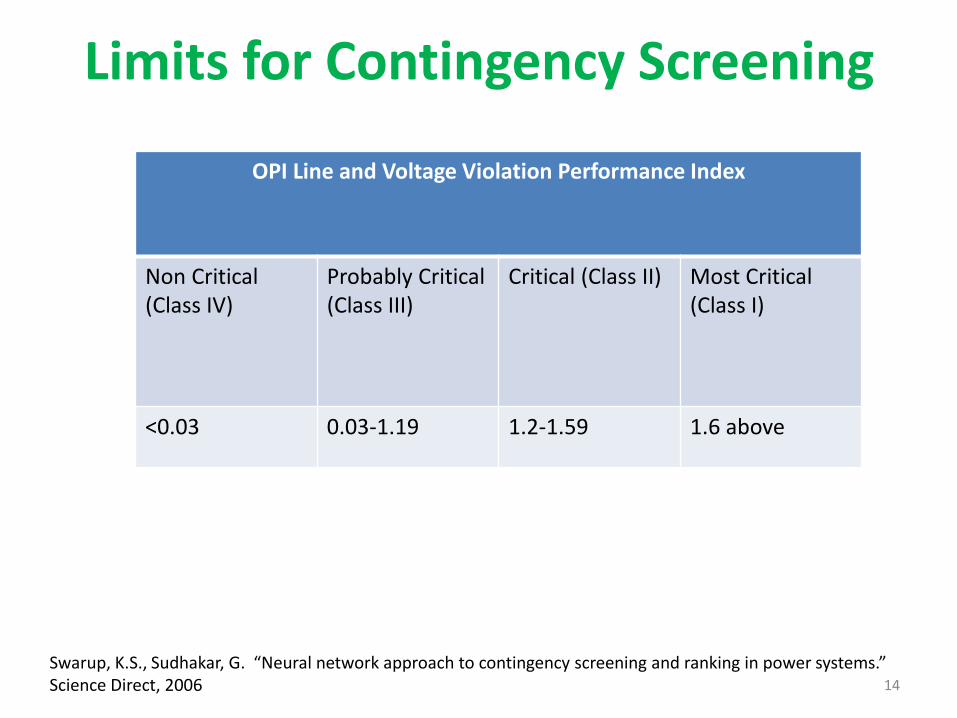
Limits for Contingency Screening
14
OPI Line and Voltage Violation Performance Index
Non Critical (Class IV)
Probably Critical (Class III)
Critical (Class II) Most Critical (Class I)
<0.03 0.03-1.19 1.2-1.59 1.6 above
Swarup, K.S., Sudhakar, G. “Neural network approach to contingency screening and ranking in power systems.” Science Direct, 2006
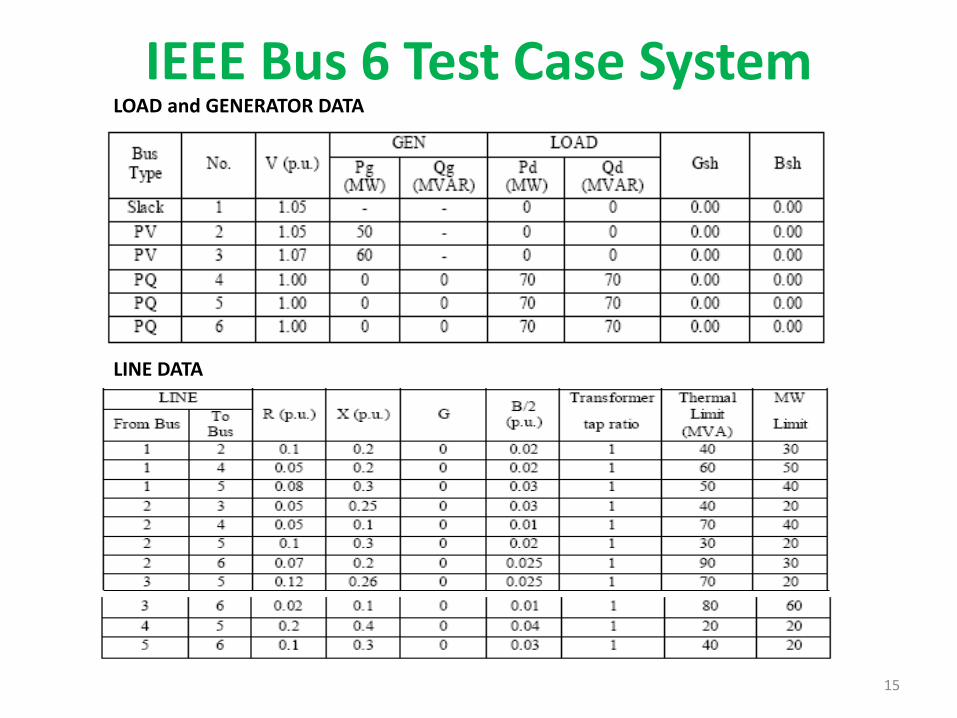
IEEE Bus 6 Test Case System
15
LOAD and GENERATOR DATA
LINE DATA
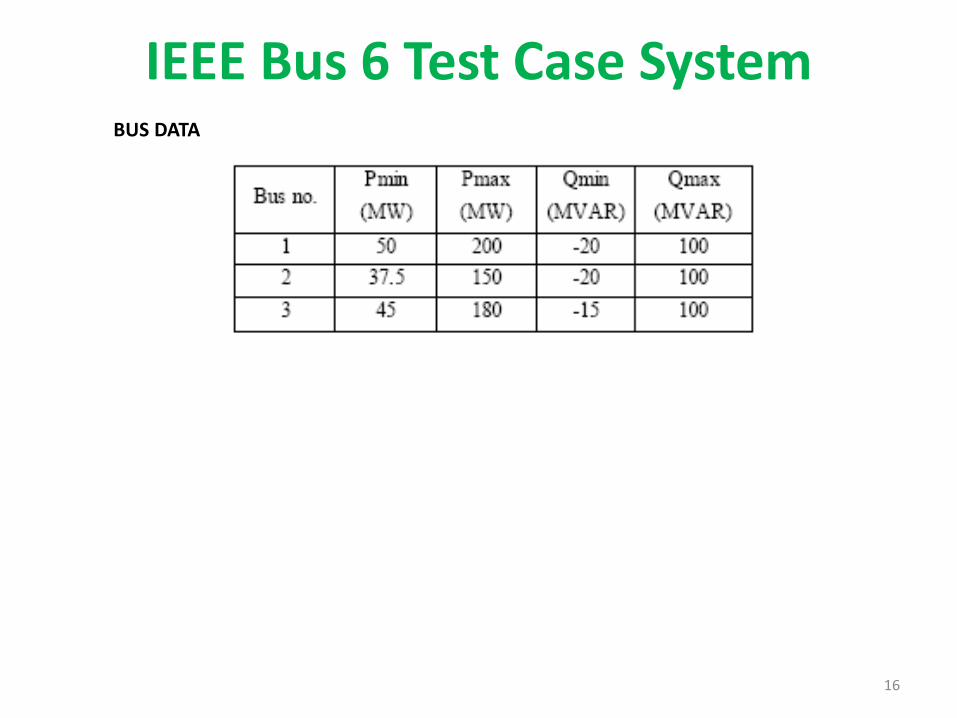
IEEE Bus 6 Test Case System
16
BUS DATA
IEEE Bus 6 Test Case System
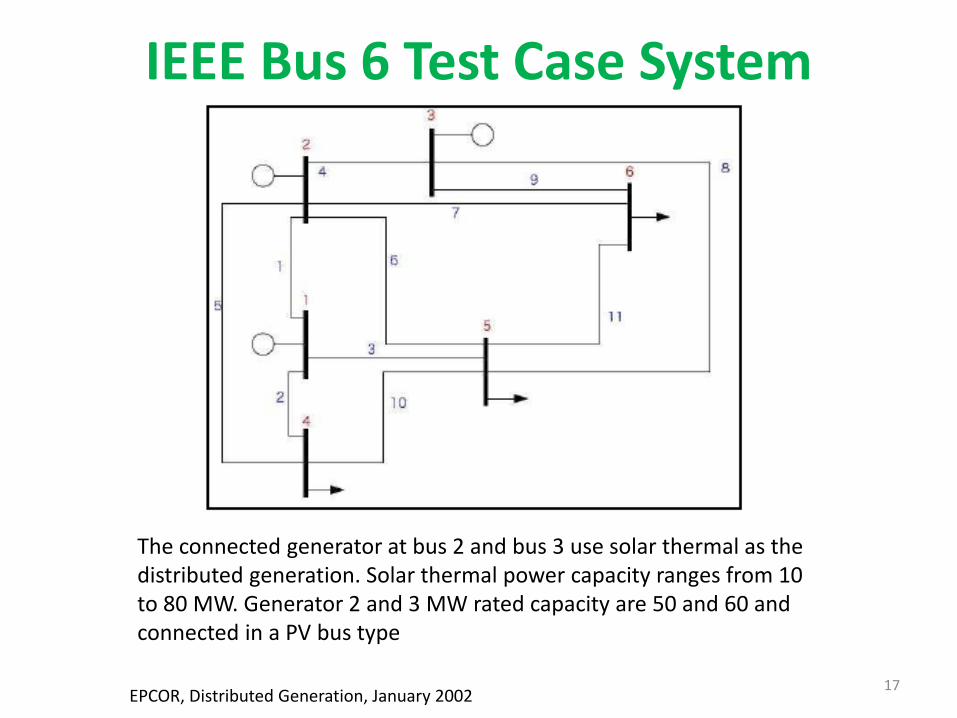
17
The connected generator at bus 2 and bus 3 use solar thermal as the distributed generation. Solar thermal power capacity ranges from 10 to 80 MW. Generator 2 and 3 MW rated capacity are 50 and 60 and connected in a PV bus type
EPCOR, Distributed Generation, January 2002
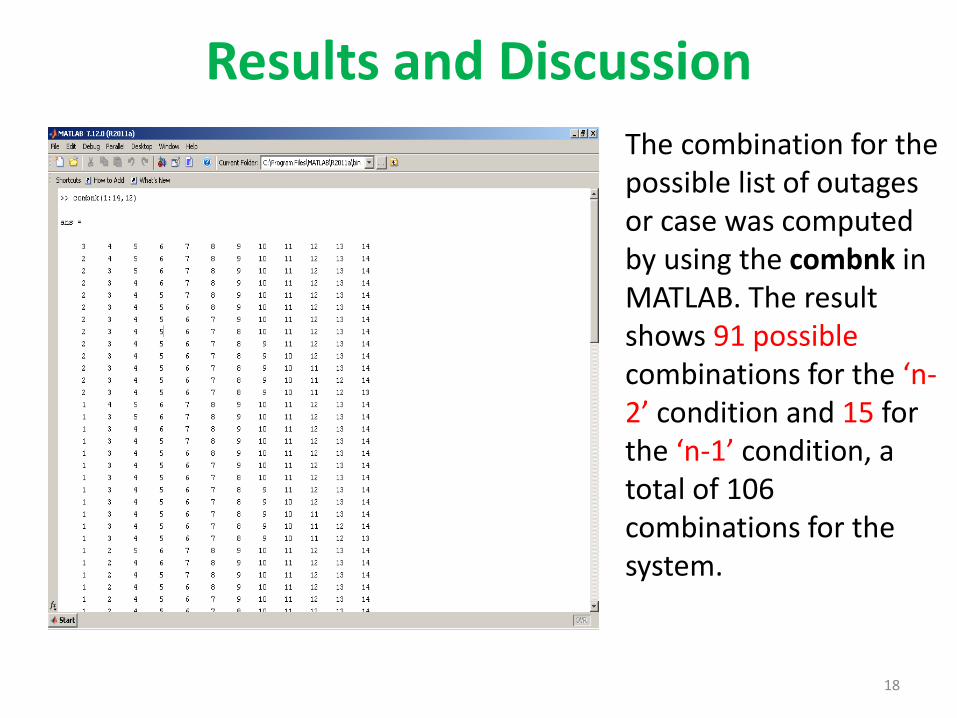
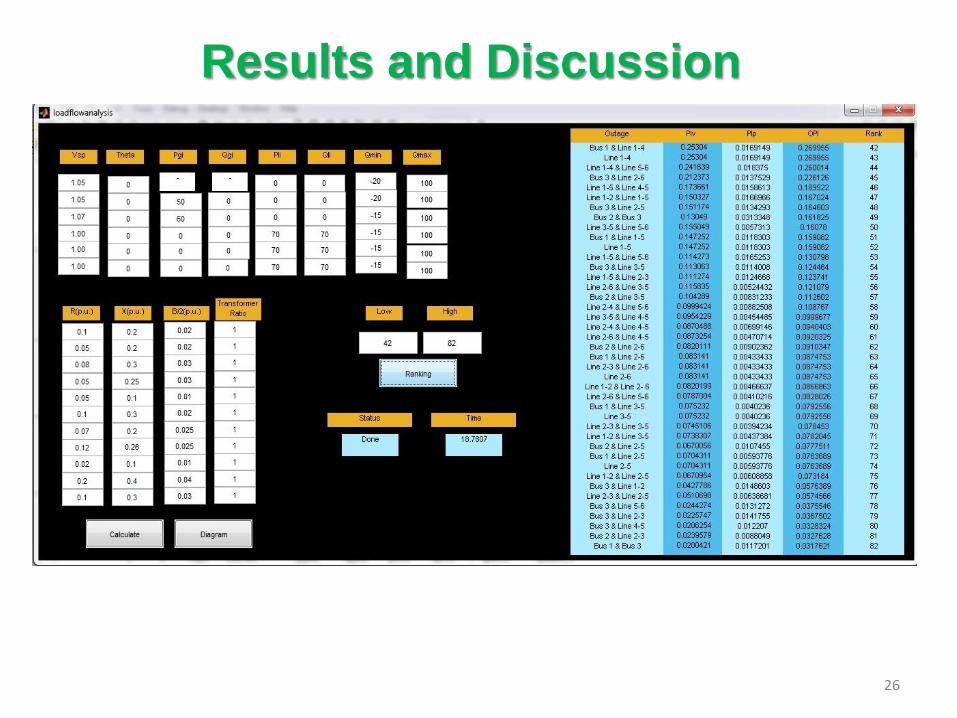
Results and Discussion
18
The combination for the possible list of outages or case was computed by using the combnk in MATLAB. The result shows 91 possible combinations for the ‘n-2’ condition and 15 for the ‘n-1’ condition, a total of 106 combinations for the system.
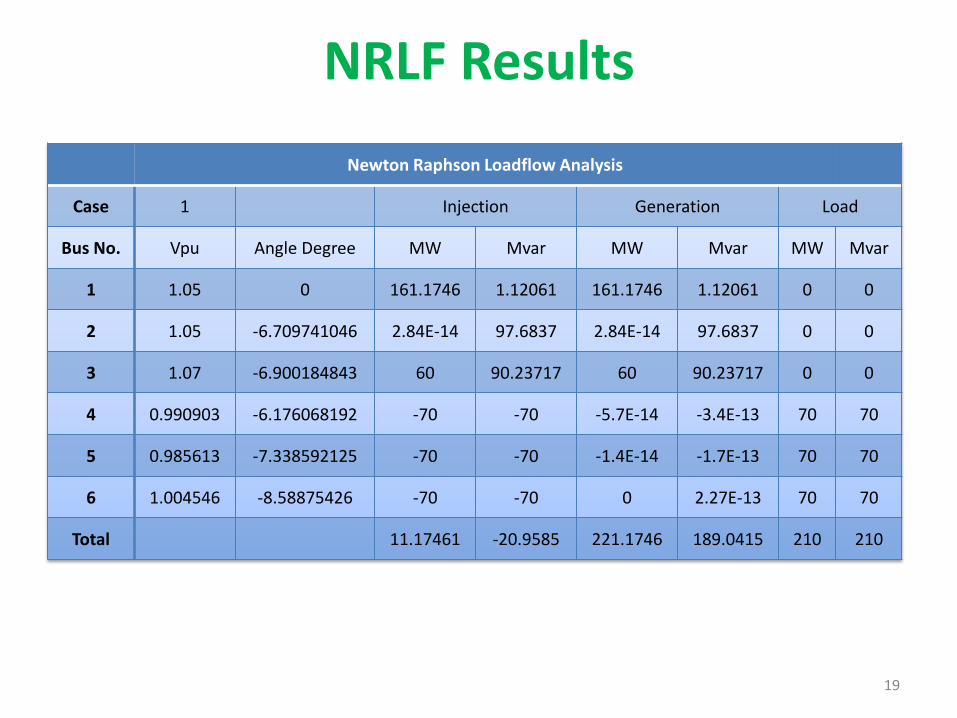
NRLF Results
19
Newton Raphson Loadflow Analysis
Case 1 Injection Generation Load
Bus No. Vpu Angle Degree MW Mvar MW Mvar MW Mvar
1 1.05 0 161.1746 1.12061 161.1746 1.12061 0 0
2 1.05 -6.709741046 2.84E-14 97.6837 2.84E-14 97.6837 0 0
3 1.07 -6.900184843 60 90.23717 60 90.23717 0 0
4 0.990903 -6.176068192 -70 -70 -5.7E-14 -3.4E-13 70 70
5 0.985613 -7.338592125 -70 -70 -1.4E-14 -1.7E-13 70 70
6 1.004546 -8.58875426 -70 -70 0 2.27E-13 70 70
Total 11.17461 -20.9585 221.1746 189.0415 210 210
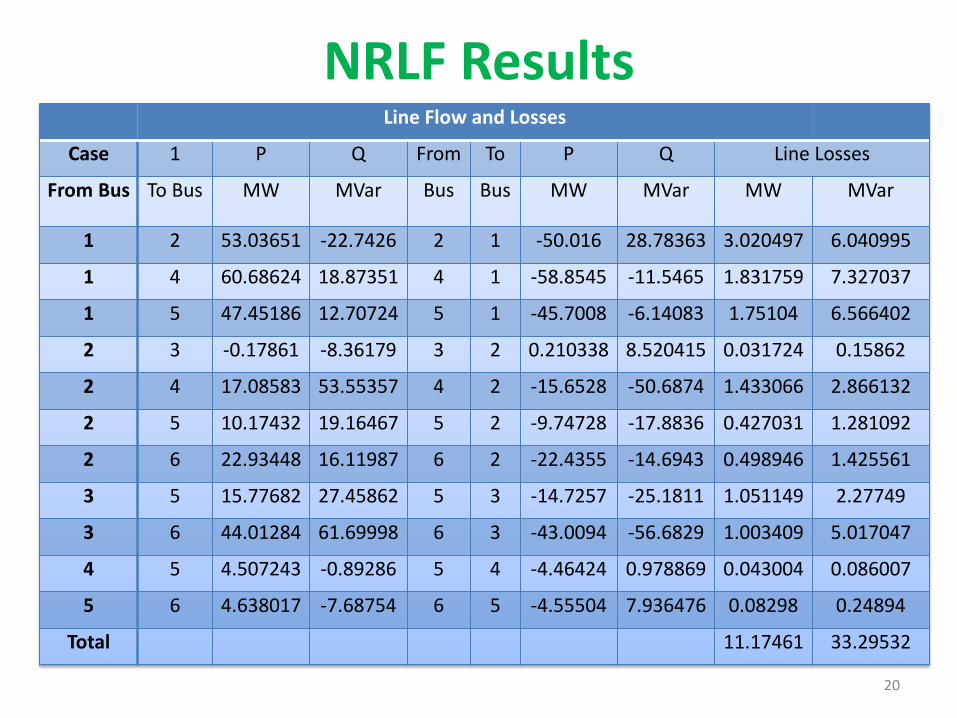
NRLF Results
20
Line Flow and Losses
Case 1 P Q From To P Q Line Losses
From Bus To Bus MW MVar Bus Bus MW MVar MW MVar
1 2 53.03651 -22.7426 2 1 -50.016 28.78363 3.020497 6.040995
1 4 60.68624 18.87351 4 1 -58.8545 -11.5465 1.831759 7.327037
1 5 47.45186 12.70724 5 1 -45.7008 -6.14083 1.75104 6.566402
2 3 -0.17861 -8.36179 3 2 0.210338 8.520415 0.031724 0.15862
2 4 17.08583 53.55357 4 2 -15.6528 -50.6874 1.433066 2.866132
2 5 10.17432 19.16467 5 2 -9.74728 -17.8836 0.427031 1.281092
2 6 22.93448 16.11987 6 2 -22.4355 -14.6943 0.498946 1.425561
3 5 15.77682 27.45862 5 3 -14.7257 -25.1811 1.051149 2.27749
3 6 44.01284 61.69998 6 3 -43.0094 -56.6829 1.003409 5.017047
4 5 4.507243 -0.89286 5 4 -4.46424 0.978869 0.043004 0.086007
5 6 4.638017 -7.68754 6 5 -4.55504 7.936476 0.08298 0.24894
Total 11.17461 33.29532
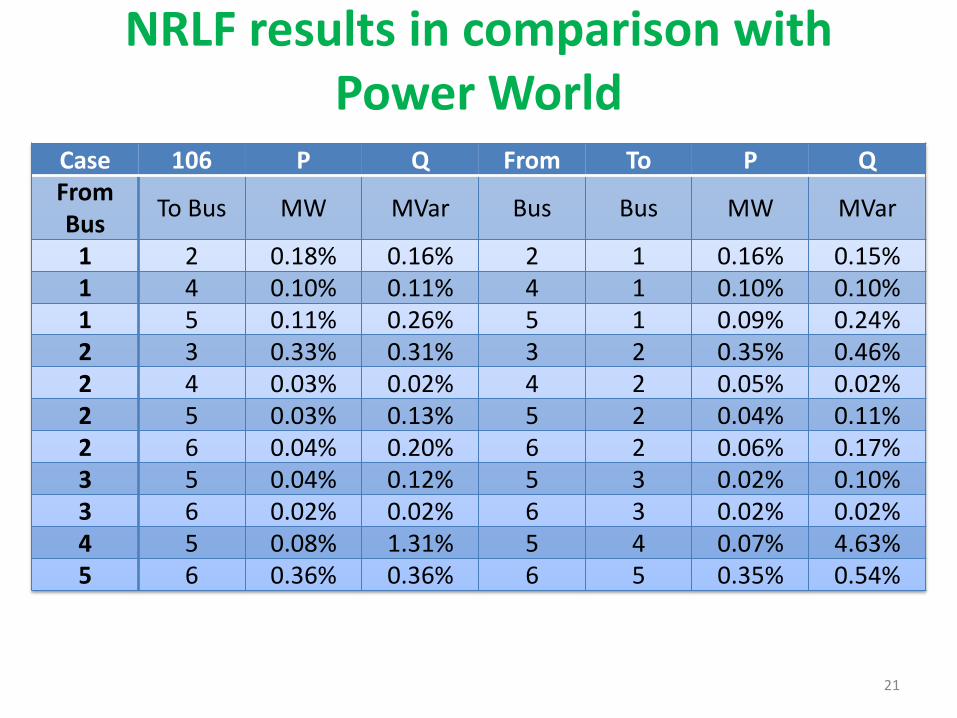
NRLF results in comparison with Power World
21
Case 106 P Q From To P Q
From Bus
To Bus MW MVar Bus Bus MW MVar
1 2 0.18% 0.16% 2 1 0.16% 0.15%
1 4 0.10% 0.11% 4 1 0.10% 0.10%
1 5 0.11% 0.26% 5 1 0.09% 0.24%
2 3 0.33% 0.31% 3 2 0.35% 0.46%
2 4 0.03% 0.02% 4 2 0.05% 0.02%
2 5 0.03% 0.13% 5 2 0.04% 0.11%
2 6 0.04% 0.20% 6 2 0.06% 0.17%
3 5 0.04% 0.12% 5 3 0.02% 0.10%
3 6 0.02% 0.02% 6 3 0.02% 0.02%
4 5 0.08% 1.31% 5 4 0.07% 4.63%
5 6 0.36% 0.36% 6 5 0.35% 0.54%
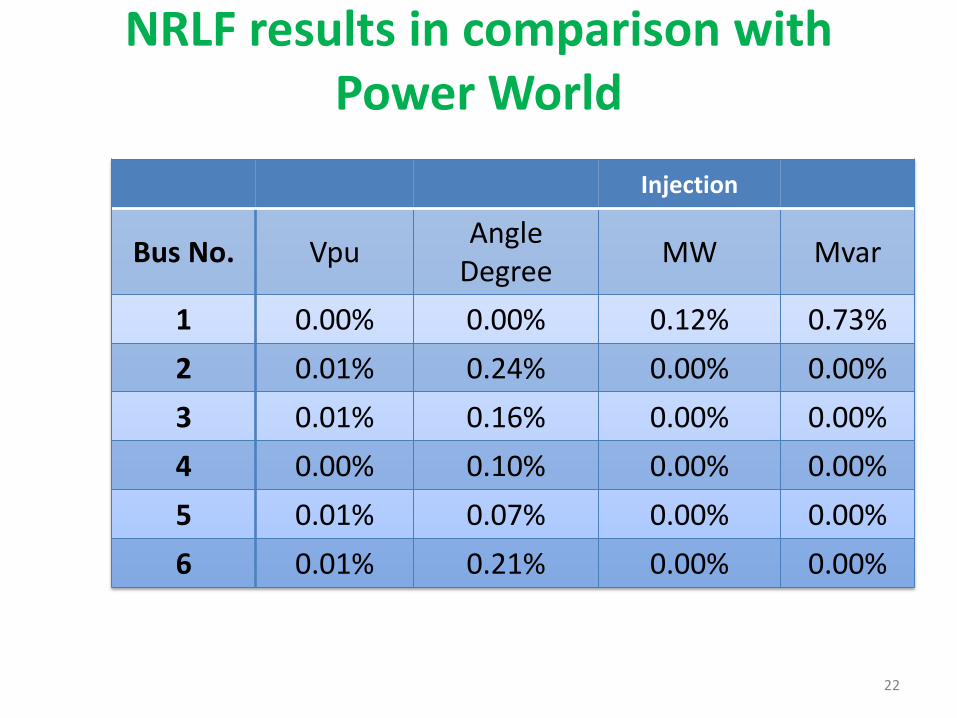
NRLF results in comparison with Power World
22
Injection
Bus No. Vpu Angle
Degree MW Mvar
1 0.00% 0.00% 0.12% 0.73%
2 0.01% 0.24% 0.00% 0.00%
3 0.01% 0.16% 0.00% 0.00%
4 0.00% 0.10% 0.00% 0.00%
5 0.01% 0.07% 0.00% 0.00%
6 0.01% 0.21% 0.00% 0.00%
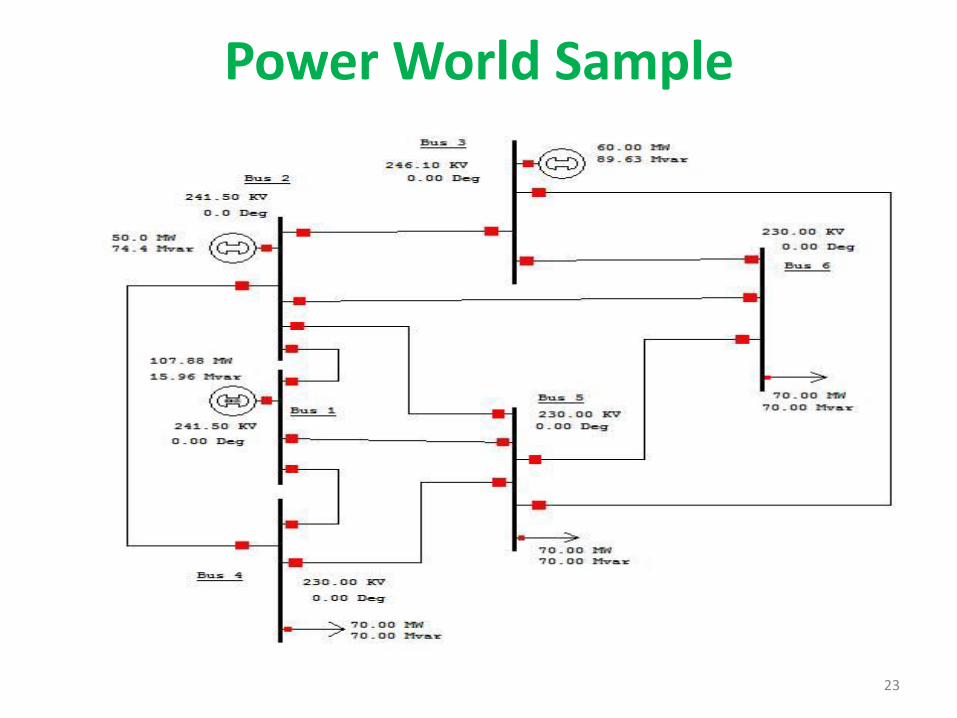
Power World Sample
23
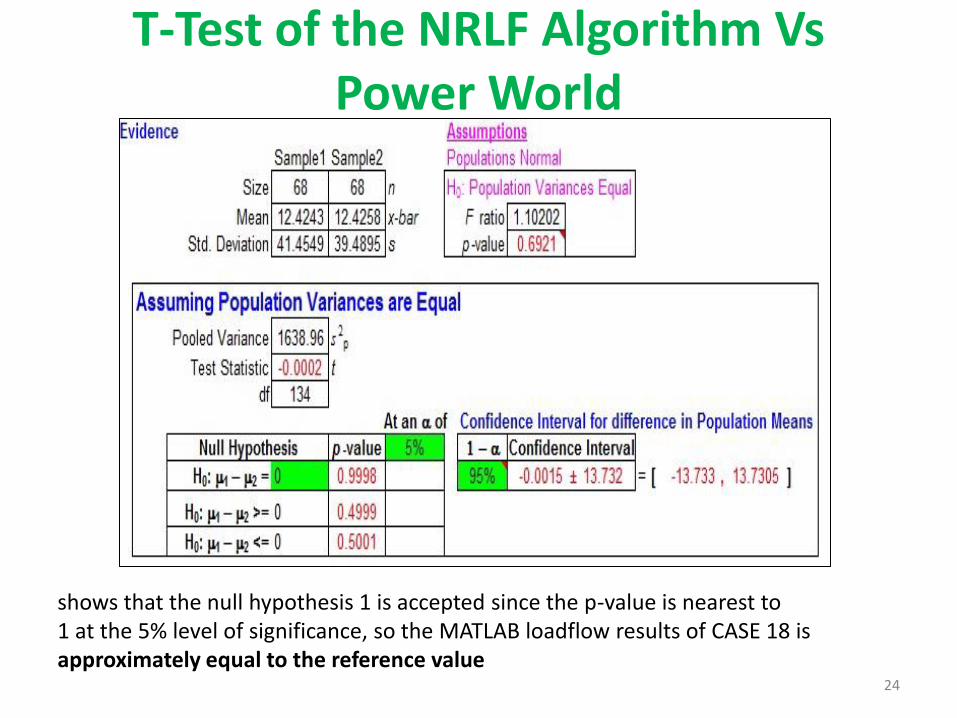
T-Test of the NRLF Algorithm Vs Power World
24
shows that the null hypothesis 1 is accepted since the p-value is nearest to 1 at the 5% level of significance, so the MATLAB loadflow results of CASE 18 is approximately equal to the reference value
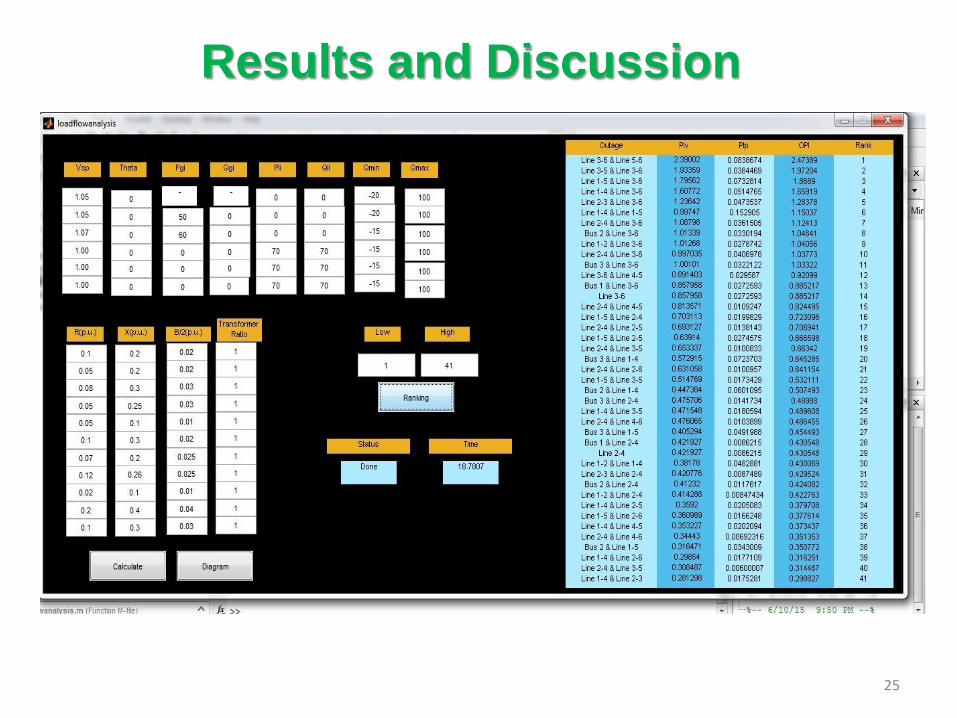
Results and Discussion
25
Results and Discussion
26
Results and Discussion
27
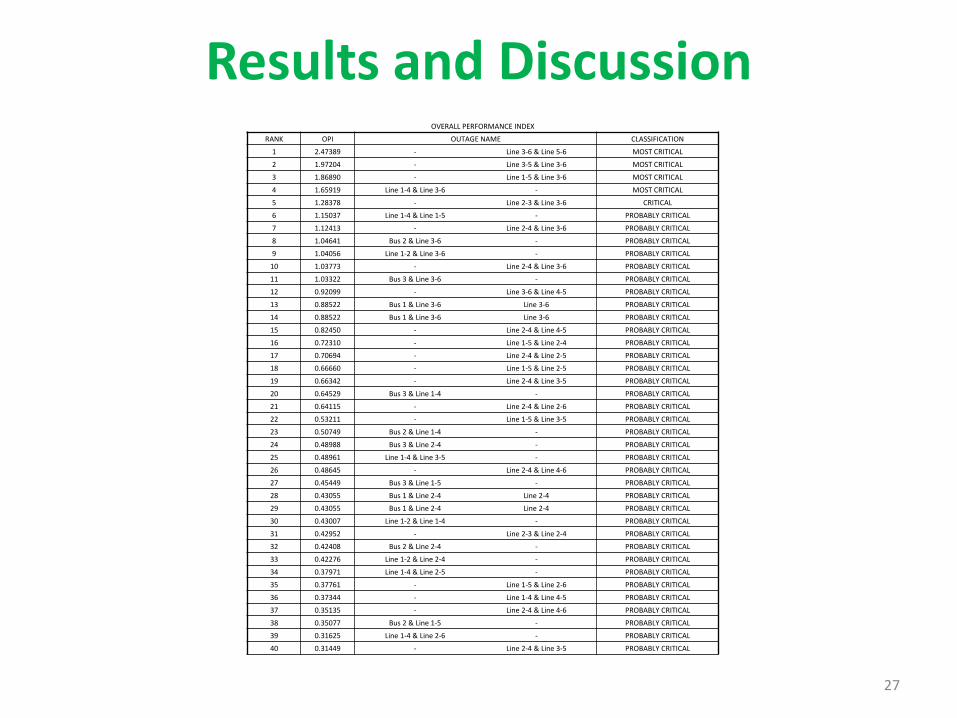
OVERALL PERFORMANCE INDEX
RANK OPI OUTAGE NAME CLASSIFICATION
1 2.47389 - Line 3-6 & Line 5-6 MOST CRITICAL
2 1.97204 - Line 3-5 & Line 3-6 MOST CRITICAL
3 1.86890 - Line 1-5 & Line 3-6 MOST CRITICAL
4 1.65919 Line 1-4 & Line 3-6 - MOST CRITICAL
5 1.28378 - Line 2-3 & Line 3-6 CRITICAL
6 1.15037 Line 1-4 & Line 1-5 - PROBABLY CRITICAL
7 1.12413 - Line 2-4 & Line 3-6 PROBABLY CRITICAL
8 1.04641 Bus 2 & Line 3-6 - PROBABLY CRITICAL
9 1.04056 Line 1-2 & Line 3-6 - PROBABLY CRITICAL
10 1.03773 - Line 2-4 & Line 3-6 PROBABLY CRITICAL
11 1.03322 Bus 3 & Line 3-6 - PROBABLY CRITICAL
12 0.92099 - Line 3-6 & Line 4-5 PROBABLY CRITICAL
13 0.88522 Bus 1 & Line 3-6 Line 3-6 PROBABLY CRITICAL
14 0.88522 Bus 1 & Line 3-6 Line 3-6 PROBABLY CRITICAL
15 0.82450 - Line 2-4 & Line 4-5 PROBABLY CRITICAL
16 0.72310 - Line 1-5 & Line 2-4 PROBABLY CRITICAL
17 0.70694 - Line 2-4 & Line 2-5 PROBABLY CRITICAL
18 0.66660 - Line 1-5 & Line 2-5 PROBABLY CRITICAL
19 0.66342 - Line 2-4 & Line 3-5 PROBABLY CRITICAL
20 0.64529 Bus 3 & Line 1-4 - PROBABLY CRITICAL
21 0.64115 - Line 2-4 & Line 2-6 PROBABLY CRITICAL
22 0.53211 - Line 1-5 & Line 3-5 PROBABLY CRITICAL
23 0.50749 Bus 2 & Line 1-4 - PROBABLY CRITICAL
24 0.48988 Bus 3 & Line 2-4 - PROBABLY CRITICAL
25 0.48961 Line 1-4 & Line 3-5 - PROBABLY CRITICAL
26 0.48645 - Line 2-4 & Line 4-6 PROBABLY CRITICAL
27 0.45449 Bus 3 & Line 1-5 - PROBABLY CRITICAL
28 0.43055 Bus 1 & Line 2-4 Line 2-4 PROBABLY CRITICAL
29 0.43055 Bus 1 & Line 2-4 Line 2-4 PROBABLY CRITICAL
30 0.43007 Line 1-2 & Line 1-4 - PROBABLY CRITICAL
31 0.42952 - Line 2-3 & Line 2-4 PROBABLY CRITICAL
32 0.42408 Bus 2 & Line 2-4 - PROBABLY CRITICAL
33 0.42276 Line 1-2 & Line 2-4 - PROBABLY CRITICAL
34 0.37971 Line 1-4 & Line 2-5 - PROBABLY CRITICAL
35 0.37761 - Line 1-5 & Line 2-6 PROBABLY CRITICAL
36 0.37344 - Line 1-4 & Line 4-5 PROBABLY CRITICAL
37 0.35135 - Line 2-4 & Line 4-6 PROBABLY CRITICAL
38 0.35077 Bus 2 & Line 1-5 - PROBABLY CRITICAL
39 0.31625 Line 1-4 & Line 2-6 - PROBABLY CRITICAL
40 0.31449 - Line 2-4 & Line 3-5 PROBABLY CRITICAL
Results and Discussion
28
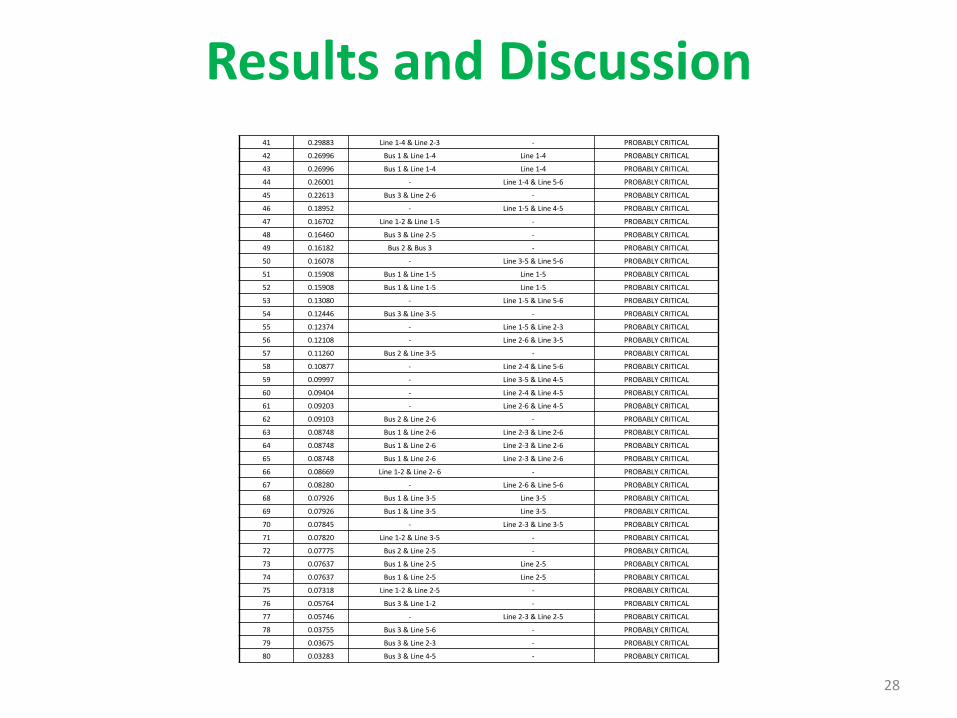
41 0.29883 Line 1-4 & Line 2-3 - PROBABLY CRITICAL
42 0.26996 Bus 1 & Line 1-4 Line 1-4 PROBABLY CRITICAL
43 0.26996 Bus 1 & Line 1-4 Line 1-4 PROBABLY CRITICAL
44 0.26001 - Line 1-4 & Line 5-6 PROBABLY CRITICAL
45 0.22613 Bus 3 & Line 2-6 - PROBABLY CRITICAL
46 0.18952 - Line 1-5 & Line 4-5 PROBABLY CRITICAL
47 0.16702 Line 1-2 & Line 1-5 - PROBABLY CRITICAL
48 0.16460 Bus 3 & Line 2-5 - PROBABLY CRITICAL
49 0.16182 Bus 2 & Bus 3 - PROBABLY CRITICAL
50 0.16078 - Line 3-5 & Line 5-6 PROBABLY CRITICAL
51 0.15908 Bus 1 & Line 1-5 Line 1-5 PROBABLY CRITICAL
52 0.15908 Bus 1 & Line 1-5 Line 1-5 PROBABLY CRITICAL
53 0.13080 - Line 1-5 & Line 5-6 PROBABLY CRITICAL
54 0.12446 Bus 3 & Line 3-5 - PROBABLY CRITICAL
55 0.12374 - Line 1-5 & Line 2-3 PROBABLY CRITICAL
56 0.12108 - Line 2-6 & Line 3-5 PROBABLY CRITICAL
57 0.11260 Bus 2 & Line 3-5 - PROBABLY CRITICAL
58 0.10877 - Line 2-4 & Line 5-6 PROBABLY CRITICAL
59 0.09997 - Line 3-5 & Line 4-5 PROBABLY CRITICAL
60 0.09404 - Line 2-4 & Line 4-5 PROBABLY CRITICAL
61 0.09203 - Line 2-6 & Line 4-5 PROBABLY CRITICAL
62 0.09103 Bus 2 & Line 2-6 - PROBABLY CRITICAL
63 0.08748 Bus 1 & Line 2-6 Line 2-3 & Line 2-6 PROBABLY CRITICAL
64 0.08748 Bus 1 & Line 2-6 Line 2-3 & Line 2-6 PROBABLY CRITICAL
65 0.08748 Bus 1 & Line 2-6 Line 2-3 & Line 2-6 PROBABLY CRITICAL
66 0.08669 Line 1-2 & Line 2- 6 - PROBABLY CRITICAL
67 0.08280 - Line 2-6 & Line 5-6 PROBABLY CRITICAL
68 0.07926 Bus 1 & Line 3-5 Line 3-5 PROBABLY CRITICAL
69 0.07926 Bus 1 & Line 3-5 Line 3-5 PROBABLY CRITICAL
70 0.07845 - Line 2-3 & Line 3-5 PROBABLY CRITICAL
71 0.07820 Line 1-2 & Line 3-5 - PROBABLY CRITICAL
72 0.07775 Bus 2 & Line 2-5 - PROBABLY CRITICAL
73 0.07637 Bus 1 & Line 2-5 Line 2-5 PROBABLY CRITICAL
74 0.07637 Bus 1 & Line 2-5 Line 2-5 PROBABLY CRITICAL
75 0.07318 Line 1-2 & Line 2-5 - PROBABLY CRITICAL
76 0.05764 Bus 3 & Line 1-2 - PROBABLY CRITICAL
77 0.05746 - Line 2-3 & Line 2-5 PROBABLY CRITICAL
78 0.03755 Bus 3 & Line 5-6 - PROBABLY CRITICAL
79 0.03675 Bus 3 & Line 2-3 - PROBABLY CRITICAL
80 0.03283 Bus 3 & Line 4-5 - PROBABLY CRITICAL
Results and Discussion
29
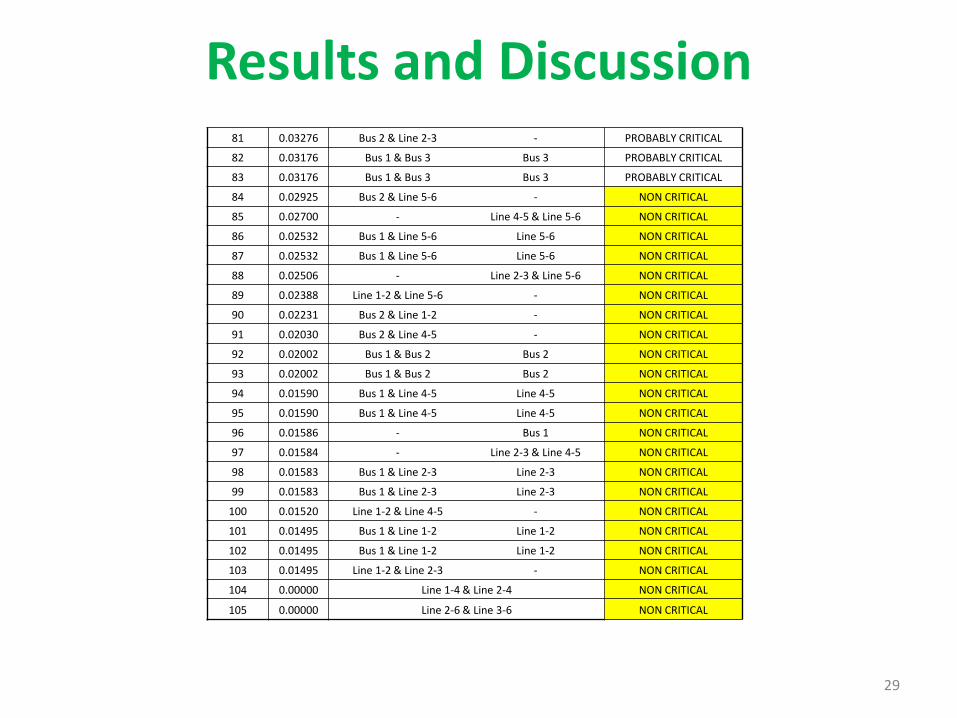
81 0.03276 Bus 2 & Line 2-3 - PROBABLY CRITICAL
82 0.03176 Bus 1 & Bus 3 Bus 3 PROBABLY CRITICAL
83 0.03176 Bus 1 & Bus 3 Bus 3 PROBABLY CRITICAL
84 0.02925 Bus 2 & Line 5-6 - NON CRITICAL
85 0.02700 - Line 4-5 & Line 5-6 NON CRITICAL
86 0.02532 Bus 1 & Line 5-6 Line 5-6 NON CRITICAL
87 0.02532 Bus 1 & Line 5-6 Line 5-6 NON CRITICAL
88 0.02506 - Line 2-3 & Line 5-6 NON CRITICAL
89 0.02388 Line 1-2 & Line 5-6 - NON CRITICAL
90 0.02231 Bus 2 & Line 1-2 - NON CRITICAL
91 0.02030 Bus 2 & Line 4-5 - NON CRITICAL
92 0.02002 Bus 1 & Bus 2 Bus 2 NON CRITICAL
93 0.02002 Bus 1 & Bus 2 Bus 2 NON CRITICAL
94 0.01590 Bus 1 & Line 4-5 Line 4-5 NON CRITICAL
95 0.01590 Bus 1 & Line 4-5 Line 4-5 NON CRITICAL
96 0.01586 - Bus 1 NON CRITICAL
97 0.01584 - Line 2-3 & Line 4-5 NON CRITICAL
98 0.01583 Bus 1 & Line 2-3 Line 2-3 NON CRITICAL
99 0.01583 Bus 1 & Line 2-3 Line 2-3 NON CRITICAL
100 0.01520 Line 1-2 & Line 4-5 - NON CRITICAL
101 0.01495 Bus 1 & Line 1-2 Line 1-2 NON CRITICAL
102 0.01495 Bus 1 & Line 1-2 Line 1-2 NON CRITICAL
103 0.01495 Line 1-2 & Line 2-3 - NON CRITICAL
104 0.00000 Line 1-4 & Line 2-4 NON CRITICAL
105 0.00000 Line 2-6 & Line 3-6 NON CRITICAL
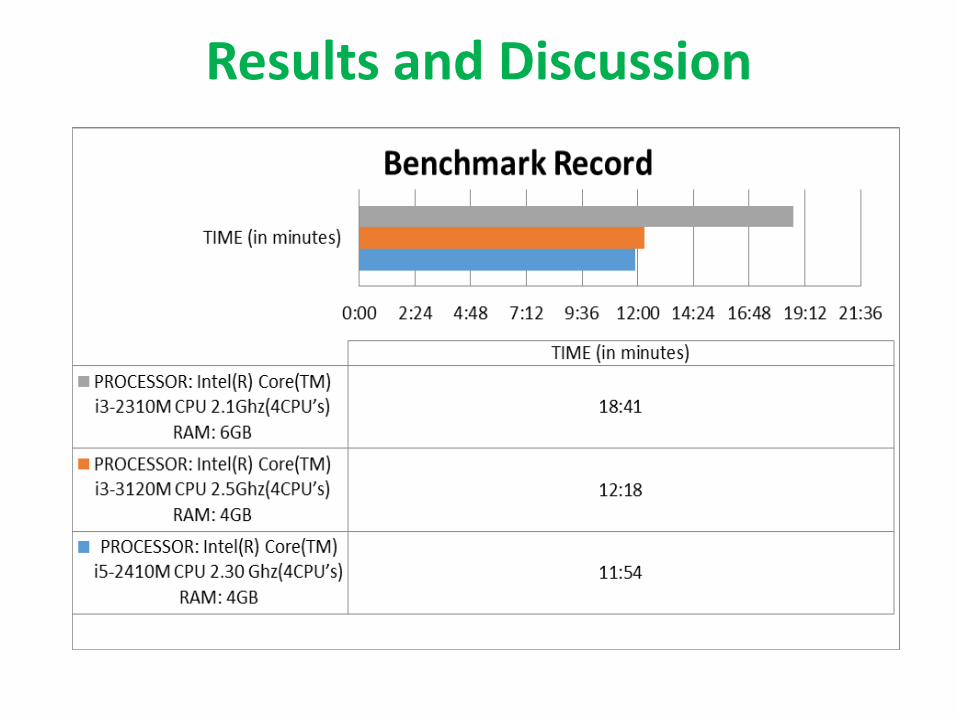
Benchmark Record
Results and Discussion
Benchmark Record
Conclusions
Objective (1) To create a Newton Raphson Load Flow simulation program NRLF section takes longer execution times, but the algorithm shows accurate results via comparison on Power World.
Benchmark Record
Conclusions
Objective (2) To simulate all possible line and generator contingencies -Simulation of all the possible line and generator contingencies were done. Using the combination command in MATLAB for finding the n-2 and n-1 cases, all of the possible combination of outages were found. - Combination of outages is dependent to the number of the slack bus, PV bus and the lines. - For the IEEE 6-bus system, with n=14 (Slack Bus=1, PV bus=2, lines=11), the n-2 cases and n-1 cases numbered to 91 and 14 respectively.
Benchmark Record
Conclusions
Objective (3) To create an algorithm for contingency analysis using the PI method
An algorithm for contingency analysis using the Performance Index (PI) method was created and integrated to the NRLF in MATLAB.
Objective (4) To integrate NRLF and PI method algorithm
Integration made the simulation process easier to operate. A GUI was also made for the changing some parameters of the system.
Benchmark Record
Conclusions
Objective (5) To adapt a method for screening the contingencies used by the authors of “Neural network approach to contingency screening and ranking in power systems.” - A method was adapted for screening the contingencies. The computed OPI from MATLAB is transferred to the MS excel for data logging for ranking and screening. - The OPI is compared to the range of the critical limits and then classified if it is most critical, critical, probably critical, and non critical. - It was found out that 4 out of 105 cases were the most critical cases and therefore it must be the focus of analysis. But 26 cases are considered as non critical cases which means that these cases have a lesser impact.
Benchmark Record
Recommendations
1.) After the generation of ranked contingencies, another method can be proposed, using PIVQ method or PIs. 2.) The screened contingencies can be improved in terms of performance by applying the optimal load flow solution to these outages. 3.) A faster contingency simulation can be proposed, by changing NRLF by Fast Decoupled Load Flow, or DC Load Flow. 4.) Correlation study is vital for the accuracy of the ranking of the contingencies.
Benchmark Record
References
[1] C. I. Faustino Agreira, J. A. Dias Pinto, “Contingency Screening and Ranking Algorithm Using Two Different Sets of Security Performance Indices”. 2003 IEEE Bologna PowerTech Conference, June 23-26, Bologna, Italy [2] EPCOR, Distributed Generation, January 2002 [3] B. Krishnakumar, S. K. Soundarajan, R. Gnanadass, “Fuzzy Based Contingency Assessment Using Performance Indices with Masking Effect. 2012 IEEE Students’ Conference on Electrical, Electronics and Computer Science [4] Mohammad Khazaei, Shahram Jadid, Contingency Ranking Using Neural Networks by Radial Basis Function Method, 2008 IEEE [5] P. Sekhar, S. Mohanty, “Power system contingency ranking using Newton Raphson load flow method”. 2013 Annual IEEE India Conference (INDICON). [6] T. S. Sidhu, L. Cui, “Contingency Screening for Steady-State Security Analysis By Using FFT and Artificial Neural Networks. IEEE transactions on power systems, vol. 15, no.1 February 2000 [7] Power Generation, Operation, and Control 3rd edition by Allen J. Wood, Bruce F. Wollenberg & Gerald B. Shelbe page 328 [8] Dugan R.C. and McDermott T.E. “Operating conflicts for distributed generation on distribution systems” Rural Electric Power Conference, April 2001. [9] Stagg and El-Abiad, Computer Methods in Power System Analysis, 1968, McGraw Hill [10] Arrillaga J. and Arnold C.P., Computer Analysis of Power Systems, 1990, John Wiley and Sons

Benchmark Record
END OF PRESENTATION
THANK YOU!


![Winter Contingency Plan 2019 - PDMA Contingency... · 2020. 12. 24. · [KHYBER PAKHTUNKHWA WINTER CONTINGENCY PLAN 2019-20] Winter Contingency Plan 5 | Page utilizing PAF strategic](https://img.pdfslide.net/doc/110x75/611400065caf3c03a80f7591/winter-contingency-plan-2019-pdma-contingency-2020-12-24-khyber-pakhtunkhwa.jpg)