Embed Size (px)
Citation preview
Contingent Claims Approach to
Measuring and Managing Sovereign Credit Risk By
Dale F. Gray, Robert C. Merton and Zvi Bodie
July 3, 2007
Dale F. Gray President of MF Risk, Inc.
Sr. Risk Expert, International Monetary Fund
Robert C. Merton John and Natty McArthur University Professor
Harvard Business School
Zvi Bodie Norman and Adele Barron Professor of Management
Boston University School of Management
2
Abstract This paper proposes a new approach to measure, analyze, and manage sovereign
risk based on the theory and practice of modern contingent claims analysis (CCA). The paper provides a new framework for adapting the CCA model to the sovereign balance sheet in a way that can help forecast credit spreads and evaluate the impact of market risks and risks transferred from other sectors. This new framework is useful for assessing vulnerability, policy analysis, sovereign credit risk analysis, and design of sovereign risk mitigation and control strategies. Applications for investors in three areas are discussed. First, CCA provides a new framework for valuing, investing, and trading sovereign secu-rities, including sovereign capital structure arbitrage. Second, it provides a new frame-work for analysis and management of sovereign wealth funds being created by many emerging market and resource rich countries. Third, the framework provides quantitative measures of sovereign risk exposures which facilitates the design of new instruments and contracts to control or transfer sovereign risk.
3
Introduction
Vulnerability of a national economy to volatility in the global markets for credit,
currencies, commodities, and other assets has become a central concern of policymakers,
credit analysts, and investors everywhere. This paper proposes a new comprehensive ap-
proach to measure, analyze, and manage sovereign risk based on the theory and practice
of modern contingent claims analysis (CCA). In this approach, the sectors of a national
economy are viewed as interconnected portfolios of assets, liabilities, and guarantees.
We measure the sensitivities of the market values of these portfolios to “shocks” in un-
derlying market risk factors, and we illustrate how to use contingent claims analysis to
quantify sovereign credit risk and risks that are transferred from other sectors to the pub-
lic sector.
Contingent claims analysis is a proven approach to analyzing and managing pri-
vate-sector risk. A contingent claim is any financial asset whose future payoff depends
on the value of another asset. The prototypical contingent claim is an option – the right
to buy or sell the underlying asset at a specified exercise price by a certain expiration
date. A call is an option to buy; a put is an option to sell. Contingent claims analysis is a
generalization of the option pricing theory pioneered by Black-Scholes (1973) and Mer-
ton (1973). Option pricing methodology has been applied to a wide variety of contingent
claims. When applied to the analysis and measurement of credit risk, contingent claims
analysis is commonly called the “Merton Model.”1 It is based on three principles: (i) the
values of liabilities are derived from assets; (ii) assets follow a stochastic process; and,
(iii) liabilities have different priority (i.e. senior and junior claims). Equity can be mod-
eled as an implicit call option and risky debt modeled as the default-free value of debt
minus an implicit put option.
The Merton Model was first adapted and applied commercially by KMV (now
Moody’s KMV) and is now firmly established as the theoretical basis for several applied
models that are widely used in the investment industry to measure and evaluate credit risk
for corporate firms and financial institutions.2 The innovation in this paper is to adapt the
Merton Model and apply it at the aggregate level to the sovereign balance sheet and to
1 See Merton (1974, 1977, 1992, 1998).
4
sectors of the economy.3 We substitute the term “junior claim” for equity in describing
the sovereign balance sheet.
The traditional approach to analyzing a country’s ability to service its foreign-
currency denominated debt was developed by economists who specialize in macroeco-
nomics and international trade. It usually involves forecasting national saving, investing,
exports, imports, and funds flows. These macroeconomic flows are often supplemented
with partial data on the government debt, and vulnerability is usually assessed with ac-
counting ratios, such as debt to GDP. By contrast, our contingent claims approach fo-
cuses on the risk-adjusted economic balance sheet of the sovereign (combined govern-
ment and monetary authorities) and is able to more accurately forecast the non-linear be-
havior of sovereign bond prices and credit spreads.
The paper is organized as follows. In the first section we give a conceptual over-
view of our approach and explain the basic features of the quantitative model. In section
2 we show how the model can be used to analyze and forecast the credit spread on a
country’s foreign-currency denominated sovereign debt. In section 3 we demonstrate its
real-world application showing how the sovereign CCA risk indicators can be calculated,
with country examples, and application of the framework to a specific country—Brazil,
during the 2002-2005 period. Section 4 explores actual and potential applications of this
framework for investment management: (i) valuing, investing and trading sovereign secu-
rities including sovereign capital structure arbitrage strategies; (ii) design and manage-
ment of sovereign wealth funds; and, (iii) design and valuation of new sovereign risk
transfer instruments and contracts.
1.0 Overview of the contingent-claims balance-sheet approach
Balance sheet risk is the key to understanding credit risk and default probabilities
whether the balance sheet is of a corporation, a financial institution or a sovereign. All of
the entity’s assets and liabilities are measured at their current market values. Random
changes in financial inflows, outflows, and fluctuations in market prices cause uncer-
tainty in the values of the entity’s assets and liabilities. The total value of all assets could
2 See KMV (1999) for a summary of their methodology.
5
decline to below the level of promised payments on the debt causing distress and/or de-
fault. The value of total assets that triggers an incidence of distress lies somewhere be-
tween the book value of total liabilities and short-term liabilities. This trigger value of
liabilities is defined as the distress barrier, which represents the present value of promised
payments on the debt and is commonly denoted as the sum of short-term debt, interest
payments up to the horizon time (one year), and half of long-term debt.4
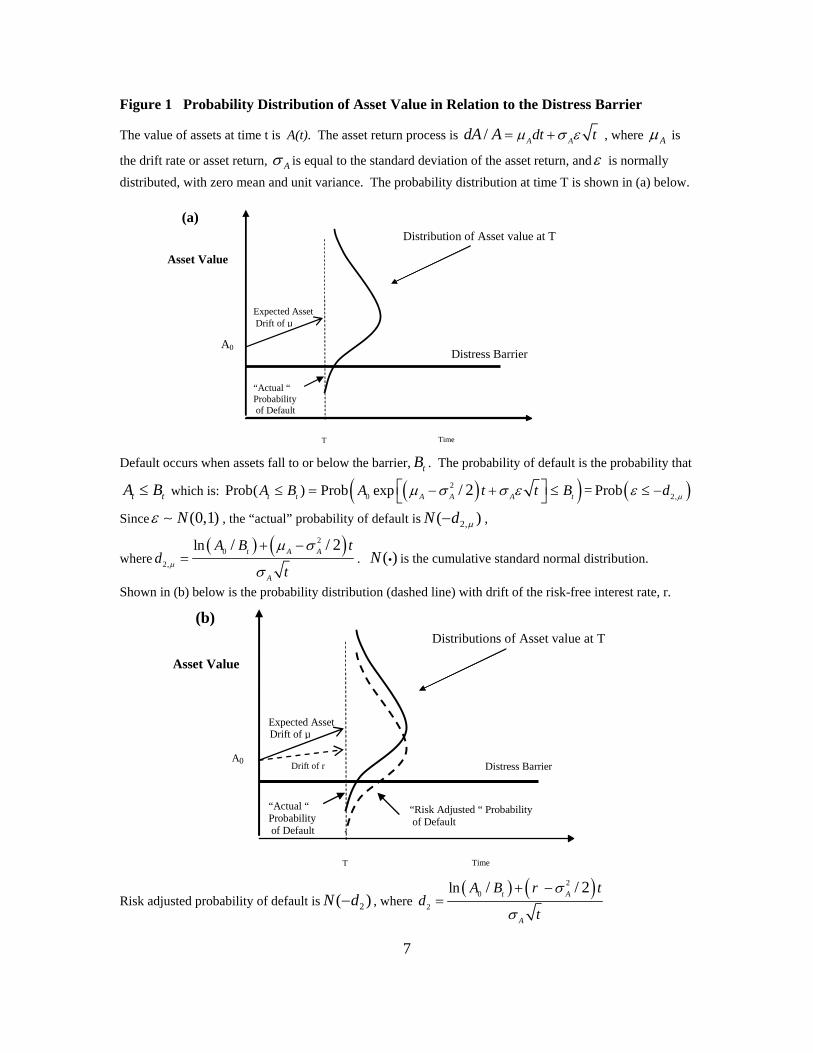
Figure 1 illustrates the key relationships, and Box 1 presents the Merton Model
equations.l The value of total assets in relation to the distress barrier is illustrated in Fig-
ure 1(a), where the expected rate of return on assets is called the drift and denoted by the
Greek letter mu (µ). The uncertainty in future asset value is represented by a probability
distribution at the time horizon T. At the end of the period, the value of assets may be
above the distress barrier, indicating that debt service can be made, or below the distress
barrier, leading to default.
The probability that the asset value will be below the distress barrier is the area
below the distress barrier in Figure 1(a). It is the “actual” default probability.5 The asset-
return probability distribution used to value contingent claims is not the “actual” one but
the “risk-adjusted” or “risk-neutral” probability distribution, which substitutes the risk-
free interest rate for the actual expected return in the distribution. This risk-neutral dis-
tribution is the dashed line in Figure 1(b) with expected rate of return r, the risk-free rate.
Thus, the “risk-adjusted” probability of default calculated using the “risk-neutral” distri-
bution is larger than the actual probability of default for all assets which have an actual
expected return (µ) greater than the risk-free rate r (that is, a positive risk premium).6
This is illustrated in Figure 1(b) which shows that the area below the distress barrier of
the “risk neutral” distribution (dashed line) is larger than the area below the distress bar-
rier of the “actual” distribution (solid line).
The calculations of the “actual” probability of default is outside the CCA/Merton
Model but it can be combined with an equilibrium model of underlying asset expected
3 This section is based on Gray, Merton, Bodie (2002); Draghi, Giavazzi, Merton (2003); Gray (2002). 4 This definition of the distress barrier is identical to that used by Moody’s KMV in corporate sector default risk analysis (KMV 1999). Short-term is defined as one year or less by residual maturity. 5 The “actual” probability of default is sometimes called “true” probability of default. 6 See Merton (1992, pp.334-343; 448-450).
6
returns to produce estimates that are consistent for expected returns on all derivatives,
conditional on the expected return on the asset. The reason being that one does not have
to know expected returns to use the CCA/Merton models for the purpose of value or risk
calculations.
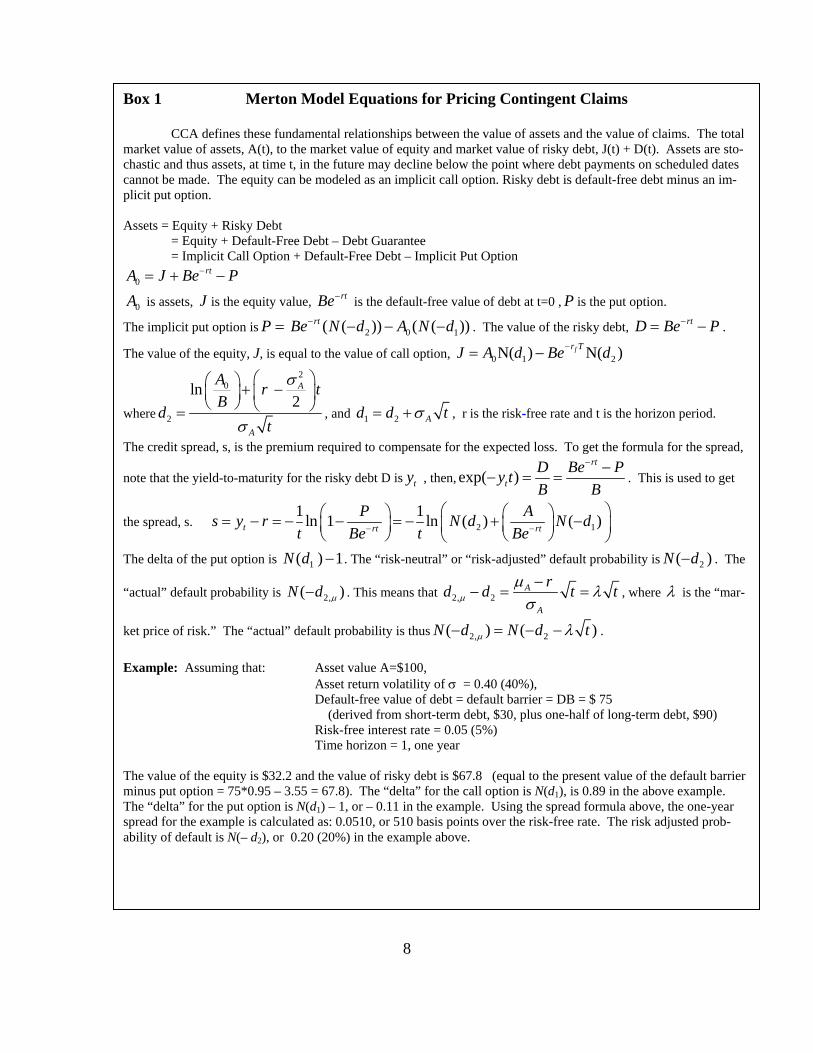
The fact that losses will be incurred in the event of default means that the debt is
“risky,” and therefore its value is less than if it were default-free. In the contingent
claims approach, the value of risky debt is calculated as the default-free value of debt mi-
nus an implicit put option.7 The implicit put option is the value of a put option on the un-
derlying assets with the strike price equal to the default-free value of debt. Equity (the
most junior claim) is modeled as an implicit call option on the assets with the strike price
equal to the default-free value of the debt. By substituting into the balance sheet identity
that total assets always equals total liabilities (including equity), we obtain:
Assets = Equity + Risky Debt = Implicit Call Option + Default-Free Debt – Implicit Put Option
7 See Merton (1977) and Merton and Bodie (1992).
7
Figure 1 Probability Distribution of Asset Value in Relation to the Distress Barrier
The value of assets at time t is A(t). The asset return process is / A Adt tdA A µ σ ε= + , where Aµ is
the drift rate or asset return, Aσ is equal to the standard deviation of the asset return, andε is normally distributed, with zero mean and unit variance. The probability distribution at time T is shown in (a) below. Default occurs when assets fall to or below the barrier, tB . The probability of default is the probability that
t tA B≤ which is: ( )( ) ( )20 2,Prob( ) Prob exp = Prob/ 2t t A A A tA B A t t B d µµ σ σ ε ε≤ = − + ≤ ≤ −⎡ ⎤⎣ ⎦
Since (0,1)Nε ∼ , the “actual” probability of default is 2,( )N d µ− ,
where( ) ( )2
02,
ln / / 2t A A
A
A B td
tµ
µ σ
σ
+ −= . ( )N i is the cumulative standard normal distribution.
Shown in (b) below is the probability distribution (dashed line) with drift of the risk-free interest rate, r.
Risk adjusted probability of default is 2( )N d− , where ( ) ( )2
02
ln / / 2t A
A
A B r td
t
σ
σ
+ −=
Asset Value
Expected Asset
Distribution of Asset value at T
Drift of µ
Distress Barrier A0
T Time
“Actual “ Probability of Default
(a)
Asset Value
Expected Asset
Distributions of Asset value at T
Drift of µ
Distress Barrier A0
T Time
“Actual “ Probability of Default
Drift of r
“Risk Adjusted “ Probability of Default
(b)
8
Box 1 Merton Model Equations for Pricing Contingent Claims CCA defines these fundamental relationships between the value of assets and the value of claims. The total market value of assets, A(t), to the market value of equity and market value of risky debt, J(t) + D(t). Assets are sto-chastic and thus assets, at time t, in the future may decline below the point where debt payments on scheduled dates cannot be made. The equity can be modeled as an implicit call option. Risky debt is default-free debt minus an im-plicit put option.
Assets = Equity + Risky Debt = Equity + Default-Free Debt – Debt Guarantee = Implicit Call Option + Default-Free Debt – Implicit Put Option
0rtA J Be P−= + −
0A is assets, J is the equity value, rtBe− is the default-free value of debt at t=0 , P is the put option.
The implicit put option is =P 2 0 1( ( )) ( ( ))rtBe N d A N d− − − − . The value of the risky debt, rtD Be P−= − .
The value of the equity, J, is equal to the value of call option, 0 1 2N( ) N( )fr TJ A d Be d−= −
where
20
2
ln2
A
A
A r tB
dt
σ
σ
⎛ ⎞⎛ ⎞ + −⎜ ⎟⎜ ⎟⎝ ⎠ ⎝ ⎠= , and 1 2 Ad d tσ= + , r is the risk-free rate and t is the horizon period.
The credit spread, s, is the premium required to compensate for the expected loss. To get the formula for the spread,
note that the yield-to-maturity for the risky debt D is ty , then, exp( )rt
tD Be Py tB B
− −− = = . This is used to get
the spread, s. 2 11 1ln 1 ln ( ) ( )t rt rt
P As y r N d N dt Be t Be− −
⎛ ⎞⎛ ⎞ ⎛ ⎞= − = − − = − + −⎜ ⎟ ⎜ ⎟⎜ ⎟⎝ ⎠ ⎝ ⎠⎝ ⎠
The delta of the put option is 1( ) 1N d − . The “risk-neutral” or “risk-adjusted” default probability is 2( )N d− . The
“actual” default probability is 2,( )N d µ− . This means that 2, 2A
A
rd d t tµµ λσ−
− = = , where λ is the “mar-
ket price of risk.” The “actual” default probability is thus 2, 2( ) ( )N d N d tµ λ− = − − . Example: Assuming that: Asset value A=$100,
Asset return volatility of σ = 0.40 (40%), Default-free value of debt = default barrier = DB = $ 75 (derived from short-term debt, $30, plus one-half of long-term debt, $90) Risk-free interest rate = 0.05 (5%) Time horizon = 1, one year
The value of the equity is $32.2 and the value of risky debt is $67.8 (equal to the present value of the default barrier minus put option = 75*0.95 – 3.55 = 67.8). The “delta” for the call option is N(d1), is 0.89 in the above example. The “delta” for the put option is N(d1) – 1, or – 0.11 in the example. Using the spread formula above, the one-year spread for the example is calculated as: 0.0510, or 510 basis points over the risk-free rate. The risk adjusted prob-ability of default is N(– d2), or 0.20 (20%) in the example above.
9
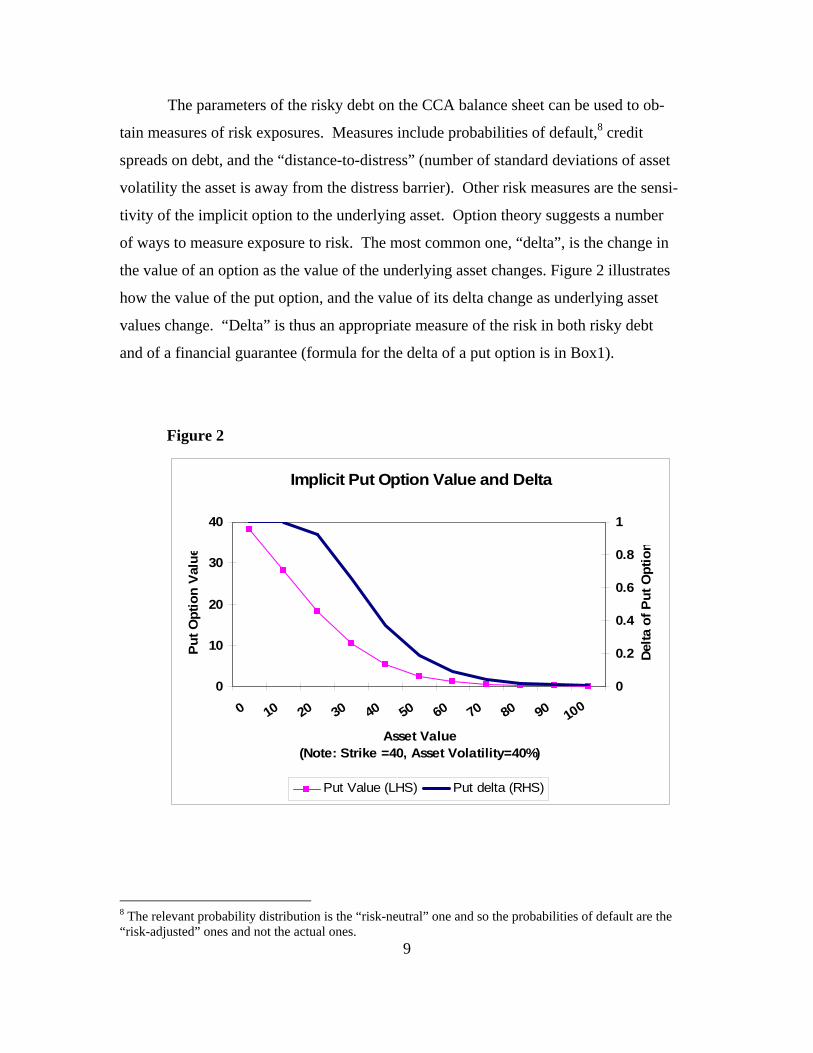
The parameters of the risky debt on the CCA balance sheet can be used to ob-
tain measures of risk exposures. Measures include probabilities of default,8 credit
spreads on debt, and the “distance-to-distress” (number of standard deviations of asset
volatility the asset is away from the distress barrier). Other risk measures are the sensi-
tivity of the implicit option to the underlying asset. Option theory suggests a number
of ways to measure exposure to risk. The most common one, “delta”, is the change in
the value of an option as the value of the underlying asset changes. Figure 2 illustrates
how the value of the put option, and the value of its delta change as underlying asset
values change. “Delta” is thus an appropriate measure of the risk in both risky debt
and of a financial guarantee (formula for the delta of a put option is in Box1).
Figure 2
Implicit Put Option Value and Delta
0
10
20
30
40
0 10 20 30 40 50 60 70 80 90 100
Asset Value (Note: Strike =40, Asset Volatility=40%)
Put O
ptio
n Va
lue
0
0.2
0.4
0.6
0.8
1
Delta
of P
ut O
ptio
n
Put Value (LHS) Put delta (RHS)
8 The relevant probability distribution is the “risk-neutral” one and so the probabilities of default are the “risk-adjusted” ones and not the actual ones.
10
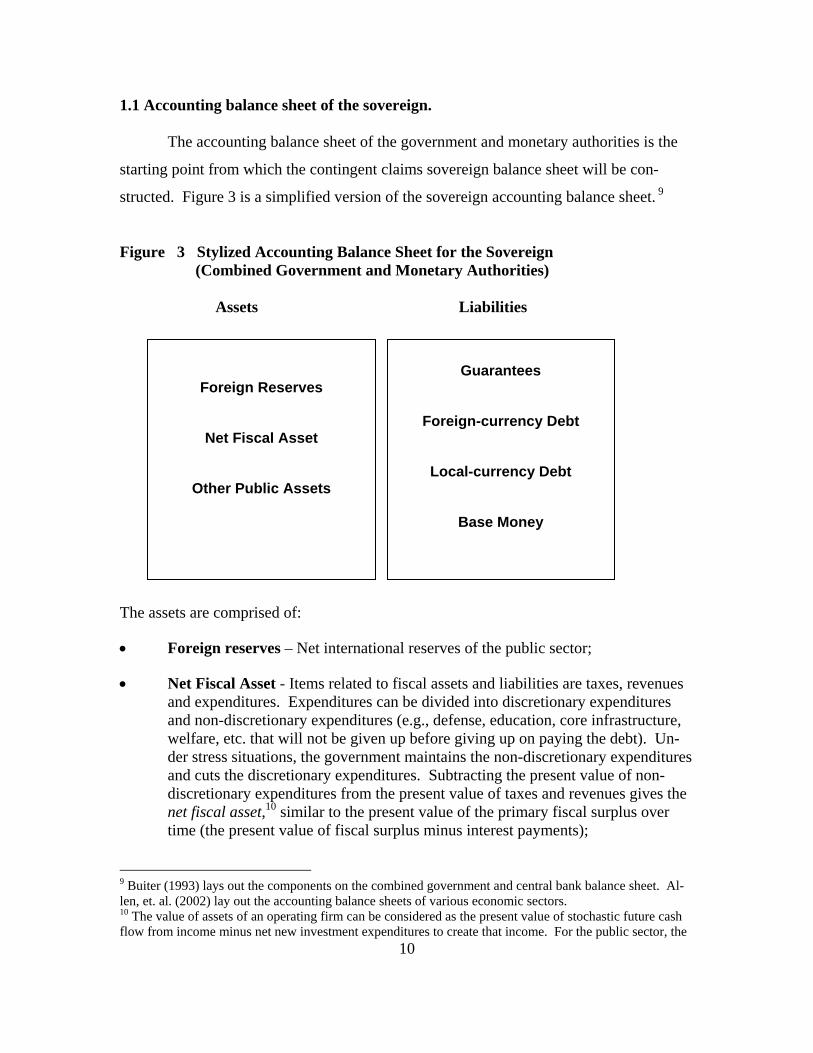
1.1 Accounting balance sheet of the sovereign. The accounting balance sheet of the government and monetary authorities is the
starting point from which the contingent claims sovereign balance sheet will be con-
structed. Figure 3 is a simplified version of the sovereign accounting balance sheet. 9
Figure 3 Stylized Accounting Balance Sheet for the Sovereign (Combined Government and Monetary Authorities)
Assets Liabilities
The assets are comprised of:
• Foreign reserves – Net international reserves of the public sector;
• Net Fiscal Asset - Items related to fiscal assets and liabilities are taxes, revenues and expenditures. Expenditures can be divided into discretionary expenditures and non-discretionary expenditures (e.g., defense, education, core infrastructure, welfare, etc. that will not be given up before giving up on paying the debt). Un-der stress situations, the government maintains the non-discretionary expenditures and cuts the discretionary expenditures. Subtracting the present value of non-discretionary expenditures from the present value of taxes and revenues gives the net fiscal asset,10 similar to the present value of the primary fiscal surplus over time (the present value of fiscal surplus minus interest payments);
9 Buiter (1993) lays out the components on the combined government and central bank balance sheet. Al-len, et. al. (2002) lay out the accounting balance sheets of various economic sectors. 10 The value of assets of an operating firm can be considered as the present value of stochastic future cash flow from income minus net new investment expenditures to create that income. For the public sector, the
Foreign Reserves
Net Fiscal Asset
Other Public Assets
Guarantees
Foreign-currency Debt
Local-currency Debt
Base Money
11
• Other Public Assets – These include equity in public enterprises, value of the public sector’s monopoly on the issue of money, and other financial and non-financial assets. (Assets which do not generate value and will likely never be sold and become part of fiscal revenues (e.g. public land) might be included in a purely accounting statement, but will not be part of an economic balance sheet.)
Liabilities consist of:
• Base money – Base money is a liability of the monetary authorities and thus a liability on the sovereign balance sheet. Base money consists of currency in cir-culation, bank reserves (required bank reserves, excess reserves, vault cash);11
• Local-currency debt – Local-currency debt of the government and monetary au-thorities, held outside of the monetary authorities and the government;
• Foreign-currency debt – Sovereign debt denominated in foreign currency, usu-ally held primarily by foreigners;
• Guarantees – Implicit or explicit financial guarantees to “too-important-to-fail” banks, other financial institutions or contingent pension/social obligations.
Annex 1 provides greater detail on the sovereign balance sheet.
1.2 Sovereign contingent claims balance sheet and valuation of sovereign risky debt. The analytical sovereign contingent claims balance sheet is the economic bal-
ance sheet of the combined government and the monetary authorities.12 In order to ap-
ply the Merton Model to the sovereign, certain items on the balance sheet need to be
rearranged. We begin by subtracting the guarantees to the too-important-to-fail entities
from the asset side. Sovereign assets now consist of foreign reserves, net fiscal asset,
other assets, minus guarantees to too-important-to-fail entities. Liabilities consist of
foreign-currency denominated debt plus what we will call local-currency liabilities (lo-
net fiscal asset is the present value of stochastic future fiscal flows from taxes and revenues minus non-discretionary expenditures. 11 Base money is also known as high-powered money or reserve money. As is the common practice, it is the main liability of the monetary authorities (IMF, 2000, Buiter, 1993, Blejer and Schumacher, 2000). Base money is “multiplied” by the banking system; the multipliers relate base money to M1, M2, etc. When a country joins a currency union (i.e. merges with another sovereign or dollarizes) base money is exchanged for foreign currency reserves. 12 This analytical combined balance sheet includes the monetary authority activities related to foreign cur-rency reserves and “net domestic credit” to government but excludes the direct activities of the monetary
12
cal-currency debt and base money). Sovereign distress or default on foreign-currency
debt occurs when the sovereign assets are insufficient to cover the promised payments
on the foreign-currency debt. We will define a “distress barrier” as the present value of
the promised payments on foreign-currency debt. While the promised payments, or
distress barrier, are known with a fair degree of certainty over a time horizon, there is
much more uncertainty about sovereign assets. The assets may increase or decrease
for a number of reasons. A decline in sovereign assets to a level below the distress
barrier will lead to serious distress and/or default. Default is thus effectively driven by
three elements: value of sovereign assets, the volatility of sovereign assets and the dis-
tress barrier.
The value of the sovereign foreign-currency debt to the holders of such debt
depends on the default-free value (promised payments) and also on losses if the sover-
eign were to default on the debt. The value of the sovereign foreign-currency debt is
“risky.” Any time a lender makes a loan to a sovereign, an implicit guarantee of that
loan is created. To see how, consider the following identity, which holds in both a
functional and a valuation sense:
Risky Sovereign Debt + Implicit Guarantee ≡ Default-free Debt
This equation can be re-written as:
Risky Sovereign Debt ≡ Default-free Debt – Implicit Guarantee
Lending to sovereigns thus consists of two functionally distinct activities: pure default-
free lending and the bearing of default risk by the lender. This implicit guarantee em-
bedded in the risky debt is equal to the expected losses from default, which depends on
the value and volatility of sovereign assets. Thus risky debt derives its value from
(stochastic) sovereign assets, i.e. its value can be seen as contingent on sovereign as-
sets.
Since some items on both the asset side and the liability side of the balance sheet
are measured in different currencies, we will measure all items in a single reserve cur-
rency. In an emerging market country with a “soft” currency, the numeraire for the
analysis is a “hard” reserve currency, e.g. US dollars. The distress barrier is related to the
authority with the banking sector, such as credit and liquidity support activities that do not go through the
13
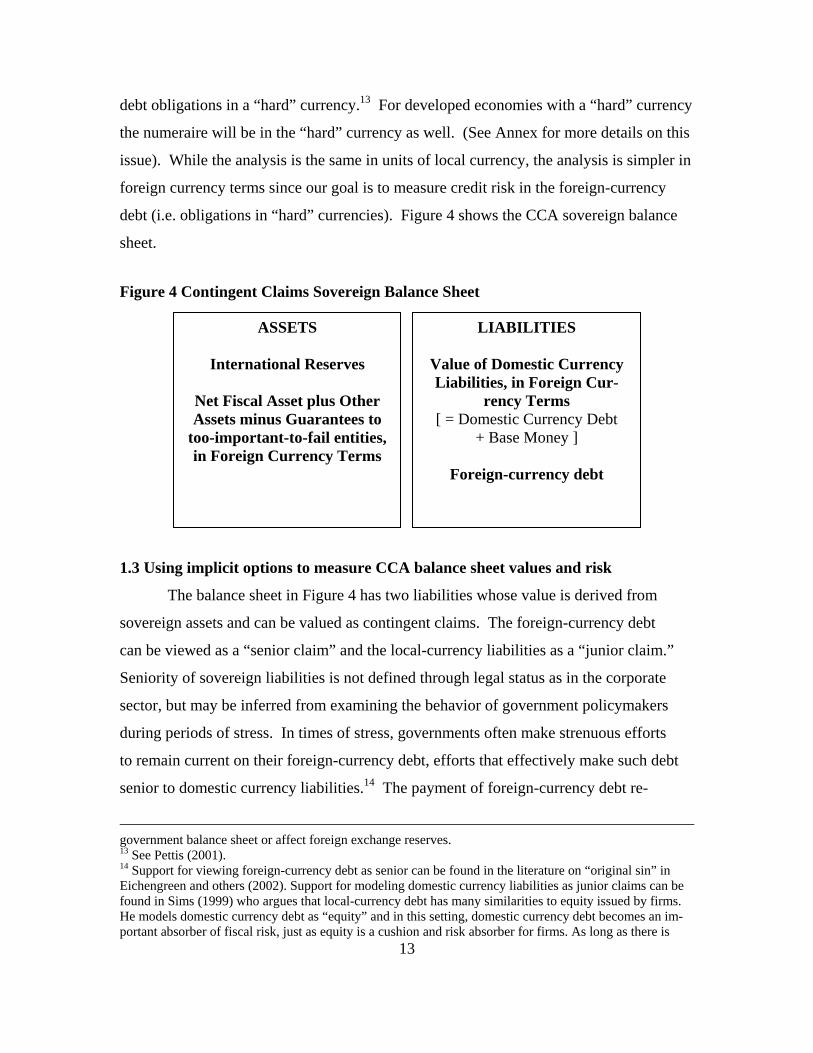
debt obligations in a “hard” currency.13 For developed economies with a “hard” currency
the numeraire will be in the “hard” currency as well. (See Annex for more details on this
issue). While the analysis is the same in units of local currency, the analysis is simpler in
foreign currency terms since our goal is to measure credit risk in the foreign-currency
debt (i.e. obligations in “hard” currencies). Figure 4 shows the CCA sovereign balance
sheet.
Figure 4 Contingent Claims Sovereign Balance Sheet
1.3 Using implicit options to measure CCA balance sheet values and risk
The balance sheet in Figure 4 has two liabilities whose value is derived from
sovereign assets and can be valued as contingent claims. The foreign-currency debt
can be viewed as a “senior claim” and the local-currency liabilities as a “junior claim.”
Seniority of sovereign liabilities is not defined through legal status as in the corporate
sector, but may be inferred from examining the behavior of government policymakers
during periods of stress. In times of stress, governments often make strenuous efforts
to remain current on their foreign-currency debt, efforts that effectively make such debt
senior to domestic currency liabilities.14 The payment of foreign-currency debt re-
government balance sheet or affect foreign exchange reserves. 13 See Pettis (2001). 14 Support for viewing foreign-currency debt as senior can be found in the literature on “original sin” in Eichengreen and others (2002). Support for modeling domestic currency liabilities as junior claims can be found in Sims (1999) who argues that local-currency debt has many similarities to equity issued by firms. He models domestic currency debt as “equity” and in this setting, domestic currency debt becomes an im-portant absorber of fiscal risk, just as equity is a cushion and risk absorber for firms. As long as there is
ASSETS
International Reserves
Net Fiscal Asset plus Other Assets minus Guarantees to
too-important-to-fail entities, in Foreign Currency Terms
LIABILITIES
Value of Domestic Currency Liabilities, in Foreign Cur-
rency Terms [ = Domestic Currency Debt
+ Base Money ]
Foreign-currency debt
14
quires the acquisition of foreign currency, which the government has a more limited
capacity to produce. In contrast, the government has much more flexibility to issue,
repurchase, and restructure local-currency debt. See Annex for more details on the
sovereign CCA balance sheet.
The foreign-currency debt can be modeled as default-free value of foreign-
currency debt minus an implicit put option. Sovereign local-currency liabilities in Fig-
ure 3 are modeled as an implicit call option. Sovereign local-currency liabilities have
certain “equity-like features” since money and local-currency debt can be issued in
large amounts even if this causes dilution/reduction in their value. In this sense, base
money and local-currency debt are similar to “shares” on a sovereign balance sheet.
Excessive issue of these “shares” can cause inflation and price changes similar to the
case where excessive issue of corporate shares dilute existing holders’ claims and re-
duce the price per share on a corporate balance sheet. The local-currency liabilities
times the exchange rate is like the “market cap” of the sovereign in the international
financial market.
1.4 Implicit options create risk interlinkages between the sovereign and other sec-
tors.
Financial guarantees can transfer risk across different sectors in the economy.
The implicit guarantees governments extend to banks and other financial institutions
result in the accumulation, often unconscious from the viewpoint of the government, of
unanticipated risks in the balance sheet of the public sector.
The explicit or implicit guarantee to the too-important-to-fail banks or financial
institutions can be modelled with put options. Economic balance sheets can be used to
demonstrate the interdependence among sectors. One sector is “long” certain implicit
options; another is “short” the same implicit options. These implicit options thus create
important risk inter-linkages among different sectors. For the sovereign balance sheet
we can see that there are two different types of implicit put options. The first is the im-
plicit put option associated with the foreign-currency debt. The holders of risky debt
some probability that the government will run a primary surplus in the future and/or will engage in the re-
15
are “short” this put option and the sovereign is “long” this put option. The second
type of implicit put option is associated with the guarantee to too-important-to-fail fi-
nancial institutions and other entities. The government is “short” these financial sector
put option(s) and the financial sector is “long” those same option(s).
2.0 Contingent claims analysis estimates sovereign asset values and volatility from market prices. Given the conceptual definition of sovereign distress, how does one go about es-
timating it? The main challenge is deriving an accurate estimate for the market value and
volatility of sovereign assets. While the levels and amounts of contractual debt are rela-
tively easy to determine from balance sheet information, the same is not true when meas-
uring the value of sovereign assets or its volatility. The market value of sovereign assets
is not directly observable and must therefore be estimated. There are several ways to
value an asset:
1. Determine value from observed market prices of all or part of the asset. This
method can use a market price quote, direct observation, bid-ask quote or other similar direct measures;
2. Determine value by a comparable or adjusted comparable. A sophisticated
version of obtaining a comparable value is the present value of a discounted expected cash flows—such as the primary surplus—with an appropriate dis-count rate;
3. Determine value from an implied value where the balance sheet relationships
between assets and liabilities allow the observed prices of liabilities to be used to obtain the implied value of the assets.
The three methods have different advantages and disadvantages. The first method
is straightforward but difficult to apply because only a few components of sovereign as-
sets have directly observable market prices. International reserves are both observable
and have a market value, yet the remaining items lack observable market prices. The
second method, using comparables, is commonly used but also has short-comings. Fu-
ture cash flows are difficult to project. The appropriate risk-adjusted discount rate and all
purchase of domestic currency debt then such debt has value.
16
of the relevant components that underlie the cash flow projections for tangible and intan-
gible items included in the asset value estimation are difficult to determine. Furthermore,
it is unclear how asset volatility should be best measured under the first two methods.
The third method, the approach adopted in this paper, circumvents the problems
in the first two methods. It estimates sovereign asset value and volatility indirectly from
information on observable values of the liability side of the balance sheet. This approach
relies on the relationship between assets and liabilities. Since liabilities are contingent
claims on assets, CCA can be used to get an “implied” estimate of the sovereign assets.
The calculation of implied values is a very common technique in the finance world.15
The collective view of many market participants is incorporated in the observable market
prices of liabilities and the change in the market price of these liabilities will determine
its volatility. The contingent claims approach implicitly assumes that market partici-
pants’ views on prices incorporate forward-looking information about the future eco-
nomic prospects of the sovereign. This assumption does not imply that the market is al-
ways right about its assessment of sovereign risk, but that it reflects the best available
collective forecast of the expectations of market participants. Implementing contingent
claims analysis to derive the implied sovereign asset value and volatility requires several
steps and assumptions. From the observed prices and volatilities of market-traded securi-
ties, one can estimate the implied values and volatilities of the underlying assets.
2.1 Calculating implied assets and implied asset volatility.
In the Merton Model for firms, banks and non-bank financials with traded equity,
E, is an implicit call option which is a function of assets, A, volatility of assets, the dis-
tress barrier, B, risk-free rate, r, and the time horizon, t. The value of E is the formula for
the call option.
( )1 , , , ,FirmE f A volatility of firm assets B r t= (1)
15 An implied value refers to an estimate derived from other observed data. Techniques for using implied
values are widely practiced in options pricing and financial engineering applications. See Bodie and Mer-ton (1995).
17
There is a second equation that links equity and equity volatility to the same five parame-
ters.16
( )2* , , , ,FirmE volatility of Equity f A volatility of firm assets B r t= (2) The value and volatility of equity can be observed. The distress barrier is derived from
the book value of debt. Risk-free rate and t are known. The Equations (1) and (2) are
used to solve for the two unknowns, asset value and volatility.
Since the market value of sovereign assets cannot be observed directly, a similar
calibration procedure can be used for the sovereign balance sheet to estimate implied as-
sets and asset volatility. The prices in the international markets (including foreign cur-
rency market), together with information from domestic market prices, provide the mar-
ket information for the value and volatility of certain liabilities on the public sector bal-
ance sheet.17 The balance sheet in Figure 4 has liabilities structured in a way that we can
observe the market value of the junior claims and the distress barrier of foreign-currency
debt so as to be able to adapt the Merton Model to the sovereign. On the simplified sov-
ereign balance sheet, the local-currency debt of the government, held outside of the
monetary authorities, and base money are local-currency liabilities which are modeled as
a call option on the sovereign assets with the default barrier derived from the foreign-
currency debt.
This model combines money and sovereign local-currency debt together to get
local currency liabilities (LCL). Book value of foreign-currency denominated debt is
used to define the distress barrier SovereignB . A simple two claim CCA framework is used
to calibrate the sovereign balance sheet by calculating implied sovereign assets, SovereignV ,
and asset volatility.
The value of local-currency liabilities in foreign currency terms $LC L is:
( )$ 1 , , , ,Sovereign SovereignLCL f V volatility of sovereign assets B r t= (3)
16 For a recently published book explaining these concepts applied to credit risk, see Crouhy, Galai, and Mark, (2000). 17 See Gray (2000) and (2001).
18
A second equation links $LC L and its volatility to the same five parameters. ( )$ $ 2* , , , ,Sovereign SovereignLCL volatility of LCL f V volatility of sovereign assets B r t= (4)
Since local-currency liabilities have some similarities to “shares,” the value of
money and local-currency debt times the exchange rate is like the “market cap” of the
sovereign. The volatility of the local-currency liabilities comes from the volatility of the
exchange rate and the volatility of the quantities of money and local-currency debt (is-
sued or repurchased).
Value of local-currency liabilities in foreign currency terms, $LC L , is a call op-
tion of sovereign assets in foreign currency terms, $SovV , with its strike price tied to the
distress barrier for foreign-currency denominated debt fB derived from the promised
payments on foreign-currency debt and interest payments up to time t.
$ $Sov 1 2N( ) N( )fr TfLCL V d B e d−= − (5)
The formula for the value of local-currency liabilities in foreign currency terms is:
$ $, 0( ) fd r Tr T
LC dd t
F
M e B eLCL M BX
−
=
+= + = (6)
The volatility of the local-currency liabilities is:
( )$ , , $, , , , , , , ,F d FLCL d d M d X F D X M Ddf M B r Xσ σ σ σ ρ ρ= (7)
where the definitions of the variables in Equations (6) and (7) are:
LCM base money in local currency terms; dr domestic interest rate; fr foreign interest
rate; domestic currency denominated debt is dB (derived from the promised payments on
local-currency debt and interest payments up to time t); FX forward exchange rate;
FXσ volatility of forward exchange rate; dDσ volatility of domestic debt in local currency
terms; ,d FD Xρ correlation of forward exchange rate and volatility of domestic debt in local
currency terms; $, dM Dρ correlation of money (in foreign currency terms) and local-
19
currency debt (in foreign currency terms); MLCσ volatility of money (in local currency
terms); Mσ volatility of money (in foreign currency terms); and,$dDσ volatility of local-
currency debt (in foreign currency terms).
Equations (3) and (4) can be rewritten as the two key equations relating assets and
local-currency liabilities:
$ $Sov 1 2N( ) N( )fr TfLCL V d B e d−= − (8)
$ $ $ $ 1
( )LCL Sov Sov
LCL V N dσ σ= (9) Equations (8) and (9) can be used to calculate the two unknowns: sovereign asset value
and sovereign asset volatility. Note that if the exchange rate is floating the volatility
comes largely from the exchange rate. If the exchange rate is “managed” or “fixed”
there is little or no volatility in the exchange rate but, to keep the exchange rate stable,
more money and local-currency debt must be issued and bought back (via sterilization
operations). There is thus higher volatility in the quantities of local-currency liabilities
from the issue and repurchase operations as the counterpart to less volatility in the ex-
change rate. (An analogy: A firm that tries to fix its stock price must issue and repur-
chase shares with the result that the “market cap,” shares times stock price, still has vola-
tility.)
The calibrated parameters of the sovereign CCA balance sheet can be used to ob-
tain quantitative sovereign risk measures. These include risk exposures for risky debt,
such as distance-to-distress, probabilities of default, spreads on debt, the sensitivity of the
implicit put option (i.e. expected losses) to the underlying asset (the delta), and other
measures.18
A large component of the spread on sovereign foreign currency debt is the credit
spread to compensate for the risk of default. The credit spread on sovereign foreign-
currency debt (from spread equation in Box 1) is a function of: (i) the ratio of sovereign
18 Xu and Ghezzi (2002) develop a stochastic debt sustainability model and show how it is related to the CCA model described in Gray, Merton, Bodie (2002) and this paper.
20
asset, $SovV to the default barrier, fB ; (ii) the volatility of sovereign assets,$ Sov
σ ; and, (iii)
horizon and risk-free interest rate. As the ratio of asset to distress barrier declines and/or
$ Sovσ increases, the spread increases in a non-linear way and can become sharply higher.
A decline in foreign currency reserves, lower fiscal revenues, and/or a rise in the foreign
debt default barrier will increase spreads.19
Risk managers working in modern financial institutions would find it difficult to
analyze the risk exposure of their financial institutions if they relied solely on their in-
come and cash flow statements and did not take into account (mark-to-market) balance
sheets or information on their institution’s derivative or option positions. Country risk
analysis that relies only on a macroeconomic flow-based approach is deficient in a simi-
lar way, given that traditional analysis does not take into account the volatility of assets.
Note that when the volatility of assets in the sovereign CCA balance sheet equation is set
to zero, the values of the implicit put and call options go to zero. Something very similar
to the traditional macroeconomic accounting balance sheet is the result. If we subse-
quently calculate the changes from one period to the next, the traditional flow-of-funds is
the result, since the change in assets is equal to changes in cash/reserves and changes in
the book value of debt. Thus, the flow-of-funds can be seen as a special deterministic
case of the CCA balance sheet equations when volatility is set to zero and annual changes
are calculated. Similarly, if the volatility of the assets of the too-important-to-fail finan-
cial institutions is set to zero, the implicit put options and contingent financial guarantees
go to zero as well. The measurement of risk transmission between sectors is lost.
3.0 Application to countries.
Using the calibration technique described above, the implied market value of sov-
ereign assets and implied volatility of sovereign assets were calculated on a weekly fre-
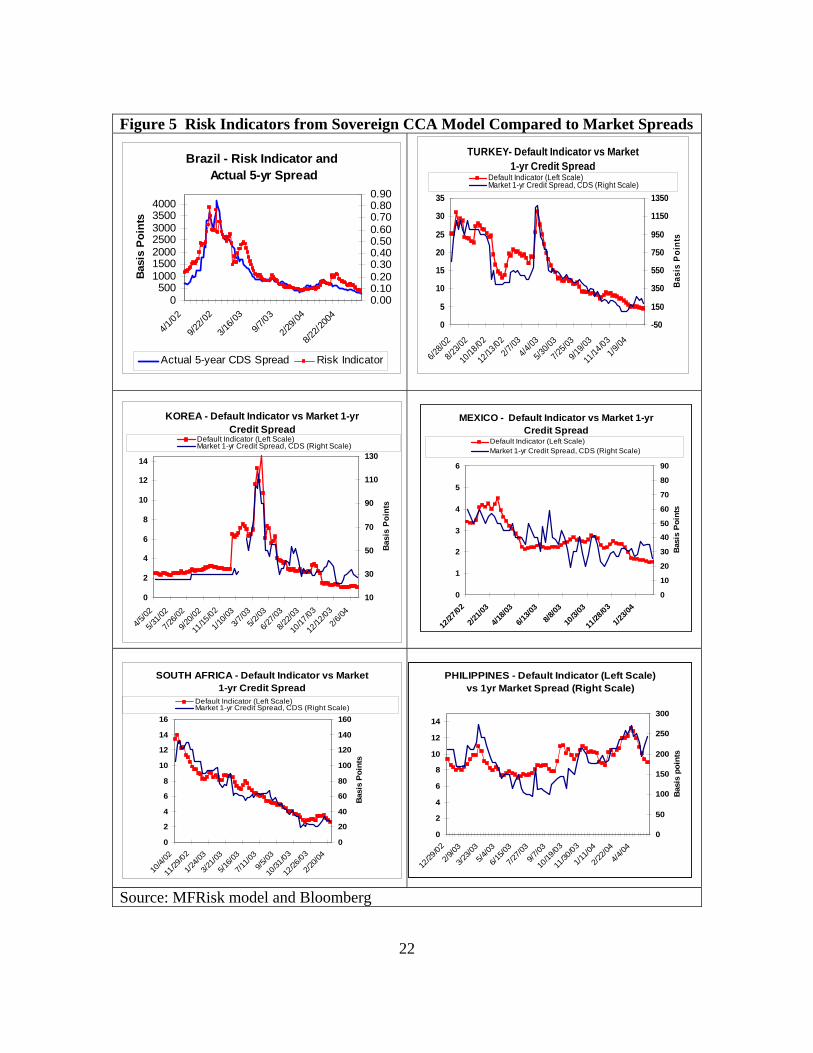
quency. The risk indicators were also calculated. Figure 5 shows the model risk indica-
tor (risk-neutral default probability) compared to credit default swap (CDS) spreads on
sovereign foreign-currency debt. Note that CDS or bond credit spreads were not used as
19 See IMF GFSR (April 2006), Box 3.6 for sovereign CCA and impact of changes in debt structure.

21
inputs into the calculation of the risk indicator. As can be seen in Figure 5 the risk indi-
cator has a high correlation with sovereign spreads.
22
Figure 5 Risk Indicators from Sovereign CCA Model Compared to Market Spreads
Source: MFRisk model and Bloomberg
Brazil - Risk Indicator and Actual 5-yr Spread
0500
1000150020002500300035004000
4/1/02
9/22/0
2
3/16/0
39/7
/03
2/29/0
4
8/22/2
004
Basi
s P
oint
s
0.000.100.200.300.400.500.600.700.800.90
Actual 5-year CDS Spread Risk Indicator
TURKEY- Default Indicator vs Market 1-yr Credit Spread
0
5
10
15
20
25
30
35
6/28/0
2
8/23/0
2
10/18
/02
12/13
/022/7
/034/4
/03
5/30/0
3
7/25/0
3
9/19/0
3
11/14
/031/9
/04
-50
150
350
550
750
950
1150
1350
Bas
is P
oint
s
Default Indicator (Left Scale)Market 1-yr Credit Spread, CDS (Right Scale)
KOREA - Default Indicator vs Market 1-yr Credit Spread
0
2
4
6
8
10
12
14
4/5/02
5/31/0
2
7/26/0
2
9/20/0
2
11/15
/02
1/10/0
33/7
/035/2
/03
6/27/0
3
8/22/0
3
10/17
/03
12/12
/032/6
/04
10
30
50
70
90
110
130
Basi
s Po
ints
Default Indicator (Left Scale)Market 1-yr Credit Spread, CDS (Right Scale)
MEXICO - Default Indicator vs Market 1-yr Credit Spread
0
1
2
3
4
5
6
12/27
/02
2/21/0
3
4/18/0
3
6/13/0
38/8
/03
10/3/
03
11/28
/03
1/23/0
40
10
20
30
40
50
60
70
80
90
Bas
is P
oint
s
Default Indicator (Left Scale)Market 1-yr Credit Spread, CDS (Right Scale)
SOUTH AFRICA - Default Indicator vs Market 1-yr Credit Spread
0
2
4
6
8
10
12
14
16
10/4/
02
11/29
/02
1/24/0
3
3/21/0
3
5/16/0
3
7/11/0
39/5
/03
10/31
/03
12/26
/03
2/20/0
40
20
40
60
80
100
120
140
160
Basi
s P
oint
s
Default Indicator (Left Scale)Market 1-yr Credit Spread, CDS (Right Scale)
PHILIPPINES - Default Indicator (Left Scale) vs 1yr Market Spread (Right Scale)
0
2
4
6
8
10
12
14
12/29
/02
2/9/03
3/23/0
35/4
/03
6/15/0
3
7/27/0
39/7
/03
10/19
/03
11/30
/03
1/11/0
4
2/22/0
44/4
/040
50
100
150
200
250
300
Basi
s po
ints
23
Robustness checks suggest that the distance-to-distress, model credit spread, and
risk-neutral probability of default are useful for evaluating sovereign vulnerabilities
(Gapen et. al. 2005). The evidence indicates that the book value of foreign-currency li-
abilities along with market information from domestic currency liabilities and the ex-
change rate contain important information about changes in the value of foreign-currency
liabilities and credit risk premium. The nonlinearities and inclusion of volatility in the
option pricing relationship used in this analysis contributes to the high degree of explana-
tory power and correlation with actual data.20
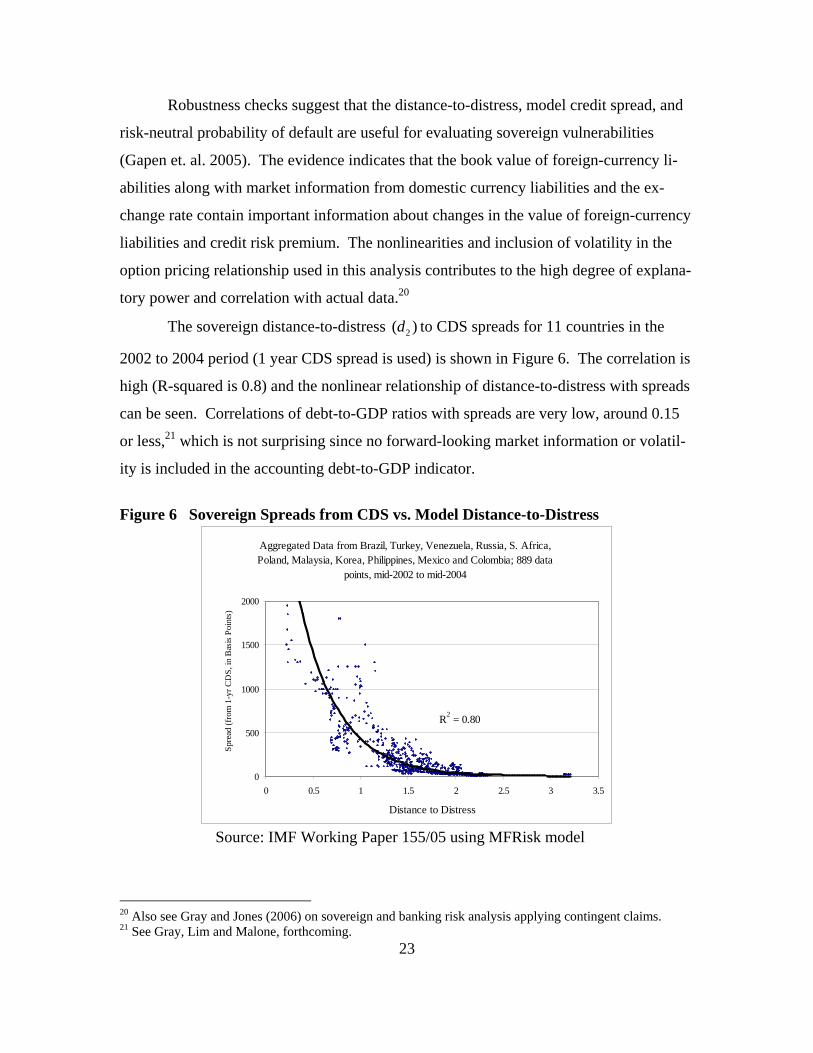
The sovereign distance-to-distress 2( )d to CDS spreads for 11 countries in the
2002 to 2004 period (1 year CDS spread is used) is shown in Figure 6. The correlation is
high (R-squared is 0.8) and the nonlinear relationship of distance-to-distress with spreads
can be seen. Correlations of debt-to-GDP ratios with spreads are very low, around 0.15
or less,21 which is not surprising since no forward-looking market information or volatil-
ity is included in the accounting debt-to-GDP indicator.
Figure 6 Sovereign Spreads from CDS vs. Model Distance-to-Distress
Aggregated Data from Brazil, Turkey, Venezuela, Russia, S. Africa, Poland, Malaysia, Korea, Philippines, Mexico and Colombia; 889 data
points, mid-2002 to mid-2004
R2 = 0.80
0
500
1000
1500
2000
0 0.5 1 1.5 2 2.5 3 3.5
Distance to Distress
Spre
ad (f
rom
1-y
r CD
S, in
Bas
is P
oint
s)
Source: IMF Working Paper 155/05 using MFRisk model 20 Also see Gray and Jones (2006) on sovereign and banking risk analysis applying contingent claims. 21 See Gray, Lim and Malone, forthcoming.
24
3.1 Application of CCA model to Brazil in volatile period 2002 to 2005.
The calibration of the CCA model for Brazil uses information from the forward
exchange rate is used as an input into the sovereign contingent claims calibration (Equa-
tion 6). The volatility of the forward exchange rate in Brazil was particularly high in Oc-
tober 2002, 80 to 90 percent, whereas the volatility in calm periods was in the 10 to 30
percent range.22
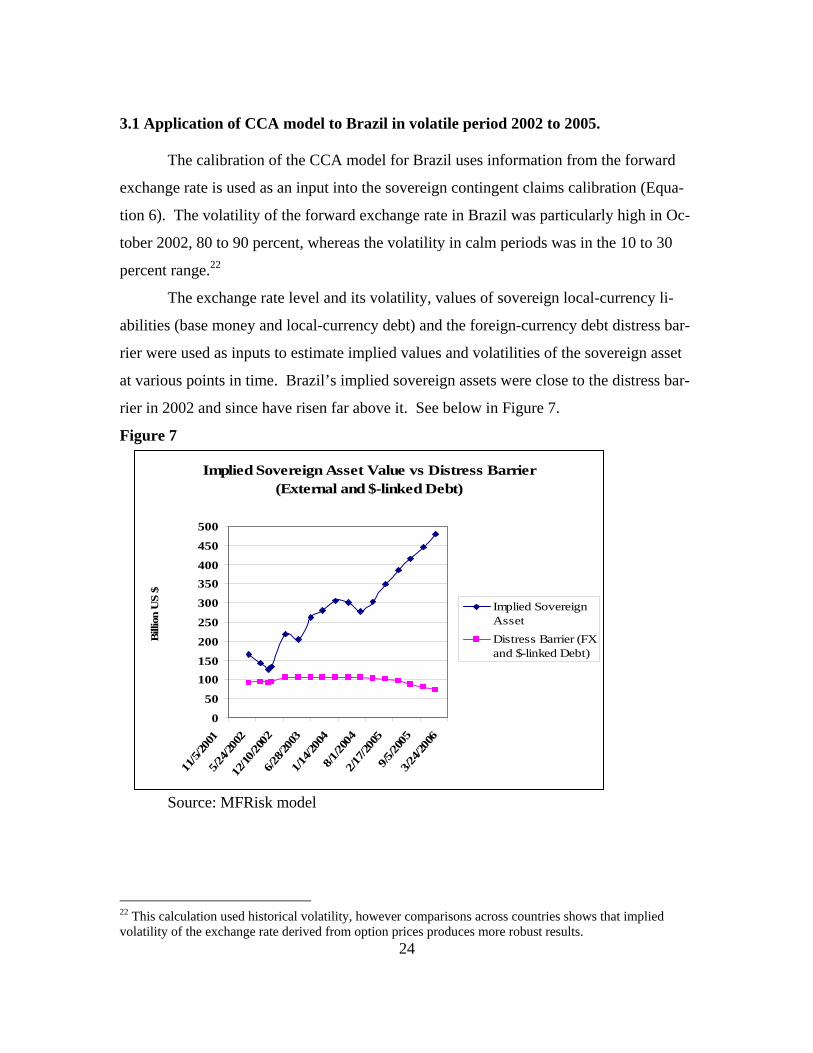
The exchange rate level and its volatility, values of sovereign local-currency li-
abilities (base money and local-currency debt) and the foreign-currency debt distress bar-
rier were used as inputs to estimate implied values and volatilities of the sovereign asset
at various points in time. Brazil’s implied sovereign assets were close to the distress bar-
rier in 2002 and since have risen far above it. See below in Figure 7.
Figure 7 Source: MFRisk model
22 This calculation used historical volatility, however comparisons across countries shows that implied volatility of the exchange rate derived from option prices produces more robust results.
Implied Sovereign Asset Value vs Distress Barrier (External and $-linked Debt)
0
50
100150
200
250
300
350400
450
500
11/5/
2001
5/24/2
002
12/10
/2002
6/28/2
003
1/14/2
004
8/1/20
042/1
7/200
59/5
/2005
3/24/2
006
Bill
ion
US
$
Implied SovereignAssetDistress Barrier (FXand $-linked Debt)
25
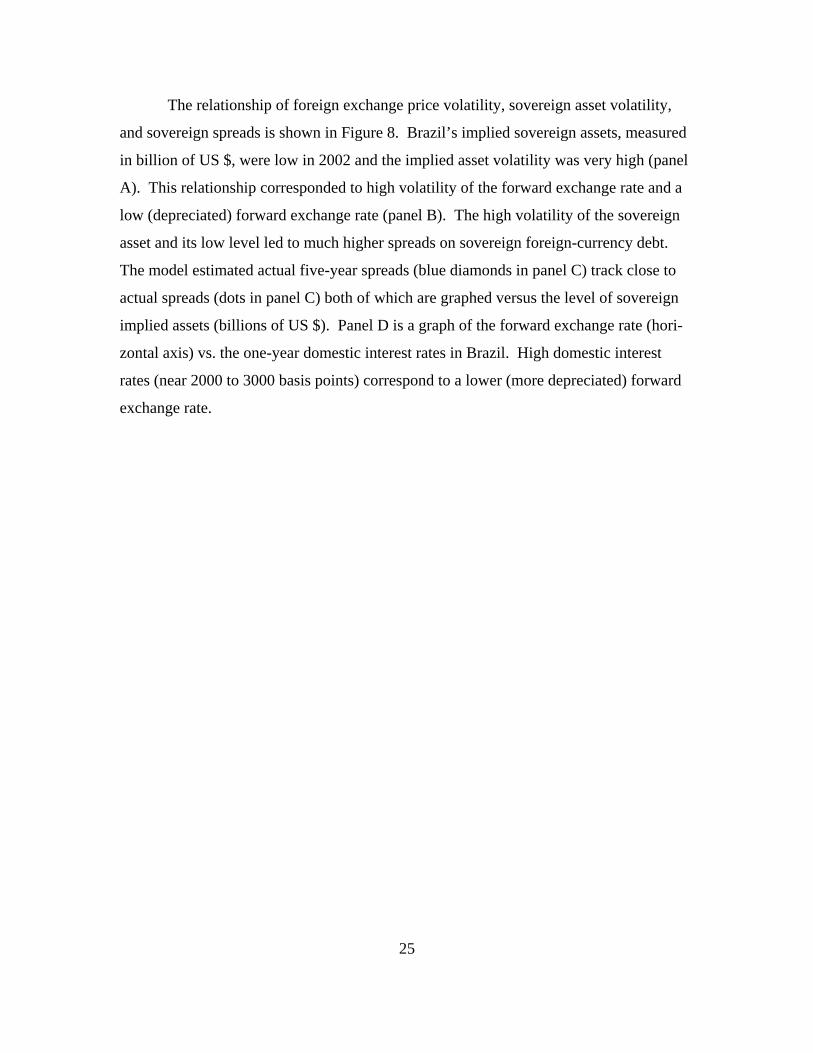
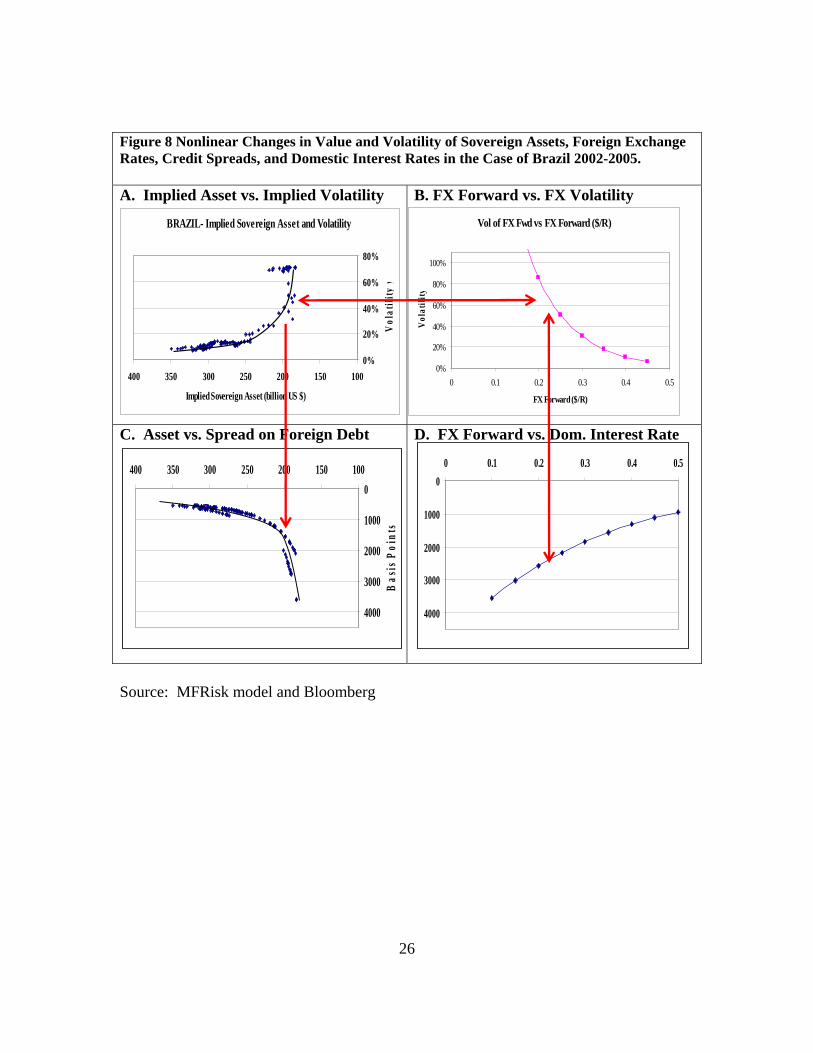
The relationship of foreign exchange price volatility, sovereign asset volatility,
and sovereign spreads is shown in Figure 8. Brazil’s implied sovereign assets, measured
in billion of US $, were low in 2002 and the implied asset volatility was very high (panel
A). This relationship corresponded to high volatility of the forward exchange rate and a
low (depreciated) forward exchange rate (panel B). The high volatility of the sovereign
asset and its low level led to much higher spreads on sovereign foreign-currency debt.
The model estimated actual five-year spreads (blue diamonds in panel C) track close to
actual spreads (dots in panel C) both of which are graphed versus the level of sovereign
implied assets (billions of US $). Panel D is a graph of the forward exchange rate (hori-
zontal axis) vs. the one-year domestic interest rates in Brazil. High domestic interest
rates (near 2000 to 3000 basis points) correspond to a lower (more depreciated) forward
exchange rate.
26
Figure 8 Nonlinear Changes in Value and Volatility of Sovereign Assets, Foreign Exchange Rates, Credit Spreads, and Domestic Interest Rates in the Case of Brazil 2002-2005. A. Implied Asset vs. Implied Volatility
B. FX Forward vs. FX Volatility
C. Asset vs. Spread on Foreign Debt
D. FX Forward vs. Dom. Interest Rate
Source: MFRisk model and Bloomberg
Vol of FX Fwd vs FX Forward ($/R)
0%
20%
40%
60%
80%
100%
0 0.1 0.2 0.3 0.4 0.5
FX Forward ($/R)
Vol
atili
ty
BRAZIL- Implied Sovereign Asset and Volatility
0%
20%
40%
60%
80%
100150200250300350400
Implied Sovereign Asset (billion US $)V
olat
ility
y
0
1000
2000
3000
4000
100150200250300350400
Bas
is P
oint
s
0
1000
2000
3000
4000
0 0.1 0.2 0.3 0.4 0.5
27
4.0 Applications of sovereign CCA from the perspective of investors.23 Investors can apply sovereign CCA framework in numerous ways. First, it pro-
vides a relative value framework for the contingent claims on sovereign assets and can be
a helpful tool in sovereign relative value trading or what can be called sovereign capital
structure arbitrage. Second, CCA has important implications for the rapidly growing area
of sovereign wealth funds. Emerging market governments have amassed large reserves
and many governments have or are setting up sizeable sovereign wealth funds. The CCA
framework developed here has important applications to this growing field of sovereign
asset and wealth management. Third, once the sovereign risk exposures are calculated,
new ways of transferring sovereign risk can be explored and potential new instruments
and risk transfer contracting arrangements can be developed. The development and ap-
plication of such instruments and contracts is known as the Alternative Risk Transfer
(ART).
4.1 Capital Structure Arbitrage for firms and potential for relative value and Sover-
eign Capital Structure Arbitrage.
Capital Structure Arbitrage (CSA) involves taking long and short positions in dif-
ferent instruments and asset classes in a firm’s capital structure. It uses relative value
techniques based on structural models for valuation across markets. Since the develop-
ment of the credit default swap market in the late 1990s, there has been a rapid growth of
CSA for corporate securities. Here we briefly describe CSA valuation and trading strate-
gies for corporate and financial firm securities and outline a framework for Sovereign
Capital Structure Arbitrage (SCSA).
The market value of risky debt from bonds and CDS can be compared to the “fair
value” derived from a CCA model using equity market information. Trading strategies
are designed to take advantage of pricing discrepancies. Equity, equity options, senior
23 See Gray and Malone, forthcoming, for a detailed explanation of macro financial risk applications for investors, for policy makers and the integration of CCA balance sheets with sophisticated macroeconomic models.
28
debt, convertible debt, CDS, and asset swaps are among the instruments that can be used
in CSA trading strategies. Summaries of market and capital structure arbitrage strategies
are provided by Berndt and de Melo (2003), Jain (2005), CreditGrades (2002), and Toft
(2003) among others. CreditGrades is a model developed by RiskMetrics Group and oth-
ers that provides a framework for relative valuation. The original CreditGrades model
(2002) included a diffusion of a firm’s assets and a first passage time default with a sto-
chastic default barrier. The model was modified to incorporate equity derivatives
(Stamicar and Finger 2005). Recent research has studied the relationship between the
volatility skew implied by equity options and CDS spreads (Hull et. al. 2003). They es-
tablish a relationship between implied volatility of two equity options, leverage and asset
volatility. This approach is, in fact, a new way of implementing Merton’s model to get
spreads and risk-neutral default probabilities directly from the implied volatility of equity
options.
A popular trade strategy is to trade equity against the CDS. Using a structural
model calibrated with an equity and asset skew, which is most easily done with informa-
tion from equity options, the “fair value” CDS spread can be obtained from the contin-
gent claims model using equity market information. If the equity looks cheap relative to
the observed CDS the strategy is to buy equity stock and buy protection in the CDS mar-
ket. If equity prices go up or spread widens then the strategy earns money. Another
strategy, if equity volatility is expensive relative to CDS spreads, is to write put options
on equity and buy protection. If equity prices increase (and volatility declines) or spreads
widen the strategy earns money.
The sovereign CCA model provides a framework for valuing sovereign foreign-
currency debt, local-currency debt, foreign currency value of base money and local-
currency debt, CDS on foreign-currency debt, and other claims. The benefit is that the
sovereign CCA model provides “fair value” estimates of risky debt and CDS using as in-
puts the exchange rate, exchange rate volatility, local-currency liabilities, book value of
foreign debt, and other parameters. Many different sovereign capital trading strategies
are possible using a variety of instruments, including FX spot and forwards, FX options,
29
local-currency debt, foreign-currency debt, CDS on foreign-currency debt, and inflation
or indexed debt.
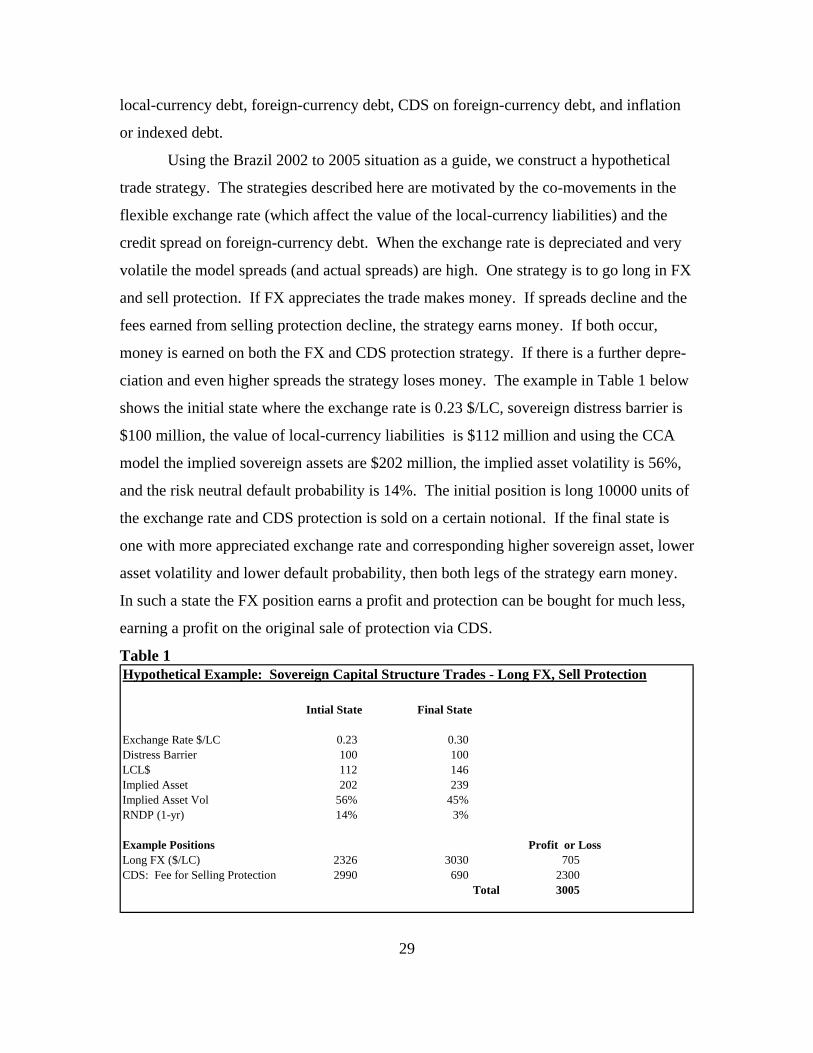
Using the Brazil 2002 to 2005 situation as a guide, we construct a hypothetical
trade strategy. The strategies described here are motivated by the co-movements in the
flexible exchange rate (which affect the value of the local-currency liabilities) and the
credit spread on foreign-currency debt. When the exchange rate is depreciated and very
volatile the model spreads (and actual spreads) are high. One strategy is to go long in FX
and sell protection. If FX appreciates the trade makes money. If spreads decline and the
fees earned from selling protection decline, the strategy earns money. If both occur,
money is earned on both the FX and CDS protection strategy. If there is a further depre-
ciation and even higher spreads the strategy loses money. The example in Table 1 below
shows the initial state where the exchange rate is 0.23 $/LC, sovereign distress barrier is
$100 million, the value of local-currency liabilities is $112 million and using the CCA
model the implied sovereign assets are $202 million, the implied asset volatility is 56%,
and the risk neutral default probability is 14%. The initial position is long 10000 units of
the exchange rate and CDS protection is sold on a certain notional. If the final state is
one with more appreciated exchange rate and corresponding higher sovereign asset, lower
asset volatility and lower default probability, then both legs of the strategy earn money.
In such a state the FX position earns a profit and protection can be bought for much less,
earning a profit on the original sale of protection via CDS.
Table 1 Hypothetical Example: Sovereign Capital Structure Trades - Long FX, Sell Protection
Intial State Final State
Exchange Rate $/LC 0.23 0.30Distress Barrier 100 100LCL$ 112 146Implied Asset 202 239Implied Asset Vol 56% 45%RNDP (1-yr) 14% 3%
Example Positions Profit or LossLong FX ($/LC) 2326 3030 705CDS: Fee for Selling Protection 2990 690 2300
Total 3005
30
Note that an alternative strategy could have been to go short FX to hedge selling CDS
protection. In this case, the final state in Table 1 would have led to profits from the sale
of protection and loss on the FX position (profits of 2300 minus 705 =1595, < 3005).
However, if the exchange rate depreciated, instead of appreciating, and if CDS spreads
stayed the same, profit would have been made on the FX trade. If the CDS spreads wid-
ened, profit would be made on the FX trade and lost on the CDS trade. There are a myr-
iad of possible strategies. Convergence arbitrage is one strategy if model “fair values”
diverge from observed levels and the bet is that they will converge over a certain horizon
period. Volatility trades are possible as well.
Preliminary work shows that the skew from FX options and its relation to sover-
eign CDS spreads has parallels to the relation between equity option skew and corporate
CDS spreads seen in corporate capital structure analyses/models. Many of the strategies
designed for corporate capital structure trades can be adapted to sovereign capital struc-
ture and relative value trades.
In a broader economic setting, the economy-wide CCA balance sheet model in-
corporating the financial and corporate sectors can be utilized to design relative value and
other trading strategies. These can be extended to stock indexes, individual stocks of
firms or banks and interest rate derivatives. There are a variety of trading strategies in-
cluding international positions in other countries and in the S&P, VIX, foreign bonds, etc.
The sovereign CCA framework has also recently been extended to value sovereign local-
currency debt. This extension can be included in trading strategies.24
4.2 Applications to sovereign asset and wealth management.
The CCA approach to measuring, analyzing, and managing sovereign risk can be
applied to the analysis and management of sovereign wealth funds. Fund managers can
combine CCA balance sheets with a Value-at-Risk (VaR) type approach adapted to the
sovereign. Macro risk management dovetails with national wealth management. The
analytical framework allows the quantification of the sovereign risk-adjusted balance
24 See Gray and Malone, forthcoming.
31
sheet so that it can be viewed as a “sovereign portfolio” consisting of assets, liabilities,
and contingent liabilities (whose values can be measured as implicit put options). This
quantitative risk-oriented approach has two important advantages. First, it is a potentially
useful new tool with which to gauge the risk reduction benefits of holding liquid foreign
currency reserves. In many countries the build-up of reserves has been much larger than
is justified by short-term liquidity needs. Asian countries with booming export sectors
and commodity exporters have amassed large reserve positions. Reserves in excess of
the required liquid reserves can be invested in higher return but less liquid instruments.
The framework described here can be used to assess investment strategies that provide
likely optimal hedging, diversification / risk reduction tailored for the specific risk char-
acteristics of a country.25 Excess reserves should be invested in instruments that have a
low correlation with the “sovereign portfolio.”
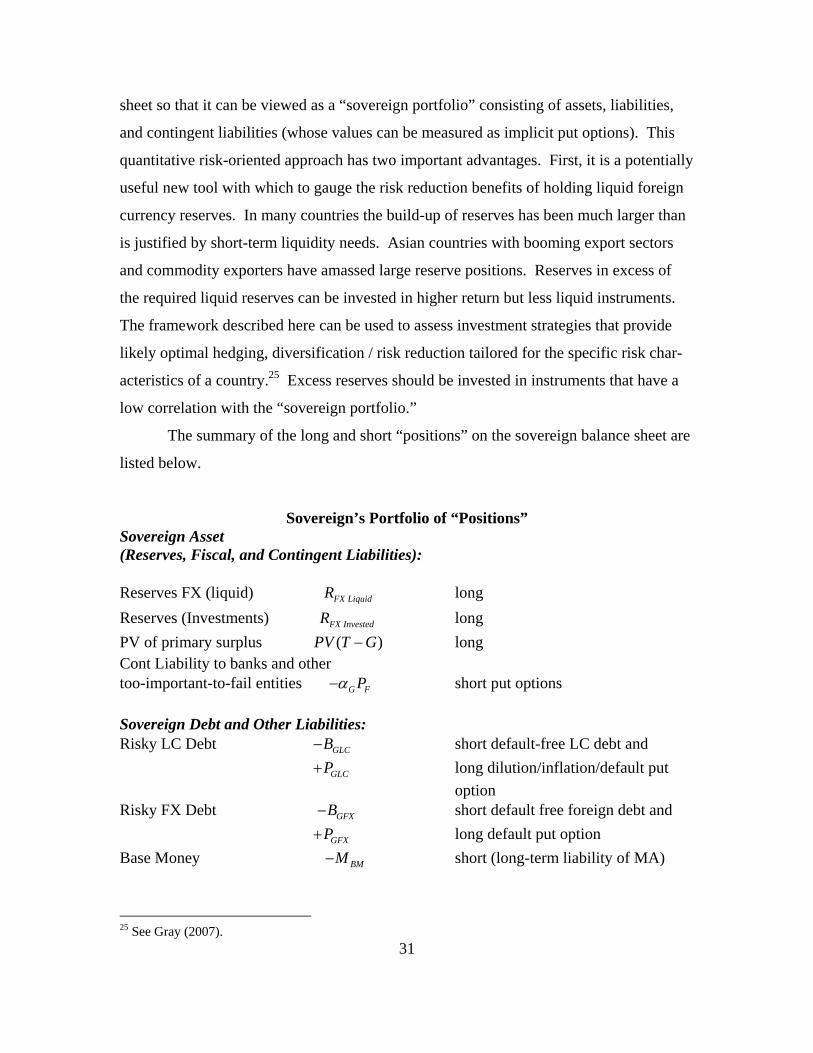
The summary of the long and short “positions” on the sovereign balance sheet are
listed below.
Sovereign’s Portfolio of “Positions” Sovereign Asset (Reserves, Fiscal, and Contingent Liabilities): Reserves FX (liquid) FX LiquidR long Reserves (Investments) FX InvestedR long PV of primary surplus ( )PV T G− long Cont Liability to banks and other too-important-to-fail entities G FPα− short put options Sovereign Debt and Other Liabilities: Risky LC Debt GLCB− short default-free LC debt and GLCP+ long dilution/inflation/default put option Risky FX Debt GFXB− short default free foreign debt and GFXP+ long default put option Base Money BMM− short (long-term liability of MA)
25 See Gray (2007).
32
Sovereign Asset-at-Risk (SAaR) analysis evaluates investment strategies which, along
with other policies, keep the tail of the probability distribution of the sovereign asset port-
folio above a threshold for a given confidence level (e.g. 5% or 10%). The sovereign as-
set portfolio is the reserves, fiscal and other assets including the contingent liabilities. If
the sovereign debt structure of the country in question includes significant foreign-
currency denominated debt, there may be additional or complementary debt targets. For
example, a target for the expected loss associated with the foreign-currency debt (i.e. the
credit spread associated with the implicit put option) so as to try to achieve a specific tar-
get rating of, for example, 0.5% probability of default or less for a one year horizon. If
countries with large excess reserves do not have significant amounts of foreign-currency
debt the SAaR is the more relevant target than a default probability target. If the SAaR
exceeds the target threshold levels, policy makers can adjust various components of the
sovereign balance sheet to lower the risk, for example:
• Use fiscal, debt and other policies that change fiscal surplus, the amount and ma-turity of outstanding government local currency and foreign-currency debt. Use financial sector and other policies such as capital controls.
• Make changes in asset allocation of sovereign wealth funds with respect to the risks, volatility and covariance of the fund vis a vis other components of the sov-ereign balance sheet.
These strategies imply that the optimal composition of the investments in wealth
funds should take into account the risk profile of the sovereign.26 Consider four countries
with different economies and different risk profiles, such as China, Chile, Algeria, and
South Africa. China’s risk exposures are to higher oil and copper prices and to a slow-
down in the US consumer market. Chile’s risk exposures are to higher oil prices, lower
copper prices and to a sudden stop in capital flows. Algeria is at risk of lower oil prices.
South Africa is at risk of higher oil prices and lower prices of gold and other minerals.
The sovereigns have various exposures from tax revenues, expenditures, risks of banking
system crises, and to capital inflows and outflows. Should the asset allocation for the
26 The MFRisk™ models have been applied to numerous countries and use simulated shocks and policy adjustments to assess impact on risk indicators.
33
sovereign wealth portfolio for each of these countries be the same? Obviously not. Such
different risk exposures argue for viewing the asset allocation policy decision in an inte-
grated context including all the country’s exposures. Contingent claims analysis provides
a framework for assessing each economic sector’s assets and liabilities, which allows pol-
icy makers to take a holistic view when formulating asset policy decisions.
4.3 Applications of the sovereign CCA framework for design of new instruments to transfer risk and the “ART” of sovereign risk management.
The application of CCA to analyze risk exposures in the sectors of an economy
offers a rich framework for comparing alternative ways to control and transfer risk.
There are several benefits. First, CCA gives the interrelated values and risk exposure
measures across sectors. Understanding these values and risk exposures can help identify
particularly vulnerable situations and potential chain reactions of default. Identification
allows formulation of various alternative ways to control and transfer risk. Second, the
framework dovetails with risk-management strategies involving explicit derivatives and
swaps used by the private and public sectors to control, hedge or transfer risk.27 The field
of Alternative Risk Transfer (ART) includes a variety of instruments and contracts used
by firms, financial institutions, and insurance companies. Many of these tools and tech-
niques can be applied to transfer sovereign risk (directly or indirectly).
Risk can be controlled or transferred by a direct change in the financial structure
(the structure of assets and liabilities), by managing guarantees (i.e. policies to limit the
contingent liabilities to too-important-to-fail entities) or via risk transfer. This section
will explore how the framework described in the paper could lead to some potential new
ways to transfer sovereign risk and a way to value new risk transfer instruments or con-
tracts. This is the “ART” of sovereign and macro risk management.
In general, there are three ways to transfer risk, diversification, hedging and in-
surance. Risk concentration can be reduced by diversification to parties who have a
comparative advantage in bearing various risks. If the balance sheets of corporations and
27 One example, in Blejer and Schumacher (2000), includes the central bank balance sheet using forward contracts in currencies.
34
financial institutions are weak when the economy is weak – as it is generally the case –
then it is precisely when tax revenue is low, and the cost of debt service is high, which
contributes to higher sovereign risk. This observation offers a powerful argument for di-
versification of the sovereign exposure to local shocks.
The financial markets, especially in emerging markets, are often “incomplete”,
meaning that they provide only limited possibilities to shift risk across various entities
and groups. In such situations, diversification through international capital mobility is
the obvious alternative. The sovereign CCA framework could be used in conjunction
with diversification, hedging, or mitigation of sovereign risk in various ways:
• Diversification and Hedging Related to Management of Foreign Reserves – A sovereign holds foreign currency reserves, in part, to cushion against potential losses of the monetary authorities or government. CCA can be used to assess the costs of increasing reserves via issue of foreign debt, local-currency debt, money or contingent capital contracts against the benefits of having a cushion to mitigate losses.
• Contingent Reserves or Contingent Sovereign Capital – Corporations sometimes
contract for contingent equity or debt purchases triggered under pre-agreed condi-tions. Similarly, governments could make arrangements with external public or private sector entities for pre-agreed purchase of government local-currency debt under specific circumstances such as a sudden stop in capital flows or certain revenue losses, commodity price drops or natural disasters. The value of such contingent capital can be compared to the costs of increasing paid-in capital re-serves via debt issues. This macrofinance framework could be used to calculate value-at-risk for the sovereign balance sheet which would help determine the ap-propriate level of foreign currency reserves and contingent reserves or contingent sovereign capital.
• Sovereign Bonds with Special Features – GDP-linked bonds or bonds with spe-
cific roll-over clauses can help manage risk. Indexed bonds such as commodity-linked bonds linked to major exports such as oil or copper, or catastrophe bonds (CAT) and similar instruments.
• Diversification – Certain methods of diversifying, hedging and risk mitigation
provide benefits to other sectors and can have an indirect benefit for the sover-eign. Asset diversification in the banking sector could indirectly benefit the sov-ereign. A bank that invests part of its assets in domestic government bonds en-hances its exposure to local macro shocks; the value of government bonds will be low precisely when the value of the loan book is low. Therefore, in such econo-mies, banks should hedge the exposure of their loan book by investing in non-domestic assets—such as bonds.
35
• Equity Swaps as a Method of Diversifying Internationally – An equity swap
would enable a small country to diversify internationally without violating possi-ble restrictions on investing capital abroad. Suppose that small-country pension funds who already own the domestic equity were to enter into swaps with a global pension intermediary (GPI). In the swap, the total return per dollar on the small country’s stock market is exchanged annually for the total return per dollar on a market-value weighted-average of the world stock markets. The swap effectively transfers the risk of the small-country stock market to foreign investors and pro-vides the domestic investors with the risk-return pattern of a well-diversified world portfolio. Since there are no initial payments between parties, there are no initial capital flows in or out of the country. Subsequent payments, which may be either inflows or outflows, involve only the difference between the returns on the two stock market indices, and no “principal” amount flow. Equity swaps can be used to reduce a country’s risk of dependence on specific exports, for example Taiwan could reduce its dependence on electronics products. The Taiwanese government would pay returns on the world electronics portfolio in exchange for returns on another industry, say the automobile industry. Thus swaps are a way in which countries could focus on industries which they have a comparative advan-tage and still pursue efficient risk diversification. 28
Conclusions
The high cost of international economic and financial crises highlights the need for a comprehensive framework to assess the robustness of countries’ economic and fi-nancial systems. This paper proposes a new approach to measure, analyze, and manage sovereign risk based on the theory and practice of modern contingent claims analysis (CCA). We illustrate how to use CCA to model and measure sovereign risk exposures and analyze policies to offset their potentially harmful effects. The paper provides a new framework for adapting the CCA model to the sovereign balance sheet in a way that can help forecast credit spreads and evaluate credit and market risks for the sovereign and risks transferred from other sectors. This new framework is useful for assessing vulner-ability, policy analysis, sovereign credit risk analysis, sovereign capital structure, and de-sign of sovereign risk mitigation and control strategies. Applications of this framework for investors in three areas are discussed. First, CCA provides a new for valuing, invest-ing, and trading sovereign securities, including sovereign capital structure arbitrage. Second, it provides a new framework for sovereign asset and wealth management which is particularly applicable to the increasingly large sovereign wealth funds being created by many emerging market and resource rich countries. Third, the framework provides quantitative measures of sovereign risk exposures which allow for potential new ways of transferring sovereign risk. New instruments and risk transfer contracting arrangements can be developed using Alternative Risk Transfer (ART) tools applied to sovereign risk management.
28 See Merton (1999), (2005), Bodie and Merton (2002) and Draghi, Giavazzi, and Merton (2003).
36
Annex – Public Sector CCA Balance Sheet and its Calibration Using the Contingent Claims Approach
This Annex describes how the segregated contingent claim balance sheet of the
monetary authorities and the government can be combined and how the implied sover-eign assets and asset volatility can be calculated and risk indicators estimated.29 Useful insights can be obtained when one views relationship between the assets and liabilities of the public sector30 as separate balance sheets of the government and monetary authorities where there are cross-holdings and financial guarantees between these two public sector “partners.” Under this structure, the assets of the monetary authority include foreign re-serves, credit to the government and other claims.31 The liabilities of the monetary au-thority partner are base money and financial guarantees to the government, including guarantees to supply foreign currency to service the sovereign foreign-currency denomi-nated debt. The assets of the government partner include the net fiscal assets and other assets. Liabilities include credit to the monetary authority (and could include local-currency debt held by the monetary authority), local-currency debt held outside of the government and monetary authority, financial guarantees and foreign-currency denomi-nated debt.
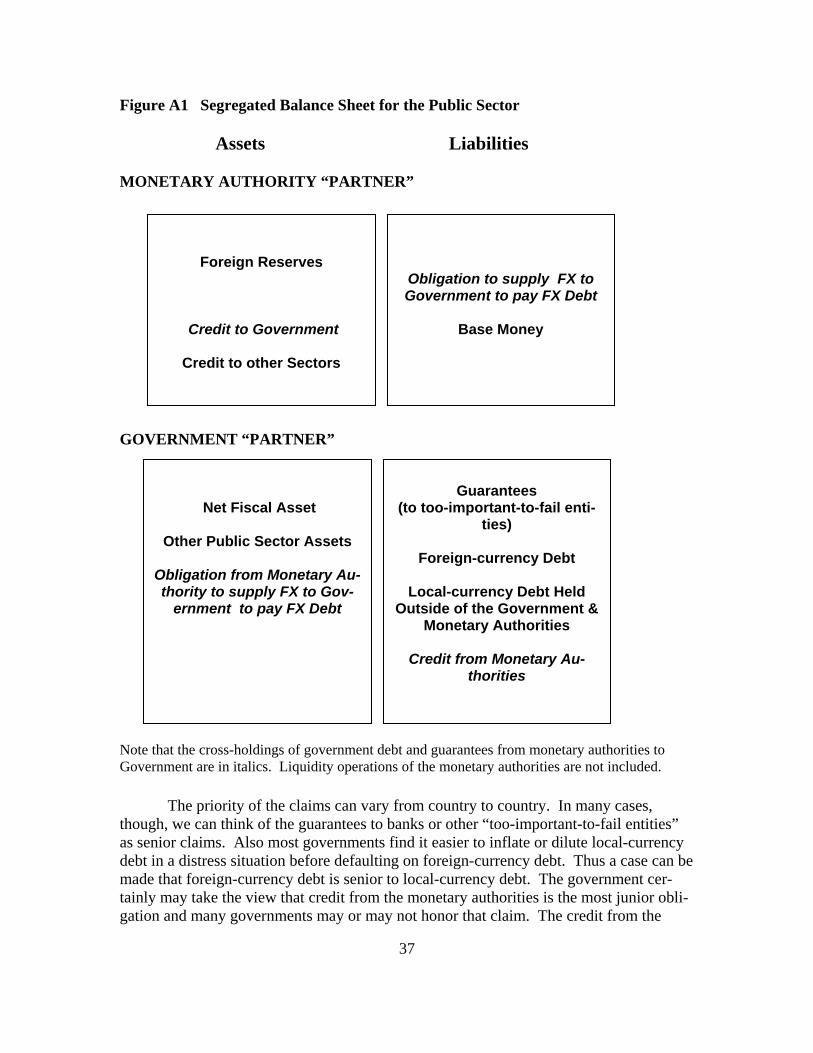
Figure A1 shows the structure of this segregated balance sheet. This simplified
framework is not meant to be a comprehensive catalogue of all the guarantees, the nature of which varies by country and by the detailed structure of the relationship between monetary authorities and the government. There also may be implicit financial support from the monetary authorities to the government via purchase of government local-currency debt under certain circumstances, but this is not shown here. The action of the monetary authority “partner” of buying additional government local-currency debt entails issue of additional base money. There are also “options,” that the government and the monetary authorities have to “default” on the obligations to convert local currency into foreign currency. Similarly the government could “forcibly” restructure local-currency debt or dictate “mandatory” purchases of government bonds by certain public or private institutions or inflate to cover potential shortfalls. Also, in some countries, banks may have deposits with the monetary authorities that receive a priority claim on foreign cur-rency reserves that is higher than that of holders of local currency, which could be junior to claims on foreign currency for payment of external foreign-currency debt.
29 See Gapen, Gray, Lim, Xiao, (2005). 30 See Buiter, W. (1993). 31 See Schaechter, A. (2001).
37
Figure A1 Segregated Balance Sheet for the Public Sector
Assets Liabilities MONETARY AUTHORITY “PARTNER”
GOVERNMENT “PARTNER”
Note that the cross-holdings of government debt and guarantees from monetary authorities to Government are in italics. Liquidity operations of the monetary authorities are not included.
The priority of the claims can vary from country to country. In many cases, though, we can think of the guarantees to banks or other “too-important-to-fail entities” as senior claims. Also most governments find it easier to inflate or dilute local-currency debt in a distress situation before defaulting on foreign-currency debt. Thus a case can be made that foreign-currency debt is senior to local-currency debt. The government cer-tainly may take the view that credit from the monetary authorities is the most junior obli-gation and many governments may or may not honor that claim. The credit from the
Net Fiscal Asset
Other Public Sector Assets
Obligation from Monetary Au-thority to supply FX to Gov-
ernment to pay FX Debt
Guarantees
(to too-important-to-fail enti-ties)
Foreign-currency Debt
Local-currency Debt Held
Outside of the Government & Monetary Authorities
Credit from Monetary Au-
thorities
Foreign Reserves
Credit to Government
Credit to other Sectors
Obligation to supply FX to Government to pay FX Debt
Base Money
38
monetary authorities is an asset on the side of the monetary authority partner and a liabil-ity of the government partner. Similarly, the financial guarantees to the government partner are an asset on its balance sheet and a liability of the monetary authority partner. When the balance sheets are combined these two items drop out. The segregated balance sheet above reduces to the combined balance sheet in Figure 3. Contingent claims ap-proach can be applied to the segregated or the combined balance sheets, the choice of which depends on the purposes of the analysis. The numeraire for the analysis is usually in a reserve or “hard” currency. In an emerging market country with a “soft” currency, the numeraire for the analysis is a “hard” reserve currency, e.g. US dollars. The distress barrier is related to the debt obligations in a “hard” currency. For developed economies with a “hard” currency the numeraire will be in the “hard” currency as well. If a devel-oped country has debt denominated in a “soft” currency it is not considered senior debt.
On the sovereign balance sheet, sovereign local-currency debt can be issued in
large amounts even it causes dilution in value. In this sense base money and local-currency debt are like “shares” on a sovereign balance sheet. Excessive issue of these “shares” can cause inflation and price changes similar to the case where excessive issue of corporate shares dilute existing holder’s claims and reduce the price per share on a corporate balance sheet. Foreign-currency denominated debt is traded and primarily held internationally. An important aspect of foreign-currency debt is that sovereigns can run out of “hard” currency to repay foreign debt but sovereigns can, in principle, print money and need not run out of local currency to pay local-currency debt. Local-currency debt can, in many cases, be considered subordinated debt on the CCA sovereign balance sheet. Governments are more likely to restructure or dilute or inflate domestic local-currency debt before defaulting on foreign-currency debt.32
When the analysis is done for a developing country sovereign, the liabilities on
the CCA balance sheet can be base money plus local-currency debt constituting a single liability. The exchange rate equals “one.” Volatility comes not from the exchange rate but from the changing quantities of base money and local-currency debt and volatility in the value of the local-currency debt as interest rates change. Foreign-currency debt would be included with the local-currency debt on equal priority, unless special circum-stances warrant.
32 See Gray and Malone, forthcoming.
39
References Allen, M., Rosenberg, C., Keller, C., Sester, B. and Roubini, N. (2002). “A Balance Sheet Approach to Financial Crisis.” IMF Working Paper 02/210. (Washington: International Monetary Fund).
Berndt, O. and de Melo, B. (2003). Capital Structure Arbitrage Strategies: Models, Prac-tice, and Empirical Evidence. Masters Thesis, School of HEC University of Lausanne, Switzerland.
Black, F. and Scholes M. (1973). “The Pricing of Options and Corporate Liabilities.” Journal of Political Economy, 81 (May-June): 637-54.
Blejer, M, and Schumacher L. (2000). “Central Banks Use of Derivatives and Other Con-tingent Liabilities: Analytical Issues and Policy Implications.” IMF Working Paper 00/66. (Washington: International Monetary Fund).
Bodie, Z. and Merton R. C. (1995). “ The Informational Role of Asset Prices: The Case of Implied Volatility.” In Chapter 6, Crane, D. B., K. A. Froot, S. P. Mason, A. F. Perold, R. C. Merton, Z. Bodie, E. R. Sirri, and P. Tufano. The Global Financial System: A Func-tional Perspective. Boston: Harvard Business School Press.
Bodie, Z. and Merton R. C. (2002). “International Pension Swaps.” Journal of Pension Economics and Finance, vol.1 (January).
Buiter, W. (1993). “Measurement of the Public Sector Deficit and Its Implications for Policy Evaluation and Design.” Chapter 14. In How to Measure the Fiscal Deficit, ed-ited by Blejer, M. and Cheasty, A. IMF. (Washington: International Monetary Fund).
CreditGrades (2002). CreditGrades Technical Document, RiskMetrics Group.
Crouhy, M., Galai D., and Mark R. (2000). Risk Management. New York: McGraw Hill.
Draghi, M., Giavazzi, F. and Merton R. C. (2003). Transparency, Risk Management and International Financial Fragility. Vol. 4, Geneva Reports on the World Economy. Inter-national Center for Monetary and Banking Studies. Eichengreen, B., Hausmann, R. and Panizza, U. (2002). "Original Sin: The Pain, the Mystery, and the Road to Redemption." Paper presented at Inter-American Development Bank conference, "Currency and Maturity Matchmaking: Redeeming Debt from Original Sin." Washington, November. Gapen, M., Gray, D., Lim, C. and Xiao, Y. (2004). “The Contingent Claims Approach to Corporate Vulnerability Analysis: Estimating Default Risk and Economy-Wide Risk Transfer.” IMF Working Paper 04/121 (Washington: International Monetary Fund).
Gapen, M., Gray, D., Lim, C. and Xiao, Y. (2005). “Measuring and Analyzing Sovereign Risk with Contingent Claims.” IMF Working Paper 05/155. (Washington: International Monetary Fund).
40
Gray, D. (2001). “Macro financial risk country report: Thailand, MFRISK™ and Macro Financial Risk Framework.” (Macro Financial Risk Framework – Patent Pending).
Gray, D. (2001). Presentations at Credit Risk Summit in NY and London in 2000; GARP Convention Presentation, February.
Gray, D. (2002). “Macro Finance: The Bigger Picture.” Risk Magazine, June.
Gray, D., Merton, R. C., Bodie, Z. (2002). “A New Framework for Analyzing and Man-aging Macrofinancial Risks.” New York University Conference on Finance and the Mac-roeconomy, October.
Gray, D. (2003). “Raise the Flags: Applying Risk Analysis Tools to Economies.” GARP Risk Review, Issue 11, March/April.
Gray, D. and Jones, M. (2006). Indonesia: Selected Issues Paper, Chapter III. “Measur-ing Sovereign and Banking Risk in Indonesia: An Application of the Contingent Claims Approach.” In IMF Country Report No. 06/318, August. (Washington: International Monetary Fund).
Gray, D., Merton, R. C., Bodie, Z. (2006). “A New Framework for Analyzing and Man-aging Macrofinancial Risks of an Economy,” NBER paper #12637 and Harvard Business School Working Paper #07-026, October.
Gray, D. (2007). “A New Framework for Sovereign Wealth Management.” In Sovereign Wealth Management, Central Banking Publications Ltd. (edited by Johnson-Calari, World Bank).
Gray, D., Lim, C., Malone, S. (forthcoming). “A New Debt Sustainability Framework: Incorporating Balance Sheets and Uncertainty.” IMF Working Paper. (Washington: In-ternational Monetary Fund).
Gray, D. and Samuel, M. (forthcoming). Macrofinancial Risk Analysis: A Framework for Integrating Finance and Risk Management with Macroeconomics, Wiley. Hull, J., Nelken, I. and White A. (2004). “Merton’s Model, Credit Risk and Volatility Skews.” Journal of Credit Risk Vol 1, No 1. IMF, (2006). Global Financial Stability Report. Box 3.6 page 120.
Jain, S. (2005). Credit and Market Risk Arbitrage. Second Edition, ISBN 1-4116-2105-0
KMV Corporation, (1999).“Modeling Default Risk.” Moody’s KMV.
Merton, R. C. (1973). “Theory of Rational Option Pricing.” Bell Journal of Economics and Management Science, 4 (Spring): 141-83.(Chapter 8 in Continuous-Time Finance)
Merton, R. C. (1974). “On the Pricing of Corporate Debt: The Risk Structure of Interest Rates.” Journal of Finance 29 (May), pp. 449-70. (Chapter12 in Continuous-Time Fi-nance).
41
Merton, R. C. (1977). "An Analytic Derivation of the Cost of Loan Guarantees and De-posit Insurance: An Application of Modern Option Pricing Theory." Journal of Banking and Finance 1 (June), pp. 3-11 (Chapter 19 in Continuous-Time Finance).
Merton, R. C. (1992). Continuous-Time Finance. Oxford, U.K.: Basil Blackwell, (Rev. ed.).
Merton, R.C. (1998). “Applications of Option-Pricing Theory: Twenty-Five Years Later.” Les Prix Nobel 1997, Stockholm: Nobel Foundation; reprinted in American Eco-nomic Review, (June): 323-349.
Merton, R.C. (1999). "Commentary: Finance Theory and the Shift to Integration." Risk, (July), P. 50.
Merton, R. C. (2002). "Future Possibilities in Finance Theory and Finance Practice." In Mathematical Finance – Bachelier Congress 2000, edited by H.Geman, D. Madan, S. Pliska and T. Vorst. Berlin Springer-Verlag.
Merton, R.C. (2005). "Swapping Your Country's Risks." Breakthrough Ideas for 2005. Harvard Business Review 83, no. 2 (February).
Merton, R.C., Bodie, Z. (1992). "On the Management of Financial Guarantees." Finan-cial Management, 21 (Winter): 87-109.
Pettis, M. (2001). The Volatility Machine. Oxford University Press, Oxford.
Schaechter, A. (2001). “Implementation of Monetary Policy and the Central Bank’s Bal-ance Sheet.” IMF Working Paper 01/149. (Washington: International Monetary Fund).
Sims, C. (1999). “Domestic Currency Denominated Government Debt as Equity in the Primary Surplus.” Paper presented at the Latin American meetings of the Econometric Society, Cancun, Mexico. August.
Stamicar, R.and Finger, C. (2005). “Incorporating Equity Options into the CreditGrades Model.” RiskMetrics Group.
Toft, K. (2003). “Implementing Cross Market Relative Value Trades.” Presentation at Boston RISK Conference.
Xu, D., and Ghezzi, P. (2002). “From Fundamentals to Spreads: A Fair Spread Model for High Yield Emerging Market Sovereigns.” Global Markets Research, Deutsche Bank. -------------------------------------------------------------------------------------------------------- Dale Gray is President of MF Risk, Inc. and Sr. Risk Expert for the IMF Monetary and Capital Markets Department. (The views expressed in this paper are those of the authors and should not be attributed to the International Monetary Fund, its Executive Directors, or its Management.) MFRisk board members include Robert C. Merton and Zvi Bodie. Contact information for Dale Gray is email [email protected] or [email protected]. Contact information for Robert C. Merton is www.people.hbs.edu/rmerton/ and Zvi Bodie is [email protected].

42
The authors would like to thank Carlos Medeiros, Michael Gapen, Yingbin Xiao, Cheng Hoon Lim, Matt Jones, Sam Malone, and Joe Zou, for useful discussions and comments on the ideas presented in the paper.