Embed Size (px)
Citation preview
Continued Development of Earthquake Load and
Resistance Factor Design Guidelines
Report 2
Seismic Hazard Characterizations
Report to
STATOIL and UNOCAL
Stavanger Norway and
Houston Texas
by
Professor Robert Bea
Marine Technology amp Management Group
Department of Civil amp Environmental Engineering
University of California at Berkeley
May 1998
I
Continued Development of Earthquake Load and
Resistance Factor Design Guidelines
Report 2
Seismic Hazard Characterizations
by
Professor Robert Bea
Marine Technology amp Management Group
Department of Civil amp Environmental Engineering
University of California at Berkeley
May 1998
this page left blank intentionally
Chapter Page
1 Introduction 1
10 Objectives 1 11 Background 1 12 Earthquake LRFD Approach 2 13 RAM Based ISO Earthquake Guidelines 6
2 Earthquake Hazard Zones amp Uncertainties 11
20 Introduction 11 21 UK Sector North Sea 11 22 Norwegian Sector North Sea14 23 Japan 16 24 Indonesia 18 25 Mexico 2 1
3 Strength Level Earthquake Response Spectra 2 5
30 Introduction 2 5 31 Response Spectra Ordinatesbull2 5 32 Vertical Response Spectra Ordinates 2 6 33 Computed Response Spectra 2 9 34 North Sea Response Spectra 31 35 Bay of Campeche Response Spectra35
4 Summary Conclusions amp Acknowledgments 3 7
40 Summary3 7 41 Conclusions 3 8 42 Acknowledgments3 8
References 3 9
this page left blank intentionally
ii
Introduction
10 Objective The objective of this study is to continue development of earthquake load and resistance factor
design (LRFD) guidelines as follows
Part 1) concrete gravity based structure (GBS) LRFD guidelines (sponsored by Health and Safety Executive)
Part 2) seismic hazard characterizations (sponsored by STATOIL and UNOCAL) and
Part 3) verification of guidelines (sponsored by U S Minerals Management Service)
This report summarizes the results of the second part of this study seismic hazard characterizations Two primary topics are addressed
a) seismic zonation and uncertainties of the UK and Norwegian Sectors of the North Sea offshore Japan and Indonesia and the Bay of Campeche Mexico and
b) Strength Level Earthquake (SLE) elastic response spectra
11 Background A first-generation LRFD ISO guideline for design of steel pile supported template-type platforms
to resist earthquake induced loading has been developed (Bea 1991 1997a) This guideline was based on the API RP 2A LRFD guideline and on the collective experience and judgment of the ISO PS committee members During the first generation developments limited verification studies of the entire process were performed there was limited documentation of the background for some of the key developments and there were additional topics that needed to be addressed These topics have been discussed and the PS committee recommended that additional studies be conducted on the two topics cited above
The report titled Continued Development of Earthquake Load and Resistance Factor Design Guidelines Report 1 - Concrete Gravity Base Structures LRFD Guidelines documented the results of the first phase of this study (Bea 1998)
This study was organized as follows
bull obtain recent background on seismic hazard characterizations
bull detail seismic exposure uncertainties and local site response uncertainties
bull reconcile differences between current ISO seismic hazard guidelines and those developed during this study
bull document the revised seismic hazard and response spectra characterizations in a project technical report (Report 2)
1
1 2 Earthquake LRFD Approach The LRFD approach used to develop the proposed ISO earthquake design guidelines can be
expressed analytically as follows
ltPE RE~ YDI D1 + Yoz Dz+ Yu L1 +YE E
where ltPE is the resistance factor for earthquake loadings RE is the design capacity of the platform element (eg brace joint pile) for earthquake loadings as defined by the API RP 2A - LRFD
guidelines yDI is the self-weight of the structure (dead) loading factor D1 is the design dead loading
Yoz is the imposed equipment and other objects loading factor Dz is the design equipment loading Yu
is the consumables supplies and vessel fluids (live) loading factor L1 is the live loading YE is the earthquake loading factor and E is the earthquake loading effect developed in the structure or foundation element This development addresses the definition of the resistance factors ltPE and the
loading factors YE for loadings induced by earthquakes (Bea l 997a) The dead equipment and live
loading factors are set as y01 = Y02 =Yu = I I
The earthquake loading factor is determined using a Lognormal format (Bea 1991)
YE = Fe B exp (08 PE crE - 257 crE)
where Fe is the median effective loading factor B is the median bias (actual I nominal) in the
computed earthquake loadings PE is the annual Safety Index designated for the platform SSL crE is the total uncertainty associated with the earthquake loadings (standard deviation of the annual maximum earthquake loading) 08 is the splitting factor used to separate the uncertainties in earthquake loadings and platform capacities and the 257 is a consequence of defining the elastic design earthquake (Strength Level Earthquake) at an average return period of 200-years (257 Standard Normal deviations from the mean)
The effective loading factor for the platform system is expressed as
Fe= [microa r 1
where micro is the platform system ductility and a is the platform residual strength ratio
micro = dp de
a=AI Aep
dp is the maximum plastic displacement that can be developed by the platform system at failure de is the displacement at which first significant nonlinear behavior is indicated by the platform system A is the area under the platform loading - displacement to failure diagram and Aep is the area under an equivalent elasto-plastic platform loading - displacement to failure diagram
The total uncertainty associated with the earthquake loadings ( crE) is expressed as
where cr5E is the uncertainty in the earthquake horizontal peak ground accelerations is thecr05 uncertainty related to the local geology and soil conditions and their effects on the ordinates of the earthquake response spectra and crbulls is the uncertainty associated with the response spectrum method used to determine forces in the elements that comprise the platform
2
In development of the proposed ISO earthquake guidelines Type I (natural inherent aleatory) uncertainties are included in cr The effects of Type II (model parameter state epistemic) uncertainties are introduced with the Biases (actual value I nominal value) in loading effects and capacities This is done to develop as close as possible a correlation with the way in which the target Safety Indices and probabilities of failure were determined
The platform element resistance factor is determined from
ltlgtE = BRE exp (-08 ~E ltJRE )
where BRE is the median bias (actual value I nominal or code value) in the element earthquake loading capacity and is the crRE uncertainty in the earthquake loading capacity of the element
The proposed ISO earthquake LRFD approach proceeds through the following nine steps (Bea 1997a)
I Define the structure safety and serviceability level (SSL)
2 Define the earthquake hazard zone (EHZ) and seismotectonic conditions (Fig 121)
3 Determine if site specific seismic exposure study is required (Table 121)
4 Define the shape of the normalized mean elastic principal horizontal acceleration response spectrum for a specified damping ratio soil profile and seismotectonic condition (Fig 122 Table 122)
5 Determine the uncertainties associated with the seismic exposure response spectrum and the methods used to analyze earthquake forces induced in the structure (Table 123 Table 124)
6 Determine the earthquake loading factor ltYE) for the elastic response spectra forces
7 Evaluate the biases and uncertainties in the platform element design capacities
8 Determine if a ductility analysis is required and the performance characteristics for the analyses
9 Determine the platform element resistance factors (ltjgtE) for the design code based capacities
The remainder of this report will summarize the study of seismic hazard characterizations (Steps 2 and 5) based on results from recent studies and local site response spectra characterizations (Steps 4 and 5) In the context of the loading and resistance factor formulation summarized in Eqn ( 1) through (7) the key issues included in this study were
- the peak horizontal ground acceleration at a return period of 200 years (Fig 121) bull G200
crE - the uncertainty associated with the seismic environment
bull ltJas - the uncertainty related to the local geology and soil conditions and their effects on the ordinates of the earthquake response spectra and
bull Sa I G vs T - the shape of the normalized SLE horizontal acceleration response spectrum for a specified damping ratio of D = 5 (Fig 122)
3
Fig 121 middot Proposed ISO Earthquake Hazard Zones (EHZ)
Sa G
(log scale)
10
middot 005 0125
Period T sec (log scale)
Fig 122 bull Proposed ISO Strength Level Earthquake Normalized Elastic Horizontal Acceleration Response Spectrum
4
Zone SLE G SSL 1 SSL 2 SSL 3 SSL 4 (1) g (3) (4) (5) (6)
2
Should 0 0-5 Allowed
1 5 -15 to use
2 15 -25 these
3 25 -35 guidelines
4 35-45
5 45 -55
Table 121 - Proposed ISO Earthquake Hazard Zones SLE Ground Accelerations (G) and Structural Serviceability amp Safety Levels (SSL)
Table 122 - Proposed Local Geology and Soil Conditions Parameter and Seismotectonic Characteristics Parameter E
Soil Conditions ( 11
SC - A Rock (Vs ~ 2500 fps)
SC - 8 Stiff to very stiff soils gravels (Vs = 1200 to 2500 fps)
SC - C Sands silts and very stiff clays (Vs= 600 to 1200 fps)
SC - D Soft to medium stiff clays (H = 10 to 200 ft Vs s 600 fps)
SC - E Site specific studies required
I
10
12
14
20
Seismotectonic Condit 121
Type A Shallow crustal faulting zones
Type 8 Deep subduction zones
Type C Mixed shallow crustal amp deep
subduction zones
Type D lntraplate zones
Default value
ions
E
10
08
09
08
10
5
Table 123 Seismic sources and
attenuation uncertainties
Table 124 Uncertainties associated with
local geology and soil conditions
Seismotectonic Characteristics
Shallow crustal fault zones
Deep subduction zones
Mixed shallow crustal fault and deep subduction zones
Intraplate zones
OsE
10
14
12
20
Geology Soil Conditions
-A
SC - B SC - C
SC - D
SC - E
OGs
030
040
040
050
050
13 RAM Based ISO Earthquake Guidelines
The approach used to develop the ISO earthquake guidelines for design and requalification are based on a Risk Assessment and Management (RAM) approach in which the seismic conditions are integrated with the performance characteristics of alternative platform configurations to define the reliabilities and risks associated with these configurations The earthquake design and requalification criteria are the basic product ofa desired reliability ofthe platforms
This is a very different approach than has been used traditionally to specify earthquake criteria for onshore facilities Traditionally earthquake criteria has been the result of two generally uncoordinated developments The first development came from geologists seismologists and earthquake engineers They were responsible for the characterization of the earthquake excitation that would be used for design of structures The basis for their characterization was some earthquake return period Often this was based on specification of a life of the structure and an acceptable probability of exceedance For example buildings were often designed for a 50 year life with a 10 percent probability of exceedance This is equivalent to design of the structure for an earthquake that has a return period of about 4 75 years The seismologists would then define design earthquakes that would be representative of the different types of earthquakes that could be experienced Representative earthquake time histories and elastic response spectra were often used for this definition
The second development came from structure design engineers They were responsible for the determination of how the structures would be configured and designed They defined the factors of safety that would be used in design of the structures Often the design procedures and factors of safety were the result of past of experiences with the performance of buildings that had experienced intense earthquake excitations If the performance of components in buildings proved to be
6
insufficient the configurations procedures and factors of safety were changed to improve the performance
The RAM procedure used in development of the ISO earthquake guidelines is based on an integration of the two developments and is focused on the reliability of the resulting structure In this instance the earthquake design spectra and design procedures are intimately related The design spectra characteristics are a direct consequence of the defined reliability and the procedures and processes that are used to configure and proportion the structure This point can be illustrated by the following RAM based equation to define the design elastic horizontal response spectra ordinate (Sa0 )
for a structure that has a given natural period (Tn) and damping ratio (D) (Fig 122)
Sa0 = (Ru50 I Fe M) (BRu I BFQ ) exp (~Q ltJQ - Z0 crFQ)
Ruso is the median static ultimate lateral loading capacity of the structure Fe is the factor that recognizes the combination of the transient earthquake induced loadings and the nonlinear hysteretic performance characteristics of the structure M is the total effective mass of the structure including the structure live and dead masses and hydrodynamic masses (often the total mass of an offshore structure is 50 to 70 hydrodynamic mass) ~Q is the design Safety Index for the structure
(directly related to the structure reliability or its compliment the probability of failure) crQ is the total uncertainty in the structure capacity and the earthquake induced loadings (square root of the sum of the squares of the standard deviations of the logarithms of the structure capacity and earthquake loadings)
Z0 is a factor that depends on the return period that is used to define the design earthquake often this is taken to be a 100-year or 200-year condition for elastic working stress or load and resistance factor design formats for 100-year and 200-year return periods Zo =233 and Zo =257 respectively (this is the number of standard deviations from the mean to the 99-th and 995-th
percentiles respectively) crFQ is the uncertainty in the earthquake loadings induced in the structure BRu is the median bias in the structure ultimate capacity (best estimate or true value divided by nominal or predicted value) BQ is the median bias in the earthquake induced loadings (demands) If unbiased estimates are used to determine the earthquake loadings and structure capacities the biases are unity
The factors Tn D Rus0 Fe and M are fundamentally structural design factors that depend on the structure materials configuration and proportioning ~Q is a derivative of the desired or accepted
reliability of the structure crFQ is a derivative of how the structure responds to the earthquake (induced loadings or forces) and the long-term uncertainty in the earthquake ground accelerations The total uncertainty crQ reflects the uncertainties in both the structure capacity and the earthquake induced
loadings It should be apparent that the spectral acceleration is a direct product of structure and reliability considerations and can not or should not be developed or defined in isolation of these considerations
In the long period range (Tn ~ = I sec) the spectral acceleration can be expressed as
Sa0 = (KE 1J1 I Tn) G0
7
K expresses the number of standard deviations of the response spectra ordinate from the mean value If other than the mean value is used (K = I) then the bias in the earthquake loadings must be recognized e is a factor that depends on the seismotectonic (earthquake sources) environment (for
strike slip sources e 10 and for subduction zone sources E 08) lj1 is a factor that depends on the
local geology and soil conditions (ljl 18 for deep soft alluvium and lj1 = 08 for rock or very strong sedimentary formations) 0 0 is the design ground acceleration that is defined at the specified return period It is apparent that the majority of these factors are those that should be determined by the earthquake engineer or geo-seismologist
Based on the RAM approach the design or requalification spectrum (Sa vs Tn) is dependent on an explicit and integrated evaluation of the following categories of factors
I) characteristics of and uncertainties in the seismic - tectonic - geologic earthquake conditions (expressed with G ljf E BQ crFQ)
2) characteristics of and uncertainties in the seismic performance characteristics of the structure and the associated process used to design or requalify the structure (expressed with Ru Tn D Fe M Z0 K crRu B) and
3) the target reliability for the structure (expressed with~)
The foregoing RAM based development results in an intimate integration of
1) managements direction regarding acceptable or desirable reliability of a structure
2) input from the earthquake engineer or geo-seismologist and
3) input from the structure design engineer
In this context the design conditions or design spectra can not and should not be developed in isolation by the earthquake engineer or geo-seismologist Many of the earthquake and structure parameters involved in the RAM are highly coupled they can not and should not be separated for examplethe loads induced in the structure by earthquake ground motions are a direct function of the characteristics of the structure
It is important to recognize that the RAM based earthquake spectrum that is used to design or requalify a structure explicitly incorporates the uncertainties in the seismic environment For example even though a mean spectrum is used in the specification given to the engineer the potential for ground motions that are much larger or more intense are directly recognized in the uncertainties attributed to the mean spectral ordinates One should not be unduly concerned when peaks in some response spectra exceed the design or requalification spectrum The uncertainties in the ground motions have a direct impact on the factors of safety and Reserve Strength Ratios that are specified for a particular structure More uncertainty leads to larger factors of safety and Reserve Strength Ratios
8
There are four major parts to the seismic exposure models used to characterize earthquake ground motions (Fig 131)
1) characterization of the seismic sources
2) characterization of the transmission of earthquake energy from the sources to the site
3) characterization of the local geology and geotechnical effects on the free-field motions of the soils and
4) description of the soil-structure interactions that develop during the earthquakes (near-field motion characterizations)
For pile supported platforms the pile foundations supporting the platforms receive their input energy from earthquakes from two distinctly different points in the soil column The input of lateral energy occurs below the sea floor where the maximum lateral earth pressures can be generated on the piles (Fig 132) Generally this point is located at five (stiff soils) to ten (soft soils) pile diameters below the sea floor Frequently the seismic exposure characterizations are developed for the level of the sea floor This is not appropriate for pile supported offshore structures This can be appropriate for mat supported structures that receive the majority of their support from the soils in the immediate vicinity of the sea floor The error introduced by the sea floor reference for the earthquake characteristics will be dependent on the soil profile and soil characteristics If there is a substantial layer of soft clays or soils overlying the stronger soils then the bias introduced by the sea floor reference can be very large (15 to 20)
The input of vertical energy for pile supported offshore platforms occurs at the point along the pile where the soil - pile shaft
SOILmiddot PILE INTERACTION
llllllllll
TRANSMISSION AT TE NUA T ION
EARTHQUAKE SOURCE
Fie 131 - Primarv Comoonents of PIP mal
0 oi-----oi2=---~-o4---~--ors~~-oie-~-lmiddotc gt 12 IN
SOltL-PILE 8
~ 40~~~+-~~middot~~~-P~-+--=~~
Fig 132 - Earthquake Effects on Pile Foundation Lateral Soil Pressures
9
shears are maximized This is generally along the bottom one-third of the pile shaft This can be a depth below the sea floor of I 00 m or more Because most attenuation relations are developed for onshore conditions and recorded earthquakes where there is a dramatic change in the impedance ratio at the earth surface and hence large reflections of the vertically propagating compression earth waves these attenuation relations incorporate these reflections and shallow effects Offshore at the sea floor there is no dramatic change in impedance for vertically propagating compression waves at the sea floor (saturated sediments interface with the water column) Thus attenuation relations for onshore conditions generally tend to dramatically overestimate the vertical motions at the sea floor This can be important for mat-supported offshore structures It is also important for pile supported platforms whose vertical motion characteristics are based on measured data from onshore surface locations
10
Earthquake Hazard Zones amp Uncertainties
20 Introduction During this study access was obtained to recent earthquake hazard exposure studies from the
following regions
bull UK Sector North Sea
bullNorwegian Sector North Sea
bullJapan
bullIndonesia
bullMexico
This Chapter summarizes the results from these studies as they pertained to the characterization of the seismic zones the design SLE horizontal ground accelerations and the uncertainty associated with the seismic environments
The author contacted three firms known internationally for their expertise in seismic exposure assessments EQE International Dames amp Moore Consultants and Geomatrix Consultants The author was not able to obtain any significant information that could be used to revise the current ISO seismic zonation maps Uniformly the firms deg felt that this information was confidential since it had been developed for clients
2 1 UK Sector North Sea Based on the study performed by EQE 55
International (1998) Fig 211 shows the Magnitudes and epicenters of earthquakes that have affected the North Sea area during the period from 1904 through 1990 There have been 7 earthquakes having magnitudes greater than M = 5 during this period
Based on the seismotectonics of this region EQE developed two zonation models one with 38 area zones and the second with 26 area zones The historic seismicity was associated with these zonation models an attenuation characterization
bull
bullbull bull
bull bull bull
0 LONGITUDE f
MAGNITUDESmiddot bull 5 bull 4 bull 3
based on an synthesis of attenuation models appropriate for the seismotectonic characteristics Fig 211 - UK Sector Historic of this area and peak ground accelerations (PGA) Earthquake Epicenters and Magnitudes
11
56
-10middot bull bullbull bullbull --shycontoura (rnta2) for shy eXCMdanct ~dM-3
middot10 bullbull 62
ID
56 56
$4 54middot I
$2 52
______ ~tomiddot -amiddot bullbull bullbull
Fig 212 middot 200-Year Peak Ground Fig 213 middot 10000 Year Peak Ground Acceleration Contours Acceleration Contours
on rock or very hard soil determined The results are summarized in Fig 212 and Fig 213 for return periods of 200 years and 10000 years respectively Although not explicitly stated in this report it is presumed that these return periods incorporate the uncertainties associated with the attenuation relationships To be consistent with the definition of earthquake uncertainties used in the proposed ISO earthquake guidelines the uncertainty associated with the attenuation relationships need to be incorporated into the seismic hazard characterizations
Fig 212 could be used as a basis for an ISO micro-zonation map of the UK Sector of the North Sea The PGA generally range from 0015 g to 0030 g The current ISO guidelines for this region indicate a seismic zone of 1 with PGA = 005 g to 015 g The lower end of this range provides a conservative estimate of the Strength Level Earthquake (SLE) conditions for this region
Fig 214 summarizes the results from the EQE study in the form of the horizontal Peak Ground Accelerations (PGA) versus the average return periods for two locations one in the southern portion of the UK Sector (54 degrees north) and one in the northern portion (58 degrees north) These results can be used to determine the uncertainties associated with the earthquake ground motions In the proposed ISO guidelines the earthquake uricertainties in annual expected PGA are based on a Lognormal distribution that is fitted to the extreme values and expressed with the standard deviation of the logarithms of the expected annual maximum PGAs crE If it were desirable to base the fitted
12
025
1000 Return Period - years
Fig 214 - Peak Ground Accelerations for Southern and Northern Locations
Lognorrnal distribution on the 10000 year and 100 year return period PGAs the uncertainty could be found from
crsEmiddot = 072 In (G 10000 I G 100 )
For the southern location
crsEmiddot = 072 In (024 g I 0024 g) = 166
For the northern location
crsEmiddot =072 In (010 g I 0010 g) = 166
The proposed ISO guidelines suggest a value of crE = 20 for the intraplate seismotectonic characteristics of this region Again the proposed ISO guidelines provide a conservative estimate of the seismic exposure uncertainties
If it were desirable to base the characterization of the seismic exposure uncertainty on the I 0000 year and 1000 year PGAs then
crSE = 161 In (G 10000 JG 1000 )
Based on the results developed by EQE for the southern location
cr5E = 161 In (024 I 0085) = 167
and for the northern location
crsEmiddot =161 In (010 I 0035) =169
The seismic uncertainties are not sensitive to the extreme earthquake return periods used to fit the equivalent Lognorrnal distributions
13
72bull
70middot
eamiddot
eamiddot
[] 74bull --middot
72bull
64
82
64 eomiddot eomiddot
eamiddot 118
eamiddot 118
54bull amp4
22 Norwegian Sector North Sea Based on the study performed by
NORSAR and the Norwegian Geotechnical Institute (1998) Fig 221 summarizes the historic earthquake epicenters and magnitudes The zonations used in the seismic exposure analyses are also shown The NORSAR study shows that these earthquake epicenters are closely associated with faulting in the region Study of recent earthquake records shows that the majority of the earthquakes originate on reverse thrust faults characteristic of intraplate seismotectonic regions
The historic seismicity developed by NORSAR was associated with the zonations indicated in Fig 221 an attenuation characterization based on an synthesis of attenuation models appropriate for the seismotectonic characteristics of this area (calibrated with recordings from recent earthquakes) and peak ground accelerations (PGA) on rock determined The results are summarized in Fig 222 and Fig 223 for return periods of 100 years and 10000 years respectively
Site specific studies performed to determine the 100-year return period earthquake peak ground
Fig 221 - Norwegian Sector Earthquake acceleration can be converted to the Epicenters Magnitudes and Seismic Zonation200-year PGA (= G) with following
relationship
= G100 exp (024 crE)0 200
Fig 222 could be used as a basis for an ISO micro-zonation map of the UK Sector of the North Sea The 200-year PGA generally range from 0015 g to 008 g The current ISO guidelines for this region indicate a seismic zone of 1 with PGA = 005 g to 015 g The lower end of this range provides a conservative estimate of the Strength Level Earthquake (SLE) conditions for this region
Fig 224 summarizes the results from the NORSAR study in the form of the horizontal Peak Ground Accelerations (PGA) versus the average return periods for two locations one in the southern portion of the Norwegian Sector (62 degrees north) and one in the northern portion (66 degrees north) Based on the fitted Lognormal distribution to the 10000 year and 100 year return period PGAs the uncertainty for the southern location is
OsEmiddot =072 In (033 g I 0042 g) =148
14
For the northern location
cr5E = 0 72 In (027 g I 0027 g) = 166
80
Fig 222 middot 100-Year Peak Ground Acceleration Contours
Fig 223 middot 10000 Year Peak Ground Acceleration Contours
The proposed ISO guidelines suggest characteristics of this region This value provides a conservative estimate for this region
Basing the characterization of the seismic exposure uncertainty on the 10000 year and 1000 year PGAs then for the southern location
OsEmiddot = 161 ln (033 013) = 149
and for the northern location
OsEmiddot = 161 In (027 I 010) = 160
These values again are in excellent agreement with those based on the 100-year and 10000-year PGA
a value of crE = 20 for the intraplate seismotectonic
0 100 1000
Return Period - years
Fig 224 middot Peak Ground Accelerations for Southern and Northern Locations
15
104
23 Japan Fig 231 summarizes the
earthquake epicenters and magnitudes in the region surrounding Japan during the period 1885 through 1995 (Utsu 1982) The data set includes more than 500 seismic events having magnitudes greater than M -= 60 Attenuation relations for peak bedrock accelerations were based on results from a recent study of recorded earthquake motions in Japan (Nozu et al 1997) The standard deviation of the attenuation
relationship was found to be crnPGA = 062 This value characterizes the uncertainty associated with the attenuation relationship
Fig 232 summarizes the results of the seismic exposure study for the Yokohama Port (Nozu Iai 1997) The 20 largest peak bedrock accelerations are shown as a function of the return period The data are fitted with a Weibull distribution and with a Earthquake Hazard Study Lognormal distribution that is fitted to the tail of the Weibull distribution Similar fits were developed for a large number of coastal middot offshore sites and similar results developed
Based on these results a seismic hazard map for the peak bedrock acceleration having a 200 year return period was developed (Fig 233) The PGA range from 005 g to 050 g The proposed ISO seismic zonation for this area ranges from 2 to 5 and thus indicate PGA =015 to 025 g to PGA = 045 g to 055 g The proposed ISO guidelines provide a conservative estimate of the 200-year PGA An ISO Japan annex could be developed that would utilize the information shown in Fig 2 3 3 as the micro zonation map for coastal - offshore Japan
This study also developed a mapping of the standard deviation of the Lognorrnal peak bedrock acceleration distribution that considered both the variability in the Lognormal distribution for the expected PGA and the uncertainty in the attenuation relationship (Fig 234) The results indicated standard
1885-1995 A Mlt60 bull deg 0 f 0 60ltMlt65 middot~ 0
bull00 0 0 0 0
0 65ltMlt70 fgt bull degii ~ OO I
0 70ltMlt75 deg o AkitaPort o0 bull
o 75ltMlt80 8 deg e 80ltM
bull
bullbullbull Kobe Port
bull
bull
bull
bullbull ltP
Fig 231 bull Seismic Event Data Used in Japan
middotmiddotmiddot-middot-middotmiddotmiddotmiddot+middotmiddot
1o 10 10
Return Period [at)
Fig 232 bull Peak Bedrock Acceleration and Return Period at Yokohama Port
16
Fig 233 - 200 Year Bedrock PGA Fig 234 - Standard Deviation of Lognormal Expected Annual Maximum
PGA
deviations of the Lognormal peak bedrock accelerations distributions that ranged from cr5E = 08 to cr5E
= 10
The value suggested in the proposed ISO guidelines for the seismotectonic conditions in this region
is cr5E = 10 Thus the proposed ISO guidelines provide a conservative estimate of the uncertainties associated with the seismic exposure of this region
17
24 Indonesia The extreme condition
earthquakes offshore Indonesia are dominated by two principal seismic sources (Beca Carter Hollings amp Ferner Ltd 1979 Dames amp Moore 1992 Untung et al 1985) The major tectonic feature in the region is the Sunda Arc which Figure 241 - Locations Offshore Indonesia extends approximately 5600 km between the Andaman Islands in the northwest and the Banda Arc in the east This feature results from convergence and subduction of the Indo-Australian plate beneath the Southeast Asia plate
The Sunda Arc consists of three primary tooOE 110oe
segments the Sumatra segment (A-1 - A-5 Figure 241 ) the Sunda Strait segment (between A-1 - A-5 and G-1 - G-7 Figure 10
middot 100N
241) and the Java segment (G-1 - G-7 Figure 241) (Dames amp Moore 1992) The locations A-1 to G-1 lie along the northern edge of the Sunda Arc The locations A-5 to G-7 lie along the axis of the Sunda Arc 0
These locations represent the area of greatest seismic exposure
There have been several great (Magnitude in excess of 775) earthquakes recorded along the Sunda Arc during this century (Figure 242) More than 150 surface Magnitude 70 or greater earthquakes 1100E
have occurred along this Arc during this MAGNITUDES lt40 0
century (Beca Carter Hollings amp Ferner Ltd 1979) The majority of these earthquakes
so e 60 70
have had focal depths (Figure 243)
in excess of 70 km Figure 242 - Epicenters of Indonesian
Earthquakes 1900 - 1996 The second primary source of
earthquakes are shallow crustal faults that generally parallel the Sunda Arc (east - west) with some transform surface faulting that marks the north - south trending boundaries of the land masses (Figure 243) The majority of recorded shallow source (less than 70 km) earthquakes that have occurred during this century have occurred along the Sunda Arc zone Several hundred shallow focus earthquakes in the Magnitude range of 40 to 70 have occurred in this zone during this century In
bull
bullmiddotmiddotmiddot bull
18
the v1cm1ty of the area indicated as Raja (Dames and Moore 1990 Lamport 1992 Risk Engineering Inc 1992) in Fig 241 there have been in excess of 12 events with magnitudes between 50 and 70 during the past century (Figure 244)
Figure 245 summarizes a proposed seismic zonation for offshore Indonesia (Bea l 997b) The zone designations are associated with the 200-year peak ground accelerations at the sites as follows
Zone I G = 005g to 015 g
Zone 2 G =015g to 025g
Zone 3 G = 025g to 035 g
These seismic zonations are consistent with those contained in the proposed ISO seismic guidelines
North -SOO -400 -300 -200 -100 0 100 200 300 400
South
0
100
200
300
400
~ 3 500
~ 600
700
800
(gt 0
CXJ) coo 0 ltli)
0
0
o~ bull
0
0 0 ~ltJOO
(J 0
MAGNITUDES lt40 0
50 0
60 8 70
900--~~~~~~~~~~~~~~~~~~
Figure 243 - Hypocentral Profile of Java Central Segment Normal to Sunda Arc - Earthquakes 1900 shy
1996
In some areas site specific studies have been performed to determine the 100-year return period earthquake peak ground acceleration To convert the 100-year G to the 200-year G the following relationship can be used
G200 = G100 exp (024 crE)
where OsE is the uncertainty in the long-term distribution of G (assumed to be Lognormally distributed)
Based on the results from the recent studies of extreme earthquake conditions that have been performed in this area Figure 246 summarizes the expected annual maximum peak ground accelerations (Gm) for the locations shown in Figure 241 The expected peak ground accelerations having return periods of 100 years at the locations ranges from 010 g to 012g (Gl Al) to 017 g to 022 g (G7 -A5)
bull J011lt40 O 4011lt4IS0 _ _ D SISllltS4
0 1bullMlt72
D 72111lt10
oeow
Figure 244 - Earthquake Sources and Magnitudes in Kalimantan Region
19
I
Figure 245 - Seismic Zonation for Offshore Indonesia
The uncertainties (natural variabilities) in the expected annual earthquake peak ground accelerations (Gm) range from crsE = 060 to 070 (A-1 A-5 G-1 G-5) to crsE = 18 to 20 (Raja) These values are consistent with the proposed ISO guidelines for this region and seismotectonic conditions
The available regional and site specific information on earthquake conditions indicates that there are two general categories of Type I uncertainties associated with the primary seismic sources The first category is associated with those locations that are adjacent to the Sunda Arc These locations very frequently experience earthquakes from both shallow and deep sources (Fig 243) Those locations have Type I uncertainties in the expected annual earthquake peak ground accelerations that range from crsE = 060 to 070
The second category of locations is 111
associated with those locations that are middotm 06~~ distant from the Sunda Arc These c locations much more infrequently ~
Iexperience earthquakes primarily from 111 01~~=1 shallow sources These locations have fi
-A-1Type I uncertainties in the expected ~ - bullA-5 --bullG-1annual earthquake peak ground ~ -G-7
accelerations that range from crsE = s bullbullbullbullbullRaiae
180 to 200 (Raja) ~ 001 100 1000 10 4
fl Average Return Period - years
Figure 246 - Expected Annual Maximum Earthquake Peak Ground Accelerations at Study
Locations
20
25 Bay of Campeche Mexico The information on earthquake seismic
100hazard characteristics for the Bay of bullbullbull Campeche Mexico was provided by Chavez (1987 1997a 1997b 1998) Additional information on the earthquake characterization was provided by Guerra and Esteva ( 1978) and Guzman ( 1982)
The seismic environment is influenced by three primary types of earthquake sources (Figure 251) The Type 1 source is associated with the subduction zone on the western Pacific coast of Mexico The earthquakes in this zone occur at depths of 15 km to 20 Km and have magnitudes up to M = 8 2 The Type 2 source is associated
EXPLANATIONwith the lithospheric slab within the central Tectonostratigraphic province boundaryportion of Mexico Earthquakes occur in
0 300km ~this zone at depths of 60 km to 250 km and Thrust taubull teeth on upper plate
have magnitudes up to M = 75 The Type Plate moliona rates in cnvyr -3 source occur in the Trans-Mexican volcanic belt located primarily along the east coast of Mexico have depths up to 20
CMbull C-Muatt CaP c-n Piiie CoP bull Cocoo Plate CTbullkm and magnitudes up to M = 67 (Chavez Caymmn Traugh MATbull Middle Atllrtic Trench MFZ bull Mot1QU8 Faull Zone 1987 1998) MSG bull Mlcl1oaean SMmic Gap NOAM bull -h American Piiie OFZ bull Orozco
Fracture Zone Ind ndgn SCbull ~a-ptOYince SMQCP bull Sietra Madre OrierltllmiddotChipu P116n ptOYince TRbull Tehuamepec Ridge TSG bull
The historic catalog of earthquake Tlhuon--Gap
occurrences during the period 1970 - 1996 Figure 251 - Bay of Campeche Earthquake
NOAM
SC I
I I
I
I Campeche Bay
I I
lt~
MAT
CoP
were used by Chavez to determine the activity rates in each of the three sources and the occurrences of varying
2400earthquake intensities and magnitudes in each of the 2300
three sources Figure 252 0 2200shows the seismic events that 0 8
have occurred in this region 0 2100 0during the period 1800 to bull
20001996 for all earthquakes that 0
1900have surface magnitudes (Ms) greater than M = 50 The 1800
majority of records contained 1700in this catalog date from the
1930s when reasonably 1600
comprehensive teleseismic 1SOO
instrumentation was in place The largest earthquakes 1400
that have occurred in the ~v1c1rnty of the Bay of ~
Campeche are in the range of M = 30 to M = 40 The
Plate Tectonics and Sources
+ + + + + + + + + + + +
+ + + + + + + + ++ + +
+ + + + + + + + + + + +
0 + + +
+
+
+
+
degamp + + + + + + + + + + +
o +
0 +
~ ~ 8 8 8 ~ ~ ~ ~ ~ N ~ ~
~ 0~ bull bull ~ bull ~ bull ~ ~ bull
2400
Z300
2200
2100
2000
1900
1800
1700
1600
IS00
1400
~ bull
Figure 252 bull Seismic Events Affecting the Bay oflargest earthquake that has Campeche Region 1800-1996 Events M gt 50
21
occurred during the past 100 years within a 100 km radius of the Bay of Carnpeche is M = 60 The vast majority of the seismic activity is concentrated along the Pacific coast of Mexico The source of nearby large earthquakes are associated with the Motagua Fault Zone and the fault system (Sierra Madre Oriental-Chipas Peten province) that generally parallels the east coast of Mexico There are no major seismic sources that have been identified within the Sigsbee-Carnpeche province that underlies the Bay of Carnpeche
Based on previous analyses of pile supported platforms subjected to earthquake excitations in soil columns of the Bay of Carnpeche a depth below the sea floor of -12 m was chosen to reference the lateral accelerations and a depth of -115 m was chosen to reference the vertical accelerations from the seismic exposure analyses (Bea 1997c)
Figure 253 summarizes the results for the Bay of Carnpeche for each of the three seismic sources A mean or average value for the four representative soil columns studied by Chavez (1997a) are shown The Type 2 and Type 3 sources develops ground motions that dominate the seismic exposure in the Bay of Carnpeche At an average return period of 10000 years the indicated peak horizontal ground acceleration (Am) is indicated to be Am~ 025 g Table 25 l summarizes the ground motions at return periods of 200 and 4000 years and the uncertainties (natural or Type I aleatory) associated with the ground motions (expressed as the standard deviation of the logarithms of expected annual G
QISE)
-CE CCI iObull -shyCJ _UI 01
iii Cl -ccI
2omiddot = o ca z G lo ii ca u GI U 0 ct
001
-shy--
- - - - - shy - - - -
bullbullbull-Zona 1 -zona2 --bullZona 3
-shy---shybullmiddotmiddotmiddotmiddot -shy__- --middot~middotmiddotmiddotmiddot
-
~ -shy middotmiddotmiddotmiddotmiddotmiddot
middotbullmiddotmiddotbullmiddotbullmiddotmiddotmiddotmiddotmiddotmiddot middotmiddotmiddotmiddotmiddotmiddotmiddotmiddotmiddotmiddotmiddotbullmiddot - - middotbullbullbullbullbull ~
41000 10
Return Period - Years
Figure 253 middot Peak horizontal ground accelerations
Table 251 middot Mean Horizontal PGA at Bay of Campeche sites (middot12m) and uncertainties of peak horizontal ground accelerations
Type 200 years shyg
1000 years -g
Uncertainty
QSE
I 12 16 058 2 50 78 084 3 27 68 175
22
These results can be compared with those developed by Guerra and Esteva ( 1978) for the Bay of Campeche and firm alluvium sites At a return period of 100 years the peak horizontal ground acceleration obtained by Guerra and Esteva is G = 66 g This compares with a maximum value of G =50 g obtained by Chavez (1998) for a 100 year return period for the Zone 2 sources The results developed by Guerra and Esteva indicate an uncertainty in the annual expected peak horizontal
ground acceleration of OsE = 126
The extensive Bay of Campeche seismic exposure study performed by Guzman ( 1982) provides some additional information on the expected ground motions At a return period of 100 years the peak horizontal ground acceleration obtained by Guzman is G = I 0 g This ground motion is more intense than developed by either Chavez or Guerra and Esteva The more intense ground motion appears to be coupled with the attenuation relationships that were developed and used by Guzman ( 1982) The results developed by Guzman indicate an uncertainty in the annual expected peak
horizontal ground acceleration of OsE = 097 This uncertainty is slightly greater than that of the Chavez results and somewhat less than indicated by the Guerra and Esteva results
The proposed ISO guidelines for this region indicate a 200-year PGA in the range of 005g to 015g The lower end of this range provides a good estimate of the seismic characteristics in the Bay of Campeche The uncertainties in the annual maximum PGA are consistent with those given in the proposed ISO guidelines
The Type 1 and Type 2 sources have uncertainties in the expected annual maximum Am that are comparable with that of offshore California The Type 3 (coastal - local) sources have an uncertainty that is comparable with intra-plate seismic zones Based on the results provided by Chavez (1997a) Table 252 summarizes the mean vertical peak ground accelerations at a depth below the sea floor of shy115 m together with the associated uncertainties
Table 252 middot Mean Vertical PGA at Bay of Campeche sites (-115m) and uncertainties of peak horizontal ground accelerations
Type 200 years shyg
1000 years - g
Uncertainty
() SE
1 02 03 075 2 09 12 055 3 02 03 075
23
this page left blank intentionally
24
Strength Level Earthquake Response Spectra
30 Introduction Strength Level Earthquake (SLE) elastic response spectra were assessed in the several of the
studies of regional seismicity discussed in Chapter 2 The SLE response spectra developed for each of these regions will be summarized in this Chapter In addition results from recent general studies of response spectra will be summarized including consideration of water column effects on vertical motions
3 1 Response Spectra Ordinates Recent studies of response spectra ordinates in the low period range (01 sec to 03 sec) have
indicated that one should expect that these ordinates will vary as a function of both the local soil conditions (soil column classification)and intensity of earthquake motions (Martin Dobry 1994 Crouse McGuire 1997) Figure 31l summarizes the results from the study by Crouse and McGuire of the median amplification factors (Fa = peak horizontal ground acceleration at surface I peak horizontal ground acceleration on rock= PGAs I PGAr) for periods (T) in the range of T = 01 sec to 03 sec
The site soil conditions indicated as SC-A B C and D correspond to those in the proposed ISO guidelines The amplification factor in this period range presently incorporated into the proposed ISO guidelines is Fa= 25 for all soil conditions These results indicate substantially larger amplifications in the short period range While these findings would relatively unimportant for the lateral motions of most offshore platforms (T = 2 to 3 sec) the effects would be potentially important for the vertical motions (T = 01 to 03 sec) of these structures (particularly for heavily loaded deck structures with large cantilevers) The National Center for Earthquake Engineering Research (NCEER) workshop defined a comparable range of amplification factors for this period range (Martin Dobry 1994)
As a result of these findings the following modifications to the proposed ISO earthquake guidelines are proposed The elastic design
tf 55 0 5 uu ~
SC-Aftl Ill ~ - S111 seaLI 111 45 CM -bullmiddotsec0 SC-0middot-Cl 4 iii 0 ~tbull~bullFbull~bullbull~~middotmiddotmiddotmiddotmiddotr-Eu
35
Qci -~-11--~---F=--- --imiddot-- middotmiddotmiddotmiddotmiddotmiddotmiddotmiddotmiddotmiddot---- -middotmiddot------ ---1-----shyE II 3
lt1shyCJ~ 25 -----middot----middot-----c ~
2 CJ 01 015 02 025 03 035 04
Peak Ground Acceleration - gs
Fig 311 - Amplification factors as function of acceleration level and soil conditions
25
response spectra (Figure 312) would 10 - - - --~ be a function of the following variables
Sa I G = vbull T = period of system
bull D = damping of system
bull v = site classification factor for short period range (new factor)
~ Sa I G =~Tla___~
bull I = site classification factor for 0=5long period range L------__________bull E =seismotectonic conditions 01
001 01 1
Period - T (sec) Table 3 11 summarizes the elastic
design response spectra characteristics Fig 312 bull Proposed elastic design responsebased on the results of the work by spectra Crouse and McGuire (1996) and the previous work incorporated into the proposed ISO design response spectra
Table 311 - Local geology and soil conditions parameters for SLE response spectra
Soil 1-ondibons Se1smotectonic Lond1tions
Site 1-lass v I E
SC-A 25 10 Type A 10
SC-B 33 12 TypeB 08
SC-C 35 14 TypeC 09
SC-D 45 20 TypeD 08
SC-E Site specific studies required Detault value 10
3 2 Vertical Response Spectra Ordinates Several recent large magnitude earthquakes have indicated that vertical ground motions can be
equal to or greater than the horizontal ground motions This observation has been particularly true for ground motions close to the epicenter of large magnitude earthquakes The present ISO guidelines prescribe an elastic design response spectrum for vertical motions that is one-half of the horizontal motions
Figure 3 21 summarizes results from a recent study of the ratios of vertical to horizontal spectral ordinates as a function of the response frequency (Bozorgnia Niazi Campbell 1995) Results for the Loma Prieta and Taiwan earthquakes are shown The ratios indicated are mean values The horizontal line indicated at the ratio of 23 references the present Uniform Building Code (UBC) specifications For near-by earthquakes (R = l 0 km) the ratio of the vertical to horizontal spectra ordinate for periods
26
in the range of T = 01 sec are in the range of 14 to I7 The ratio is close to unity at distances of R = 20 km to 30 km Comparable results have been found for other large magnitude earthquakes in other sernismotectonic zones
For periods in the range of T = 2 to 3 sec the ratios are in the range of 02 to 03 for all distances Current studies of recordings from different earthquakes generated by different types of seismotectonic environments indicates that these trends are very likely to be universal (Bozorgnia Niazi Campbell 1995) These results show the problems that are associated with specifying a constant ratio of vertical to horizontal spectra ordinates for all periods and distances The results indicate that the horizontal and vertical spectra have decidedly different shapes
The authors application of these results to the unmodified 1 ISO response spectra is illustrated in Figure 322 The present proposed ISO horizontal and vertical response spectra for Site Classification C (firm alluvium v = 35 I= 14) and Type A seismotectonic
conditions (shallow crustal faulting E = 1 ) For periods greater than about 03 sec the unmodified vertical response spectra have ordinates that are less than the present proposed ISO guideline vertical spectra For periods Jess than 03 sec the unmodified ordinates are substantially larger
The foregoing results have been developed based on earthquake ground motion measurements that have been made on land Measurements of ground motions offshore have indicated that the presence of the water column can have a marked influence on the sea floor motions (Smith 1997 Sleefe 1990) The measurements indicate that the vertical motions at the sea floor are much less than would expected based on on-land measurements For mat supported structures that receive the majority of their input motions from soils that are located near the sea floor this can be an important consideration
For vertically incident earthquake compression waves the ratio of the reflected to the incident wave amplitude at the ground
1 unmodified for water column effects
Loma Prieta EQ Stitt Soll Sites 16
14
0
i ~
12
10
08
~ 08
~ 04
02
00
SMART-1 Array Taiwan Mag 70
(a)
Rbull10 km
Rbull20 km
R-40 km -------213
18
i
16
14
0 12
( i 10I
08
-~ 06 ~
gtbull 04
02
00
(b)
Rbull10 km
Rbull30 km
-------213RafiO km
001 010 100 1000 Period (sec)
Fig 321 - Ratio of Vertical to Horizontal Elastic Response Spectra Ordinates
UJ
01 _____ ______~
1SO Horizontal-II bullVertical -+bullISO Vertical
-----middot
D = 5
001 01
Period - T (sec)
Fig 322 - Horizontal and Vertical Elastic Response Spectra for SC-C E = 10
27
-+-ISO Vertical
bullC
surface is a function of the impedance ratio IR at the ground surface
IR= ps Vspa Va
where pis the mass density of the soil (s) and air (a) and V is the compression wave velocity in the two media On land this impedance ratio is very large and one would expect almost total reflection of the energy at the ground surface This would indicate a doubling of the amplitude of the incident compression waves at the ground - air interface
In water the compression wave velocity in the water and in the water saturated sediments would be almost the same The density difference would be a factor of about 2 This would indicate that about 50 of the compression wave would be transmitted through the interface and the remaining 50 would be reflected The total wave amplitude at the interface would be 15 times the incident amplitude or 75 of the amplitude expected at an air - soil interface
This analysis assumes that the water is infinitely deep and ignores the reflection of the incident compression waves at the water - air interface Crouse and Quilter ( 1991) developed an analysis that includes the finite water column effects Depending on the water depth some frequencies can be reinforced and amplified by the finite water depth while others can be canceled The analyses performed by Crouse indicates that the peak vertical accelerations at the sea floor can be reduced by as much as 50 (Crouse Quilter 1991 Dolan Crouse Quilter 1992 Smith 1997 Sleefe 1990) These observations are in agreement with the analyses of recorded earthquakes at the sea floor reported by Smith ( 1997) and Sleefe ( 1990)
The earthquake ground motions in the vicinity of the sea floor are the result of a very complex variety of wave forms frequencies and incidence angles Thus the foregoing simplified analyses can be relied upon only to provide some insights into the potential effects of the water column on the vertical movements at the sea floor Measurements of earthquake movements at the sea floor provide the only reliable source of information to quantify these effects The measurements that are available confirm the inferences that have been drawn based on simplified analyses
Figure 323 summarizes the results for the water column modified vertical response spectra compared -bullbullModified (x05) Vertical
D =5 Modified (x 075) Vertical with the present ISO vertical response
spectra The present ISO vertical response spectra provides a conservative envelope to the modified vertical spectra for periods greater ~ 1 ~
~than about 02 sec However the ftl bull-----117 present ISO vertical response spectrum is somewhat unconservative ifor periods less than about 02 sec
SC-C v = 35 1J1 = 14 E = I ~ bullUntil better information becomes available it is the authors conclusion 01
that the present proposed ISO 001 01 1 guidelines for vertical response Period - T (sec) spectra provide a reasonable arid likely somewhat conservative Fig 323 - Water Column Modified Vertical approximation to the vertical Response Spectra movements that can be expected in the vicinity of the sea floor
28
33 Computed Response Spectra Most current seismic exposure analyses and evaluations characterize the earthquake ground
motions on a rock or very firm alluvium surface Then often one-dimensional shear beam type analyses are performed to characterize the earthquake ground motions within the soil column that overlies the rock or very firm alluvium surface A variety of soil constitutive models can be used in these analyses but most often equivalent linear models are used with modifications introduced to model the soil non-linear stress-strain behavior and the changes in this behavior with cyclic strains Damping is generally introduced as an equivalent viscous damping (Dobry 1991 ) The bottom boundary of the soil column at the rock interface is generally characterized with an absorbing boundary element to prevent unrealistic trapping of the earthquake energy in the soil column due to reflections of the energy at the rock interface
Relative to the ISO earthquake guidelines this practice raises issues regarding the uncertainties and biases that can be introduced by different analyses of soil column effects The ISO guidelines do not include any definitive information on how such analyses should be performed There is a very wide range in how such analyses are performed and how the soil column analyses are performed can have extremely important effects on the earthquake ground motions that are utilized in analyses of the soil shystructure interactions
Fig 33 l summarizes earthquake acceleration response spectra from four locations in Mexico City based on recordings obtained during the 1985 earthquake (Seed 1987) The soft clay soil column has discernible effects on the shapes of the response spectra and the magnitudes of the spectra ordinates The computed natural periods of the soil columns (Ts) at each of the locations is noted based on the relationship
Ts =4dVs
where dis the depth of the soil column and Vs is the soil shear wave velocity (appropriate for the soil strains induced by the earthquake) For a given soil column thickness the natural period of the soil column is controlled solely by the shear wave velocity The shear wave velocity is a function of the shear modulus which is a function of the cyclic shear strains induced in the soils by the earthquake Higher strains result in lower shear modulii and shear wave velocities
The response spectra exhibit definite peaks at the natural periods of the soil columns The noticeable increase in the response spectra energy associated with the 37 m depth site is likely due to reflected energy associated with the edge of the Mexico 75
rbullbull 4H37gt bull 2 sec City basin This basin 10------- 10---10---0--- edge influence would oat- UNAM CAOT J SCT CAF
08 08 08 not be incorporated in ss 06 5 orrpng bullbull gmost shear beam soil bullmiddot g 04t-
column analyses because the soil column 0o 1 2 3 5responses would be
T sec T sec T sec T secbased on the rock outcrop motions (in this case at the UNAM site)
0[~mJraquo middot~middot~middotmiddot 75~)~mbullEJ 3f==Soft Fig 332 l c~~aVbullSOOto900nVa middotsummarizes results
from SHAKE analyses
0606
04
06
04 JT
dego t 2 3 1 2 3 4 5
of motions at the soil surface identified as Fig 331 - Soil Conditions and Recorded Acceleration Spectra Oakland Outer Harbor During 1985 Mexico City Earthquake
29
(Bray et al 1996) during the 1989 Loma Prieta earthquake (epicenter about 70 km away) The soil profile consists of 156 m of alluvium (clays sands) overlying bedrock The shear wave velocity in this soil column ranged from 800 msec (alluvium at base of column) to 63 mis (Bay Mud) The soil column had an average shear wave velocity in the range of approximately 400 msec The response spectra indicates discernible peaks at 15 sec and about 06 sec Based on the results from testing of soil samples a soil damping ratio of l 0 to 20 was used
Response spectra from available strong motions recorded at nearby rock sites are shown in Fig 332 The response peak at 06 sec is obviously due to the energy in the input rock motions at this period The response peak at 15 sec is obviously due to the natural period of the soil column The spectral acceleration of the rock is amplified by a factor of about 4 at the 06 sec and 16 sec peaks of the soil column Given a peak spectral acceleration of 025 g in the input rock motion at the natural period of the soil column the peak spectral acceleration is
Rock mollon YBI (90 dovl ied lo OOlg
Rocordod mollon (305 dovgt Computed mollon
o
1 2 3 4 PERIOD seconds
middot Recorded and SHAKE
1
Cl
Fig 332 Computed Response Spectra (Oakland
Outer Harbor Loma Prieta Earthquake)
about 05 g representing a doubling of the peak in the spectral input motion Note that the computed motion of the soil column generally is somewhat less than the recorded motion
Fig 333 and Fig 334 summarize similar results for two other nearby locations The Oakland location consisted of 152 m of alluvium having shear wave velocities in the range of 800 msec to 120 msec The Emryville location consisted of 137 m of alluvium having a similar range in shear wave velocities In these cases the amplifications of the rock motions at a period of 06 sec were about 3 and at a period of about 15 sec were about 4 The peak input spectral acceleration of 020 g to 025 g was magnified at the natural period of the soil column by a factor of about 2 Again the SHAKE analyses tend to under predict the ground motions at the natural period of the soil column but predict the amplifications reasonably well at the earthquake input peak energy period of about 06 sec
These results indicate that the SHAKE analytical model and the associated characterizations of the soil stiffness and damping has a bias in the range of B = 15 to 20 for the natural period of the soil columns Other similar results need to be developed before definitive statements can be made
Rock mollon YBI (90 dogl ied lo OOlg Rocordod mollon (290 dovgt06 11ecorded motion (200 deg)
Cl Compulod mollon
Demplng 5
0 1 2 3 PERIOD seconds
Fig 333 bull Recorded and SHAKE Computed Response Spectra (Oakland Loma Prieta
Earthquake)
30
4
concerning the biases associated with the soil column analyses
The amplification of the earthquake input acceleration on rock at the surface of the soil column can be evaluated approximately from (Dobry 1991)
A= [as I ar lmax =II I + (1t 12) D5 I
where A is the ratio of the maximum acceleration at the soil surface as to the input acceleration at the rock interface ar I is the impedance ratio of the rock - soil interface D5 is the soil damping ratio The soil - rock impedance ratio is
I= (pr I ps) (Yr I Vs)
where pr is the density of the rock ps is the density of the soil Yr is the shear wave velocity of the rock and Vs is the shear wave velocity of the soil The velocity ratio would generally be in the range of 5 to 30 and the density ratio in the range of II to 15 Thus the impedance would generally be in the range of 5 to 50 The soil damping ratio could be expected to be in the range of 005 (low
I
Rocle mollon YBI llO dog) Recordod mollon (350ltMg)0
Cl
0
Ar Compulodmodan bull I
DomplngS
middotmiddot~_ -~
1 2 3 PERIOD seconds
Fig 334 - Recorded and SHAKE Computed Response Spectra (Emryville Loma Prieta
Earthquake)
strains) to more than 03 (high strains) Fig 335 summarizes the results of this development Except for very low impedance impedance is not an extremely important element However damping is very important The use of low strain damping ratios in the range of 5 to I 0 result in amplifications that are a factor of 4 to 5 times those for damping ratios in the range of 25 to 30
The Loma Prieta site results summarized earlier had a velocity ratio in the range of 7 to 9 a density ratio in the range of I I to 12 This would indicate an impedance in the range of 8 to 11 Given an amplification of the input rock acceleration of about 2 at these sites a damping ratio in the range of 20 to 30 is indicated This damping is much higher than indicated from the laboratory triaxial and resonant column tests 12Often this has been found to be true and it has been postulated that the under-estimated c( 1 0 damping is due to the laboratory testing boundary conditions c 80
Studies are currently being conducted to ~ 6better characterize the bias and uncertainties
associated with analyses of soil column e 4response characteristics during intense Q
earthquakes These studies are attempting to E 2c(account for the different methods that can be used to characterize the soil properties and the 0input earthquake excitations Results from these studies will be monitored by the author
-D=Soo Impedance- bull0=10dego - bull bull0=15dego t--r~-~-~-~--- bullbullbullbullbullD=20dego
~middot0=30oomiddotmiddotmiddotmiddotmiddot0=251middot=~~-
10 20 30 40
and their implications integrated into future revisions of the proposed ISO guidelines Fig 335 - Soil Surface Amplification of
Bed Rock Acceleration
31
4
50
34 North Sea Response Spectra Elastic response spectra for North Sea
seismotectonic and hard ground - rock conditions were developed as part of the EQE International study (1998) and the NORSAR study (1998) Fig 341 summarizes the normalized response spectra results for a 5 damping ratio from the EQE study for return periods of 100 years 1000 years and 10000 years The response spectra do not vary significantly as a function of the intensity of the earthquakes in this range This is to be expected since the hard ground shyrock materials respond essentially in their low-strain reasonably elastic range The peak amplification of the spectra is approximately 25
In the EQE study it was noted that the spectra could be modified for other values of damping by the factor K (Woo et al 1988)
K = 148 - 030 In D
This response spectrum modification factor was compared with that contained in the proposed ISO guidelines It was found that the modification factors are essentially identical for damping ratios less than about 20 and above 20 only differ by about 10
I 1000
100
~ ~ 6 -g 10
~
01
01 10 100 100
Undamped Natural Frequency (Hz)
Fig 341 - Earthquake Response Spectra for UK Sector Conditions
Fig 342 summarizes the response spectra from the NORSAR study (1998) for a return period of 10000 years at low seismic activity (Alta) and high seismic activity (Midgard) sites for rock or hard ground conditions The shapes of the spectra are essentially identical
1 1 FREOUENCY (HZ)
a 1u
Fig 342 - Earthquake Response Spectra for Norwegian Sector Conditions For Earthquake Return Period of 10000 years and Rock - Hard Ground
32
Fig 343 and Fig 344 summarize results from the study of soil column effects on the rock spectra performed by the Norwegian Geotechnical Institute (1988) as part of the NORSAR study ( 1988) Soil column characteristics were based on results from soil exploration - soil boring - laboratory jtesting performed at North Sea platform locations and onshore Norway locations The earthquake response analyses were performed using the SHAKE computer program discussed earlier The soil columns were organized into two different categories Soil Type B - shallow firm alluvium and Soil Type C - deep firm alluvium Recorded earthquake time histories characteristic of those expected for the Norwegian
01 10 100seismotectonic conditions were used as input to the soil column analyses Frequency (Hz)
The amplification factors for the Soil Type Fig 343 Computed Earthquake Response B profiles has a definite peak in the period Spectra Amplification Factors for Deep range of 005 sec to 01 sec The peak Alluvium Soil Conditions (Soil Type C) amplifications range from about 25 to as high The Coefficient of Variation (COY) of the peak amplification factors is approximately 20 ( ~
crG5) The COY suggested in the proposed ISO guidelines is 30 The range of results shown in Fig 343 represents the range of results between different sites not the range of results that reflect variations in the soil characteristics for a given site
The amplification factors for the Soil Type C profiles has a definite peak in the period range of 0 5 sec to 1 sec The peak amplifications range from about 25 to almost 6 The Coefficient of Variation (COY) of the peak amplification factors is approximately 30 The COY suggested in the proposed ISO guidelines is 40
Fig 345 summarizes the mean soil response spectra amplification factors for the two different soil column conditions The mean peak soil amplification factor for Soil Type B is 3 and the same factor for Soil Type C is 3 5 These results are in excellent agreement with those summarized in Table 311 These results confirm the need to have a factor that modifies the magnitude of the peak in the response spectra as a function of the soil conditions
The NORSAR study also addressed the 01 10 100
vertical motion spectra and concluded that the Fraqubullcy (Hz) ratio of the spectral ordinates (VH) was frequency (f) dependent In the vicinity of the Fig 344 - Computed Earthquake peak of the horizontal response spectrum (f = 1 Response Spectra Amplification Factors to 3 Hz) the recommendation was that the ratio for Shallow Alluvium Soil Conditions should be determined as follows (Soil Type B)
1400
300 +----+--+-+-r-tishy
200 +---+---+-middot
7
6
2
0
I
33
VH = 09 - 042 log (f)
For f =1 Hz VH =09 These results are in reasonably good agreement with those summarized in Fig 322 Based on the information provided in the NORSAR study it is understood that these results are for the surface of the soil column and do not incorporate the effects of the overlying water column Future studies of the vertical response spectra at the sea floor should take account of these effects
400
300~
~ c 0 ~ 2005 E Q
100~
000
010
Fig 345 middot Recommended Earthquake Response Spectra Mean Amplification Factors for Deep Alluvium Soil Conditions (API Soil Type C)
100 1000 10000 Frequency (Hz)
Sc w ) ~
I
I I
~
v Soll Ty1 bull
) 1
34
35 Bay of Campeche Spectra Chavez (I997a l 997b) performed a number of site response studies for the Bay of Campeche
using the computer program SHAKE Results from recently performed high quality soil borings and laboratory static and dynamic testing programs were used to characterize the strength stiffness damping and hysteretic performance characteristics of the soils The soils consist of deep (100 m to 200 m) firm alluvium (layered calcareous sands silts and clays) Chavez introduced the deconvolved input motions from the three types of earthquakes at the base of the soil columns and determined the output motions close to the sea floor (at -12 m appropriate for lateral motions characterizations for piles) and at significant penetrations below the sea floor ( -100 m appropriate for vertical motions characterizations
Results for the 200-year horizontal Strength Level Earthquake (SLE) conditions ( -12 m) for a variety of sites in the Bay of Campeche are summarized in Figures 351 352 and 353 for Type I (very distant subduction zone) Type II (distant mixed zone) and Type III (nearby surface faulting zone) earthquakes respectively The Type I earthquake produces a peak in the ground motions at a period of about 3 sec that represents the long-period energy from these distant subduction zone earthquakes that coincides with the natural period of the soil column The Type II earthquake produces a set of response spectra with multiple peaks in the range of 0 3 sec to 3 sec The Type II earthquake produces a much more conventional spectrum with peaks in the range of 02 to 08 sec
The resulting mean response spectra for these three types of earthquake conditions is summarized in Fig 354
bullbull
bullbull
bullI
~~
1
~ (
~w - ~
- Fig 351 - Type I 200-year Earthquake Computed
Response Spectra
bullbull
bullbull
bull i j0 bull -
~~ ~middotg- - ~~middotshy -
I I bull
Fig 352 - Type II 200-year Earthquake Computed Response Spectra
35
bull
bull
together with the mean plus one standard deviation and envelope spectra Chavez included the range in response spectra results that developed from plus and minus one standard deviation changes in the soil shear modulus and damping characteristics The COY of the peak response spectra values is about 100 This high uncertainty reflects the influences of the three different types of seismic sources different soil characteristics at different sites and the effects of plus and minus one standard deviation ranges in the soil properties at the different sites Given a location that is affected by multiple types of earthquake sources it would be preferable to define different response spectra associated with these sources rather than combine them into a single response spectrum
These results clearly indicate that the dominant horizontal and vertical motions important to the pile foundations of the platforms in the Bay of Campeche are associated with the Type II earthquake source At a period of 1 sec (predominant natural period of platforms in Bay of Campeche) the Type II earthquake source produces horizontal motions at a penetration of -12 m that are a factor of about 10 greater than those for the Type I and Type III sources
In general these results are in good agreement with the proposed modifications to the ISO SLE response spectra
bull
middot~
0JO
Imiddot~ 016
1110
f 016
010
~ -~middot)
Ar
~I~ -
I I I
Fig 353 - Type III 200-year Earthquake Computed
Response Spectra
I I
I
I I
I [I
I I
I
I
-~-~ Fig 354 bull 200-year Mean Mean Plus One Standard
Deviation and Envelope Response Spectra
36
Summary Conclusions amp Acknowledgments
40 Summary The objective of this study was to continue development of earthquake load and resistance factor
design (LRFD) guidelines with a study of results from recent seismic hazard characterizations This study addressed two primary topics
a) seismic zonation of the UK and Norwegian Sectors of the North Sea offshore Japan and Indonesia and the Bay of Campeche Mexico and
b) Strength Level Earthquake (SLE) response spectra
This study was organized as follows
bull obtain recent background on seismic hazard characterizations
bull detail seismic exposure uncertainties and local site response uncertainties
bull reconcile differences between current ISO seismic hazard guidelines and those developed during this study
bull document the revised seismic hazard and response spectra characterizations in a project technical report
Results from current seismic exposure studies of the UK and Norwegian Sectors of the North Sea indicate SLE rock PGA in the range of 0015 g to 008 g and seismic uncertainties in the range of crE = 15 to 17
Results from current seismic exposure studies for the Japan coastal and offshore areas indicate SLE rock PGA in the range of 005 g to 05 g and seismic uncertainties in the range of crE = 08 to 10
Results from current seismic exposure studies for the Indonesia coastal and offshore areas indicate
SLE rock PGA in the range of 005 g to 035 g and seismic uncertainties in the range of crE =06 to 20 (lower end of range associated with subduction zone dominated sites)
Results from current seismic exposure studies for the Bay of Campeche Mexico indicates SLE rock PGA in the range of 001 g to 005 g and seismic uncertainties in the range of crE = 06 to 18
Results from current studies of horizontal response spectra associated with SLE intensities indicates that the ISO SLE horizontal response spectra for periods in the range of about 01 sec to 05 sec should be modified (increased) to account for different types of soils Such modifications have been developed as a result of this study Results from region and site specific SLE horizontal response spectra generally are in good agreement with the proposed modified ISO response spectra
Study of information relating to the vertical ground motion spectra for on-land conditions indicate that the ratios of vertical motions to horizontal motions in the low period range (01 sec to 03 sec) for near-by earthquakes can be much greater than currently specified in the proposed ISO guidelines
37
However when the effects of the water column are taken into account combined with the proposed modifications to the horizontal response spectra in the period range of 01 sec to 05 sec the proposed modified ISO guidelines generally provide a conservative estimate of the vertical motion characteristics
4 1 Conclusions The results from this study indicate that the proposed ISO seismic exposure guidelines generally
provide a conservative estimate of the SLE PGA for the regions studied The current regional seismic exposure results provide the basis for updated North Sea Japan and Indonesia regional ISO seismic exposure maps (Fig 212 Fig 222 Fig 232 Fig 246)
The results from this study indicate that the proposed ISO guidelines for seismic exposure uncertainties associated with the different seismotectonic zones generally provide a conservative estimate of the uncertainties The current regional seismic exposure results provide the basis for updated North Sea Japan Indonesia and Mexico seismic exposure uncertainties
The results from this study indicate the need for modifications to the proposed ISO SLE horizontal response spectra in the period range of about 01 sec to about 05 sec Based on results from current response spectra studies proposed modifications that are a function of the type of soil column have been developed In general the proposed modified ISO SLE horizontal response spectra provide a conservative estimate of the expected SLE horizontal response spectra developed from detailed site specific studies The uncertainties associated with the response spectra ordinates as suggested in the proposed ISO guidelines provide reasonable characterizations for the different types of soil columns
The results from this study indicate that it is important to clearly identify the position in the soil column that are associated with the response spectra The positions should be those that characterize the positions that result in maximum input of motions or energy from the earthquake ground motions For pile supported structures these motions would be below the sea floor for lateral motions (eg 5 to 10 pile diameters) and along the lower one-third to bottom of the pile shaft for axial motions For mat supported structures these motions would generally be much closer to the sea floor but are still not generally at the sea floor itself These considerations are particularly important for specification of the vertical response spectra for both pile and mat supported platforms
The presence of the water column has important effects on the vertical motions at or very close to the sea floor These effects need to be accounted for when evaluations are developed for the vertical response spectra for these elevations Analysis of available information on vertical motions and the effects of the water column generally indicates that the proposed modified ISO guidelines provide a conservative characterization of the vertical motion effects
42 Acknowledgments The author would like to acknowledge the technical guidance and information provided by Dr Ove
Gudmestad of Statoil and Mr Mike Craig of Unocal Financial support for the second phase of this study was provided by Statoil and Unocal
The third phase of this study will be sponsored by the U S Minerals Management Service The third phase will address verifications of the proposed ISO guidelines based on site and platform specific results provided by the project sponsors
38
Australian Bureau of Mineral Resources Geology and Geophysics and Lamont-Doherty Geological Observatory of Columbia University Tectonic Map of the Indonesian Region Professional Paper 1078 Geological Survey oflndonesia
Bea R G (1992) Seismic Design and Requalification Methodologies for Offshore Platforms Proceedings of the International Workshop on Seismic Design and Requalification of Offshore Structures California Institute of Technology Pasadena CA Dec
Bea R G (l997a) Background for the Proposed International Standards Organization Reliability Based Seismic Design Guidelines for Offshore Platforms Proceedings of the Earthquake Criteria Workshop Recent Developments in Seismic Hazard and Risk Assessment 16th International Conference on Offshore Mechanics and Arctic Engineering Y okahama Japan (obtain proceedings from Port and Harbors Research Institute Yokuska Japan)
Bea R G (1997b) Risk Based Oceanographic and Earthquake Load amp Resistance Factor Criteria for Design and Requalification of Platforms Offshore Indonesia Report to Indonesian Petroleum Association Directorate General of Oil and Gas of Indonesia Pertamina and Bandung Institute of Technology Marine Technology and Management Group University of California at Berkeley
Bea R G (1997c) Risk Based Hurricane and Earthquake Criteria for Design and Requalification of Platforms in the Bay of Campeche Report to Petroleos Mexicanos Instituto Mexicano de Petroleo and Brown amp Root International Inc Marine Technology and Management Group University of California at Berkeley
Bea R G (1998) Continued Development of Earthquake Load and Resistance Factor Design Guidelines Report I - Concrete Gravity Base Structures LRFD Guidelines Report to the UK Health and Safety Executive Marine Technology and Management Group University of California at Berkeley
Beca Carter Hollings amp Ferner Ltd Indonesian Earthquake Study Seismic Zones for Building Construction in Indonesia 1979
Borcherdt R D (1994) Estimates of Site-Dependent Response Spectra for Design (Methodology and Justification) Earthquake Spectra The Professional Journal of the Earthquake Engineering Research Institute Vol 10 No 4 Nov
Bozorgnia Y Niazi M and Campbell K W (1995) Characteristics of Free-field Vertical Ground Motion during the Northridge Earthquake Earthquake Spectra Vol 11 No 2 Earthquake Engineering Research Institute Oakland California
Bray J D Chameau J-L and Guha S (1997) Seismic Response of Deep Stiff Clay Deposits Proceedings of the 5th International Conference on Earthquake Engineering Earthquake Engineering Research Center University of California at Berkeley
Chavez M (1987) Analisis de Riesgo Sismico en Varios Sitios de a Bahia de Campeche Elaborado para IMP Proy 6734 Mexico City MX
Chavez M (1997a) On the Seismic Hazard of the Campeche Bay Region Prepared for Meeting About the PEMEX Transition Normativity for the Bay of Campeche Berkeley CA March
Chavez M (1997b) Seismic Hazard and Design Spectra for Southern Gulf of Mexico 16th International Conference on Offshore Mechanics and Arctic Engineering OMAE 97
39
Proceedings of Earthquake Criteria Workshop Recent Developments in Seismic Hmard and Risk Assessments for Port Harbor and Offshore Structures Yokohama Japan April 17 American Society of Mechanical Engineers New York NY
Chavez M (1997c) Seismic Hmard at Sites of the Campeche Bay for the Risk Assessment of PEMEX Offshore Facilities Report to PEMEX and IMP August 10 Mexico City Mexico
Chavez M (1998) Seismic Hazard at Sites of the Campeche Bay for the Risk Assessment of PEMEX Offshore Facilities risks and Seismic Design Spectra in Areas of the Bay of Campeche Report to Petroleos Mexicano Instituto Mexicano de Petroleo and Brown amp Root International CISIND Col Jardines de Ajusco Talapan DP Mexico
Crouse CB and Quilter J (1991) Seismic Hazard Analyses and Development of Design Spectra for Maui A Platform Proceedings of the Pacific Conference on Earthquake Engineering Auckland New Zealand
Crouse C B and McGuire J W (1997) Site Response Studies for Purpose of Revising NEHRP Seismic Provisions Dames and Moore Consultants Seattle Washington
Dames amp Moore 1992 Final Report Seismic Hazard Evaluation Offihore Northwest Java Indonesia Report to Maxus Southeast Sumatra Inc Atlantic Richfield Indonesia Inc
Dames and Moore Seismic Risk and Site Response Study Proposed Rajah Platform East Kalimantan Indonesia Report No 02310-004-75 Report to Unocal Corporation
Dobry R (1991) Soil Properties and Earthquake Ground Response Proceedings of the Tenth European Conference on Soil Mechanics and Foundation Engineering Associazione Geotecnica Italiana Florence Italy
Dolan D K Crouse C B and Quilter J M (1992) Seismic Reassessment of Maui A Proceedings ofthe Offshore Technology Conference OTC 6934 Society of Petroleum Engineers Richardson Texas
EQE International Ltd ( 1998) Seismic Hazard Mapping of Offshore Britain Report to Health and Safety Executive London UK
Guerra R and Esteva L (1978) Espectros de Diseno Sismico en Paraiso Tab y Cuidad de Carmen Camp Patrocinado por Proyectos Marinos S A Instituto de Ingenieria UNAM Mexico City DP
Guzman R (1982) Bases de Riegso Sismico y Espectros de Riesgo Uniforme de la Bahia de Campeche Preparado para Instituto Mexicano de Petrroleo Proyectos Marinos Mexico DP
Lamport W B 1992 Seismic Analyses of Indonesias Rajah Wellhead Platform Unocal Corporation Science and Technology Division Project Report 91-23
Martin G R and Dobry R (1994) Earthquake Site Response and Seismic Code Provisions National Center for Earthquake Engineering Research Bulletin Vol 8 No 4 Buffalo New York
NORSAR and Norwegian Geotechnical Institute (1998) Seismic Zonation for Norway Report to Norwegian Council for Building Standardization
Norwegian Geotechnical Institute (1998) Effects of Local Soil Response on Earthquake Loading Report to Norwegian Council for Building Standardization
Nozu A and Iai S (1997) Seismic Hazard in Coastal Areas of Japan Proceedings of Earthquake Criteria Workshop Recent Developments in Seismic Hazard and Risk Assessments for Port Harbor and Offshore Structures Port and Harbor Research Institute Japan
40
Nozu A Uwabe T Sato Y Ichii K and Iai S (1997) Attenuation Relations for Peak Ground Motions on Base Layer in Japan Proceedings of Earthquake Criteria Workshop Recent Developments in Seismic Hazard and Risk Assessments for Port Harbor and Offshore Structures Port and Harbor Research Institute Japan
Risk Engineering Inc 1992 Seismic Hazard Analysis for the Offshore Kalimantan Sites Indonesia Report to Unocal Corporation March 27
Sleefe G E (1990) The Long-Term Measurement of Strong-Motion Earthquakes offshore Southern California Proceedings Offshore Technology Conference OTC 2345 Society of Petroleum Engineers Richardson Texas
Smith C E ( 1997) Dynamic Response of a Steel-Jacket Platform Subject to Measured Seafloor Earthquake Ground Motions Proceedings Eighth International Conference on the Behavior of Offshore Structures Vol 3 Pergamon Elsevier Science Ltd Oxford England
Untung M Buyung N Kertapi E Undang N Allen C R 1985 Rupture Along the Great Sumatran Fault Indonesia During the Earthquakes of 1926 and 1943 Bulletin of the Seismological Society of America Vol 75
Utsu T (1982) Catalog of Large Earthquakes in the Region of Japan from 1885 through 1980 Bulletin ofEarthquake Research Institute University of Tokyo Vol 57 pp 401-463
41
this page left blank intentionally
42

I
Continued Development of Earthquake Load and
Resistance Factor Design Guidelines
Report 2
Seismic Hazard Characterizations
by
Professor Robert Bea
Marine Technology amp Management Group
Department of Civil amp Environmental Engineering
University of California at Berkeley
May 1998
this page left blank intentionally
Chapter Page
1 Introduction 1
10 Objectives 1 11 Background 1 12 Earthquake LRFD Approach 2 13 RAM Based ISO Earthquake Guidelines 6
2 Earthquake Hazard Zones amp Uncertainties 11
20 Introduction 11 21 UK Sector North Sea 11 22 Norwegian Sector North Sea14 23 Japan 16 24 Indonesia 18 25 Mexico 2 1
3 Strength Level Earthquake Response Spectra 2 5
30 Introduction 2 5 31 Response Spectra Ordinatesbull2 5 32 Vertical Response Spectra Ordinates 2 6 33 Computed Response Spectra 2 9 34 North Sea Response Spectra 31 35 Bay of Campeche Response Spectra35
4 Summary Conclusions amp Acknowledgments 3 7
40 Summary3 7 41 Conclusions 3 8 42 Acknowledgments3 8
References 3 9
this page left blank intentionally
ii
Introduction
10 Objective The objective of this study is to continue development of earthquake load and resistance factor
design (LRFD) guidelines as follows
Part 1) concrete gravity based structure (GBS) LRFD guidelines (sponsored by Health and Safety Executive)
Part 2) seismic hazard characterizations (sponsored by STATOIL and UNOCAL) and
Part 3) verification of guidelines (sponsored by U S Minerals Management Service)
This report summarizes the results of the second part of this study seismic hazard characterizations Two primary topics are addressed
a) seismic zonation and uncertainties of the UK and Norwegian Sectors of the North Sea offshore Japan and Indonesia and the Bay of Campeche Mexico and
b) Strength Level Earthquake (SLE) elastic response spectra
11 Background A first-generation LRFD ISO guideline for design of steel pile supported template-type platforms
to resist earthquake induced loading has been developed (Bea 1991 1997a) This guideline was based on the API RP 2A LRFD guideline and on the collective experience and judgment of the ISO PS committee members During the first generation developments limited verification studies of the entire process were performed there was limited documentation of the background for some of the key developments and there were additional topics that needed to be addressed These topics have been discussed and the PS committee recommended that additional studies be conducted on the two topics cited above
The report titled Continued Development of Earthquake Load and Resistance Factor Design Guidelines Report 1 - Concrete Gravity Base Structures LRFD Guidelines documented the results of the first phase of this study (Bea 1998)
This study was organized as follows
bull obtain recent background on seismic hazard characterizations
bull detail seismic exposure uncertainties and local site response uncertainties
bull reconcile differences between current ISO seismic hazard guidelines and those developed during this study
bull document the revised seismic hazard and response spectra characterizations in a project technical report (Report 2)
1
1 2 Earthquake LRFD Approach The LRFD approach used to develop the proposed ISO earthquake design guidelines can be
expressed analytically as follows
ltPE RE~ YDI D1 + Yoz Dz+ Yu L1 +YE E
where ltPE is the resistance factor for earthquake loadings RE is the design capacity of the platform element (eg brace joint pile) for earthquake loadings as defined by the API RP 2A - LRFD
guidelines yDI is the self-weight of the structure (dead) loading factor D1 is the design dead loading
Yoz is the imposed equipment and other objects loading factor Dz is the design equipment loading Yu
is the consumables supplies and vessel fluids (live) loading factor L1 is the live loading YE is the earthquake loading factor and E is the earthquake loading effect developed in the structure or foundation element This development addresses the definition of the resistance factors ltPE and the
loading factors YE for loadings induced by earthquakes (Bea l 997a) The dead equipment and live
loading factors are set as y01 = Y02 =Yu = I I
The earthquake loading factor is determined using a Lognormal format (Bea 1991)
YE = Fe B exp (08 PE crE - 257 crE)
where Fe is the median effective loading factor B is the median bias (actual I nominal) in the
computed earthquake loadings PE is the annual Safety Index designated for the platform SSL crE is the total uncertainty associated with the earthquake loadings (standard deviation of the annual maximum earthquake loading) 08 is the splitting factor used to separate the uncertainties in earthquake loadings and platform capacities and the 257 is a consequence of defining the elastic design earthquake (Strength Level Earthquake) at an average return period of 200-years (257 Standard Normal deviations from the mean)
The effective loading factor for the platform system is expressed as
Fe= [microa r 1
where micro is the platform system ductility and a is the platform residual strength ratio
micro = dp de
a=AI Aep
dp is the maximum plastic displacement that can be developed by the platform system at failure de is the displacement at which first significant nonlinear behavior is indicated by the platform system A is the area under the platform loading - displacement to failure diagram and Aep is the area under an equivalent elasto-plastic platform loading - displacement to failure diagram
The total uncertainty associated with the earthquake loadings ( crE) is expressed as
where cr5E is the uncertainty in the earthquake horizontal peak ground accelerations is thecr05 uncertainty related to the local geology and soil conditions and their effects on the ordinates of the earthquake response spectra and crbulls is the uncertainty associated with the response spectrum method used to determine forces in the elements that comprise the platform
2
In development of the proposed ISO earthquake guidelines Type I (natural inherent aleatory) uncertainties are included in cr The effects of Type II (model parameter state epistemic) uncertainties are introduced with the Biases (actual value I nominal value) in loading effects and capacities This is done to develop as close as possible a correlation with the way in which the target Safety Indices and probabilities of failure were determined
The platform element resistance factor is determined from
ltlgtE = BRE exp (-08 ~E ltJRE )
where BRE is the median bias (actual value I nominal or code value) in the element earthquake loading capacity and is the crRE uncertainty in the earthquake loading capacity of the element
The proposed ISO earthquake LRFD approach proceeds through the following nine steps (Bea 1997a)
I Define the structure safety and serviceability level (SSL)
2 Define the earthquake hazard zone (EHZ) and seismotectonic conditions (Fig 121)
3 Determine if site specific seismic exposure study is required (Table 121)
4 Define the shape of the normalized mean elastic principal horizontal acceleration response spectrum for a specified damping ratio soil profile and seismotectonic condition (Fig 122 Table 122)
5 Determine the uncertainties associated with the seismic exposure response spectrum and the methods used to analyze earthquake forces induced in the structure (Table 123 Table 124)
6 Determine the earthquake loading factor ltYE) for the elastic response spectra forces
7 Evaluate the biases and uncertainties in the platform element design capacities
8 Determine if a ductility analysis is required and the performance characteristics for the analyses
9 Determine the platform element resistance factors (ltjgtE) for the design code based capacities
The remainder of this report will summarize the study of seismic hazard characterizations (Steps 2 and 5) based on results from recent studies and local site response spectra characterizations (Steps 4 and 5) In the context of the loading and resistance factor formulation summarized in Eqn ( 1) through (7) the key issues included in this study were
- the peak horizontal ground acceleration at a return period of 200 years (Fig 121) bull G200
crE - the uncertainty associated with the seismic environment
bull ltJas - the uncertainty related to the local geology and soil conditions and their effects on the ordinates of the earthquake response spectra and
bull Sa I G vs T - the shape of the normalized SLE horizontal acceleration response spectrum for a specified damping ratio of D = 5 (Fig 122)
3
Fig 121 middot Proposed ISO Earthquake Hazard Zones (EHZ)
Sa G
(log scale)
10
middot 005 0125
Period T sec (log scale)
Fig 122 bull Proposed ISO Strength Level Earthquake Normalized Elastic Horizontal Acceleration Response Spectrum
4
Zone SLE G SSL 1 SSL 2 SSL 3 SSL 4 (1) g (3) (4) (5) (6)
2
Should 0 0-5 Allowed
1 5 -15 to use
2 15 -25 these
3 25 -35 guidelines
4 35-45
5 45 -55
Table 121 - Proposed ISO Earthquake Hazard Zones SLE Ground Accelerations (G) and Structural Serviceability amp Safety Levels (SSL)
Table 122 - Proposed Local Geology and Soil Conditions Parameter and Seismotectonic Characteristics Parameter E
Soil Conditions ( 11
SC - A Rock (Vs ~ 2500 fps)
SC - 8 Stiff to very stiff soils gravels (Vs = 1200 to 2500 fps)
SC - C Sands silts and very stiff clays (Vs= 600 to 1200 fps)
SC - D Soft to medium stiff clays (H = 10 to 200 ft Vs s 600 fps)
SC - E Site specific studies required
I
10
12
14
20
Seismotectonic Condit 121
Type A Shallow crustal faulting zones
Type 8 Deep subduction zones
Type C Mixed shallow crustal amp deep
subduction zones
Type D lntraplate zones
Default value
ions
E
10
08
09
08
10
5
Table 123 Seismic sources and
attenuation uncertainties
Table 124 Uncertainties associated with
local geology and soil conditions
Seismotectonic Characteristics
Shallow crustal fault zones
Deep subduction zones
Mixed shallow crustal fault and deep subduction zones
Intraplate zones
OsE
10
14
12
20
Geology Soil Conditions
-A
SC - B SC - C
SC - D
SC - E
OGs
030
040
040
050
050
13 RAM Based ISO Earthquake Guidelines
The approach used to develop the ISO earthquake guidelines for design and requalification are based on a Risk Assessment and Management (RAM) approach in which the seismic conditions are integrated with the performance characteristics of alternative platform configurations to define the reliabilities and risks associated with these configurations The earthquake design and requalification criteria are the basic product ofa desired reliability ofthe platforms
This is a very different approach than has been used traditionally to specify earthquake criteria for onshore facilities Traditionally earthquake criteria has been the result of two generally uncoordinated developments The first development came from geologists seismologists and earthquake engineers They were responsible for the characterization of the earthquake excitation that would be used for design of structures The basis for their characterization was some earthquake return period Often this was based on specification of a life of the structure and an acceptable probability of exceedance For example buildings were often designed for a 50 year life with a 10 percent probability of exceedance This is equivalent to design of the structure for an earthquake that has a return period of about 4 75 years The seismologists would then define design earthquakes that would be representative of the different types of earthquakes that could be experienced Representative earthquake time histories and elastic response spectra were often used for this definition
The second development came from structure design engineers They were responsible for the determination of how the structures would be configured and designed They defined the factors of safety that would be used in design of the structures Often the design procedures and factors of safety were the result of past of experiences with the performance of buildings that had experienced intense earthquake excitations If the performance of components in buildings proved to be
6
insufficient the configurations procedures and factors of safety were changed to improve the performance
The RAM procedure used in development of the ISO earthquake guidelines is based on an integration of the two developments and is focused on the reliability of the resulting structure In this instance the earthquake design spectra and design procedures are intimately related The design spectra characteristics are a direct consequence of the defined reliability and the procedures and processes that are used to configure and proportion the structure This point can be illustrated by the following RAM based equation to define the design elastic horizontal response spectra ordinate (Sa0 )
for a structure that has a given natural period (Tn) and damping ratio (D) (Fig 122)
Sa0 = (Ru50 I Fe M) (BRu I BFQ ) exp (~Q ltJQ - Z0 crFQ)
Ruso is the median static ultimate lateral loading capacity of the structure Fe is the factor that recognizes the combination of the transient earthquake induced loadings and the nonlinear hysteretic performance characteristics of the structure M is the total effective mass of the structure including the structure live and dead masses and hydrodynamic masses (often the total mass of an offshore structure is 50 to 70 hydrodynamic mass) ~Q is the design Safety Index for the structure
(directly related to the structure reliability or its compliment the probability of failure) crQ is the total uncertainty in the structure capacity and the earthquake induced loadings (square root of the sum of the squares of the standard deviations of the logarithms of the structure capacity and earthquake loadings)
Z0 is a factor that depends on the return period that is used to define the design earthquake often this is taken to be a 100-year or 200-year condition for elastic working stress or load and resistance factor design formats for 100-year and 200-year return periods Zo =233 and Zo =257 respectively (this is the number of standard deviations from the mean to the 99-th and 995-th
percentiles respectively) crFQ is the uncertainty in the earthquake loadings induced in the structure BRu is the median bias in the structure ultimate capacity (best estimate or true value divided by nominal or predicted value) BQ is the median bias in the earthquake induced loadings (demands) If unbiased estimates are used to determine the earthquake loadings and structure capacities the biases are unity
The factors Tn D Rus0 Fe and M are fundamentally structural design factors that depend on the structure materials configuration and proportioning ~Q is a derivative of the desired or accepted
reliability of the structure crFQ is a derivative of how the structure responds to the earthquake (induced loadings or forces) and the long-term uncertainty in the earthquake ground accelerations The total uncertainty crQ reflects the uncertainties in both the structure capacity and the earthquake induced
loadings It should be apparent that the spectral acceleration is a direct product of structure and reliability considerations and can not or should not be developed or defined in isolation of these considerations
In the long period range (Tn ~ = I sec) the spectral acceleration can be expressed as
Sa0 = (KE 1J1 I Tn) G0
7
K expresses the number of standard deviations of the response spectra ordinate from the mean value If other than the mean value is used (K = I) then the bias in the earthquake loadings must be recognized e is a factor that depends on the seismotectonic (earthquake sources) environment (for
strike slip sources e 10 and for subduction zone sources E 08) lj1 is a factor that depends on the
local geology and soil conditions (ljl 18 for deep soft alluvium and lj1 = 08 for rock or very strong sedimentary formations) 0 0 is the design ground acceleration that is defined at the specified return period It is apparent that the majority of these factors are those that should be determined by the earthquake engineer or geo-seismologist
Based on the RAM approach the design or requalification spectrum (Sa vs Tn) is dependent on an explicit and integrated evaluation of the following categories of factors
I) characteristics of and uncertainties in the seismic - tectonic - geologic earthquake conditions (expressed with G ljf E BQ crFQ)
2) characteristics of and uncertainties in the seismic performance characteristics of the structure and the associated process used to design or requalify the structure (expressed with Ru Tn D Fe M Z0 K crRu B) and
3) the target reliability for the structure (expressed with~)
The foregoing RAM based development results in an intimate integration of
1) managements direction regarding acceptable or desirable reliability of a structure
2) input from the earthquake engineer or geo-seismologist and
3) input from the structure design engineer
In this context the design conditions or design spectra can not and should not be developed in isolation by the earthquake engineer or geo-seismologist Many of the earthquake and structure parameters involved in the RAM are highly coupled they can not and should not be separated for examplethe loads induced in the structure by earthquake ground motions are a direct function of the characteristics of the structure
It is important to recognize that the RAM based earthquake spectrum that is used to design or requalify a structure explicitly incorporates the uncertainties in the seismic environment For example even though a mean spectrum is used in the specification given to the engineer the potential for ground motions that are much larger or more intense are directly recognized in the uncertainties attributed to the mean spectral ordinates One should not be unduly concerned when peaks in some response spectra exceed the design or requalification spectrum The uncertainties in the ground motions have a direct impact on the factors of safety and Reserve Strength Ratios that are specified for a particular structure More uncertainty leads to larger factors of safety and Reserve Strength Ratios
8
There are four major parts to the seismic exposure models used to characterize earthquake ground motions (Fig 131)
1) characterization of the seismic sources
2) characterization of the transmission of earthquake energy from the sources to the site
3) characterization of the local geology and geotechnical effects on the free-field motions of the soils and
4) description of the soil-structure interactions that develop during the earthquakes (near-field motion characterizations)
For pile supported platforms the pile foundations supporting the platforms receive their input energy from earthquakes from two distinctly different points in the soil column The input of lateral energy occurs below the sea floor where the maximum lateral earth pressures can be generated on the piles (Fig 132) Generally this point is located at five (stiff soils) to ten (soft soils) pile diameters below the sea floor Frequently the seismic exposure characterizations are developed for the level of the sea floor This is not appropriate for pile supported offshore structures This can be appropriate for mat supported structures that receive the majority of their support from the soils in the immediate vicinity of the sea floor The error introduced by the sea floor reference for the earthquake characteristics will be dependent on the soil profile and soil characteristics If there is a substantial layer of soft clays or soils overlying the stronger soils then the bias introduced by the sea floor reference can be very large (15 to 20)
The input of vertical energy for pile supported offshore platforms occurs at the point along the pile where the soil - pile shaft
SOILmiddot PILE INTERACTION
llllllllll
TRANSMISSION AT TE NUA T ION
EARTHQUAKE SOURCE
Fie 131 - Primarv Comoonents of PIP mal
0 oi-----oi2=---~-o4---~--ors~~-oie-~-lmiddotc gt 12 IN
SOltL-PILE 8
~ 40~~~+-~~middot~~~-P~-+--=~~
Fig 132 - Earthquake Effects on Pile Foundation Lateral Soil Pressures
9
shears are maximized This is generally along the bottom one-third of the pile shaft This can be a depth below the sea floor of I 00 m or more Because most attenuation relations are developed for onshore conditions and recorded earthquakes where there is a dramatic change in the impedance ratio at the earth surface and hence large reflections of the vertically propagating compression earth waves these attenuation relations incorporate these reflections and shallow effects Offshore at the sea floor there is no dramatic change in impedance for vertically propagating compression waves at the sea floor (saturated sediments interface with the water column) Thus attenuation relations for onshore conditions generally tend to dramatically overestimate the vertical motions at the sea floor This can be important for mat-supported offshore structures It is also important for pile supported platforms whose vertical motion characteristics are based on measured data from onshore surface locations
10
Earthquake Hazard Zones amp Uncertainties
20 Introduction During this study access was obtained to recent earthquake hazard exposure studies from the
following regions
bull UK Sector North Sea
bullNorwegian Sector North Sea
bullJapan
bullIndonesia
bullMexico
This Chapter summarizes the results from these studies as they pertained to the characterization of the seismic zones the design SLE horizontal ground accelerations and the uncertainty associated with the seismic environments
The author contacted three firms known internationally for their expertise in seismic exposure assessments EQE International Dames amp Moore Consultants and Geomatrix Consultants The author was not able to obtain any significant information that could be used to revise the current ISO seismic zonation maps Uniformly the firms deg felt that this information was confidential since it had been developed for clients
2 1 UK Sector North Sea Based on the study performed by EQE 55
International (1998) Fig 211 shows the Magnitudes and epicenters of earthquakes that have affected the North Sea area during the period from 1904 through 1990 There have been 7 earthquakes having magnitudes greater than M = 5 during this period
Based on the seismotectonics of this region EQE developed two zonation models one with 38 area zones and the second with 26 area zones The historic seismicity was associated with these zonation models an attenuation characterization
bull
bullbull bull
bull bull bull
0 LONGITUDE f
MAGNITUDESmiddot bull 5 bull 4 bull 3
based on an synthesis of attenuation models appropriate for the seismotectonic characteristics Fig 211 - UK Sector Historic of this area and peak ground accelerations (PGA) Earthquake Epicenters and Magnitudes
11
56
-10middot bull bullbull bullbull --shycontoura (rnta2) for shy eXCMdanct ~dM-3
middot10 bullbull 62
ID
56 56
$4 54middot I
$2 52
______ ~tomiddot -amiddot bullbull bullbull
Fig 212 middot 200-Year Peak Ground Fig 213 middot 10000 Year Peak Ground Acceleration Contours Acceleration Contours
on rock or very hard soil determined The results are summarized in Fig 212 and Fig 213 for return periods of 200 years and 10000 years respectively Although not explicitly stated in this report it is presumed that these return periods incorporate the uncertainties associated with the attenuation relationships To be consistent with the definition of earthquake uncertainties used in the proposed ISO earthquake guidelines the uncertainty associated with the attenuation relationships need to be incorporated into the seismic hazard characterizations
Fig 212 could be used as a basis for an ISO micro-zonation map of the UK Sector of the North Sea The PGA generally range from 0015 g to 0030 g The current ISO guidelines for this region indicate a seismic zone of 1 with PGA = 005 g to 015 g The lower end of this range provides a conservative estimate of the Strength Level Earthquake (SLE) conditions for this region
Fig 214 summarizes the results from the EQE study in the form of the horizontal Peak Ground Accelerations (PGA) versus the average return periods for two locations one in the southern portion of the UK Sector (54 degrees north) and one in the northern portion (58 degrees north) These results can be used to determine the uncertainties associated with the earthquake ground motions In the proposed ISO guidelines the earthquake uricertainties in annual expected PGA are based on a Lognormal distribution that is fitted to the extreme values and expressed with the standard deviation of the logarithms of the expected annual maximum PGAs crE If it were desirable to base the fitted
12
025
1000 Return Period - years
Fig 214 - Peak Ground Accelerations for Southern and Northern Locations
Lognorrnal distribution on the 10000 year and 100 year return period PGAs the uncertainty could be found from
crsEmiddot = 072 In (G 10000 I G 100 )
For the southern location
crsEmiddot = 072 In (024 g I 0024 g) = 166
For the northern location
crsEmiddot =072 In (010 g I 0010 g) = 166
The proposed ISO guidelines suggest a value of crE = 20 for the intraplate seismotectonic characteristics of this region Again the proposed ISO guidelines provide a conservative estimate of the seismic exposure uncertainties
If it were desirable to base the characterization of the seismic exposure uncertainty on the I 0000 year and 1000 year PGAs then
crSE = 161 In (G 10000 JG 1000 )
Based on the results developed by EQE for the southern location
cr5E = 161 In (024 I 0085) = 167
and for the northern location
crsEmiddot =161 In (010 I 0035) =169
The seismic uncertainties are not sensitive to the extreme earthquake return periods used to fit the equivalent Lognorrnal distributions
13
72bull
70middot
eamiddot
eamiddot
[] 74bull --middot
72bull
64
82
64 eomiddot eomiddot
eamiddot 118
eamiddot 118
54bull amp4
22 Norwegian Sector North Sea Based on the study performed by
NORSAR and the Norwegian Geotechnical Institute (1998) Fig 221 summarizes the historic earthquake epicenters and magnitudes The zonations used in the seismic exposure analyses are also shown The NORSAR study shows that these earthquake epicenters are closely associated with faulting in the region Study of recent earthquake records shows that the majority of the earthquakes originate on reverse thrust faults characteristic of intraplate seismotectonic regions
The historic seismicity developed by NORSAR was associated with the zonations indicated in Fig 221 an attenuation characterization based on an synthesis of attenuation models appropriate for the seismotectonic characteristics of this area (calibrated with recordings from recent earthquakes) and peak ground accelerations (PGA) on rock determined The results are summarized in Fig 222 and Fig 223 for return periods of 100 years and 10000 years respectively
Site specific studies performed to determine the 100-year return period earthquake peak ground
Fig 221 - Norwegian Sector Earthquake acceleration can be converted to the Epicenters Magnitudes and Seismic Zonation200-year PGA (= G) with following
relationship
= G100 exp (024 crE)0 200
Fig 222 could be used as a basis for an ISO micro-zonation map of the UK Sector of the North Sea The 200-year PGA generally range from 0015 g to 008 g The current ISO guidelines for this region indicate a seismic zone of 1 with PGA = 005 g to 015 g The lower end of this range provides a conservative estimate of the Strength Level Earthquake (SLE) conditions for this region
Fig 224 summarizes the results from the NORSAR study in the form of the horizontal Peak Ground Accelerations (PGA) versus the average return periods for two locations one in the southern portion of the Norwegian Sector (62 degrees north) and one in the northern portion (66 degrees north) Based on the fitted Lognormal distribution to the 10000 year and 100 year return period PGAs the uncertainty for the southern location is
OsEmiddot =072 In (033 g I 0042 g) =148
14
For the northern location
cr5E = 0 72 In (027 g I 0027 g) = 166
80
Fig 222 middot 100-Year Peak Ground Acceleration Contours
Fig 223 middot 10000 Year Peak Ground Acceleration Contours
The proposed ISO guidelines suggest characteristics of this region This value provides a conservative estimate for this region
Basing the characterization of the seismic exposure uncertainty on the 10000 year and 1000 year PGAs then for the southern location
OsEmiddot = 161 ln (033 013) = 149
and for the northern location
OsEmiddot = 161 In (027 I 010) = 160
These values again are in excellent agreement with those based on the 100-year and 10000-year PGA
a value of crE = 20 for the intraplate seismotectonic
0 100 1000
Return Period - years
Fig 224 middot Peak Ground Accelerations for Southern and Northern Locations
15
104
23 Japan Fig 231 summarizes the
earthquake epicenters and magnitudes in the region surrounding Japan during the period 1885 through 1995 (Utsu 1982) The data set includes more than 500 seismic events having magnitudes greater than M -= 60 Attenuation relations for peak bedrock accelerations were based on results from a recent study of recorded earthquake motions in Japan (Nozu et al 1997) The standard deviation of the attenuation
relationship was found to be crnPGA = 062 This value characterizes the uncertainty associated with the attenuation relationship
Fig 232 summarizes the results of the seismic exposure study for the Yokohama Port (Nozu Iai 1997) The 20 largest peak bedrock accelerations are shown as a function of the return period The data are fitted with a Weibull distribution and with a Earthquake Hazard Study Lognormal distribution that is fitted to the tail of the Weibull distribution Similar fits were developed for a large number of coastal middot offshore sites and similar results developed
Based on these results a seismic hazard map for the peak bedrock acceleration having a 200 year return period was developed (Fig 233) The PGA range from 005 g to 050 g The proposed ISO seismic zonation for this area ranges from 2 to 5 and thus indicate PGA =015 to 025 g to PGA = 045 g to 055 g The proposed ISO guidelines provide a conservative estimate of the 200-year PGA An ISO Japan annex could be developed that would utilize the information shown in Fig 2 3 3 as the micro zonation map for coastal - offshore Japan
This study also developed a mapping of the standard deviation of the Lognorrnal peak bedrock acceleration distribution that considered both the variability in the Lognormal distribution for the expected PGA and the uncertainty in the attenuation relationship (Fig 234) The results indicated standard
1885-1995 A Mlt60 bull deg 0 f 0 60ltMlt65 middot~ 0
bull00 0 0 0 0
0 65ltMlt70 fgt bull degii ~ OO I
0 70ltMlt75 deg o AkitaPort o0 bull
o 75ltMlt80 8 deg e 80ltM
bull
bullbullbull Kobe Port
bull
bull
bull
bullbull ltP
Fig 231 bull Seismic Event Data Used in Japan
middotmiddotmiddot-middot-middotmiddotmiddotmiddot+middotmiddot
1o 10 10
Return Period [at)
Fig 232 bull Peak Bedrock Acceleration and Return Period at Yokohama Port
16
Fig 233 - 200 Year Bedrock PGA Fig 234 - Standard Deviation of Lognormal Expected Annual Maximum
PGA
deviations of the Lognormal peak bedrock accelerations distributions that ranged from cr5E = 08 to cr5E
= 10
The value suggested in the proposed ISO guidelines for the seismotectonic conditions in this region
is cr5E = 10 Thus the proposed ISO guidelines provide a conservative estimate of the uncertainties associated with the seismic exposure of this region
17
24 Indonesia The extreme condition
earthquakes offshore Indonesia are dominated by two principal seismic sources (Beca Carter Hollings amp Ferner Ltd 1979 Dames amp Moore 1992 Untung et al 1985) The major tectonic feature in the region is the Sunda Arc which Figure 241 - Locations Offshore Indonesia extends approximately 5600 km between the Andaman Islands in the northwest and the Banda Arc in the east This feature results from convergence and subduction of the Indo-Australian plate beneath the Southeast Asia plate
The Sunda Arc consists of three primary tooOE 110oe
segments the Sumatra segment (A-1 - A-5 Figure 241 ) the Sunda Strait segment (between A-1 - A-5 and G-1 - G-7 Figure 10
middot 100N
241) and the Java segment (G-1 - G-7 Figure 241) (Dames amp Moore 1992) The locations A-1 to G-1 lie along the northern edge of the Sunda Arc The locations A-5 to G-7 lie along the axis of the Sunda Arc 0
These locations represent the area of greatest seismic exposure
There have been several great (Magnitude in excess of 775) earthquakes recorded along the Sunda Arc during this century (Figure 242) More than 150 surface Magnitude 70 or greater earthquakes 1100E
have occurred along this Arc during this MAGNITUDES lt40 0
century (Beca Carter Hollings amp Ferner Ltd 1979) The majority of these earthquakes
so e 60 70
have had focal depths (Figure 243)
in excess of 70 km Figure 242 - Epicenters of Indonesian
Earthquakes 1900 - 1996 The second primary source of
earthquakes are shallow crustal faults that generally parallel the Sunda Arc (east - west) with some transform surface faulting that marks the north - south trending boundaries of the land masses (Figure 243) The majority of recorded shallow source (less than 70 km) earthquakes that have occurred during this century have occurred along the Sunda Arc zone Several hundred shallow focus earthquakes in the Magnitude range of 40 to 70 have occurred in this zone during this century In
bull
bullmiddotmiddotmiddot bull
18
the v1cm1ty of the area indicated as Raja (Dames and Moore 1990 Lamport 1992 Risk Engineering Inc 1992) in Fig 241 there have been in excess of 12 events with magnitudes between 50 and 70 during the past century (Figure 244)
Figure 245 summarizes a proposed seismic zonation for offshore Indonesia (Bea l 997b) The zone designations are associated with the 200-year peak ground accelerations at the sites as follows
Zone I G = 005g to 015 g
Zone 2 G =015g to 025g
Zone 3 G = 025g to 035 g
These seismic zonations are consistent with those contained in the proposed ISO seismic guidelines
North -SOO -400 -300 -200 -100 0 100 200 300 400
South
0
100
200
300
400
~ 3 500
~ 600
700
800
(gt 0
CXJ) coo 0 ltli)
0
0
o~ bull
0
0 0 ~ltJOO
(J 0
MAGNITUDES lt40 0
50 0
60 8 70
900--~~~~~~~~~~~~~~~~~~
Figure 243 - Hypocentral Profile of Java Central Segment Normal to Sunda Arc - Earthquakes 1900 shy
1996
In some areas site specific studies have been performed to determine the 100-year return period earthquake peak ground acceleration To convert the 100-year G to the 200-year G the following relationship can be used
G200 = G100 exp (024 crE)
where OsE is the uncertainty in the long-term distribution of G (assumed to be Lognormally distributed)
Based on the results from the recent studies of extreme earthquake conditions that have been performed in this area Figure 246 summarizes the expected annual maximum peak ground accelerations (Gm) for the locations shown in Figure 241 The expected peak ground accelerations having return periods of 100 years at the locations ranges from 010 g to 012g (Gl Al) to 017 g to 022 g (G7 -A5)
bull J011lt40 O 4011lt4IS0 _ _ D SISllltS4
0 1bullMlt72
D 72111lt10
oeow
Figure 244 - Earthquake Sources and Magnitudes in Kalimantan Region
19
I
Figure 245 - Seismic Zonation for Offshore Indonesia
The uncertainties (natural variabilities) in the expected annual earthquake peak ground accelerations (Gm) range from crsE = 060 to 070 (A-1 A-5 G-1 G-5) to crsE = 18 to 20 (Raja) These values are consistent with the proposed ISO guidelines for this region and seismotectonic conditions
The available regional and site specific information on earthquake conditions indicates that there are two general categories of Type I uncertainties associated with the primary seismic sources The first category is associated with those locations that are adjacent to the Sunda Arc These locations very frequently experience earthquakes from both shallow and deep sources (Fig 243) Those locations have Type I uncertainties in the expected annual earthquake peak ground accelerations that range from crsE = 060 to 070
The second category of locations is 111
associated with those locations that are middotm 06~~ distant from the Sunda Arc These c locations much more infrequently ~
Iexperience earthquakes primarily from 111 01~~=1 shallow sources These locations have fi
-A-1Type I uncertainties in the expected ~ - bullA-5 --bullG-1annual earthquake peak ground ~ -G-7
accelerations that range from crsE = s bullbullbullbullbullRaiae
180 to 200 (Raja) ~ 001 100 1000 10 4
fl Average Return Period - years
Figure 246 - Expected Annual Maximum Earthquake Peak Ground Accelerations at Study
Locations
20
25 Bay of Campeche Mexico The information on earthquake seismic
100hazard characteristics for the Bay of bullbullbull Campeche Mexico was provided by Chavez (1987 1997a 1997b 1998) Additional information on the earthquake characterization was provided by Guerra and Esteva ( 1978) and Guzman ( 1982)
The seismic environment is influenced by three primary types of earthquake sources (Figure 251) The Type 1 source is associated with the subduction zone on the western Pacific coast of Mexico The earthquakes in this zone occur at depths of 15 km to 20 Km and have magnitudes up to M = 8 2 The Type 2 source is associated
EXPLANATIONwith the lithospheric slab within the central Tectonostratigraphic province boundaryportion of Mexico Earthquakes occur in
0 300km ~this zone at depths of 60 km to 250 km and Thrust taubull teeth on upper plate
have magnitudes up to M = 75 The Type Plate moliona rates in cnvyr -3 source occur in the Trans-Mexican volcanic belt located primarily along the east coast of Mexico have depths up to 20
CMbull C-Muatt CaP c-n Piiie CoP bull Cocoo Plate CTbullkm and magnitudes up to M = 67 (Chavez Caymmn Traugh MATbull Middle Atllrtic Trench MFZ bull Mot1QU8 Faull Zone 1987 1998) MSG bull Mlcl1oaean SMmic Gap NOAM bull -h American Piiie OFZ bull Orozco
Fracture Zone Ind ndgn SCbull ~a-ptOYince SMQCP bull Sietra Madre OrierltllmiddotChipu P116n ptOYince TRbull Tehuamepec Ridge TSG bull
The historic catalog of earthquake Tlhuon--Gap
occurrences during the period 1970 - 1996 Figure 251 - Bay of Campeche Earthquake
NOAM
SC I
I I
I
I Campeche Bay
I I
lt~
MAT
CoP
were used by Chavez to determine the activity rates in each of the three sources and the occurrences of varying
2400earthquake intensities and magnitudes in each of the 2300
three sources Figure 252 0 2200shows the seismic events that 0 8
have occurred in this region 0 2100 0during the period 1800 to bull
20001996 for all earthquakes that 0
1900have surface magnitudes (Ms) greater than M = 50 The 1800
majority of records contained 1700in this catalog date from the
1930s when reasonably 1600
comprehensive teleseismic 1SOO
instrumentation was in place The largest earthquakes 1400
that have occurred in the ~v1c1rnty of the Bay of ~
Campeche are in the range of M = 30 to M = 40 The
Plate Tectonics and Sources
+ + + + + + + + + + + +
+ + + + + + + + ++ + +
+ + + + + + + + + + + +
0 + + +
+
+
+
+
degamp + + + + + + + + + + +
o +
0 +
~ ~ 8 8 8 ~ ~ ~ ~ ~ N ~ ~
~ 0~ bull bull ~ bull ~ bull ~ ~ bull
2400
Z300
2200
2100
2000
1900
1800
1700
1600
IS00
1400
~ bull
Figure 252 bull Seismic Events Affecting the Bay oflargest earthquake that has Campeche Region 1800-1996 Events M gt 50
21
occurred during the past 100 years within a 100 km radius of the Bay of Carnpeche is M = 60 The vast majority of the seismic activity is concentrated along the Pacific coast of Mexico The source of nearby large earthquakes are associated with the Motagua Fault Zone and the fault system (Sierra Madre Oriental-Chipas Peten province) that generally parallels the east coast of Mexico There are no major seismic sources that have been identified within the Sigsbee-Carnpeche province that underlies the Bay of Carnpeche
Based on previous analyses of pile supported platforms subjected to earthquake excitations in soil columns of the Bay of Carnpeche a depth below the sea floor of -12 m was chosen to reference the lateral accelerations and a depth of -115 m was chosen to reference the vertical accelerations from the seismic exposure analyses (Bea 1997c)
Figure 253 summarizes the results for the Bay of Carnpeche for each of the three seismic sources A mean or average value for the four representative soil columns studied by Chavez (1997a) are shown The Type 2 and Type 3 sources develops ground motions that dominate the seismic exposure in the Bay of Carnpeche At an average return period of 10000 years the indicated peak horizontal ground acceleration (Am) is indicated to be Am~ 025 g Table 25 l summarizes the ground motions at return periods of 200 and 4000 years and the uncertainties (natural or Type I aleatory) associated with the ground motions (expressed as the standard deviation of the logarithms of expected annual G
QISE)
-CE CCI iObull -shyCJ _UI 01
iii Cl -ccI
2omiddot = o ca z G lo ii ca u GI U 0 ct
001
-shy--
- - - - - shy - - - -
bullbullbull-Zona 1 -zona2 --bullZona 3
-shy---shybullmiddotmiddotmiddotmiddot -shy__- --middot~middotmiddotmiddotmiddot
-
~ -shy middotmiddotmiddotmiddotmiddotmiddot
middotbullmiddotmiddotbullmiddotbullmiddotmiddotmiddotmiddotmiddotmiddot middotmiddotmiddotmiddotmiddotmiddotmiddotmiddotmiddotmiddotmiddotbullmiddot - - middotbullbullbullbullbull ~
41000 10
Return Period - Years
Figure 253 middot Peak horizontal ground accelerations
Table 251 middot Mean Horizontal PGA at Bay of Campeche sites (middot12m) and uncertainties of peak horizontal ground accelerations
Type 200 years shyg
1000 years -g
Uncertainty
QSE
I 12 16 058 2 50 78 084 3 27 68 175
22
These results can be compared with those developed by Guerra and Esteva ( 1978) for the Bay of Campeche and firm alluvium sites At a return period of 100 years the peak horizontal ground acceleration obtained by Guerra and Esteva is G = 66 g This compares with a maximum value of G =50 g obtained by Chavez (1998) for a 100 year return period for the Zone 2 sources The results developed by Guerra and Esteva indicate an uncertainty in the annual expected peak horizontal
ground acceleration of OsE = 126
The extensive Bay of Campeche seismic exposure study performed by Guzman ( 1982) provides some additional information on the expected ground motions At a return period of 100 years the peak horizontal ground acceleration obtained by Guzman is G = I 0 g This ground motion is more intense than developed by either Chavez or Guerra and Esteva The more intense ground motion appears to be coupled with the attenuation relationships that were developed and used by Guzman ( 1982) The results developed by Guzman indicate an uncertainty in the annual expected peak
horizontal ground acceleration of OsE = 097 This uncertainty is slightly greater than that of the Chavez results and somewhat less than indicated by the Guerra and Esteva results
The proposed ISO guidelines for this region indicate a 200-year PGA in the range of 005g to 015g The lower end of this range provides a good estimate of the seismic characteristics in the Bay of Campeche The uncertainties in the annual maximum PGA are consistent with those given in the proposed ISO guidelines
The Type 1 and Type 2 sources have uncertainties in the expected annual maximum Am that are comparable with that of offshore California The Type 3 (coastal - local) sources have an uncertainty that is comparable with intra-plate seismic zones Based on the results provided by Chavez (1997a) Table 252 summarizes the mean vertical peak ground accelerations at a depth below the sea floor of shy115 m together with the associated uncertainties
Table 252 middot Mean Vertical PGA at Bay of Campeche sites (-115m) and uncertainties of peak horizontal ground accelerations
Type 200 years shyg
1000 years - g
Uncertainty
() SE
1 02 03 075 2 09 12 055 3 02 03 075
23
this page left blank intentionally
24
Strength Level Earthquake Response Spectra
30 Introduction Strength Level Earthquake (SLE) elastic response spectra were assessed in the several of the
studies of regional seismicity discussed in Chapter 2 The SLE response spectra developed for each of these regions will be summarized in this Chapter In addition results from recent general studies of response spectra will be summarized including consideration of water column effects on vertical motions
3 1 Response Spectra Ordinates Recent studies of response spectra ordinates in the low period range (01 sec to 03 sec) have
indicated that one should expect that these ordinates will vary as a function of both the local soil conditions (soil column classification)and intensity of earthquake motions (Martin Dobry 1994 Crouse McGuire 1997) Figure 31l summarizes the results from the study by Crouse and McGuire of the median amplification factors (Fa = peak horizontal ground acceleration at surface I peak horizontal ground acceleration on rock= PGAs I PGAr) for periods (T) in the range of T = 01 sec to 03 sec
The site soil conditions indicated as SC-A B C and D correspond to those in the proposed ISO guidelines The amplification factor in this period range presently incorporated into the proposed ISO guidelines is Fa= 25 for all soil conditions These results indicate substantially larger amplifications in the short period range While these findings would relatively unimportant for the lateral motions of most offshore platforms (T = 2 to 3 sec) the effects would be potentially important for the vertical motions (T = 01 to 03 sec) of these structures (particularly for heavily loaded deck structures with large cantilevers) The National Center for Earthquake Engineering Research (NCEER) workshop defined a comparable range of amplification factors for this period range (Martin Dobry 1994)
As a result of these findings the following modifications to the proposed ISO earthquake guidelines are proposed The elastic design
tf 55 0 5 uu ~
SC-Aftl Ill ~ - S111 seaLI 111 45 CM -bullmiddotsec0 SC-0middot-Cl 4 iii 0 ~tbull~bullFbull~bullbull~~middotmiddotmiddotmiddotmiddotr-Eu
35
Qci -~-11--~---F=--- --imiddot-- middotmiddotmiddotmiddotmiddotmiddotmiddotmiddotmiddotmiddot---- -middotmiddot------ ---1-----shyE II 3
lt1shyCJ~ 25 -----middot----middot-----c ~
2 CJ 01 015 02 025 03 035 04
Peak Ground Acceleration - gs
Fig 311 - Amplification factors as function of acceleration level and soil conditions
25
response spectra (Figure 312) would 10 - - - --~ be a function of the following variables
Sa I G = vbull T = period of system
bull D = damping of system
bull v = site classification factor for short period range (new factor)
~ Sa I G =~Tla___~
bull I = site classification factor for 0=5long period range L------__________bull E =seismotectonic conditions 01
001 01 1
Period - T (sec) Table 3 11 summarizes the elastic
design response spectra characteristics Fig 312 bull Proposed elastic design responsebased on the results of the work by spectra Crouse and McGuire (1996) and the previous work incorporated into the proposed ISO design response spectra
Table 311 - Local geology and soil conditions parameters for SLE response spectra
Soil 1-ondibons Se1smotectonic Lond1tions
Site 1-lass v I E
SC-A 25 10 Type A 10
SC-B 33 12 TypeB 08
SC-C 35 14 TypeC 09
SC-D 45 20 TypeD 08
SC-E Site specific studies required Detault value 10
3 2 Vertical Response Spectra Ordinates Several recent large magnitude earthquakes have indicated that vertical ground motions can be
equal to or greater than the horizontal ground motions This observation has been particularly true for ground motions close to the epicenter of large magnitude earthquakes The present ISO guidelines prescribe an elastic design response spectrum for vertical motions that is one-half of the horizontal motions
Figure 3 21 summarizes results from a recent study of the ratios of vertical to horizontal spectral ordinates as a function of the response frequency (Bozorgnia Niazi Campbell 1995) Results for the Loma Prieta and Taiwan earthquakes are shown The ratios indicated are mean values The horizontal line indicated at the ratio of 23 references the present Uniform Building Code (UBC) specifications For near-by earthquakes (R = l 0 km) the ratio of the vertical to horizontal spectra ordinate for periods
26
in the range of T = 01 sec are in the range of 14 to I7 The ratio is close to unity at distances of R = 20 km to 30 km Comparable results have been found for other large magnitude earthquakes in other sernismotectonic zones
For periods in the range of T = 2 to 3 sec the ratios are in the range of 02 to 03 for all distances Current studies of recordings from different earthquakes generated by different types of seismotectonic environments indicates that these trends are very likely to be universal (Bozorgnia Niazi Campbell 1995) These results show the problems that are associated with specifying a constant ratio of vertical to horizontal spectra ordinates for all periods and distances The results indicate that the horizontal and vertical spectra have decidedly different shapes
The authors application of these results to the unmodified 1 ISO response spectra is illustrated in Figure 322 The present proposed ISO horizontal and vertical response spectra for Site Classification C (firm alluvium v = 35 I= 14) and Type A seismotectonic
conditions (shallow crustal faulting E = 1 ) For periods greater than about 03 sec the unmodified vertical response spectra have ordinates that are less than the present proposed ISO guideline vertical spectra For periods Jess than 03 sec the unmodified ordinates are substantially larger
The foregoing results have been developed based on earthquake ground motion measurements that have been made on land Measurements of ground motions offshore have indicated that the presence of the water column can have a marked influence on the sea floor motions (Smith 1997 Sleefe 1990) The measurements indicate that the vertical motions at the sea floor are much less than would expected based on on-land measurements For mat supported structures that receive the majority of their input motions from soils that are located near the sea floor this can be an important consideration
For vertically incident earthquake compression waves the ratio of the reflected to the incident wave amplitude at the ground
1 unmodified for water column effects
Loma Prieta EQ Stitt Soll Sites 16
14
0
i ~
12
10
08
~ 08
~ 04
02
00
SMART-1 Array Taiwan Mag 70
(a)
Rbull10 km
Rbull20 km
R-40 km -------213
18
i
16
14
0 12
( i 10I
08
-~ 06 ~
gtbull 04
02
00
(b)
Rbull10 km
Rbull30 km
-------213RafiO km
001 010 100 1000 Period (sec)
Fig 321 - Ratio of Vertical to Horizontal Elastic Response Spectra Ordinates
UJ
01 _____ ______~
1SO Horizontal-II bullVertical -+bullISO Vertical
-----middot
D = 5
001 01
Period - T (sec)
Fig 322 - Horizontal and Vertical Elastic Response Spectra for SC-C E = 10
27
-+-ISO Vertical
bullC
surface is a function of the impedance ratio IR at the ground surface
IR= ps Vspa Va
where pis the mass density of the soil (s) and air (a) and V is the compression wave velocity in the two media On land this impedance ratio is very large and one would expect almost total reflection of the energy at the ground surface This would indicate a doubling of the amplitude of the incident compression waves at the ground - air interface
In water the compression wave velocity in the water and in the water saturated sediments would be almost the same The density difference would be a factor of about 2 This would indicate that about 50 of the compression wave would be transmitted through the interface and the remaining 50 would be reflected The total wave amplitude at the interface would be 15 times the incident amplitude or 75 of the amplitude expected at an air - soil interface
This analysis assumes that the water is infinitely deep and ignores the reflection of the incident compression waves at the water - air interface Crouse and Quilter ( 1991) developed an analysis that includes the finite water column effects Depending on the water depth some frequencies can be reinforced and amplified by the finite water depth while others can be canceled The analyses performed by Crouse indicates that the peak vertical accelerations at the sea floor can be reduced by as much as 50 (Crouse Quilter 1991 Dolan Crouse Quilter 1992 Smith 1997 Sleefe 1990) These observations are in agreement with the analyses of recorded earthquakes at the sea floor reported by Smith ( 1997) and Sleefe ( 1990)
The earthquake ground motions in the vicinity of the sea floor are the result of a very complex variety of wave forms frequencies and incidence angles Thus the foregoing simplified analyses can be relied upon only to provide some insights into the potential effects of the water column on the vertical movements at the sea floor Measurements of earthquake movements at the sea floor provide the only reliable source of information to quantify these effects The measurements that are available confirm the inferences that have been drawn based on simplified analyses
Figure 323 summarizes the results for the water column modified vertical response spectra compared -bullbullModified (x05) Vertical
D =5 Modified (x 075) Vertical with the present ISO vertical response
spectra The present ISO vertical response spectra provides a conservative envelope to the modified vertical spectra for periods greater ~ 1 ~
~than about 02 sec However the ftl bull-----117 present ISO vertical response spectrum is somewhat unconservative ifor periods less than about 02 sec
SC-C v = 35 1J1 = 14 E = I ~ bullUntil better information becomes available it is the authors conclusion 01
that the present proposed ISO 001 01 1 guidelines for vertical response Period - T (sec) spectra provide a reasonable arid likely somewhat conservative Fig 323 - Water Column Modified Vertical approximation to the vertical Response Spectra movements that can be expected in the vicinity of the sea floor
28
33 Computed Response Spectra Most current seismic exposure analyses and evaluations characterize the earthquake ground
motions on a rock or very firm alluvium surface Then often one-dimensional shear beam type analyses are performed to characterize the earthquake ground motions within the soil column that overlies the rock or very firm alluvium surface A variety of soil constitutive models can be used in these analyses but most often equivalent linear models are used with modifications introduced to model the soil non-linear stress-strain behavior and the changes in this behavior with cyclic strains Damping is generally introduced as an equivalent viscous damping (Dobry 1991 ) The bottom boundary of the soil column at the rock interface is generally characterized with an absorbing boundary element to prevent unrealistic trapping of the earthquake energy in the soil column due to reflections of the energy at the rock interface
Relative to the ISO earthquake guidelines this practice raises issues regarding the uncertainties and biases that can be introduced by different analyses of soil column effects The ISO guidelines do not include any definitive information on how such analyses should be performed There is a very wide range in how such analyses are performed and how the soil column analyses are performed can have extremely important effects on the earthquake ground motions that are utilized in analyses of the soil shystructure interactions
Fig 33 l summarizes earthquake acceleration response spectra from four locations in Mexico City based on recordings obtained during the 1985 earthquake (Seed 1987) The soft clay soil column has discernible effects on the shapes of the response spectra and the magnitudes of the spectra ordinates The computed natural periods of the soil columns (Ts) at each of the locations is noted based on the relationship
Ts =4dVs
where dis the depth of the soil column and Vs is the soil shear wave velocity (appropriate for the soil strains induced by the earthquake) For a given soil column thickness the natural period of the soil column is controlled solely by the shear wave velocity The shear wave velocity is a function of the shear modulus which is a function of the cyclic shear strains induced in the soils by the earthquake Higher strains result in lower shear modulii and shear wave velocities
The response spectra exhibit definite peaks at the natural periods of the soil columns The noticeable increase in the response spectra energy associated with the 37 m depth site is likely due to reflected energy associated with the edge of the Mexico 75
rbullbull 4H37gt bull 2 sec City basin This basin 10------- 10---10---0--- edge influence would oat- UNAM CAOT J SCT CAF
08 08 08 not be incorporated in ss 06 5 orrpng bullbull gmost shear beam soil bullmiddot g 04t-
column analyses because the soil column 0o 1 2 3 5responses would be
T sec T sec T sec T secbased on the rock outcrop motions (in this case at the UNAM site)
0[~mJraquo middot~middot~middotmiddot 75~)~mbullEJ 3f==Soft Fig 332 l c~~aVbullSOOto900nVa middotsummarizes results
from SHAKE analyses
0606
04
06
04 JT
dego t 2 3 1 2 3 4 5
of motions at the soil surface identified as Fig 331 - Soil Conditions and Recorded Acceleration Spectra Oakland Outer Harbor During 1985 Mexico City Earthquake
29
(Bray et al 1996) during the 1989 Loma Prieta earthquake (epicenter about 70 km away) The soil profile consists of 156 m of alluvium (clays sands) overlying bedrock The shear wave velocity in this soil column ranged from 800 msec (alluvium at base of column) to 63 mis (Bay Mud) The soil column had an average shear wave velocity in the range of approximately 400 msec The response spectra indicates discernible peaks at 15 sec and about 06 sec Based on the results from testing of soil samples a soil damping ratio of l 0 to 20 was used
Response spectra from available strong motions recorded at nearby rock sites are shown in Fig 332 The response peak at 06 sec is obviously due to the energy in the input rock motions at this period The response peak at 15 sec is obviously due to the natural period of the soil column The spectral acceleration of the rock is amplified by a factor of about 4 at the 06 sec and 16 sec peaks of the soil column Given a peak spectral acceleration of 025 g in the input rock motion at the natural period of the soil column the peak spectral acceleration is
Rock mollon YBI (90 dovl ied lo OOlg
Rocordod mollon (305 dovgt Computed mollon
o
1 2 3 4 PERIOD seconds
middot Recorded and SHAKE
1
Cl
Fig 332 Computed Response Spectra (Oakland
Outer Harbor Loma Prieta Earthquake)
about 05 g representing a doubling of the peak in the spectral input motion Note that the computed motion of the soil column generally is somewhat less than the recorded motion
Fig 333 and Fig 334 summarize similar results for two other nearby locations The Oakland location consisted of 152 m of alluvium having shear wave velocities in the range of 800 msec to 120 msec The Emryville location consisted of 137 m of alluvium having a similar range in shear wave velocities In these cases the amplifications of the rock motions at a period of 06 sec were about 3 and at a period of about 15 sec were about 4 The peak input spectral acceleration of 020 g to 025 g was magnified at the natural period of the soil column by a factor of about 2 Again the SHAKE analyses tend to under predict the ground motions at the natural period of the soil column but predict the amplifications reasonably well at the earthquake input peak energy period of about 06 sec
These results indicate that the SHAKE analytical model and the associated characterizations of the soil stiffness and damping has a bias in the range of B = 15 to 20 for the natural period of the soil columns Other similar results need to be developed before definitive statements can be made
Rock mollon YBI (90 dogl ied lo OOlg Rocordod mollon (290 dovgt06 11ecorded motion (200 deg)
Cl Compulod mollon
Demplng 5
0 1 2 3 PERIOD seconds
Fig 333 bull Recorded and SHAKE Computed Response Spectra (Oakland Loma Prieta
Earthquake)
30
4
concerning the biases associated with the soil column analyses
The amplification of the earthquake input acceleration on rock at the surface of the soil column can be evaluated approximately from (Dobry 1991)
A= [as I ar lmax =II I + (1t 12) D5 I
where A is the ratio of the maximum acceleration at the soil surface as to the input acceleration at the rock interface ar I is the impedance ratio of the rock - soil interface D5 is the soil damping ratio The soil - rock impedance ratio is
I= (pr I ps) (Yr I Vs)
where pr is the density of the rock ps is the density of the soil Yr is the shear wave velocity of the rock and Vs is the shear wave velocity of the soil The velocity ratio would generally be in the range of 5 to 30 and the density ratio in the range of II to 15 Thus the impedance would generally be in the range of 5 to 50 The soil damping ratio could be expected to be in the range of 005 (low
I
Rocle mollon YBI llO dog) Recordod mollon (350ltMg)0
Cl
0
Ar Compulodmodan bull I
DomplngS
middotmiddot~_ -~
1 2 3 PERIOD seconds
Fig 334 - Recorded and SHAKE Computed Response Spectra (Emryville Loma Prieta
Earthquake)
strains) to more than 03 (high strains) Fig 335 summarizes the results of this development Except for very low impedance impedance is not an extremely important element However damping is very important The use of low strain damping ratios in the range of 5 to I 0 result in amplifications that are a factor of 4 to 5 times those for damping ratios in the range of 25 to 30
The Loma Prieta site results summarized earlier had a velocity ratio in the range of 7 to 9 a density ratio in the range of I I to 12 This would indicate an impedance in the range of 8 to 11 Given an amplification of the input rock acceleration of about 2 at these sites a damping ratio in the range of 20 to 30 is indicated This damping is much higher than indicated from the laboratory triaxial and resonant column tests 12Often this has been found to be true and it has been postulated that the under-estimated c( 1 0 damping is due to the laboratory testing boundary conditions c 80
Studies are currently being conducted to ~ 6better characterize the bias and uncertainties
associated with analyses of soil column e 4response characteristics during intense Q
earthquakes These studies are attempting to E 2c(account for the different methods that can be used to characterize the soil properties and the 0input earthquake excitations Results from these studies will be monitored by the author
-D=Soo Impedance- bull0=10dego - bull bull0=15dego t--r~-~-~-~--- bullbullbullbullbullD=20dego
~middot0=30oomiddotmiddotmiddotmiddotmiddot0=251middot=~~-
10 20 30 40
and their implications integrated into future revisions of the proposed ISO guidelines Fig 335 - Soil Surface Amplification of
Bed Rock Acceleration
31
4
50
34 North Sea Response Spectra Elastic response spectra for North Sea
seismotectonic and hard ground - rock conditions were developed as part of the EQE International study (1998) and the NORSAR study (1998) Fig 341 summarizes the normalized response spectra results for a 5 damping ratio from the EQE study for return periods of 100 years 1000 years and 10000 years The response spectra do not vary significantly as a function of the intensity of the earthquakes in this range This is to be expected since the hard ground shyrock materials respond essentially in their low-strain reasonably elastic range The peak amplification of the spectra is approximately 25
In the EQE study it was noted that the spectra could be modified for other values of damping by the factor K (Woo et al 1988)
K = 148 - 030 In D
This response spectrum modification factor was compared with that contained in the proposed ISO guidelines It was found that the modification factors are essentially identical for damping ratios less than about 20 and above 20 only differ by about 10
I 1000
100
~ ~ 6 -g 10
~
01
01 10 100 100
Undamped Natural Frequency (Hz)
Fig 341 - Earthquake Response Spectra for UK Sector Conditions
Fig 342 summarizes the response spectra from the NORSAR study (1998) for a return period of 10000 years at low seismic activity (Alta) and high seismic activity (Midgard) sites for rock or hard ground conditions The shapes of the spectra are essentially identical
1 1 FREOUENCY (HZ)
a 1u
Fig 342 - Earthquake Response Spectra for Norwegian Sector Conditions For Earthquake Return Period of 10000 years and Rock - Hard Ground
32
Fig 343 and Fig 344 summarize results from the study of soil column effects on the rock spectra performed by the Norwegian Geotechnical Institute (1988) as part of the NORSAR study ( 1988) Soil column characteristics were based on results from soil exploration - soil boring - laboratory jtesting performed at North Sea platform locations and onshore Norway locations The earthquake response analyses were performed using the SHAKE computer program discussed earlier The soil columns were organized into two different categories Soil Type B - shallow firm alluvium and Soil Type C - deep firm alluvium Recorded earthquake time histories characteristic of those expected for the Norwegian
01 10 100seismotectonic conditions were used as input to the soil column analyses Frequency (Hz)
The amplification factors for the Soil Type Fig 343 Computed Earthquake Response B profiles has a definite peak in the period Spectra Amplification Factors for Deep range of 005 sec to 01 sec The peak Alluvium Soil Conditions (Soil Type C) amplifications range from about 25 to as high The Coefficient of Variation (COY) of the peak amplification factors is approximately 20 ( ~
crG5) The COY suggested in the proposed ISO guidelines is 30 The range of results shown in Fig 343 represents the range of results between different sites not the range of results that reflect variations in the soil characteristics for a given site
The amplification factors for the Soil Type C profiles has a definite peak in the period range of 0 5 sec to 1 sec The peak amplifications range from about 25 to almost 6 The Coefficient of Variation (COY) of the peak amplification factors is approximately 30 The COY suggested in the proposed ISO guidelines is 40
Fig 345 summarizes the mean soil response spectra amplification factors for the two different soil column conditions The mean peak soil amplification factor for Soil Type B is 3 and the same factor for Soil Type C is 3 5 These results are in excellent agreement with those summarized in Table 311 These results confirm the need to have a factor that modifies the magnitude of the peak in the response spectra as a function of the soil conditions
The NORSAR study also addressed the 01 10 100
vertical motion spectra and concluded that the Fraqubullcy (Hz) ratio of the spectral ordinates (VH) was frequency (f) dependent In the vicinity of the Fig 344 - Computed Earthquake peak of the horizontal response spectrum (f = 1 Response Spectra Amplification Factors to 3 Hz) the recommendation was that the ratio for Shallow Alluvium Soil Conditions should be determined as follows (Soil Type B)
1400
300 +----+--+-+-r-tishy
200 +---+---+-middot
7
6
2
0
I
33
VH = 09 - 042 log (f)
For f =1 Hz VH =09 These results are in reasonably good agreement with those summarized in Fig 322 Based on the information provided in the NORSAR study it is understood that these results are for the surface of the soil column and do not incorporate the effects of the overlying water column Future studies of the vertical response spectra at the sea floor should take account of these effects
400
300~
~ c 0 ~ 2005 E Q
100~
000
010
Fig 345 middot Recommended Earthquake Response Spectra Mean Amplification Factors for Deep Alluvium Soil Conditions (API Soil Type C)
100 1000 10000 Frequency (Hz)
Sc w ) ~
I
I I
~
v Soll Ty1 bull
) 1
34
35 Bay of Campeche Spectra Chavez (I997a l 997b) performed a number of site response studies for the Bay of Campeche
using the computer program SHAKE Results from recently performed high quality soil borings and laboratory static and dynamic testing programs were used to characterize the strength stiffness damping and hysteretic performance characteristics of the soils The soils consist of deep (100 m to 200 m) firm alluvium (layered calcareous sands silts and clays) Chavez introduced the deconvolved input motions from the three types of earthquakes at the base of the soil columns and determined the output motions close to the sea floor (at -12 m appropriate for lateral motions characterizations for piles) and at significant penetrations below the sea floor ( -100 m appropriate for vertical motions characterizations
Results for the 200-year horizontal Strength Level Earthquake (SLE) conditions ( -12 m) for a variety of sites in the Bay of Campeche are summarized in Figures 351 352 and 353 for Type I (very distant subduction zone) Type II (distant mixed zone) and Type III (nearby surface faulting zone) earthquakes respectively The Type I earthquake produces a peak in the ground motions at a period of about 3 sec that represents the long-period energy from these distant subduction zone earthquakes that coincides with the natural period of the soil column The Type II earthquake produces a set of response spectra with multiple peaks in the range of 0 3 sec to 3 sec The Type II earthquake produces a much more conventional spectrum with peaks in the range of 02 to 08 sec
The resulting mean response spectra for these three types of earthquake conditions is summarized in Fig 354
bullbull
bullbull
bullI
~~
1
~ (
~w - ~
- Fig 351 - Type I 200-year Earthquake Computed
Response Spectra
bullbull
bullbull
bull i j0 bull -
~~ ~middotg- - ~~middotshy -
I I bull
Fig 352 - Type II 200-year Earthquake Computed Response Spectra
35
bull
bull
together with the mean plus one standard deviation and envelope spectra Chavez included the range in response spectra results that developed from plus and minus one standard deviation changes in the soil shear modulus and damping characteristics The COY of the peak response spectra values is about 100 This high uncertainty reflects the influences of the three different types of seismic sources different soil characteristics at different sites and the effects of plus and minus one standard deviation ranges in the soil properties at the different sites Given a location that is affected by multiple types of earthquake sources it would be preferable to define different response spectra associated with these sources rather than combine them into a single response spectrum
These results clearly indicate that the dominant horizontal and vertical motions important to the pile foundations of the platforms in the Bay of Campeche are associated with the Type II earthquake source At a period of 1 sec (predominant natural period of platforms in Bay of Campeche) the Type II earthquake source produces horizontal motions at a penetration of -12 m that are a factor of about 10 greater than those for the Type I and Type III sources
In general these results are in good agreement with the proposed modifications to the ISO SLE response spectra
bull
middot~
0JO
Imiddot~ 016
1110
f 016
010
~ -~middot)
Ar
~I~ -
I I I
Fig 353 - Type III 200-year Earthquake Computed
Response Spectra
I I
I
I I
I [I
I I
I
I
-~-~ Fig 354 bull 200-year Mean Mean Plus One Standard
Deviation and Envelope Response Spectra
36
Summary Conclusions amp Acknowledgments
40 Summary The objective of this study was to continue development of earthquake load and resistance factor
design (LRFD) guidelines with a study of results from recent seismic hazard characterizations This study addressed two primary topics
a) seismic zonation of the UK and Norwegian Sectors of the North Sea offshore Japan and Indonesia and the Bay of Campeche Mexico and
b) Strength Level Earthquake (SLE) response spectra
This study was organized as follows
bull obtain recent background on seismic hazard characterizations
bull detail seismic exposure uncertainties and local site response uncertainties
bull reconcile differences between current ISO seismic hazard guidelines and those developed during this study
bull document the revised seismic hazard and response spectra characterizations in a project technical report
Results from current seismic exposure studies of the UK and Norwegian Sectors of the North Sea indicate SLE rock PGA in the range of 0015 g to 008 g and seismic uncertainties in the range of crE = 15 to 17
Results from current seismic exposure studies for the Japan coastal and offshore areas indicate SLE rock PGA in the range of 005 g to 05 g and seismic uncertainties in the range of crE = 08 to 10
Results from current seismic exposure studies for the Indonesia coastal and offshore areas indicate
SLE rock PGA in the range of 005 g to 035 g and seismic uncertainties in the range of crE =06 to 20 (lower end of range associated with subduction zone dominated sites)
Results from current seismic exposure studies for the Bay of Campeche Mexico indicates SLE rock PGA in the range of 001 g to 005 g and seismic uncertainties in the range of crE = 06 to 18
Results from current studies of horizontal response spectra associated with SLE intensities indicates that the ISO SLE horizontal response spectra for periods in the range of about 01 sec to 05 sec should be modified (increased) to account for different types of soils Such modifications have been developed as a result of this study Results from region and site specific SLE horizontal response spectra generally are in good agreement with the proposed modified ISO response spectra
Study of information relating to the vertical ground motion spectra for on-land conditions indicate that the ratios of vertical motions to horizontal motions in the low period range (01 sec to 03 sec) for near-by earthquakes can be much greater than currently specified in the proposed ISO guidelines
37
However when the effects of the water column are taken into account combined with the proposed modifications to the horizontal response spectra in the period range of 01 sec to 05 sec the proposed modified ISO guidelines generally provide a conservative estimate of the vertical motion characteristics
4 1 Conclusions The results from this study indicate that the proposed ISO seismic exposure guidelines generally
provide a conservative estimate of the SLE PGA for the regions studied The current regional seismic exposure results provide the basis for updated North Sea Japan and Indonesia regional ISO seismic exposure maps (Fig 212 Fig 222 Fig 232 Fig 246)
The results from this study indicate that the proposed ISO guidelines for seismic exposure uncertainties associated with the different seismotectonic zones generally provide a conservative estimate of the uncertainties The current regional seismic exposure results provide the basis for updated North Sea Japan Indonesia and Mexico seismic exposure uncertainties
The results from this study indicate the need for modifications to the proposed ISO SLE horizontal response spectra in the period range of about 01 sec to about 05 sec Based on results from current response spectra studies proposed modifications that are a function of the type of soil column have been developed In general the proposed modified ISO SLE horizontal response spectra provide a conservative estimate of the expected SLE horizontal response spectra developed from detailed site specific studies The uncertainties associated with the response spectra ordinates as suggested in the proposed ISO guidelines provide reasonable characterizations for the different types of soil columns
The results from this study indicate that it is important to clearly identify the position in the soil column that are associated with the response spectra The positions should be those that characterize the positions that result in maximum input of motions or energy from the earthquake ground motions For pile supported structures these motions would be below the sea floor for lateral motions (eg 5 to 10 pile diameters) and along the lower one-third to bottom of the pile shaft for axial motions For mat supported structures these motions would generally be much closer to the sea floor but are still not generally at the sea floor itself These considerations are particularly important for specification of the vertical response spectra for both pile and mat supported platforms
The presence of the water column has important effects on the vertical motions at or very close to the sea floor These effects need to be accounted for when evaluations are developed for the vertical response spectra for these elevations Analysis of available information on vertical motions and the effects of the water column generally indicates that the proposed modified ISO guidelines provide a conservative characterization of the vertical motion effects
42 Acknowledgments The author would like to acknowledge the technical guidance and information provided by Dr Ove
Gudmestad of Statoil and Mr Mike Craig of Unocal Financial support for the second phase of this study was provided by Statoil and Unocal
The third phase of this study will be sponsored by the U S Minerals Management Service The third phase will address verifications of the proposed ISO guidelines based on site and platform specific results provided by the project sponsors
38
Australian Bureau of Mineral Resources Geology and Geophysics and Lamont-Doherty Geological Observatory of Columbia University Tectonic Map of the Indonesian Region Professional Paper 1078 Geological Survey oflndonesia
Bea R G (1992) Seismic Design and Requalification Methodologies for Offshore Platforms Proceedings of the International Workshop on Seismic Design and Requalification of Offshore Structures California Institute of Technology Pasadena CA Dec
Bea R G (l997a) Background for the Proposed International Standards Organization Reliability Based Seismic Design Guidelines for Offshore Platforms Proceedings of the Earthquake Criteria Workshop Recent Developments in Seismic Hazard and Risk Assessment 16th International Conference on Offshore Mechanics and Arctic Engineering Y okahama Japan (obtain proceedings from Port and Harbors Research Institute Yokuska Japan)
Bea R G (1997b) Risk Based Oceanographic and Earthquake Load amp Resistance Factor Criteria for Design and Requalification of Platforms Offshore Indonesia Report to Indonesian Petroleum Association Directorate General of Oil and Gas of Indonesia Pertamina and Bandung Institute of Technology Marine Technology and Management Group University of California at Berkeley
Bea R G (1997c) Risk Based Hurricane and Earthquake Criteria for Design and Requalification of Platforms in the Bay of Campeche Report to Petroleos Mexicanos Instituto Mexicano de Petroleo and Brown amp Root International Inc Marine Technology and Management Group University of California at Berkeley
Bea R G (1998) Continued Development of Earthquake Load and Resistance Factor Design Guidelines Report I - Concrete Gravity Base Structures LRFD Guidelines Report to the UK Health and Safety Executive Marine Technology and Management Group University of California at Berkeley
Beca Carter Hollings amp Ferner Ltd Indonesian Earthquake Study Seismic Zones for Building Construction in Indonesia 1979
Borcherdt R D (1994) Estimates of Site-Dependent Response Spectra for Design (Methodology and Justification) Earthquake Spectra The Professional Journal of the Earthquake Engineering Research Institute Vol 10 No 4 Nov
Bozorgnia Y Niazi M and Campbell K W (1995) Characteristics of Free-field Vertical Ground Motion during the Northridge Earthquake Earthquake Spectra Vol 11 No 2 Earthquake Engineering Research Institute Oakland California
Bray J D Chameau J-L and Guha S (1997) Seismic Response of Deep Stiff Clay Deposits Proceedings of the 5th International Conference on Earthquake Engineering Earthquake Engineering Research Center University of California at Berkeley
Chavez M (1987) Analisis de Riesgo Sismico en Varios Sitios de a Bahia de Campeche Elaborado para IMP Proy 6734 Mexico City MX
Chavez M (1997a) On the Seismic Hazard of the Campeche Bay Region Prepared for Meeting About the PEMEX Transition Normativity for the Bay of Campeche Berkeley CA March
Chavez M (1997b) Seismic Hazard and Design Spectra for Southern Gulf of Mexico 16th International Conference on Offshore Mechanics and Arctic Engineering OMAE 97
39
Proceedings of Earthquake Criteria Workshop Recent Developments in Seismic Hmard and Risk Assessments for Port Harbor and Offshore Structures Yokohama Japan April 17 American Society of Mechanical Engineers New York NY
Chavez M (1997c) Seismic Hmard at Sites of the Campeche Bay for the Risk Assessment of PEMEX Offshore Facilities Report to PEMEX and IMP August 10 Mexico City Mexico
Chavez M (1998) Seismic Hazard at Sites of the Campeche Bay for the Risk Assessment of PEMEX Offshore Facilities risks and Seismic Design Spectra in Areas of the Bay of Campeche Report to Petroleos Mexicano Instituto Mexicano de Petroleo and Brown amp Root International CISIND Col Jardines de Ajusco Talapan DP Mexico
Crouse CB and Quilter J (1991) Seismic Hazard Analyses and Development of Design Spectra for Maui A Platform Proceedings of the Pacific Conference on Earthquake Engineering Auckland New Zealand
Crouse C B and McGuire J W (1997) Site Response Studies for Purpose of Revising NEHRP Seismic Provisions Dames and Moore Consultants Seattle Washington
Dames amp Moore 1992 Final Report Seismic Hazard Evaluation Offihore Northwest Java Indonesia Report to Maxus Southeast Sumatra Inc Atlantic Richfield Indonesia Inc
Dames and Moore Seismic Risk and Site Response Study Proposed Rajah Platform East Kalimantan Indonesia Report No 02310-004-75 Report to Unocal Corporation
Dobry R (1991) Soil Properties and Earthquake Ground Response Proceedings of the Tenth European Conference on Soil Mechanics and Foundation Engineering Associazione Geotecnica Italiana Florence Italy
Dolan D K Crouse C B and Quilter J M (1992) Seismic Reassessment of Maui A Proceedings ofthe Offshore Technology Conference OTC 6934 Society of Petroleum Engineers Richardson Texas
EQE International Ltd ( 1998) Seismic Hazard Mapping of Offshore Britain Report to Health and Safety Executive London UK
Guerra R and Esteva L (1978) Espectros de Diseno Sismico en Paraiso Tab y Cuidad de Carmen Camp Patrocinado por Proyectos Marinos S A Instituto de Ingenieria UNAM Mexico City DP
Guzman R (1982) Bases de Riegso Sismico y Espectros de Riesgo Uniforme de la Bahia de Campeche Preparado para Instituto Mexicano de Petrroleo Proyectos Marinos Mexico DP
Lamport W B 1992 Seismic Analyses of Indonesias Rajah Wellhead Platform Unocal Corporation Science and Technology Division Project Report 91-23
Martin G R and Dobry R (1994) Earthquake Site Response and Seismic Code Provisions National Center for Earthquake Engineering Research Bulletin Vol 8 No 4 Buffalo New York
NORSAR and Norwegian Geotechnical Institute (1998) Seismic Zonation for Norway Report to Norwegian Council for Building Standardization
Norwegian Geotechnical Institute (1998) Effects of Local Soil Response on Earthquake Loading Report to Norwegian Council for Building Standardization
Nozu A and Iai S (1997) Seismic Hazard in Coastal Areas of Japan Proceedings of Earthquake Criteria Workshop Recent Developments in Seismic Hazard and Risk Assessments for Port Harbor and Offshore Structures Port and Harbor Research Institute Japan
40
Nozu A Uwabe T Sato Y Ichii K and Iai S (1997) Attenuation Relations for Peak Ground Motions on Base Layer in Japan Proceedings of Earthquake Criteria Workshop Recent Developments in Seismic Hazard and Risk Assessments for Port Harbor and Offshore Structures Port and Harbor Research Institute Japan
Risk Engineering Inc 1992 Seismic Hazard Analysis for the Offshore Kalimantan Sites Indonesia Report to Unocal Corporation March 27
Sleefe G E (1990) The Long-Term Measurement of Strong-Motion Earthquakes offshore Southern California Proceedings Offshore Technology Conference OTC 2345 Society of Petroleum Engineers Richardson Texas
Smith C E ( 1997) Dynamic Response of a Steel-Jacket Platform Subject to Measured Seafloor Earthquake Ground Motions Proceedings Eighth International Conference on the Behavior of Offshore Structures Vol 3 Pergamon Elsevier Science Ltd Oxford England
Untung M Buyung N Kertapi E Undang N Allen C R 1985 Rupture Along the Great Sumatran Fault Indonesia During the Earthquakes of 1926 and 1943 Bulletin of the Seismological Society of America Vol 75
Utsu T (1982) Catalog of Large Earthquakes in the Region of Japan from 1885 through 1980 Bulletin ofEarthquake Research Institute University of Tokyo Vol 57 pp 401-463
41
this page left blank intentionally
42

this page left blank intentionally
Chapter Page
1 Introduction 1
10 Objectives 1 11 Background 1 12 Earthquake LRFD Approach 2 13 RAM Based ISO Earthquake Guidelines 6
2 Earthquake Hazard Zones amp Uncertainties 11
20 Introduction 11 21 UK Sector North Sea 11 22 Norwegian Sector North Sea14 23 Japan 16 24 Indonesia 18 25 Mexico 2 1
3 Strength Level Earthquake Response Spectra 2 5
30 Introduction 2 5 31 Response Spectra Ordinatesbull2 5 32 Vertical Response Spectra Ordinates 2 6 33 Computed Response Spectra 2 9 34 North Sea Response Spectra 31 35 Bay of Campeche Response Spectra35
4 Summary Conclusions amp Acknowledgments 3 7
40 Summary3 7 41 Conclusions 3 8 42 Acknowledgments3 8
References 3 9
this page left blank intentionally
ii
Introduction
10 Objective The objective of this study is to continue development of earthquake load and resistance factor
design (LRFD) guidelines as follows
Part 1) concrete gravity based structure (GBS) LRFD guidelines (sponsored by Health and Safety Executive)
Part 2) seismic hazard characterizations (sponsored by STATOIL and UNOCAL) and
Part 3) verification of guidelines (sponsored by U S Minerals Management Service)
This report summarizes the results of the second part of this study seismic hazard characterizations Two primary topics are addressed
a) seismic zonation and uncertainties of the UK and Norwegian Sectors of the North Sea offshore Japan and Indonesia and the Bay of Campeche Mexico and
b) Strength Level Earthquake (SLE) elastic response spectra
11 Background A first-generation LRFD ISO guideline for design of steel pile supported template-type platforms
to resist earthquake induced loading has been developed (Bea 1991 1997a) This guideline was based on the API RP 2A LRFD guideline and on the collective experience and judgment of the ISO PS committee members During the first generation developments limited verification studies of the entire process were performed there was limited documentation of the background for some of the key developments and there were additional topics that needed to be addressed These topics have been discussed and the PS committee recommended that additional studies be conducted on the two topics cited above
The report titled Continued Development of Earthquake Load and Resistance Factor Design Guidelines Report 1 - Concrete Gravity Base Structures LRFD Guidelines documented the results of the first phase of this study (Bea 1998)
This study was organized as follows
bull obtain recent background on seismic hazard characterizations
bull detail seismic exposure uncertainties and local site response uncertainties
bull reconcile differences between current ISO seismic hazard guidelines and those developed during this study
bull document the revised seismic hazard and response spectra characterizations in a project technical report (Report 2)
1
1 2 Earthquake LRFD Approach The LRFD approach used to develop the proposed ISO earthquake design guidelines can be
expressed analytically as follows
ltPE RE~ YDI D1 + Yoz Dz+ Yu L1 +YE E
where ltPE is the resistance factor for earthquake loadings RE is the design capacity of the platform element (eg brace joint pile) for earthquake loadings as defined by the API RP 2A - LRFD
guidelines yDI is the self-weight of the structure (dead) loading factor D1 is the design dead loading
Yoz is the imposed equipment and other objects loading factor Dz is the design equipment loading Yu
is the consumables supplies and vessel fluids (live) loading factor L1 is the live loading YE is the earthquake loading factor and E is the earthquake loading effect developed in the structure or foundation element This development addresses the definition of the resistance factors ltPE and the
loading factors YE for loadings induced by earthquakes (Bea l 997a) The dead equipment and live
loading factors are set as y01 = Y02 =Yu = I I
The earthquake loading factor is determined using a Lognormal format (Bea 1991)
YE = Fe B exp (08 PE crE - 257 crE)
where Fe is the median effective loading factor B is the median bias (actual I nominal) in the
computed earthquake loadings PE is the annual Safety Index designated for the platform SSL crE is the total uncertainty associated with the earthquake loadings (standard deviation of the annual maximum earthquake loading) 08 is the splitting factor used to separate the uncertainties in earthquake loadings and platform capacities and the 257 is a consequence of defining the elastic design earthquake (Strength Level Earthquake) at an average return period of 200-years (257 Standard Normal deviations from the mean)
The effective loading factor for the platform system is expressed as
Fe= [microa r 1
where micro is the platform system ductility and a is the platform residual strength ratio
micro = dp de
a=AI Aep
dp is the maximum plastic displacement that can be developed by the platform system at failure de is the displacement at which first significant nonlinear behavior is indicated by the platform system A is the area under the platform loading - displacement to failure diagram and Aep is the area under an equivalent elasto-plastic platform loading - displacement to failure diagram
The total uncertainty associated with the earthquake loadings ( crE) is expressed as
where cr5E is the uncertainty in the earthquake horizontal peak ground accelerations is thecr05 uncertainty related to the local geology and soil conditions and their effects on the ordinates of the earthquake response spectra and crbulls is the uncertainty associated with the response spectrum method used to determine forces in the elements that comprise the platform
2
In development of the proposed ISO earthquake guidelines Type I (natural inherent aleatory) uncertainties are included in cr The effects of Type II (model parameter state epistemic) uncertainties are introduced with the Biases (actual value I nominal value) in loading effects and capacities This is done to develop as close as possible a correlation with the way in which the target Safety Indices and probabilities of failure were determined
The platform element resistance factor is determined from
ltlgtE = BRE exp (-08 ~E ltJRE )
where BRE is the median bias (actual value I nominal or code value) in the element earthquake loading capacity and is the crRE uncertainty in the earthquake loading capacity of the element
The proposed ISO earthquake LRFD approach proceeds through the following nine steps (Bea 1997a)
I Define the structure safety and serviceability level (SSL)
2 Define the earthquake hazard zone (EHZ) and seismotectonic conditions (Fig 121)
3 Determine if site specific seismic exposure study is required (Table 121)
4 Define the shape of the normalized mean elastic principal horizontal acceleration response spectrum for a specified damping ratio soil profile and seismotectonic condition (Fig 122 Table 122)
5 Determine the uncertainties associated with the seismic exposure response spectrum and the methods used to analyze earthquake forces induced in the structure (Table 123 Table 124)
6 Determine the earthquake loading factor ltYE) for the elastic response spectra forces
7 Evaluate the biases and uncertainties in the platform element design capacities
8 Determine if a ductility analysis is required and the performance characteristics for the analyses
9 Determine the platform element resistance factors (ltjgtE) for the design code based capacities
The remainder of this report will summarize the study of seismic hazard characterizations (Steps 2 and 5) based on results from recent studies and local site response spectra characterizations (Steps 4 and 5) In the context of the loading and resistance factor formulation summarized in Eqn ( 1) through (7) the key issues included in this study were
- the peak horizontal ground acceleration at a return period of 200 years (Fig 121) bull G200
crE - the uncertainty associated with the seismic environment
bull ltJas - the uncertainty related to the local geology and soil conditions and their effects on the ordinates of the earthquake response spectra and
bull Sa I G vs T - the shape of the normalized SLE horizontal acceleration response spectrum for a specified damping ratio of D = 5 (Fig 122)
3
Fig 121 middot Proposed ISO Earthquake Hazard Zones (EHZ)
Sa G
(log scale)
10
middot 005 0125
Period T sec (log scale)
Fig 122 bull Proposed ISO Strength Level Earthquake Normalized Elastic Horizontal Acceleration Response Spectrum
4
Zone SLE G SSL 1 SSL 2 SSL 3 SSL 4 (1) g (3) (4) (5) (6)
2
Should 0 0-5 Allowed
1 5 -15 to use
2 15 -25 these
3 25 -35 guidelines
4 35-45
5 45 -55
Table 121 - Proposed ISO Earthquake Hazard Zones SLE Ground Accelerations (G) and Structural Serviceability amp Safety Levels (SSL)
Table 122 - Proposed Local Geology and Soil Conditions Parameter and Seismotectonic Characteristics Parameter E
Soil Conditions ( 11
SC - A Rock (Vs ~ 2500 fps)
SC - 8 Stiff to very stiff soils gravels (Vs = 1200 to 2500 fps)
SC - C Sands silts and very stiff clays (Vs= 600 to 1200 fps)
SC - D Soft to medium stiff clays (H = 10 to 200 ft Vs s 600 fps)
SC - E Site specific studies required
I
10
12
14
20
Seismotectonic Condit 121
Type A Shallow crustal faulting zones
Type 8 Deep subduction zones
Type C Mixed shallow crustal amp deep
subduction zones
Type D lntraplate zones
Default value
ions
E
10
08
09
08
10
5
Table 123 Seismic sources and
attenuation uncertainties
Table 124 Uncertainties associated with
local geology and soil conditions
Seismotectonic Characteristics
Shallow crustal fault zones
Deep subduction zones
Mixed shallow crustal fault and deep subduction zones
Intraplate zones
OsE
10
14
12
20
Geology Soil Conditions
-A
SC - B SC - C
SC - D
SC - E
OGs
030
040
040
050
050
13 RAM Based ISO Earthquake Guidelines
The approach used to develop the ISO earthquake guidelines for design and requalification are based on a Risk Assessment and Management (RAM) approach in which the seismic conditions are integrated with the performance characteristics of alternative platform configurations to define the reliabilities and risks associated with these configurations The earthquake design and requalification criteria are the basic product ofa desired reliability ofthe platforms
This is a very different approach than has been used traditionally to specify earthquake criteria for onshore facilities Traditionally earthquake criteria has been the result of two generally uncoordinated developments The first development came from geologists seismologists and earthquake engineers They were responsible for the characterization of the earthquake excitation that would be used for design of structures The basis for their characterization was some earthquake return period Often this was based on specification of a life of the structure and an acceptable probability of exceedance For example buildings were often designed for a 50 year life with a 10 percent probability of exceedance This is equivalent to design of the structure for an earthquake that has a return period of about 4 75 years The seismologists would then define design earthquakes that would be representative of the different types of earthquakes that could be experienced Representative earthquake time histories and elastic response spectra were often used for this definition
The second development came from structure design engineers They were responsible for the determination of how the structures would be configured and designed They defined the factors of safety that would be used in design of the structures Often the design procedures and factors of safety were the result of past of experiences with the performance of buildings that had experienced intense earthquake excitations If the performance of components in buildings proved to be
6
insufficient the configurations procedures and factors of safety were changed to improve the performance
The RAM procedure used in development of the ISO earthquake guidelines is based on an integration of the two developments and is focused on the reliability of the resulting structure In this instance the earthquake design spectra and design procedures are intimately related The design spectra characteristics are a direct consequence of the defined reliability and the procedures and processes that are used to configure and proportion the structure This point can be illustrated by the following RAM based equation to define the design elastic horizontal response spectra ordinate (Sa0 )
for a structure that has a given natural period (Tn) and damping ratio (D) (Fig 122)
Sa0 = (Ru50 I Fe M) (BRu I BFQ ) exp (~Q ltJQ - Z0 crFQ)
Ruso is the median static ultimate lateral loading capacity of the structure Fe is the factor that recognizes the combination of the transient earthquake induced loadings and the nonlinear hysteretic performance characteristics of the structure M is the total effective mass of the structure including the structure live and dead masses and hydrodynamic masses (often the total mass of an offshore structure is 50 to 70 hydrodynamic mass) ~Q is the design Safety Index for the structure
(directly related to the structure reliability or its compliment the probability of failure) crQ is the total uncertainty in the structure capacity and the earthquake induced loadings (square root of the sum of the squares of the standard deviations of the logarithms of the structure capacity and earthquake loadings)
Z0 is a factor that depends on the return period that is used to define the design earthquake often this is taken to be a 100-year or 200-year condition for elastic working stress or load and resistance factor design formats for 100-year and 200-year return periods Zo =233 and Zo =257 respectively (this is the number of standard deviations from the mean to the 99-th and 995-th
percentiles respectively) crFQ is the uncertainty in the earthquake loadings induced in the structure BRu is the median bias in the structure ultimate capacity (best estimate or true value divided by nominal or predicted value) BQ is the median bias in the earthquake induced loadings (demands) If unbiased estimates are used to determine the earthquake loadings and structure capacities the biases are unity
The factors Tn D Rus0 Fe and M are fundamentally structural design factors that depend on the structure materials configuration and proportioning ~Q is a derivative of the desired or accepted
reliability of the structure crFQ is a derivative of how the structure responds to the earthquake (induced loadings or forces) and the long-term uncertainty in the earthquake ground accelerations The total uncertainty crQ reflects the uncertainties in both the structure capacity and the earthquake induced
loadings It should be apparent that the spectral acceleration is a direct product of structure and reliability considerations and can not or should not be developed or defined in isolation of these considerations
In the long period range (Tn ~ = I sec) the spectral acceleration can be expressed as
Sa0 = (KE 1J1 I Tn) G0
7
K expresses the number of standard deviations of the response spectra ordinate from the mean value If other than the mean value is used (K = I) then the bias in the earthquake loadings must be recognized e is a factor that depends on the seismotectonic (earthquake sources) environment (for
strike slip sources e 10 and for subduction zone sources E 08) lj1 is a factor that depends on the
local geology and soil conditions (ljl 18 for deep soft alluvium and lj1 = 08 for rock or very strong sedimentary formations) 0 0 is the design ground acceleration that is defined at the specified return period It is apparent that the majority of these factors are those that should be determined by the earthquake engineer or geo-seismologist
Based on the RAM approach the design or requalification spectrum (Sa vs Tn) is dependent on an explicit and integrated evaluation of the following categories of factors
I) characteristics of and uncertainties in the seismic - tectonic - geologic earthquake conditions (expressed with G ljf E BQ crFQ)
2) characteristics of and uncertainties in the seismic performance characteristics of the structure and the associated process used to design or requalify the structure (expressed with Ru Tn D Fe M Z0 K crRu B) and
3) the target reliability for the structure (expressed with~)
The foregoing RAM based development results in an intimate integration of
1) managements direction regarding acceptable or desirable reliability of a structure
2) input from the earthquake engineer or geo-seismologist and
3) input from the structure design engineer
In this context the design conditions or design spectra can not and should not be developed in isolation by the earthquake engineer or geo-seismologist Many of the earthquake and structure parameters involved in the RAM are highly coupled they can not and should not be separated for examplethe loads induced in the structure by earthquake ground motions are a direct function of the characteristics of the structure
It is important to recognize that the RAM based earthquake spectrum that is used to design or requalify a structure explicitly incorporates the uncertainties in the seismic environment For example even though a mean spectrum is used in the specification given to the engineer the potential for ground motions that are much larger or more intense are directly recognized in the uncertainties attributed to the mean spectral ordinates One should not be unduly concerned when peaks in some response spectra exceed the design or requalification spectrum The uncertainties in the ground motions have a direct impact on the factors of safety and Reserve Strength Ratios that are specified for a particular structure More uncertainty leads to larger factors of safety and Reserve Strength Ratios
8
There are four major parts to the seismic exposure models used to characterize earthquake ground motions (Fig 131)
1) characterization of the seismic sources
2) characterization of the transmission of earthquake energy from the sources to the site
3) characterization of the local geology and geotechnical effects on the free-field motions of the soils and
4) description of the soil-structure interactions that develop during the earthquakes (near-field motion characterizations)
For pile supported platforms the pile foundations supporting the platforms receive their input energy from earthquakes from two distinctly different points in the soil column The input of lateral energy occurs below the sea floor where the maximum lateral earth pressures can be generated on the piles (Fig 132) Generally this point is located at five (stiff soils) to ten (soft soils) pile diameters below the sea floor Frequently the seismic exposure characterizations are developed for the level of the sea floor This is not appropriate for pile supported offshore structures This can be appropriate for mat supported structures that receive the majority of their support from the soils in the immediate vicinity of the sea floor The error introduced by the sea floor reference for the earthquake characteristics will be dependent on the soil profile and soil characteristics If there is a substantial layer of soft clays or soils overlying the stronger soils then the bias introduced by the sea floor reference can be very large (15 to 20)
The input of vertical energy for pile supported offshore platforms occurs at the point along the pile where the soil - pile shaft
SOILmiddot PILE INTERACTION
llllllllll
TRANSMISSION AT TE NUA T ION
EARTHQUAKE SOURCE
Fie 131 - Primarv Comoonents of PIP mal
0 oi-----oi2=---~-o4---~--ors~~-oie-~-lmiddotc gt 12 IN
SOltL-PILE 8
~ 40~~~+-~~middot~~~-P~-+--=~~
Fig 132 - Earthquake Effects on Pile Foundation Lateral Soil Pressures
9
shears are maximized This is generally along the bottom one-third of the pile shaft This can be a depth below the sea floor of I 00 m or more Because most attenuation relations are developed for onshore conditions and recorded earthquakes where there is a dramatic change in the impedance ratio at the earth surface and hence large reflections of the vertically propagating compression earth waves these attenuation relations incorporate these reflections and shallow effects Offshore at the sea floor there is no dramatic change in impedance for vertically propagating compression waves at the sea floor (saturated sediments interface with the water column) Thus attenuation relations for onshore conditions generally tend to dramatically overestimate the vertical motions at the sea floor This can be important for mat-supported offshore structures It is also important for pile supported platforms whose vertical motion characteristics are based on measured data from onshore surface locations
10
Earthquake Hazard Zones amp Uncertainties
20 Introduction During this study access was obtained to recent earthquake hazard exposure studies from the
following regions
bull UK Sector North Sea
bullNorwegian Sector North Sea
bullJapan
bullIndonesia
bullMexico
This Chapter summarizes the results from these studies as they pertained to the characterization of the seismic zones the design SLE horizontal ground accelerations and the uncertainty associated with the seismic environments
The author contacted three firms known internationally for their expertise in seismic exposure assessments EQE International Dames amp Moore Consultants and Geomatrix Consultants The author was not able to obtain any significant information that could be used to revise the current ISO seismic zonation maps Uniformly the firms deg felt that this information was confidential since it had been developed for clients
2 1 UK Sector North Sea Based on the study performed by EQE 55
International (1998) Fig 211 shows the Magnitudes and epicenters of earthquakes that have affected the North Sea area during the period from 1904 through 1990 There have been 7 earthquakes having magnitudes greater than M = 5 during this period
Based on the seismotectonics of this region EQE developed two zonation models one with 38 area zones and the second with 26 area zones The historic seismicity was associated with these zonation models an attenuation characterization
bull
bullbull bull
bull bull bull
0 LONGITUDE f
MAGNITUDESmiddot bull 5 bull 4 bull 3
based on an synthesis of attenuation models appropriate for the seismotectonic characteristics Fig 211 - UK Sector Historic of this area and peak ground accelerations (PGA) Earthquake Epicenters and Magnitudes
11
56
-10middot bull bullbull bullbull --shycontoura (rnta2) for shy eXCMdanct ~dM-3
middot10 bullbull 62
ID
56 56
$4 54middot I
$2 52
______ ~tomiddot -amiddot bullbull bullbull
Fig 212 middot 200-Year Peak Ground Fig 213 middot 10000 Year Peak Ground Acceleration Contours Acceleration Contours
on rock or very hard soil determined The results are summarized in Fig 212 and Fig 213 for return periods of 200 years and 10000 years respectively Although not explicitly stated in this report it is presumed that these return periods incorporate the uncertainties associated with the attenuation relationships To be consistent with the definition of earthquake uncertainties used in the proposed ISO earthquake guidelines the uncertainty associated with the attenuation relationships need to be incorporated into the seismic hazard characterizations
Fig 212 could be used as a basis for an ISO micro-zonation map of the UK Sector of the North Sea The PGA generally range from 0015 g to 0030 g The current ISO guidelines for this region indicate a seismic zone of 1 with PGA = 005 g to 015 g The lower end of this range provides a conservative estimate of the Strength Level Earthquake (SLE) conditions for this region
Fig 214 summarizes the results from the EQE study in the form of the horizontal Peak Ground Accelerations (PGA) versus the average return periods for two locations one in the southern portion of the UK Sector (54 degrees north) and one in the northern portion (58 degrees north) These results can be used to determine the uncertainties associated with the earthquake ground motions In the proposed ISO guidelines the earthquake uricertainties in annual expected PGA are based on a Lognormal distribution that is fitted to the extreme values and expressed with the standard deviation of the logarithms of the expected annual maximum PGAs crE If it were desirable to base the fitted
12
025
1000 Return Period - years
Fig 214 - Peak Ground Accelerations for Southern and Northern Locations
Lognorrnal distribution on the 10000 year and 100 year return period PGAs the uncertainty could be found from
crsEmiddot = 072 In (G 10000 I G 100 )
For the southern location
crsEmiddot = 072 In (024 g I 0024 g) = 166
For the northern location
crsEmiddot =072 In (010 g I 0010 g) = 166
The proposed ISO guidelines suggest a value of crE = 20 for the intraplate seismotectonic characteristics of this region Again the proposed ISO guidelines provide a conservative estimate of the seismic exposure uncertainties
If it were desirable to base the characterization of the seismic exposure uncertainty on the I 0000 year and 1000 year PGAs then
crSE = 161 In (G 10000 JG 1000 )
Based on the results developed by EQE for the southern location
cr5E = 161 In (024 I 0085) = 167
and for the northern location
crsEmiddot =161 In (010 I 0035) =169
The seismic uncertainties are not sensitive to the extreme earthquake return periods used to fit the equivalent Lognorrnal distributions
13
72bull
70middot
eamiddot
eamiddot
[] 74bull --middot
72bull
64
82
64 eomiddot eomiddot
eamiddot 118
eamiddot 118
54bull amp4
22 Norwegian Sector North Sea Based on the study performed by
NORSAR and the Norwegian Geotechnical Institute (1998) Fig 221 summarizes the historic earthquake epicenters and magnitudes The zonations used in the seismic exposure analyses are also shown The NORSAR study shows that these earthquake epicenters are closely associated with faulting in the region Study of recent earthquake records shows that the majority of the earthquakes originate on reverse thrust faults characteristic of intraplate seismotectonic regions
The historic seismicity developed by NORSAR was associated with the zonations indicated in Fig 221 an attenuation characterization based on an synthesis of attenuation models appropriate for the seismotectonic characteristics of this area (calibrated with recordings from recent earthquakes) and peak ground accelerations (PGA) on rock determined The results are summarized in Fig 222 and Fig 223 for return periods of 100 years and 10000 years respectively
Site specific studies performed to determine the 100-year return period earthquake peak ground
Fig 221 - Norwegian Sector Earthquake acceleration can be converted to the Epicenters Magnitudes and Seismic Zonation200-year PGA (= G) with following
relationship
= G100 exp (024 crE)0 200
Fig 222 could be used as a basis for an ISO micro-zonation map of the UK Sector of the North Sea The 200-year PGA generally range from 0015 g to 008 g The current ISO guidelines for this region indicate a seismic zone of 1 with PGA = 005 g to 015 g The lower end of this range provides a conservative estimate of the Strength Level Earthquake (SLE) conditions for this region
Fig 224 summarizes the results from the NORSAR study in the form of the horizontal Peak Ground Accelerations (PGA) versus the average return periods for two locations one in the southern portion of the Norwegian Sector (62 degrees north) and one in the northern portion (66 degrees north) Based on the fitted Lognormal distribution to the 10000 year and 100 year return period PGAs the uncertainty for the southern location is
OsEmiddot =072 In (033 g I 0042 g) =148
14
For the northern location
cr5E = 0 72 In (027 g I 0027 g) = 166
80
Fig 222 middot 100-Year Peak Ground Acceleration Contours
Fig 223 middot 10000 Year Peak Ground Acceleration Contours
The proposed ISO guidelines suggest characteristics of this region This value provides a conservative estimate for this region
Basing the characterization of the seismic exposure uncertainty on the 10000 year and 1000 year PGAs then for the southern location
OsEmiddot = 161 ln (033 013) = 149
and for the northern location
OsEmiddot = 161 In (027 I 010) = 160
These values again are in excellent agreement with those based on the 100-year and 10000-year PGA
a value of crE = 20 for the intraplate seismotectonic
0 100 1000
Return Period - years
Fig 224 middot Peak Ground Accelerations for Southern and Northern Locations
15
104
23 Japan Fig 231 summarizes the
earthquake epicenters and magnitudes in the region surrounding Japan during the period 1885 through 1995 (Utsu 1982) The data set includes more than 500 seismic events having magnitudes greater than M -= 60 Attenuation relations for peak bedrock accelerations were based on results from a recent study of recorded earthquake motions in Japan (Nozu et al 1997) The standard deviation of the attenuation
relationship was found to be crnPGA = 062 This value characterizes the uncertainty associated with the attenuation relationship
Fig 232 summarizes the results of the seismic exposure study for the Yokohama Port (Nozu Iai 1997) The 20 largest peak bedrock accelerations are shown as a function of the return period The data are fitted with a Weibull distribution and with a Earthquake Hazard Study Lognormal distribution that is fitted to the tail of the Weibull distribution Similar fits were developed for a large number of coastal middot offshore sites and similar results developed
Based on these results a seismic hazard map for the peak bedrock acceleration having a 200 year return period was developed (Fig 233) The PGA range from 005 g to 050 g The proposed ISO seismic zonation for this area ranges from 2 to 5 and thus indicate PGA =015 to 025 g to PGA = 045 g to 055 g The proposed ISO guidelines provide a conservative estimate of the 200-year PGA An ISO Japan annex could be developed that would utilize the information shown in Fig 2 3 3 as the micro zonation map for coastal - offshore Japan
This study also developed a mapping of the standard deviation of the Lognorrnal peak bedrock acceleration distribution that considered both the variability in the Lognormal distribution for the expected PGA and the uncertainty in the attenuation relationship (Fig 234) The results indicated standard
1885-1995 A Mlt60 bull deg 0 f 0 60ltMlt65 middot~ 0
bull00 0 0 0 0
0 65ltMlt70 fgt bull degii ~ OO I
0 70ltMlt75 deg o AkitaPort o0 bull
o 75ltMlt80 8 deg e 80ltM
bull
bullbullbull Kobe Port
bull
bull
bull
bullbull ltP
Fig 231 bull Seismic Event Data Used in Japan
middotmiddotmiddot-middot-middotmiddotmiddotmiddot+middotmiddot
1o 10 10
Return Period [at)
Fig 232 bull Peak Bedrock Acceleration and Return Period at Yokohama Port
16
Fig 233 - 200 Year Bedrock PGA Fig 234 - Standard Deviation of Lognormal Expected Annual Maximum
PGA
deviations of the Lognormal peak bedrock accelerations distributions that ranged from cr5E = 08 to cr5E
= 10
The value suggested in the proposed ISO guidelines for the seismotectonic conditions in this region
is cr5E = 10 Thus the proposed ISO guidelines provide a conservative estimate of the uncertainties associated with the seismic exposure of this region
17
24 Indonesia The extreme condition
earthquakes offshore Indonesia are dominated by two principal seismic sources (Beca Carter Hollings amp Ferner Ltd 1979 Dames amp Moore 1992 Untung et al 1985) The major tectonic feature in the region is the Sunda Arc which Figure 241 - Locations Offshore Indonesia extends approximately 5600 km between the Andaman Islands in the northwest and the Banda Arc in the east This feature results from convergence and subduction of the Indo-Australian plate beneath the Southeast Asia plate
The Sunda Arc consists of three primary tooOE 110oe
segments the Sumatra segment (A-1 - A-5 Figure 241 ) the Sunda Strait segment (between A-1 - A-5 and G-1 - G-7 Figure 10
middot 100N
241) and the Java segment (G-1 - G-7 Figure 241) (Dames amp Moore 1992) The locations A-1 to G-1 lie along the northern edge of the Sunda Arc The locations A-5 to G-7 lie along the axis of the Sunda Arc 0
These locations represent the area of greatest seismic exposure
There have been several great (Magnitude in excess of 775) earthquakes recorded along the Sunda Arc during this century (Figure 242) More than 150 surface Magnitude 70 or greater earthquakes 1100E
have occurred along this Arc during this MAGNITUDES lt40 0
century (Beca Carter Hollings amp Ferner Ltd 1979) The majority of these earthquakes
so e 60 70
have had focal depths (Figure 243)
in excess of 70 km Figure 242 - Epicenters of Indonesian
Earthquakes 1900 - 1996 The second primary source of
earthquakes are shallow crustal faults that generally parallel the Sunda Arc (east - west) with some transform surface faulting that marks the north - south trending boundaries of the land masses (Figure 243) The majority of recorded shallow source (less than 70 km) earthquakes that have occurred during this century have occurred along the Sunda Arc zone Several hundred shallow focus earthquakes in the Magnitude range of 40 to 70 have occurred in this zone during this century In
bull
bullmiddotmiddotmiddot bull
18
the v1cm1ty of the area indicated as Raja (Dames and Moore 1990 Lamport 1992 Risk Engineering Inc 1992) in Fig 241 there have been in excess of 12 events with magnitudes between 50 and 70 during the past century (Figure 244)
Figure 245 summarizes a proposed seismic zonation for offshore Indonesia (Bea l 997b) The zone designations are associated with the 200-year peak ground accelerations at the sites as follows
Zone I G = 005g to 015 g
Zone 2 G =015g to 025g
Zone 3 G = 025g to 035 g
These seismic zonations are consistent with those contained in the proposed ISO seismic guidelines
North -SOO -400 -300 -200 -100 0 100 200 300 400
South
0
100
200
300
400
~ 3 500
~ 600
700
800
(gt 0
CXJ) coo 0 ltli)
0
0
o~ bull
0
0 0 ~ltJOO
(J 0
MAGNITUDES lt40 0
50 0
60 8 70
900--~~~~~~~~~~~~~~~~~~
Figure 243 - Hypocentral Profile of Java Central Segment Normal to Sunda Arc - Earthquakes 1900 shy
1996
In some areas site specific studies have been performed to determine the 100-year return period earthquake peak ground acceleration To convert the 100-year G to the 200-year G the following relationship can be used
G200 = G100 exp (024 crE)
where OsE is the uncertainty in the long-term distribution of G (assumed to be Lognormally distributed)
Based on the results from the recent studies of extreme earthquake conditions that have been performed in this area Figure 246 summarizes the expected annual maximum peak ground accelerations (Gm) for the locations shown in Figure 241 The expected peak ground accelerations having return periods of 100 years at the locations ranges from 010 g to 012g (Gl Al) to 017 g to 022 g (G7 -A5)
bull J011lt40 O 4011lt4IS0 _ _ D SISllltS4
0 1bullMlt72
D 72111lt10
oeow
Figure 244 - Earthquake Sources and Magnitudes in Kalimantan Region
19
I
Figure 245 - Seismic Zonation for Offshore Indonesia
The uncertainties (natural variabilities) in the expected annual earthquake peak ground accelerations (Gm) range from crsE = 060 to 070 (A-1 A-5 G-1 G-5) to crsE = 18 to 20 (Raja) These values are consistent with the proposed ISO guidelines for this region and seismotectonic conditions
The available regional and site specific information on earthquake conditions indicates that there are two general categories of Type I uncertainties associated with the primary seismic sources The first category is associated with those locations that are adjacent to the Sunda Arc These locations very frequently experience earthquakes from both shallow and deep sources (Fig 243) Those locations have Type I uncertainties in the expected annual earthquake peak ground accelerations that range from crsE = 060 to 070
The second category of locations is 111
associated with those locations that are middotm 06~~ distant from the Sunda Arc These c locations much more infrequently ~
Iexperience earthquakes primarily from 111 01~~=1 shallow sources These locations have fi
-A-1Type I uncertainties in the expected ~ - bullA-5 --bullG-1annual earthquake peak ground ~ -G-7
accelerations that range from crsE = s bullbullbullbullbullRaiae
180 to 200 (Raja) ~ 001 100 1000 10 4
fl Average Return Period - years
Figure 246 - Expected Annual Maximum Earthquake Peak Ground Accelerations at Study
Locations
20
25 Bay of Campeche Mexico The information on earthquake seismic
100hazard characteristics for the Bay of bullbullbull Campeche Mexico was provided by Chavez (1987 1997a 1997b 1998) Additional information on the earthquake characterization was provided by Guerra and Esteva ( 1978) and Guzman ( 1982)
The seismic environment is influenced by three primary types of earthquake sources (Figure 251) The Type 1 source is associated with the subduction zone on the western Pacific coast of Mexico The earthquakes in this zone occur at depths of 15 km to 20 Km and have magnitudes up to M = 8 2 The Type 2 source is associated
EXPLANATIONwith the lithospheric slab within the central Tectonostratigraphic province boundaryportion of Mexico Earthquakes occur in
0 300km ~this zone at depths of 60 km to 250 km and Thrust taubull teeth on upper plate
have magnitudes up to M = 75 The Type Plate moliona rates in cnvyr -3 source occur in the Trans-Mexican volcanic belt located primarily along the east coast of Mexico have depths up to 20
CMbull C-Muatt CaP c-n Piiie CoP bull Cocoo Plate CTbullkm and magnitudes up to M = 67 (Chavez Caymmn Traugh MATbull Middle Atllrtic Trench MFZ bull Mot1QU8 Faull Zone 1987 1998) MSG bull Mlcl1oaean SMmic Gap NOAM bull -h American Piiie OFZ bull Orozco
Fracture Zone Ind ndgn SCbull ~a-ptOYince SMQCP bull Sietra Madre OrierltllmiddotChipu P116n ptOYince TRbull Tehuamepec Ridge TSG bull
The historic catalog of earthquake Tlhuon--Gap
occurrences during the period 1970 - 1996 Figure 251 - Bay of Campeche Earthquake
NOAM
SC I
I I
I
I Campeche Bay
I I
lt~
MAT
CoP
were used by Chavez to determine the activity rates in each of the three sources and the occurrences of varying
2400earthquake intensities and magnitudes in each of the 2300
three sources Figure 252 0 2200shows the seismic events that 0 8
have occurred in this region 0 2100 0during the period 1800 to bull
20001996 for all earthquakes that 0
1900have surface magnitudes (Ms) greater than M = 50 The 1800
majority of records contained 1700in this catalog date from the
1930s when reasonably 1600
comprehensive teleseismic 1SOO
instrumentation was in place The largest earthquakes 1400
that have occurred in the ~v1c1rnty of the Bay of ~
Campeche are in the range of M = 30 to M = 40 The
Plate Tectonics and Sources
+ + + + + + + + + + + +
+ + + + + + + + ++ + +
+ + + + + + + + + + + +
0 + + +
+
+
+
+
degamp + + + + + + + + + + +
o +
0 +
~ ~ 8 8 8 ~ ~ ~ ~ ~ N ~ ~
~ 0~ bull bull ~ bull ~ bull ~ ~ bull
2400
Z300
2200
2100
2000
1900
1800
1700
1600
IS00
1400
~ bull
Figure 252 bull Seismic Events Affecting the Bay oflargest earthquake that has Campeche Region 1800-1996 Events M gt 50
21
occurred during the past 100 years within a 100 km radius of the Bay of Carnpeche is M = 60 The vast majority of the seismic activity is concentrated along the Pacific coast of Mexico The source of nearby large earthquakes are associated with the Motagua Fault Zone and the fault system (Sierra Madre Oriental-Chipas Peten province) that generally parallels the east coast of Mexico There are no major seismic sources that have been identified within the Sigsbee-Carnpeche province that underlies the Bay of Carnpeche
Based on previous analyses of pile supported platforms subjected to earthquake excitations in soil columns of the Bay of Carnpeche a depth below the sea floor of -12 m was chosen to reference the lateral accelerations and a depth of -115 m was chosen to reference the vertical accelerations from the seismic exposure analyses (Bea 1997c)
Figure 253 summarizes the results for the Bay of Carnpeche for each of the three seismic sources A mean or average value for the four representative soil columns studied by Chavez (1997a) are shown The Type 2 and Type 3 sources develops ground motions that dominate the seismic exposure in the Bay of Carnpeche At an average return period of 10000 years the indicated peak horizontal ground acceleration (Am) is indicated to be Am~ 025 g Table 25 l summarizes the ground motions at return periods of 200 and 4000 years and the uncertainties (natural or Type I aleatory) associated with the ground motions (expressed as the standard deviation of the logarithms of expected annual G
QISE)
-CE CCI iObull -shyCJ _UI 01
iii Cl -ccI
2omiddot = o ca z G lo ii ca u GI U 0 ct
001
-shy--
- - - - - shy - - - -
bullbullbull-Zona 1 -zona2 --bullZona 3
-shy---shybullmiddotmiddotmiddotmiddot -shy__- --middot~middotmiddotmiddotmiddot
-
~ -shy middotmiddotmiddotmiddotmiddotmiddot
middotbullmiddotmiddotbullmiddotbullmiddotmiddotmiddotmiddotmiddotmiddot middotmiddotmiddotmiddotmiddotmiddotmiddotmiddotmiddotmiddotmiddotbullmiddot - - middotbullbullbullbullbull ~
41000 10
Return Period - Years
Figure 253 middot Peak horizontal ground accelerations
Table 251 middot Mean Horizontal PGA at Bay of Campeche sites (middot12m) and uncertainties of peak horizontal ground accelerations
Type 200 years shyg
1000 years -g
Uncertainty
QSE
I 12 16 058 2 50 78 084 3 27 68 175
22
These results can be compared with those developed by Guerra and Esteva ( 1978) for the Bay of Campeche and firm alluvium sites At a return period of 100 years the peak horizontal ground acceleration obtained by Guerra and Esteva is G = 66 g This compares with a maximum value of G =50 g obtained by Chavez (1998) for a 100 year return period for the Zone 2 sources The results developed by Guerra and Esteva indicate an uncertainty in the annual expected peak horizontal
ground acceleration of OsE = 126
The extensive Bay of Campeche seismic exposure study performed by Guzman ( 1982) provides some additional information on the expected ground motions At a return period of 100 years the peak horizontal ground acceleration obtained by Guzman is G = I 0 g This ground motion is more intense than developed by either Chavez or Guerra and Esteva The more intense ground motion appears to be coupled with the attenuation relationships that were developed and used by Guzman ( 1982) The results developed by Guzman indicate an uncertainty in the annual expected peak
horizontal ground acceleration of OsE = 097 This uncertainty is slightly greater than that of the Chavez results and somewhat less than indicated by the Guerra and Esteva results
The proposed ISO guidelines for this region indicate a 200-year PGA in the range of 005g to 015g The lower end of this range provides a good estimate of the seismic characteristics in the Bay of Campeche The uncertainties in the annual maximum PGA are consistent with those given in the proposed ISO guidelines
The Type 1 and Type 2 sources have uncertainties in the expected annual maximum Am that are comparable with that of offshore California The Type 3 (coastal - local) sources have an uncertainty that is comparable with intra-plate seismic zones Based on the results provided by Chavez (1997a) Table 252 summarizes the mean vertical peak ground accelerations at a depth below the sea floor of shy115 m together with the associated uncertainties
Table 252 middot Mean Vertical PGA at Bay of Campeche sites (-115m) and uncertainties of peak horizontal ground accelerations
Type 200 years shyg
1000 years - g
Uncertainty
() SE
1 02 03 075 2 09 12 055 3 02 03 075
23
this page left blank intentionally
24
Strength Level Earthquake Response Spectra
30 Introduction Strength Level Earthquake (SLE) elastic response spectra were assessed in the several of the
studies of regional seismicity discussed in Chapter 2 The SLE response spectra developed for each of these regions will be summarized in this Chapter In addition results from recent general studies of response spectra will be summarized including consideration of water column effects on vertical motions
3 1 Response Spectra Ordinates Recent studies of response spectra ordinates in the low period range (01 sec to 03 sec) have
indicated that one should expect that these ordinates will vary as a function of both the local soil conditions (soil column classification)and intensity of earthquake motions (Martin Dobry 1994 Crouse McGuire 1997) Figure 31l summarizes the results from the study by Crouse and McGuire of the median amplification factors (Fa = peak horizontal ground acceleration at surface I peak horizontal ground acceleration on rock= PGAs I PGAr) for periods (T) in the range of T = 01 sec to 03 sec
The site soil conditions indicated as SC-A B C and D correspond to those in the proposed ISO guidelines The amplification factor in this period range presently incorporated into the proposed ISO guidelines is Fa= 25 for all soil conditions These results indicate substantially larger amplifications in the short period range While these findings would relatively unimportant for the lateral motions of most offshore platforms (T = 2 to 3 sec) the effects would be potentially important for the vertical motions (T = 01 to 03 sec) of these structures (particularly for heavily loaded deck structures with large cantilevers) The National Center for Earthquake Engineering Research (NCEER) workshop defined a comparable range of amplification factors for this period range (Martin Dobry 1994)
As a result of these findings the following modifications to the proposed ISO earthquake guidelines are proposed The elastic design
tf 55 0 5 uu ~
SC-Aftl Ill ~ - S111 seaLI 111 45 CM -bullmiddotsec0 SC-0middot-Cl 4 iii 0 ~tbull~bullFbull~bullbull~~middotmiddotmiddotmiddotmiddotr-Eu
35
Qci -~-11--~---F=--- --imiddot-- middotmiddotmiddotmiddotmiddotmiddotmiddotmiddotmiddotmiddot---- -middotmiddot------ ---1-----shyE II 3
lt1shyCJ~ 25 -----middot----middot-----c ~
2 CJ 01 015 02 025 03 035 04
Peak Ground Acceleration - gs
Fig 311 - Amplification factors as function of acceleration level and soil conditions
25
response spectra (Figure 312) would 10 - - - --~ be a function of the following variables
Sa I G = vbull T = period of system
bull D = damping of system
bull v = site classification factor for short period range (new factor)
~ Sa I G =~Tla___~
bull I = site classification factor for 0=5long period range L------__________bull E =seismotectonic conditions 01
001 01 1
Period - T (sec) Table 3 11 summarizes the elastic
design response spectra characteristics Fig 312 bull Proposed elastic design responsebased on the results of the work by spectra Crouse and McGuire (1996) and the previous work incorporated into the proposed ISO design response spectra
Table 311 - Local geology and soil conditions parameters for SLE response spectra
Soil 1-ondibons Se1smotectonic Lond1tions
Site 1-lass v I E
SC-A 25 10 Type A 10
SC-B 33 12 TypeB 08
SC-C 35 14 TypeC 09
SC-D 45 20 TypeD 08
SC-E Site specific studies required Detault value 10
3 2 Vertical Response Spectra Ordinates Several recent large magnitude earthquakes have indicated that vertical ground motions can be
equal to or greater than the horizontal ground motions This observation has been particularly true for ground motions close to the epicenter of large magnitude earthquakes The present ISO guidelines prescribe an elastic design response spectrum for vertical motions that is one-half of the horizontal motions
Figure 3 21 summarizes results from a recent study of the ratios of vertical to horizontal spectral ordinates as a function of the response frequency (Bozorgnia Niazi Campbell 1995) Results for the Loma Prieta and Taiwan earthquakes are shown The ratios indicated are mean values The horizontal line indicated at the ratio of 23 references the present Uniform Building Code (UBC) specifications For near-by earthquakes (R = l 0 km) the ratio of the vertical to horizontal spectra ordinate for periods
26
in the range of T = 01 sec are in the range of 14 to I7 The ratio is close to unity at distances of R = 20 km to 30 km Comparable results have been found for other large magnitude earthquakes in other sernismotectonic zones
For periods in the range of T = 2 to 3 sec the ratios are in the range of 02 to 03 for all distances Current studies of recordings from different earthquakes generated by different types of seismotectonic environments indicates that these trends are very likely to be universal (Bozorgnia Niazi Campbell 1995) These results show the problems that are associated with specifying a constant ratio of vertical to horizontal spectra ordinates for all periods and distances The results indicate that the horizontal and vertical spectra have decidedly different shapes
The authors application of these results to the unmodified 1 ISO response spectra is illustrated in Figure 322 The present proposed ISO horizontal and vertical response spectra for Site Classification C (firm alluvium v = 35 I= 14) and Type A seismotectonic
conditions (shallow crustal faulting E = 1 ) For periods greater than about 03 sec the unmodified vertical response spectra have ordinates that are less than the present proposed ISO guideline vertical spectra For periods Jess than 03 sec the unmodified ordinates are substantially larger
The foregoing results have been developed based on earthquake ground motion measurements that have been made on land Measurements of ground motions offshore have indicated that the presence of the water column can have a marked influence on the sea floor motions (Smith 1997 Sleefe 1990) The measurements indicate that the vertical motions at the sea floor are much less than would expected based on on-land measurements For mat supported structures that receive the majority of their input motions from soils that are located near the sea floor this can be an important consideration
For vertically incident earthquake compression waves the ratio of the reflected to the incident wave amplitude at the ground
1 unmodified for water column effects
Loma Prieta EQ Stitt Soll Sites 16
14
0
i ~
12
10
08
~ 08
~ 04
02
00
SMART-1 Array Taiwan Mag 70
(a)
Rbull10 km
Rbull20 km
R-40 km -------213
18
i
16
14
0 12
( i 10I
08
-~ 06 ~
gtbull 04
02
00
(b)
Rbull10 km
Rbull30 km
-------213RafiO km
001 010 100 1000 Period (sec)
Fig 321 - Ratio of Vertical to Horizontal Elastic Response Spectra Ordinates
UJ
01 _____ ______~
1SO Horizontal-II bullVertical -+bullISO Vertical
-----middot
D = 5
001 01
Period - T (sec)
Fig 322 - Horizontal and Vertical Elastic Response Spectra for SC-C E = 10
27
-+-ISO Vertical
bullC
surface is a function of the impedance ratio IR at the ground surface
IR= ps Vspa Va
where pis the mass density of the soil (s) and air (a) and V is the compression wave velocity in the two media On land this impedance ratio is very large and one would expect almost total reflection of the energy at the ground surface This would indicate a doubling of the amplitude of the incident compression waves at the ground - air interface
In water the compression wave velocity in the water and in the water saturated sediments would be almost the same The density difference would be a factor of about 2 This would indicate that about 50 of the compression wave would be transmitted through the interface and the remaining 50 would be reflected The total wave amplitude at the interface would be 15 times the incident amplitude or 75 of the amplitude expected at an air - soil interface
This analysis assumes that the water is infinitely deep and ignores the reflection of the incident compression waves at the water - air interface Crouse and Quilter ( 1991) developed an analysis that includes the finite water column effects Depending on the water depth some frequencies can be reinforced and amplified by the finite water depth while others can be canceled The analyses performed by Crouse indicates that the peak vertical accelerations at the sea floor can be reduced by as much as 50 (Crouse Quilter 1991 Dolan Crouse Quilter 1992 Smith 1997 Sleefe 1990) These observations are in agreement with the analyses of recorded earthquakes at the sea floor reported by Smith ( 1997) and Sleefe ( 1990)
The earthquake ground motions in the vicinity of the sea floor are the result of a very complex variety of wave forms frequencies and incidence angles Thus the foregoing simplified analyses can be relied upon only to provide some insights into the potential effects of the water column on the vertical movements at the sea floor Measurements of earthquake movements at the sea floor provide the only reliable source of information to quantify these effects The measurements that are available confirm the inferences that have been drawn based on simplified analyses
Figure 323 summarizes the results for the water column modified vertical response spectra compared -bullbullModified (x05) Vertical
D =5 Modified (x 075) Vertical with the present ISO vertical response
spectra The present ISO vertical response spectra provides a conservative envelope to the modified vertical spectra for periods greater ~ 1 ~
~than about 02 sec However the ftl bull-----117 present ISO vertical response spectrum is somewhat unconservative ifor periods less than about 02 sec
SC-C v = 35 1J1 = 14 E = I ~ bullUntil better information becomes available it is the authors conclusion 01
that the present proposed ISO 001 01 1 guidelines for vertical response Period - T (sec) spectra provide a reasonable arid likely somewhat conservative Fig 323 - Water Column Modified Vertical approximation to the vertical Response Spectra movements that can be expected in the vicinity of the sea floor
28
33 Computed Response Spectra Most current seismic exposure analyses and evaluations characterize the earthquake ground
motions on a rock or very firm alluvium surface Then often one-dimensional shear beam type analyses are performed to characterize the earthquake ground motions within the soil column that overlies the rock or very firm alluvium surface A variety of soil constitutive models can be used in these analyses but most often equivalent linear models are used with modifications introduced to model the soil non-linear stress-strain behavior and the changes in this behavior with cyclic strains Damping is generally introduced as an equivalent viscous damping (Dobry 1991 ) The bottom boundary of the soil column at the rock interface is generally characterized with an absorbing boundary element to prevent unrealistic trapping of the earthquake energy in the soil column due to reflections of the energy at the rock interface
Relative to the ISO earthquake guidelines this practice raises issues regarding the uncertainties and biases that can be introduced by different analyses of soil column effects The ISO guidelines do not include any definitive information on how such analyses should be performed There is a very wide range in how such analyses are performed and how the soil column analyses are performed can have extremely important effects on the earthquake ground motions that are utilized in analyses of the soil shystructure interactions
Fig 33 l summarizes earthquake acceleration response spectra from four locations in Mexico City based on recordings obtained during the 1985 earthquake (Seed 1987) The soft clay soil column has discernible effects on the shapes of the response spectra and the magnitudes of the spectra ordinates The computed natural periods of the soil columns (Ts) at each of the locations is noted based on the relationship
Ts =4dVs
where dis the depth of the soil column and Vs is the soil shear wave velocity (appropriate for the soil strains induced by the earthquake) For a given soil column thickness the natural period of the soil column is controlled solely by the shear wave velocity The shear wave velocity is a function of the shear modulus which is a function of the cyclic shear strains induced in the soils by the earthquake Higher strains result in lower shear modulii and shear wave velocities
The response spectra exhibit definite peaks at the natural periods of the soil columns The noticeable increase in the response spectra energy associated with the 37 m depth site is likely due to reflected energy associated with the edge of the Mexico 75
rbullbull 4H37gt bull 2 sec City basin This basin 10------- 10---10---0--- edge influence would oat- UNAM CAOT J SCT CAF
08 08 08 not be incorporated in ss 06 5 orrpng bullbull gmost shear beam soil bullmiddot g 04t-
column analyses because the soil column 0o 1 2 3 5responses would be
T sec T sec T sec T secbased on the rock outcrop motions (in this case at the UNAM site)
0[~mJraquo middot~middot~middotmiddot 75~)~mbullEJ 3f==Soft Fig 332 l c~~aVbullSOOto900nVa middotsummarizes results
from SHAKE analyses
0606
04
06
04 JT
dego t 2 3 1 2 3 4 5
of motions at the soil surface identified as Fig 331 - Soil Conditions and Recorded Acceleration Spectra Oakland Outer Harbor During 1985 Mexico City Earthquake
29
(Bray et al 1996) during the 1989 Loma Prieta earthquake (epicenter about 70 km away) The soil profile consists of 156 m of alluvium (clays sands) overlying bedrock The shear wave velocity in this soil column ranged from 800 msec (alluvium at base of column) to 63 mis (Bay Mud) The soil column had an average shear wave velocity in the range of approximately 400 msec The response spectra indicates discernible peaks at 15 sec and about 06 sec Based on the results from testing of soil samples a soil damping ratio of l 0 to 20 was used
Response spectra from available strong motions recorded at nearby rock sites are shown in Fig 332 The response peak at 06 sec is obviously due to the energy in the input rock motions at this period The response peak at 15 sec is obviously due to the natural period of the soil column The spectral acceleration of the rock is amplified by a factor of about 4 at the 06 sec and 16 sec peaks of the soil column Given a peak spectral acceleration of 025 g in the input rock motion at the natural period of the soil column the peak spectral acceleration is
Rock mollon YBI (90 dovl ied lo OOlg
Rocordod mollon (305 dovgt Computed mollon
o
1 2 3 4 PERIOD seconds
middot Recorded and SHAKE
1
Cl
Fig 332 Computed Response Spectra (Oakland
Outer Harbor Loma Prieta Earthquake)
about 05 g representing a doubling of the peak in the spectral input motion Note that the computed motion of the soil column generally is somewhat less than the recorded motion
Fig 333 and Fig 334 summarize similar results for two other nearby locations The Oakland location consisted of 152 m of alluvium having shear wave velocities in the range of 800 msec to 120 msec The Emryville location consisted of 137 m of alluvium having a similar range in shear wave velocities In these cases the amplifications of the rock motions at a period of 06 sec were about 3 and at a period of about 15 sec were about 4 The peak input spectral acceleration of 020 g to 025 g was magnified at the natural period of the soil column by a factor of about 2 Again the SHAKE analyses tend to under predict the ground motions at the natural period of the soil column but predict the amplifications reasonably well at the earthquake input peak energy period of about 06 sec
These results indicate that the SHAKE analytical model and the associated characterizations of the soil stiffness and damping has a bias in the range of B = 15 to 20 for the natural period of the soil columns Other similar results need to be developed before definitive statements can be made
Rock mollon YBI (90 dogl ied lo OOlg Rocordod mollon (290 dovgt06 11ecorded motion (200 deg)
Cl Compulod mollon
Demplng 5
0 1 2 3 PERIOD seconds
Fig 333 bull Recorded and SHAKE Computed Response Spectra (Oakland Loma Prieta
Earthquake)
30
4
concerning the biases associated with the soil column analyses
The amplification of the earthquake input acceleration on rock at the surface of the soil column can be evaluated approximately from (Dobry 1991)
A= [as I ar lmax =II I + (1t 12) D5 I
where A is the ratio of the maximum acceleration at the soil surface as to the input acceleration at the rock interface ar I is the impedance ratio of the rock - soil interface D5 is the soil damping ratio The soil - rock impedance ratio is
I= (pr I ps) (Yr I Vs)
where pr is the density of the rock ps is the density of the soil Yr is the shear wave velocity of the rock and Vs is the shear wave velocity of the soil The velocity ratio would generally be in the range of 5 to 30 and the density ratio in the range of II to 15 Thus the impedance would generally be in the range of 5 to 50 The soil damping ratio could be expected to be in the range of 005 (low
I
Rocle mollon YBI llO dog) Recordod mollon (350ltMg)0
Cl
0
Ar Compulodmodan bull I
DomplngS
middotmiddot~_ -~
1 2 3 PERIOD seconds
Fig 334 - Recorded and SHAKE Computed Response Spectra (Emryville Loma Prieta
Earthquake)
strains) to more than 03 (high strains) Fig 335 summarizes the results of this development Except for very low impedance impedance is not an extremely important element However damping is very important The use of low strain damping ratios in the range of 5 to I 0 result in amplifications that are a factor of 4 to 5 times those for damping ratios in the range of 25 to 30
The Loma Prieta site results summarized earlier had a velocity ratio in the range of 7 to 9 a density ratio in the range of I I to 12 This would indicate an impedance in the range of 8 to 11 Given an amplification of the input rock acceleration of about 2 at these sites a damping ratio in the range of 20 to 30 is indicated This damping is much higher than indicated from the laboratory triaxial and resonant column tests 12Often this has been found to be true and it has been postulated that the under-estimated c( 1 0 damping is due to the laboratory testing boundary conditions c 80
Studies are currently being conducted to ~ 6better characterize the bias and uncertainties
associated with analyses of soil column e 4response characteristics during intense Q
earthquakes These studies are attempting to E 2c(account for the different methods that can be used to characterize the soil properties and the 0input earthquake excitations Results from these studies will be monitored by the author
-D=Soo Impedance- bull0=10dego - bull bull0=15dego t--r~-~-~-~--- bullbullbullbullbullD=20dego
~middot0=30oomiddotmiddotmiddotmiddotmiddot0=251middot=~~-
10 20 30 40
and their implications integrated into future revisions of the proposed ISO guidelines Fig 335 - Soil Surface Amplification of
Bed Rock Acceleration
31
4
50
34 North Sea Response Spectra Elastic response spectra for North Sea
seismotectonic and hard ground - rock conditions were developed as part of the EQE International study (1998) and the NORSAR study (1998) Fig 341 summarizes the normalized response spectra results for a 5 damping ratio from the EQE study for return periods of 100 years 1000 years and 10000 years The response spectra do not vary significantly as a function of the intensity of the earthquakes in this range This is to be expected since the hard ground shyrock materials respond essentially in their low-strain reasonably elastic range The peak amplification of the spectra is approximately 25
In the EQE study it was noted that the spectra could be modified for other values of damping by the factor K (Woo et al 1988)
K = 148 - 030 In D
This response spectrum modification factor was compared with that contained in the proposed ISO guidelines It was found that the modification factors are essentially identical for damping ratios less than about 20 and above 20 only differ by about 10
I 1000
100
~ ~ 6 -g 10
~
01
01 10 100 100
Undamped Natural Frequency (Hz)
Fig 341 - Earthquake Response Spectra for UK Sector Conditions
Fig 342 summarizes the response spectra from the NORSAR study (1998) for a return period of 10000 years at low seismic activity (Alta) and high seismic activity (Midgard) sites for rock or hard ground conditions The shapes of the spectra are essentially identical
1 1 FREOUENCY (HZ)
a 1u
Fig 342 - Earthquake Response Spectra for Norwegian Sector Conditions For Earthquake Return Period of 10000 years and Rock - Hard Ground
32
Fig 343 and Fig 344 summarize results from the study of soil column effects on the rock spectra performed by the Norwegian Geotechnical Institute (1988) as part of the NORSAR study ( 1988) Soil column characteristics were based on results from soil exploration - soil boring - laboratory jtesting performed at North Sea platform locations and onshore Norway locations The earthquake response analyses were performed using the SHAKE computer program discussed earlier The soil columns were organized into two different categories Soil Type B - shallow firm alluvium and Soil Type C - deep firm alluvium Recorded earthquake time histories characteristic of those expected for the Norwegian
01 10 100seismotectonic conditions were used as input to the soil column analyses Frequency (Hz)
The amplification factors for the Soil Type Fig 343 Computed Earthquake Response B profiles has a definite peak in the period Spectra Amplification Factors for Deep range of 005 sec to 01 sec The peak Alluvium Soil Conditions (Soil Type C) amplifications range from about 25 to as high The Coefficient of Variation (COY) of the peak amplification factors is approximately 20 ( ~
crG5) The COY suggested in the proposed ISO guidelines is 30 The range of results shown in Fig 343 represents the range of results between different sites not the range of results that reflect variations in the soil characteristics for a given site
The amplification factors for the Soil Type C profiles has a definite peak in the period range of 0 5 sec to 1 sec The peak amplifications range from about 25 to almost 6 The Coefficient of Variation (COY) of the peak amplification factors is approximately 30 The COY suggested in the proposed ISO guidelines is 40
Fig 345 summarizes the mean soil response spectra amplification factors for the two different soil column conditions The mean peak soil amplification factor for Soil Type B is 3 and the same factor for Soil Type C is 3 5 These results are in excellent agreement with those summarized in Table 311 These results confirm the need to have a factor that modifies the magnitude of the peak in the response spectra as a function of the soil conditions
The NORSAR study also addressed the 01 10 100
vertical motion spectra and concluded that the Fraqubullcy (Hz) ratio of the spectral ordinates (VH) was frequency (f) dependent In the vicinity of the Fig 344 - Computed Earthquake peak of the horizontal response spectrum (f = 1 Response Spectra Amplification Factors to 3 Hz) the recommendation was that the ratio for Shallow Alluvium Soil Conditions should be determined as follows (Soil Type B)
1400
300 +----+--+-+-r-tishy
200 +---+---+-middot
7
6
2
0
I
33
VH = 09 - 042 log (f)
For f =1 Hz VH =09 These results are in reasonably good agreement with those summarized in Fig 322 Based on the information provided in the NORSAR study it is understood that these results are for the surface of the soil column and do not incorporate the effects of the overlying water column Future studies of the vertical response spectra at the sea floor should take account of these effects
400
300~
~ c 0 ~ 2005 E Q
100~
000
010
Fig 345 middot Recommended Earthquake Response Spectra Mean Amplification Factors for Deep Alluvium Soil Conditions (API Soil Type C)
100 1000 10000 Frequency (Hz)
Sc w ) ~
I
I I
~
v Soll Ty1 bull
) 1
34
35 Bay of Campeche Spectra Chavez (I997a l 997b) performed a number of site response studies for the Bay of Campeche
using the computer program SHAKE Results from recently performed high quality soil borings and laboratory static and dynamic testing programs were used to characterize the strength stiffness damping and hysteretic performance characteristics of the soils The soils consist of deep (100 m to 200 m) firm alluvium (layered calcareous sands silts and clays) Chavez introduced the deconvolved input motions from the three types of earthquakes at the base of the soil columns and determined the output motions close to the sea floor (at -12 m appropriate for lateral motions characterizations for piles) and at significant penetrations below the sea floor ( -100 m appropriate for vertical motions characterizations
Results for the 200-year horizontal Strength Level Earthquake (SLE) conditions ( -12 m) for a variety of sites in the Bay of Campeche are summarized in Figures 351 352 and 353 for Type I (very distant subduction zone) Type II (distant mixed zone) and Type III (nearby surface faulting zone) earthquakes respectively The Type I earthquake produces a peak in the ground motions at a period of about 3 sec that represents the long-period energy from these distant subduction zone earthquakes that coincides with the natural period of the soil column The Type II earthquake produces a set of response spectra with multiple peaks in the range of 0 3 sec to 3 sec The Type II earthquake produces a much more conventional spectrum with peaks in the range of 02 to 08 sec
The resulting mean response spectra for these three types of earthquake conditions is summarized in Fig 354
bullbull
bullbull
bullI
~~
1
~ (
~w - ~
- Fig 351 - Type I 200-year Earthquake Computed
Response Spectra
bullbull
bullbull
bull i j0 bull -
~~ ~middotg- - ~~middotshy -
I I bull
Fig 352 - Type II 200-year Earthquake Computed Response Spectra
35
bull
bull
together with the mean plus one standard deviation and envelope spectra Chavez included the range in response spectra results that developed from plus and minus one standard deviation changes in the soil shear modulus and damping characteristics The COY of the peak response spectra values is about 100 This high uncertainty reflects the influences of the three different types of seismic sources different soil characteristics at different sites and the effects of plus and minus one standard deviation ranges in the soil properties at the different sites Given a location that is affected by multiple types of earthquake sources it would be preferable to define different response spectra associated with these sources rather than combine them into a single response spectrum
These results clearly indicate that the dominant horizontal and vertical motions important to the pile foundations of the platforms in the Bay of Campeche are associated with the Type II earthquake source At a period of 1 sec (predominant natural period of platforms in Bay of Campeche) the Type II earthquake source produces horizontal motions at a penetration of -12 m that are a factor of about 10 greater than those for the Type I and Type III sources
In general these results are in good agreement with the proposed modifications to the ISO SLE response spectra
bull
middot~
0JO
Imiddot~ 016
1110
f 016
010
~ -~middot)
Ar
~I~ -
I I I
Fig 353 - Type III 200-year Earthquake Computed
Response Spectra
I I
I
I I
I [I
I I
I
I
-~-~ Fig 354 bull 200-year Mean Mean Plus One Standard
Deviation and Envelope Response Spectra
36
Summary Conclusions amp Acknowledgments
40 Summary The objective of this study was to continue development of earthquake load and resistance factor
design (LRFD) guidelines with a study of results from recent seismic hazard characterizations This study addressed two primary topics
a) seismic zonation of the UK and Norwegian Sectors of the North Sea offshore Japan and Indonesia and the Bay of Campeche Mexico and
b) Strength Level Earthquake (SLE) response spectra
This study was organized as follows
bull obtain recent background on seismic hazard characterizations
bull detail seismic exposure uncertainties and local site response uncertainties
bull reconcile differences between current ISO seismic hazard guidelines and those developed during this study
bull document the revised seismic hazard and response spectra characterizations in a project technical report
Results from current seismic exposure studies of the UK and Norwegian Sectors of the North Sea indicate SLE rock PGA in the range of 0015 g to 008 g and seismic uncertainties in the range of crE = 15 to 17
Results from current seismic exposure studies for the Japan coastal and offshore areas indicate SLE rock PGA in the range of 005 g to 05 g and seismic uncertainties in the range of crE = 08 to 10
Results from current seismic exposure studies for the Indonesia coastal and offshore areas indicate
SLE rock PGA in the range of 005 g to 035 g and seismic uncertainties in the range of crE =06 to 20 (lower end of range associated with subduction zone dominated sites)
Results from current seismic exposure studies for the Bay of Campeche Mexico indicates SLE rock PGA in the range of 001 g to 005 g and seismic uncertainties in the range of crE = 06 to 18
Results from current studies of horizontal response spectra associated with SLE intensities indicates that the ISO SLE horizontal response spectra for periods in the range of about 01 sec to 05 sec should be modified (increased) to account for different types of soils Such modifications have been developed as a result of this study Results from region and site specific SLE horizontal response spectra generally are in good agreement with the proposed modified ISO response spectra
Study of information relating to the vertical ground motion spectra for on-land conditions indicate that the ratios of vertical motions to horizontal motions in the low period range (01 sec to 03 sec) for near-by earthquakes can be much greater than currently specified in the proposed ISO guidelines
37
However when the effects of the water column are taken into account combined with the proposed modifications to the horizontal response spectra in the period range of 01 sec to 05 sec the proposed modified ISO guidelines generally provide a conservative estimate of the vertical motion characteristics
4 1 Conclusions The results from this study indicate that the proposed ISO seismic exposure guidelines generally
provide a conservative estimate of the SLE PGA for the regions studied The current regional seismic exposure results provide the basis for updated North Sea Japan and Indonesia regional ISO seismic exposure maps (Fig 212 Fig 222 Fig 232 Fig 246)
The results from this study indicate that the proposed ISO guidelines for seismic exposure uncertainties associated with the different seismotectonic zones generally provide a conservative estimate of the uncertainties The current regional seismic exposure results provide the basis for updated North Sea Japan Indonesia and Mexico seismic exposure uncertainties
The results from this study indicate the need for modifications to the proposed ISO SLE horizontal response spectra in the period range of about 01 sec to about 05 sec Based on results from current response spectra studies proposed modifications that are a function of the type of soil column have been developed In general the proposed modified ISO SLE horizontal response spectra provide a conservative estimate of the expected SLE horizontal response spectra developed from detailed site specific studies The uncertainties associated with the response spectra ordinates as suggested in the proposed ISO guidelines provide reasonable characterizations for the different types of soil columns
The results from this study indicate that it is important to clearly identify the position in the soil column that are associated with the response spectra The positions should be those that characterize the positions that result in maximum input of motions or energy from the earthquake ground motions For pile supported structures these motions would be below the sea floor for lateral motions (eg 5 to 10 pile diameters) and along the lower one-third to bottom of the pile shaft for axial motions For mat supported structures these motions would generally be much closer to the sea floor but are still not generally at the sea floor itself These considerations are particularly important for specification of the vertical response spectra for both pile and mat supported platforms
The presence of the water column has important effects on the vertical motions at or very close to the sea floor These effects need to be accounted for when evaluations are developed for the vertical response spectra for these elevations Analysis of available information on vertical motions and the effects of the water column generally indicates that the proposed modified ISO guidelines provide a conservative characterization of the vertical motion effects
42 Acknowledgments The author would like to acknowledge the technical guidance and information provided by Dr Ove
Gudmestad of Statoil and Mr Mike Craig of Unocal Financial support for the second phase of this study was provided by Statoil and Unocal
The third phase of this study will be sponsored by the U S Minerals Management Service The third phase will address verifications of the proposed ISO guidelines based on site and platform specific results provided by the project sponsors
38
Australian Bureau of Mineral Resources Geology and Geophysics and Lamont-Doherty Geological Observatory of Columbia University Tectonic Map of the Indonesian Region Professional Paper 1078 Geological Survey oflndonesia
Bea R G (1992) Seismic Design and Requalification Methodologies for Offshore Platforms Proceedings of the International Workshop on Seismic Design and Requalification of Offshore Structures California Institute of Technology Pasadena CA Dec
Bea R G (l997a) Background for the Proposed International Standards Organization Reliability Based Seismic Design Guidelines for Offshore Platforms Proceedings of the Earthquake Criteria Workshop Recent Developments in Seismic Hazard and Risk Assessment 16th International Conference on Offshore Mechanics and Arctic Engineering Y okahama Japan (obtain proceedings from Port and Harbors Research Institute Yokuska Japan)
Bea R G (1997b) Risk Based Oceanographic and Earthquake Load amp Resistance Factor Criteria for Design and Requalification of Platforms Offshore Indonesia Report to Indonesian Petroleum Association Directorate General of Oil and Gas of Indonesia Pertamina and Bandung Institute of Technology Marine Technology and Management Group University of California at Berkeley
Bea R G (1997c) Risk Based Hurricane and Earthquake Criteria for Design and Requalification of Platforms in the Bay of Campeche Report to Petroleos Mexicanos Instituto Mexicano de Petroleo and Brown amp Root International Inc Marine Technology and Management Group University of California at Berkeley
Bea R G (1998) Continued Development of Earthquake Load and Resistance Factor Design Guidelines Report I - Concrete Gravity Base Structures LRFD Guidelines Report to the UK Health and Safety Executive Marine Technology and Management Group University of California at Berkeley
Beca Carter Hollings amp Ferner Ltd Indonesian Earthquake Study Seismic Zones for Building Construction in Indonesia 1979
Borcherdt R D (1994) Estimates of Site-Dependent Response Spectra for Design (Methodology and Justification) Earthquake Spectra The Professional Journal of the Earthquake Engineering Research Institute Vol 10 No 4 Nov
Bozorgnia Y Niazi M and Campbell K W (1995) Characteristics of Free-field Vertical Ground Motion during the Northridge Earthquake Earthquake Spectra Vol 11 No 2 Earthquake Engineering Research Institute Oakland California
Bray J D Chameau J-L and Guha S (1997) Seismic Response of Deep Stiff Clay Deposits Proceedings of the 5th International Conference on Earthquake Engineering Earthquake Engineering Research Center University of California at Berkeley
Chavez M (1987) Analisis de Riesgo Sismico en Varios Sitios de a Bahia de Campeche Elaborado para IMP Proy 6734 Mexico City MX
Chavez M (1997a) On the Seismic Hazard of the Campeche Bay Region Prepared for Meeting About the PEMEX Transition Normativity for the Bay of Campeche Berkeley CA March
Chavez M (1997b) Seismic Hazard and Design Spectra for Southern Gulf of Mexico 16th International Conference on Offshore Mechanics and Arctic Engineering OMAE 97
39
Proceedings of Earthquake Criteria Workshop Recent Developments in Seismic Hmard and Risk Assessments for Port Harbor and Offshore Structures Yokohama Japan April 17 American Society of Mechanical Engineers New York NY
Chavez M (1997c) Seismic Hmard at Sites of the Campeche Bay for the Risk Assessment of PEMEX Offshore Facilities Report to PEMEX and IMP August 10 Mexico City Mexico
Chavez M (1998) Seismic Hazard at Sites of the Campeche Bay for the Risk Assessment of PEMEX Offshore Facilities risks and Seismic Design Spectra in Areas of the Bay of Campeche Report to Petroleos Mexicano Instituto Mexicano de Petroleo and Brown amp Root International CISIND Col Jardines de Ajusco Talapan DP Mexico
Crouse CB and Quilter J (1991) Seismic Hazard Analyses and Development of Design Spectra for Maui A Platform Proceedings of the Pacific Conference on Earthquake Engineering Auckland New Zealand
Crouse C B and McGuire J W (1997) Site Response Studies for Purpose of Revising NEHRP Seismic Provisions Dames and Moore Consultants Seattle Washington
Dames amp Moore 1992 Final Report Seismic Hazard Evaluation Offihore Northwest Java Indonesia Report to Maxus Southeast Sumatra Inc Atlantic Richfield Indonesia Inc
Dames and Moore Seismic Risk and Site Response Study Proposed Rajah Platform East Kalimantan Indonesia Report No 02310-004-75 Report to Unocal Corporation
Dobry R (1991) Soil Properties and Earthquake Ground Response Proceedings of the Tenth European Conference on Soil Mechanics and Foundation Engineering Associazione Geotecnica Italiana Florence Italy
Dolan D K Crouse C B and Quilter J M (1992) Seismic Reassessment of Maui A Proceedings ofthe Offshore Technology Conference OTC 6934 Society of Petroleum Engineers Richardson Texas
EQE International Ltd ( 1998) Seismic Hazard Mapping of Offshore Britain Report to Health and Safety Executive London UK
Guerra R and Esteva L (1978) Espectros de Diseno Sismico en Paraiso Tab y Cuidad de Carmen Camp Patrocinado por Proyectos Marinos S A Instituto de Ingenieria UNAM Mexico City DP
Guzman R (1982) Bases de Riegso Sismico y Espectros de Riesgo Uniforme de la Bahia de Campeche Preparado para Instituto Mexicano de Petrroleo Proyectos Marinos Mexico DP
Lamport W B 1992 Seismic Analyses of Indonesias Rajah Wellhead Platform Unocal Corporation Science and Technology Division Project Report 91-23
Martin G R and Dobry R (1994) Earthquake Site Response and Seismic Code Provisions National Center for Earthquake Engineering Research Bulletin Vol 8 No 4 Buffalo New York
NORSAR and Norwegian Geotechnical Institute (1998) Seismic Zonation for Norway Report to Norwegian Council for Building Standardization
Norwegian Geotechnical Institute (1998) Effects of Local Soil Response on Earthquake Loading Report to Norwegian Council for Building Standardization
Nozu A and Iai S (1997) Seismic Hazard in Coastal Areas of Japan Proceedings of Earthquake Criteria Workshop Recent Developments in Seismic Hazard and Risk Assessments for Port Harbor and Offshore Structures Port and Harbor Research Institute Japan
40
Nozu A Uwabe T Sato Y Ichii K and Iai S (1997) Attenuation Relations for Peak Ground Motions on Base Layer in Japan Proceedings of Earthquake Criteria Workshop Recent Developments in Seismic Hazard and Risk Assessments for Port Harbor and Offshore Structures Port and Harbor Research Institute Japan
Risk Engineering Inc 1992 Seismic Hazard Analysis for the Offshore Kalimantan Sites Indonesia Report to Unocal Corporation March 27
Sleefe G E (1990) The Long-Term Measurement of Strong-Motion Earthquakes offshore Southern California Proceedings Offshore Technology Conference OTC 2345 Society of Petroleum Engineers Richardson Texas
Smith C E ( 1997) Dynamic Response of a Steel-Jacket Platform Subject to Measured Seafloor Earthquake Ground Motions Proceedings Eighth International Conference on the Behavior of Offshore Structures Vol 3 Pergamon Elsevier Science Ltd Oxford England
Untung M Buyung N Kertapi E Undang N Allen C R 1985 Rupture Along the Great Sumatran Fault Indonesia During the Earthquakes of 1926 and 1943 Bulletin of the Seismological Society of America Vol 75
Utsu T (1982) Catalog of Large Earthquakes in the Region of Japan from 1885 through 1980 Bulletin ofEarthquake Research Institute University of Tokyo Vol 57 pp 401-463
41
this page left blank intentionally
42

this page left blank intentionally
ii
Introduction
10 Objective The objective of this study is to continue development of earthquake load and resistance factor
design (LRFD) guidelines as follows
Part 1) concrete gravity based structure (GBS) LRFD guidelines (sponsored by Health and Safety Executive)
Part 2) seismic hazard characterizations (sponsored by STATOIL and UNOCAL) and
Part 3) verification of guidelines (sponsored by U S Minerals Management Service)
This report summarizes the results of the second part of this study seismic hazard characterizations Two primary topics are addressed
a) seismic zonation and uncertainties of the UK and Norwegian Sectors of the North Sea offshore Japan and Indonesia and the Bay of Campeche Mexico and
b) Strength Level Earthquake (SLE) elastic response spectra
11 Background A first-generation LRFD ISO guideline for design of steel pile supported template-type platforms
to resist earthquake induced loading has been developed (Bea 1991 1997a) This guideline was based on the API RP 2A LRFD guideline and on the collective experience and judgment of the ISO PS committee members During the first generation developments limited verification studies of the entire process were performed there was limited documentation of the background for some of the key developments and there were additional topics that needed to be addressed These topics have been discussed and the PS committee recommended that additional studies be conducted on the two topics cited above
The report titled Continued Development of Earthquake Load and Resistance Factor Design Guidelines Report 1 - Concrete Gravity Base Structures LRFD Guidelines documented the results of the first phase of this study (Bea 1998)
This study was organized as follows
bull obtain recent background on seismic hazard characterizations
bull detail seismic exposure uncertainties and local site response uncertainties
bull reconcile differences between current ISO seismic hazard guidelines and those developed during this study
bull document the revised seismic hazard and response spectra characterizations in a project technical report (Report 2)
1
1 2 Earthquake LRFD Approach The LRFD approach used to develop the proposed ISO earthquake design guidelines can be
expressed analytically as follows
ltPE RE~ YDI D1 + Yoz Dz+ Yu L1 +YE E
where ltPE is the resistance factor for earthquake loadings RE is the design capacity of the platform element (eg brace joint pile) for earthquake loadings as defined by the API RP 2A - LRFD
guidelines yDI is the self-weight of the structure (dead) loading factor D1 is the design dead loading
Yoz is the imposed equipment and other objects loading factor Dz is the design equipment loading Yu
is the consumables supplies and vessel fluids (live) loading factor L1 is the live loading YE is the earthquake loading factor and E is the earthquake loading effect developed in the structure or foundation element This development addresses the definition of the resistance factors ltPE and the
loading factors YE for loadings induced by earthquakes (Bea l 997a) The dead equipment and live
loading factors are set as y01 = Y02 =Yu = I I
The earthquake loading factor is determined using a Lognormal format (Bea 1991)
YE = Fe B exp (08 PE crE - 257 crE)
where Fe is the median effective loading factor B is the median bias (actual I nominal) in the
computed earthquake loadings PE is the annual Safety Index designated for the platform SSL crE is the total uncertainty associated with the earthquake loadings (standard deviation of the annual maximum earthquake loading) 08 is the splitting factor used to separate the uncertainties in earthquake loadings and platform capacities and the 257 is a consequence of defining the elastic design earthquake (Strength Level Earthquake) at an average return period of 200-years (257 Standard Normal deviations from the mean)
The effective loading factor for the platform system is expressed as
Fe= [microa r 1
where micro is the platform system ductility and a is the platform residual strength ratio
micro = dp de
a=AI Aep
dp is the maximum plastic displacement that can be developed by the platform system at failure de is the displacement at which first significant nonlinear behavior is indicated by the platform system A is the area under the platform loading - displacement to failure diagram and Aep is the area under an equivalent elasto-plastic platform loading - displacement to failure diagram
The total uncertainty associated with the earthquake loadings ( crE) is expressed as
where cr5E is the uncertainty in the earthquake horizontal peak ground accelerations is thecr05 uncertainty related to the local geology and soil conditions and their effects on the ordinates of the earthquake response spectra and crbulls is the uncertainty associated with the response spectrum method used to determine forces in the elements that comprise the platform
2
In development of the proposed ISO earthquake guidelines Type I (natural inherent aleatory) uncertainties are included in cr The effects of Type II (model parameter state epistemic) uncertainties are introduced with the Biases (actual value I nominal value) in loading effects and capacities This is done to develop as close as possible a correlation with the way in which the target Safety Indices and probabilities of failure were determined
The platform element resistance factor is determined from
ltlgtE = BRE exp (-08 ~E ltJRE )
where BRE is the median bias (actual value I nominal or code value) in the element earthquake loading capacity and is the crRE uncertainty in the earthquake loading capacity of the element
The proposed ISO earthquake LRFD approach proceeds through the following nine steps (Bea 1997a)
I Define the structure safety and serviceability level (SSL)
2 Define the earthquake hazard zone (EHZ) and seismotectonic conditions (Fig 121)
3 Determine if site specific seismic exposure study is required (Table 121)
4 Define the shape of the normalized mean elastic principal horizontal acceleration response spectrum for a specified damping ratio soil profile and seismotectonic condition (Fig 122 Table 122)
5 Determine the uncertainties associated with the seismic exposure response spectrum and the methods used to analyze earthquake forces induced in the structure (Table 123 Table 124)
6 Determine the earthquake loading factor ltYE) for the elastic response spectra forces
7 Evaluate the biases and uncertainties in the platform element design capacities
8 Determine if a ductility analysis is required and the performance characteristics for the analyses
9 Determine the platform element resistance factors (ltjgtE) for the design code based capacities
The remainder of this report will summarize the study of seismic hazard characterizations (Steps 2 and 5) based on results from recent studies and local site response spectra characterizations (Steps 4 and 5) In the context of the loading and resistance factor formulation summarized in Eqn ( 1) through (7) the key issues included in this study were
- the peak horizontal ground acceleration at a return period of 200 years (Fig 121) bull G200
crE - the uncertainty associated with the seismic environment
bull ltJas - the uncertainty related to the local geology and soil conditions and their effects on the ordinates of the earthquake response spectra and
bull Sa I G vs T - the shape of the normalized SLE horizontal acceleration response spectrum for a specified damping ratio of D = 5 (Fig 122)
3
Fig 121 middot Proposed ISO Earthquake Hazard Zones (EHZ)
Sa G
(log scale)
10
middot 005 0125
Period T sec (log scale)
Fig 122 bull Proposed ISO Strength Level Earthquake Normalized Elastic Horizontal Acceleration Response Spectrum
4
Zone SLE G SSL 1 SSL 2 SSL 3 SSL 4 (1) g (3) (4) (5) (6)
2
Should 0 0-5 Allowed
1 5 -15 to use
2 15 -25 these
3 25 -35 guidelines
4 35-45
5 45 -55
Table 121 - Proposed ISO Earthquake Hazard Zones SLE Ground Accelerations (G) and Structural Serviceability amp Safety Levels (SSL)
Table 122 - Proposed Local Geology and Soil Conditions Parameter and Seismotectonic Characteristics Parameter E
Soil Conditions ( 11
SC - A Rock (Vs ~ 2500 fps)
SC - 8 Stiff to very stiff soils gravels (Vs = 1200 to 2500 fps)
SC - C Sands silts and very stiff clays (Vs= 600 to 1200 fps)
SC - D Soft to medium stiff clays (H = 10 to 200 ft Vs s 600 fps)
SC - E Site specific studies required
I
10
12
14
20
Seismotectonic Condit 121
Type A Shallow crustal faulting zones
Type 8 Deep subduction zones
Type C Mixed shallow crustal amp deep
subduction zones
Type D lntraplate zones
Default value
ions
E
10
08
09
08
10
5
Table 123 Seismic sources and
attenuation uncertainties
Table 124 Uncertainties associated with
local geology and soil conditions
Seismotectonic Characteristics
Shallow crustal fault zones
Deep subduction zones
Mixed shallow crustal fault and deep subduction zones
Intraplate zones
OsE
10
14
12
20
Geology Soil Conditions
-A
SC - B SC - C
SC - D
SC - E
OGs
030
040
040
050
050
13 RAM Based ISO Earthquake Guidelines
The approach used to develop the ISO earthquake guidelines for design and requalification are based on a Risk Assessment and Management (RAM) approach in which the seismic conditions are integrated with the performance characteristics of alternative platform configurations to define the reliabilities and risks associated with these configurations The earthquake design and requalification criteria are the basic product ofa desired reliability ofthe platforms
This is a very different approach than has been used traditionally to specify earthquake criteria for onshore facilities Traditionally earthquake criteria has been the result of two generally uncoordinated developments The first development came from geologists seismologists and earthquake engineers They were responsible for the characterization of the earthquake excitation that would be used for design of structures The basis for their characterization was some earthquake return period Often this was based on specification of a life of the structure and an acceptable probability of exceedance For example buildings were often designed for a 50 year life with a 10 percent probability of exceedance This is equivalent to design of the structure for an earthquake that has a return period of about 4 75 years The seismologists would then define design earthquakes that would be representative of the different types of earthquakes that could be experienced Representative earthquake time histories and elastic response spectra were often used for this definition
The second development came from structure design engineers They were responsible for the determination of how the structures would be configured and designed They defined the factors of safety that would be used in design of the structures Often the design procedures and factors of safety were the result of past of experiences with the performance of buildings that had experienced intense earthquake excitations If the performance of components in buildings proved to be
6
insufficient the configurations procedures and factors of safety were changed to improve the performance
The RAM procedure used in development of the ISO earthquake guidelines is based on an integration of the two developments and is focused on the reliability of the resulting structure In this instance the earthquake design spectra and design procedures are intimately related The design spectra characteristics are a direct consequence of the defined reliability and the procedures and processes that are used to configure and proportion the structure This point can be illustrated by the following RAM based equation to define the design elastic horizontal response spectra ordinate (Sa0 )
for a structure that has a given natural period (Tn) and damping ratio (D) (Fig 122)
Sa0 = (Ru50 I Fe M) (BRu I BFQ ) exp (~Q ltJQ - Z0 crFQ)
Ruso is the median static ultimate lateral loading capacity of the structure Fe is the factor that recognizes the combination of the transient earthquake induced loadings and the nonlinear hysteretic performance characteristics of the structure M is the total effective mass of the structure including the structure live and dead masses and hydrodynamic masses (often the total mass of an offshore structure is 50 to 70 hydrodynamic mass) ~Q is the design Safety Index for the structure
(directly related to the structure reliability or its compliment the probability of failure) crQ is the total uncertainty in the structure capacity and the earthquake induced loadings (square root of the sum of the squares of the standard deviations of the logarithms of the structure capacity and earthquake loadings)
Z0 is a factor that depends on the return period that is used to define the design earthquake often this is taken to be a 100-year or 200-year condition for elastic working stress or load and resistance factor design formats for 100-year and 200-year return periods Zo =233 and Zo =257 respectively (this is the number of standard deviations from the mean to the 99-th and 995-th
percentiles respectively) crFQ is the uncertainty in the earthquake loadings induced in the structure BRu is the median bias in the structure ultimate capacity (best estimate or true value divided by nominal or predicted value) BQ is the median bias in the earthquake induced loadings (demands) If unbiased estimates are used to determine the earthquake loadings and structure capacities the biases are unity
The factors Tn D Rus0 Fe and M are fundamentally structural design factors that depend on the structure materials configuration and proportioning ~Q is a derivative of the desired or accepted
reliability of the structure crFQ is a derivative of how the structure responds to the earthquake (induced loadings or forces) and the long-term uncertainty in the earthquake ground accelerations The total uncertainty crQ reflects the uncertainties in both the structure capacity and the earthquake induced
loadings It should be apparent that the spectral acceleration is a direct product of structure and reliability considerations and can not or should not be developed or defined in isolation of these considerations
In the long period range (Tn ~ = I sec) the spectral acceleration can be expressed as
Sa0 = (KE 1J1 I Tn) G0
7
K expresses the number of standard deviations of the response spectra ordinate from the mean value If other than the mean value is used (K = I) then the bias in the earthquake loadings must be recognized e is a factor that depends on the seismotectonic (earthquake sources) environment (for
strike slip sources e 10 and for subduction zone sources E 08) lj1 is a factor that depends on the
local geology and soil conditions (ljl 18 for deep soft alluvium and lj1 = 08 for rock or very strong sedimentary formations) 0 0 is the design ground acceleration that is defined at the specified return period It is apparent that the majority of these factors are those that should be determined by the earthquake engineer or geo-seismologist
Based on the RAM approach the design or requalification spectrum (Sa vs Tn) is dependent on an explicit and integrated evaluation of the following categories of factors
I) characteristics of and uncertainties in the seismic - tectonic - geologic earthquake conditions (expressed with G ljf E BQ crFQ)
2) characteristics of and uncertainties in the seismic performance characteristics of the structure and the associated process used to design or requalify the structure (expressed with Ru Tn D Fe M Z0 K crRu B) and
3) the target reliability for the structure (expressed with~)
The foregoing RAM based development results in an intimate integration of
1) managements direction regarding acceptable or desirable reliability of a structure
2) input from the earthquake engineer or geo-seismologist and
3) input from the structure design engineer
In this context the design conditions or design spectra can not and should not be developed in isolation by the earthquake engineer or geo-seismologist Many of the earthquake and structure parameters involved in the RAM are highly coupled they can not and should not be separated for examplethe loads induced in the structure by earthquake ground motions are a direct function of the characteristics of the structure
It is important to recognize that the RAM based earthquake spectrum that is used to design or requalify a structure explicitly incorporates the uncertainties in the seismic environment For example even though a mean spectrum is used in the specification given to the engineer the potential for ground motions that are much larger or more intense are directly recognized in the uncertainties attributed to the mean spectral ordinates One should not be unduly concerned when peaks in some response spectra exceed the design or requalification spectrum The uncertainties in the ground motions have a direct impact on the factors of safety and Reserve Strength Ratios that are specified for a particular structure More uncertainty leads to larger factors of safety and Reserve Strength Ratios
8
There are four major parts to the seismic exposure models used to characterize earthquake ground motions (Fig 131)
1) characterization of the seismic sources
2) characterization of the transmission of earthquake energy from the sources to the site
3) characterization of the local geology and geotechnical effects on the free-field motions of the soils and
4) description of the soil-structure interactions that develop during the earthquakes (near-field motion characterizations)
For pile supported platforms the pile foundations supporting the platforms receive their input energy from earthquakes from two distinctly different points in the soil column The input of lateral energy occurs below the sea floor where the maximum lateral earth pressures can be generated on the piles (Fig 132) Generally this point is located at five (stiff soils) to ten (soft soils) pile diameters below the sea floor Frequently the seismic exposure characterizations are developed for the level of the sea floor This is not appropriate for pile supported offshore structures This can be appropriate for mat supported structures that receive the majority of their support from the soils in the immediate vicinity of the sea floor The error introduced by the sea floor reference for the earthquake characteristics will be dependent on the soil profile and soil characteristics If there is a substantial layer of soft clays or soils overlying the stronger soils then the bias introduced by the sea floor reference can be very large (15 to 20)
The input of vertical energy for pile supported offshore platforms occurs at the point along the pile where the soil - pile shaft
SOILmiddot PILE INTERACTION
llllllllll
TRANSMISSION AT TE NUA T ION
EARTHQUAKE SOURCE
Fie 131 - Primarv Comoonents of PIP mal
0 oi-----oi2=---~-o4---~--ors~~-oie-~-lmiddotc gt 12 IN
SOltL-PILE 8
~ 40~~~+-~~middot~~~-P~-+--=~~
Fig 132 - Earthquake Effects on Pile Foundation Lateral Soil Pressures
9
shears are maximized This is generally along the bottom one-third of the pile shaft This can be a depth below the sea floor of I 00 m or more Because most attenuation relations are developed for onshore conditions and recorded earthquakes where there is a dramatic change in the impedance ratio at the earth surface and hence large reflections of the vertically propagating compression earth waves these attenuation relations incorporate these reflections and shallow effects Offshore at the sea floor there is no dramatic change in impedance for vertically propagating compression waves at the sea floor (saturated sediments interface with the water column) Thus attenuation relations for onshore conditions generally tend to dramatically overestimate the vertical motions at the sea floor This can be important for mat-supported offshore structures It is also important for pile supported platforms whose vertical motion characteristics are based on measured data from onshore surface locations
10
Earthquake Hazard Zones amp Uncertainties
20 Introduction During this study access was obtained to recent earthquake hazard exposure studies from the
following regions
bull UK Sector North Sea
bullNorwegian Sector North Sea
bullJapan
bullIndonesia
bullMexico
This Chapter summarizes the results from these studies as they pertained to the characterization of the seismic zones the design SLE horizontal ground accelerations and the uncertainty associated with the seismic environments
The author contacted three firms known internationally for their expertise in seismic exposure assessments EQE International Dames amp Moore Consultants and Geomatrix Consultants The author was not able to obtain any significant information that could be used to revise the current ISO seismic zonation maps Uniformly the firms deg felt that this information was confidential since it had been developed for clients
2 1 UK Sector North Sea Based on the study performed by EQE 55
International (1998) Fig 211 shows the Magnitudes and epicenters of earthquakes that have affected the North Sea area during the period from 1904 through 1990 There have been 7 earthquakes having magnitudes greater than M = 5 during this period
Based on the seismotectonics of this region EQE developed two zonation models one with 38 area zones and the second with 26 area zones The historic seismicity was associated with these zonation models an attenuation characterization
bull
bullbull bull
bull bull bull
0 LONGITUDE f
MAGNITUDESmiddot bull 5 bull 4 bull 3
based on an synthesis of attenuation models appropriate for the seismotectonic characteristics Fig 211 - UK Sector Historic of this area and peak ground accelerations (PGA) Earthquake Epicenters and Magnitudes
11
56
-10middot bull bullbull bullbull --shycontoura (rnta2) for shy eXCMdanct ~dM-3
middot10 bullbull 62
ID
56 56
$4 54middot I
$2 52
______ ~tomiddot -amiddot bullbull bullbull
Fig 212 middot 200-Year Peak Ground Fig 213 middot 10000 Year Peak Ground Acceleration Contours Acceleration Contours
on rock or very hard soil determined The results are summarized in Fig 212 and Fig 213 for return periods of 200 years and 10000 years respectively Although not explicitly stated in this report it is presumed that these return periods incorporate the uncertainties associated with the attenuation relationships To be consistent with the definition of earthquake uncertainties used in the proposed ISO earthquake guidelines the uncertainty associated with the attenuation relationships need to be incorporated into the seismic hazard characterizations
Fig 212 could be used as a basis for an ISO micro-zonation map of the UK Sector of the North Sea The PGA generally range from 0015 g to 0030 g The current ISO guidelines for this region indicate a seismic zone of 1 with PGA = 005 g to 015 g The lower end of this range provides a conservative estimate of the Strength Level Earthquake (SLE) conditions for this region
Fig 214 summarizes the results from the EQE study in the form of the horizontal Peak Ground Accelerations (PGA) versus the average return periods for two locations one in the southern portion of the UK Sector (54 degrees north) and one in the northern portion (58 degrees north) These results can be used to determine the uncertainties associated with the earthquake ground motions In the proposed ISO guidelines the earthquake uricertainties in annual expected PGA are based on a Lognormal distribution that is fitted to the extreme values and expressed with the standard deviation of the logarithms of the expected annual maximum PGAs crE If it were desirable to base the fitted
12
025
1000 Return Period - years
Fig 214 - Peak Ground Accelerations for Southern and Northern Locations
Lognorrnal distribution on the 10000 year and 100 year return period PGAs the uncertainty could be found from
crsEmiddot = 072 In (G 10000 I G 100 )
For the southern location
crsEmiddot = 072 In (024 g I 0024 g) = 166
For the northern location
crsEmiddot =072 In (010 g I 0010 g) = 166
The proposed ISO guidelines suggest a value of crE = 20 for the intraplate seismotectonic characteristics of this region Again the proposed ISO guidelines provide a conservative estimate of the seismic exposure uncertainties
If it were desirable to base the characterization of the seismic exposure uncertainty on the I 0000 year and 1000 year PGAs then
crSE = 161 In (G 10000 JG 1000 )
Based on the results developed by EQE for the southern location
cr5E = 161 In (024 I 0085) = 167
and for the northern location
crsEmiddot =161 In (010 I 0035) =169
The seismic uncertainties are not sensitive to the extreme earthquake return periods used to fit the equivalent Lognorrnal distributions
13
72bull
70middot
eamiddot
eamiddot
[] 74bull --middot
72bull
64
82
64 eomiddot eomiddot
eamiddot 118
eamiddot 118
54bull amp4
22 Norwegian Sector North Sea Based on the study performed by
NORSAR and the Norwegian Geotechnical Institute (1998) Fig 221 summarizes the historic earthquake epicenters and magnitudes The zonations used in the seismic exposure analyses are also shown The NORSAR study shows that these earthquake epicenters are closely associated with faulting in the region Study of recent earthquake records shows that the majority of the earthquakes originate on reverse thrust faults characteristic of intraplate seismotectonic regions
The historic seismicity developed by NORSAR was associated with the zonations indicated in Fig 221 an attenuation characterization based on an synthesis of attenuation models appropriate for the seismotectonic characteristics of this area (calibrated with recordings from recent earthquakes) and peak ground accelerations (PGA) on rock determined The results are summarized in Fig 222 and Fig 223 for return periods of 100 years and 10000 years respectively
Site specific studies performed to determine the 100-year return period earthquake peak ground
Fig 221 - Norwegian Sector Earthquake acceleration can be converted to the Epicenters Magnitudes and Seismic Zonation200-year PGA (= G) with following
relationship
= G100 exp (024 crE)0 200
Fig 222 could be used as a basis for an ISO micro-zonation map of the UK Sector of the North Sea The 200-year PGA generally range from 0015 g to 008 g The current ISO guidelines for this region indicate a seismic zone of 1 with PGA = 005 g to 015 g The lower end of this range provides a conservative estimate of the Strength Level Earthquake (SLE) conditions for this region
Fig 224 summarizes the results from the NORSAR study in the form of the horizontal Peak Ground Accelerations (PGA) versus the average return periods for two locations one in the southern portion of the Norwegian Sector (62 degrees north) and one in the northern portion (66 degrees north) Based on the fitted Lognormal distribution to the 10000 year and 100 year return period PGAs the uncertainty for the southern location is
OsEmiddot =072 In (033 g I 0042 g) =148
14
For the northern location
cr5E = 0 72 In (027 g I 0027 g) = 166
80
Fig 222 middot 100-Year Peak Ground Acceleration Contours
Fig 223 middot 10000 Year Peak Ground Acceleration Contours
The proposed ISO guidelines suggest characteristics of this region This value provides a conservative estimate for this region
Basing the characterization of the seismic exposure uncertainty on the 10000 year and 1000 year PGAs then for the southern location
OsEmiddot = 161 ln (033 013) = 149
and for the northern location
OsEmiddot = 161 In (027 I 010) = 160
These values again are in excellent agreement with those based on the 100-year and 10000-year PGA
a value of crE = 20 for the intraplate seismotectonic
0 100 1000
Return Period - years
Fig 224 middot Peak Ground Accelerations for Southern and Northern Locations
15
104
23 Japan Fig 231 summarizes the
earthquake epicenters and magnitudes in the region surrounding Japan during the period 1885 through 1995 (Utsu 1982) The data set includes more than 500 seismic events having magnitudes greater than M -= 60 Attenuation relations for peak bedrock accelerations were based on results from a recent study of recorded earthquake motions in Japan (Nozu et al 1997) The standard deviation of the attenuation
relationship was found to be crnPGA = 062 This value characterizes the uncertainty associated with the attenuation relationship
Fig 232 summarizes the results of the seismic exposure study for the Yokohama Port (Nozu Iai 1997) The 20 largest peak bedrock accelerations are shown as a function of the return period The data are fitted with a Weibull distribution and with a Earthquake Hazard Study Lognormal distribution that is fitted to the tail of the Weibull distribution Similar fits were developed for a large number of coastal middot offshore sites and similar results developed
Based on these results a seismic hazard map for the peak bedrock acceleration having a 200 year return period was developed (Fig 233) The PGA range from 005 g to 050 g The proposed ISO seismic zonation for this area ranges from 2 to 5 and thus indicate PGA =015 to 025 g to PGA = 045 g to 055 g The proposed ISO guidelines provide a conservative estimate of the 200-year PGA An ISO Japan annex could be developed that would utilize the information shown in Fig 2 3 3 as the micro zonation map for coastal - offshore Japan
This study also developed a mapping of the standard deviation of the Lognorrnal peak bedrock acceleration distribution that considered both the variability in the Lognormal distribution for the expected PGA and the uncertainty in the attenuation relationship (Fig 234) The results indicated standard
1885-1995 A Mlt60 bull deg 0 f 0 60ltMlt65 middot~ 0
bull00 0 0 0 0
0 65ltMlt70 fgt bull degii ~ OO I
0 70ltMlt75 deg o AkitaPort o0 bull
o 75ltMlt80 8 deg e 80ltM
bull
bullbullbull Kobe Port
bull
bull
bull
bullbull ltP
Fig 231 bull Seismic Event Data Used in Japan
middotmiddotmiddot-middot-middotmiddotmiddotmiddot+middotmiddot
1o 10 10
Return Period [at)
Fig 232 bull Peak Bedrock Acceleration and Return Period at Yokohama Port
16
Fig 233 - 200 Year Bedrock PGA Fig 234 - Standard Deviation of Lognormal Expected Annual Maximum
PGA
deviations of the Lognormal peak bedrock accelerations distributions that ranged from cr5E = 08 to cr5E
= 10
The value suggested in the proposed ISO guidelines for the seismotectonic conditions in this region
is cr5E = 10 Thus the proposed ISO guidelines provide a conservative estimate of the uncertainties associated with the seismic exposure of this region
17
24 Indonesia The extreme condition
earthquakes offshore Indonesia are dominated by two principal seismic sources (Beca Carter Hollings amp Ferner Ltd 1979 Dames amp Moore 1992 Untung et al 1985) The major tectonic feature in the region is the Sunda Arc which Figure 241 - Locations Offshore Indonesia extends approximately 5600 km between the Andaman Islands in the northwest and the Banda Arc in the east This feature results from convergence and subduction of the Indo-Australian plate beneath the Southeast Asia plate
The Sunda Arc consists of three primary tooOE 110oe
segments the Sumatra segment (A-1 - A-5 Figure 241 ) the Sunda Strait segment (between A-1 - A-5 and G-1 - G-7 Figure 10
middot 100N
241) and the Java segment (G-1 - G-7 Figure 241) (Dames amp Moore 1992) The locations A-1 to G-1 lie along the northern edge of the Sunda Arc The locations A-5 to G-7 lie along the axis of the Sunda Arc 0
These locations represent the area of greatest seismic exposure
There have been several great (Magnitude in excess of 775) earthquakes recorded along the Sunda Arc during this century (Figure 242) More than 150 surface Magnitude 70 or greater earthquakes 1100E
have occurred along this Arc during this MAGNITUDES lt40 0
century (Beca Carter Hollings amp Ferner Ltd 1979) The majority of these earthquakes
so e 60 70
have had focal depths (Figure 243)
in excess of 70 km Figure 242 - Epicenters of Indonesian
Earthquakes 1900 - 1996 The second primary source of
earthquakes are shallow crustal faults that generally parallel the Sunda Arc (east - west) with some transform surface faulting that marks the north - south trending boundaries of the land masses (Figure 243) The majority of recorded shallow source (less than 70 km) earthquakes that have occurred during this century have occurred along the Sunda Arc zone Several hundred shallow focus earthquakes in the Magnitude range of 40 to 70 have occurred in this zone during this century In
bull
bullmiddotmiddotmiddot bull
18
the v1cm1ty of the area indicated as Raja (Dames and Moore 1990 Lamport 1992 Risk Engineering Inc 1992) in Fig 241 there have been in excess of 12 events with magnitudes between 50 and 70 during the past century (Figure 244)
Figure 245 summarizes a proposed seismic zonation for offshore Indonesia (Bea l 997b) The zone designations are associated with the 200-year peak ground accelerations at the sites as follows
Zone I G = 005g to 015 g
Zone 2 G =015g to 025g
Zone 3 G = 025g to 035 g
These seismic zonations are consistent with those contained in the proposed ISO seismic guidelines
North -SOO -400 -300 -200 -100 0 100 200 300 400
South
0
100
200
300
400
~ 3 500
~ 600
700
800
(gt 0
CXJ) coo 0 ltli)
0
0
o~ bull
0
0 0 ~ltJOO
(J 0
MAGNITUDES lt40 0
50 0
60 8 70
900--~~~~~~~~~~~~~~~~~~
Figure 243 - Hypocentral Profile of Java Central Segment Normal to Sunda Arc - Earthquakes 1900 shy
1996
In some areas site specific studies have been performed to determine the 100-year return period earthquake peak ground acceleration To convert the 100-year G to the 200-year G the following relationship can be used
G200 = G100 exp (024 crE)
where OsE is the uncertainty in the long-term distribution of G (assumed to be Lognormally distributed)
Based on the results from the recent studies of extreme earthquake conditions that have been performed in this area Figure 246 summarizes the expected annual maximum peak ground accelerations (Gm) for the locations shown in Figure 241 The expected peak ground accelerations having return periods of 100 years at the locations ranges from 010 g to 012g (Gl Al) to 017 g to 022 g (G7 -A5)
bull J011lt40 O 4011lt4IS0 _ _ D SISllltS4
0 1bullMlt72
D 72111lt10
oeow
Figure 244 - Earthquake Sources and Magnitudes in Kalimantan Region
19
I
Figure 245 - Seismic Zonation for Offshore Indonesia
The uncertainties (natural variabilities) in the expected annual earthquake peak ground accelerations (Gm) range from crsE = 060 to 070 (A-1 A-5 G-1 G-5) to crsE = 18 to 20 (Raja) These values are consistent with the proposed ISO guidelines for this region and seismotectonic conditions
The available regional and site specific information on earthquake conditions indicates that there are two general categories of Type I uncertainties associated with the primary seismic sources The first category is associated with those locations that are adjacent to the Sunda Arc These locations very frequently experience earthquakes from both shallow and deep sources (Fig 243) Those locations have Type I uncertainties in the expected annual earthquake peak ground accelerations that range from crsE = 060 to 070
The second category of locations is 111
associated with those locations that are middotm 06~~ distant from the Sunda Arc These c locations much more infrequently ~
Iexperience earthquakes primarily from 111 01~~=1 shallow sources These locations have fi
-A-1Type I uncertainties in the expected ~ - bullA-5 --bullG-1annual earthquake peak ground ~ -G-7
accelerations that range from crsE = s bullbullbullbullbullRaiae
180 to 200 (Raja) ~ 001 100 1000 10 4
fl Average Return Period - years
Figure 246 - Expected Annual Maximum Earthquake Peak Ground Accelerations at Study
Locations
20
25 Bay of Campeche Mexico The information on earthquake seismic
100hazard characteristics for the Bay of bullbullbull Campeche Mexico was provided by Chavez (1987 1997a 1997b 1998) Additional information on the earthquake characterization was provided by Guerra and Esteva ( 1978) and Guzman ( 1982)
The seismic environment is influenced by three primary types of earthquake sources (Figure 251) The Type 1 source is associated with the subduction zone on the western Pacific coast of Mexico The earthquakes in this zone occur at depths of 15 km to 20 Km and have magnitudes up to M = 8 2 The Type 2 source is associated
EXPLANATIONwith the lithospheric slab within the central Tectonostratigraphic province boundaryportion of Mexico Earthquakes occur in
0 300km ~this zone at depths of 60 km to 250 km and Thrust taubull teeth on upper plate
have magnitudes up to M = 75 The Type Plate moliona rates in cnvyr -3 source occur in the Trans-Mexican volcanic belt located primarily along the east coast of Mexico have depths up to 20
CMbull C-Muatt CaP c-n Piiie CoP bull Cocoo Plate CTbullkm and magnitudes up to M = 67 (Chavez Caymmn Traugh MATbull Middle Atllrtic Trench MFZ bull Mot1QU8 Faull Zone 1987 1998) MSG bull Mlcl1oaean SMmic Gap NOAM bull -h American Piiie OFZ bull Orozco
Fracture Zone Ind ndgn SCbull ~a-ptOYince SMQCP bull Sietra Madre OrierltllmiddotChipu P116n ptOYince TRbull Tehuamepec Ridge TSG bull
The historic catalog of earthquake Tlhuon--Gap
occurrences during the period 1970 - 1996 Figure 251 - Bay of Campeche Earthquake
NOAM
SC I
I I
I
I Campeche Bay
I I
lt~
MAT
CoP
were used by Chavez to determine the activity rates in each of the three sources and the occurrences of varying
2400earthquake intensities and magnitudes in each of the 2300
three sources Figure 252 0 2200shows the seismic events that 0 8
have occurred in this region 0 2100 0during the period 1800 to bull
20001996 for all earthquakes that 0
1900have surface magnitudes (Ms) greater than M = 50 The 1800
majority of records contained 1700in this catalog date from the
1930s when reasonably 1600
comprehensive teleseismic 1SOO
instrumentation was in place The largest earthquakes 1400
that have occurred in the ~v1c1rnty of the Bay of ~
Campeche are in the range of M = 30 to M = 40 The
Plate Tectonics and Sources
+ + + + + + + + + + + +
+ + + + + + + + ++ + +
+ + + + + + + + + + + +
0 + + +
+
+
+
+
degamp + + + + + + + + + + +
o +
0 +
~ ~ 8 8 8 ~ ~ ~ ~ ~ N ~ ~
~ 0~ bull bull ~ bull ~ bull ~ ~ bull
2400
Z300
2200
2100
2000
1900
1800
1700
1600
IS00
1400
~ bull
Figure 252 bull Seismic Events Affecting the Bay oflargest earthquake that has Campeche Region 1800-1996 Events M gt 50
21
occurred during the past 100 years within a 100 km radius of the Bay of Carnpeche is M = 60 The vast majority of the seismic activity is concentrated along the Pacific coast of Mexico The source of nearby large earthquakes are associated with the Motagua Fault Zone and the fault system (Sierra Madre Oriental-Chipas Peten province) that generally parallels the east coast of Mexico There are no major seismic sources that have been identified within the Sigsbee-Carnpeche province that underlies the Bay of Carnpeche
Based on previous analyses of pile supported platforms subjected to earthquake excitations in soil columns of the Bay of Carnpeche a depth below the sea floor of -12 m was chosen to reference the lateral accelerations and a depth of -115 m was chosen to reference the vertical accelerations from the seismic exposure analyses (Bea 1997c)
Figure 253 summarizes the results for the Bay of Carnpeche for each of the three seismic sources A mean or average value for the four representative soil columns studied by Chavez (1997a) are shown The Type 2 and Type 3 sources develops ground motions that dominate the seismic exposure in the Bay of Carnpeche At an average return period of 10000 years the indicated peak horizontal ground acceleration (Am) is indicated to be Am~ 025 g Table 25 l summarizes the ground motions at return periods of 200 and 4000 years and the uncertainties (natural or Type I aleatory) associated with the ground motions (expressed as the standard deviation of the logarithms of expected annual G
QISE)
-CE CCI iObull -shyCJ _UI 01
iii Cl -ccI
2omiddot = o ca z G lo ii ca u GI U 0 ct
001
-shy--
- - - - - shy - - - -
bullbullbull-Zona 1 -zona2 --bullZona 3
-shy---shybullmiddotmiddotmiddotmiddot -shy__- --middot~middotmiddotmiddotmiddot
-
~ -shy middotmiddotmiddotmiddotmiddotmiddot
middotbullmiddotmiddotbullmiddotbullmiddotmiddotmiddotmiddotmiddotmiddot middotmiddotmiddotmiddotmiddotmiddotmiddotmiddotmiddotmiddotmiddotbullmiddot - - middotbullbullbullbullbull ~
41000 10
Return Period - Years
Figure 253 middot Peak horizontal ground accelerations
Table 251 middot Mean Horizontal PGA at Bay of Campeche sites (middot12m) and uncertainties of peak horizontal ground accelerations
Type 200 years shyg
1000 years -g
Uncertainty
QSE
I 12 16 058 2 50 78 084 3 27 68 175
22
These results can be compared with those developed by Guerra and Esteva ( 1978) for the Bay of Campeche and firm alluvium sites At a return period of 100 years the peak horizontal ground acceleration obtained by Guerra and Esteva is G = 66 g This compares with a maximum value of G =50 g obtained by Chavez (1998) for a 100 year return period for the Zone 2 sources The results developed by Guerra and Esteva indicate an uncertainty in the annual expected peak horizontal
ground acceleration of OsE = 126
The extensive Bay of Campeche seismic exposure study performed by Guzman ( 1982) provides some additional information on the expected ground motions At a return period of 100 years the peak horizontal ground acceleration obtained by Guzman is G = I 0 g This ground motion is more intense than developed by either Chavez or Guerra and Esteva The more intense ground motion appears to be coupled with the attenuation relationships that were developed and used by Guzman ( 1982) The results developed by Guzman indicate an uncertainty in the annual expected peak
horizontal ground acceleration of OsE = 097 This uncertainty is slightly greater than that of the Chavez results and somewhat less than indicated by the Guerra and Esteva results
The proposed ISO guidelines for this region indicate a 200-year PGA in the range of 005g to 015g The lower end of this range provides a good estimate of the seismic characteristics in the Bay of Campeche The uncertainties in the annual maximum PGA are consistent with those given in the proposed ISO guidelines
The Type 1 and Type 2 sources have uncertainties in the expected annual maximum Am that are comparable with that of offshore California The Type 3 (coastal - local) sources have an uncertainty that is comparable with intra-plate seismic zones Based on the results provided by Chavez (1997a) Table 252 summarizes the mean vertical peak ground accelerations at a depth below the sea floor of shy115 m together with the associated uncertainties
Table 252 middot Mean Vertical PGA at Bay of Campeche sites (-115m) and uncertainties of peak horizontal ground accelerations
Type 200 years shyg
1000 years - g
Uncertainty
() SE
1 02 03 075 2 09 12 055 3 02 03 075
23
this page left blank intentionally
24
Strength Level Earthquake Response Spectra
30 Introduction Strength Level Earthquake (SLE) elastic response spectra were assessed in the several of the
studies of regional seismicity discussed in Chapter 2 The SLE response spectra developed for each of these regions will be summarized in this Chapter In addition results from recent general studies of response spectra will be summarized including consideration of water column effects on vertical motions
3 1 Response Spectra Ordinates Recent studies of response spectra ordinates in the low period range (01 sec to 03 sec) have
indicated that one should expect that these ordinates will vary as a function of both the local soil conditions (soil column classification)and intensity of earthquake motions (Martin Dobry 1994 Crouse McGuire 1997) Figure 31l summarizes the results from the study by Crouse and McGuire of the median amplification factors (Fa = peak horizontal ground acceleration at surface I peak horizontal ground acceleration on rock= PGAs I PGAr) for periods (T) in the range of T = 01 sec to 03 sec
The site soil conditions indicated as SC-A B C and D correspond to those in the proposed ISO guidelines The amplification factor in this period range presently incorporated into the proposed ISO guidelines is Fa= 25 for all soil conditions These results indicate substantially larger amplifications in the short period range While these findings would relatively unimportant for the lateral motions of most offshore platforms (T = 2 to 3 sec) the effects would be potentially important for the vertical motions (T = 01 to 03 sec) of these structures (particularly for heavily loaded deck structures with large cantilevers) The National Center for Earthquake Engineering Research (NCEER) workshop defined a comparable range of amplification factors for this period range (Martin Dobry 1994)
As a result of these findings the following modifications to the proposed ISO earthquake guidelines are proposed The elastic design
tf 55 0 5 uu ~
SC-Aftl Ill ~ - S111 seaLI 111 45 CM -bullmiddotsec0 SC-0middot-Cl 4 iii 0 ~tbull~bullFbull~bullbull~~middotmiddotmiddotmiddotmiddotr-Eu
35
Qci -~-11--~---F=--- --imiddot-- middotmiddotmiddotmiddotmiddotmiddotmiddotmiddotmiddotmiddot---- -middotmiddot------ ---1-----shyE II 3
lt1shyCJ~ 25 -----middot----middot-----c ~
2 CJ 01 015 02 025 03 035 04
Peak Ground Acceleration - gs
Fig 311 - Amplification factors as function of acceleration level and soil conditions
25
response spectra (Figure 312) would 10 - - - --~ be a function of the following variables
Sa I G = vbull T = period of system
bull D = damping of system
bull v = site classification factor for short period range (new factor)
~ Sa I G =~Tla___~
bull I = site classification factor for 0=5long period range L------__________bull E =seismotectonic conditions 01
001 01 1
Period - T (sec) Table 3 11 summarizes the elastic
design response spectra characteristics Fig 312 bull Proposed elastic design responsebased on the results of the work by spectra Crouse and McGuire (1996) and the previous work incorporated into the proposed ISO design response spectra
Table 311 - Local geology and soil conditions parameters for SLE response spectra
Soil 1-ondibons Se1smotectonic Lond1tions
Site 1-lass v I E
SC-A 25 10 Type A 10
SC-B 33 12 TypeB 08
SC-C 35 14 TypeC 09
SC-D 45 20 TypeD 08
SC-E Site specific studies required Detault value 10
3 2 Vertical Response Spectra Ordinates Several recent large magnitude earthquakes have indicated that vertical ground motions can be
equal to or greater than the horizontal ground motions This observation has been particularly true for ground motions close to the epicenter of large magnitude earthquakes The present ISO guidelines prescribe an elastic design response spectrum for vertical motions that is one-half of the horizontal motions
Figure 3 21 summarizes results from a recent study of the ratios of vertical to horizontal spectral ordinates as a function of the response frequency (Bozorgnia Niazi Campbell 1995) Results for the Loma Prieta and Taiwan earthquakes are shown The ratios indicated are mean values The horizontal line indicated at the ratio of 23 references the present Uniform Building Code (UBC) specifications For near-by earthquakes (R = l 0 km) the ratio of the vertical to horizontal spectra ordinate for periods
26
in the range of T = 01 sec are in the range of 14 to I7 The ratio is close to unity at distances of R = 20 km to 30 km Comparable results have been found for other large magnitude earthquakes in other sernismotectonic zones
For periods in the range of T = 2 to 3 sec the ratios are in the range of 02 to 03 for all distances Current studies of recordings from different earthquakes generated by different types of seismotectonic environments indicates that these trends are very likely to be universal (Bozorgnia Niazi Campbell 1995) These results show the problems that are associated with specifying a constant ratio of vertical to horizontal spectra ordinates for all periods and distances The results indicate that the horizontal and vertical spectra have decidedly different shapes
The authors application of these results to the unmodified 1 ISO response spectra is illustrated in Figure 322 The present proposed ISO horizontal and vertical response spectra for Site Classification C (firm alluvium v = 35 I= 14) and Type A seismotectonic
conditions (shallow crustal faulting E = 1 ) For periods greater than about 03 sec the unmodified vertical response spectra have ordinates that are less than the present proposed ISO guideline vertical spectra For periods Jess than 03 sec the unmodified ordinates are substantially larger
The foregoing results have been developed based on earthquake ground motion measurements that have been made on land Measurements of ground motions offshore have indicated that the presence of the water column can have a marked influence on the sea floor motions (Smith 1997 Sleefe 1990) The measurements indicate that the vertical motions at the sea floor are much less than would expected based on on-land measurements For mat supported structures that receive the majority of their input motions from soils that are located near the sea floor this can be an important consideration
For vertically incident earthquake compression waves the ratio of the reflected to the incident wave amplitude at the ground
1 unmodified for water column effects
Loma Prieta EQ Stitt Soll Sites 16
14
0
i ~
12
10
08
~ 08
~ 04
02
00
SMART-1 Array Taiwan Mag 70
(a)
Rbull10 km
Rbull20 km
R-40 km -------213
18
i
16
14
0 12
( i 10I
08
-~ 06 ~
gtbull 04
02
00
(b)
Rbull10 km
Rbull30 km
-------213RafiO km
001 010 100 1000 Period (sec)
Fig 321 - Ratio of Vertical to Horizontal Elastic Response Spectra Ordinates
UJ
01 _____ ______~
1SO Horizontal-II bullVertical -+bullISO Vertical
-----middot
D = 5
001 01
Period - T (sec)
Fig 322 - Horizontal and Vertical Elastic Response Spectra for SC-C E = 10
27
-+-ISO Vertical
bullC
surface is a function of the impedance ratio IR at the ground surface
IR= ps Vspa Va
where pis the mass density of the soil (s) and air (a) and V is the compression wave velocity in the two media On land this impedance ratio is very large and one would expect almost total reflection of the energy at the ground surface This would indicate a doubling of the amplitude of the incident compression waves at the ground - air interface
In water the compression wave velocity in the water and in the water saturated sediments would be almost the same The density difference would be a factor of about 2 This would indicate that about 50 of the compression wave would be transmitted through the interface and the remaining 50 would be reflected The total wave amplitude at the interface would be 15 times the incident amplitude or 75 of the amplitude expected at an air - soil interface
This analysis assumes that the water is infinitely deep and ignores the reflection of the incident compression waves at the water - air interface Crouse and Quilter ( 1991) developed an analysis that includes the finite water column effects Depending on the water depth some frequencies can be reinforced and amplified by the finite water depth while others can be canceled The analyses performed by Crouse indicates that the peak vertical accelerations at the sea floor can be reduced by as much as 50 (Crouse Quilter 1991 Dolan Crouse Quilter 1992 Smith 1997 Sleefe 1990) These observations are in agreement with the analyses of recorded earthquakes at the sea floor reported by Smith ( 1997) and Sleefe ( 1990)
The earthquake ground motions in the vicinity of the sea floor are the result of a very complex variety of wave forms frequencies and incidence angles Thus the foregoing simplified analyses can be relied upon only to provide some insights into the potential effects of the water column on the vertical movements at the sea floor Measurements of earthquake movements at the sea floor provide the only reliable source of information to quantify these effects The measurements that are available confirm the inferences that have been drawn based on simplified analyses
Figure 323 summarizes the results for the water column modified vertical response spectra compared -bullbullModified (x05) Vertical
D =5 Modified (x 075) Vertical with the present ISO vertical response
spectra The present ISO vertical response spectra provides a conservative envelope to the modified vertical spectra for periods greater ~ 1 ~
~than about 02 sec However the ftl bull-----117 present ISO vertical response spectrum is somewhat unconservative ifor periods less than about 02 sec
SC-C v = 35 1J1 = 14 E = I ~ bullUntil better information becomes available it is the authors conclusion 01
that the present proposed ISO 001 01 1 guidelines for vertical response Period - T (sec) spectra provide a reasonable arid likely somewhat conservative Fig 323 - Water Column Modified Vertical approximation to the vertical Response Spectra movements that can be expected in the vicinity of the sea floor
28
33 Computed Response Spectra Most current seismic exposure analyses and evaluations characterize the earthquake ground
motions on a rock or very firm alluvium surface Then often one-dimensional shear beam type analyses are performed to characterize the earthquake ground motions within the soil column that overlies the rock or very firm alluvium surface A variety of soil constitutive models can be used in these analyses but most often equivalent linear models are used with modifications introduced to model the soil non-linear stress-strain behavior and the changes in this behavior with cyclic strains Damping is generally introduced as an equivalent viscous damping (Dobry 1991 ) The bottom boundary of the soil column at the rock interface is generally characterized with an absorbing boundary element to prevent unrealistic trapping of the earthquake energy in the soil column due to reflections of the energy at the rock interface
Relative to the ISO earthquake guidelines this practice raises issues regarding the uncertainties and biases that can be introduced by different analyses of soil column effects The ISO guidelines do not include any definitive information on how such analyses should be performed There is a very wide range in how such analyses are performed and how the soil column analyses are performed can have extremely important effects on the earthquake ground motions that are utilized in analyses of the soil shystructure interactions
Fig 33 l summarizes earthquake acceleration response spectra from four locations in Mexico City based on recordings obtained during the 1985 earthquake (Seed 1987) The soft clay soil column has discernible effects on the shapes of the response spectra and the magnitudes of the spectra ordinates The computed natural periods of the soil columns (Ts) at each of the locations is noted based on the relationship
Ts =4dVs
where dis the depth of the soil column and Vs is the soil shear wave velocity (appropriate for the soil strains induced by the earthquake) For a given soil column thickness the natural period of the soil column is controlled solely by the shear wave velocity The shear wave velocity is a function of the shear modulus which is a function of the cyclic shear strains induced in the soils by the earthquake Higher strains result in lower shear modulii and shear wave velocities
The response spectra exhibit definite peaks at the natural periods of the soil columns The noticeable increase in the response spectra energy associated with the 37 m depth site is likely due to reflected energy associated with the edge of the Mexico 75
rbullbull 4H37gt bull 2 sec City basin This basin 10------- 10---10---0--- edge influence would oat- UNAM CAOT J SCT CAF
08 08 08 not be incorporated in ss 06 5 orrpng bullbull gmost shear beam soil bullmiddot g 04t-
column analyses because the soil column 0o 1 2 3 5responses would be
T sec T sec T sec T secbased on the rock outcrop motions (in this case at the UNAM site)
0[~mJraquo middot~middot~middotmiddot 75~)~mbullEJ 3f==Soft Fig 332 l c~~aVbullSOOto900nVa middotsummarizes results
from SHAKE analyses
0606
04
06
04 JT
dego t 2 3 1 2 3 4 5
of motions at the soil surface identified as Fig 331 - Soil Conditions and Recorded Acceleration Spectra Oakland Outer Harbor During 1985 Mexico City Earthquake
29
(Bray et al 1996) during the 1989 Loma Prieta earthquake (epicenter about 70 km away) The soil profile consists of 156 m of alluvium (clays sands) overlying bedrock The shear wave velocity in this soil column ranged from 800 msec (alluvium at base of column) to 63 mis (Bay Mud) The soil column had an average shear wave velocity in the range of approximately 400 msec The response spectra indicates discernible peaks at 15 sec and about 06 sec Based on the results from testing of soil samples a soil damping ratio of l 0 to 20 was used
Response spectra from available strong motions recorded at nearby rock sites are shown in Fig 332 The response peak at 06 sec is obviously due to the energy in the input rock motions at this period The response peak at 15 sec is obviously due to the natural period of the soil column The spectral acceleration of the rock is amplified by a factor of about 4 at the 06 sec and 16 sec peaks of the soil column Given a peak spectral acceleration of 025 g in the input rock motion at the natural period of the soil column the peak spectral acceleration is
Rock mollon YBI (90 dovl ied lo OOlg
Rocordod mollon (305 dovgt Computed mollon
o
1 2 3 4 PERIOD seconds
middot Recorded and SHAKE
1
Cl
Fig 332 Computed Response Spectra (Oakland
Outer Harbor Loma Prieta Earthquake)
about 05 g representing a doubling of the peak in the spectral input motion Note that the computed motion of the soil column generally is somewhat less than the recorded motion
Fig 333 and Fig 334 summarize similar results for two other nearby locations The Oakland location consisted of 152 m of alluvium having shear wave velocities in the range of 800 msec to 120 msec The Emryville location consisted of 137 m of alluvium having a similar range in shear wave velocities In these cases the amplifications of the rock motions at a period of 06 sec were about 3 and at a period of about 15 sec were about 4 The peak input spectral acceleration of 020 g to 025 g was magnified at the natural period of the soil column by a factor of about 2 Again the SHAKE analyses tend to under predict the ground motions at the natural period of the soil column but predict the amplifications reasonably well at the earthquake input peak energy period of about 06 sec
These results indicate that the SHAKE analytical model and the associated characterizations of the soil stiffness and damping has a bias in the range of B = 15 to 20 for the natural period of the soil columns Other similar results need to be developed before definitive statements can be made
Rock mollon YBI (90 dogl ied lo OOlg Rocordod mollon (290 dovgt06 11ecorded motion (200 deg)
Cl Compulod mollon
Demplng 5
0 1 2 3 PERIOD seconds
Fig 333 bull Recorded and SHAKE Computed Response Spectra (Oakland Loma Prieta
Earthquake)
30
4
concerning the biases associated with the soil column analyses
The amplification of the earthquake input acceleration on rock at the surface of the soil column can be evaluated approximately from (Dobry 1991)
A= [as I ar lmax =II I + (1t 12) D5 I
where A is the ratio of the maximum acceleration at the soil surface as to the input acceleration at the rock interface ar I is the impedance ratio of the rock - soil interface D5 is the soil damping ratio The soil - rock impedance ratio is
I= (pr I ps) (Yr I Vs)
where pr is the density of the rock ps is the density of the soil Yr is the shear wave velocity of the rock and Vs is the shear wave velocity of the soil The velocity ratio would generally be in the range of 5 to 30 and the density ratio in the range of II to 15 Thus the impedance would generally be in the range of 5 to 50 The soil damping ratio could be expected to be in the range of 005 (low
I
Rocle mollon YBI llO dog) Recordod mollon (350ltMg)0
Cl
0
Ar Compulodmodan bull I
DomplngS
middotmiddot~_ -~
1 2 3 PERIOD seconds
Fig 334 - Recorded and SHAKE Computed Response Spectra (Emryville Loma Prieta
Earthquake)
strains) to more than 03 (high strains) Fig 335 summarizes the results of this development Except for very low impedance impedance is not an extremely important element However damping is very important The use of low strain damping ratios in the range of 5 to I 0 result in amplifications that are a factor of 4 to 5 times those for damping ratios in the range of 25 to 30
The Loma Prieta site results summarized earlier had a velocity ratio in the range of 7 to 9 a density ratio in the range of I I to 12 This would indicate an impedance in the range of 8 to 11 Given an amplification of the input rock acceleration of about 2 at these sites a damping ratio in the range of 20 to 30 is indicated This damping is much higher than indicated from the laboratory triaxial and resonant column tests 12Often this has been found to be true and it has been postulated that the under-estimated c( 1 0 damping is due to the laboratory testing boundary conditions c 80
Studies are currently being conducted to ~ 6better characterize the bias and uncertainties
associated with analyses of soil column e 4response characteristics during intense Q
earthquakes These studies are attempting to E 2c(account for the different methods that can be used to characterize the soil properties and the 0input earthquake excitations Results from these studies will be monitored by the author
-D=Soo Impedance- bull0=10dego - bull bull0=15dego t--r~-~-~-~--- bullbullbullbullbullD=20dego
~middot0=30oomiddotmiddotmiddotmiddotmiddot0=251middot=~~-
10 20 30 40
and their implications integrated into future revisions of the proposed ISO guidelines Fig 335 - Soil Surface Amplification of
Bed Rock Acceleration
31
4
50
34 North Sea Response Spectra Elastic response spectra for North Sea
seismotectonic and hard ground - rock conditions were developed as part of the EQE International study (1998) and the NORSAR study (1998) Fig 341 summarizes the normalized response spectra results for a 5 damping ratio from the EQE study for return periods of 100 years 1000 years and 10000 years The response spectra do not vary significantly as a function of the intensity of the earthquakes in this range This is to be expected since the hard ground shyrock materials respond essentially in their low-strain reasonably elastic range The peak amplification of the spectra is approximately 25
In the EQE study it was noted that the spectra could be modified for other values of damping by the factor K (Woo et al 1988)
K = 148 - 030 In D
This response spectrum modification factor was compared with that contained in the proposed ISO guidelines It was found that the modification factors are essentially identical for damping ratios less than about 20 and above 20 only differ by about 10
I 1000
100
~ ~ 6 -g 10
~
01
01 10 100 100
Undamped Natural Frequency (Hz)
Fig 341 - Earthquake Response Spectra for UK Sector Conditions
Fig 342 summarizes the response spectra from the NORSAR study (1998) for a return period of 10000 years at low seismic activity (Alta) and high seismic activity (Midgard) sites for rock or hard ground conditions The shapes of the spectra are essentially identical
1 1 FREOUENCY (HZ)
a 1u
Fig 342 - Earthquake Response Spectra for Norwegian Sector Conditions For Earthquake Return Period of 10000 years and Rock - Hard Ground
32
Fig 343 and Fig 344 summarize results from the study of soil column effects on the rock spectra performed by the Norwegian Geotechnical Institute (1988) as part of the NORSAR study ( 1988) Soil column characteristics were based on results from soil exploration - soil boring - laboratory jtesting performed at North Sea platform locations and onshore Norway locations The earthquake response analyses were performed using the SHAKE computer program discussed earlier The soil columns were organized into two different categories Soil Type B - shallow firm alluvium and Soil Type C - deep firm alluvium Recorded earthquake time histories characteristic of those expected for the Norwegian
01 10 100seismotectonic conditions were used as input to the soil column analyses Frequency (Hz)
The amplification factors for the Soil Type Fig 343 Computed Earthquake Response B profiles has a definite peak in the period Spectra Amplification Factors for Deep range of 005 sec to 01 sec The peak Alluvium Soil Conditions (Soil Type C) amplifications range from about 25 to as high The Coefficient of Variation (COY) of the peak amplification factors is approximately 20 ( ~
crG5) The COY suggested in the proposed ISO guidelines is 30 The range of results shown in Fig 343 represents the range of results between different sites not the range of results that reflect variations in the soil characteristics for a given site
The amplification factors for the Soil Type C profiles has a definite peak in the period range of 0 5 sec to 1 sec The peak amplifications range from about 25 to almost 6 The Coefficient of Variation (COY) of the peak amplification factors is approximately 30 The COY suggested in the proposed ISO guidelines is 40
Fig 345 summarizes the mean soil response spectra amplification factors for the two different soil column conditions The mean peak soil amplification factor for Soil Type B is 3 and the same factor for Soil Type C is 3 5 These results are in excellent agreement with those summarized in Table 311 These results confirm the need to have a factor that modifies the magnitude of the peak in the response spectra as a function of the soil conditions
The NORSAR study also addressed the 01 10 100
vertical motion spectra and concluded that the Fraqubullcy (Hz) ratio of the spectral ordinates (VH) was frequency (f) dependent In the vicinity of the Fig 344 - Computed Earthquake peak of the horizontal response spectrum (f = 1 Response Spectra Amplification Factors to 3 Hz) the recommendation was that the ratio for Shallow Alluvium Soil Conditions should be determined as follows (Soil Type B)
1400
300 +----+--+-+-r-tishy
200 +---+---+-middot
7
6
2
0
I
33
VH = 09 - 042 log (f)
For f =1 Hz VH =09 These results are in reasonably good agreement with those summarized in Fig 322 Based on the information provided in the NORSAR study it is understood that these results are for the surface of the soil column and do not incorporate the effects of the overlying water column Future studies of the vertical response spectra at the sea floor should take account of these effects
400
300~
~ c 0 ~ 2005 E Q
100~
000
010
Fig 345 middot Recommended Earthquake Response Spectra Mean Amplification Factors for Deep Alluvium Soil Conditions (API Soil Type C)
100 1000 10000 Frequency (Hz)
Sc w ) ~
I
I I
~
v Soll Ty1 bull
) 1
34
35 Bay of Campeche Spectra Chavez (I997a l 997b) performed a number of site response studies for the Bay of Campeche
using the computer program SHAKE Results from recently performed high quality soil borings and laboratory static and dynamic testing programs were used to characterize the strength stiffness damping and hysteretic performance characteristics of the soils The soils consist of deep (100 m to 200 m) firm alluvium (layered calcareous sands silts and clays) Chavez introduced the deconvolved input motions from the three types of earthquakes at the base of the soil columns and determined the output motions close to the sea floor (at -12 m appropriate for lateral motions characterizations for piles) and at significant penetrations below the sea floor ( -100 m appropriate for vertical motions characterizations
Results for the 200-year horizontal Strength Level Earthquake (SLE) conditions ( -12 m) for a variety of sites in the Bay of Campeche are summarized in Figures 351 352 and 353 for Type I (very distant subduction zone) Type II (distant mixed zone) and Type III (nearby surface faulting zone) earthquakes respectively The Type I earthquake produces a peak in the ground motions at a period of about 3 sec that represents the long-period energy from these distant subduction zone earthquakes that coincides with the natural period of the soil column The Type II earthquake produces a set of response spectra with multiple peaks in the range of 0 3 sec to 3 sec The Type II earthquake produces a much more conventional spectrum with peaks in the range of 02 to 08 sec
The resulting mean response spectra for these three types of earthquake conditions is summarized in Fig 354
bullbull
bullbull
bullI
~~
1
~ (
~w - ~
- Fig 351 - Type I 200-year Earthquake Computed
Response Spectra
bullbull
bullbull
bull i j0 bull -
~~ ~middotg- - ~~middotshy -
I I bull
Fig 352 - Type II 200-year Earthquake Computed Response Spectra
35
bull
bull
together with the mean plus one standard deviation and envelope spectra Chavez included the range in response spectra results that developed from plus and minus one standard deviation changes in the soil shear modulus and damping characteristics The COY of the peak response spectra values is about 100 This high uncertainty reflects the influences of the three different types of seismic sources different soil characteristics at different sites and the effects of plus and minus one standard deviation ranges in the soil properties at the different sites Given a location that is affected by multiple types of earthquake sources it would be preferable to define different response spectra associated with these sources rather than combine them into a single response spectrum
These results clearly indicate that the dominant horizontal and vertical motions important to the pile foundations of the platforms in the Bay of Campeche are associated with the Type II earthquake source At a period of 1 sec (predominant natural period of platforms in Bay of Campeche) the Type II earthquake source produces horizontal motions at a penetration of -12 m that are a factor of about 10 greater than those for the Type I and Type III sources
In general these results are in good agreement with the proposed modifications to the ISO SLE response spectra
bull
middot~
0JO
Imiddot~ 016
1110
f 016
010
~ -~middot)
Ar
~I~ -
I I I
Fig 353 - Type III 200-year Earthquake Computed
Response Spectra
I I
I
I I
I [I
I I
I
I
-~-~ Fig 354 bull 200-year Mean Mean Plus One Standard
Deviation and Envelope Response Spectra
36
Summary Conclusions amp Acknowledgments
40 Summary The objective of this study was to continue development of earthquake load and resistance factor
design (LRFD) guidelines with a study of results from recent seismic hazard characterizations This study addressed two primary topics
a) seismic zonation of the UK and Norwegian Sectors of the North Sea offshore Japan and Indonesia and the Bay of Campeche Mexico and
b) Strength Level Earthquake (SLE) response spectra
This study was organized as follows
bull obtain recent background on seismic hazard characterizations
bull detail seismic exposure uncertainties and local site response uncertainties
bull reconcile differences between current ISO seismic hazard guidelines and those developed during this study
bull document the revised seismic hazard and response spectra characterizations in a project technical report
Results from current seismic exposure studies of the UK and Norwegian Sectors of the North Sea indicate SLE rock PGA in the range of 0015 g to 008 g and seismic uncertainties in the range of crE = 15 to 17
Results from current seismic exposure studies for the Japan coastal and offshore areas indicate SLE rock PGA in the range of 005 g to 05 g and seismic uncertainties in the range of crE = 08 to 10
Results from current seismic exposure studies for the Indonesia coastal and offshore areas indicate
SLE rock PGA in the range of 005 g to 035 g and seismic uncertainties in the range of crE =06 to 20 (lower end of range associated with subduction zone dominated sites)
Results from current seismic exposure studies for the Bay of Campeche Mexico indicates SLE rock PGA in the range of 001 g to 005 g and seismic uncertainties in the range of crE = 06 to 18
Results from current studies of horizontal response spectra associated with SLE intensities indicates that the ISO SLE horizontal response spectra for periods in the range of about 01 sec to 05 sec should be modified (increased) to account for different types of soils Such modifications have been developed as a result of this study Results from region and site specific SLE horizontal response spectra generally are in good agreement with the proposed modified ISO response spectra
Study of information relating to the vertical ground motion spectra for on-land conditions indicate that the ratios of vertical motions to horizontal motions in the low period range (01 sec to 03 sec) for near-by earthquakes can be much greater than currently specified in the proposed ISO guidelines
37
However when the effects of the water column are taken into account combined with the proposed modifications to the horizontal response spectra in the period range of 01 sec to 05 sec the proposed modified ISO guidelines generally provide a conservative estimate of the vertical motion characteristics
4 1 Conclusions The results from this study indicate that the proposed ISO seismic exposure guidelines generally
provide a conservative estimate of the SLE PGA for the regions studied The current regional seismic exposure results provide the basis for updated North Sea Japan and Indonesia regional ISO seismic exposure maps (Fig 212 Fig 222 Fig 232 Fig 246)
The results from this study indicate that the proposed ISO guidelines for seismic exposure uncertainties associated with the different seismotectonic zones generally provide a conservative estimate of the uncertainties The current regional seismic exposure results provide the basis for updated North Sea Japan Indonesia and Mexico seismic exposure uncertainties
The results from this study indicate the need for modifications to the proposed ISO SLE horizontal response spectra in the period range of about 01 sec to about 05 sec Based on results from current response spectra studies proposed modifications that are a function of the type of soil column have been developed In general the proposed modified ISO SLE horizontal response spectra provide a conservative estimate of the expected SLE horizontal response spectra developed from detailed site specific studies The uncertainties associated with the response spectra ordinates as suggested in the proposed ISO guidelines provide reasonable characterizations for the different types of soil columns
The results from this study indicate that it is important to clearly identify the position in the soil column that are associated with the response spectra The positions should be those that characterize the positions that result in maximum input of motions or energy from the earthquake ground motions For pile supported structures these motions would be below the sea floor for lateral motions (eg 5 to 10 pile diameters) and along the lower one-third to bottom of the pile shaft for axial motions For mat supported structures these motions would generally be much closer to the sea floor but are still not generally at the sea floor itself These considerations are particularly important for specification of the vertical response spectra for both pile and mat supported platforms
The presence of the water column has important effects on the vertical motions at or very close to the sea floor These effects need to be accounted for when evaluations are developed for the vertical response spectra for these elevations Analysis of available information on vertical motions and the effects of the water column generally indicates that the proposed modified ISO guidelines provide a conservative characterization of the vertical motion effects
42 Acknowledgments The author would like to acknowledge the technical guidance and information provided by Dr Ove
Gudmestad of Statoil and Mr Mike Craig of Unocal Financial support for the second phase of this study was provided by Statoil and Unocal
The third phase of this study will be sponsored by the U S Minerals Management Service The third phase will address verifications of the proposed ISO guidelines based on site and platform specific results provided by the project sponsors
38
Australian Bureau of Mineral Resources Geology and Geophysics and Lamont-Doherty Geological Observatory of Columbia University Tectonic Map of the Indonesian Region Professional Paper 1078 Geological Survey oflndonesia
Bea R G (1992) Seismic Design and Requalification Methodologies for Offshore Platforms Proceedings of the International Workshop on Seismic Design and Requalification of Offshore Structures California Institute of Technology Pasadena CA Dec
Bea R G (l997a) Background for the Proposed International Standards Organization Reliability Based Seismic Design Guidelines for Offshore Platforms Proceedings of the Earthquake Criteria Workshop Recent Developments in Seismic Hazard and Risk Assessment 16th International Conference on Offshore Mechanics and Arctic Engineering Y okahama Japan (obtain proceedings from Port and Harbors Research Institute Yokuska Japan)
Bea R G (1997b) Risk Based Oceanographic and Earthquake Load amp Resistance Factor Criteria for Design and Requalification of Platforms Offshore Indonesia Report to Indonesian Petroleum Association Directorate General of Oil and Gas of Indonesia Pertamina and Bandung Institute of Technology Marine Technology and Management Group University of California at Berkeley
Bea R G (1997c) Risk Based Hurricane and Earthquake Criteria for Design and Requalification of Platforms in the Bay of Campeche Report to Petroleos Mexicanos Instituto Mexicano de Petroleo and Brown amp Root International Inc Marine Technology and Management Group University of California at Berkeley
Bea R G (1998) Continued Development of Earthquake Load and Resistance Factor Design Guidelines Report I - Concrete Gravity Base Structures LRFD Guidelines Report to the UK Health and Safety Executive Marine Technology and Management Group University of California at Berkeley
Beca Carter Hollings amp Ferner Ltd Indonesian Earthquake Study Seismic Zones for Building Construction in Indonesia 1979
Borcherdt R D (1994) Estimates of Site-Dependent Response Spectra for Design (Methodology and Justification) Earthquake Spectra The Professional Journal of the Earthquake Engineering Research Institute Vol 10 No 4 Nov
Bozorgnia Y Niazi M and Campbell K W (1995) Characteristics of Free-field Vertical Ground Motion during the Northridge Earthquake Earthquake Spectra Vol 11 No 2 Earthquake Engineering Research Institute Oakland California
Bray J D Chameau J-L and Guha S (1997) Seismic Response of Deep Stiff Clay Deposits Proceedings of the 5th International Conference on Earthquake Engineering Earthquake Engineering Research Center University of California at Berkeley
Chavez M (1987) Analisis de Riesgo Sismico en Varios Sitios de a Bahia de Campeche Elaborado para IMP Proy 6734 Mexico City MX
Chavez M (1997a) On the Seismic Hazard of the Campeche Bay Region Prepared for Meeting About the PEMEX Transition Normativity for the Bay of Campeche Berkeley CA March
Chavez M (1997b) Seismic Hazard and Design Spectra for Southern Gulf of Mexico 16th International Conference on Offshore Mechanics and Arctic Engineering OMAE 97
39
Proceedings of Earthquake Criteria Workshop Recent Developments in Seismic Hmard and Risk Assessments for Port Harbor and Offshore Structures Yokohama Japan April 17 American Society of Mechanical Engineers New York NY
Chavez M (1997c) Seismic Hmard at Sites of the Campeche Bay for the Risk Assessment of PEMEX Offshore Facilities Report to PEMEX and IMP August 10 Mexico City Mexico
Chavez M (1998) Seismic Hazard at Sites of the Campeche Bay for the Risk Assessment of PEMEX Offshore Facilities risks and Seismic Design Spectra in Areas of the Bay of Campeche Report to Petroleos Mexicano Instituto Mexicano de Petroleo and Brown amp Root International CISIND Col Jardines de Ajusco Talapan DP Mexico
Crouse CB and Quilter J (1991) Seismic Hazard Analyses and Development of Design Spectra for Maui A Platform Proceedings of the Pacific Conference on Earthquake Engineering Auckland New Zealand
Crouse C B and McGuire J W (1997) Site Response Studies for Purpose of Revising NEHRP Seismic Provisions Dames and Moore Consultants Seattle Washington
Dames amp Moore 1992 Final Report Seismic Hazard Evaluation Offihore Northwest Java Indonesia Report to Maxus Southeast Sumatra Inc Atlantic Richfield Indonesia Inc
Dames and Moore Seismic Risk and Site Response Study Proposed Rajah Platform East Kalimantan Indonesia Report No 02310-004-75 Report to Unocal Corporation
Dobry R (1991) Soil Properties and Earthquake Ground Response Proceedings of the Tenth European Conference on Soil Mechanics and Foundation Engineering Associazione Geotecnica Italiana Florence Italy
Dolan D K Crouse C B and Quilter J M (1992) Seismic Reassessment of Maui A Proceedings ofthe Offshore Technology Conference OTC 6934 Society of Petroleum Engineers Richardson Texas
EQE International Ltd ( 1998) Seismic Hazard Mapping of Offshore Britain Report to Health and Safety Executive London UK
Guerra R and Esteva L (1978) Espectros de Diseno Sismico en Paraiso Tab y Cuidad de Carmen Camp Patrocinado por Proyectos Marinos S A Instituto de Ingenieria UNAM Mexico City DP
Guzman R (1982) Bases de Riegso Sismico y Espectros de Riesgo Uniforme de la Bahia de Campeche Preparado para Instituto Mexicano de Petrroleo Proyectos Marinos Mexico DP
Lamport W B 1992 Seismic Analyses of Indonesias Rajah Wellhead Platform Unocal Corporation Science and Technology Division Project Report 91-23
Martin G R and Dobry R (1994) Earthquake Site Response and Seismic Code Provisions National Center for Earthquake Engineering Research Bulletin Vol 8 No 4 Buffalo New York
NORSAR and Norwegian Geotechnical Institute (1998) Seismic Zonation for Norway Report to Norwegian Council for Building Standardization
Norwegian Geotechnical Institute (1998) Effects of Local Soil Response on Earthquake Loading Report to Norwegian Council for Building Standardization
Nozu A and Iai S (1997) Seismic Hazard in Coastal Areas of Japan Proceedings of Earthquake Criteria Workshop Recent Developments in Seismic Hazard and Risk Assessments for Port Harbor and Offshore Structures Port and Harbor Research Institute Japan
40
Nozu A Uwabe T Sato Y Ichii K and Iai S (1997) Attenuation Relations for Peak Ground Motions on Base Layer in Japan Proceedings of Earthquake Criteria Workshop Recent Developments in Seismic Hazard and Risk Assessments for Port Harbor and Offshore Structures Port and Harbor Research Institute Japan
Risk Engineering Inc 1992 Seismic Hazard Analysis for the Offshore Kalimantan Sites Indonesia Report to Unocal Corporation March 27
Sleefe G E (1990) The Long-Term Measurement of Strong-Motion Earthquakes offshore Southern California Proceedings Offshore Technology Conference OTC 2345 Society of Petroleum Engineers Richardson Texas
Smith C E ( 1997) Dynamic Response of a Steel-Jacket Platform Subject to Measured Seafloor Earthquake Ground Motions Proceedings Eighth International Conference on the Behavior of Offshore Structures Vol 3 Pergamon Elsevier Science Ltd Oxford England
Untung M Buyung N Kertapi E Undang N Allen C R 1985 Rupture Along the Great Sumatran Fault Indonesia During the Earthquakes of 1926 and 1943 Bulletin of the Seismological Society of America Vol 75
Utsu T (1982) Catalog of Large Earthquakes in the Region of Japan from 1885 through 1980 Bulletin ofEarthquake Research Institute University of Tokyo Vol 57 pp 401-463
41
this page left blank intentionally
42
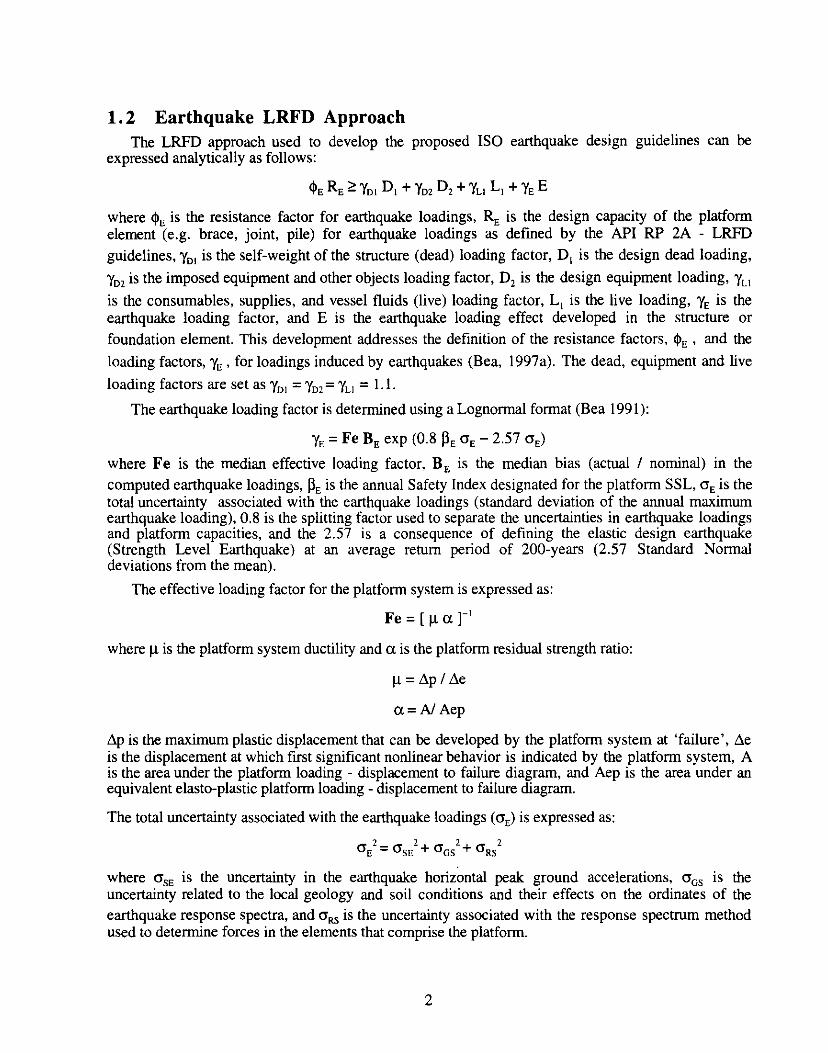
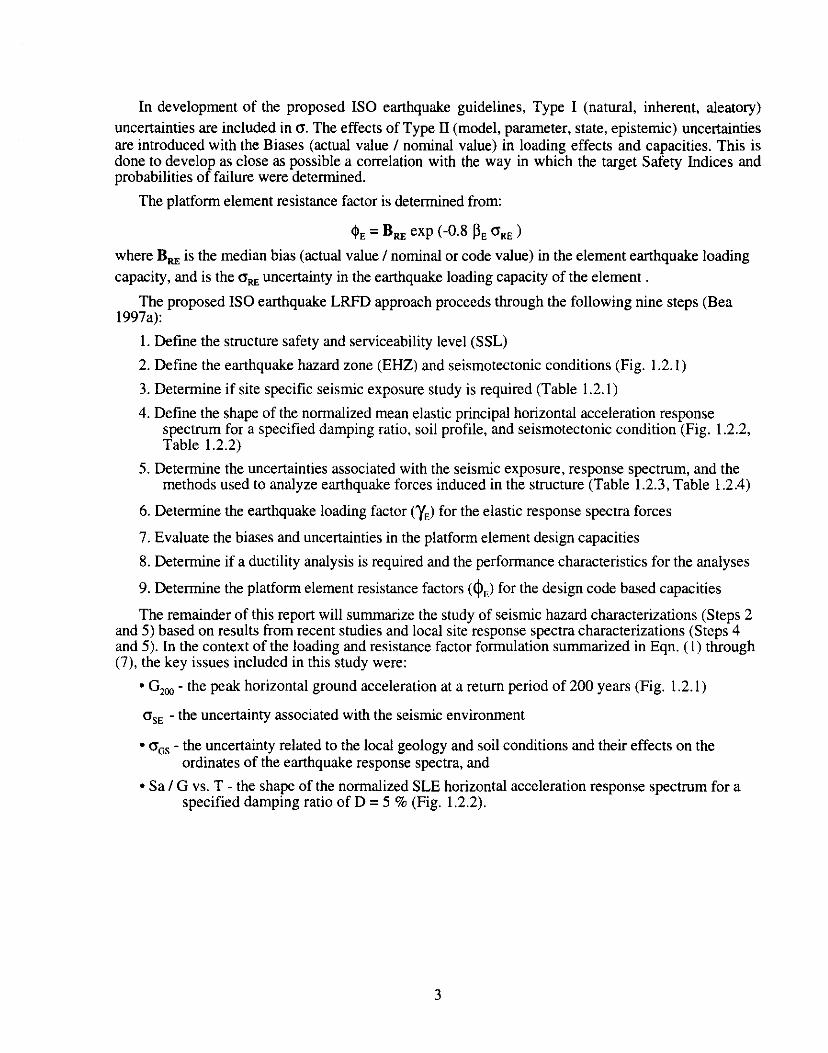
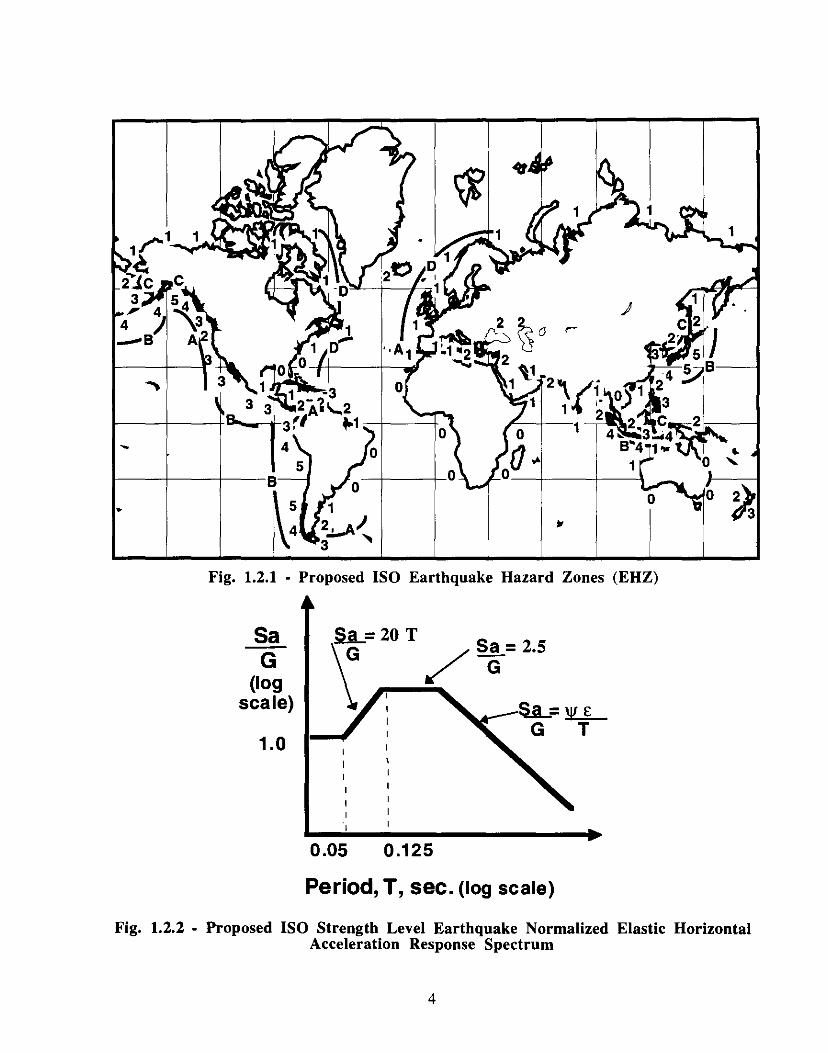
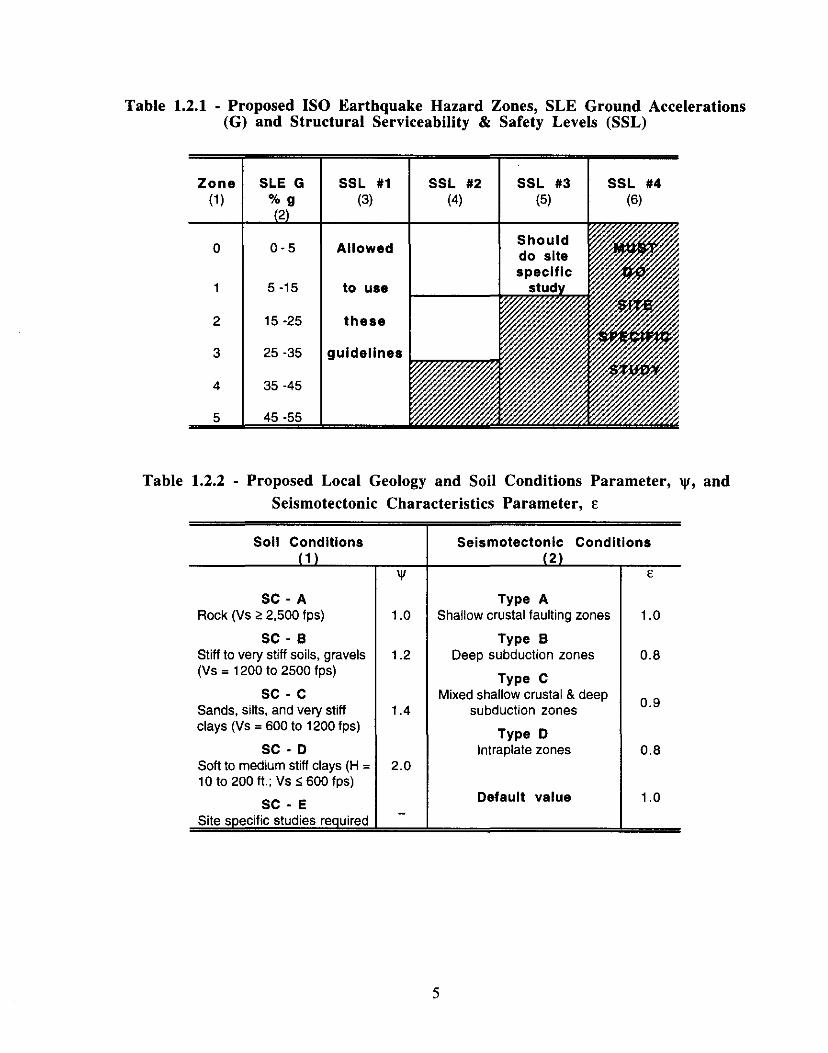
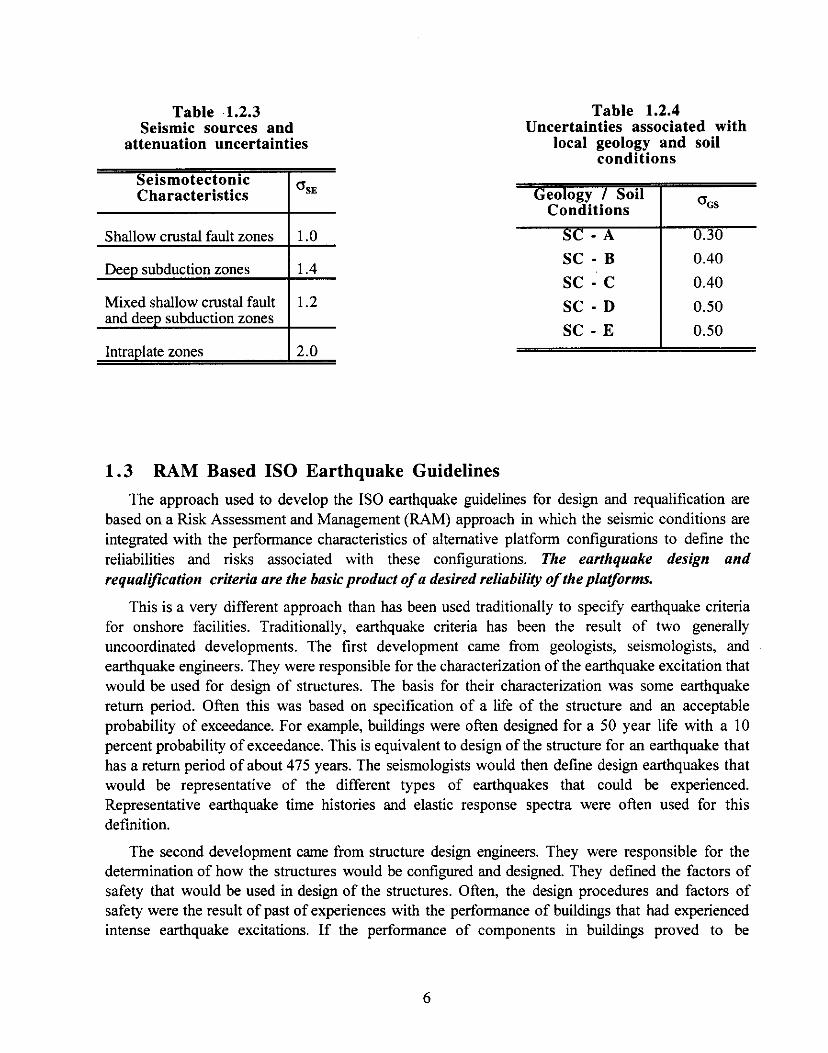
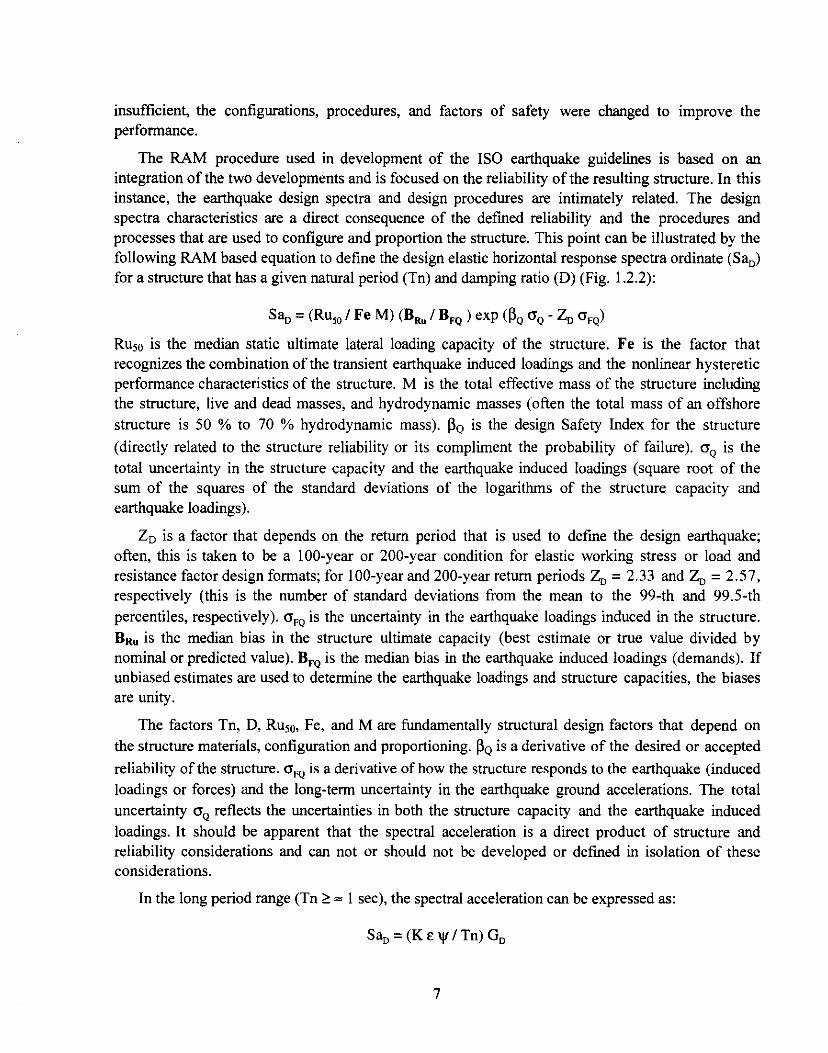
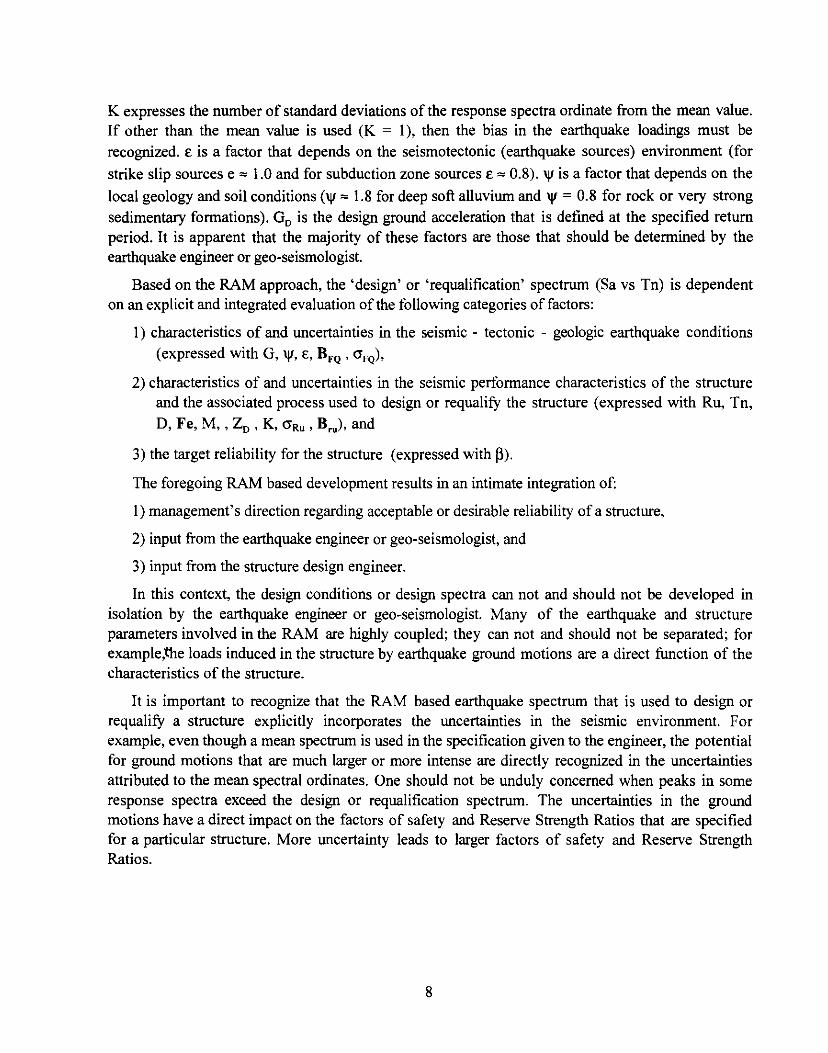
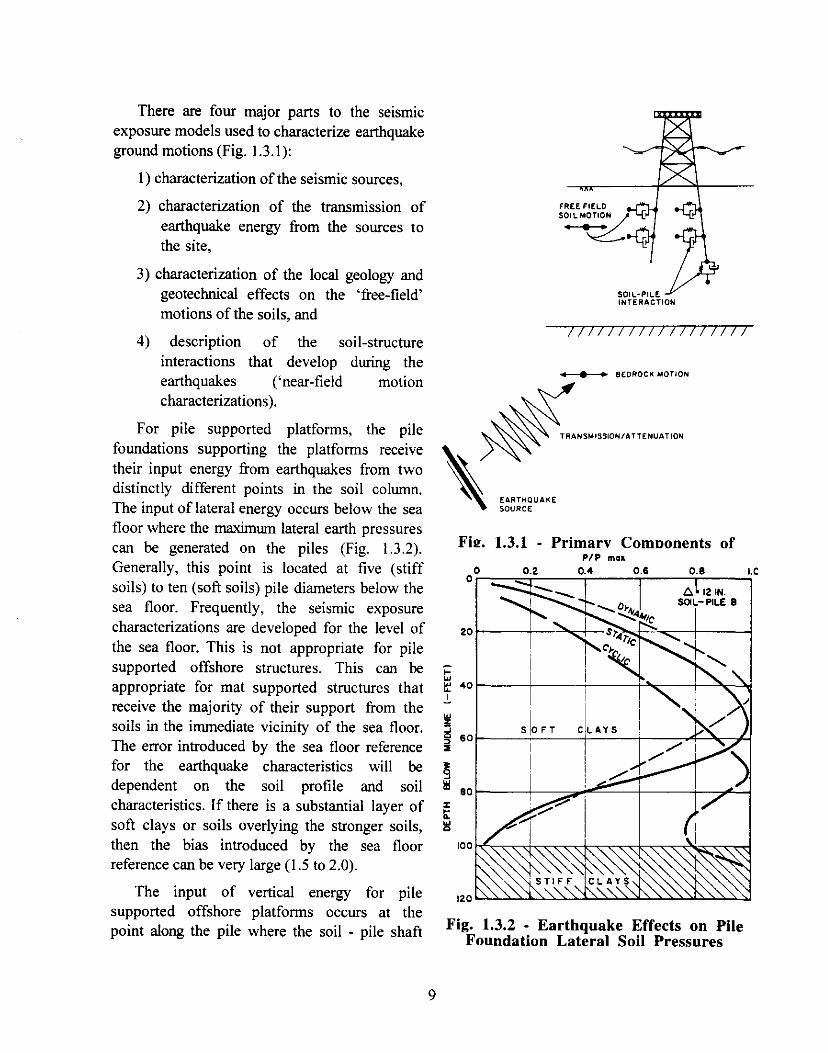
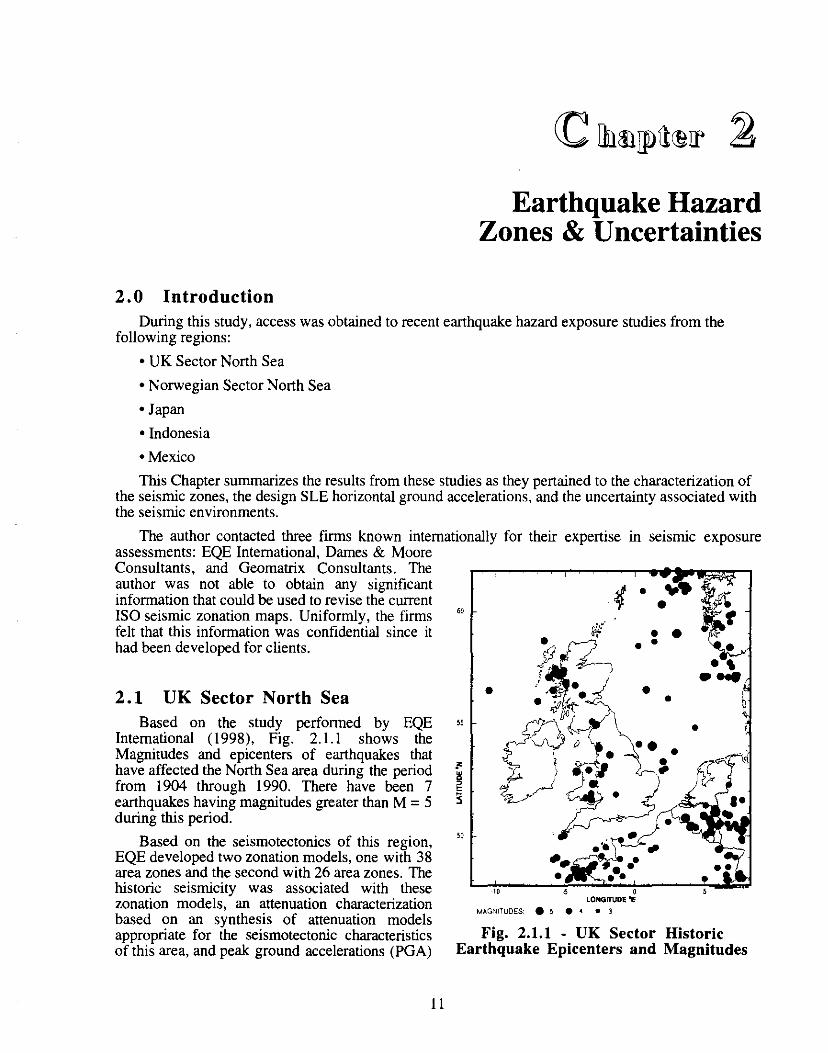
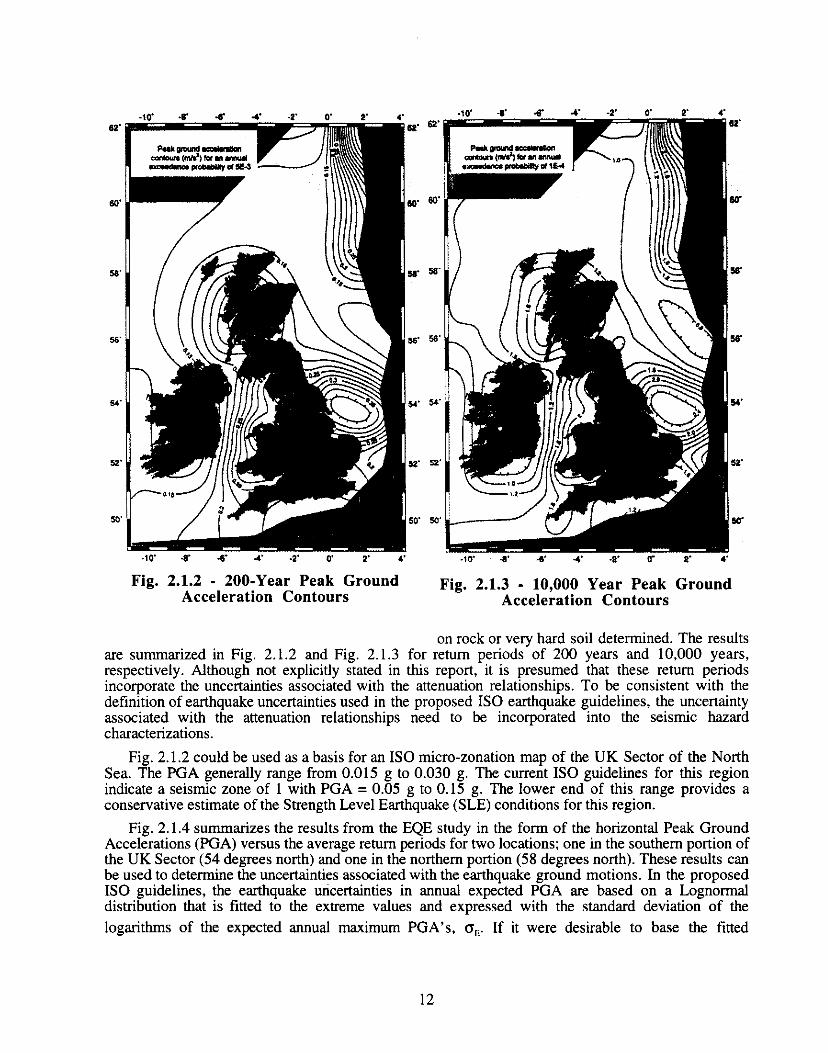
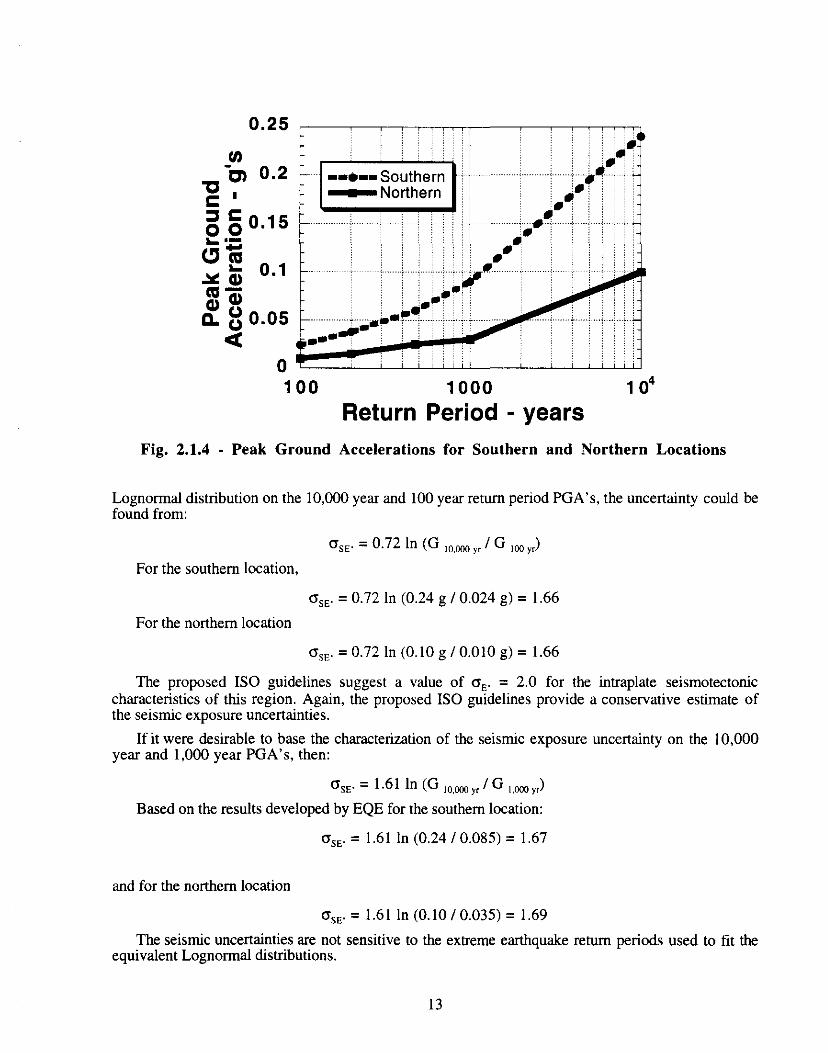
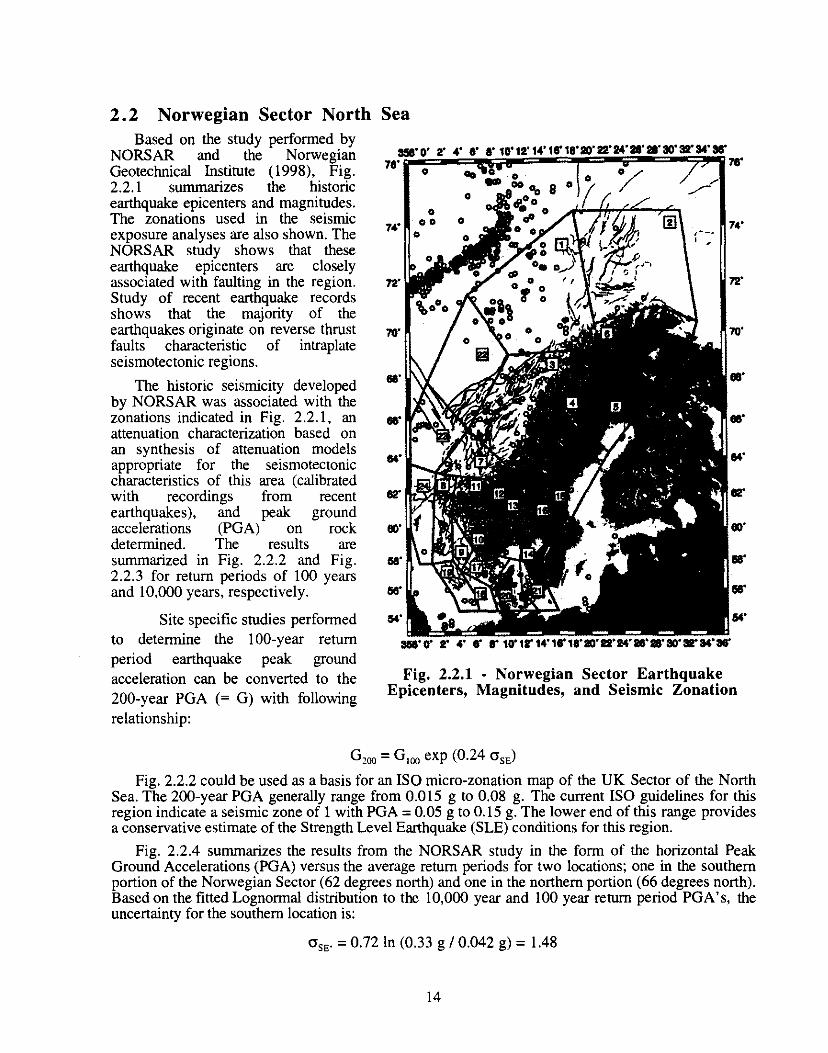
72bull
70middot
eamiddot
eamiddot
[] 74bull --middot
72bull
64
82
64 eomiddot eomiddot
eamiddot 118
eamiddot 118
54bull amp4
22 Norwegian Sector North Sea Based on the study performed by
NORSAR and the Norwegian Geotechnical Institute (1998) Fig 221 summarizes the historic earthquake epicenters and magnitudes The zonations used in the seismic exposure analyses are also shown The NORSAR study shows that these earthquake epicenters are closely associated with faulting in the region Study of recent earthquake records shows that the majority of the earthquakes originate on reverse thrust faults characteristic of intraplate seismotectonic regions
The historic seismicity developed by NORSAR was associated with the zonations indicated in Fig 221 an attenuation characterization based on an synthesis of attenuation models appropriate for the seismotectonic characteristics of this area (calibrated with recordings from recent earthquakes) and peak ground accelerations (PGA) on rock determined The results are summarized in Fig 222 and Fig 223 for return periods of 100 years and 10000 years respectively
Site specific studies performed to determine the 100-year return period earthquake peak ground
Fig 221 - Norwegian Sector Earthquake acceleration can be converted to the Epicenters Magnitudes and Seismic Zonation200-year PGA (= G) with following
relationship
= G100 exp (024 crE)0 200
Fig 222 could be used as a basis for an ISO micro-zonation map of the UK Sector of the North Sea The 200-year PGA generally range from 0015 g to 008 g The current ISO guidelines for this region indicate a seismic zone of 1 with PGA = 005 g to 015 g The lower end of this range provides a conservative estimate of the Strength Level Earthquake (SLE) conditions for this region
Fig 224 summarizes the results from the NORSAR study in the form of the horizontal Peak Ground Accelerations (PGA) versus the average return periods for two locations one in the southern portion of the Norwegian Sector (62 degrees north) and one in the northern portion (66 degrees north) Based on the fitted Lognormal distribution to the 10000 year and 100 year return period PGAs the uncertainty for the southern location is
OsEmiddot =072 In (033 g I 0042 g) =148
14
For the northern location
cr5E = 0 72 In (027 g I 0027 g) = 166
80
Fig 222 middot 100-Year Peak Ground Acceleration Contours
Fig 223 middot 10000 Year Peak Ground Acceleration Contours
The proposed ISO guidelines suggest characteristics of this region This value provides a conservative estimate for this region
Basing the characterization of the seismic exposure uncertainty on the 10000 year and 1000 year PGAs then for the southern location
OsEmiddot = 161 ln (033 013) = 149
and for the northern location
OsEmiddot = 161 In (027 I 010) = 160
These values again are in excellent agreement with those based on the 100-year and 10000-year PGA
a value of crE = 20 for the intraplate seismotectonic
0 100 1000
Return Period - years
Fig 224 middot Peak Ground Accelerations for Southern and Northern Locations
15
104
23 Japan Fig 231 summarizes the
earthquake epicenters and magnitudes in the region surrounding Japan during the period 1885 through 1995 (Utsu 1982) The data set includes more than 500 seismic events having magnitudes greater than M -= 60 Attenuation relations for peak bedrock accelerations were based on results from a recent study of recorded earthquake motions in Japan (Nozu et al 1997) The standard deviation of the attenuation
relationship was found to be crnPGA = 062 This value characterizes the uncertainty associated with the attenuation relationship
Fig 232 summarizes the results of the seismic exposure study for the Yokohama Port (Nozu Iai 1997) The 20 largest peak bedrock accelerations are shown as a function of the return period The data are fitted with a Weibull distribution and with a Earthquake Hazard Study Lognormal distribution that is fitted to the tail of the Weibull distribution Similar fits were developed for a large number of coastal middot offshore sites and similar results developed
Based on these results a seismic hazard map for the peak bedrock acceleration having a 200 year return period was developed (Fig 233) The PGA range from 005 g to 050 g The proposed ISO seismic zonation for this area ranges from 2 to 5 and thus indicate PGA =015 to 025 g to PGA = 045 g to 055 g The proposed ISO guidelines provide a conservative estimate of the 200-year PGA An ISO Japan annex could be developed that would utilize the information shown in Fig 2 3 3 as the micro zonation map for coastal - offshore Japan
This study also developed a mapping of the standard deviation of the Lognorrnal peak bedrock acceleration distribution that considered both the variability in the Lognormal distribution for the expected PGA and the uncertainty in the attenuation relationship (Fig 234) The results indicated standard
1885-1995 A Mlt60 bull deg 0 f 0 60ltMlt65 middot~ 0
bull00 0 0 0 0
0 65ltMlt70 fgt bull degii ~ OO I
0 70ltMlt75 deg o AkitaPort o0 bull
o 75ltMlt80 8 deg e 80ltM
bull
bullbullbull Kobe Port
bull
bull
bull
bullbull ltP
Fig 231 bull Seismic Event Data Used in Japan
middotmiddotmiddot-middot-middotmiddotmiddotmiddot+middotmiddot
1o 10 10
Return Period [at)
Fig 232 bull Peak Bedrock Acceleration and Return Period at Yokohama Port
16
Fig 233 - 200 Year Bedrock PGA Fig 234 - Standard Deviation of Lognormal Expected Annual Maximum
PGA
deviations of the Lognormal peak bedrock accelerations distributions that ranged from cr5E = 08 to cr5E
= 10
The value suggested in the proposed ISO guidelines for the seismotectonic conditions in this region
is cr5E = 10 Thus the proposed ISO guidelines provide a conservative estimate of the uncertainties associated with the seismic exposure of this region
17
24 Indonesia The extreme condition
earthquakes offshore Indonesia are dominated by two principal seismic sources (Beca Carter Hollings amp Ferner Ltd 1979 Dames amp Moore 1992 Untung et al 1985) The major tectonic feature in the region is the Sunda Arc which Figure 241 - Locations Offshore Indonesia extends approximately 5600 km between the Andaman Islands in the northwest and the Banda Arc in the east This feature results from convergence and subduction of the Indo-Australian plate beneath the Southeast Asia plate
The Sunda Arc consists of three primary tooOE 110oe
segments the Sumatra segment (A-1 - A-5 Figure 241 ) the Sunda Strait segment (between A-1 - A-5 and G-1 - G-7 Figure 10
middot 100N
241) and the Java segment (G-1 - G-7 Figure 241) (Dames amp Moore 1992) The locations A-1 to G-1 lie along the northern edge of the Sunda Arc The locations A-5 to G-7 lie along the axis of the Sunda Arc 0
These locations represent the area of greatest seismic exposure
There have been several great (Magnitude in excess of 775) earthquakes recorded along the Sunda Arc during this century (Figure 242) More than 150 surface Magnitude 70 or greater earthquakes 1100E
have occurred along this Arc during this MAGNITUDES lt40 0
century (Beca Carter Hollings amp Ferner Ltd 1979) The majority of these earthquakes
so e 60 70
have had focal depths (Figure 243)
in excess of 70 km Figure 242 - Epicenters of Indonesian
Earthquakes 1900 - 1996 The second primary source of
earthquakes are shallow crustal faults that generally parallel the Sunda Arc (east - west) with some transform surface faulting that marks the north - south trending boundaries of the land masses (Figure 243) The majority of recorded shallow source (less than 70 km) earthquakes that have occurred during this century have occurred along the Sunda Arc zone Several hundred shallow focus earthquakes in the Magnitude range of 40 to 70 have occurred in this zone during this century In
bull
bullmiddotmiddotmiddot bull
18
the v1cm1ty of the area indicated as Raja (Dames and Moore 1990 Lamport 1992 Risk Engineering Inc 1992) in Fig 241 there have been in excess of 12 events with magnitudes between 50 and 70 during the past century (Figure 244)
Figure 245 summarizes a proposed seismic zonation for offshore Indonesia (Bea l 997b) The zone designations are associated with the 200-year peak ground accelerations at the sites as follows
Zone I G = 005g to 015 g
Zone 2 G =015g to 025g
Zone 3 G = 025g to 035 g
These seismic zonations are consistent with those contained in the proposed ISO seismic guidelines
North -SOO -400 -300 -200 -100 0 100 200 300 400
South
0
100
200
300
400
~ 3 500
~ 600
700
800
(gt 0
CXJ) coo 0 ltli)
0
0
o~ bull
0
0 0 ~ltJOO
(J 0
MAGNITUDES lt40 0
50 0
60 8 70
900--~~~~~~~~~~~~~~~~~~
Figure 243 - Hypocentral Profile of Java Central Segment Normal to Sunda Arc - Earthquakes 1900 shy
1996
In some areas site specific studies have been performed to determine the 100-year return period earthquake peak ground acceleration To convert the 100-year G to the 200-year G the following relationship can be used
G200 = G100 exp (024 crE)
where OsE is the uncertainty in the long-term distribution of G (assumed to be Lognormally distributed)
Based on the results from the recent studies of extreme earthquake conditions that have been performed in this area Figure 246 summarizes the expected annual maximum peak ground accelerations (Gm) for the locations shown in Figure 241 The expected peak ground accelerations having return periods of 100 years at the locations ranges from 010 g to 012g (Gl Al) to 017 g to 022 g (G7 -A5)
bull J011lt40 O 4011lt4IS0 _ _ D SISllltS4
0 1bullMlt72
D 72111lt10
oeow
Figure 244 - Earthquake Sources and Magnitudes in Kalimantan Region
19
I
Figure 245 - Seismic Zonation for Offshore Indonesia
The uncertainties (natural variabilities) in the expected annual earthquake peak ground accelerations (Gm) range from crsE = 060 to 070 (A-1 A-5 G-1 G-5) to crsE = 18 to 20 (Raja) These values are consistent with the proposed ISO guidelines for this region and seismotectonic conditions
The available regional and site specific information on earthquake conditions indicates that there are two general categories of Type I uncertainties associated with the primary seismic sources The first category is associated with those locations that are adjacent to the Sunda Arc These locations very frequently experience earthquakes from both shallow and deep sources (Fig 243) Those locations have Type I uncertainties in the expected annual earthquake peak ground accelerations that range from crsE = 060 to 070
The second category of locations is 111
associated with those locations that are middotm 06~~ distant from the Sunda Arc These c locations much more infrequently ~
Iexperience earthquakes primarily from 111 01~~=1 shallow sources These locations have fi
-A-1Type I uncertainties in the expected ~ - bullA-5 --bullG-1annual earthquake peak ground ~ -G-7
accelerations that range from crsE = s bullbullbullbullbullRaiae
180 to 200 (Raja) ~ 001 100 1000 10 4
fl Average Return Period - years
Figure 246 - Expected Annual Maximum Earthquake Peak Ground Accelerations at Study
Locations
20
25 Bay of Campeche Mexico The information on earthquake seismic
100hazard characteristics for the Bay of bullbullbull Campeche Mexico was provided by Chavez (1987 1997a 1997b 1998) Additional information on the earthquake characterization was provided by Guerra and Esteva ( 1978) and Guzman ( 1982)
The seismic environment is influenced by three primary types of earthquake sources (Figure 251) The Type 1 source is associated with the subduction zone on the western Pacific coast of Mexico The earthquakes in this zone occur at depths of 15 km to 20 Km and have magnitudes up to M = 8 2 The Type 2 source is associated
EXPLANATIONwith the lithospheric slab within the central Tectonostratigraphic province boundaryportion of Mexico Earthquakes occur in
0 300km ~this zone at depths of 60 km to 250 km and Thrust taubull teeth on upper plate
have magnitudes up to M = 75 The Type Plate moliona rates in cnvyr -3 source occur in the Trans-Mexican volcanic belt located primarily along the east coast of Mexico have depths up to 20
CMbull C-Muatt CaP c-n Piiie CoP bull Cocoo Plate CTbullkm and magnitudes up to M = 67 (Chavez Caymmn Traugh MATbull Middle Atllrtic Trench MFZ bull Mot1QU8 Faull Zone 1987 1998) MSG bull Mlcl1oaean SMmic Gap NOAM bull -h American Piiie OFZ bull Orozco
Fracture Zone Ind ndgn SCbull ~a-ptOYince SMQCP bull Sietra Madre OrierltllmiddotChipu P116n ptOYince TRbull Tehuamepec Ridge TSG bull
The historic catalog of earthquake Tlhuon--Gap
occurrences during the period 1970 - 1996 Figure 251 - Bay of Campeche Earthquake
NOAM
SC I
I I
I
I Campeche Bay
I I
lt~
MAT
CoP
were used by Chavez to determine the activity rates in each of the three sources and the occurrences of varying
2400earthquake intensities and magnitudes in each of the 2300
three sources Figure 252 0 2200shows the seismic events that 0 8
have occurred in this region 0 2100 0during the period 1800 to bull
20001996 for all earthquakes that 0
1900have surface magnitudes (Ms) greater than M = 50 The 1800
majority of records contained 1700in this catalog date from the
1930s when reasonably 1600
comprehensive teleseismic 1SOO
instrumentation was in place The largest earthquakes 1400
that have occurred in the ~v1c1rnty of the Bay of ~
Campeche are in the range of M = 30 to M = 40 The
Plate Tectonics and Sources
+ + + + + + + + + + + +
+ + + + + + + + ++ + +
+ + + + + + + + + + + +
0 + + +
+
+
+
+
degamp + + + + + + + + + + +
o +
0 +
~ ~ 8 8 8 ~ ~ ~ ~ ~ N ~ ~
~ 0~ bull bull ~ bull ~ bull ~ ~ bull
2400
Z300
2200
2100
2000
1900
1800
1700
1600
IS00
1400
~ bull
Figure 252 bull Seismic Events Affecting the Bay oflargest earthquake that has Campeche Region 1800-1996 Events M gt 50
21
occurred during the past 100 years within a 100 km radius of the Bay of Carnpeche is M = 60 The vast majority of the seismic activity is concentrated along the Pacific coast of Mexico The source of nearby large earthquakes are associated with the Motagua Fault Zone and the fault system (Sierra Madre Oriental-Chipas Peten province) that generally parallels the east coast of Mexico There are no major seismic sources that have been identified within the Sigsbee-Carnpeche province that underlies the Bay of Carnpeche
Based on previous analyses of pile supported platforms subjected to earthquake excitations in soil columns of the Bay of Carnpeche a depth below the sea floor of -12 m was chosen to reference the lateral accelerations and a depth of -115 m was chosen to reference the vertical accelerations from the seismic exposure analyses (Bea 1997c)
Figure 253 summarizes the results for the Bay of Carnpeche for each of the three seismic sources A mean or average value for the four representative soil columns studied by Chavez (1997a) are shown The Type 2 and Type 3 sources develops ground motions that dominate the seismic exposure in the Bay of Carnpeche At an average return period of 10000 years the indicated peak horizontal ground acceleration (Am) is indicated to be Am~ 025 g Table 25 l summarizes the ground motions at return periods of 200 and 4000 years and the uncertainties (natural or Type I aleatory) associated with the ground motions (expressed as the standard deviation of the logarithms of expected annual G
QISE)
-CE CCI iObull -shyCJ _UI 01
iii Cl -ccI
2omiddot = o ca z G lo ii ca u GI U 0 ct
001
-shy--
- - - - - shy - - - -
bullbullbull-Zona 1 -zona2 --bullZona 3
-shy---shybullmiddotmiddotmiddotmiddot -shy__- --middot~middotmiddotmiddotmiddot
-
~ -shy middotmiddotmiddotmiddotmiddotmiddot
middotbullmiddotmiddotbullmiddotbullmiddotmiddotmiddotmiddotmiddotmiddot middotmiddotmiddotmiddotmiddotmiddotmiddotmiddotmiddotmiddotmiddotbullmiddot - - middotbullbullbullbullbull ~
41000 10
Return Period - Years
Figure 253 middot Peak horizontal ground accelerations
Table 251 middot Mean Horizontal PGA at Bay of Campeche sites (middot12m) and uncertainties of peak horizontal ground accelerations
Type 200 years shyg
1000 years -g
Uncertainty
QSE
I 12 16 058 2 50 78 084 3 27 68 175
22
These results can be compared with those developed by Guerra and Esteva ( 1978) for the Bay of Campeche and firm alluvium sites At a return period of 100 years the peak horizontal ground acceleration obtained by Guerra and Esteva is G = 66 g This compares with a maximum value of G =50 g obtained by Chavez (1998) for a 100 year return period for the Zone 2 sources The results developed by Guerra and Esteva indicate an uncertainty in the annual expected peak horizontal
ground acceleration of OsE = 126
The extensive Bay of Campeche seismic exposure study performed by Guzman ( 1982) provides some additional information on the expected ground motions At a return period of 100 years the peak horizontal ground acceleration obtained by Guzman is G = I 0 g This ground motion is more intense than developed by either Chavez or Guerra and Esteva The more intense ground motion appears to be coupled with the attenuation relationships that were developed and used by Guzman ( 1982) The results developed by Guzman indicate an uncertainty in the annual expected peak
horizontal ground acceleration of OsE = 097 This uncertainty is slightly greater than that of the Chavez results and somewhat less than indicated by the Guerra and Esteva results
The proposed ISO guidelines for this region indicate a 200-year PGA in the range of 005g to 015g The lower end of this range provides a good estimate of the seismic characteristics in the Bay of Campeche The uncertainties in the annual maximum PGA are consistent with those given in the proposed ISO guidelines
The Type 1 and Type 2 sources have uncertainties in the expected annual maximum Am that are comparable with that of offshore California The Type 3 (coastal - local) sources have an uncertainty that is comparable with intra-plate seismic zones Based on the results provided by Chavez (1997a) Table 252 summarizes the mean vertical peak ground accelerations at a depth below the sea floor of shy115 m together with the associated uncertainties
Table 252 middot Mean Vertical PGA at Bay of Campeche sites (-115m) and uncertainties of peak horizontal ground accelerations
Type 200 years shyg
1000 years - g
Uncertainty
() SE
1 02 03 075 2 09 12 055 3 02 03 075
23
this page left blank intentionally
24
Strength Level Earthquake Response Spectra
30 Introduction Strength Level Earthquake (SLE) elastic response spectra were assessed in the several of the
studies of regional seismicity discussed in Chapter 2 The SLE response spectra developed for each of these regions will be summarized in this Chapter In addition results from recent general studies of response spectra will be summarized including consideration of water column effects on vertical motions
3 1 Response Spectra Ordinates Recent studies of response spectra ordinates in the low period range (01 sec to 03 sec) have
indicated that one should expect that these ordinates will vary as a function of both the local soil conditions (soil column classification)and intensity of earthquake motions (Martin Dobry 1994 Crouse McGuire 1997) Figure 31l summarizes the results from the study by Crouse and McGuire of the median amplification factors (Fa = peak horizontal ground acceleration at surface I peak horizontal ground acceleration on rock= PGAs I PGAr) for periods (T) in the range of T = 01 sec to 03 sec
The site soil conditions indicated as SC-A B C and D correspond to those in the proposed ISO guidelines The amplification factor in this period range presently incorporated into the proposed ISO guidelines is Fa= 25 for all soil conditions These results indicate substantially larger amplifications in the short period range While these findings would relatively unimportant for the lateral motions of most offshore platforms (T = 2 to 3 sec) the effects would be potentially important for the vertical motions (T = 01 to 03 sec) of these structures (particularly for heavily loaded deck structures with large cantilevers) The National Center for Earthquake Engineering Research (NCEER) workshop defined a comparable range of amplification factors for this period range (Martin Dobry 1994)
As a result of these findings the following modifications to the proposed ISO earthquake guidelines are proposed The elastic design
tf 55 0 5 uu ~
SC-Aftl Ill ~ - S111 seaLI 111 45 CM -bullmiddotsec0 SC-0middot-Cl 4 iii 0 ~tbull~bullFbull~bullbull~~middotmiddotmiddotmiddotmiddotr-Eu
35
Qci -~-11--~---F=--- --imiddot-- middotmiddotmiddotmiddotmiddotmiddotmiddotmiddotmiddotmiddot---- -middotmiddot------ ---1-----shyE II 3
lt1shyCJ~ 25 -----middot----middot-----c ~
2 CJ 01 015 02 025 03 035 04
Peak Ground Acceleration - gs
Fig 311 - Amplification factors as function of acceleration level and soil conditions
25
response spectra (Figure 312) would 10 - - - --~ be a function of the following variables
Sa I G = vbull T = period of system
bull D = damping of system
bull v = site classification factor for short period range (new factor)
~ Sa I G =~Tla___~
bull I = site classification factor for 0=5long period range L------__________bull E =seismotectonic conditions 01
001 01 1
Period - T (sec) Table 3 11 summarizes the elastic
design response spectra characteristics Fig 312 bull Proposed elastic design responsebased on the results of the work by spectra Crouse and McGuire (1996) and the previous work incorporated into the proposed ISO design response spectra
Table 311 - Local geology and soil conditions parameters for SLE response spectra
Soil 1-ondibons Se1smotectonic Lond1tions
Site 1-lass v I E
SC-A 25 10 Type A 10
SC-B 33 12 TypeB 08
SC-C 35 14 TypeC 09
SC-D 45 20 TypeD 08
SC-E Site specific studies required Detault value 10
3 2 Vertical Response Spectra Ordinates Several recent large magnitude earthquakes have indicated that vertical ground motions can be
equal to or greater than the horizontal ground motions This observation has been particularly true for ground motions close to the epicenter of large magnitude earthquakes The present ISO guidelines prescribe an elastic design response spectrum for vertical motions that is one-half of the horizontal motions
Figure 3 21 summarizes results from a recent study of the ratios of vertical to horizontal spectral ordinates as a function of the response frequency (Bozorgnia Niazi Campbell 1995) Results for the Loma Prieta and Taiwan earthquakes are shown The ratios indicated are mean values The horizontal line indicated at the ratio of 23 references the present Uniform Building Code (UBC) specifications For near-by earthquakes (R = l 0 km) the ratio of the vertical to horizontal spectra ordinate for periods
26
in the range of T = 01 sec are in the range of 14 to I7 The ratio is close to unity at distances of R = 20 km to 30 km Comparable results have been found for other large magnitude earthquakes in other sernismotectonic zones
For periods in the range of T = 2 to 3 sec the ratios are in the range of 02 to 03 for all distances Current studies of recordings from different earthquakes generated by different types of seismotectonic environments indicates that these trends are very likely to be universal (Bozorgnia Niazi Campbell 1995) These results show the problems that are associated with specifying a constant ratio of vertical to horizontal spectra ordinates for all periods and distances The results indicate that the horizontal and vertical spectra have decidedly different shapes
The authors application of these results to the unmodified 1 ISO response spectra is illustrated in Figure 322 The present proposed ISO horizontal and vertical response spectra for Site Classification C (firm alluvium v = 35 I= 14) and Type A seismotectonic
conditions (shallow crustal faulting E = 1 ) For periods greater than about 03 sec the unmodified vertical response spectra have ordinates that are less than the present proposed ISO guideline vertical spectra For periods Jess than 03 sec the unmodified ordinates are substantially larger
The foregoing results have been developed based on earthquake ground motion measurements that have been made on land Measurements of ground motions offshore have indicated that the presence of the water column can have a marked influence on the sea floor motions (Smith 1997 Sleefe 1990) The measurements indicate that the vertical motions at the sea floor are much less than would expected based on on-land measurements For mat supported structures that receive the majority of their input motions from soils that are located near the sea floor this can be an important consideration
For vertically incident earthquake compression waves the ratio of the reflected to the incident wave amplitude at the ground
1 unmodified for water column effects
Loma Prieta EQ Stitt Soll Sites 16
14
0
i ~
12
10
08
~ 08
~ 04
02
00
SMART-1 Array Taiwan Mag 70
(a)
Rbull10 km
Rbull20 km
R-40 km -------213
18
i
16
14
0 12
( i 10I
08
-~ 06 ~
gtbull 04
02
00
(b)
Rbull10 km
Rbull30 km
-------213RafiO km
001 010 100 1000 Period (sec)
Fig 321 - Ratio of Vertical to Horizontal Elastic Response Spectra Ordinates
UJ
01 _____ ______~
1SO Horizontal-II bullVertical -+bullISO Vertical
-----middot
D = 5
001 01
Period - T (sec)
Fig 322 - Horizontal and Vertical Elastic Response Spectra for SC-C E = 10
27
-+-ISO Vertical
bullC
surface is a function of the impedance ratio IR at the ground surface
IR= ps Vspa Va
where pis the mass density of the soil (s) and air (a) and V is the compression wave velocity in the two media On land this impedance ratio is very large and one would expect almost total reflection of the energy at the ground surface This would indicate a doubling of the amplitude of the incident compression waves at the ground - air interface
In water the compression wave velocity in the water and in the water saturated sediments would be almost the same The density difference would be a factor of about 2 This would indicate that about 50 of the compression wave would be transmitted through the interface and the remaining 50 would be reflected The total wave amplitude at the interface would be 15 times the incident amplitude or 75 of the amplitude expected at an air - soil interface
This analysis assumes that the water is infinitely deep and ignores the reflection of the incident compression waves at the water - air interface Crouse and Quilter ( 1991) developed an analysis that includes the finite water column effects Depending on the water depth some frequencies can be reinforced and amplified by the finite water depth while others can be canceled The analyses performed by Crouse indicates that the peak vertical accelerations at the sea floor can be reduced by as much as 50 (Crouse Quilter 1991 Dolan Crouse Quilter 1992 Smith 1997 Sleefe 1990) These observations are in agreement with the analyses of recorded earthquakes at the sea floor reported by Smith ( 1997) and Sleefe ( 1990)
The earthquake ground motions in the vicinity of the sea floor are the result of a very complex variety of wave forms frequencies and incidence angles Thus the foregoing simplified analyses can be relied upon only to provide some insights into the potential effects of the water column on the vertical movements at the sea floor Measurements of earthquake movements at the sea floor provide the only reliable source of information to quantify these effects The measurements that are available confirm the inferences that have been drawn based on simplified analyses
Figure 323 summarizes the results for the water column modified vertical response spectra compared -bullbullModified (x05) Vertical
D =5 Modified (x 075) Vertical with the present ISO vertical response
spectra The present ISO vertical response spectra provides a conservative envelope to the modified vertical spectra for periods greater ~ 1 ~
~than about 02 sec However the ftl bull-----117 present ISO vertical response spectrum is somewhat unconservative ifor periods less than about 02 sec
SC-C v = 35 1J1 = 14 E = I ~ bullUntil better information becomes available it is the authors conclusion 01
that the present proposed ISO 001 01 1 guidelines for vertical response Period - T (sec) spectra provide a reasonable arid likely somewhat conservative Fig 323 - Water Column Modified Vertical approximation to the vertical Response Spectra movements that can be expected in the vicinity of the sea floor
28
33 Computed Response Spectra Most current seismic exposure analyses and evaluations characterize the earthquake ground
motions on a rock or very firm alluvium surface Then often one-dimensional shear beam type analyses are performed to characterize the earthquake ground motions within the soil column that overlies the rock or very firm alluvium surface A variety of soil constitutive models can be used in these analyses but most often equivalent linear models are used with modifications introduced to model the soil non-linear stress-strain behavior and the changes in this behavior with cyclic strains Damping is generally introduced as an equivalent viscous damping (Dobry 1991 ) The bottom boundary of the soil column at the rock interface is generally characterized with an absorbing boundary element to prevent unrealistic trapping of the earthquake energy in the soil column due to reflections of the energy at the rock interface
Relative to the ISO earthquake guidelines this practice raises issues regarding the uncertainties and biases that can be introduced by different analyses of soil column effects The ISO guidelines do not include any definitive information on how such analyses should be performed There is a very wide range in how such analyses are performed and how the soil column analyses are performed can have extremely important effects on the earthquake ground motions that are utilized in analyses of the soil shystructure interactions
Fig 33 l summarizes earthquake acceleration response spectra from four locations in Mexico City based on recordings obtained during the 1985 earthquake (Seed 1987) The soft clay soil column has discernible effects on the shapes of the response spectra and the magnitudes of the spectra ordinates The computed natural periods of the soil columns (Ts) at each of the locations is noted based on the relationship
Ts =4dVs
where dis the depth of the soil column and Vs is the soil shear wave velocity (appropriate for the soil strains induced by the earthquake) For a given soil column thickness the natural period of the soil column is controlled solely by the shear wave velocity The shear wave velocity is a function of the shear modulus which is a function of the cyclic shear strains induced in the soils by the earthquake Higher strains result in lower shear modulii and shear wave velocities
The response spectra exhibit definite peaks at the natural periods of the soil columns The noticeable increase in the response spectra energy associated with the 37 m depth site is likely due to reflected energy associated with the edge of the Mexico 75
rbullbull 4H37gt bull 2 sec City basin This basin 10------- 10---10---0--- edge influence would oat- UNAM CAOT J SCT CAF
08 08 08 not be incorporated in ss 06 5 orrpng bullbull gmost shear beam soil bullmiddot g 04t-
column analyses because the soil column 0o 1 2 3 5responses would be
T sec T sec T sec T secbased on the rock outcrop motions (in this case at the UNAM site)
0[~mJraquo middot~middot~middotmiddot 75~)~mbullEJ 3f==Soft Fig 332 l c~~aVbullSOOto900nVa middotsummarizes results
from SHAKE analyses
0606
04
06
04 JT
dego t 2 3 1 2 3 4 5
of motions at the soil surface identified as Fig 331 - Soil Conditions and Recorded Acceleration Spectra Oakland Outer Harbor During 1985 Mexico City Earthquake
29
(Bray et al 1996) during the 1989 Loma Prieta earthquake (epicenter about 70 km away) The soil profile consists of 156 m of alluvium (clays sands) overlying bedrock The shear wave velocity in this soil column ranged from 800 msec (alluvium at base of column) to 63 mis (Bay Mud) The soil column had an average shear wave velocity in the range of approximately 400 msec The response spectra indicates discernible peaks at 15 sec and about 06 sec Based on the results from testing of soil samples a soil damping ratio of l 0 to 20 was used
Response spectra from available strong motions recorded at nearby rock sites are shown in Fig 332 The response peak at 06 sec is obviously due to the energy in the input rock motions at this period The response peak at 15 sec is obviously due to the natural period of the soil column The spectral acceleration of the rock is amplified by a factor of about 4 at the 06 sec and 16 sec peaks of the soil column Given a peak spectral acceleration of 025 g in the input rock motion at the natural period of the soil column the peak spectral acceleration is
Rock mollon YBI (90 dovl ied lo OOlg
Rocordod mollon (305 dovgt Computed mollon
o
1 2 3 4 PERIOD seconds
middot Recorded and SHAKE
1
Cl
Fig 332 Computed Response Spectra (Oakland
Outer Harbor Loma Prieta Earthquake)
about 05 g representing a doubling of the peak in the spectral input motion Note that the computed motion of the soil column generally is somewhat less than the recorded motion
Fig 333 and Fig 334 summarize similar results for two other nearby locations The Oakland location consisted of 152 m of alluvium having shear wave velocities in the range of 800 msec to 120 msec The Emryville location consisted of 137 m of alluvium having a similar range in shear wave velocities In these cases the amplifications of the rock motions at a period of 06 sec were about 3 and at a period of about 15 sec were about 4 The peak input spectral acceleration of 020 g to 025 g was magnified at the natural period of the soil column by a factor of about 2 Again the SHAKE analyses tend to under predict the ground motions at the natural period of the soil column but predict the amplifications reasonably well at the earthquake input peak energy period of about 06 sec
These results indicate that the SHAKE analytical model and the associated characterizations of the soil stiffness and damping has a bias in the range of B = 15 to 20 for the natural period of the soil columns Other similar results need to be developed before definitive statements can be made
Rock mollon YBI (90 dogl ied lo OOlg Rocordod mollon (290 dovgt06 11ecorded motion (200 deg)
Cl Compulod mollon
Demplng 5
0 1 2 3 PERIOD seconds
Fig 333 bull Recorded and SHAKE Computed Response Spectra (Oakland Loma Prieta
Earthquake)
30
4
concerning the biases associated with the soil column analyses
The amplification of the earthquake input acceleration on rock at the surface of the soil column can be evaluated approximately from (Dobry 1991)
A= [as I ar lmax =II I + (1t 12) D5 I
where A is the ratio of the maximum acceleration at the soil surface as to the input acceleration at the rock interface ar I is the impedance ratio of the rock - soil interface D5 is the soil damping ratio The soil - rock impedance ratio is
I= (pr I ps) (Yr I Vs)
where pr is the density of the rock ps is the density of the soil Yr is the shear wave velocity of the rock and Vs is the shear wave velocity of the soil The velocity ratio would generally be in the range of 5 to 30 and the density ratio in the range of II to 15 Thus the impedance would generally be in the range of 5 to 50 The soil damping ratio could be expected to be in the range of 005 (low
I
Rocle mollon YBI llO dog) Recordod mollon (350ltMg)0
Cl
0
Ar Compulodmodan bull I
DomplngS
middotmiddot~_ -~
1 2 3 PERIOD seconds
Fig 334 - Recorded and SHAKE Computed Response Spectra (Emryville Loma Prieta
Earthquake)
strains) to more than 03 (high strains) Fig 335 summarizes the results of this development Except for very low impedance impedance is not an extremely important element However damping is very important The use of low strain damping ratios in the range of 5 to I 0 result in amplifications that are a factor of 4 to 5 times those for damping ratios in the range of 25 to 30
The Loma Prieta site results summarized earlier had a velocity ratio in the range of 7 to 9 a density ratio in the range of I I to 12 This would indicate an impedance in the range of 8 to 11 Given an amplification of the input rock acceleration of about 2 at these sites a damping ratio in the range of 20 to 30 is indicated This damping is much higher than indicated from the laboratory triaxial and resonant column tests 12Often this has been found to be true and it has been postulated that the under-estimated c( 1 0 damping is due to the laboratory testing boundary conditions c 80
Studies are currently being conducted to ~ 6better characterize the bias and uncertainties
associated with analyses of soil column e 4response characteristics during intense Q
earthquakes These studies are attempting to E 2c(account for the different methods that can be used to characterize the soil properties and the 0input earthquake excitations Results from these studies will be monitored by the author
-D=Soo Impedance- bull0=10dego - bull bull0=15dego t--r~-~-~-~--- bullbullbullbullbullD=20dego
~middot0=30oomiddotmiddotmiddotmiddotmiddot0=251middot=~~-
10 20 30 40
and their implications integrated into future revisions of the proposed ISO guidelines Fig 335 - Soil Surface Amplification of
Bed Rock Acceleration
31
4
50
34 North Sea Response Spectra Elastic response spectra for North Sea
seismotectonic and hard ground - rock conditions were developed as part of the EQE International study (1998) and the NORSAR study (1998) Fig 341 summarizes the normalized response spectra results for a 5 damping ratio from the EQE study for return periods of 100 years 1000 years and 10000 years The response spectra do not vary significantly as a function of the intensity of the earthquakes in this range This is to be expected since the hard ground shyrock materials respond essentially in their low-strain reasonably elastic range The peak amplification of the spectra is approximately 25
In the EQE study it was noted that the spectra could be modified for other values of damping by the factor K (Woo et al 1988)
K = 148 - 030 In D
This response spectrum modification factor was compared with that contained in the proposed ISO guidelines It was found that the modification factors are essentially identical for damping ratios less than about 20 and above 20 only differ by about 10
I 1000
100
~ ~ 6 -g 10
~
01
01 10 100 100
Undamped Natural Frequency (Hz)
Fig 341 - Earthquake Response Spectra for UK Sector Conditions
Fig 342 summarizes the response spectra from the NORSAR study (1998) for a return period of 10000 years at low seismic activity (Alta) and high seismic activity (Midgard) sites for rock or hard ground conditions The shapes of the spectra are essentially identical
1 1 FREOUENCY (HZ)
a 1u
Fig 342 - Earthquake Response Spectra for Norwegian Sector Conditions For Earthquake Return Period of 10000 years and Rock - Hard Ground
32
Fig 343 and Fig 344 summarize results from the study of soil column effects on the rock spectra performed by the Norwegian Geotechnical Institute (1988) as part of the NORSAR study ( 1988) Soil column characteristics were based on results from soil exploration - soil boring - laboratory jtesting performed at North Sea platform locations and onshore Norway locations The earthquake response analyses were performed using the SHAKE computer program discussed earlier The soil columns were organized into two different categories Soil Type B - shallow firm alluvium and Soil Type C - deep firm alluvium Recorded earthquake time histories characteristic of those expected for the Norwegian
01 10 100seismotectonic conditions were used as input to the soil column analyses Frequency (Hz)
The amplification factors for the Soil Type Fig 343 Computed Earthquake Response B profiles has a definite peak in the period Spectra Amplification Factors for Deep range of 005 sec to 01 sec The peak Alluvium Soil Conditions (Soil Type C) amplifications range from about 25 to as high The Coefficient of Variation (COY) of the peak amplification factors is approximately 20 ( ~
crG5) The COY suggested in the proposed ISO guidelines is 30 The range of results shown in Fig 343 represents the range of results between different sites not the range of results that reflect variations in the soil characteristics for a given site
The amplification factors for the Soil Type C profiles has a definite peak in the period range of 0 5 sec to 1 sec The peak amplifications range from about 25 to almost 6 The Coefficient of Variation (COY) of the peak amplification factors is approximately 30 The COY suggested in the proposed ISO guidelines is 40
Fig 345 summarizes the mean soil response spectra amplification factors for the two different soil column conditions The mean peak soil amplification factor for Soil Type B is 3 and the same factor for Soil Type C is 3 5 These results are in excellent agreement with those summarized in Table 311 These results confirm the need to have a factor that modifies the magnitude of the peak in the response spectra as a function of the soil conditions
The NORSAR study also addressed the 01 10 100
vertical motion spectra and concluded that the Fraqubullcy (Hz) ratio of the spectral ordinates (VH) was frequency (f) dependent In the vicinity of the Fig 344 - Computed Earthquake peak of the horizontal response spectrum (f = 1 Response Spectra Amplification Factors to 3 Hz) the recommendation was that the ratio for Shallow Alluvium Soil Conditions should be determined as follows (Soil Type B)
1400
300 +----+--+-+-r-tishy
200 +---+---+-middot
7
6
2
0
I
33
VH = 09 - 042 log (f)
For f =1 Hz VH =09 These results are in reasonably good agreement with those summarized in Fig 322 Based on the information provided in the NORSAR study it is understood that these results are for the surface of the soil column and do not incorporate the effects of the overlying water column Future studies of the vertical response spectra at the sea floor should take account of these effects
400
300~
~ c 0 ~ 2005 E Q
100~
000
010
Fig 345 middot Recommended Earthquake Response Spectra Mean Amplification Factors for Deep Alluvium Soil Conditions (API Soil Type C)
100 1000 10000 Frequency (Hz)
Sc w ) ~
I
I I
~
v Soll Ty1 bull
) 1
34
35 Bay of Campeche Spectra Chavez (I997a l 997b) performed a number of site response studies for the Bay of Campeche
using the computer program SHAKE Results from recently performed high quality soil borings and laboratory static and dynamic testing programs were used to characterize the strength stiffness damping and hysteretic performance characteristics of the soils The soils consist of deep (100 m to 200 m) firm alluvium (layered calcareous sands silts and clays) Chavez introduced the deconvolved input motions from the three types of earthquakes at the base of the soil columns and determined the output motions close to the sea floor (at -12 m appropriate for lateral motions characterizations for piles) and at significant penetrations below the sea floor ( -100 m appropriate for vertical motions characterizations
Results for the 200-year horizontal Strength Level Earthquake (SLE) conditions ( -12 m) for a variety of sites in the Bay of Campeche are summarized in Figures 351 352 and 353 for Type I (very distant subduction zone) Type II (distant mixed zone) and Type III (nearby surface faulting zone) earthquakes respectively The Type I earthquake produces a peak in the ground motions at a period of about 3 sec that represents the long-period energy from these distant subduction zone earthquakes that coincides with the natural period of the soil column The Type II earthquake produces a set of response spectra with multiple peaks in the range of 0 3 sec to 3 sec The Type II earthquake produces a much more conventional spectrum with peaks in the range of 02 to 08 sec
The resulting mean response spectra for these three types of earthquake conditions is summarized in Fig 354
bullbull
bullbull
bullI
~~
1
~ (
~w - ~
- Fig 351 - Type I 200-year Earthquake Computed
Response Spectra
bullbull
bullbull
bull i j0 bull -
~~ ~middotg- - ~~middotshy -
I I bull
Fig 352 - Type II 200-year Earthquake Computed Response Spectra
35
bull
bull
together with the mean plus one standard deviation and envelope spectra Chavez included the range in response spectra results that developed from plus and minus one standard deviation changes in the soil shear modulus and damping characteristics The COY of the peak response spectra values is about 100 This high uncertainty reflects the influences of the three different types of seismic sources different soil characteristics at different sites and the effects of plus and minus one standard deviation ranges in the soil properties at the different sites Given a location that is affected by multiple types of earthquake sources it would be preferable to define different response spectra associated with these sources rather than combine them into a single response spectrum
These results clearly indicate that the dominant horizontal and vertical motions important to the pile foundations of the platforms in the Bay of Campeche are associated with the Type II earthquake source At a period of 1 sec (predominant natural period of platforms in Bay of Campeche) the Type II earthquake source produces horizontal motions at a penetration of -12 m that are a factor of about 10 greater than those for the Type I and Type III sources
In general these results are in good agreement with the proposed modifications to the ISO SLE response spectra
bull
middot~
0JO
Imiddot~ 016
1110
f 016
010
~ -~middot)
Ar
~I~ -
I I I
Fig 353 - Type III 200-year Earthquake Computed
Response Spectra
I I
I
I I
I [I
I I
I
I
-~-~ Fig 354 bull 200-year Mean Mean Plus One Standard
Deviation and Envelope Response Spectra
36
Summary Conclusions amp Acknowledgments
40 Summary The objective of this study was to continue development of earthquake load and resistance factor
design (LRFD) guidelines with a study of results from recent seismic hazard characterizations This study addressed two primary topics
a) seismic zonation of the UK and Norwegian Sectors of the North Sea offshore Japan and Indonesia and the Bay of Campeche Mexico and
b) Strength Level Earthquake (SLE) response spectra
This study was organized as follows
bull obtain recent background on seismic hazard characterizations
bull detail seismic exposure uncertainties and local site response uncertainties
bull reconcile differences between current ISO seismic hazard guidelines and those developed during this study
bull document the revised seismic hazard and response spectra characterizations in a project technical report
Results from current seismic exposure studies of the UK and Norwegian Sectors of the North Sea indicate SLE rock PGA in the range of 0015 g to 008 g and seismic uncertainties in the range of crE = 15 to 17
Results from current seismic exposure studies for the Japan coastal and offshore areas indicate SLE rock PGA in the range of 005 g to 05 g and seismic uncertainties in the range of crE = 08 to 10
Results from current seismic exposure studies for the Indonesia coastal and offshore areas indicate
SLE rock PGA in the range of 005 g to 035 g and seismic uncertainties in the range of crE =06 to 20 (lower end of range associated with subduction zone dominated sites)
Results from current seismic exposure studies for the Bay of Campeche Mexico indicates SLE rock PGA in the range of 001 g to 005 g and seismic uncertainties in the range of crE = 06 to 18
Results from current studies of horizontal response spectra associated with SLE intensities indicates that the ISO SLE horizontal response spectra for periods in the range of about 01 sec to 05 sec should be modified (increased) to account for different types of soils Such modifications have been developed as a result of this study Results from region and site specific SLE horizontal response spectra generally are in good agreement with the proposed modified ISO response spectra
Study of information relating to the vertical ground motion spectra for on-land conditions indicate that the ratios of vertical motions to horizontal motions in the low period range (01 sec to 03 sec) for near-by earthquakes can be much greater than currently specified in the proposed ISO guidelines
37
However when the effects of the water column are taken into account combined with the proposed modifications to the horizontal response spectra in the period range of 01 sec to 05 sec the proposed modified ISO guidelines generally provide a conservative estimate of the vertical motion characteristics
4 1 Conclusions The results from this study indicate that the proposed ISO seismic exposure guidelines generally
provide a conservative estimate of the SLE PGA for the regions studied The current regional seismic exposure results provide the basis for updated North Sea Japan and Indonesia regional ISO seismic exposure maps (Fig 212 Fig 222 Fig 232 Fig 246)
The results from this study indicate that the proposed ISO guidelines for seismic exposure uncertainties associated with the different seismotectonic zones generally provide a conservative estimate of the uncertainties The current regional seismic exposure results provide the basis for updated North Sea Japan Indonesia and Mexico seismic exposure uncertainties
The results from this study indicate the need for modifications to the proposed ISO SLE horizontal response spectra in the period range of about 01 sec to about 05 sec Based on results from current response spectra studies proposed modifications that are a function of the type of soil column have been developed In general the proposed modified ISO SLE horizontal response spectra provide a conservative estimate of the expected SLE horizontal response spectra developed from detailed site specific studies The uncertainties associated with the response spectra ordinates as suggested in the proposed ISO guidelines provide reasonable characterizations for the different types of soil columns
The results from this study indicate that it is important to clearly identify the position in the soil column that are associated with the response spectra The positions should be those that characterize the positions that result in maximum input of motions or energy from the earthquake ground motions For pile supported structures these motions would be below the sea floor for lateral motions (eg 5 to 10 pile diameters) and along the lower one-third to bottom of the pile shaft for axial motions For mat supported structures these motions would generally be much closer to the sea floor but are still not generally at the sea floor itself These considerations are particularly important for specification of the vertical response spectra for both pile and mat supported platforms
The presence of the water column has important effects on the vertical motions at or very close to the sea floor These effects need to be accounted for when evaluations are developed for the vertical response spectra for these elevations Analysis of available information on vertical motions and the effects of the water column generally indicates that the proposed modified ISO guidelines provide a conservative characterization of the vertical motion effects
42 Acknowledgments The author would like to acknowledge the technical guidance and information provided by Dr Ove
Gudmestad of Statoil and Mr Mike Craig of Unocal Financial support for the second phase of this study was provided by Statoil and Unocal
The third phase of this study will be sponsored by the U S Minerals Management Service The third phase will address verifications of the proposed ISO guidelines based on site and platform specific results provided by the project sponsors
38
Australian Bureau of Mineral Resources Geology and Geophysics and Lamont-Doherty Geological Observatory of Columbia University Tectonic Map of the Indonesian Region Professional Paper 1078 Geological Survey oflndonesia
Bea R G (1992) Seismic Design and Requalification Methodologies for Offshore Platforms Proceedings of the International Workshop on Seismic Design and Requalification of Offshore Structures California Institute of Technology Pasadena CA Dec
Bea R G (l997a) Background for the Proposed International Standards Organization Reliability Based Seismic Design Guidelines for Offshore Platforms Proceedings of the Earthquake Criteria Workshop Recent Developments in Seismic Hazard and Risk Assessment 16th International Conference on Offshore Mechanics and Arctic Engineering Y okahama Japan (obtain proceedings from Port and Harbors Research Institute Yokuska Japan)
Bea R G (1997b) Risk Based Oceanographic and Earthquake Load amp Resistance Factor Criteria for Design and Requalification of Platforms Offshore Indonesia Report to Indonesian Petroleum Association Directorate General of Oil and Gas of Indonesia Pertamina and Bandung Institute of Technology Marine Technology and Management Group University of California at Berkeley
Bea R G (1997c) Risk Based Hurricane and Earthquake Criteria for Design and Requalification of Platforms in the Bay of Campeche Report to Petroleos Mexicanos Instituto Mexicano de Petroleo and Brown amp Root International Inc Marine Technology and Management Group University of California at Berkeley
Bea R G (1998) Continued Development of Earthquake Load and Resistance Factor Design Guidelines Report I - Concrete Gravity Base Structures LRFD Guidelines Report to the UK Health and Safety Executive Marine Technology and Management Group University of California at Berkeley
Beca Carter Hollings amp Ferner Ltd Indonesian Earthquake Study Seismic Zones for Building Construction in Indonesia 1979
Borcherdt R D (1994) Estimates of Site-Dependent Response Spectra for Design (Methodology and Justification) Earthquake Spectra The Professional Journal of the Earthquake Engineering Research Institute Vol 10 No 4 Nov
Bozorgnia Y Niazi M and Campbell K W (1995) Characteristics of Free-field Vertical Ground Motion during the Northridge Earthquake Earthquake Spectra Vol 11 No 2 Earthquake Engineering Research Institute Oakland California
Bray J D Chameau J-L and Guha S (1997) Seismic Response of Deep Stiff Clay Deposits Proceedings of the 5th International Conference on Earthquake Engineering Earthquake Engineering Research Center University of California at Berkeley
Chavez M (1987) Analisis de Riesgo Sismico en Varios Sitios de a Bahia de Campeche Elaborado para IMP Proy 6734 Mexico City MX
Chavez M (1997a) On the Seismic Hazard of the Campeche Bay Region Prepared for Meeting About the PEMEX Transition Normativity for the Bay of Campeche Berkeley CA March
Chavez M (1997b) Seismic Hazard and Design Spectra for Southern Gulf of Mexico 16th International Conference on Offshore Mechanics and Arctic Engineering OMAE 97
39
Proceedings of Earthquake Criteria Workshop Recent Developments in Seismic Hmard and Risk Assessments for Port Harbor and Offshore Structures Yokohama Japan April 17 American Society of Mechanical Engineers New York NY
Chavez M (1997c) Seismic Hmard at Sites of the Campeche Bay for the Risk Assessment of PEMEX Offshore Facilities Report to PEMEX and IMP August 10 Mexico City Mexico
Chavez M (1998) Seismic Hazard at Sites of the Campeche Bay for the Risk Assessment of PEMEX Offshore Facilities risks and Seismic Design Spectra in Areas of the Bay of Campeche Report to Petroleos Mexicano Instituto Mexicano de Petroleo and Brown amp Root International CISIND Col Jardines de Ajusco Talapan DP Mexico
Crouse CB and Quilter J (1991) Seismic Hazard Analyses and Development of Design Spectra for Maui A Platform Proceedings of the Pacific Conference on Earthquake Engineering Auckland New Zealand
Crouse C B and McGuire J W (1997) Site Response Studies for Purpose of Revising NEHRP Seismic Provisions Dames and Moore Consultants Seattle Washington
Dames amp Moore 1992 Final Report Seismic Hazard Evaluation Offihore Northwest Java Indonesia Report to Maxus Southeast Sumatra Inc Atlantic Richfield Indonesia Inc
Dames and Moore Seismic Risk and Site Response Study Proposed Rajah Platform East Kalimantan Indonesia Report No 02310-004-75 Report to Unocal Corporation
Dobry R (1991) Soil Properties and Earthquake Ground Response Proceedings of the Tenth European Conference on Soil Mechanics and Foundation Engineering Associazione Geotecnica Italiana Florence Italy
Dolan D K Crouse C B and Quilter J M (1992) Seismic Reassessment of Maui A Proceedings ofthe Offshore Technology Conference OTC 6934 Society of Petroleum Engineers Richardson Texas
EQE International Ltd ( 1998) Seismic Hazard Mapping of Offshore Britain Report to Health and Safety Executive London UK
Guerra R and Esteva L (1978) Espectros de Diseno Sismico en Paraiso Tab y Cuidad de Carmen Camp Patrocinado por Proyectos Marinos S A Instituto de Ingenieria UNAM Mexico City DP
Guzman R (1982) Bases de Riegso Sismico y Espectros de Riesgo Uniforme de la Bahia de Campeche Preparado para Instituto Mexicano de Petrroleo Proyectos Marinos Mexico DP
Lamport W B 1992 Seismic Analyses of Indonesias Rajah Wellhead Platform Unocal Corporation Science and Technology Division Project Report 91-23
Martin G R and Dobry R (1994) Earthquake Site Response and Seismic Code Provisions National Center for Earthquake Engineering Research Bulletin Vol 8 No 4 Buffalo New York
NORSAR and Norwegian Geotechnical Institute (1998) Seismic Zonation for Norway Report to Norwegian Council for Building Standardization
Norwegian Geotechnical Institute (1998) Effects of Local Soil Response on Earthquake Loading Report to Norwegian Council for Building Standardization
Nozu A and Iai S (1997) Seismic Hazard in Coastal Areas of Japan Proceedings of Earthquake Criteria Workshop Recent Developments in Seismic Hazard and Risk Assessments for Port Harbor and Offshore Structures Port and Harbor Research Institute Japan
40
Nozu A Uwabe T Sato Y Ichii K and Iai S (1997) Attenuation Relations for Peak Ground Motions on Base Layer in Japan Proceedings of Earthquake Criteria Workshop Recent Developments in Seismic Hazard and Risk Assessments for Port Harbor and Offshore Structures Port and Harbor Research Institute Japan
Risk Engineering Inc 1992 Seismic Hazard Analysis for the Offshore Kalimantan Sites Indonesia Report to Unocal Corporation March 27
Sleefe G E (1990) The Long-Term Measurement of Strong-Motion Earthquakes offshore Southern California Proceedings Offshore Technology Conference OTC 2345 Society of Petroleum Engineers Richardson Texas
Smith C E ( 1997) Dynamic Response of a Steel-Jacket Platform Subject to Measured Seafloor Earthquake Ground Motions Proceedings Eighth International Conference on the Behavior of Offshore Structures Vol 3 Pergamon Elsevier Science Ltd Oxford England
Untung M Buyung N Kertapi E Undang N Allen C R 1985 Rupture Along the Great Sumatran Fault Indonesia During the Earthquakes of 1926 and 1943 Bulletin of the Seismological Society of America Vol 75
Utsu T (1982) Catalog of Large Earthquakes in the Region of Japan from 1885 through 1980 Bulletin ofEarthquake Research Institute University of Tokyo Vol 57 pp 401-463
41
this page left blank intentionally
42
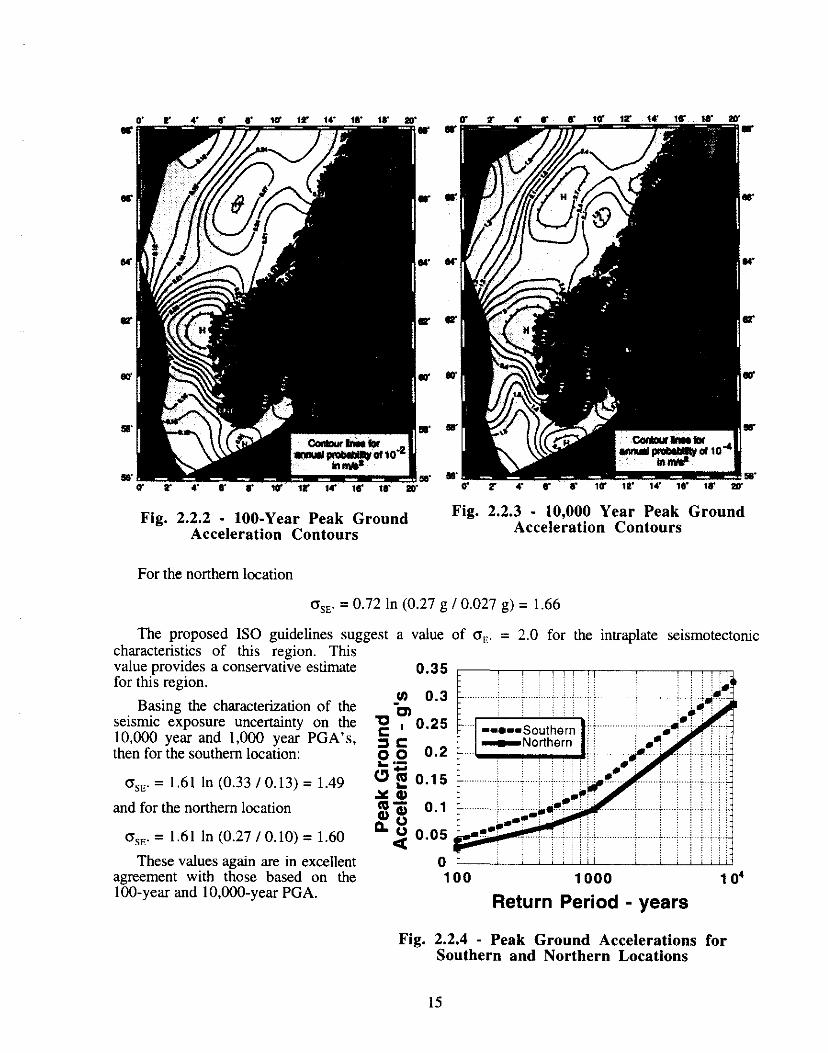
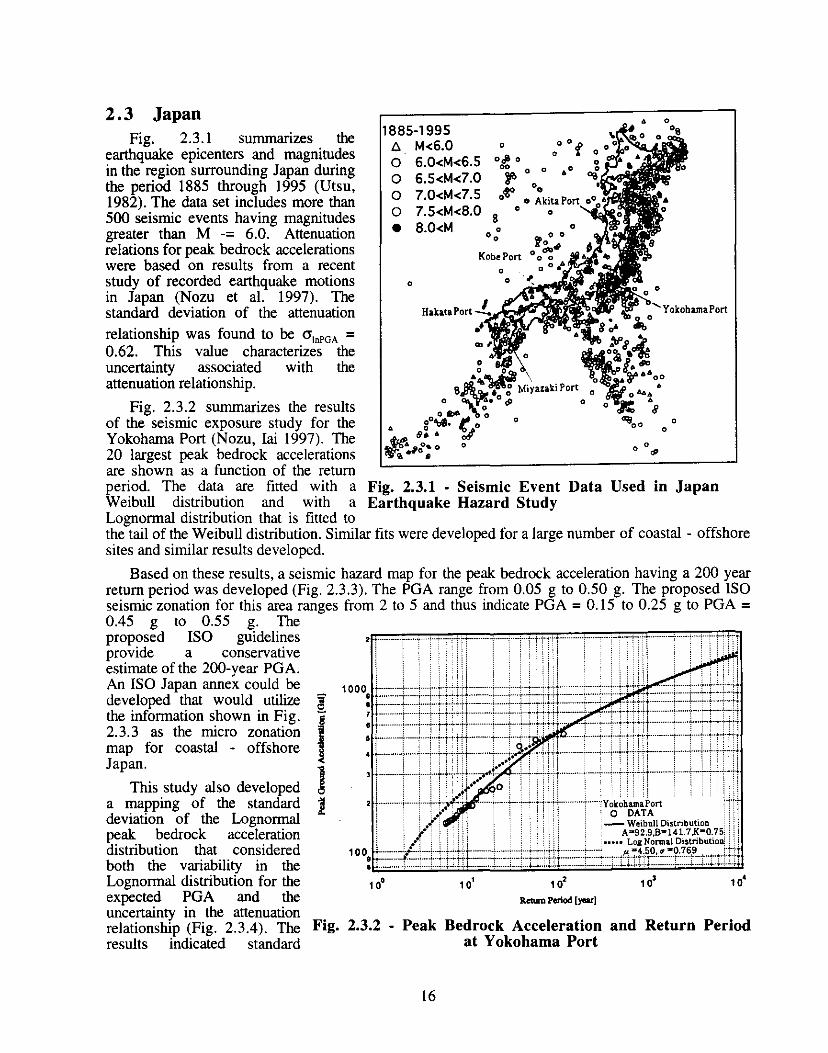
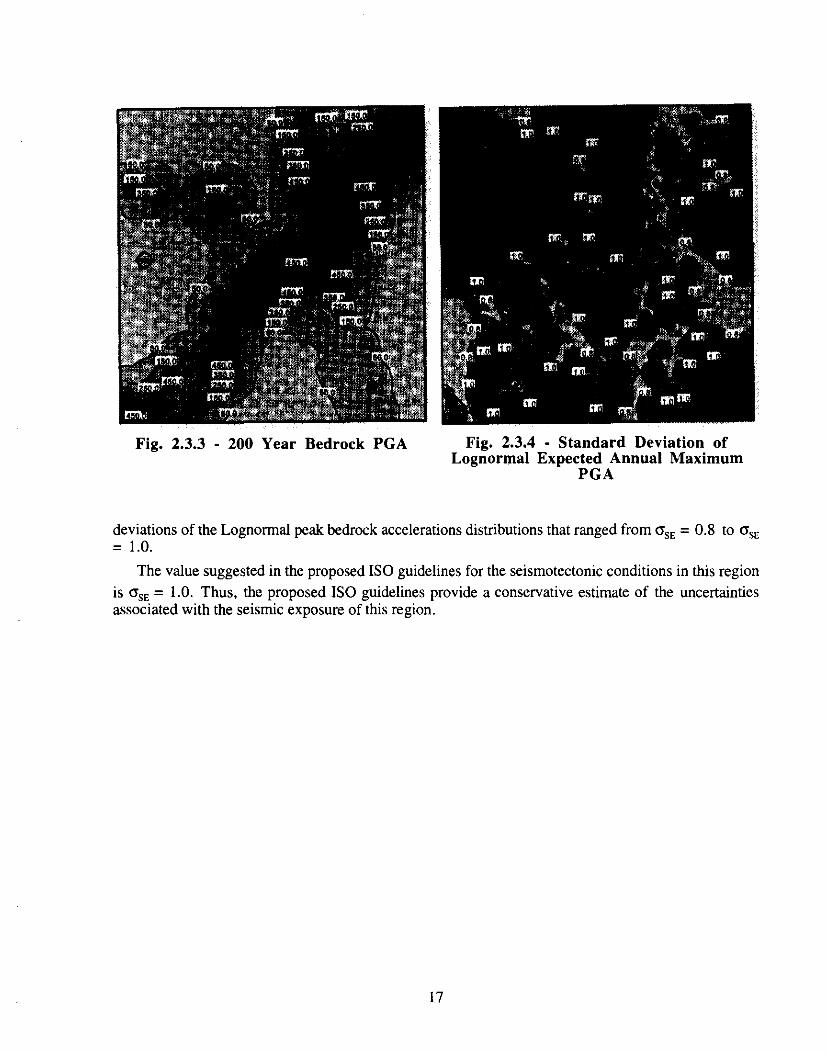
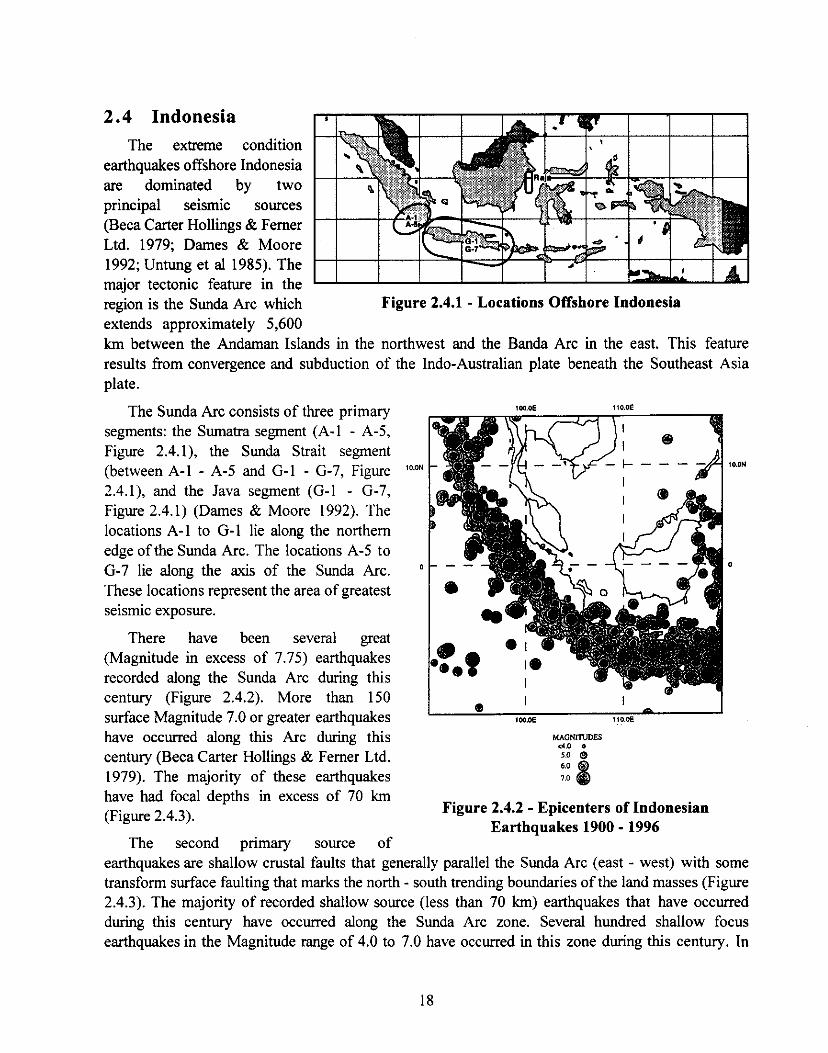
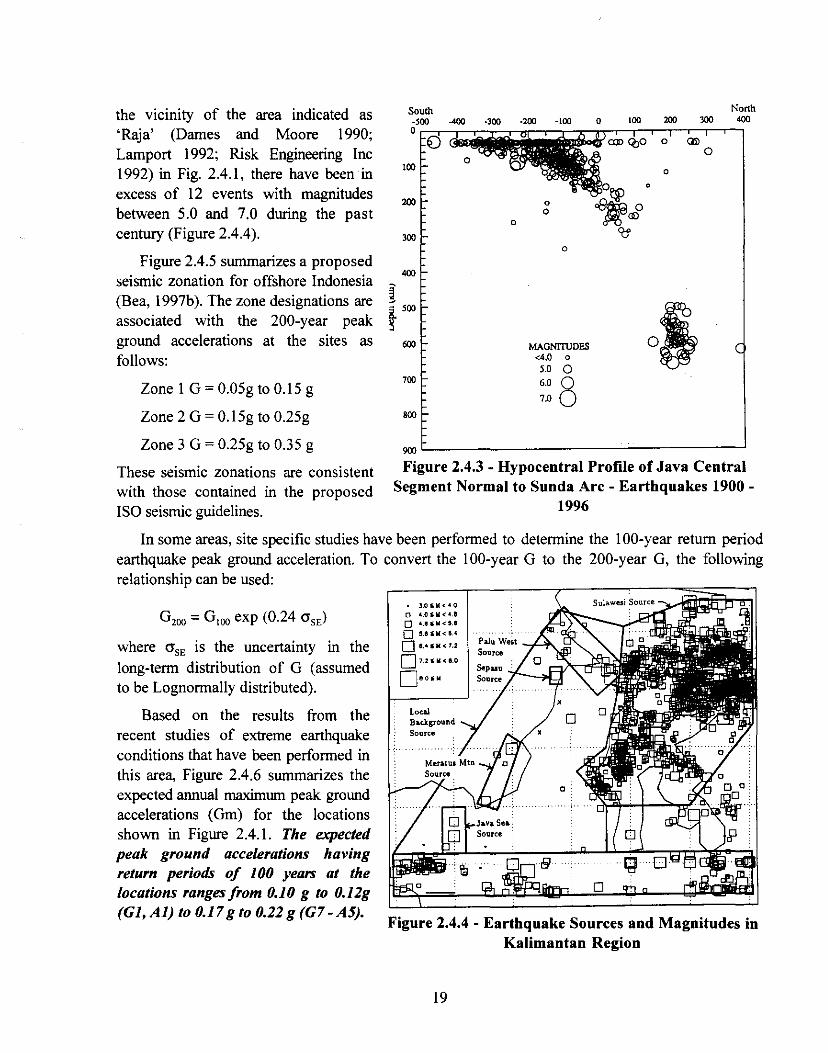
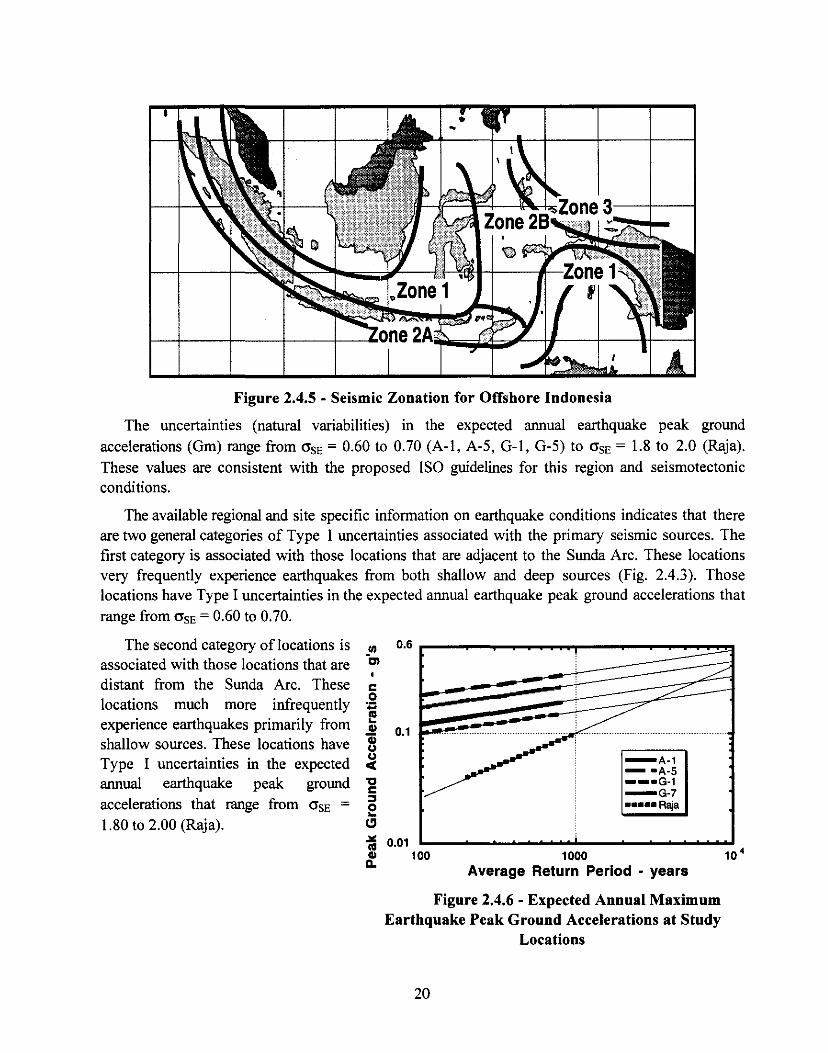
I
Figure 245 - Seismic Zonation for Offshore Indonesia
The uncertainties (natural variabilities) in the expected annual earthquake peak ground accelerations (Gm) range from crsE = 060 to 070 (A-1 A-5 G-1 G-5) to crsE = 18 to 20 (Raja) These values are consistent with the proposed ISO guidelines for this region and seismotectonic conditions
The available regional and site specific information on earthquake conditions indicates that there are two general categories of Type I uncertainties associated with the primary seismic sources The first category is associated with those locations that are adjacent to the Sunda Arc These locations very frequently experience earthquakes from both shallow and deep sources (Fig 243) Those locations have Type I uncertainties in the expected annual earthquake peak ground accelerations that range from crsE = 060 to 070
The second category of locations is 111
associated with those locations that are middotm 06~~ distant from the Sunda Arc These c locations much more infrequently ~
Iexperience earthquakes primarily from 111 01~~=1 shallow sources These locations have fi
-A-1Type I uncertainties in the expected ~ - bullA-5 --bullG-1annual earthquake peak ground ~ -G-7
accelerations that range from crsE = s bullbullbullbullbullRaiae
180 to 200 (Raja) ~ 001 100 1000 10 4
fl Average Return Period - years
Figure 246 - Expected Annual Maximum Earthquake Peak Ground Accelerations at Study
Locations
20
25 Bay of Campeche Mexico The information on earthquake seismic
100hazard characteristics for the Bay of bullbullbull Campeche Mexico was provided by Chavez (1987 1997a 1997b 1998) Additional information on the earthquake characterization was provided by Guerra and Esteva ( 1978) and Guzman ( 1982)
The seismic environment is influenced by three primary types of earthquake sources (Figure 251) The Type 1 source is associated with the subduction zone on the western Pacific coast of Mexico The earthquakes in this zone occur at depths of 15 km to 20 Km and have magnitudes up to M = 8 2 The Type 2 source is associated
EXPLANATIONwith the lithospheric slab within the central Tectonostratigraphic province boundaryportion of Mexico Earthquakes occur in
0 300km ~this zone at depths of 60 km to 250 km and Thrust taubull teeth on upper plate
have magnitudes up to M = 75 The Type Plate moliona rates in cnvyr -3 source occur in the Trans-Mexican volcanic belt located primarily along the east coast of Mexico have depths up to 20
CMbull C-Muatt CaP c-n Piiie CoP bull Cocoo Plate CTbullkm and magnitudes up to M = 67 (Chavez Caymmn Traugh MATbull Middle Atllrtic Trench MFZ bull Mot1QU8 Faull Zone 1987 1998) MSG bull Mlcl1oaean SMmic Gap NOAM bull -h American Piiie OFZ bull Orozco
Fracture Zone Ind ndgn SCbull ~a-ptOYince SMQCP bull Sietra Madre OrierltllmiddotChipu P116n ptOYince TRbull Tehuamepec Ridge TSG bull
The historic catalog of earthquake Tlhuon--Gap
occurrences during the period 1970 - 1996 Figure 251 - Bay of Campeche Earthquake
NOAM
SC I
I I
I
I Campeche Bay
I I
lt~
MAT
CoP
were used by Chavez to determine the activity rates in each of the three sources and the occurrences of varying
2400earthquake intensities and magnitudes in each of the 2300
three sources Figure 252 0 2200shows the seismic events that 0 8
have occurred in this region 0 2100 0during the period 1800 to bull
20001996 for all earthquakes that 0
1900have surface magnitudes (Ms) greater than M = 50 The 1800
majority of records contained 1700in this catalog date from the
1930s when reasonably 1600
comprehensive teleseismic 1SOO
instrumentation was in place The largest earthquakes 1400
that have occurred in the ~v1c1rnty of the Bay of ~
Campeche are in the range of M = 30 to M = 40 The
Plate Tectonics and Sources
+ + + + + + + + + + + +
+ + + + + + + + ++ + +
+ + + + + + + + + + + +
0 + + +
+
+
+
+
degamp + + + + + + + + + + +
o +
0 +
~ ~ 8 8 8 ~ ~ ~ ~ ~ N ~ ~
~ 0~ bull bull ~ bull ~ bull ~ ~ bull
2400
Z300
2200
2100
2000
1900
1800
1700
1600
IS00
1400
~ bull
Figure 252 bull Seismic Events Affecting the Bay oflargest earthquake that has Campeche Region 1800-1996 Events M gt 50
21
occurred during the past 100 years within a 100 km radius of the Bay of Carnpeche is M = 60 The vast majority of the seismic activity is concentrated along the Pacific coast of Mexico The source of nearby large earthquakes are associated with the Motagua Fault Zone and the fault system (Sierra Madre Oriental-Chipas Peten province) that generally parallels the east coast of Mexico There are no major seismic sources that have been identified within the Sigsbee-Carnpeche province that underlies the Bay of Carnpeche
Based on previous analyses of pile supported platforms subjected to earthquake excitations in soil columns of the Bay of Carnpeche a depth below the sea floor of -12 m was chosen to reference the lateral accelerations and a depth of -115 m was chosen to reference the vertical accelerations from the seismic exposure analyses (Bea 1997c)
Figure 253 summarizes the results for the Bay of Carnpeche for each of the three seismic sources A mean or average value for the four representative soil columns studied by Chavez (1997a) are shown The Type 2 and Type 3 sources develops ground motions that dominate the seismic exposure in the Bay of Carnpeche At an average return period of 10000 years the indicated peak horizontal ground acceleration (Am) is indicated to be Am~ 025 g Table 25 l summarizes the ground motions at return periods of 200 and 4000 years and the uncertainties (natural or Type I aleatory) associated with the ground motions (expressed as the standard deviation of the logarithms of expected annual G
QISE)
-CE CCI iObull -shyCJ _UI 01
iii Cl -ccI
2omiddot = o ca z G lo ii ca u GI U 0 ct
001
-shy--
- - - - - shy - - - -
bullbullbull-Zona 1 -zona2 --bullZona 3
-shy---shybullmiddotmiddotmiddotmiddot -shy__- --middot~middotmiddotmiddotmiddot
-
~ -shy middotmiddotmiddotmiddotmiddotmiddot
middotbullmiddotmiddotbullmiddotbullmiddotmiddotmiddotmiddotmiddotmiddot middotmiddotmiddotmiddotmiddotmiddotmiddotmiddotmiddotmiddotmiddotbullmiddot - - middotbullbullbullbullbull ~
41000 10
Return Period - Years
Figure 253 middot Peak horizontal ground accelerations
Table 251 middot Mean Horizontal PGA at Bay of Campeche sites (middot12m) and uncertainties of peak horizontal ground accelerations
Type 200 years shyg
1000 years -g
Uncertainty
QSE
I 12 16 058 2 50 78 084 3 27 68 175
22
These results can be compared with those developed by Guerra and Esteva ( 1978) for the Bay of Campeche and firm alluvium sites At a return period of 100 years the peak horizontal ground acceleration obtained by Guerra and Esteva is G = 66 g This compares with a maximum value of G =50 g obtained by Chavez (1998) for a 100 year return period for the Zone 2 sources The results developed by Guerra and Esteva indicate an uncertainty in the annual expected peak horizontal
ground acceleration of OsE = 126
The extensive Bay of Campeche seismic exposure study performed by Guzman ( 1982) provides some additional information on the expected ground motions At a return period of 100 years the peak horizontal ground acceleration obtained by Guzman is G = I 0 g This ground motion is more intense than developed by either Chavez or Guerra and Esteva The more intense ground motion appears to be coupled with the attenuation relationships that were developed and used by Guzman ( 1982) The results developed by Guzman indicate an uncertainty in the annual expected peak
horizontal ground acceleration of OsE = 097 This uncertainty is slightly greater than that of the Chavez results and somewhat less than indicated by the Guerra and Esteva results
The proposed ISO guidelines for this region indicate a 200-year PGA in the range of 005g to 015g The lower end of this range provides a good estimate of the seismic characteristics in the Bay of Campeche The uncertainties in the annual maximum PGA are consistent with those given in the proposed ISO guidelines
The Type 1 and Type 2 sources have uncertainties in the expected annual maximum Am that are comparable with that of offshore California The Type 3 (coastal - local) sources have an uncertainty that is comparable with intra-plate seismic zones Based on the results provided by Chavez (1997a) Table 252 summarizes the mean vertical peak ground accelerations at a depth below the sea floor of shy115 m together with the associated uncertainties
Table 252 middot Mean Vertical PGA at Bay of Campeche sites (-115m) and uncertainties of peak horizontal ground accelerations
Type 200 years shyg
1000 years - g
Uncertainty
() SE
1 02 03 075 2 09 12 055 3 02 03 075
23
this page left blank intentionally
24
Strength Level Earthquake Response Spectra
30 Introduction Strength Level Earthquake (SLE) elastic response spectra were assessed in the several of the
studies of regional seismicity discussed in Chapter 2 The SLE response spectra developed for each of these regions will be summarized in this Chapter In addition results from recent general studies of response spectra will be summarized including consideration of water column effects on vertical motions
3 1 Response Spectra Ordinates Recent studies of response spectra ordinates in the low period range (01 sec to 03 sec) have
indicated that one should expect that these ordinates will vary as a function of both the local soil conditions (soil column classification)and intensity of earthquake motions (Martin Dobry 1994 Crouse McGuire 1997) Figure 31l summarizes the results from the study by Crouse and McGuire of the median amplification factors (Fa = peak horizontal ground acceleration at surface I peak horizontal ground acceleration on rock= PGAs I PGAr) for periods (T) in the range of T = 01 sec to 03 sec
The site soil conditions indicated as SC-A B C and D correspond to those in the proposed ISO guidelines The amplification factor in this period range presently incorporated into the proposed ISO guidelines is Fa= 25 for all soil conditions These results indicate substantially larger amplifications in the short period range While these findings would relatively unimportant for the lateral motions of most offshore platforms (T = 2 to 3 sec) the effects would be potentially important for the vertical motions (T = 01 to 03 sec) of these structures (particularly for heavily loaded deck structures with large cantilevers) The National Center for Earthquake Engineering Research (NCEER) workshop defined a comparable range of amplification factors for this period range (Martin Dobry 1994)
As a result of these findings the following modifications to the proposed ISO earthquake guidelines are proposed The elastic design
tf 55 0 5 uu ~
SC-Aftl Ill ~ - S111 seaLI 111 45 CM -bullmiddotsec0 SC-0middot-Cl 4 iii 0 ~tbull~bullFbull~bullbull~~middotmiddotmiddotmiddotmiddotr-Eu
35
Qci -~-11--~---F=--- --imiddot-- middotmiddotmiddotmiddotmiddotmiddotmiddotmiddotmiddotmiddot---- -middotmiddot------ ---1-----shyE II 3
lt1shyCJ~ 25 -----middot----middot-----c ~
2 CJ 01 015 02 025 03 035 04
Peak Ground Acceleration - gs
Fig 311 - Amplification factors as function of acceleration level and soil conditions
25
response spectra (Figure 312) would 10 - - - --~ be a function of the following variables
Sa I G = vbull T = period of system
bull D = damping of system
bull v = site classification factor for short period range (new factor)
~ Sa I G =~Tla___~
bull I = site classification factor for 0=5long period range L------__________bull E =seismotectonic conditions 01
001 01 1
Period - T (sec) Table 3 11 summarizes the elastic
design response spectra characteristics Fig 312 bull Proposed elastic design responsebased on the results of the work by spectra Crouse and McGuire (1996) and the previous work incorporated into the proposed ISO design response spectra
Table 311 - Local geology and soil conditions parameters for SLE response spectra
Soil 1-ondibons Se1smotectonic Lond1tions
Site 1-lass v I E
SC-A 25 10 Type A 10
SC-B 33 12 TypeB 08
SC-C 35 14 TypeC 09
SC-D 45 20 TypeD 08
SC-E Site specific studies required Detault value 10
3 2 Vertical Response Spectra Ordinates Several recent large magnitude earthquakes have indicated that vertical ground motions can be
equal to or greater than the horizontal ground motions This observation has been particularly true for ground motions close to the epicenter of large magnitude earthquakes The present ISO guidelines prescribe an elastic design response spectrum for vertical motions that is one-half of the horizontal motions
Figure 3 21 summarizes results from a recent study of the ratios of vertical to horizontal spectral ordinates as a function of the response frequency (Bozorgnia Niazi Campbell 1995) Results for the Loma Prieta and Taiwan earthquakes are shown The ratios indicated are mean values The horizontal line indicated at the ratio of 23 references the present Uniform Building Code (UBC) specifications For near-by earthquakes (R = l 0 km) the ratio of the vertical to horizontal spectra ordinate for periods
26
in the range of T = 01 sec are in the range of 14 to I7 The ratio is close to unity at distances of R = 20 km to 30 km Comparable results have been found for other large magnitude earthquakes in other sernismotectonic zones
For periods in the range of T = 2 to 3 sec the ratios are in the range of 02 to 03 for all distances Current studies of recordings from different earthquakes generated by different types of seismotectonic environments indicates that these trends are very likely to be universal (Bozorgnia Niazi Campbell 1995) These results show the problems that are associated with specifying a constant ratio of vertical to horizontal spectra ordinates for all periods and distances The results indicate that the horizontal and vertical spectra have decidedly different shapes
The authors application of these results to the unmodified 1 ISO response spectra is illustrated in Figure 322 The present proposed ISO horizontal and vertical response spectra for Site Classification C (firm alluvium v = 35 I= 14) and Type A seismotectonic
conditions (shallow crustal faulting E = 1 ) For periods greater than about 03 sec the unmodified vertical response spectra have ordinates that are less than the present proposed ISO guideline vertical spectra For periods Jess than 03 sec the unmodified ordinates are substantially larger
The foregoing results have been developed based on earthquake ground motion measurements that have been made on land Measurements of ground motions offshore have indicated that the presence of the water column can have a marked influence on the sea floor motions (Smith 1997 Sleefe 1990) The measurements indicate that the vertical motions at the sea floor are much less than would expected based on on-land measurements For mat supported structures that receive the majority of their input motions from soils that are located near the sea floor this can be an important consideration
For vertically incident earthquake compression waves the ratio of the reflected to the incident wave amplitude at the ground
1 unmodified for water column effects
Loma Prieta EQ Stitt Soll Sites 16
14
0
i ~
12
10
08
~ 08
~ 04
02
00
SMART-1 Array Taiwan Mag 70
(a)
Rbull10 km
Rbull20 km
R-40 km -------213
18
i
16
14
0 12
( i 10I
08
-~ 06 ~
gtbull 04
02
00
(b)
Rbull10 km
Rbull30 km
-------213RafiO km
001 010 100 1000 Period (sec)
Fig 321 - Ratio of Vertical to Horizontal Elastic Response Spectra Ordinates
UJ
01 _____ ______~
1SO Horizontal-II bullVertical -+bullISO Vertical
-----middot
D = 5
001 01
Period - T (sec)
Fig 322 - Horizontal and Vertical Elastic Response Spectra for SC-C E = 10
27
-+-ISO Vertical
bullC
surface is a function of the impedance ratio IR at the ground surface
IR= ps Vspa Va
where pis the mass density of the soil (s) and air (a) and V is the compression wave velocity in the two media On land this impedance ratio is very large and one would expect almost total reflection of the energy at the ground surface This would indicate a doubling of the amplitude of the incident compression waves at the ground - air interface
In water the compression wave velocity in the water and in the water saturated sediments would be almost the same The density difference would be a factor of about 2 This would indicate that about 50 of the compression wave would be transmitted through the interface and the remaining 50 would be reflected The total wave amplitude at the interface would be 15 times the incident amplitude or 75 of the amplitude expected at an air - soil interface
This analysis assumes that the water is infinitely deep and ignores the reflection of the incident compression waves at the water - air interface Crouse and Quilter ( 1991) developed an analysis that includes the finite water column effects Depending on the water depth some frequencies can be reinforced and amplified by the finite water depth while others can be canceled The analyses performed by Crouse indicates that the peak vertical accelerations at the sea floor can be reduced by as much as 50 (Crouse Quilter 1991 Dolan Crouse Quilter 1992 Smith 1997 Sleefe 1990) These observations are in agreement with the analyses of recorded earthquakes at the sea floor reported by Smith ( 1997) and Sleefe ( 1990)
The earthquake ground motions in the vicinity of the sea floor are the result of a very complex variety of wave forms frequencies and incidence angles Thus the foregoing simplified analyses can be relied upon only to provide some insights into the potential effects of the water column on the vertical movements at the sea floor Measurements of earthquake movements at the sea floor provide the only reliable source of information to quantify these effects The measurements that are available confirm the inferences that have been drawn based on simplified analyses
Figure 323 summarizes the results for the water column modified vertical response spectra compared -bullbullModified (x05) Vertical
D =5 Modified (x 075) Vertical with the present ISO vertical response
spectra The present ISO vertical response spectra provides a conservative envelope to the modified vertical spectra for periods greater ~ 1 ~
~than about 02 sec However the ftl bull-----117 present ISO vertical response spectrum is somewhat unconservative ifor periods less than about 02 sec
SC-C v = 35 1J1 = 14 E = I ~ bullUntil better information becomes available it is the authors conclusion 01
that the present proposed ISO 001 01 1 guidelines for vertical response Period - T (sec) spectra provide a reasonable arid likely somewhat conservative Fig 323 - Water Column Modified Vertical approximation to the vertical Response Spectra movements that can be expected in the vicinity of the sea floor
28
33 Computed Response Spectra Most current seismic exposure analyses and evaluations characterize the earthquake ground
motions on a rock or very firm alluvium surface Then often one-dimensional shear beam type analyses are performed to characterize the earthquake ground motions within the soil column that overlies the rock or very firm alluvium surface A variety of soil constitutive models can be used in these analyses but most often equivalent linear models are used with modifications introduced to model the soil non-linear stress-strain behavior and the changes in this behavior with cyclic strains Damping is generally introduced as an equivalent viscous damping (Dobry 1991 ) The bottom boundary of the soil column at the rock interface is generally characterized with an absorbing boundary element to prevent unrealistic trapping of the earthquake energy in the soil column due to reflections of the energy at the rock interface
Relative to the ISO earthquake guidelines this practice raises issues regarding the uncertainties and biases that can be introduced by different analyses of soil column effects The ISO guidelines do not include any definitive information on how such analyses should be performed There is a very wide range in how such analyses are performed and how the soil column analyses are performed can have extremely important effects on the earthquake ground motions that are utilized in analyses of the soil shystructure interactions
Fig 33 l summarizes earthquake acceleration response spectra from four locations in Mexico City based on recordings obtained during the 1985 earthquake (Seed 1987) The soft clay soil column has discernible effects on the shapes of the response spectra and the magnitudes of the spectra ordinates The computed natural periods of the soil columns (Ts) at each of the locations is noted based on the relationship
Ts =4dVs
where dis the depth of the soil column and Vs is the soil shear wave velocity (appropriate for the soil strains induced by the earthquake) For a given soil column thickness the natural period of the soil column is controlled solely by the shear wave velocity The shear wave velocity is a function of the shear modulus which is a function of the cyclic shear strains induced in the soils by the earthquake Higher strains result in lower shear modulii and shear wave velocities
The response spectra exhibit definite peaks at the natural periods of the soil columns The noticeable increase in the response spectra energy associated with the 37 m depth site is likely due to reflected energy associated with the edge of the Mexico 75
rbullbull 4H37gt bull 2 sec City basin This basin 10------- 10---10---0--- edge influence would oat- UNAM CAOT J SCT CAF
08 08 08 not be incorporated in ss 06 5 orrpng bullbull gmost shear beam soil bullmiddot g 04t-
column analyses because the soil column 0o 1 2 3 5responses would be
T sec T sec T sec T secbased on the rock outcrop motions (in this case at the UNAM site)
0[~mJraquo middot~middot~middotmiddot 75~)~mbullEJ 3f==Soft Fig 332 l c~~aVbullSOOto900nVa middotsummarizes results
from SHAKE analyses
0606
04
06
04 JT
dego t 2 3 1 2 3 4 5
of motions at the soil surface identified as Fig 331 - Soil Conditions and Recorded Acceleration Spectra Oakland Outer Harbor During 1985 Mexico City Earthquake
29
(Bray et al 1996) during the 1989 Loma Prieta earthquake (epicenter about 70 km away) The soil profile consists of 156 m of alluvium (clays sands) overlying bedrock The shear wave velocity in this soil column ranged from 800 msec (alluvium at base of column) to 63 mis (Bay Mud) The soil column had an average shear wave velocity in the range of approximately 400 msec The response spectra indicates discernible peaks at 15 sec and about 06 sec Based on the results from testing of soil samples a soil damping ratio of l 0 to 20 was used
Response spectra from available strong motions recorded at nearby rock sites are shown in Fig 332 The response peak at 06 sec is obviously due to the energy in the input rock motions at this period The response peak at 15 sec is obviously due to the natural period of the soil column The spectral acceleration of the rock is amplified by a factor of about 4 at the 06 sec and 16 sec peaks of the soil column Given a peak spectral acceleration of 025 g in the input rock motion at the natural period of the soil column the peak spectral acceleration is
Rock mollon YBI (90 dovl ied lo OOlg
Rocordod mollon (305 dovgt Computed mollon
o
1 2 3 4 PERIOD seconds
middot Recorded and SHAKE
1
Cl
Fig 332 Computed Response Spectra (Oakland
Outer Harbor Loma Prieta Earthquake)
about 05 g representing a doubling of the peak in the spectral input motion Note that the computed motion of the soil column generally is somewhat less than the recorded motion
Fig 333 and Fig 334 summarize similar results for two other nearby locations The Oakland location consisted of 152 m of alluvium having shear wave velocities in the range of 800 msec to 120 msec The Emryville location consisted of 137 m of alluvium having a similar range in shear wave velocities In these cases the amplifications of the rock motions at a period of 06 sec were about 3 and at a period of about 15 sec were about 4 The peak input spectral acceleration of 020 g to 025 g was magnified at the natural period of the soil column by a factor of about 2 Again the SHAKE analyses tend to under predict the ground motions at the natural period of the soil column but predict the amplifications reasonably well at the earthquake input peak energy period of about 06 sec
These results indicate that the SHAKE analytical model and the associated characterizations of the soil stiffness and damping has a bias in the range of B = 15 to 20 for the natural period of the soil columns Other similar results need to be developed before definitive statements can be made
Rock mollon YBI (90 dogl ied lo OOlg Rocordod mollon (290 dovgt06 11ecorded motion (200 deg)
Cl Compulod mollon
Demplng 5
0 1 2 3 PERIOD seconds
Fig 333 bull Recorded and SHAKE Computed Response Spectra (Oakland Loma Prieta
Earthquake)
30
4
concerning the biases associated with the soil column analyses
The amplification of the earthquake input acceleration on rock at the surface of the soil column can be evaluated approximately from (Dobry 1991)
A= [as I ar lmax =II I + (1t 12) D5 I
where A is the ratio of the maximum acceleration at the soil surface as to the input acceleration at the rock interface ar I is the impedance ratio of the rock - soil interface D5 is the soil damping ratio The soil - rock impedance ratio is
I= (pr I ps) (Yr I Vs)
where pr is the density of the rock ps is the density of the soil Yr is the shear wave velocity of the rock and Vs is the shear wave velocity of the soil The velocity ratio would generally be in the range of 5 to 30 and the density ratio in the range of II to 15 Thus the impedance would generally be in the range of 5 to 50 The soil damping ratio could be expected to be in the range of 005 (low
I
Rocle mollon YBI llO dog) Recordod mollon (350ltMg)0
Cl
0
Ar Compulodmodan bull I
DomplngS
middotmiddot~_ -~
1 2 3 PERIOD seconds
Fig 334 - Recorded and SHAKE Computed Response Spectra (Emryville Loma Prieta
Earthquake)
strains) to more than 03 (high strains) Fig 335 summarizes the results of this development Except for very low impedance impedance is not an extremely important element However damping is very important The use of low strain damping ratios in the range of 5 to I 0 result in amplifications that are a factor of 4 to 5 times those for damping ratios in the range of 25 to 30
The Loma Prieta site results summarized earlier had a velocity ratio in the range of 7 to 9 a density ratio in the range of I I to 12 This would indicate an impedance in the range of 8 to 11 Given an amplification of the input rock acceleration of about 2 at these sites a damping ratio in the range of 20 to 30 is indicated This damping is much higher than indicated from the laboratory triaxial and resonant column tests 12Often this has been found to be true and it has been postulated that the under-estimated c( 1 0 damping is due to the laboratory testing boundary conditions c 80
Studies are currently being conducted to ~ 6better characterize the bias and uncertainties
associated with analyses of soil column e 4response characteristics during intense Q
earthquakes These studies are attempting to E 2c(account for the different methods that can be used to characterize the soil properties and the 0input earthquake excitations Results from these studies will be monitored by the author
-D=Soo Impedance- bull0=10dego - bull bull0=15dego t--r~-~-~-~--- bullbullbullbullbullD=20dego
~middot0=30oomiddotmiddotmiddotmiddotmiddot0=251middot=~~-
10 20 30 40
and their implications integrated into future revisions of the proposed ISO guidelines Fig 335 - Soil Surface Amplification of
Bed Rock Acceleration
31
4
50
34 North Sea Response Spectra Elastic response spectra for North Sea
seismotectonic and hard ground - rock conditions were developed as part of the EQE International study (1998) and the NORSAR study (1998) Fig 341 summarizes the normalized response spectra results for a 5 damping ratio from the EQE study for return periods of 100 years 1000 years and 10000 years The response spectra do not vary significantly as a function of the intensity of the earthquakes in this range This is to be expected since the hard ground shyrock materials respond essentially in their low-strain reasonably elastic range The peak amplification of the spectra is approximately 25
In the EQE study it was noted that the spectra could be modified for other values of damping by the factor K (Woo et al 1988)
K = 148 - 030 In D
This response spectrum modification factor was compared with that contained in the proposed ISO guidelines It was found that the modification factors are essentially identical for damping ratios less than about 20 and above 20 only differ by about 10
I 1000
100
~ ~ 6 -g 10
~
01
01 10 100 100
Undamped Natural Frequency (Hz)
Fig 341 - Earthquake Response Spectra for UK Sector Conditions
Fig 342 summarizes the response spectra from the NORSAR study (1998) for a return period of 10000 years at low seismic activity (Alta) and high seismic activity (Midgard) sites for rock or hard ground conditions The shapes of the spectra are essentially identical
1 1 FREOUENCY (HZ)
a 1u
Fig 342 - Earthquake Response Spectra for Norwegian Sector Conditions For Earthquake Return Period of 10000 years and Rock - Hard Ground
32
Fig 343 and Fig 344 summarize results from the study of soil column effects on the rock spectra performed by the Norwegian Geotechnical Institute (1988) as part of the NORSAR study ( 1988) Soil column characteristics were based on results from soil exploration - soil boring - laboratory jtesting performed at North Sea platform locations and onshore Norway locations The earthquake response analyses were performed using the SHAKE computer program discussed earlier The soil columns were organized into two different categories Soil Type B - shallow firm alluvium and Soil Type C - deep firm alluvium Recorded earthquake time histories characteristic of those expected for the Norwegian
01 10 100seismotectonic conditions were used as input to the soil column analyses Frequency (Hz)
The amplification factors for the Soil Type Fig 343 Computed Earthquake Response B profiles has a definite peak in the period Spectra Amplification Factors for Deep range of 005 sec to 01 sec The peak Alluvium Soil Conditions (Soil Type C) amplifications range from about 25 to as high The Coefficient of Variation (COY) of the peak amplification factors is approximately 20 ( ~
crG5) The COY suggested in the proposed ISO guidelines is 30 The range of results shown in Fig 343 represents the range of results between different sites not the range of results that reflect variations in the soil characteristics for a given site
The amplification factors for the Soil Type C profiles has a definite peak in the period range of 0 5 sec to 1 sec The peak amplifications range from about 25 to almost 6 The Coefficient of Variation (COY) of the peak amplification factors is approximately 30 The COY suggested in the proposed ISO guidelines is 40
Fig 345 summarizes the mean soil response spectra amplification factors for the two different soil column conditions The mean peak soil amplification factor for Soil Type B is 3 and the same factor for Soil Type C is 3 5 These results are in excellent agreement with those summarized in Table 311 These results confirm the need to have a factor that modifies the magnitude of the peak in the response spectra as a function of the soil conditions
The NORSAR study also addressed the 01 10 100
vertical motion spectra and concluded that the Fraqubullcy (Hz) ratio of the spectral ordinates (VH) was frequency (f) dependent In the vicinity of the Fig 344 - Computed Earthquake peak of the horizontal response spectrum (f = 1 Response Spectra Amplification Factors to 3 Hz) the recommendation was that the ratio for Shallow Alluvium Soil Conditions should be determined as follows (Soil Type B)
1400
300 +----+--+-+-r-tishy
200 +---+---+-middot
7
6
2
0
I
33
VH = 09 - 042 log (f)
For f =1 Hz VH =09 These results are in reasonably good agreement with those summarized in Fig 322 Based on the information provided in the NORSAR study it is understood that these results are for the surface of the soil column and do not incorporate the effects of the overlying water column Future studies of the vertical response spectra at the sea floor should take account of these effects
400
300~
~ c 0 ~ 2005 E Q
100~
000
010
Fig 345 middot Recommended Earthquake Response Spectra Mean Amplification Factors for Deep Alluvium Soil Conditions (API Soil Type C)
100 1000 10000 Frequency (Hz)
Sc w ) ~
I
I I
~
v Soll Ty1 bull
) 1
34
35 Bay of Campeche Spectra Chavez (I997a l 997b) performed a number of site response studies for the Bay of Campeche
using the computer program SHAKE Results from recently performed high quality soil borings and laboratory static and dynamic testing programs were used to characterize the strength stiffness damping and hysteretic performance characteristics of the soils The soils consist of deep (100 m to 200 m) firm alluvium (layered calcareous sands silts and clays) Chavez introduced the deconvolved input motions from the three types of earthquakes at the base of the soil columns and determined the output motions close to the sea floor (at -12 m appropriate for lateral motions characterizations for piles) and at significant penetrations below the sea floor ( -100 m appropriate for vertical motions characterizations
Results for the 200-year horizontal Strength Level Earthquake (SLE) conditions ( -12 m) for a variety of sites in the Bay of Campeche are summarized in Figures 351 352 and 353 for Type I (very distant subduction zone) Type II (distant mixed zone) and Type III (nearby surface faulting zone) earthquakes respectively The Type I earthquake produces a peak in the ground motions at a period of about 3 sec that represents the long-period energy from these distant subduction zone earthquakes that coincides with the natural period of the soil column The Type II earthquake produces a set of response spectra with multiple peaks in the range of 0 3 sec to 3 sec The Type II earthquake produces a much more conventional spectrum with peaks in the range of 02 to 08 sec
The resulting mean response spectra for these three types of earthquake conditions is summarized in Fig 354
bullbull
bullbull
bullI
~~
1
~ (
~w - ~
- Fig 351 - Type I 200-year Earthquake Computed
Response Spectra
bullbull
bullbull
bull i j0 bull -
~~ ~middotg- - ~~middotshy -
I I bull
Fig 352 - Type II 200-year Earthquake Computed Response Spectra
35
bull
bull
together with the mean plus one standard deviation and envelope spectra Chavez included the range in response spectra results that developed from plus and minus one standard deviation changes in the soil shear modulus and damping characteristics The COY of the peak response spectra values is about 100 This high uncertainty reflects the influences of the three different types of seismic sources different soil characteristics at different sites and the effects of plus and minus one standard deviation ranges in the soil properties at the different sites Given a location that is affected by multiple types of earthquake sources it would be preferable to define different response spectra associated with these sources rather than combine them into a single response spectrum
These results clearly indicate that the dominant horizontal and vertical motions important to the pile foundations of the platforms in the Bay of Campeche are associated with the Type II earthquake source At a period of 1 sec (predominant natural period of platforms in Bay of Campeche) the Type II earthquake source produces horizontal motions at a penetration of -12 m that are a factor of about 10 greater than those for the Type I and Type III sources
In general these results are in good agreement with the proposed modifications to the ISO SLE response spectra
bull
middot~
0JO
Imiddot~ 016
1110
f 016
010
~ -~middot)
Ar
~I~ -
I I I
Fig 353 - Type III 200-year Earthquake Computed
Response Spectra
I I
I
I I
I [I
I I
I
I
-~-~ Fig 354 bull 200-year Mean Mean Plus One Standard
Deviation and Envelope Response Spectra
36
Summary Conclusions amp Acknowledgments
40 Summary The objective of this study was to continue development of earthquake load and resistance factor
design (LRFD) guidelines with a study of results from recent seismic hazard characterizations This study addressed two primary topics
a) seismic zonation of the UK and Norwegian Sectors of the North Sea offshore Japan and Indonesia and the Bay of Campeche Mexico and
b) Strength Level Earthquake (SLE) response spectra
This study was organized as follows
bull obtain recent background on seismic hazard characterizations
bull detail seismic exposure uncertainties and local site response uncertainties
bull reconcile differences between current ISO seismic hazard guidelines and those developed during this study
bull document the revised seismic hazard and response spectra characterizations in a project technical report
Results from current seismic exposure studies of the UK and Norwegian Sectors of the North Sea indicate SLE rock PGA in the range of 0015 g to 008 g and seismic uncertainties in the range of crE = 15 to 17
Results from current seismic exposure studies for the Japan coastal and offshore areas indicate SLE rock PGA in the range of 005 g to 05 g and seismic uncertainties in the range of crE = 08 to 10
Results from current seismic exposure studies for the Indonesia coastal and offshore areas indicate
SLE rock PGA in the range of 005 g to 035 g and seismic uncertainties in the range of crE =06 to 20 (lower end of range associated with subduction zone dominated sites)
Results from current seismic exposure studies for the Bay of Campeche Mexico indicates SLE rock PGA in the range of 001 g to 005 g and seismic uncertainties in the range of crE = 06 to 18
Results from current studies of horizontal response spectra associated with SLE intensities indicates that the ISO SLE horizontal response spectra for periods in the range of about 01 sec to 05 sec should be modified (increased) to account for different types of soils Such modifications have been developed as a result of this study Results from region and site specific SLE horizontal response spectra generally are in good agreement with the proposed modified ISO response spectra
Study of information relating to the vertical ground motion spectra for on-land conditions indicate that the ratios of vertical motions to horizontal motions in the low period range (01 sec to 03 sec) for near-by earthquakes can be much greater than currently specified in the proposed ISO guidelines
37
However when the effects of the water column are taken into account combined with the proposed modifications to the horizontal response spectra in the period range of 01 sec to 05 sec the proposed modified ISO guidelines generally provide a conservative estimate of the vertical motion characteristics
4 1 Conclusions The results from this study indicate that the proposed ISO seismic exposure guidelines generally
provide a conservative estimate of the SLE PGA for the regions studied The current regional seismic exposure results provide the basis for updated North Sea Japan and Indonesia regional ISO seismic exposure maps (Fig 212 Fig 222 Fig 232 Fig 246)
The results from this study indicate that the proposed ISO guidelines for seismic exposure uncertainties associated with the different seismotectonic zones generally provide a conservative estimate of the uncertainties The current regional seismic exposure results provide the basis for updated North Sea Japan Indonesia and Mexico seismic exposure uncertainties
The results from this study indicate the need for modifications to the proposed ISO SLE horizontal response spectra in the period range of about 01 sec to about 05 sec Based on results from current response spectra studies proposed modifications that are a function of the type of soil column have been developed In general the proposed modified ISO SLE horizontal response spectra provide a conservative estimate of the expected SLE horizontal response spectra developed from detailed site specific studies The uncertainties associated with the response spectra ordinates as suggested in the proposed ISO guidelines provide reasonable characterizations for the different types of soil columns
The results from this study indicate that it is important to clearly identify the position in the soil column that are associated with the response spectra The positions should be those that characterize the positions that result in maximum input of motions or energy from the earthquake ground motions For pile supported structures these motions would be below the sea floor for lateral motions (eg 5 to 10 pile diameters) and along the lower one-third to bottom of the pile shaft for axial motions For mat supported structures these motions would generally be much closer to the sea floor but are still not generally at the sea floor itself These considerations are particularly important for specification of the vertical response spectra for both pile and mat supported platforms
The presence of the water column has important effects on the vertical motions at or very close to the sea floor These effects need to be accounted for when evaluations are developed for the vertical response spectra for these elevations Analysis of available information on vertical motions and the effects of the water column generally indicates that the proposed modified ISO guidelines provide a conservative characterization of the vertical motion effects
42 Acknowledgments The author would like to acknowledge the technical guidance and information provided by Dr Ove
Gudmestad of Statoil and Mr Mike Craig of Unocal Financial support for the second phase of this study was provided by Statoil and Unocal
The third phase of this study will be sponsored by the U S Minerals Management Service The third phase will address verifications of the proposed ISO guidelines based on site and platform specific results provided by the project sponsors
38
Australian Bureau of Mineral Resources Geology and Geophysics and Lamont-Doherty Geological Observatory of Columbia University Tectonic Map of the Indonesian Region Professional Paper 1078 Geological Survey oflndonesia
Bea R G (1992) Seismic Design and Requalification Methodologies for Offshore Platforms Proceedings of the International Workshop on Seismic Design and Requalification of Offshore Structures California Institute of Technology Pasadena CA Dec
Bea R G (l997a) Background for the Proposed International Standards Organization Reliability Based Seismic Design Guidelines for Offshore Platforms Proceedings of the Earthquake Criteria Workshop Recent Developments in Seismic Hazard and Risk Assessment 16th International Conference on Offshore Mechanics and Arctic Engineering Y okahama Japan (obtain proceedings from Port and Harbors Research Institute Yokuska Japan)
Bea R G (1997b) Risk Based Oceanographic and Earthquake Load amp Resistance Factor Criteria for Design and Requalification of Platforms Offshore Indonesia Report to Indonesian Petroleum Association Directorate General of Oil and Gas of Indonesia Pertamina and Bandung Institute of Technology Marine Technology and Management Group University of California at Berkeley
Bea R G (1997c) Risk Based Hurricane and Earthquake Criteria for Design and Requalification of Platforms in the Bay of Campeche Report to Petroleos Mexicanos Instituto Mexicano de Petroleo and Brown amp Root International Inc Marine Technology and Management Group University of California at Berkeley
Bea R G (1998) Continued Development of Earthquake Load and Resistance Factor Design Guidelines Report I - Concrete Gravity Base Structures LRFD Guidelines Report to the UK Health and Safety Executive Marine Technology and Management Group University of California at Berkeley
Beca Carter Hollings amp Ferner Ltd Indonesian Earthquake Study Seismic Zones for Building Construction in Indonesia 1979
Borcherdt R D (1994) Estimates of Site-Dependent Response Spectra for Design (Methodology and Justification) Earthquake Spectra The Professional Journal of the Earthquake Engineering Research Institute Vol 10 No 4 Nov
Bozorgnia Y Niazi M and Campbell K W (1995) Characteristics of Free-field Vertical Ground Motion during the Northridge Earthquake Earthquake Spectra Vol 11 No 2 Earthquake Engineering Research Institute Oakland California
Bray J D Chameau J-L and Guha S (1997) Seismic Response of Deep Stiff Clay Deposits Proceedings of the 5th International Conference on Earthquake Engineering Earthquake Engineering Research Center University of California at Berkeley
Chavez M (1987) Analisis de Riesgo Sismico en Varios Sitios de a Bahia de Campeche Elaborado para IMP Proy 6734 Mexico City MX
Chavez M (1997a) On the Seismic Hazard of the Campeche Bay Region Prepared for Meeting About the PEMEX Transition Normativity for the Bay of Campeche Berkeley CA March
Chavez M (1997b) Seismic Hazard and Design Spectra for Southern Gulf of Mexico 16th International Conference on Offshore Mechanics and Arctic Engineering OMAE 97
39
Proceedings of Earthquake Criteria Workshop Recent Developments in Seismic Hmard and Risk Assessments for Port Harbor and Offshore Structures Yokohama Japan April 17 American Society of Mechanical Engineers New York NY
Chavez M (1997c) Seismic Hmard at Sites of the Campeche Bay for the Risk Assessment of PEMEX Offshore Facilities Report to PEMEX and IMP August 10 Mexico City Mexico
Chavez M (1998) Seismic Hazard at Sites of the Campeche Bay for the Risk Assessment of PEMEX Offshore Facilities risks and Seismic Design Spectra in Areas of the Bay of Campeche Report to Petroleos Mexicano Instituto Mexicano de Petroleo and Brown amp Root International CISIND Col Jardines de Ajusco Talapan DP Mexico
Crouse CB and Quilter J (1991) Seismic Hazard Analyses and Development of Design Spectra for Maui A Platform Proceedings of the Pacific Conference on Earthquake Engineering Auckland New Zealand
Crouse C B and McGuire J W (1997) Site Response Studies for Purpose of Revising NEHRP Seismic Provisions Dames and Moore Consultants Seattle Washington
Dames amp Moore 1992 Final Report Seismic Hazard Evaluation Offihore Northwest Java Indonesia Report to Maxus Southeast Sumatra Inc Atlantic Richfield Indonesia Inc
Dames and Moore Seismic Risk and Site Response Study Proposed Rajah Platform East Kalimantan Indonesia Report No 02310-004-75 Report to Unocal Corporation
Dobry R (1991) Soil Properties and Earthquake Ground Response Proceedings of the Tenth European Conference on Soil Mechanics and Foundation Engineering Associazione Geotecnica Italiana Florence Italy
Dolan D K Crouse C B and Quilter J M (1992) Seismic Reassessment of Maui A Proceedings ofthe Offshore Technology Conference OTC 6934 Society of Petroleum Engineers Richardson Texas
EQE International Ltd ( 1998) Seismic Hazard Mapping of Offshore Britain Report to Health and Safety Executive London UK
Guerra R and Esteva L (1978) Espectros de Diseno Sismico en Paraiso Tab y Cuidad de Carmen Camp Patrocinado por Proyectos Marinos S A Instituto de Ingenieria UNAM Mexico City DP
Guzman R (1982) Bases de Riegso Sismico y Espectros de Riesgo Uniforme de la Bahia de Campeche Preparado para Instituto Mexicano de Petrroleo Proyectos Marinos Mexico DP
Lamport W B 1992 Seismic Analyses of Indonesias Rajah Wellhead Platform Unocal Corporation Science and Technology Division Project Report 91-23
Martin G R and Dobry R (1994) Earthquake Site Response and Seismic Code Provisions National Center for Earthquake Engineering Research Bulletin Vol 8 No 4 Buffalo New York
NORSAR and Norwegian Geotechnical Institute (1998) Seismic Zonation for Norway Report to Norwegian Council for Building Standardization
Norwegian Geotechnical Institute (1998) Effects of Local Soil Response on Earthquake Loading Report to Norwegian Council for Building Standardization
Nozu A and Iai S (1997) Seismic Hazard in Coastal Areas of Japan Proceedings of Earthquake Criteria Workshop Recent Developments in Seismic Hazard and Risk Assessments for Port Harbor and Offshore Structures Port and Harbor Research Institute Japan
40
Nozu A Uwabe T Sato Y Ichii K and Iai S (1997) Attenuation Relations for Peak Ground Motions on Base Layer in Japan Proceedings of Earthquake Criteria Workshop Recent Developments in Seismic Hazard and Risk Assessments for Port Harbor and Offshore Structures Port and Harbor Research Institute Japan
Risk Engineering Inc 1992 Seismic Hazard Analysis for the Offshore Kalimantan Sites Indonesia Report to Unocal Corporation March 27
Sleefe G E (1990) The Long-Term Measurement of Strong-Motion Earthquakes offshore Southern California Proceedings Offshore Technology Conference OTC 2345 Society of Petroleum Engineers Richardson Texas
Smith C E ( 1997) Dynamic Response of a Steel-Jacket Platform Subject to Measured Seafloor Earthquake Ground Motions Proceedings Eighth International Conference on the Behavior of Offshore Structures Vol 3 Pergamon Elsevier Science Ltd Oxford England
Untung M Buyung N Kertapi E Undang N Allen C R 1985 Rupture Along the Great Sumatran Fault Indonesia During the Earthquakes of 1926 and 1943 Bulletin of the Seismological Society of America Vol 75
Utsu T (1982) Catalog of Large Earthquakes in the Region of Japan from 1885 through 1980 Bulletin ofEarthquake Research Institute University of Tokyo Vol 57 pp 401-463
41
this page left blank intentionally
42
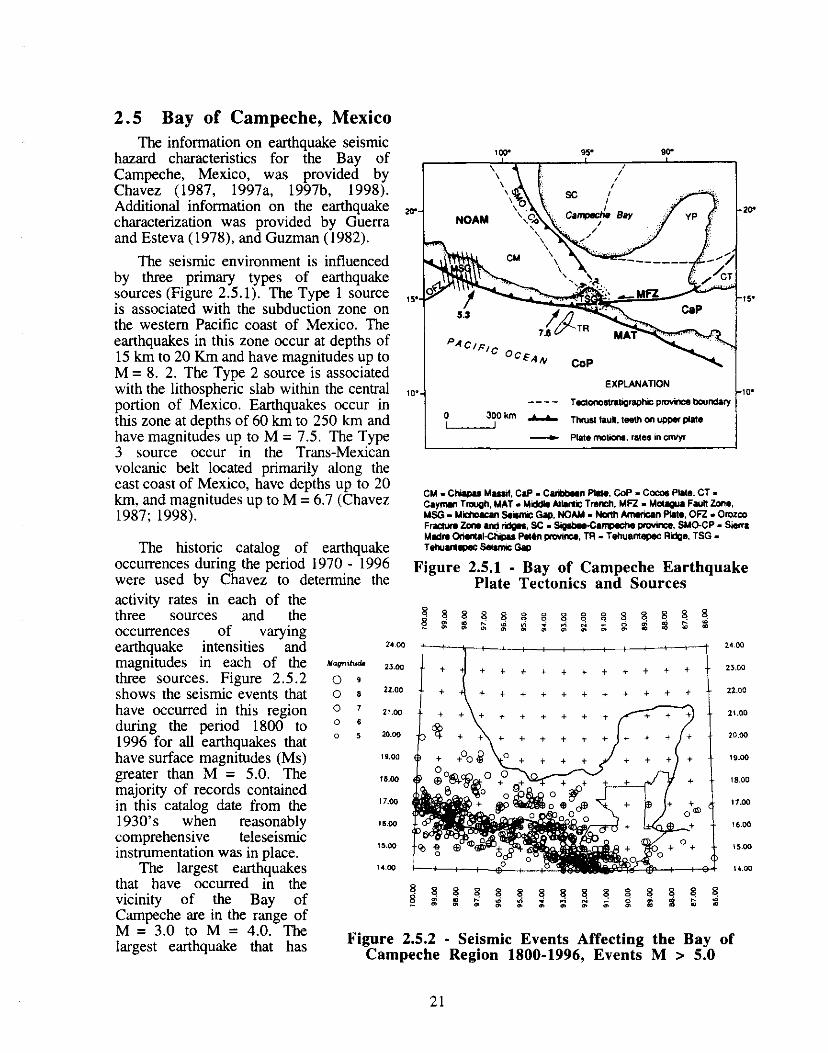
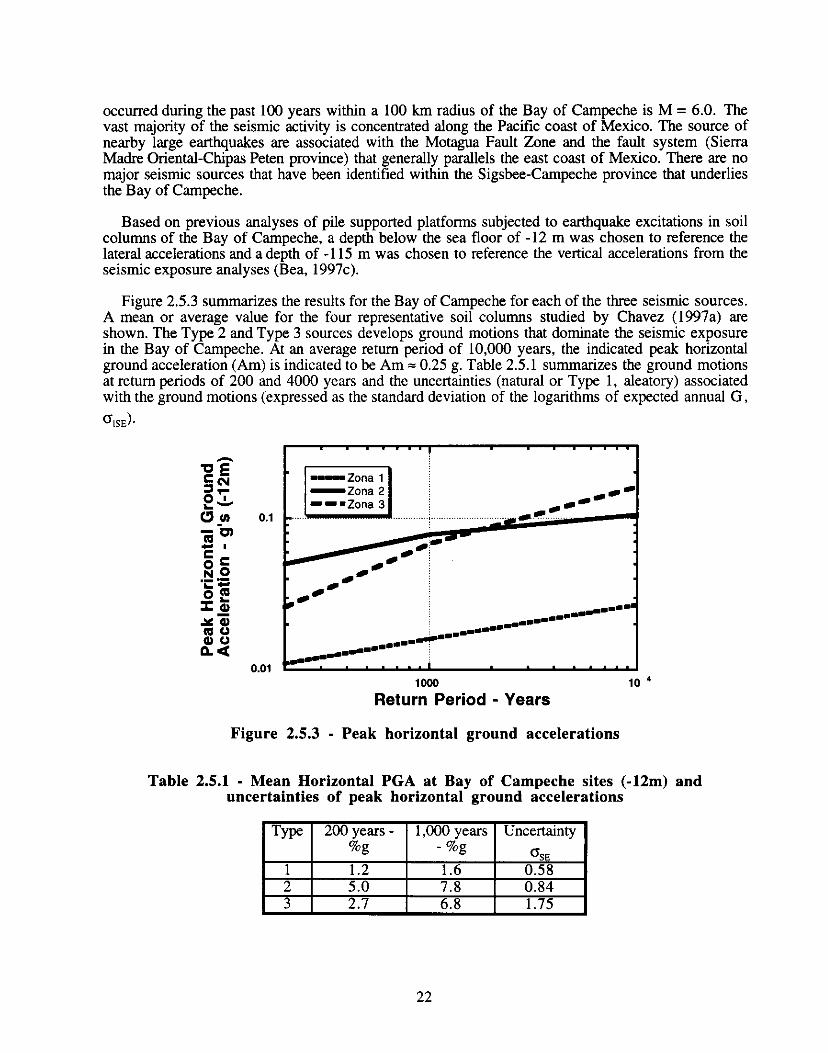
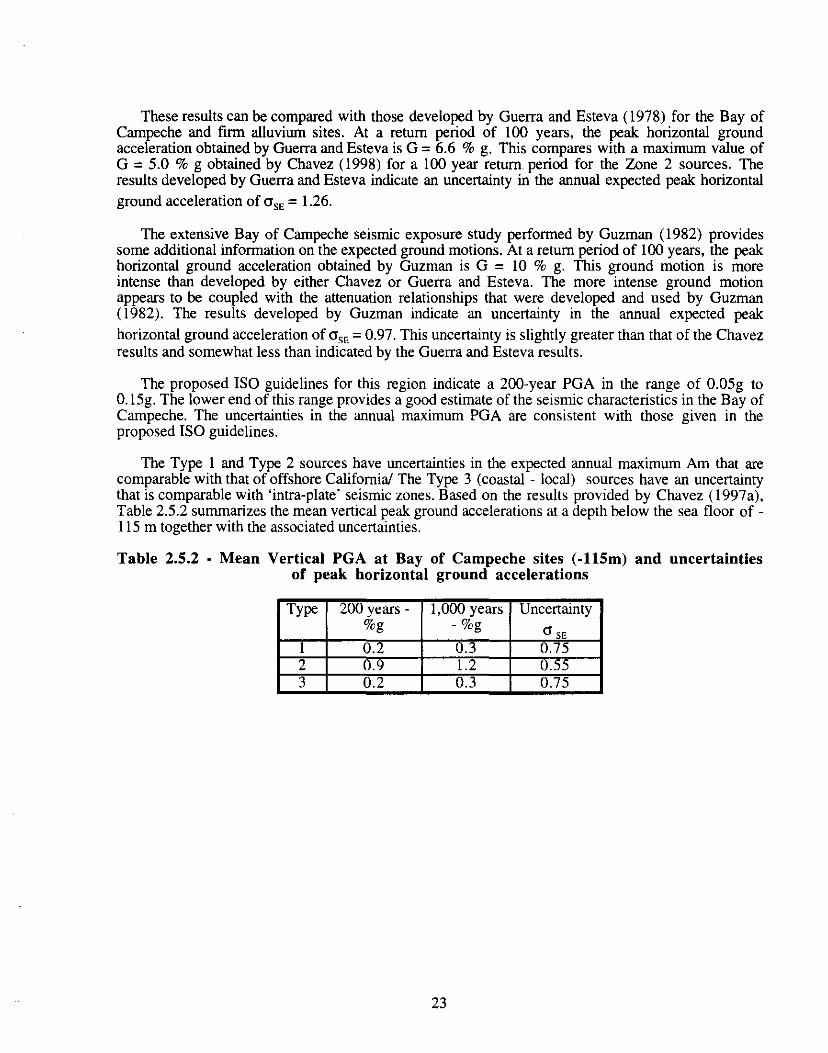

this page left blank intentionally
24
Strength Level Earthquake Response Spectra
30 Introduction Strength Level Earthquake (SLE) elastic response spectra were assessed in the several of the
studies of regional seismicity discussed in Chapter 2 The SLE response spectra developed for each of these regions will be summarized in this Chapter In addition results from recent general studies of response spectra will be summarized including consideration of water column effects on vertical motions
3 1 Response Spectra Ordinates Recent studies of response spectra ordinates in the low period range (01 sec to 03 sec) have
indicated that one should expect that these ordinates will vary as a function of both the local soil conditions (soil column classification)and intensity of earthquake motions (Martin Dobry 1994 Crouse McGuire 1997) Figure 31l summarizes the results from the study by Crouse and McGuire of the median amplification factors (Fa = peak horizontal ground acceleration at surface I peak horizontal ground acceleration on rock= PGAs I PGAr) for periods (T) in the range of T = 01 sec to 03 sec
The site soil conditions indicated as SC-A B C and D correspond to those in the proposed ISO guidelines The amplification factor in this period range presently incorporated into the proposed ISO guidelines is Fa= 25 for all soil conditions These results indicate substantially larger amplifications in the short period range While these findings would relatively unimportant for the lateral motions of most offshore platforms (T = 2 to 3 sec) the effects would be potentially important for the vertical motions (T = 01 to 03 sec) of these structures (particularly for heavily loaded deck structures with large cantilevers) The National Center for Earthquake Engineering Research (NCEER) workshop defined a comparable range of amplification factors for this period range (Martin Dobry 1994)
As a result of these findings the following modifications to the proposed ISO earthquake guidelines are proposed The elastic design
tf 55 0 5 uu ~
SC-Aftl Ill ~ - S111 seaLI 111 45 CM -bullmiddotsec0 SC-0middot-Cl 4 iii 0 ~tbull~bullFbull~bullbull~~middotmiddotmiddotmiddotmiddotr-Eu
35
Qci -~-11--~---F=--- --imiddot-- middotmiddotmiddotmiddotmiddotmiddotmiddotmiddotmiddotmiddot---- -middotmiddot------ ---1-----shyE II 3
lt1shyCJ~ 25 -----middot----middot-----c ~
2 CJ 01 015 02 025 03 035 04
Peak Ground Acceleration - gs
Fig 311 - Amplification factors as function of acceleration level and soil conditions
25
response spectra (Figure 312) would 10 - - - --~ be a function of the following variables
Sa I G = vbull T = period of system
bull D = damping of system
bull v = site classification factor for short period range (new factor)
~ Sa I G =~Tla___~
bull I = site classification factor for 0=5long period range L------__________bull E =seismotectonic conditions 01
001 01 1
Period - T (sec) Table 3 11 summarizes the elastic
design response spectra characteristics Fig 312 bull Proposed elastic design responsebased on the results of the work by spectra Crouse and McGuire (1996) and the previous work incorporated into the proposed ISO design response spectra
Table 311 - Local geology and soil conditions parameters for SLE response spectra
Soil 1-ondibons Se1smotectonic Lond1tions
Site 1-lass v I E
SC-A 25 10 Type A 10
SC-B 33 12 TypeB 08
SC-C 35 14 TypeC 09
SC-D 45 20 TypeD 08
SC-E Site specific studies required Detault value 10
3 2 Vertical Response Spectra Ordinates Several recent large magnitude earthquakes have indicated that vertical ground motions can be
equal to or greater than the horizontal ground motions This observation has been particularly true for ground motions close to the epicenter of large magnitude earthquakes The present ISO guidelines prescribe an elastic design response spectrum for vertical motions that is one-half of the horizontal motions
Figure 3 21 summarizes results from a recent study of the ratios of vertical to horizontal spectral ordinates as a function of the response frequency (Bozorgnia Niazi Campbell 1995) Results for the Loma Prieta and Taiwan earthquakes are shown The ratios indicated are mean values The horizontal line indicated at the ratio of 23 references the present Uniform Building Code (UBC) specifications For near-by earthquakes (R = l 0 km) the ratio of the vertical to horizontal spectra ordinate for periods
26
in the range of T = 01 sec are in the range of 14 to I7 The ratio is close to unity at distances of R = 20 km to 30 km Comparable results have been found for other large magnitude earthquakes in other sernismotectonic zones
For periods in the range of T = 2 to 3 sec the ratios are in the range of 02 to 03 for all distances Current studies of recordings from different earthquakes generated by different types of seismotectonic environments indicates that these trends are very likely to be universal (Bozorgnia Niazi Campbell 1995) These results show the problems that are associated with specifying a constant ratio of vertical to horizontal spectra ordinates for all periods and distances The results indicate that the horizontal and vertical spectra have decidedly different shapes
The authors application of these results to the unmodified 1 ISO response spectra is illustrated in Figure 322 The present proposed ISO horizontal and vertical response spectra for Site Classification C (firm alluvium v = 35 I= 14) and Type A seismotectonic
conditions (shallow crustal faulting E = 1 ) For periods greater than about 03 sec the unmodified vertical response spectra have ordinates that are less than the present proposed ISO guideline vertical spectra For periods Jess than 03 sec the unmodified ordinates are substantially larger
The foregoing results have been developed based on earthquake ground motion measurements that have been made on land Measurements of ground motions offshore have indicated that the presence of the water column can have a marked influence on the sea floor motions (Smith 1997 Sleefe 1990) The measurements indicate that the vertical motions at the sea floor are much less than would expected based on on-land measurements For mat supported structures that receive the majority of their input motions from soils that are located near the sea floor this can be an important consideration
For vertically incident earthquake compression waves the ratio of the reflected to the incident wave amplitude at the ground
1 unmodified for water column effects
Loma Prieta EQ Stitt Soll Sites 16
14
0
i ~
12
10
08
~ 08
~ 04
02
00
SMART-1 Array Taiwan Mag 70
(a)
Rbull10 km
Rbull20 km
R-40 km -------213
18
i
16
14
0 12
( i 10I
08
-~ 06 ~
gtbull 04
02
00
(b)
Rbull10 km
Rbull30 km
-------213RafiO km
001 010 100 1000 Period (sec)
Fig 321 - Ratio of Vertical to Horizontal Elastic Response Spectra Ordinates
UJ
01 _____ ______~
1SO Horizontal-II bullVertical -+bullISO Vertical
-----middot
D = 5
001 01
Period - T (sec)
Fig 322 - Horizontal and Vertical Elastic Response Spectra for SC-C E = 10
27
-+-ISO Vertical
bullC
surface is a function of the impedance ratio IR at the ground surface
IR= ps Vspa Va
where pis the mass density of the soil (s) and air (a) and V is the compression wave velocity in the two media On land this impedance ratio is very large and one would expect almost total reflection of the energy at the ground surface This would indicate a doubling of the amplitude of the incident compression waves at the ground - air interface
In water the compression wave velocity in the water and in the water saturated sediments would be almost the same The density difference would be a factor of about 2 This would indicate that about 50 of the compression wave would be transmitted through the interface and the remaining 50 would be reflected The total wave amplitude at the interface would be 15 times the incident amplitude or 75 of the amplitude expected at an air - soil interface
This analysis assumes that the water is infinitely deep and ignores the reflection of the incident compression waves at the water - air interface Crouse and Quilter ( 1991) developed an analysis that includes the finite water column effects Depending on the water depth some frequencies can be reinforced and amplified by the finite water depth while others can be canceled The analyses performed by Crouse indicates that the peak vertical accelerations at the sea floor can be reduced by as much as 50 (Crouse Quilter 1991 Dolan Crouse Quilter 1992 Smith 1997 Sleefe 1990) These observations are in agreement with the analyses of recorded earthquakes at the sea floor reported by Smith ( 1997) and Sleefe ( 1990)
The earthquake ground motions in the vicinity of the sea floor are the result of a very complex variety of wave forms frequencies and incidence angles Thus the foregoing simplified analyses can be relied upon only to provide some insights into the potential effects of the water column on the vertical movements at the sea floor Measurements of earthquake movements at the sea floor provide the only reliable source of information to quantify these effects The measurements that are available confirm the inferences that have been drawn based on simplified analyses
Figure 323 summarizes the results for the water column modified vertical response spectra compared -bullbullModified (x05) Vertical
D =5 Modified (x 075) Vertical with the present ISO vertical response
spectra The present ISO vertical response spectra provides a conservative envelope to the modified vertical spectra for periods greater ~ 1 ~
~than about 02 sec However the ftl bull-----117 present ISO vertical response spectrum is somewhat unconservative ifor periods less than about 02 sec
SC-C v = 35 1J1 = 14 E = I ~ bullUntil better information becomes available it is the authors conclusion 01
that the present proposed ISO 001 01 1 guidelines for vertical response Period - T (sec) spectra provide a reasonable arid likely somewhat conservative Fig 323 - Water Column Modified Vertical approximation to the vertical Response Spectra movements that can be expected in the vicinity of the sea floor
28
33 Computed Response Spectra Most current seismic exposure analyses and evaluations characterize the earthquake ground
motions on a rock or very firm alluvium surface Then often one-dimensional shear beam type analyses are performed to characterize the earthquake ground motions within the soil column that overlies the rock or very firm alluvium surface A variety of soil constitutive models can be used in these analyses but most often equivalent linear models are used with modifications introduced to model the soil non-linear stress-strain behavior and the changes in this behavior with cyclic strains Damping is generally introduced as an equivalent viscous damping (Dobry 1991 ) The bottom boundary of the soil column at the rock interface is generally characterized with an absorbing boundary element to prevent unrealistic trapping of the earthquake energy in the soil column due to reflections of the energy at the rock interface
Relative to the ISO earthquake guidelines this practice raises issues regarding the uncertainties and biases that can be introduced by different analyses of soil column effects The ISO guidelines do not include any definitive information on how such analyses should be performed There is a very wide range in how such analyses are performed and how the soil column analyses are performed can have extremely important effects on the earthquake ground motions that are utilized in analyses of the soil shystructure interactions
Fig 33 l summarizes earthquake acceleration response spectra from four locations in Mexico City based on recordings obtained during the 1985 earthquake (Seed 1987) The soft clay soil column has discernible effects on the shapes of the response spectra and the magnitudes of the spectra ordinates The computed natural periods of the soil columns (Ts) at each of the locations is noted based on the relationship
Ts =4dVs
where dis the depth of the soil column and Vs is the soil shear wave velocity (appropriate for the soil strains induced by the earthquake) For a given soil column thickness the natural period of the soil column is controlled solely by the shear wave velocity The shear wave velocity is a function of the shear modulus which is a function of the cyclic shear strains induced in the soils by the earthquake Higher strains result in lower shear modulii and shear wave velocities
The response spectra exhibit definite peaks at the natural periods of the soil columns The noticeable increase in the response spectra energy associated with the 37 m depth site is likely due to reflected energy associated with the edge of the Mexico 75
rbullbull 4H37gt bull 2 sec City basin This basin 10------- 10---10---0--- edge influence would oat- UNAM CAOT J SCT CAF
08 08 08 not be incorporated in ss 06 5 orrpng bullbull gmost shear beam soil bullmiddot g 04t-
column analyses because the soil column 0o 1 2 3 5responses would be
T sec T sec T sec T secbased on the rock outcrop motions (in this case at the UNAM site)
0[~mJraquo middot~middot~middotmiddot 75~)~mbullEJ 3f==Soft Fig 332 l c~~aVbullSOOto900nVa middotsummarizes results
from SHAKE analyses
0606
04
06
04 JT
dego t 2 3 1 2 3 4 5
of motions at the soil surface identified as Fig 331 - Soil Conditions and Recorded Acceleration Spectra Oakland Outer Harbor During 1985 Mexico City Earthquake
29
(Bray et al 1996) during the 1989 Loma Prieta earthquake (epicenter about 70 km away) The soil profile consists of 156 m of alluvium (clays sands) overlying bedrock The shear wave velocity in this soil column ranged from 800 msec (alluvium at base of column) to 63 mis (Bay Mud) The soil column had an average shear wave velocity in the range of approximately 400 msec The response spectra indicates discernible peaks at 15 sec and about 06 sec Based on the results from testing of soil samples a soil damping ratio of l 0 to 20 was used
Response spectra from available strong motions recorded at nearby rock sites are shown in Fig 332 The response peak at 06 sec is obviously due to the energy in the input rock motions at this period The response peak at 15 sec is obviously due to the natural period of the soil column The spectral acceleration of the rock is amplified by a factor of about 4 at the 06 sec and 16 sec peaks of the soil column Given a peak spectral acceleration of 025 g in the input rock motion at the natural period of the soil column the peak spectral acceleration is
Rock mollon YBI (90 dovl ied lo OOlg
Rocordod mollon (305 dovgt Computed mollon
o
1 2 3 4 PERIOD seconds
middot Recorded and SHAKE
1
Cl
Fig 332 Computed Response Spectra (Oakland
Outer Harbor Loma Prieta Earthquake)
about 05 g representing a doubling of the peak in the spectral input motion Note that the computed motion of the soil column generally is somewhat less than the recorded motion
Fig 333 and Fig 334 summarize similar results for two other nearby locations The Oakland location consisted of 152 m of alluvium having shear wave velocities in the range of 800 msec to 120 msec The Emryville location consisted of 137 m of alluvium having a similar range in shear wave velocities In these cases the amplifications of the rock motions at a period of 06 sec were about 3 and at a period of about 15 sec were about 4 The peak input spectral acceleration of 020 g to 025 g was magnified at the natural period of the soil column by a factor of about 2 Again the SHAKE analyses tend to under predict the ground motions at the natural period of the soil column but predict the amplifications reasonably well at the earthquake input peak energy period of about 06 sec
These results indicate that the SHAKE analytical model and the associated characterizations of the soil stiffness and damping has a bias in the range of B = 15 to 20 for the natural period of the soil columns Other similar results need to be developed before definitive statements can be made
Rock mollon YBI (90 dogl ied lo OOlg Rocordod mollon (290 dovgt06 11ecorded motion (200 deg)
Cl Compulod mollon
Demplng 5
0 1 2 3 PERIOD seconds
Fig 333 bull Recorded and SHAKE Computed Response Spectra (Oakland Loma Prieta
Earthquake)
30
4
concerning the biases associated with the soil column analyses
The amplification of the earthquake input acceleration on rock at the surface of the soil column can be evaluated approximately from (Dobry 1991)
A= [as I ar lmax =II I + (1t 12) D5 I
where A is the ratio of the maximum acceleration at the soil surface as to the input acceleration at the rock interface ar I is the impedance ratio of the rock - soil interface D5 is the soil damping ratio The soil - rock impedance ratio is
I= (pr I ps) (Yr I Vs)
where pr is the density of the rock ps is the density of the soil Yr is the shear wave velocity of the rock and Vs is the shear wave velocity of the soil The velocity ratio would generally be in the range of 5 to 30 and the density ratio in the range of II to 15 Thus the impedance would generally be in the range of 5 to 50 The soil damping ratio could be expected to be in the range of 005 (low
I
Rocle mollon YBI llO dog) Recordod mollon (350ltMg)0
Cl
0
Ar Compulodmodan bull I
DomplngS
middotmiddot~_ -~
1 2 3 PERIOD seconds
Fig 334 - Recorded and SHAKE Computed Response Spectra (Emryville Loma Prieta
Earthquake)
strains) to more than 03 (high strains) Fig 335 summarizes the results of this development Except for very low impedance impedance is not an extremely important element However damping is very important The use of low strain damping ratios in the range of 5 to I 0 result in amplifications that are a factor of 4 to 5 times those for damping ratios in the range of 25 to 30
The Loma Prieta site results summarized earlier had a velocity ratio in the range of 7 to 9 a density ratio in the range of I I to 12 This would indicate an impedance in the range of 8 to 11 Given an amplification of the input rock acceleration of about 2 at these sites a damping ratio in the range of 20 to 30 is indicated This damping is much higher than indicated from the laboratory triaxial and resonant column tests 12Often this has been found to be true and it has been postulated that the under-estimated c( 1 0 damping is due to the laboratory testing boundary conditions c 80
Studies are currently being conducted to ~ 6better characterize the bias and uncertainties
associated with analyses of soil column e 4response characteristics during intense Q
earthquakes These studies are attempting to E 2c(account for the different methods that can be used to characterize the soil properties and the 0input earthquake excitations Results from these studies will be monitored by the author
-D=Soo Impedance- bull0=10dego - bull bull0=15dego t--r~-~-~-~--- bullbullbullbullbullD=20dego
~middot0=30oomiddotmiddotmiddotmiddotmiddot0=251middot=~~-
10 20 30 40
and their implications integrated into future revisions of the proposed ISO guidelines Fig 335 - Soil Surface Amplification of
Bed Rock Acceleration
31
4
50
34 North Sea Response Spectra Elastic response spectra for North Sea
seismotectonic and hard ground - rock conditions were developed as part of the EQE International study (1998) and the NORSAR study (1998) Fig 341 summarizes the normalized response spectra results for a 5 damping ratio from the EQE study for return periods of 100 years 1000 years and 10000 years The response spectra do not vary significantly as a function of the intensity of the earthquakes in this range This is to be expected since the hard ground shyrock materials respond essentially in their low-strain reasonably elastic range The peak amplification of the spectra is approximately 25
In the EQE study it was noted that the spectra could be modified for other values of damping by the factor K (Woo et al 1988)
K = 148 - 030 In D
This response spectrum modification factor was compared with that contained in the proposed ISO guidelines It was found that the modification factors are essentially identical for damping ratios less than about 20 and above 20 only differ by about 10
I 1000
100
~ ~ 6 -g 10
~
01
01 10 100 100
Undamped Natural Frequency (Hz)
Fig 341 - Earthquake Response Spectra for UK Sector Conditions
Fig 342 summarizes the response spectra from the NORSAR study (1998) for a return period of 10000 years at low seismic activity (Alta) and high seismic activity (Midgard) sites for rock or hard ground conditions The shapes of the spectra are essentially identical
1 1 FREOUENCY (HZ)
a 1u
Fig 342 - Earthquake Response Spectra for Norwegian Sector Conditions For Earthquake Return Period of 10000 years and Rock - Hard Ground
32
Fig 343 and Fig 344 summarize results from the study of soil column effects on the rock spectra performed by the Norwegian Geotechnical Institute (1988) as part of the NORSAR study ( 1988) Soil column characteristics were based on results from soil exploration - soil boring - laboratory jtesting performed at North Sea platform locations and onshore Norway locations The earthquake response analyses were performed using the SHAKE computer program discussed earlier The soil columns were organized into two different categories Soil Type B - shallow firm alluvium and Soil Type C - deep firm alluvium Recorded earthquake time histories characteristic of those expected for the Norwegian
01 10 100seismotectonic conditions were used as input to the soil column analyses Frequency (Hz)
The amplification factors for the Soil Type Fig 343 Computed Earthquake Response B profiles has a definite peak in the period Spectra Amplification Factors for Deep range of 005 sec to 01 sec The peak Alluvium Soil Conditions (Soil Type C) amplifications range from about 25 to as high The Coefficient of Variation (COY) of the peak amplification factors is approximately 20 ( ~
crG5) The COY suggested in the proposed ISO guidelines is 30 The range of results shown in Fig 343 represents the range of results between different sites not the range of results that reflect variations in the soil characteristics for a given site
The amplification factors for the Soil Type C profiles has a definite peak in the period range of 0 5 sec to 1 sec The peak amplifications range from about 25 to almost 6 The Coefficient of Variation (COY) of the peak amplification factors is approximately 30 The COY suggested in the proposed ISO guidelines is 40
Fig 345 summarizes the mean soil response spectra amplification factors for the two different soil column conditions The mean peak soil amplification factor for Soil Type B is 3 and the same factor for Soil Type C is 3 5 These results are in excellent agreement with those summarized in Table 311 These results confirm the need to have a factor that modifies the magnitude of the peak in the response spectra as a function of the soil conditions
The NORSAR study also addressed the 01 10 100
vertical motion spectra and concluded that the Fraqubullcy (Hz) ratio of the spectral ordinates (VH) was frequency (f) dependent In the vicinity of the Fig 344 - Computed Earthquake peak of the horizontal response spectrum (f = 1 Response Spectra Amplification Factors to 3 Hz) the recommendation was that the ratio for Shallow Alluvium Soil Conditions should be determined as follows (Soil Type B)
1400
300 +----+--+-+-r-tishy
200 +---+---+-middot
7
6
2
0
I
33
VH = 09 - 042 log (f)
For f =1 Hz VH =09 These results are in reasonably good agreement with those summarized in Fig 322 Based on the information provided in the NORSAR study it is understood that these results are for the surface of the soil column and do not incorporate the effects of the overlying water column Future studies of the vertical response spectra at the sea floor should take account of these effects
400
300~
~ c 0 ~ 2005 E Q
100~
000
010
Fig 345 middot Recommended Earthquake Response Spectra Mean Amplification Factors for Deep Alluvium Soil Conditions (API Soil Type C)
100 1000 10000 Frequency (Hz)
Sc w ) ~
I
I I
~
v Soll Ty1 bull
) 1
34
35 Bay of Campeche Spectra Chavez (I997a l 997b) performed a number of site response studies for the Bay of Campeche
using the computer program SHAKE Results from recently performed high quality soil borings and laboratory static and dynamic testing programs were used to characterize the strength stiffness damping and hysteretic performance characteristics of the soils The soils consist of deep (100 m to 200 m) firm alluvium (layered calcareous sands silts and clays) Chavez introduced the deconvolved input motions from the three types of earthquakes at the base of the soil columns and determined the output motions close to the sea floor (at -12 m appropriate for lateral motions characterizations for piles) and at significant penetrations below the sea floor ( -100 m appropriate for vertical motions characterizations
Results for the 200-year horizontal Strength Level Earthquake (SLE) conditions ( -12 m) for a variety of sites in the Bay of Campeche are summarized in Figures 351 352 and 353 for Type I (very distant subduction zone) Type II (distant mixed zone) and Type III (nearby surface faulting zone) earthquakes respectively The Type I earthquake produces a peak in the ground motions at a period of about 3 sec that represents the long-period energy from these distant subduction zone earthquakes that coincides with the natural period of the soil column The Type II earthquake produces a set of response spectra with multiple peaks in the range of 0 3 sec to 3 sec The Type II earthquake produces a much more conventional spectrum with peaks in the range of 02 to 08 sec
The resulting mean response spectra for these three types of earthquake conditions is summarized in Fig 354
bullbull
bullbull
bullI
~~
1
~ (
~w - ~
- Fig 351 - Type I 200-year Earthquake Computed
Response Spectra
bullbull
bullbull
bull i j0 bull -
~~ ~middotg- - ~~middotshy -
I I bull
Fig 352 - Type II 200-year Earthquake Computed Response Spectra
35
bull
bull
together with the mean plus one standard deviation and envelope spectra Chavez included the range in response spectra results that developed from plus and minus one standard deviation changes in the soil shear modulus and damping characteristics The COY of the peak response spectra values is about 100 This high uncertainty reflects the influences of the three different types of seismic sources different soil characteristics at different sites and the effects of plus and minus one standard deviation ranges in the soil properties at the different sites Given a location that is affected by multiple types of earthquake sources it would be preferable to define different response spectra associated with these sources rather than combine them into a single response spectrum
These results clearly indicate that the dominant horizontal and vertical motions important to the pile foundations of the platforms in the Bay of Campeche are associated with the Type II earthquake source At a period of 1 sec (predominant natural period of platforms in Bay of Campeche) the Type II earthquake source produces horizontal motions at a penetration of -12 m that are a factor of about 10 greater than those for the Type I and Type III sources
In general these results are in good agreement with the proposed modifications to the ISO SLE response spectra
bull
middot~
0JO
Imiddot~ 016
1110
f 016
010
~ -~middot)
Ar
~I~ -
I I I
Fig 353 - Type III 200-year Earthquake Computed
Response Spectra
I I
I
I I
I [I
I I
I
I
-~-~ Fig 354 bull 200-year Mean Mean Plus One Standard
Deviation and Envelope Response Spectra
36
Summary Conclusions amp Acknowledgments
40 Summary The objective of this study was to continue development of earthquake load and resistance factor
design (LRFD) guidelines with a study of results from recent seismic hazard characterizations This study addressed two primary topics
a) seismic zonation of the UK and Norwegian Sectors of the North Sea offshore Japan and Indonesia and the Bay of Campeche Mexico and
b) Strength Level Earthquake (SLE) response spectra
This study was organized as follows
bull obtain recent background on seismic hazard characterizations
bull detail seismic exposure uncertainties and local site response uncertainties
bull reconcile differences between current ISO seismic hazard guidelines and those developed during this study
bull document the revised seismic hazard and response spectra characterizations in a project technical report
Results from current seismic exposure studies of the UK and Norwegian Sectors of the North Sea indicate SLE rock PGA in the range of 0015 g to 008 g and seismic uncertainties in the range of crE = 15 to 17
Results from current seismic exposure studies for the Japan coastal and offshore areas indicate SLE rock PGA in the range of 005 g to 05 g and seismic uncertainties in the range of crE = 08 to 10
Results from current seismic exposure studies for the Indonesia coastal and offshore areas indicate
SLE rock PGA in the range of 005 g to 035 g and seismic uncertainties in the range of crE =06 to 20 (lower end of range associated with subduction zone dominated sites)
Results from current seismic exposure studies for the Bay of Campeche Mexico indicates SLE rock PGA in the range of 001 g to 005 g and seismic uncertainties in the range of crE = 06 to 18
Results from current studies of horizontal response spectra associated with SLE intensities indicates that the ISO SLE horizontal response spectra for periods in the range of about 01 sec to 05 sec should be modified (increased) to account for different types of soils Such modifications have been developed as a result of this study Results from region and site specific SLE horizontal response spectra generally are in good agreement with the proposed modified ISO response spectra
Study of information relating to the vertical ground motion spectra for on-land conditions indicate that the ratios of vertical motions to horizontal motions in the low period range (01 sec to 03 sec) for near-by earthquakes can be much greater than currently specified in the proposed ISO guidelines
37
However when the effects of the water column are taken into account combined with the proposed modifications to the horizontal response spectra in the period range of 01 sec to 05 sec the proposed modified ISO guidelines generally provide a conservative estimate of the vertical motion characteristics
4 1 Conclusions The results from this study indicate that the proposed ISO seismic exposure guidelines generally
provide a conservative estimate of the SLE PGA for the regions studied The current regional seismic exposure results provide the basis for updated North Sea Japan and Indonesia regional ISO seismic exposure maps (Fig 212 Fig 222 Fig 232 Fig 246)
The results from this study indicate that the proposed ISO guidelines for seismic exposure uncertainties associated with the different seismotectonic zones generally provide a conservative estimate of the uncertainties The current regional seismic exposure results provide the basis for updated North Sea Japan Indonesia and Mexico seismic exposure uncertainties
The results from this study indicate the need for modifications to the proposed ISO SLE horizontal response spectra in the period range of about 01 sec to about 05 sec Based on results from current response spectra studies proposed modifications that are a function of the type of soil column have been developed In general the proposed modified ISO SLE horizontal response spectra provide a conservative estimate of the expected SLE horizontal response spectra developed from detailed site specific studies The uncertainties associated with the response spectra ordinates as suggested in the proposed ISO guidelines provide reasonable characterizations for the different types of soil columns
The results from this study indicate that it is important to clearly identify the position in the soil column that are associated with the response spectra The positions should be those that characterize the positions that result in maximum input of motions or energy from the earthquake ground motions For pile supported structures these motions would be below the sea floor for lateral motions (eg 5 to 10 pile diameters) and along the lower one-third to bottom of the pile shaft for axial motions For mat supported structures these motions would generally be much closer to the sea floor but are still not generally at the sea floor itself These considerations are particularly important for specification of the vertical response spectra for both pile and mat supported platforms
The presence of the water column has important effects on the vertical motions at or very close to the sea floor These effects need to be accounted for when evaluations are developed for the vertical response spectra for these elevations Analysis of available information on vertical motions and the effects of the water column generally indicates that the proposed modified ISO guidelines provide a conservative characterization of the vertical motion effects
42 Acknowledgments The author would like to acknowledge the technical guidance and information provided by Dr Ove
Gudmestad of Statoil and Mr Mike Craig of Unocal Financial support for the second phase of this study was provided by Statoil and Unocal
The third phase of this study will be sponsored by the U S Minerals Management Service The third phase will address verifications of the proposed ISO guidelines based on site and platform specific results provided by the project sponsors
38
Australian Bureau of Mineral Resources Geology and Geophysics and Lamont-Doherty Geological Observatory of Columbia University Tectonic Map of the Indonesian Region Professional Paper 1078 Geological Survey oflndonesia
Bea R G (1992) Seismic Design and Requalification Methodologies for Offshore Platforms Proceedings of the International Workshop on Seismic Design and Requalification of Offshore Structures California Institute of Technology Pasadena CA Dec
Bea R G (l997a) Background for the Proposed International Standards Organization Reliability Based Seismic Design Guidelines for Offshore Platforms Proceedings of the Earthquake Criteria Workshop Recent Developments in Seismic Hazard and Risk Assessment 16th International Conference on Offshore Mechanics and Arctic Engineering Y okahama Japan (obtain proceedings from Port and Harbors Research Institute Yokuska Japan)
Bea R G (1997b) Risk Based Oceanographic and Earthquake Load amp Resistance Factor Criteria for Design and Requalification of Platforms Offshore Indonesia Report to Indonesian Petroleum Association Directorate General of Oil and Gas of Indonesia Pertamina and Bandung Institute of Technology Marine Technology and Management Group University of California at Berkeley
Bea R G (1997c) Risk Based Hurricane and Earthquake Criteria for Design and Requalification of Platforms in the Bay of Campeche Report to Petroleos Mexicanos Instituto Mexicano de Petroleo and Brown amp Root International Inc Marine Technology and Management Group University of California at Berkeley
Bea R G (1998) Continued Development of Earthquake Load and Resistance Factor Design Guidelines Report I - Concrete Gravity Base Structures LRFD Guidelines Report to the UK Health and Safety Executive Marine Technology and Management Group University of California at Berkeley
Beca Carter Hollings amp Ferner Ltd Indonesian Earthquake Study Seismic Zones for Building Construction in Indonesia 1979
Borcherdt R D (1994) Estimates of Site-Dependent Response Spectra for Design (Methodology and Justification) Earthquake Spectra The Professional Journal of the Earthquake Engineering Research Institute Vol 10 No 4 Nov
Bozorgnia Y Niazi M and Campbell K W (1995) Characteristics of Free-field Vertical Ground Motion during the Northridge Earthquake Earthquake Spectra Vol 11 No 2 Earthquake Engineering Research Institute Oakland California
Bray J D Chameau J-L and Guha S (1997) Seismic Response of Deep Stiff Clay Deposits Proceedings of the 5th International Conference on Earthquake Engineering Earthquake Engineering Research Center University of California at Berkeley
Chavez M (1987) Analisis de Riesgo Sismico en Varios Sitios de a Bahia de Campeche Elaborado para IMP Proy 6734 Mexico City MX
Chavez M (1997a) On the Seismic Hazard of the Campeche Bay Region Prepared for Meeting About the PEMEX Transition Normativity for the Bay of Campeche Berkeley CA March
Chavez M (1997b) Seismic Hazard and Design Spectra for Southern Gulf of Mexico 16th International Conference on Offshore Mechanics and Arctic Engineering OMAE 97
39
Proceedings of Earthquake Criteria Workshop Recent Developments in Seismic Hmard and Risk Assessments for Port Harbor and Offshore Structures Yokohama Japan April 17 American Society of Mechanical Engineers New York NY
Chavez M (1997c) Seismic Hmard at Sites of the Campeche Bay for the Risk Assessment of PEMEX Offshore Facilities Report to PEMEX and IMP August 10 Mexico City Mexico
Chavez M (1998) Seismic Hazard at Sites of the Campeche Bay for the Risk Assessment of PEMEX Offshore Facilities risks and Seismic Design Spectra in Areas of the Bay of Campeche Report to Petroleos Mexicano Instituto Mexicano de Petroleo and Brown amp Root International CISIND Col Jardines de Ajusco Talapan DP Mexico
Crouse CB and Quilter J (1991) Seismic Hazard Analyses and Development of Design Spectra for Maui A Platform Proceedings of the Pacific Conference on Earthquake Engineering Auckland New Zealand
Crouse C B and McGuire J W (1997) Site Response Studies for Purpose of Revising NEHRP Seismic Provisions Dames and Moore Consultants Seattle Washington
Dames amp Moore 1992 Final Report Seismic Hazard Evaluation Offihore Northwest Java Indonesia Report to Maxus Southeast Sumatra Inc Atlantic Richfield Indonesia Inc
Dames and Moore Seismic Risk and Site Response Study Proposed Rajah Platform East Kalimantan Indonesia Report No 02310-004-75 Report to Unocal Corporation
Dobry R (1991) Soil Properties and Earthquake Ground Response Proceedings of the Tenth European Conference on Soil Mechanics and Foundation Engineering Associazione Geotecnica Italiana Florence Italy
Dolan D K Crouse C B and Quilter J M (1992) Seismic Reassessment of Maui A Proceedings ofthe Offshore Technology Conference OTC 6934 Society of Petroleum Engineers Richardson Texas
EQE International Ltd ( 1998) Seismic Hazard Mapping of Offshore Britain Report to Health and Safety Executive London UK
Guerra R and Esteva L (1978) Espectros de Diseno Sismico en Paraiso Tab y Cuidad de Carmen Camp Patrocinado por Proyectos Marinos S A Instituto de Ingenieria UNAM Mexico City DP
Guzman R (1982) Bases de Riegso Sismico y Espectros de Riesgo Uniforme de la Bahia de Campeche Preparado para Instituto Mexicano de Petrroleo Proyectos Marinos Mexico DP
Lamport W B 1992 Seismic Analyses of Indonesias Rajah Wellhead Platform Unocal Corporation Science and Technology Division Project Report 91-23
Martin G R and Dobry R (1994) Earthquake Site Response and Seismic Code Provisions National Center for Earthquake Engineering Research Bulletin Vol 8 No 4 Buffalo New York
NORSAR and Norwegian Geotechnical Institute (1998) Seismic Zonation for Norway Report to Norwegian Council for Building Standardization
Norwegian Geotechnical Institute (1998) Effects of Local Soil Response on Earthquake Loading Report to Norwegian Council for Building Standardization
Nozu A and Iai S (1997) Seismic Hazard in Coastal Areas of Japan Proceedings of Earthquake Criteria Workshop Recent Developments in Seismic Hazard and Risk Assessments for Port Harbor and Offshore Structures Port and Harbor Research Institute Japan
40
Nozu A Uwabe T Sato Y Ichii K and Iai S (1997) Attenuation Relations for Peak Ground Motions on Base Layer in Japan Proceedings of Earthquake Criteria Workshop Recent Developments in Seismic Hazard and Risk Assessments for Port Harbor and Offshore Structures Port and Harbor Research Institute Japan
Risk Engineering Inc 1992 Seismic Hazard Analysis for the Offshore Kalimantan Sites Indonesia Report to Unocal Corporation March 27
Sleefe G E (1990) The Long-Term Measurement of Strong-Motion Earthquakes offshore Southern California Proceedings Offshore Technology Conference OTC 2345 Society of Petroleum Engineers Richardson Texas
Smith C E ( 1997) Dynamic Response of a Steel-Jacket Platform Subject to Measured Seafloor Earthquake Ground Motions Proceedings Eighth International Conference on the Behavior of Offshore Structures Vol 3 Pergamon Elsevier Science Ltd Oxford England
Untung M Buyung N Kertapi E Undang N Allen C R 1985 Rupture Along the Great Sumatran Fault Indonesia During the Earthquakes of 1926 and 1943 Bulletin of the Seismological Society of America Vol 75
Utsu T (1982) Catalog of Large Earthquakes in the Region of Japan from 1885 through 1980 Bulletin ofEarthquake Research Institute University of Tokyo Vol 57 pp 401-463
41
this page left blank intentionally
42
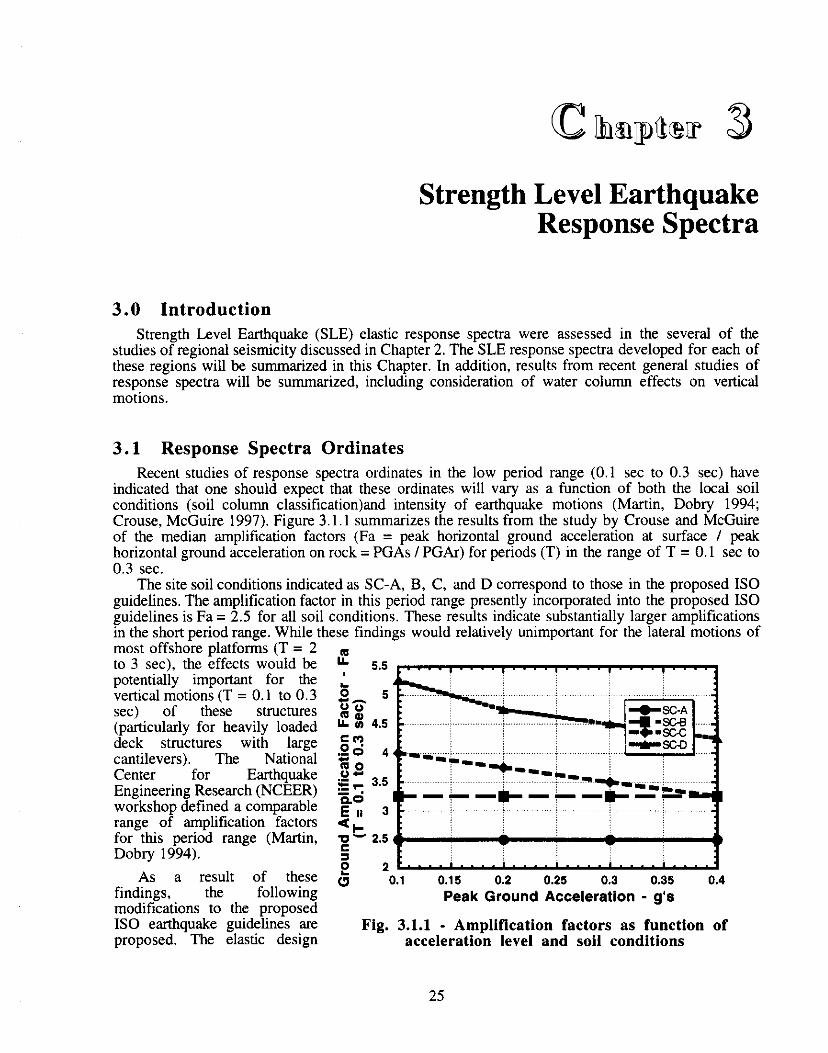
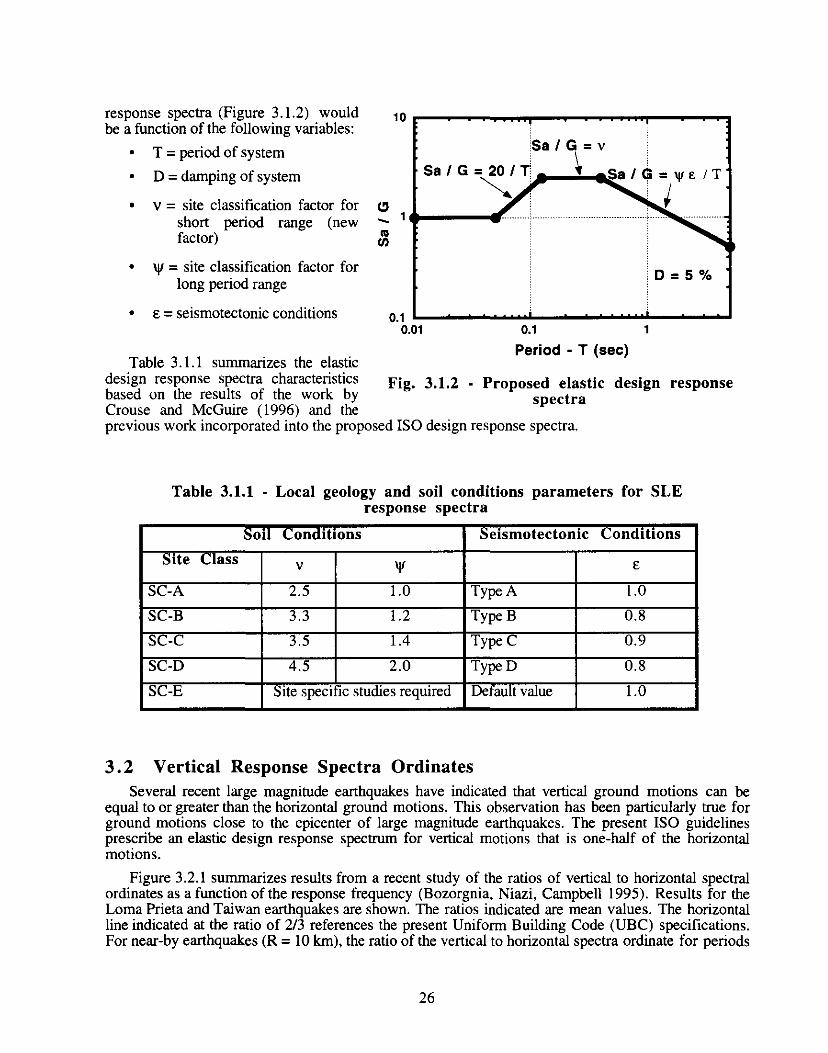
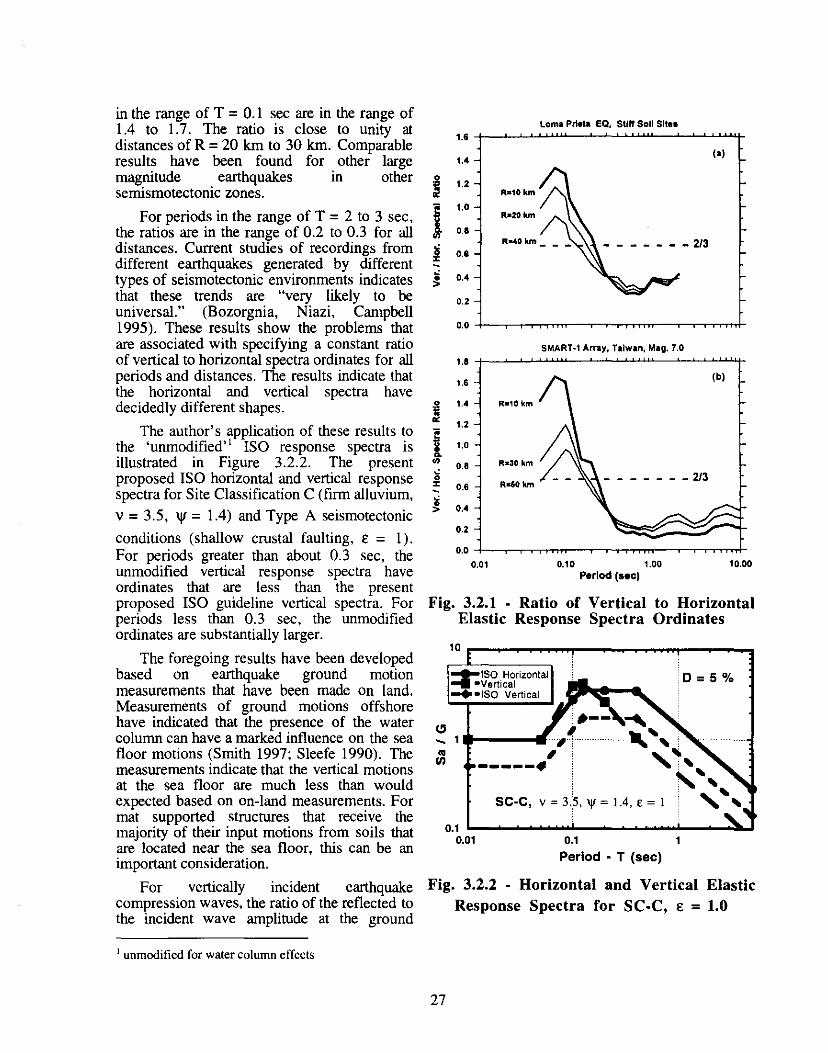
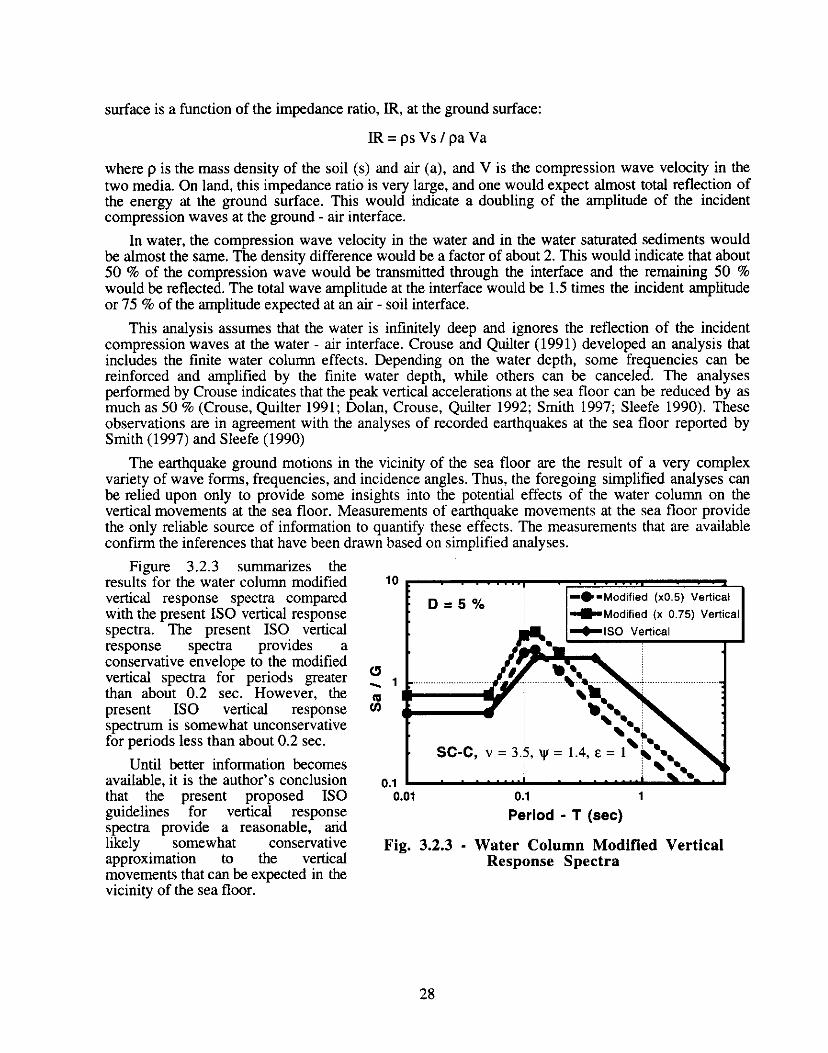
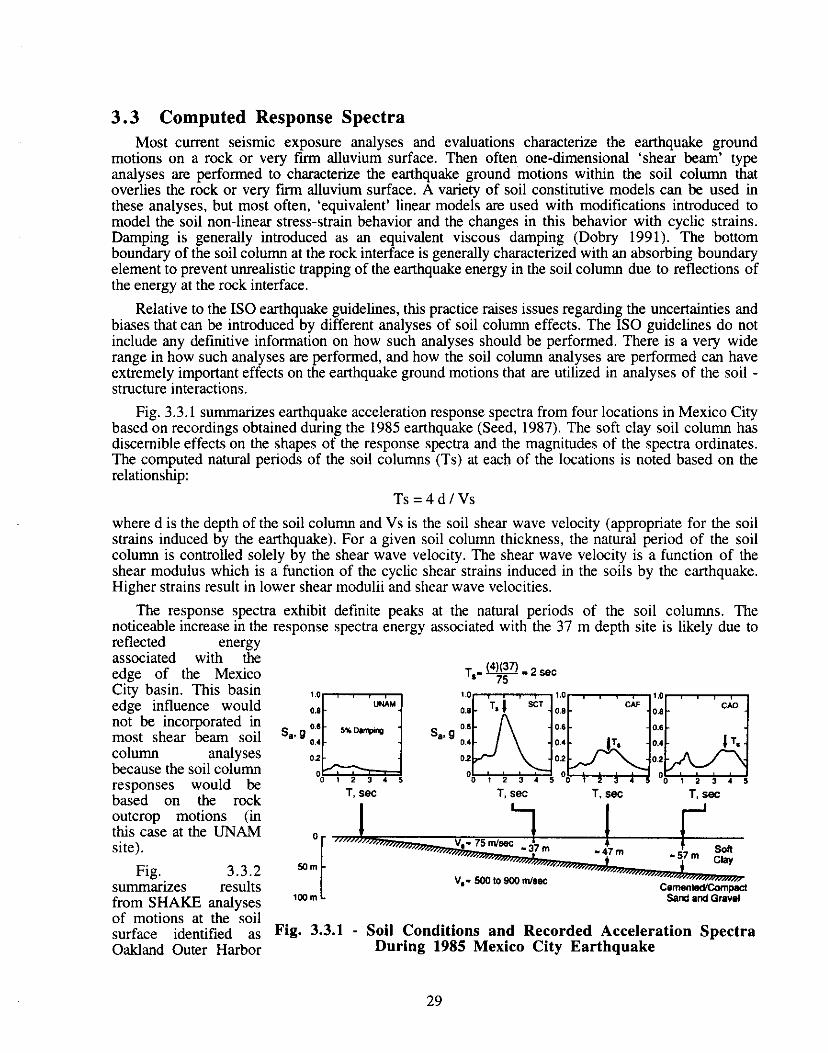
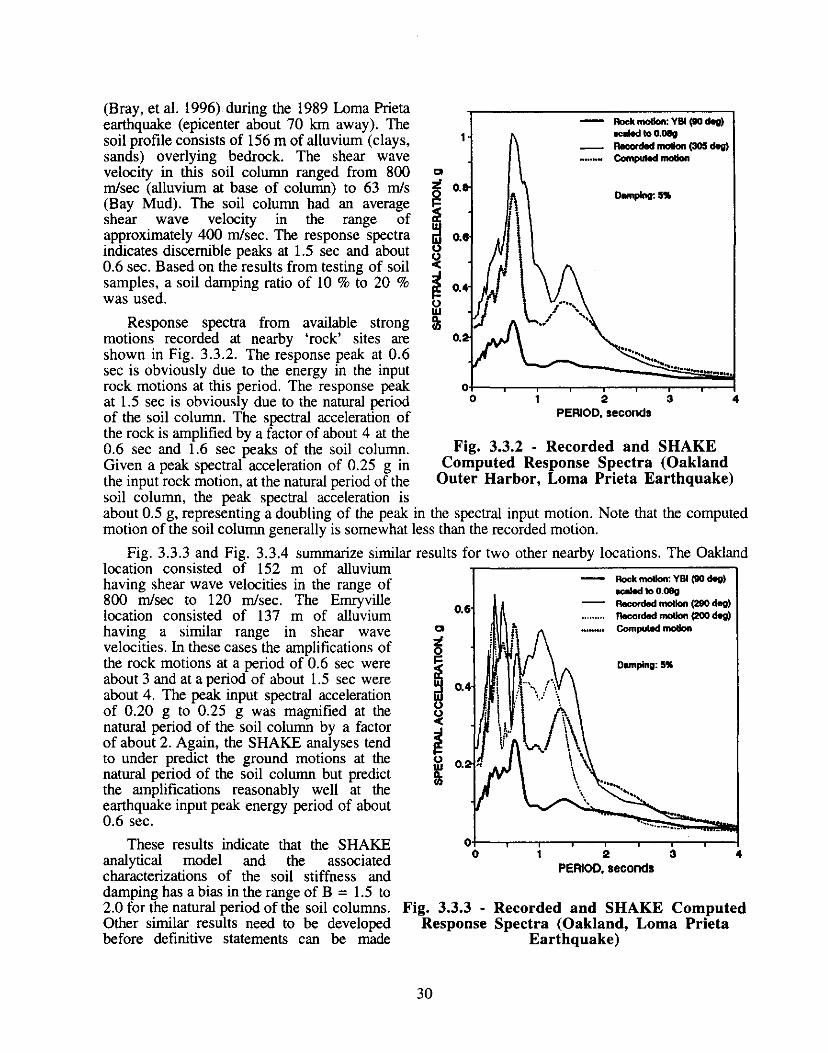
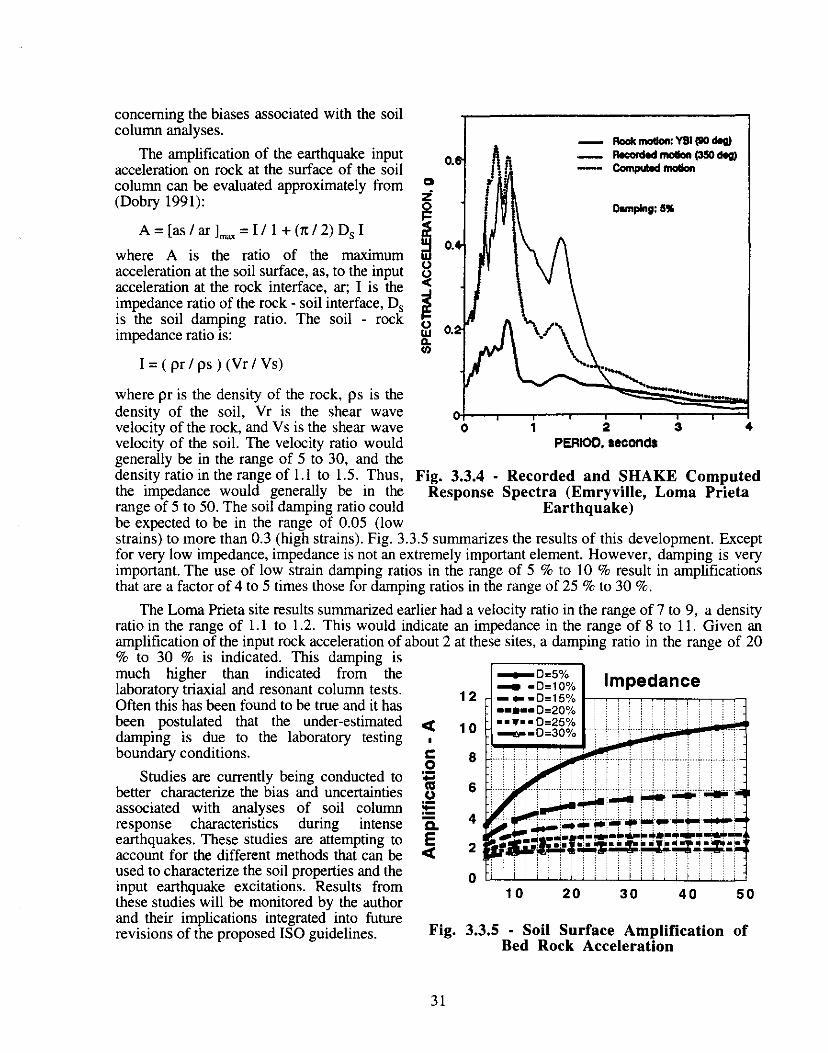
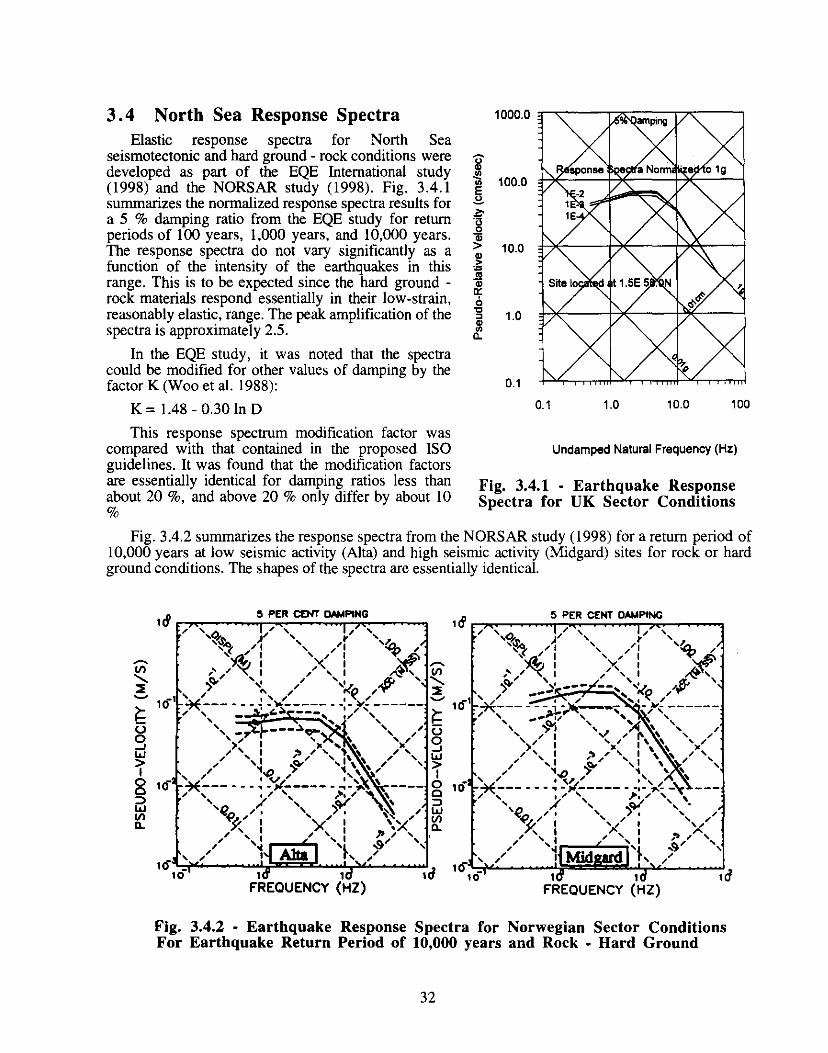
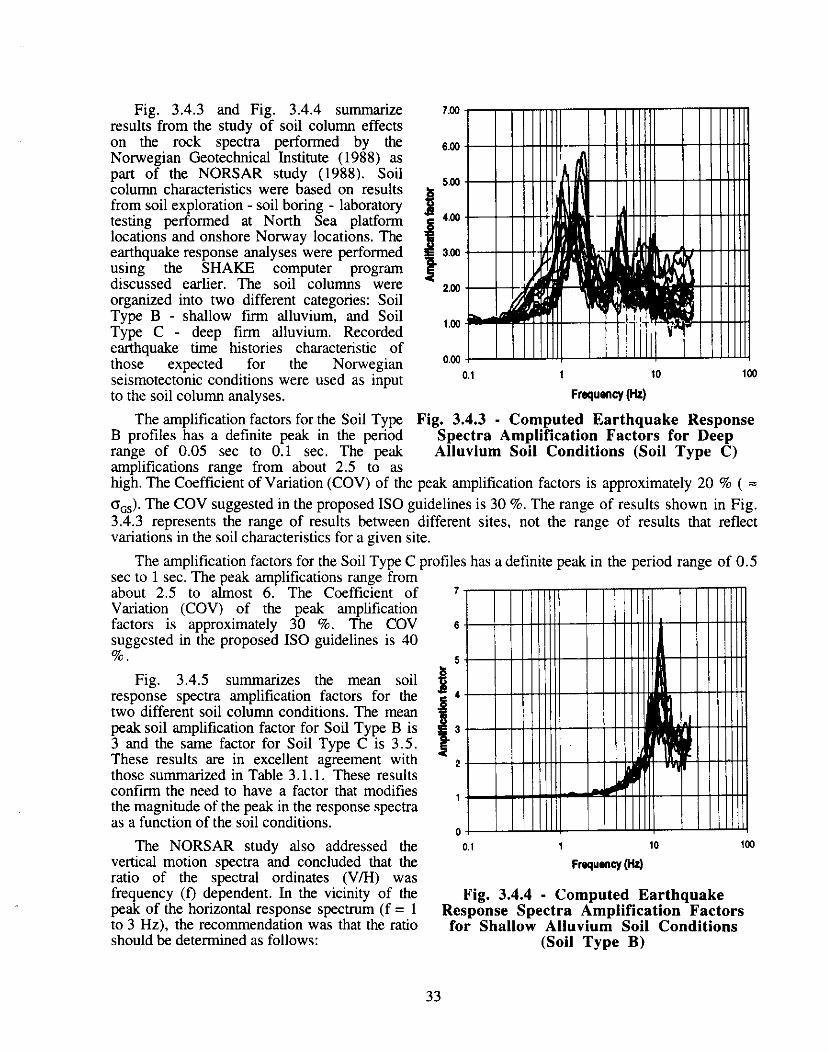
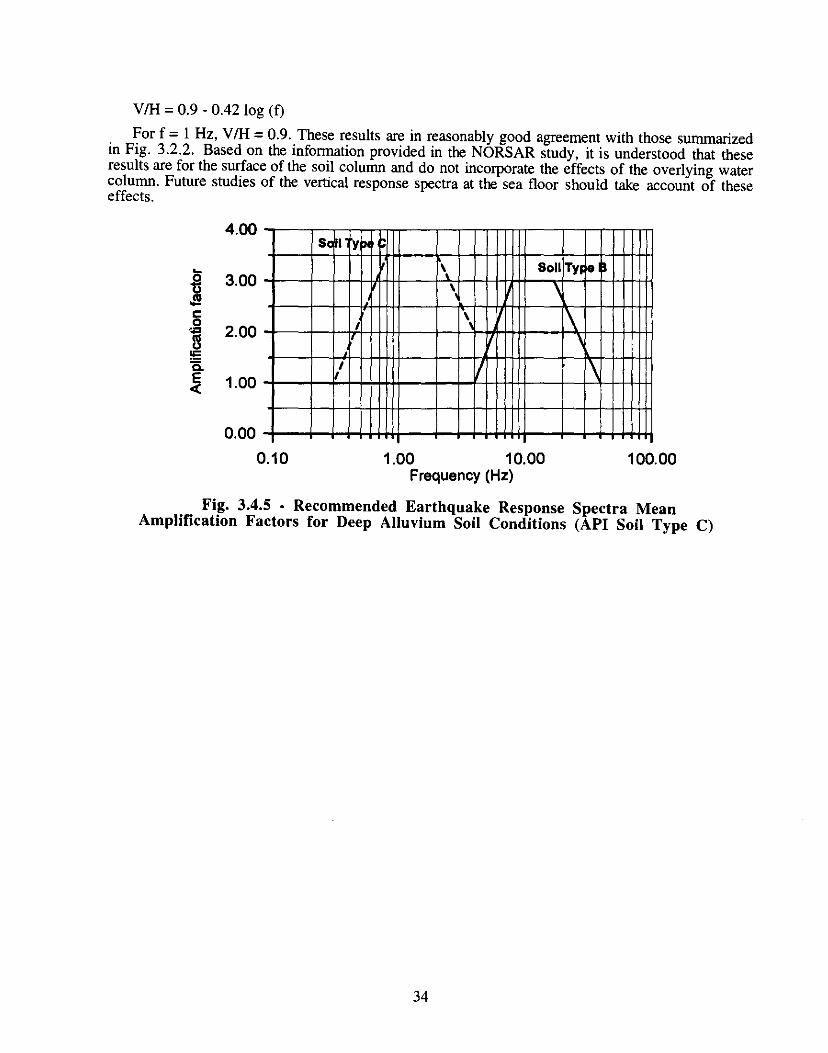
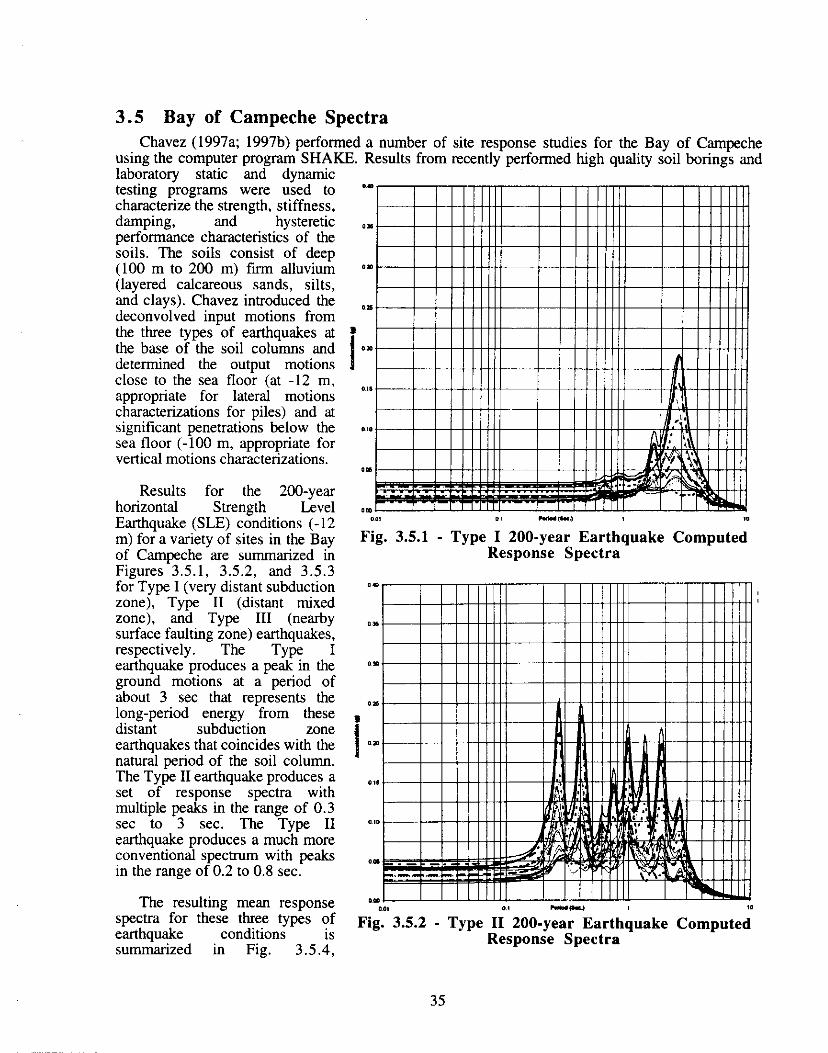
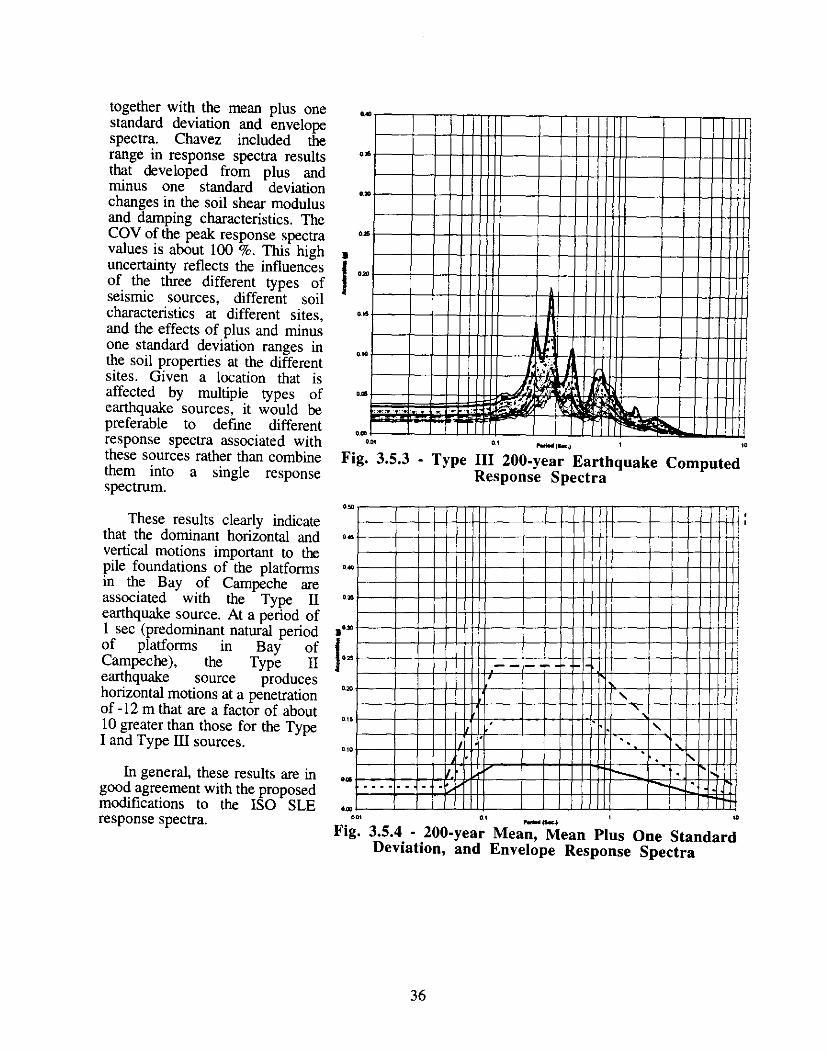
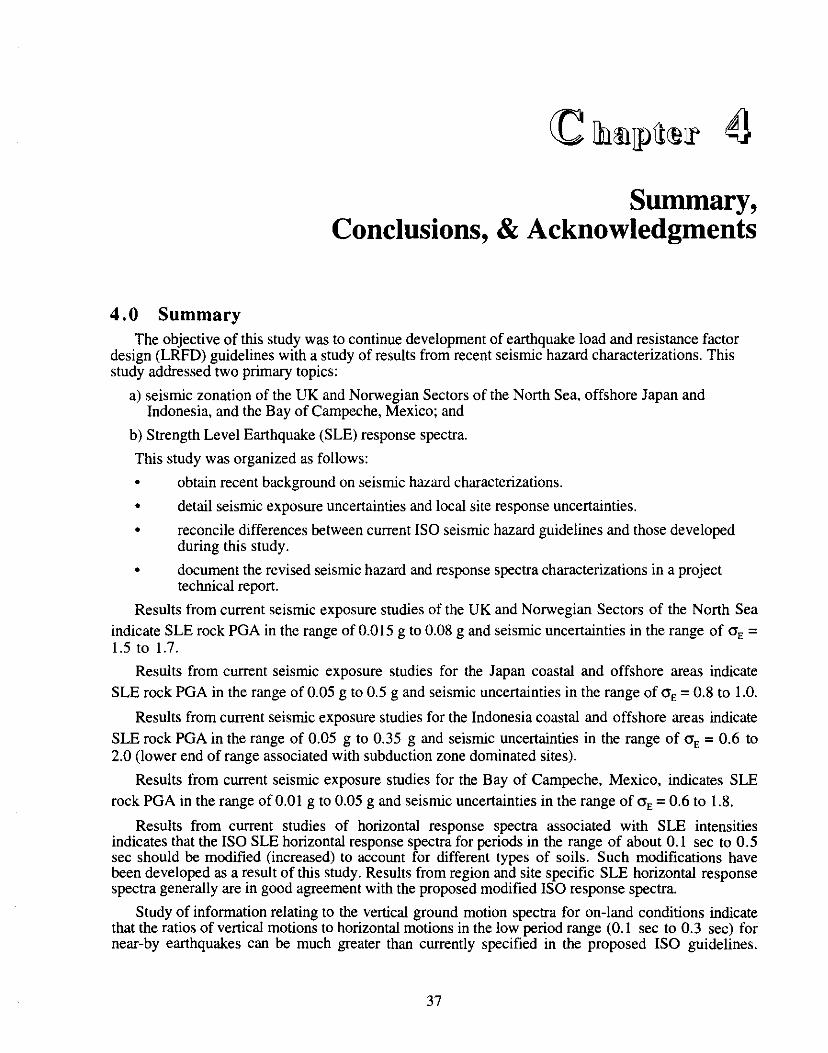
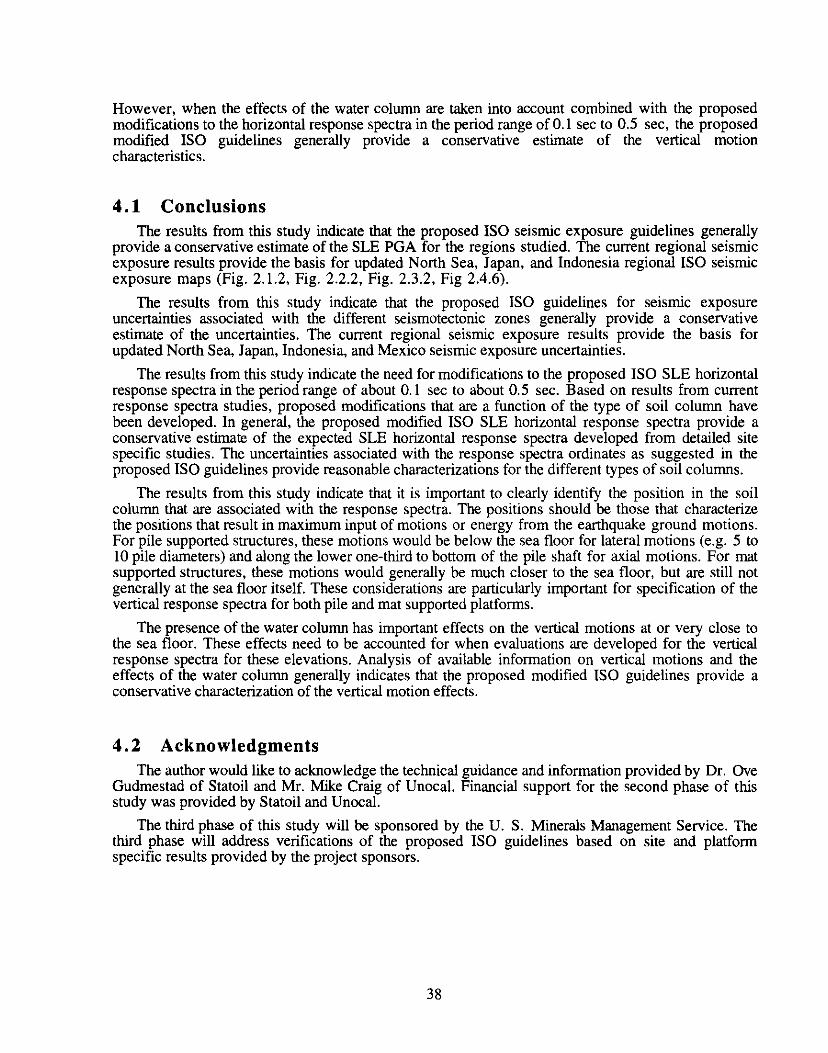

this page left blank intentionally
42


![[PATEL] Shock Transmission Units for Earthquake Load Distribution](https://img.pdfslide.net/doc/110x75/55cf9b27550346d033a4f082/patel-shock-transmission-units-for-earthquake-load-distribution.jpg)