Embed Size (px)
Citation preview
EARTHQUAKE ENGINEERING AND STRUCTURAL DYNAMICS, VOL. 18,799-814 (1989)
INFLUENCE OF LATERAL-LOAD-RESISTING SYSTEM ON THE EARTHQUAKE RESPONSE OF STRUCTURES-A SYSTEM
IDENTIFICATION STUDY
APOSTOLOS S. PAPAGEORGIOU* AND BING-CHANG LIN' Department of Civil Engineering, Rensselaer Polytechnic Institute, Troy, New York 12180-3590 U.S.A.
SUMMARY
Analysis and comparison of the dynamic responses of three well instrumented (with accelerographs) high-rise buildings shaken during the 1984 Morgan Hill earthquake are presented. The buildings examined in the present work are (i) the Town Park Towers Apartment building, a 10-storey, concrete shear wall building; (ii) the Great Western Savings and Loan building, a 10-storey building with concrete frames and shear walls; and (iii) the Santa Clara County Office building, a 13-storey, moment-resistant steel frame building. The structures are located within 2 km of each other and, as may be confirmed by visual inspection of the recorded seismograms, experienced similar ground motions. One-dimensional and three-dimensional linear structural models are fitted to the observations using the 'modal minimization method' for structural identification, in order to determine optimal estimates of the parameters of the dominant modes of the buildings. The time-varying character of these parameters over the duration of the response is also investigated. Comparison of the recorded earthquake response of the structures reveals that the type of lateral-load-resisting system has an important effect on the dynamic behaviour of the structures because it controls the spacing of the characteristic modes on the frequency axis. The Santa Clara County Office building has closely spaced natural frequencies and exhibits strong torsional response and modal coupling. Its dynamic behaviour is contrasted with that of the Great Western Savings and Loan building which has well separated natural frequencies and exhibits small torsional response and no modal coupling. Strong modal coupling causes a beating-type phenomenon and makes earthquake response of structures different from that envisioned by codes.
INTRODUCTION
In recent years the California Division of Mines and Geology (CDMG) instrumented several modern structures at various sites in the State of California. Many of these extensively instrumented structures have been excited by moderate earthquakes such as the Morgan Hill earthquake of April 24,1984 (ML 6.2, USGS) and the Whittier Narrows earthquake of October 1, 1987 (ML 6-1, Caltech), and a plethora of structural response records has been collected since the initiation of the program. Such response data provide an excellent opportunity to study quantitatively as well as qualitatively the dynamic behaviour of structures at force and deflection levels directly relevant to earthquake-resistant design. It is beyond any doubt that analysis of full-scale building response measurements is an essential part of structural engineering research and'may pave the way to improved analysis and design methods.
In this paper we analyse and compare the dynamic response of three such well instrumented high-rise buildings shaken during the 1984 Morgan Hill earthquake. The structures considered here are located in the City of San Jose, California, approximately 20 km from the epicentre of the earthquake, and they include (i) the Town Park Towers Apartment building, a 10-storey, concrete shear wall building; (ii) the Great Western Savings and Loan building, a 10-storey building with concrete frames and shear walls; and (iii) the Santa Clara County Office building, a 13-storey, moment-resistant steel frame building. ' 9 '
* Assistant Professor. Research Assistant.
OO98-8847/89/060799-16$08.OO 0 1989 by John Wiley & Sons, Ltd.
Received I $ April 1988 Revised 30 January 1989
800 A. S. PAPAGEORGIOU AND B.-C. LIN
Estimates of the optimum values of the dynamic parameters (e.g. damping ratio, characteristic frequencies and corresponding modal shapes) of 1-D and 3-D linear mathematical models of the three structures are obtained by applying the ‘modal minimization method’ for structural identification. This technique, developed by is a practical algorithm which minimizes some positive-definite measure-of-fit between the observed structural output and model output in the time domain, by systematically varying the model parameters. Originally Beck3g4 applied the method in the analysis of structural response data of high-rise buildings and subsequently Werner et aL5 employed it in the seismic response evaluation of a bridge shaken by the 1979 Imperial Valley earthquake. These studies concluded that time-invariant linear models-or a number of different time-invariant models, each fitted to separate time intervals of the recorded response- based on a small number of modes may adequately reproduce the earthquake response of structures for amplitudes of vibration up to the onset of structural damage. The three buildings under investigation in this paper experienced low intensity ground motions during the 1984 Morgan Hill earthquake, as can be judged by the peak accelerations ( N 0.069) recorded at their base. The two reinforced concrete structures performed satisfactorily with no damage, while the steel building suffered some non-structural and content damage and very limited structural
Analysis of the earthquake response of these three structures is interesting primarily for two reasons. 1. The structures are located within 2km of each other and consequently the input motions-at least their long- period components-must be similar. This can easily be confirmed by visual comparison of the recorded motions at the ground floors of the three structures (see Reference 1). 2. The structures were designed with different types of lateral-load-resisting systems; the stiff shear walls at the periphery of the Great Western Savings and Loan building contrast the smooth and even dispersion of load-bearing shear walls over the floor plan of the Town Park Towers Apartment building or the smooth distribution of columns of the Santa Clara County Office building. The characteristic frequencies of the former structure are expected to be well separated, while for the other two structures at least one of the characteristic frequencies corresponding to one of the two fundamental translational modes of vibration (=modes for which the dominant components of motion are translational) is expected to be close to the characteristic frequency of the fundamental torsional mode of vibration (=mode for which the dominant components of motion are r o t a t i ~ n a l ) . ~ , ~ AnalyticalE-” and numerical l4 studies, confirmed by full-scale forced vibration tests,’ have shown that a strong coupling effect between translational and torsional vibrations can occur if the natural frequencies of the translational and torsional modes of vibration are close to each other, even when eccentricities are small, while no such coupling occurs if the natural frequencies are well separated. Therefore, the recorded earthquake response of the three buildings under investigation provides an- excellent opportunity to confirm the predictions of the analytical studies for the case of earthquake excitation.
Before we proceed to the analysis of the response of the buildings we should point out some characteristics of the source of the 1984 Morgan Hill earthquake which are relevant to the input motions and ultimately to the recorded response of the buildings.
The April 24, 1984 Morgan Hill earthquake is a moderate-sized event ( M L 6.2 USGS) which occurred on the Calaveras fault, approximately 20 km southeast of the site of the three buildings. To a first approximation slip over the fault plane can be interpreted as two main source regions, each with an extent of about 5 km, with their centres separated by about 12 km. The second source, further to the south, is three times larger than the first and it occurred about 4.5 sec after the first source which is located closer to San The signature of these two subevents is distinguishable on the ground motions recorded at the site of the buildings (see for instance the basement records of the Great Western Savings and Loan building, Figure 5). Careful examination of these records suggests that the first subevent appears to be richer in high frequencies content. This fact is reflected in the response of the structures, as will be demonstrated below.
For each one of the structures, we performed two types of analyses. 1. One-dimensional (1-D) analyses considering a planar linear model with classical damping (see for
example, p. 556, Reference 18). 2. Three-dimensional (3-D) analyses considering an idealized model consisting of rigid floor decks
supported on massless axially inextensible columns and walls, where for each floor are allowed three degrees of freedom, two orthogonal translations plus a rotation. The equations of motion of the mathematical model
LATERAL-LOAD-RESISTING SYSTEM 80 1
were formulated assuming that the centres of mass of all the floors lie on a vertical axis and the principal axes of resistance of all storeys are identically oriented. These were considered to be reasonable assumptions since the geometry of the floors of each building did not vary with height. However, no assumption was made related to the position of the centre of resistance of each
The modal equations of the above two models are summarized in Reference 19 where the reader can find a more detailed account of the work described here. In the following we present the results of these analyses.
TOWN PARK TOWERS APARTMENT BUILDING
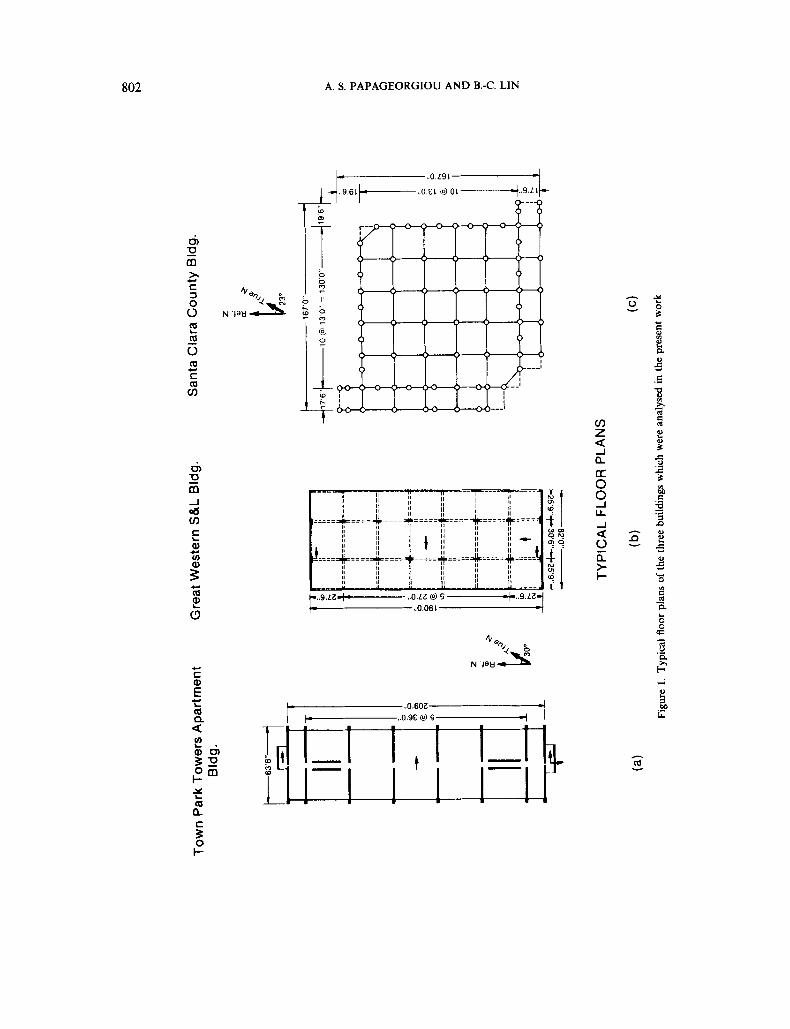
The 10-storey Town Park Towers Apartment reinforced concrete building [a typical floor plan of which is shown in Figure l(a)] was constructed in 1972. The lateral-force-resisting system of the structure consists of reinforced concrete shear walls at regular intervals in the transverse (E-W) direction and concrete shear walls along the interior corridors in the longitudinal (N-S) direction. The shear walls in the longitudinal direction are stepped at the 6th floor. A typical floor system of the structure consists of one-way post tensioned concrete slabs spanning the transverse load-bearing concrete shear walls. The structure is supported on precast, prestressed concrete piles placed under all bearing
The sensors are located at three different levels (ground floor, 6th floor and roof) of the structure.' Pairs of sensors pointing east-west at these three levels are intended to record translational as well as torsional motions at these levels. In addition, a sensor pointing east-west is mounted at the centre of the roof to detect any in-plane motions of the floor system. By comparing the translational response recorded by this sensor with the response obtained by averaging the recorded motions of the other two sensors located at the edges of the slab we inferred that the floor deck of the roof-and presumably of all other floors-behaved as a rigid disk during the earthquake. The torsional motion of a given floor may therefore be safely estimated from the differential motion between sensors on that floor oriented parallel to each other.
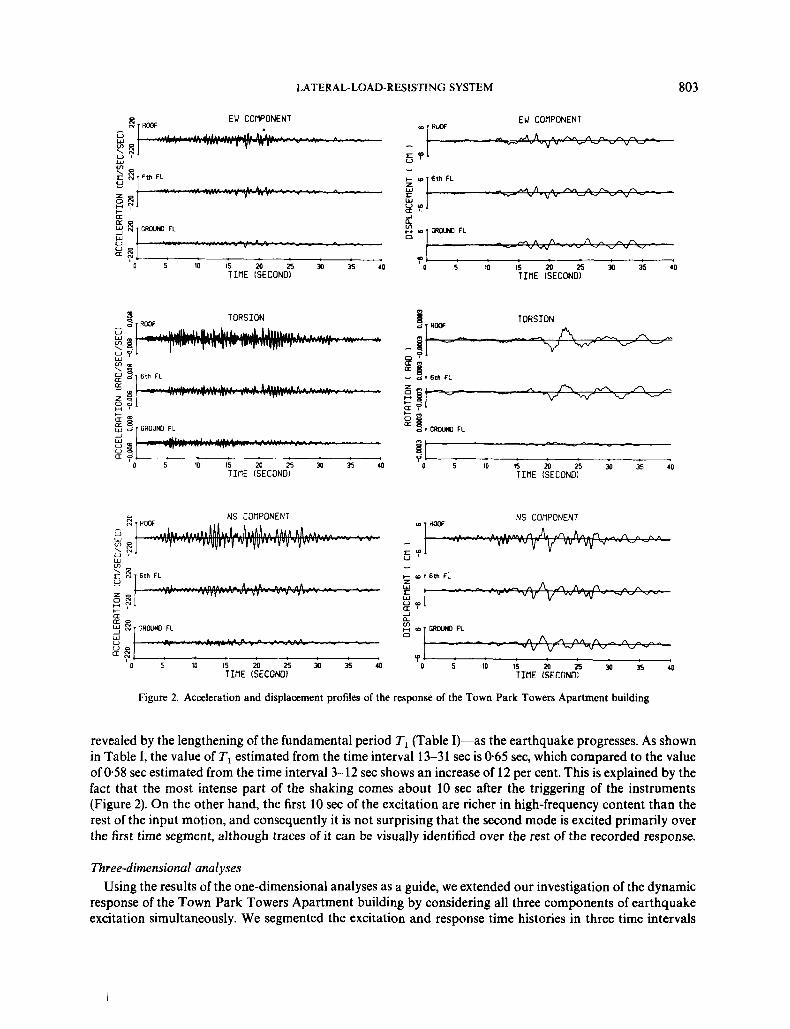
During the 1984 Morgan Hill earthquake, the building oscillated for about 40 sec. Visual inspection of the acceleration profiles of the response of the building, shown in Figure 2, reveals that the fundamental period T, of vibration along the longitudinal (N-S) direction is clearly longer than that of the transverse (E-W) direction, which is closer to the torsional period. Thus, given the symmetric floor plan of the building, if modal coupling were to be observed it would be due to accidental eccentricities and it would involve only the transverse (E-W) and torsional modes of vibration (one-way coupling).' In fact such coupling is detected in the results of the three-dimensional analyses discussed below (see the torsional mode shapes and the corresponding participation factors of the 1st torsional mode and 1st E-W translational mode in Table IT).
One-dimensional analyses The vibration properties of the building for each of the two orthogonal directions, transverse (E-W) and
longitudinal (N-S), initially were estimated by fitting a one-mode linear time-invariant model over the time segment 3-33 sec, covering the significant part of the excitation and response. Assessing visually the quality of fitting we observed l9 that for the transverse (E-W) direction, the agreement of the calculated response with the recorded one was exceptionally good. On the contrary, the matching of the model response to the observed one along the longitudinal (N-S) direction was less satisfactory. Careful examination of the longitudinal (N-S) response revealed that a one-mode model could not simulate. the high-frequency component which rode over the predominant oscillatory motion during the first 17 sec of the response.
To accommodate this high-frequency component, we partitioned the excitation and response records into two consecutive time segments. (For all the analyses presented in this paper, two important considerations are taken into account in selecting the limits of the time segments: (i) the frequency content of the recorded motions, which dictates the number of modes of the model to be used; and (ii) the motion amplitudes, which affect the stiffness, and therefore the fundamental period, of the building.) For the first time segment (3-12 sec) we had to use a model with two modes in order to simulate accurately the response records, while for the second time segment (13-31 sec) a model with only one mode was adequate. The estimated parameters are summarized in Table I. We observe that the value of the ratio (TIIT,)= 3.4 is close to the value 3 expected for a shear beam model. What is particularly interesting to notice is the reduction in stiffness of the building-
i
802 A. S. PAPAGEORGIOU AND B.-C. LIN
6 2 m
I- -..0.9ce) s- I
e m a C
I-
4-
P e a 0
E 9
LATERAL-LOAD-RESISTING SYSTEM 803
I - D 5 w C R W l O FL w U
g z $ 0 s 10 15 m E JO K 40
T I f l E ISECONOI
- N NS COflPONENT - V W
0 , Y E W
EU COflPONENT u ) r R c O F
0 5 10 I5 20 25 30 35 40 TInE LSECONDI
NS COflPONENT in 1 dooF
I
I- u) 6th FL Z W S W vin
-J a an
0 5 1 0 1 5 2 0 2 5 3 0 3 5 4 0 TInE (SECnNfll
Figure 2. Acceleration and displacement profiles of the response of the Town Park Towers Apartment building
revealed by the lengthening of the fundamental period TI (Table 1)-as the earthquake progresses. As shown in Table I, the value of TI estimated from the time interval 13-31 sec is 0.65 sec, which compared to the value of 0.58 sec estimated from the time interval 3-12 sec shows an increase of 12 per cent. This is explained by the fact that the most intense part of the shaking comes about 10 sec after the triggering of the instruments (Figure 2). On the other hand, the first 10 sec of the excitation are richer in high-frequency content than the rest of the input motion, and consequently it is not surprising that the second mode is excited primarily over the first time segment, although traces of it can be visually identified over the rest of the recorded response.
Three-dimensional analyses Using the results of the one-dimensional analyses as a guide, we extended our investigation of the dynamic
response of the Town Park Towers Apartment building by considering all three components of earthquake excitation simultaneously. We segmented the excitation and response time histories in three time intervals
804 A. S. PAPAGEORGIOU AND B.-C. LIN
Table I. Vibration characteristics of the Town Park Towers Apartment building inferred from 1-D analyses by fitting one-mode and two-mode models to the recorded response along the longitudinal (N-S) and
transverse (E-W) directions
Effective participation
Time Periods (sec) Damping(%) factors’ Normalized error (1) (2) Interval Model T , T2 (1 5 2 Proof Prwf
1 mode 0.58 4.3 1.553 0.076 3-12 [1*72]*
NS 2 modes 0.58 0.17 4.1 9.6 1.477 -0.891 0.031 [1.72]* [5.88]*
13-3 1 1 mode 0.65 4.4 1.668 0.023 (set) [1.54]*
EW 3-33 1 mode 0.43 5.2 1.33 0.037 (set) [2.33]*
*h (= W,) ‘Defined as in Reference 4.
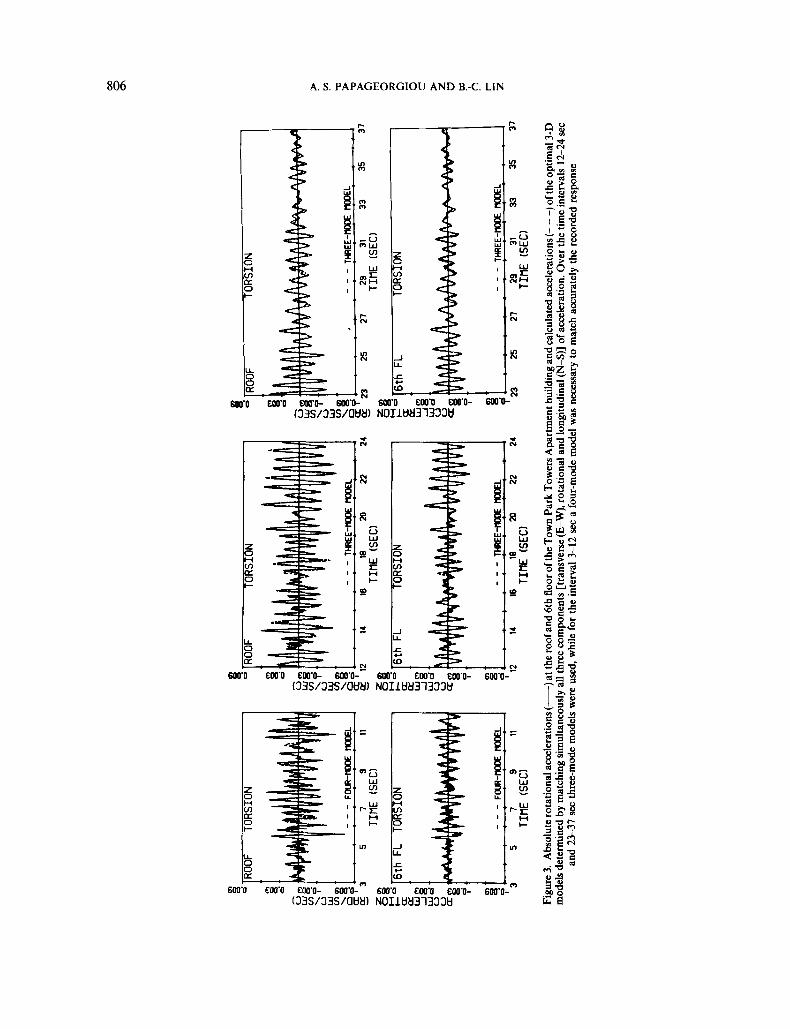
and fitted 3-D linear time-invariant models over each time interval separately. The inferred parameters are summarized in Table 11, while a sample of the comparison of the calculated response to the recorded one is shown in Figure 3. Three modes (two translational and one torsional were adequate to model the response over the time interval 12-37 sec, while a fourth mode-the 2nd translational mode in the longitudinal (N-S) direction-was necessary to simulate accurately the response in the time interval 3-1 2 sec, confirming thus the conclusions derived from the one-dimensional analyses.
The values of the participation factors inferred from the time intervals 3-12 sec and 12-24 sec appear to be reasonably consistent. However, estimates of the participation factors from the last time segment (23-37 sec) (not shown in Table II for economy of space, see Reference 19) exhibited larger variation. This is to be expected since, as B e ~ k ~ . ~ points out, the determination of the participation factors becomes ill-conditioned for later portions of the records. This is explained by the fact that the basement accelerations are small for these time intervals and the structural motion is dominated by the free-vibration components which do not depend on the participation factor.
The damping ratio and the effective participation factor of the 2nd N-S translational mode are estimated to be 7.6 per cent and -0.831 respectively. Both these values are smaller than the corresponding values 9.6 per cent and - 0.891 inferred from the one-dimensional analysis (Table I). This confirms observation that the above two parameters can change in the same direction (i.e. increase or decrease) roughly by the same percentage. This is because the model response is quite sensitive to the ratio of the effective participation factor over the damping ratio and not as sensitive to the individual values of these two parameters. Nevertheless, we favour the smaller value inferred above for the damping ratio because it is closer to the damping values of other reinforced concrete structures shaken by earthquake motions of similar intensity.”
Concluding, we should note that we did not detect any obvious manifestation of the discontinuity (with height) of the longitudinai shear walls.
GREAT WESTERN SAVINGS AND LOAN BUILDING
Constructed in 1967, this 10-storey reinforced concrete structure is located only about 0-5 km from the Town Park Towers Apartment building. Two exterior concrete shear walls in the transverse (E-W) direction and four moment frames in the longitudinal (N-S) direction provide resistance to lateral forces. The floor system of a typical floor consists of one-way reinforced concrete floor slabs overspanning joints supported by the
LATERAL-LOAD-RESISTING SYSTEM 805
Table 11. Vibration characteristics of the Town Park Towers Apartments building inferred from 3-D analyses ~~
12-24 sec Time interval 3-12 sec
r = 1 r = 2 r = 3 r = 4 r = l r = 2 r = 3 Mode 1st N-S 1st E-W 1st torsional 2nd N-S 1st N-S 1st E-W 1st torsional
~
Period T, (sec) 0.58 0.42 0.38 0.17 0.64 0.43 0.39
Damping r, (%) 4.0 3.4 4.1 1.6 4.6 4.5 5.0 [1.72]* [2.38]* [2.63]* [5.88]* [1.56]* [2.33]* [2.56]*
Participation factors
-0.056 -0.213 - 1.483
0.925 0.846 0.084
Modal shapes R ( I )
roof. EW R (r) 6th floor, EW
- 0.04
0.00
- 1.00
- 0.02
0-00
- 0.36
1 .00
0.25
0.0 1
0.45
0.10
0.02
0'320 -0088
0'031 -0.831 - 1.128 0.078
1 .00 -0.11
-0.96 - 0.03
0.08 1 .oo
0.46 - 0.02
- 0.42 -0.01
- 0.03 - 0.79
- 0045 -0.619 - 1.483
1.067 1,043 0.043
0.207
0.003 - 1.058
- 0.0 1
- 0.02
- 1.00
0.00
- 0.0 1
-0.36
1 .00
0.19
- 0.00
Q46
0.07
0.02
0.83
- 1.00
- 0.0 1
0.40
- 0.47
- 0.09
Normalized error 0.596 0.385
concrete The structure has a basement and the foundation consists of a 1.5 m thick reinforced concrete mat.
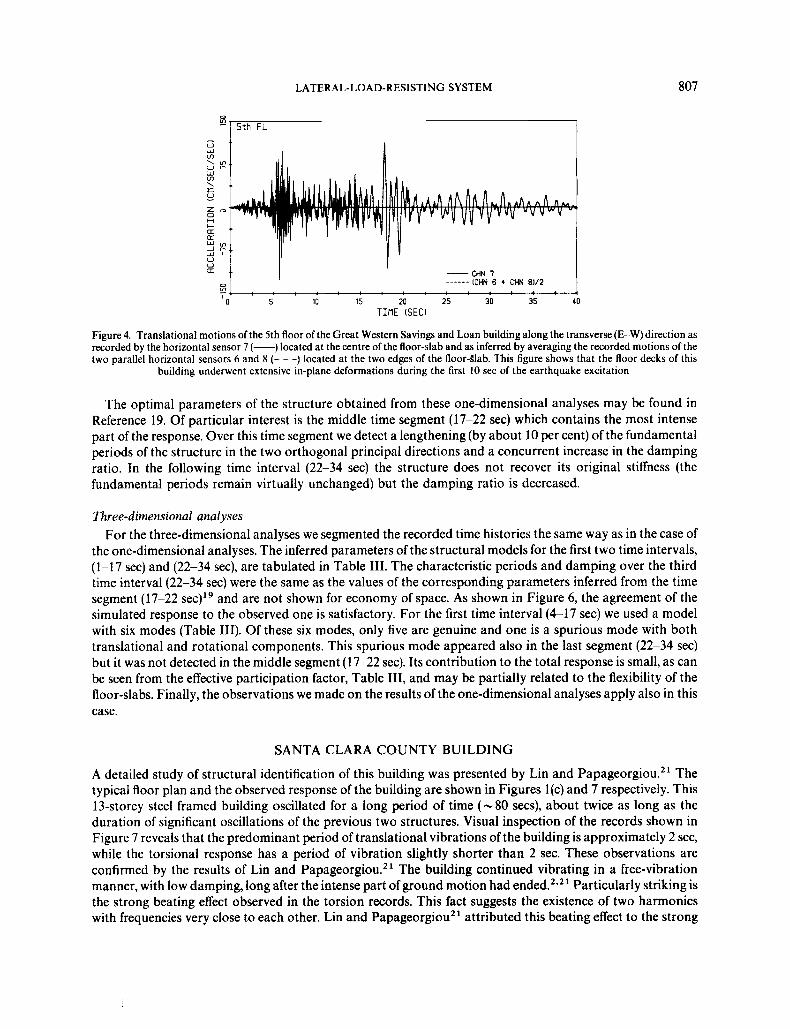
The sensors are located at four different levels (basement, 2nd floor, 5th floor and roof) of the structure. A sensor (sensor 7) is mounted at the centre of the 5th floor to detect any in-plane distortions of the floor deck. As shown in Figure 4, such in-plane deformations occurred only over the first 7 sec of the recorded response. It is apparent that, during this initial time segment, the motions are richer in high frequencies as compared to the rest of the response. Furthermore, during the same time interval, the amplitudes of vibration of the centre of the floor-slab (sensor 7) are considerably larger than the response ampiitudes of its two ends which are attached to the shear walls (sensors 6 and 8). On the contrary, theiatter part of the response is characterized by longer periods and the floor-slab clearly behaves as a rigid disk. Therefore, it is clear that the initial time segment of the recorded excitation and response contains harmonic components with frequencies high enough to excite the in-plane vibration modes of the floor-slab, causing thus extensive in-plane deformations.
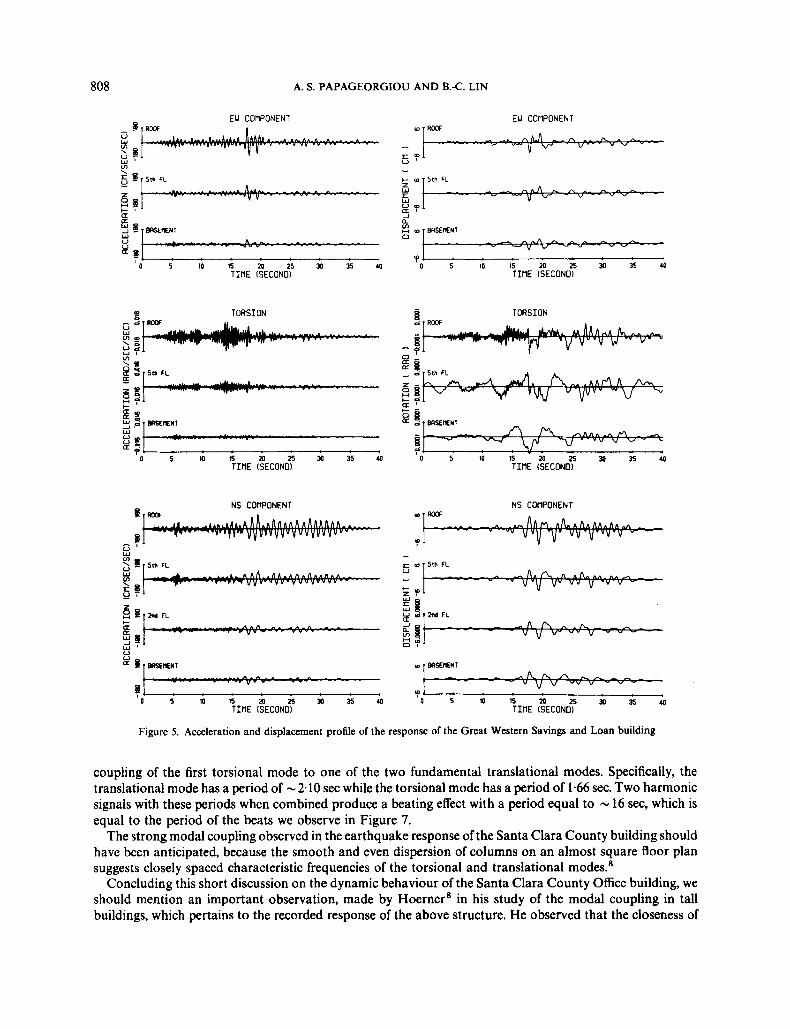
The observed response of the structure, as recorded at different levels (basement, 2nd floor (only in the longitudinal direction), 5th floor and roof) is shown in Figure 5. Visual inspection of Figure 5 provides convincing evidence that the characteristic frequencies of the translational and rotational motions respect- ively are well separated and therefore no modal coupling should be anticipated.
One-dimensional analyses We performed the same kind of analysis as for the Town Park Towers Apartment building. We considered
three time segments. For the first segment (4-17 sec) we found that a 1-D model with two modes was necessary to simulate the response accurately, while for the other two time intervals, (17-22 sec) and (22-34 sec), one mode was enough to model the observed response although traces of the 2nd mode were visible over the time interval 17-22 sec on the longitudinal (N-S) component of motion. This is again a direct consequence of the fact that the first half of the excitation is richer in high frequencies and therefore is more likely to excite the higher modes of the building.
8 0 1 RO
OF
TORS
ION
1 TO
RSIO
N P ]R
OO
F I
12
14
16
18
20
22
24
TID
E (SEC)
5 7
9 11
TI
RE
(SE
CI
zm
ag
I=
16th
FL
TORS
ION
U
a
u' am
8
Wm
d
?
u d 3
5 7
9 11
TI
DE
(SE
C)
TORS
ION
-'e 8
wo
u
u
Urn
d
I.
.
. .
12
14
16
. 18
20
22
24
TID
E (SEC)
TORS
ION
0 rR
OOF
1 I
THRE
E-NB
E m
DEL
-
--
TIH
E (S
EC)
Figu
re 3
. A
bsol
ute r
otat
iona
l acc
eler
atio
ns (-)
at th
e ro
of a
nd 6
th fl
oor o
f the
Tow
n Pa
rk T
ower
s Apa
rtmen
t bui
ldin
g an
d ca
lcul
ated
acc
eler
atio
ns (-
- -)
of th
e op
timal
3-D
m
odel
s det
erm
ined
by
mat
chin
g si
mul
tane
ousl
y al
l thr
ee c
ompo
nent
s [tr
ansv
erse
(E-W
), ro
tatio
nal
and
long
itudi
nal (N-S)] o
f acc
eler
atio
n. O
ver t
he ti
me
inte
rval
s 12
-24
sec
and
23-3
7 sec
thre
e-m
ode
mod
els
wer
e us
ed, w
hile
for t
he in
terv
al 3
-12
sec
a fo
ur-m
ode
mod
el w
as n
eces
sary
to m
atch
acc
urat
ely
the
reco
rded
res
pons
e
LATERAL-LOAD-RESISTING SYSTEM 807
I CHN 7 CHN 6 + CW 8V2
__ ..____
V U
D 5 0 5 10 15 20 25 30 35
T I t l E [SEC) I
Figure 4. Translational motions of the 5th floor of the Great Western Savings and Loan building along the transverse (E-W) direction as recorded by the horizontal sensor 7 (-) located at the centre of the floor-slab and as inferred by averaging the recorded motions of the two parallel horizontal sensors 6 and 8 (- - -) located at the two edges of the floor-Slab. This figure shows that the floor decks of this
building underwent extensive in-plane deformations during the first 10 sec of the earthquake excitation
The optimal parameters of the structure obtained from these one-dimensional analyses may be found in Reference 19. Of particular interest is the middle time segment (17-22 sec) which contains the most intense part of the response. Over this time segment we detect a lengthening (by about 10 per cent) of the fundamental periods of the structure in the two orthogonal principal directions and a concurrent increase in the damping ratio. In the following time interval (22-34 sec) the structure does not recover its original stiffness (the fundamental periods remain virtually unchanged) but the damping ratio is decreased.
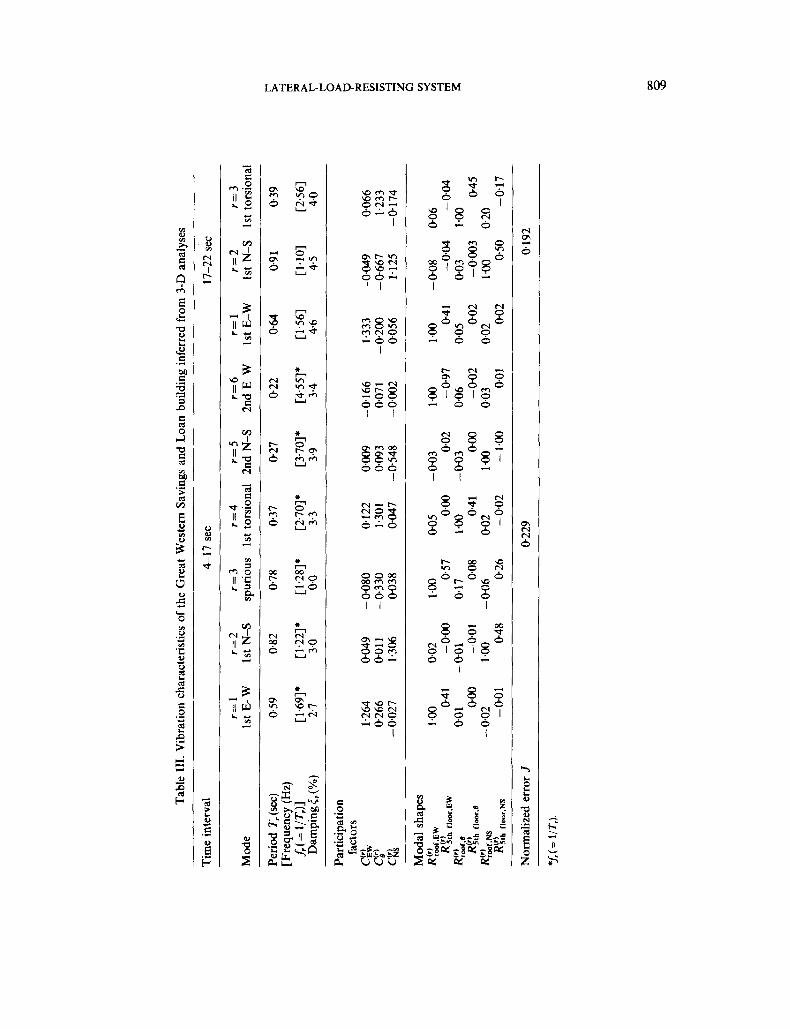
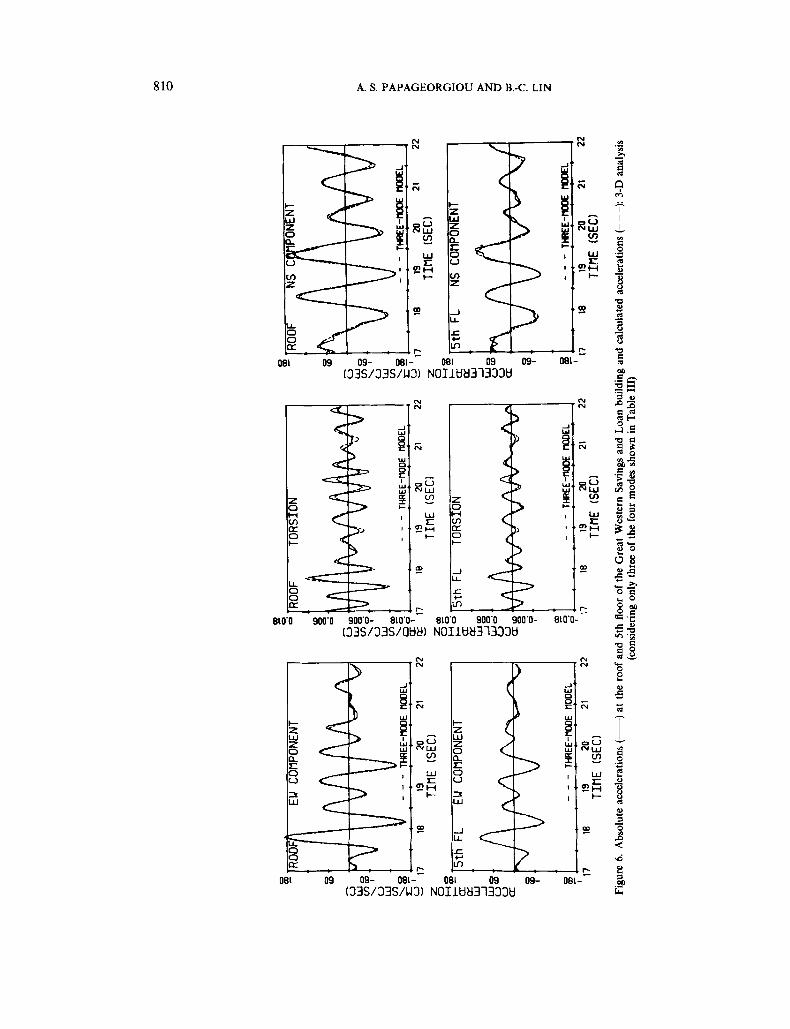
Three-dimensional analyses For the three-dimensional analyses we segmented the recorded time histories the same way as in the case of
the one-dimensional analyses. The inferred parameters of the structural models for the first two time intervals, (1-17 sec) and (22-34 sec), are tabulated in Table 111. The characteristic periods and damping over the third time interval (22-34 sec) were the same as the values of the corresponding parameters inferred from the time segment (17-22 sec)” and are not shown for economy of space. As shown in Figure 6, the agreement of the simulated response to the observed one is satisfactory. For the first time interval (4-17 sec) we used a model with six modes (Table 111). Of these six modes, only five are genuine and one is a spurious mode with both translational and rotational components. This spurious mode appeared also in the last segment (22-34 sec) but it was not detected in the middle segment (17-22 sec). Its contribution to the total response is small, as can be seen from the effective participation factor, Table 111, and may be partially related to the flexibility of the floor-slabs. Finally, the observations we made on the results of the one-dimensional analyses apply also in this case.
SANTA CLARA COUNTY BUILDING
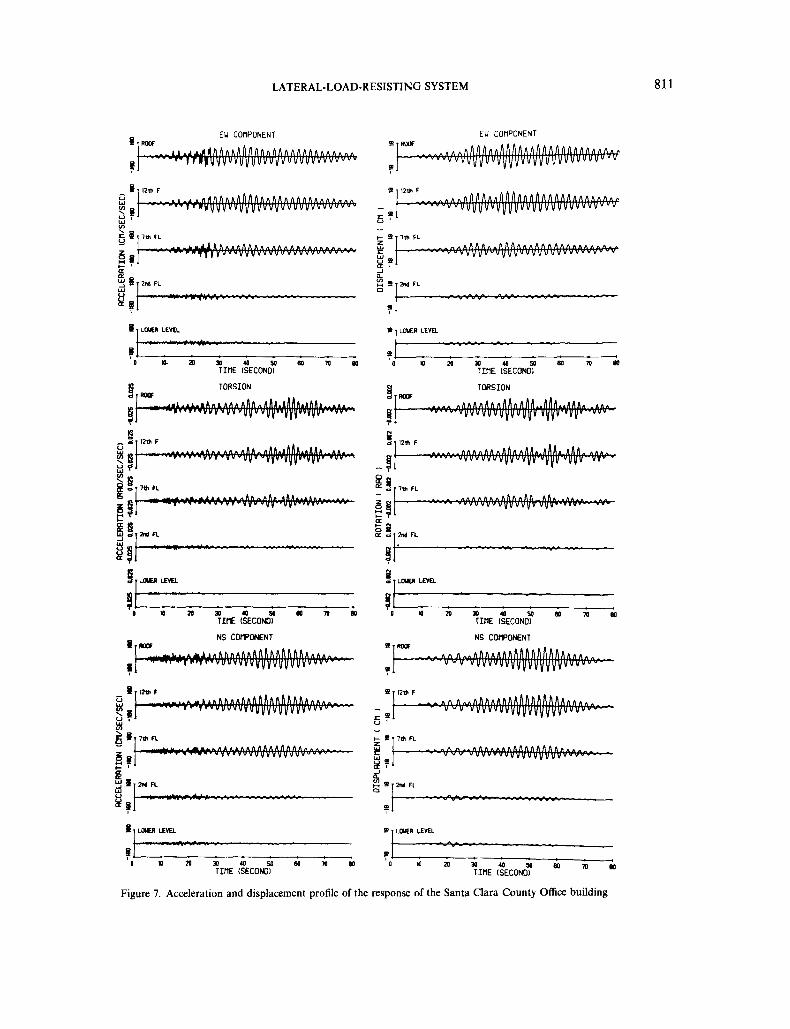
A detailed study of structural identification of this building was presented by Lin and Papageorgiou.” The typical floor plan and the observed response of the building are shown in Figures l(c) and 7 respectively. This 13-storey steel framed building oscillated for a long period of time (- 80 secs), about twice as long as the duration of significant oscillations of the previous two structures. Visual inspection of the records shown in Figure 7 reveals that the predominant period of translational vibrations of the building is approximately 2 sec, while the torsional response has a period of vibration slightly shorter than 2 sec. These observations are confirmed by the results of Lin and Papageorgiou.z’ The building continued vibrating in a free-vibration manner, with low damping, long after the intense part of ground motion had ended.2*21 Particularly striking is the strong beating effect observed in the torsion records. This fact suggests the existence of two harmonics with frequencies very close to each other. Lin and Papageorgiou” attributed this beating effect to the strong
808 A. S. PAPAGEORGIOU AND B.-C. LIN
EU COflPONENT
a
o s 10 15 m 2s 30 K 40 TIVE (SECOND)
EU COVPONENT
- c w 5th FL
W o w U ' 1 1 -I a
w ERSEMNT 0 - - - v -
'p O S I O I S ~ E Y I S U I TIVE (SECOND)
TORSION TORSION
NS COVPONENl
o s i o i s m z s 3 ~ ~ ~ 1 TIVE ISECONO)
P J
NS COVPONENT
(pol 5 10 15 2p x b 3s 4a T I V E ISECONO)
Figure 5. Acceleration and displacement profile of the response of the Great Western Savings and Loan building
coupling of the first torsional mode to one of the two fundamental translational modes. Specifically, the translational mode has a period of - 2-10 sec while the torsional mode has a period of 1.66 sec. Two harmonic signals with these periods when combined produce a beating effect with a period equal to - 16 sec, which is equal to the period of the beats we observe in Figure 7.
The strong modal coupling observed in the earthquake response of the Santa Clara County building should have been anticipated, because the smooth and even dispersion of columns on an almost square floor plan suggests closely spaced characteristic frequencies of the torsional and translational modes.'
Concluding this short discussion on the dynamic behaviour of the Santa Clara County Office building, we should mention an important observation, made by Hoerner' in his study of the modal coupling in tall buildings, which pertains to the recorded response of the above structure. He observed that the closeness of
Tabl
e 11
1. V
ibra
tion
char
acte
rist
ics
of t
he G
reat
Wes
tern
Sav
ings
and
Loa
n bu
ildin
g in
ferr
ed fr
om 3
-D a
naly
ses
Tim
e in
terv
al
61
7 se
c 17
-22
sec
Mod
e r=
1
r=2
r=
3
r=4
r=
5 r=
6
r= 1
r=
2
r=3
1s
t E-W
1s
t N-S
sp
urio
us
1st t
orsi
onal
2nd
N-S
2n
d E-
W
1st E
-W
1st N
-S
1st t
orsi
onal
Peri
od T
, (se
c)
059
0.82
0.
78
0.37
0.
27
0.22
0.64
0.9 1
0-
39
[Fre
quen
cy (
Hz)
f, (=
l/T
r)l
[1.6
9]*
[1.2
2]*
[1.2
8]*
[2,7
0]*
[3.7
0]*
[4.5
5]*
[l-56
1 Cl
.101
C2
.561
Dam
ping
&(%
) 2.7
3.
0 oa
3
3
3.9
3.4
4,6
4.5
4.0
Part
icip
atio
n
C&
1.
264
0.04
9 -0
.080
0.
122
0009
-0
'166
1.
333
-0.0
49
0.06
6 0;'
0.26
6 0.
011
-0.3
30
1.30
1 0.
093
0.07
1 -0
,200
-0
.667
1.
233
fact
ors
a$
- 0.0
27
1.30
6 0-
038
0.04
7 -0
.548
-0
.002
00
56
1.12
5 -0
.174
Mod
al s
hape
s R
(r)
rwf,
EW
1.
00
0.02
1 .00
0.05
- 00
3 1 .00
1 .00
-0.0
8 0.
06
04
1 -
0-00
0.
57
0.00
0-
02
-0.9
7 0.
4 1
-0.0
4 -0
.04
000
-0.0
1 0-
08
0.4 1
0.0
0 - 0.
02
002
-000
3 04
5 R(
')
R(') 5th
flm
r.N
S -0
01
0.48
0.
26
- 0-
02
- 1.
00
0.0 1
0.
02
0.50
-0
17
R (I)
5th
flo
or,E
W
R'" rW
f.8
0.0 1
-0
01
0.17
1 -00
- 0.
03
0.06
0.
05
0.03
1-
00
5th
mr.
e R
Zdo
f,N
S - 0.0
2 1 .00
- 0.0
6 0.
02
1 -00
0.03
00
2 1.
00
020
Nor
mal
ized
erro
r J
0.22
9 0.
192
0
EW
COnP
ONEN
T 1
8
mz - 0 w
\'
u
W
cn
\=
- 17
18
19
20
21
22
=
$
z TI
flE
(SE
C)
--
- Tw
E-n
mE
noo
n.
17 18
19
20
21
22
TI
ME
(SEC
)
0
03
0 TROO
F TO
RSIO
N I 2
TIflE
(SE
C)
0-
c
(I
WW
UP
u
HZ
a 0
_-
- TH
REE-
MO
E @
DEL-
m 7 17
18
19
20
21
22
TIRE
(SE
C)
0
HO
2' 5
th F
L NS C
OMPO
NENT
s s h
U
C
U
pl
w
" i
5 0
---
THRE
E-tlo
pE
rgoEL
. aD
17
18
19
20
21
22
TIfl
E (
SEC)
Figu
re 6
. A
bsol
ute
acce
lera
tions
(-) at
the
roo
f an
d 5t
h flo
or o
f th
e G
reat
Wes
tern
Sav
ings
and
Loa
n bu
ildin
g an
d ca
lcul
ated
acc
eler
atio
ns (-
- -)
: 3-
D a
naly
sis
(con
sider
ing o
nly
thre
e of
the
four
mod
es sh
own
in T
able
111)
LATERAL-LOAD-RESISTING SYSTEM
- EU COflPONENT
81 1
EU COnPONENT
a e P T 2 n d F C
0 1 0 2 0 0 ( 0 w w m m T I E ISECONOI
TORSION I
NS COMPONENT
w ln
TI ' o m 2 o 3 o u ) w ~ o m w
TIRE ISECONOI
F'D z w S W
:? a v)
0 c r S 2ndFL
c 'D 1 L O K R LEVEL
I - ~ o m m a A w w m w TIflE (SECONO)
TORSION
a c 0
NS CONPONENT
t i 0 1 0 2 o a a w w m m TIME ISECONDI
Figure 7. Acceleration and displacement profile of the response of the Santa Clara County Office building
812 A. S. PAPAGEORGIOU A N D B.-C. LIN
the values of the translational stiffnesses in the two orthogonal principal directions (and the corresponding fundamental frequencies) are not as influential as the closeness of the corresponding translational and rotational parameters. This is because the off-diagonal terms in the stiffness matrix couple directly only translational and torsional motions. Coupling of translational vibrations can occur only indirectly, that is, by way of torsion. Clearly, this is what is happening in the response of the Santa Clara County building. Despite the fact that the two translational fundamental periods are closer to each other than to the fundamental torsional-Lin and Papageorgiou” found the two translational periods to be around 2.10 sec while the torsional period was estimated to be about 1.66 sec-the strong beating effect is observed in the rotational component of motion and not in the translational components of motion which exhibit a considerably weaker beating effect, if at all.
DISCUSSION
Having analysed the earthquake response of the three high-rise buildings studied in this paper, let us focus our attention on the three-dimensional aspects of the vibrations and in particular on the torsional motions. These are of particular interest to design engineers because many conventional dynamic response analyses consider planar structural models subjected to single component ground motions and the three-dimensional aspects of the response are only approximately accounted for in design.
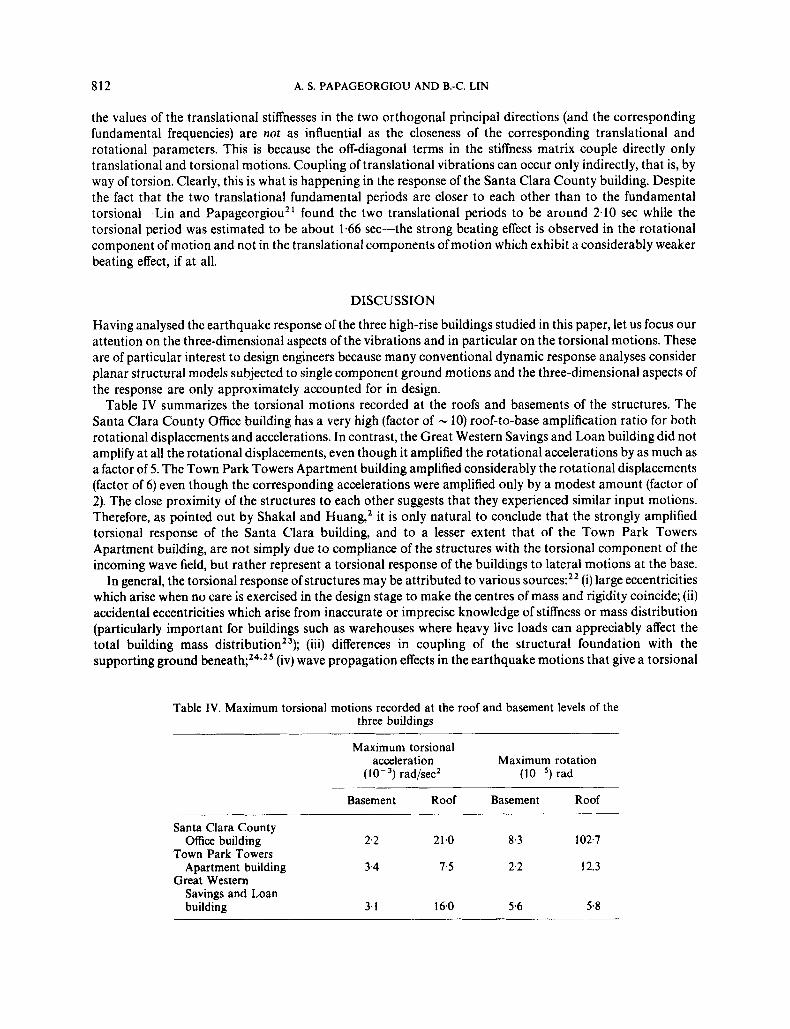
Table IV summarizes the torsional motions recorded at the roofs and basements of the structures. The Santa Clara County Office building has a very high (factor of - 10) roof-to-base amplification ratio for both rotational displacements and accelerations. In contrast, the Great Western Savings and Loan building did not amplify at all the rotational displacements, even though it amplified the rotational accelerations by as much as a factor of 5. The Town Park Towers Apartment building amplified considerably the rotational displacements (factor of 6) even though the corresponding accelerations were amplified only by a modest amount (factor of 2). The close proximity of the structures to each other suggests that they experienced similar input motions. Therefore, as pointed out by Shakal and Huang,’ it is only natural to conclude that the strongly amplified torsional response of the Santa Clara building, and to a lesser extent that of the Town Park Towers Apartment building, are not simply due to compliance of the structures with the torsional component of the incoming wave field, but rather represent a torsional response of the buildings to lateral motions at the base.
In general, the torsional response of structures may be attributed to various sources:z2 (i) large eccentricities which arise when no care is exercised in the design stage to make the centres of mass and rigidity coincide; (ii) accidental eccentricities which arise from inaccurate or imprecise knowledge of stiffness or mass distribution (particularly important for buildings such as warehouses where heavy live loads can appreciably affect the total building mass distributionz3); (iii) differences in coupling of the structural foundation with the supporting ground beneath;z4*z5 (iv) wave propagation effects in the earthquake motions that give a torsional
Table IV. Maximum torsional motions recorded at the roof and basement levels of the three buildings
Maximum torsional
( 10 - 3, rad/sec2 acceleration Maximum rotation
(lo-’) rad
Basement Roof Basement Roof ~~ ~
Santa Clara County
Town Park Towers
Great Western
Office building 2.2 21.0 8.3 102.7
Apartment building 3 4 7.5 2.2 12.3
Savings and Loan building 3.1 160 5.6 5 3
LATERAL-LOAD-RESISTING SYSTEM 813
input to the s t r ~ c t u r e ; ~ ~ ’ ~ ~ and (v) torsional motions in the earth itself during the earthquake.26 Of the above sources of torsional response, the last three cause torsional effects over and above those due to lack of coincidence between the centres of mass and resistance.
Eccentricities in general cause modal coupling, and it is fairly obvious that large eccentricities cause strong modal coupling. Less obvious though is the fact that, even with small eccentricities, strong modal coupling can occur if the natural frequencies of the torsional and translational modes of vibration are spaced close to each other. This phenomenon was first observed by Shepherd and Donald’* in numerical experiments and by Jennings etal.’’ in the forced vibration tests of a tall steel frame building. Motivated by these observations, Hoerner’ conducted a systematic analytical study of the modal coupling and earthquake response of tall buildings and concluded that a sufficient condition for the mode shapes to be nearly uncoupled is that the eccentricities be small with respect to the difference in the corresponding natural frequencies. Stating this differently, even with small accidental eccentricities, modal coupling effects can be strong if the torsional and translational natural frequencies are spaced closely enough. It was also noted by the above investigators that, if the frequencies are close together, a beating-type phenomenon would be likely, and hence the traditional square-root-of-sum-of-squares (SRSS) rule for combining modal maxima-applicable to well-separated frequencies-should be replalaced by an absolute sum of the maxima of the modal responses. Such a beating- type phenomenon is clearly observed in the recorded response of the Santa Clara County Office building. The exterior cores at the south and west ends [Figure l(c)] introduce some eccentricity, which, even though not necessarily large in absolute terms, is large enough relative to the difference between the translational and torsional frequencies of vibration of the structure to cause the observed strong coupling effect. The dynamic behaviour of the Santa Clara County building should be contrasted to that of the Great Western Savings and Loan building which has well separated natural frequencies and exhibits no modal coupling and small torsional response.
CONCLUSION
As a final remark, we will repeat the conclusions and design recommendations put forward by various investigators.*%’ 1*1 3,14
1. Designs for which modes are relatively uncoupled should be sought. 2. Rectangular buildings with either central cores or peripheral shear walls (such as the Great Western
Savings and Loan building) as primary resistive elements tend to have relatively uncoupled modes and their dynamic behaviour is not much affected by accidental eccentricities.
3. Strong modal coupling makes earthquake response of structures different from that envisioned by codes. Thus, the SRSS rule of combining modal maxima is a reasonable estimator of maximum total response when frequencies are well separated, but even then not necessarily con~ervative.~~ Other rules, such as the complete- quadratic-combination (CQC) rule27328 are recommended as better estimators of the true maximum response.
ACKNOWLEDGEMENTS
The authors would like to thank the Staff of the Office of Strong Motion Studies of the California Division of Mines and Geology and in particular Drs Moh-Jiann Huang and Antony F. Shakal for providing the data used in this work.
REFERENCES 1 . M. J. Huang, A. F. Shakal, D. L. Parke, R. W. Sherburne and R.V. Nutt,’Processed Data from the Strong-motion records of the
Morgan Hill earthquake of 24 April 1984, Part 11. Structural-response records’, Office of Strong Motion Studies, Division of Mines and Geology, California Department of Conservation, Report No. OSMS 8 5 4 , Nov. 1985.
2. A. F. Shakal and M. J. Huang ‘Torsional response of three instrumented buildings during the 1984 Morgan Hill earthquake’, Proc. 3rd U.S. Con5 earthquake eng. Charleston, South Carolina (1986).
3. J. L. Beck, ‘Determining models of structures from earthquake records’ Report No. EERL 78-01, California Institute of Technology, Pasadena, CA, 1978.
4. J. L. Beck and P. C. Jennings, ‘Structural identification using linear models and earthquake records’, Earthquake eng. struct. dyn. 8, 145-160 (1980).
814 A. S. PAPAGEORGIOU AND B.-C. LIN
5. S. D. Werner, J. L. Beck and M. B. Levine, ‘Seismic response evaluation of Meloland Road Overpass using 1979 Imperial Valley
6. S. Naaseh, ‘The Morgan Hill earthquake of April 24,1984. Performance of three engineered structures’ Earthquake spectra 1,579-593
7. R. S. Ayre, ‘Interconnection of translational and torsional vibrations in buildings’, Bull. seism. soc. Am. 29, 89-130 (1938). 8. J. B. Hoerner, ‘Modal coupling and earthquake response of tall buildings’ Report No. EERL7147, California Institute of
9. C. L. Kan and A. K. Chopra, ‘Effects of torsional coupling on earthquake forces in buildings’, J. struct. diu. ASCE 103,805-819 (1977). 10. C. L. Kan and A. K. Chopra, ‘Elastic earthquake analysis of a class of torsionally coupled buildings’ J. struct. diu. ASCE 103,821-838
1 I . C. L. Kan and A. K. Chopra, ‘Elastic earthquake analysis of torsionally coupled multistorey buildings’, Earthquake eny. struct. dyn. 5,
12. J. Penzien, ‘Earthquake response of irregularly shaped buildings’, Proc. 4th world con5 earthquake eng. Santiago, Chile, 2, A3-
13. S. Y. Kung and D. A. Pecknold, ‘Effects of ground motion characteristics on the seismic response of torsionally coupled elastic
14. R. Shepherd and R. A. H. Donald, ‘Seismic response of torsionally unbalanced buildings’, J. sound uib. 6, 2G37 (1967). 15. P. C. Jennings, R. 8 . Mathiesen and J. B. Hoerner, ‘Forced vibration of a tall steel-frame building’ Earthquake eng. struct. dyn. 1,
16. S. H. Hartzell and T. H. Heaton ‘Rupture history of the 1984 Morgan Hill, California, earthquake from the inversion of strong
17. G. C. Beroza and P. Spudich, ‘Linearized inversion for fault rupture behavior: Application to the 1984, Morgan Hill, California
18. R. W. CIough and J. Penzien, Dynamics ofStructures, McGraw-Hill, New York, 1975. 19. B. C. Lin, ‘Dynamic characteristics and comparisons of base-isolatbd buildings under ground excitation’, Ph.D. Dissertation,
20. G. H. McVerry, ‘Frequency domain identification of structural models from earthquake records’, Report No. EERL 79-02,
21. B. C. Lin and A. S. Papageorgiou, ‘Demonstration of torsional coupling caused by closely spaced periods: 1984 Morgan Hill
22. A. K. Chopra and N. M. Newmark,’ Analysis’, Chapter 2 in Design ofEarthquake Resistant Structures (E. Rosenblueth, ed. ), Pentech
23. D. G. Elms, ‘Seismic torsional effects on buildings’, Bull. N.Z. natl. SOC. earthquake eng. 9, 79-83 (1976). 24. J. P. Wolf, Dynamic Soil-Structure Interaction, Prentice-Hall, Englewood Cliff, N. J., 1985. 25. N. M. Newmark, ‘Torsion in symmetrical buildings’ Proc. 4th world conf: earthquake eng. Santiago, Chile, 2, A3-19-A3-32 (1969). 26. M. Bouchon and K. Aki, ‘Strain, tilt, and rotation associated with strong ground motion in the vicinity of earthquake faults’, Bull.
27. E. L. Wilson, A. Der Kiureghian and E. P. Bayo, ‘A replacement for the SRSS method in seismic design,’ Earthquake eng. struct. dyn.
28. A. Der Kiureghian, ‘A response spectrum method for random vibration analysis of MDOF systems’, Earthquake eng. struct. dyn. 9,
earthquake records, Earthquake eng. struct. dyn. 15,249-274 (1987).
(1985).
Technology, Pasadena, CA. 1971.
( 1977).
395412 (1977).
75-A3-89 (1969).
systems’, Report to NSF, University of Illinois at Urbana-Champaign, Urbana, IL, 1982.
107-1 32 ( 1 972).
motion records’ Bull. seism. SOC. Am. 76, 649-674 (1986).
earthquake’, J. geophys. res. 93,6275-6296 (1988).
Rensselaer Polytechnic Institute, Troy, New York, 1988.
California Institute of Technology, Pasadena, CA, (1979).
earthquake, response of the Santa Clara County Building’, Earthquake spectra 5, Aug. 1989.
Press, London, 1980.
seism. SOC. Am. 72, 1717-1738 (1982).
9, 187-194 (1981).
419435 (1981).