Embed Size (px)
Citation preview

Continuous Moving MeasurementMethod for Thermal Environmental
Distributions in Streets
Masaki NAKAO*, Minako NABESHIMA,Masashi MIZUNO, Masatoshi NISHIOKA,
Oosaka City University, Osaka, Japan Tomoko HASAGAWA
Kyoto University, Kyoto, Japan

Pyrgeometer
GPS
Pyranometer
Air temperature
Infrared thermometer
1000mm
1500
mm
赤外放射計日射計
GPS
熱電対日射遮蔽シェルター
放射温度計
350㎜
Vehicle for continuous moving measurent
Pyrgeometer
Pyranometer
Infrared thermometerSensors and GPS attached

②Delay time in the GPS terminal
① Time lag of the sensors
Why error occurs
GPSTrue ValueMeasured Data
Val
ue
Position of the Sensor X
Measurement errors

PyranometerStep Response
① Time lag of the sensors
0100200300400500600700
0 5 10 15 20Time s
Am
ount
of c
hang
e W
/m2

②Delay time in the GPS terminals
location
GPS receiver
receiving signalsfrom satellites
X
Sensing data at time tat the location X
[logging data ]X+⊿X
Sensing and logging dataat time t+⊿t as thelocation X, but at thelocation X+⊿X
Processing time ⊿t

Estimation system
Estimation System
Sensing Data
Position X
True Value
Position X

Data measuring position x
dVtttVxx !!+= )( 00
t : Timex : Data measuring position at time tx0 : Initial position of the sensorV : Moving speed of the sensort0 : Initial timetd : GPS delay time from receiving from the satellites to outputting the positioning informationxp : The sensor position at time t
The sensor position xp at time t :)( 00 ttVxxp !+=
Data measuring position x at time t :(1)
(2)

Input/output relation of the sensor
MeasurementTrue value ofthe spatialdistributionf(x)=u(t)
Measurementvalue g(t) ofthe sensor inthe timedomain
u(t): True value of the measured property at time t
f(x) : True value of the measured property at the positon x
g(t) : Instantaneous value of the data measured by the sensor at time t

Assuming the sensor response as a first-order lag system,
)()()(
tutgdx
tdgT =+
( ) !! "##+##=t
t
dssuTTsttgTtttg
0
)(/}/)(exp{)(}/exp{)( 00
the solution is the following equation.
Assuming u(t) is constant over the time interval, thisequation is transformed to the following discrete system.
)()1()()( tuetgettg T
t
T
t !"
!"
"+=!+
(3)
(4)
(5)

An Inverse system of responsecharacteristics of the sensor
An inversesystem of thesensor
Input u(t)to thesensor
Measurementvalue g(t) ofthe sensor
The inverse system of the equation will bethe following equation.
)1/()()()( T
t
T
t
etgettgtu
!"
!"
"#$%
&'(
"!+=

Moving average
Movingaverage
Movingaverage u(t)of input tothe sensor
Input u(t)to thesensor
)12/()()( +!+= "#=
Ntitutu
N
Ni

Transformation of the input signal of thesensor to the spatial distribution
Transformationfrom time domainto spatial domain
Estimatedvalue F(x)of the spacedistribution
Movingaverage u(t)of input signalto the sensor
Also, a transformation from time to space is made bysubstituting ( ) VtVxxtt
d/
00+!+=
The spatial distribution F(x) will be obtained.( ) )/()( 00 VtVxxtuxF
d+!+=

Step responses of the pyranometer
Step response ofthe pyranometer
An approximationof first-order lagsystem
An approximation of first-order lagsystem
Sola
r rad
iatio
n [
W/m
2 ]
Time [s]0
100200300400500600700
0 5 10 15 20 25 30 35
Pyranometer

Step responses of the pyrgeometer(IRradiometer)
Infr
ared
radi
atio
n [
W/m
2 ] Step response of thepyrgeometer(IR radiometer)
An approximation offirst-order lag system
Time [s]
05
1015202530354045
0 10 20 30 40

Step responses of the infraredthermometer
Step response of theinfrared thermometer
An approximation offirst-order lag system
Tem
pera
ture
cha
nge
[K]
Time [s]
02468
10121416
0 0.2 0.4 0.6 0.8 1 1.2 1.4 1.6

Step responses of the thermocoupleTe
mpe
ratu
re c
hang
e [K
]
Step response of thermocouple(0.1mmφ)
An approximation of first-order lag system(0.1mmφ)
Step response of thermocouple(0.3mmφ)An approximation of first-order lag system(0.3mmφ)
0
10
20
30
40
50
60
0 2 4 6 8 10 12 14 16Time [s]
0
10
20
30
40
50
60
0 2 4 6 8 10 12 14 16
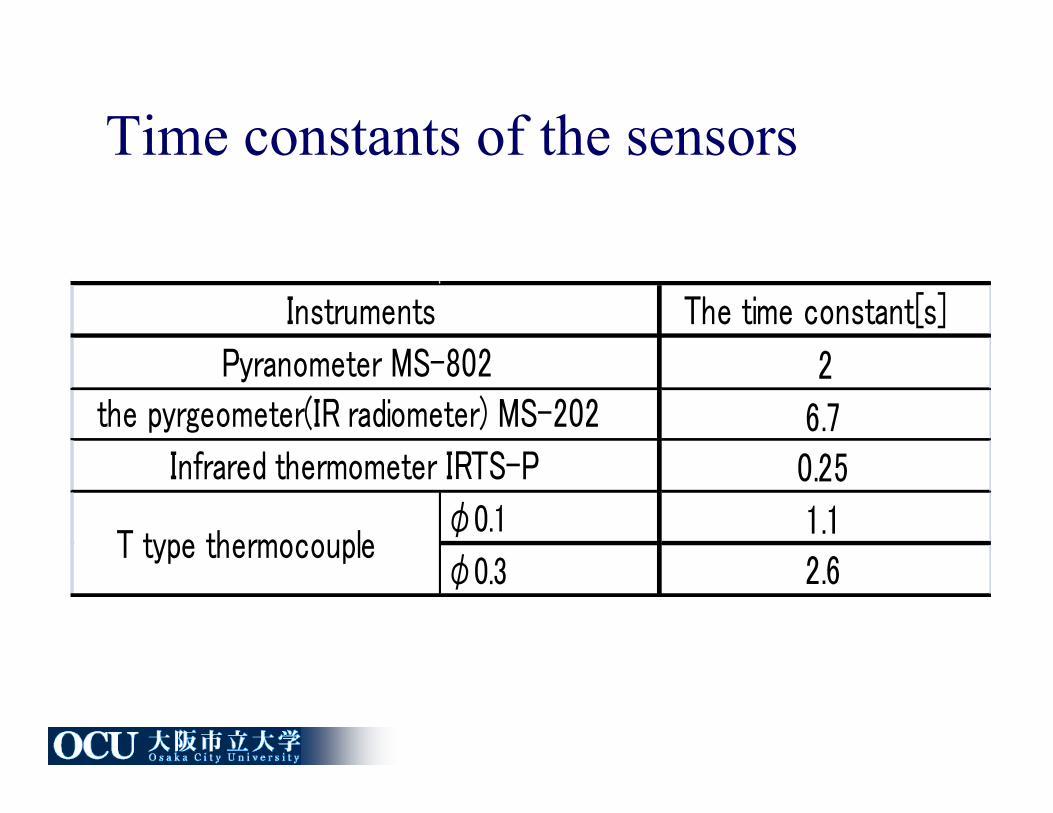
Time constants of the sensors
The time constant[s]
2
6.70.25
φ0.1 1.1φ0.3 2.6
Pyranometer MS-802the pyrgeometer(IR radiometer) MS-202
Infrared thermometer IRTS-P
T type thermocouple
Instruments

Installation of the sensors
1000mm
1500
mm
Solar shading
Air temperature
GPS
Pyranometer
Pyrgeometer(IR radiometer)
Datalogger
Infraredthermometer
350m
m
Themocouple
PyranometerGPS
Pyrgeometer(IR radiometer)

Field testDate: 2005/10/12Place : Osaka city, JapanSpeed: 5km/h 10km/h 20km/h 40km/h
data sampling interval:0.2 sGPS delay time:1 s
500 m
E
A BWE

Moving measurement result of the pyranometer
0
200
400
600
800
135.5095135.5105135.5115135.5125135.5135135.5145Longitude
Sola
r rad
iatio
n [W
/m2
]
Low speed 10km/h 20km/h 40km/h Position of trees along the street
EAST WEST

Moving measurement result of the pyrgeometer(IRradiometer)
360
380
400
420
440
135.5095135.5105135.5115135.5125135.5135135.5145
Longitude
Infr
ared
radi
atio
n[W
/m2 ]
10km/hLow speed 20km/h 40km/h Position of trees in the street
EAST WEST
40km/h

0
100
200
300
400
500
600
700
800
900
1000
135.509135.51135.511135.512135.513135.514
全天日射量
[ W / m 2 ]
経度[ƒ]
Comparative result of the moving measurement value, thetrue value and the estimated value of the pyranometer
Sola
r rad
iatio
n [W
/m2 ]
Longitude
Moving directionof the sensor
The estimatedvalue F(x)
True value f(x) (measurementvalue at the low speed of 5 km/h)
Measured data at 40 km/h
EAST WEST

360
370
380
390
400
410
420
430
440
135.509135.51135.511135.512135.513135.514
赤外放射量
[ W / m 2 ]
経度[ƒ]
Comparative result of the moving measurement value, thetrue value and the estimated value of pyrgeometer(IRradiometer)
Infr
ared
radi
atio
n [
W/m
2 ] Measured data at the speed of 40 km/h
True value f(x)(measurement value at 5 km/h)
The estimated valueF(x)
Longitude
Moving directionof the sensor
EAST WEST

Conclusion
1. A method to estimate the spatial distribution from datawhich was obtained by continuously measuring instreets, using sensors which have a response lag andGPS which has a time delay.
2. The measurement error of the pyranometer with a 2.0-second time constant was extremely small.
3. The error was much larger for the pyrgeometer (IRradiometer) with a comparably large 6.7-second timeconstant.
4. By applying this method, it became obvious thatmeasurement error can be effectively decreased.

500mW A B E500m500mW A B E
0
200
400
600
800
0 5 10 15 20
time[sec]
resp
on
se[W
/ !]
measurmentapproximation
( ) !"#
$%& ''=
T
ttt
)(exp 0(
T: time constant[sec]
ContinuousMoving
MeasurementTrue
distribution
Sensing Data andLocation output ofGPS
EstimationSystem
Estimateddistribution
360
370
380
390
400
410
420
430
440
135.509135.51135.511135.512135.513135.514
!"#$%
[W/m2]
&' [ƒ]
Infr
ared
rad
iati
on
[
W/m
2]
Measured data at the speed of 40 km/h
True value f(x)
(measurement value at 5 km/h)
The estimated value
F(x), a dash line
Longitude
Moving direction
of the sensor
EAST WEST
360
370
380
390
400
410
420
430
440
135.509135.51135.511135.512135.513135.514
!"#$%
[W/m2]
&' [ƒ]
Infr
ared
rad
iati
on
[
W/m
2]
Measured data at the speed of 40 km/hMeasured data at the speed of 40 km/h
True value f(x)
(measurement value at 5 km/h)
True value f(x)
(measurement value at 5 km/h)
The estimated value
F(x), a dash line
The estimated value
F(x), a dash line
Longitude
Moving direction
of the sensor
EAST WEST

Exampleofcontinuousmovingmeasurement
2008年8月2日19時半の気温分布図(移動観測データ+定点観測データ)
START
GOAL
300m
d.土佐公園
e.日吉公園
a.堀江公園
b.南堀江公園c.高台橋公園
j.島津公園 i.阿波座南公園
h.新町北公園
g.新町南公園
f.松島公園
※赤☆は定点観測地点、赤・緑・青線は移動観測経路堀江周辺地図

Measurement plan
Spatial frequency to measure<Cut-off spatial frequency
Moving velocity
Sampling interval
21[1/m]π
μ<μ TVc=
21][
21[km/h] 0
μs
μπ
Vtt
TVV
s=≤
=≤
[m/s]Velocity Time constant
:V[s]:T

0
20
40
60
80
100
0 0.02 0.04 0.06 0.08 0.1Cut-off Spatial frequency [1/m]
Spee
d [k
m/h
]
Infrared thermometerPyranometerPyrgeometer
Measurement PlanChoice of Speed
Spatial frequency⇒Instrument⇒Speed
0.04[1/m]
60km
25m

0
1
2
3
4
5
0 0.02 0.04 0.06 0.08 0.1Spatial frequency[1/m]
Sam
plin
g in
terv
al [s
]
20km40km60km80km
0.8
Interval<0.8sec
Measurement PlanSampling interval
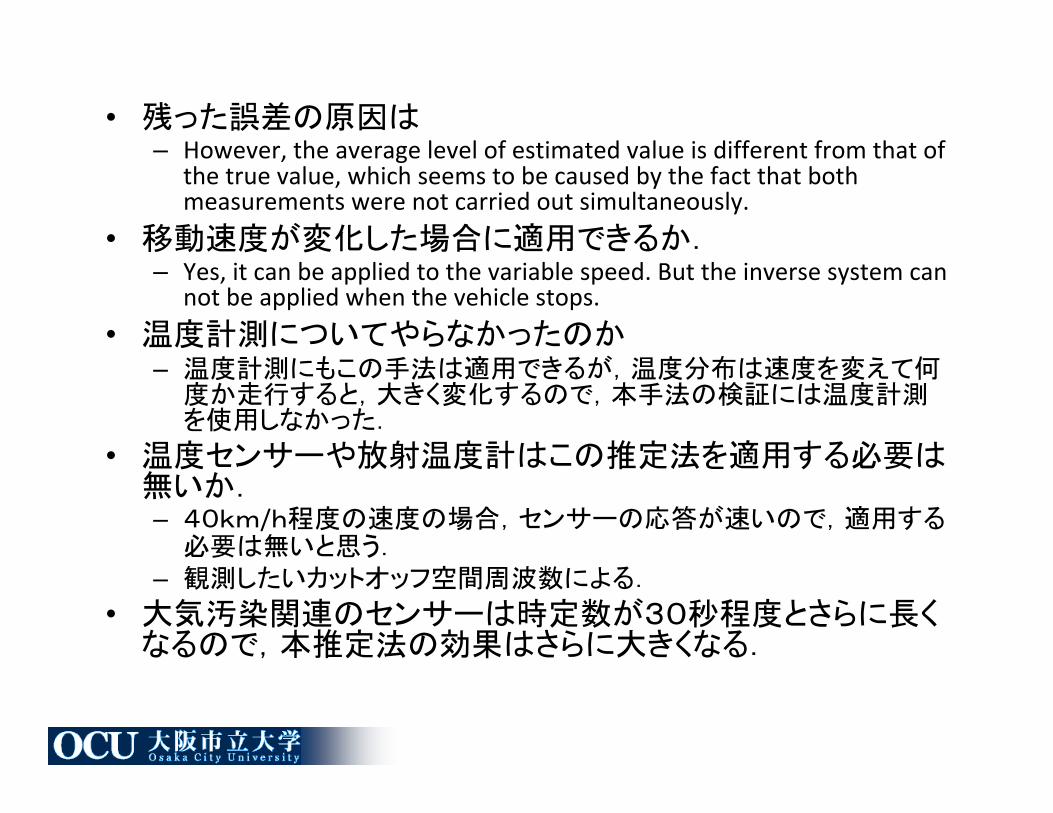
• 残った誤差の原因は– However,theaveragelevelofestimatedvalueisdifferentfromthatof
thetruevalue,whichseemstobecausedbythefactthatbothmeasurementswerenotcarriedoutsimultaneously.
• 移動速度が変化した場合に適用できるか.– Yes,itcanbeappliedtothevariablespeed.Buttheinversesystemcan
notbeappliedwhenthevehiclestops.
• 温度計測についてやらなかったのか– 温度計測にもこの手法は適用できるが,温度分布は速度を変えて何度か走行すると,大きく変化するので,本手法の検証には温度計測を使用しなかった.
• 温度センサーや放射温度計はこの推定法を適用する必要は無いか.– 40km/h程度の速度の場合,センサーの応答が速いので,適用する必要は無いと思う.
– 観測したいカットオッフ空間周波数による.• 大気汚染関連のセンサーは時定数が30秒程度とさらに長くなるので,本推定法の効果はさらに大きくなる.