Embed Size (px)
Citation preview
POLICY RESEARCH WORKING PAPER 3 13 9
Contracting Models of the Phillips Curve
Empirical Estimates for Middle-Income Countries
Pierre-Richard Aggnor
Nihal Bayraktar
The World BankWorld Bank InstitutePoverty Reduction and Economic Management DivisionSeptember 2003
Pub
lic D
iscl
osur
e A
utho
rized
Pub
lic D
iscl
osur
e A
utho
rized
Pub
lic D
iscl
osur
e A
utho
rized
Pub
lic D
iscl
osur
e A
utho
rized
| POLICY RESEARCH WORKING PAPER 3139
Abstract
This paper provides empirical estimates of contracting The results indicate that for both Chile and Turkey pastmodels of the Phillips curve for four middle-income and future inflation are of about the same magnitude indeveloping economies-Chile, the Republic of Korea, affecting current inflation. In Korea past inflation has athe Philippines, and Turkey. Following an analytical larger impact on inflation, whereas in the Philippines it isreview, models with both one lead and one lag, and two future inflation that plays a larger role. Homogeneitylags and three leads, are then estimated using restrictions are satisfied for Korea and Turkey but notGeneralized Method of Moments (GMM) techniques. for Chile and the Philippines.
This paper-a product of the Poverty Reduction and Economic Management Division, World Bank Institute-is part ofa larger effort in the institute to understand the dynamics of inflation in developing countries. Copies of the paper areavailable free from the World Bank, 1818 H Street NW, Washington, DC 20433. Please contactMaria Gosiengfiao, roomJ4-280, telephone 202-473-3363, fax 202-676-9810, email address [email protected]. Policy ResearchWorking Papers are also posted on the Web at http://econ.worldbank.org. The authors may be contacted at [email protected] or [email protected]. September 2003. (24 pages)
The Policy Research Working Paper Series disseminates the findings of work in progress to encourage the exchange of ideas aboutaeveiopment issues. Ain ojecwive of te series is to get tbe fnaings ouL qluciz;y, euen if ebe presentations are less tban suliy pomlsnca. Tbe
papers carry the names of the authors and should be cited accordingly. The findings, interpretations, and conclusions expressed in thispaper a.rA ontire, tt-o of tbe auth-rs The¢o. not n4rcenrii- rflrcnrt tbe, iJ of th W-orJd Rank, ;ts F-eCutibe flrenonrc -r th,
countries they represent.
Produced by the Research Support Team
Contracting Models of the Phillips Curve:Empirical Estimates for Middle-Income
Countries
Pierre-Richard Ag6nor and Nihal BayraktarThe World Bank
Washington DC 20433
JEL Classification Numbers: E44, F32, F34

I Introduction
The degree of wage and price stickiness plays an important role in the trans-
mission of macroeconomic shocks. In traditional backward-looking Phillips
curves, inertia in the wage- and price-contracting process is generally cap-
tured by introducing measures of past inflation.' By contrast, in models of
overlapping contracts with forward-looking agents, inflation is represented as
a function of its expected future realizations, based on all available informa-
tion about the state of the economy. Indeed, several of these models, such as
the Taylor-Calvo staggered contracts approach (see Taylor (1979, 1980) and
Calvo (1983)) and the quadratic price adjustment cost approach of Rotem-
berg (1982), have a common formulation that is similar to an expectations-
augmented Philipps curve, with current prices depend on future prices.2
Several recent studies have provided estimates of forward-looking con-
tracting models (also called New Keynesian models) of the Phillips curve,
most notably Fuhrer (1997), Galf and Gertler (1999), Guerrieri (2002), Roberts
(1995, 2001), and Rudd and Whelan (2001). However, all of these studies fo-
cus on the United states; given the conflicting nature of some of the results, it
is difficult to draw general inference from them for other industrial countries,
or, for that matter, developing countries. In this paper, we provide empirical
'It is also argued that past inflation is a proxy for expectations of future inflation.2See Roberts (1995). These two approaches are often referred to as "time-dependent"
models (see Ball, Mankin and Romer (1988)), because firms set their prices for fixedperiods of time. An alternative approach to sticky prices relies on "state-contingent"adjustment rules, in which firms change price when underlying determinants, such asdemand and costs, reach some pre-specified upper or lower bounds. See, Romer (2000)and Sutherland (1995) for a discussion, and Mankiw and Reis (2001) for an effort to moveaway from the sticky-price models that underlie contracting models of the Phillips curve,in understanding inflation dynamics.
2
evidence on contracting models of inflation for four middle-income develop-
ing countries: Chile, Korea, the Philippines, and Turkey. These countries
represent a fairly diverse experience in terms of inflation, with countries like
Korea and the Philippines experiencing relatively low and stable inflation
during the sample period, whereas Chile and Turkey experienced higher and
more persistent episodes of inflation. Section II examines various types of
backward- and forward-looking models of inflation, including specifically the
model of Fuhrer and Moore (1995). Section III presents our econometric
methodology, which is based on GMM estimation. We use in our empirical
framework a weighted average of both past and expected future inflation, to
reflect elements of both the backward- and forward-looking approaches to the
Phillips curve, with the importance of each determined empirically. Section
IV presents the empirical results, whereas Section V concludes.
2 Contracting Models of the Phillips Curve
Much of the recent research on the dynamics of price adjustment in Keynesian
models dwells on the staggered contracts models of Taylor (1979, 1980), Calvo
(1983), Rotemberg (1982) and Fuhrer and Moore (1995). These models are
based on the assumption that wages are set in nominal terms at discrete
periods of time in an asynchronous fashion (because they are set by different
agents at different points in time) and, as a result, contracts overlap. Agents
are assumed to contract a wage that reflects their anticipations of future price
and output levels for the expected duration of the contract. These models
typically assume that prices are a constant markup over wages and focus on
the persistence induced in the aggregate price (average wage) level due to
3
the asynchronous and overlapping nature of wage contracts.3
The main difference between Taylor-type contracts and Calvo and Rotem-
berg models is that the individual firm's price-setting decision is derived from
an explicit optimization problem. In the latter group of models, the start-
ing point is an environment with monopolistically competitive firms: when it
has the opportunity, each firm chooses its nominal price to maximize prof-
its subject to constraints on the frequency of future price adjustments. For
instance, in the quadratic price adjustment model developed by Rotemberg
(1982), firms are assumed to minimize the total costs of changing prices.
Nevertheless, as shown by Roberts (1995), and as discussed by Clarida, Galf,
and Gertler (1999), all of these models can be formulated in the form of a
forward-looking Philipps curve, of the form
7rt = alyt + a2 Et7rt+1 + Et, a,i > 0,
where 0 < a 2 < 1, 7rt is the inflation rate, Et7rt+l denotes the one-period
ahead expected inflation rate, conditional on period t information, Yt the
output gap, and et a random shock with zero mean and constant variance.
In this setting, it can also be shown that cal is inversely related to the degree of
price rigidity; the longer prices are held fixed (on average), the less responsive
is inflation to cyclical fluctuations in output.
Various criticisms have been addressed to the Taylor-Calvo-Rotemberg
(TCR) approach. Ireland (2001) has argued that the approach is flawed in
the sense that it focused on the costs (or impossibility) of changing prices
in relation to the previous period's level, instead of focusing on changes3 Note that this approach does not postulate that formal contracts are actually written,
but rather that nominal prices (wages) are preset for some period of time.
4
relative to the previous period's level plus the average one-period inflation
rate. Andersen (1998) has argued that focusing on price staggering, instead
of wage staggering, does matter for output and price dynamics (namely,
the degree of persistence of shocks), in contrast to the TCR approach in
which implicitly it is assumed that there is no qualitative difference between
the two cases. Most importantly for our purpose here, it has been pointed
out that the TCR approach implies no persistence to the inflation rate (see
Estrella and Fuhrer (2000) for a detailed discussion). It has the implausible
implication that a credible disinflation program can be implemented at no
output cost.
Fuhrer and Moore (1995) have developed a price formation equation that
can indeed generate inflation inertia. Their model can be summarized as
follows. Suppose that agents negotiate nominal wage contracts that remain
in effect for four quarters. Unlike Taylor (1980), however, there is no fixed
markup from wages to prices. This difference is essential, because it allows
a meaningful distinction between prices and wages. The aggregate log price
index in quarter t, Pt, is a weighted average of the log of contract prices,
Xt-i, that were negotiated in the current and the previous three quarters and
are still in effect. The weights, 6i, are the proportions of the outstanding
contracts that were negotiated in quarter t -i,
3
Pt = 6ixt-i, (1)i=o
where bi > 0 and i = 1. Fuhrer and Moore (1995) assume that the
distribution of contract prices can be characterized by a downward-sloping
5
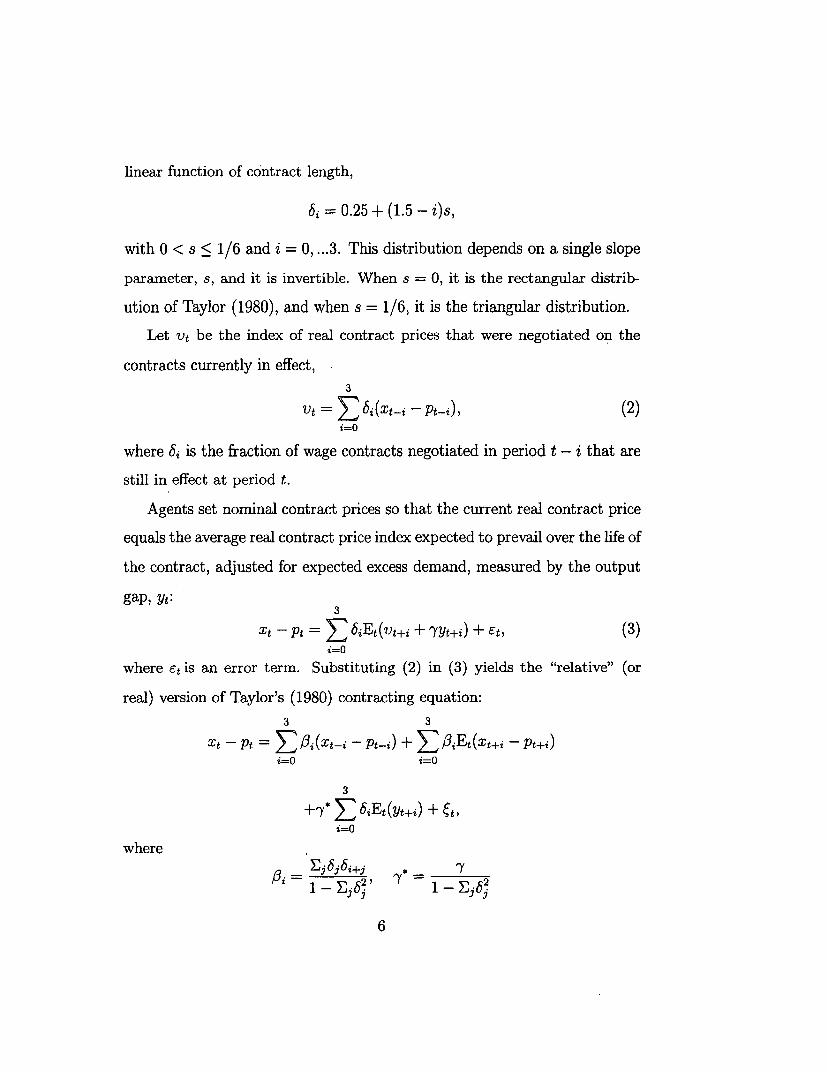
linear function of contract length,
6i = 0.25 + (1.5 - i)s,
with 0 < s < 1/6 and i = 0, ... 3. This distribution depends on a single slope
parameter, s, and it is invertible. When s = 0, it is the rectangular distrib-
ution of Taylor (1980), and when s = 1/6, it is the triangular distribution.
Let vt be the index of real contract prices that were negotiated on the
contracts currently in effect,3
Vt = bi(Xt-i - Pt-i), (2)i=o
where bi is the fraction of wage contracts negotiated in period t - i that are
still in effect at period t.
Agents set nominal contract prices so that the current real contract price
equals the average real contract price index expected to prevail over the life of
the contract, adjusted for expected excess demand, measured by the output
gap, yt:3
Xt - Pt = S &iEt(vt+i + 7Yt+i) + et, (3)i=O
where etis an error term. Substituting (2) in (3) yields the "relative" (or
real) version of Taylor's (1980) contracting equation:
3 3
Xt - Pt = 5i (xt-i - Pt-i) + EI3iEt(xt+i - Pt+i)i=o i=o
3
+y* E 6iEt(yt+i) + (t,i=O
where>2 j6
3 i+j ___
p3i = I__ Ejb a -Ej
6
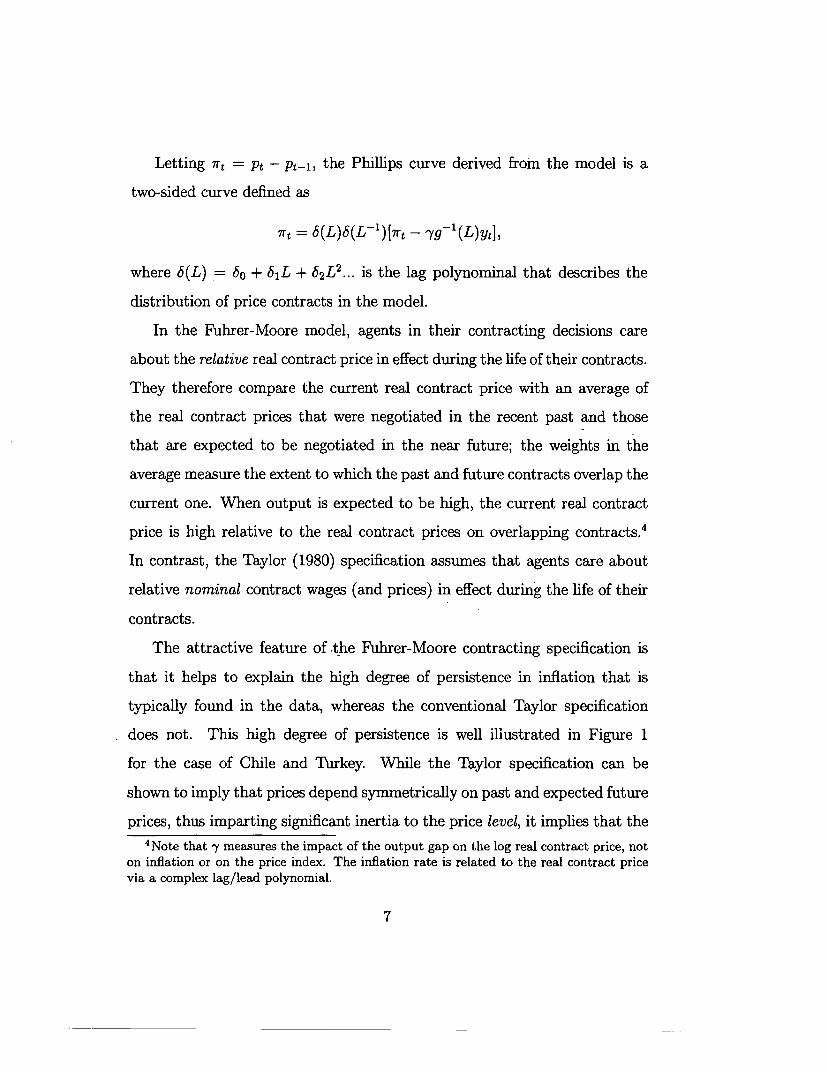
Letting 7rt = Pt - Pt-1, the Phillips curve derived from the model is a
two-sided curve defined as
7rt = 6(L)6(L- 1)[7rt - yg9-(L)yt],
where 6(L) = o0 + 61L + 62L2 ... is the lag polynominal that describes the
distribution of price contracts in the model.
In the Fuhrer-Moore model, agents in their contracting decisions care
about the relative real contract price in effect during the life of their contracts.
They therefore compare the current real contract price with an average of
the real contract prices that were negotiated in the recent past and those
that are expected to be negotiated in the near future; the weights in the
average measure the extent to which the past and future contracts overlap the
current one. When output is expected to be high, the current real contract
price is high relative to the real contract prices on overlapping contracts.4
In contrast, the Taylor (1980) specification assumes that agents care about
relative nominal contract wages (and prices) in effect during the life of their
contracts.
The attractive feature of the Fuhrer-Moore contracting specification is
that it helps to explain the high degree of persistence in inflation that is
typically found in the data, whereas the conventional Taylor specification
does not. This high degree of persistence is well illustrated in Figure 1
for the case of Chile and Turkey. While the Taylor specification can be
shown to imply that prices depend symmetrically on past and expected future
prices, thus imparting significant inertia to the price level, it implies that the
4Note that y measures the impact of the output gap on the log real contract price, noton inflation or on the price index. The inflation rate is related to the real contract pricevia a complex lag/lead polynomial.
7
inflation rate is highly flexible-that is, it can jump in response to news.
In contrast, the Fuhrer-Moore relative contracting specification implies that
inflation depends symmetrically on past and expected future inflation, thus
imparting significant inertia to both inflation and the price level. In addition,
the relative contracting model, because it implies a link between the inflation
rate and excess demand, can account for a correlation between demand and
inflation; the Taylor model, by contrast, links the price level and excess
demand and is thus not able to do so. 5
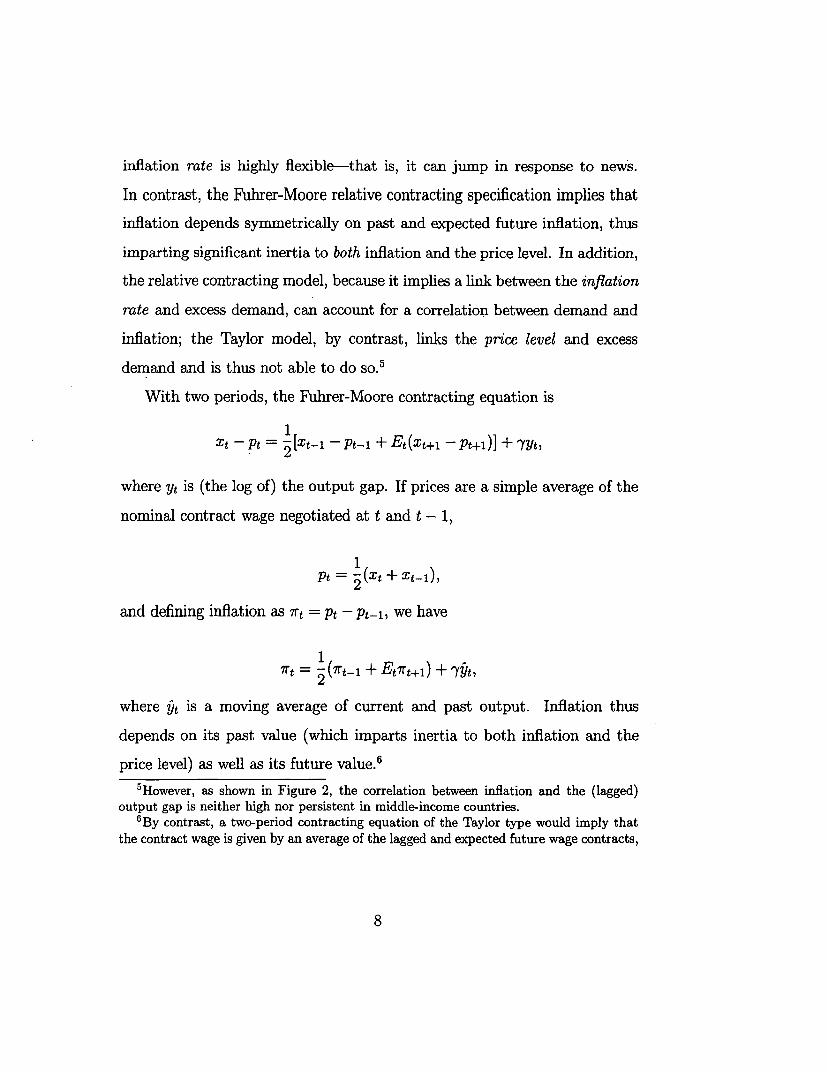
With two periods, the Fuhrer-Moore contracting equation is
Xt -Pt = 2x[t- --Pt-i + Et(xt+l - pt+i)] + YYt,
where Yt is (the log of) the output gap. If prices are a simple average of the
nominal contract wage negotiated at t and t - 1,
Pt = 1(xt + Xt-1),
and defining inflation as 7rt = Pt - Pt-1, we have
lrt 2 (rt-, + Etirt+i) + 9yt,
where 9t is a moving average of current and past output. Inflation thus
depends on its past value (which imparts inertia to both inflation and the
price level) as well as its future value.6
5However, as shown in Figure 2, the correlation between inflation and the (lagged)output gap is neither high nor persistent in middle-income countries.
6By contrast, a two-period contracting equation of the Taylor type would imply thatthe contract wage is given by an average of the lagged and expected future wage contracts,
8
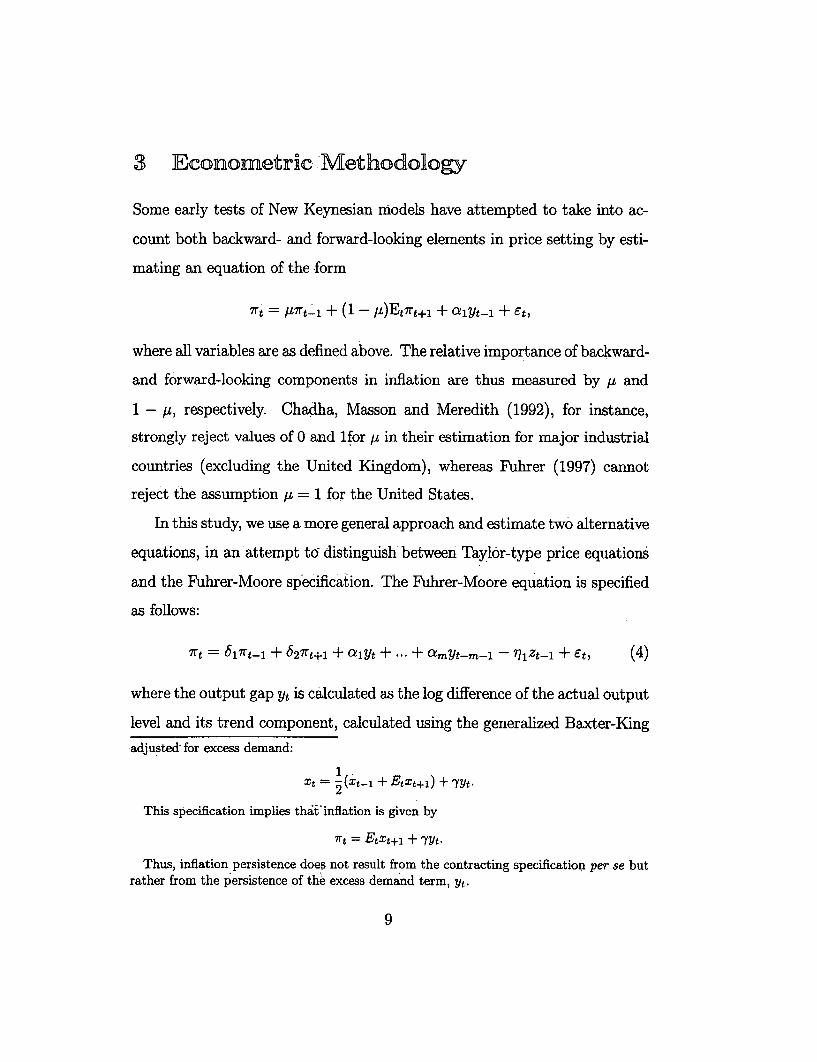
3 Econometric -Methodology
Some early tests of New Keynesian models have attempted to take into ac-
count both backward- and forward-looking elements in price setting by esti-
mating an equation of the -form
7rt = W7rt-1 + (1 - IL)Et7rt+l + C!lYt- + Et,
where all variables are as defined above. The relative importance of backward-
and forward-looking components in inflation are thus measured by I and
1 - , respectively. Chadha, Masson and Meredith (1992), for instance,
strongly reject values of 0 and lfor IL in their estimation for major industrial
countries (excluding the United Kingdom), whereas Fuhrer (1997) cannot
reject the assumption /s = 1 for the United States.
In this study, we use a more general approach and estimate two alternative
equations, in an attempt to distinguish between Taylor-type price equations
and the Fuhrer-Moore specification. The Fuhrer-Moore equation is specified
as follows:
7rt = 1v7rt-I + 627rt+l + alYt + ... + c&mYt_m - 771 Zt-1 + et, (4)
where the output gap Yt is calculated as the log difference of the actual output
level and its trend component, calculated using the generalized Baxter-King
adjusted- for excess demand:
xt =(xt-, + Etxt+i) + yyt.
This specification implies that-inflation is given by
7rt = Etxt+l + YYt.
Thus, inflation persistence does not -result from the contracting specification per se butrather from the persistence of the excess demand term, yt.
9
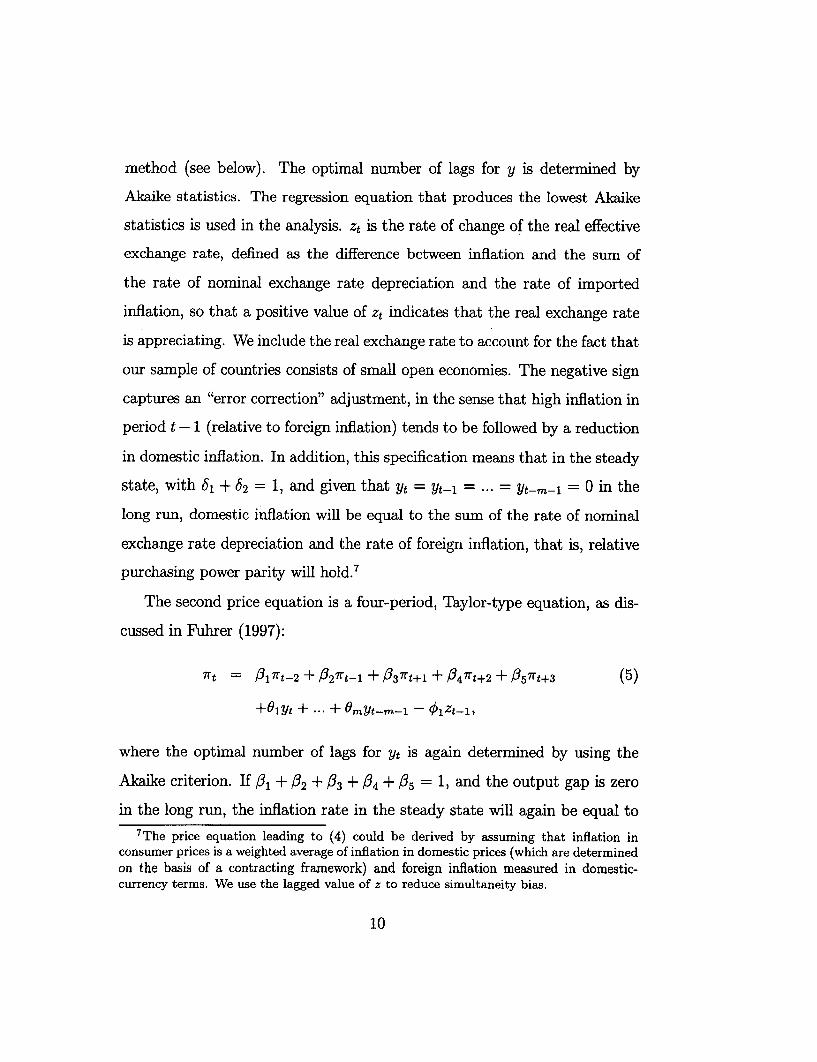
method (see below). The optimal number of lags for y is determined by
Akaike statistics. The regression equation that produces the lowest Akaike
statistics is used in the analysis. Zt is the rate of change of the real effective
exchange rate, defined as the difference between inflation and the sum of
the rate of nominal exchange rate depreciation and the rate of imported
inflation, so that a positive value of zt indicates that the real exchange rate
is appreciating. We include the real exchange rate to account for the fact that
our sample of countries consists of small open economies. The negative sign
captures an "error correction" adjustment, in the sense that high inflation in
period t - 1 (relative to foreign inflation) tends to be followed by a reduction
in domestic inflation. In addition, this specification means that in the steady
state, with 61 + 62 = 1, and given that Yt = Yt-, = ... = Yt-m-i = 0 in the
long run, domestic inflation will be equal to the sum of the rate of nominal
exchange rate depreciation and the rate of foreign inflation, that is, relative
purchasing power parity will hold.7
The second price equation is a four-period, Taylor-type equation, as dis-
cussed in Fuhrer (1997):
It = 317rt-2 + 327rt-1 + 337rt+l + 347rt+2 + 357rt+3 (5)
+0iYt + ... + 9mYt-m-i - Ozt-i,
where the optimal number of lags for yt is again determined by using the
Akaike criterion. If /31 + ,B2 + /33 + /34 + /53 = 1, and the output gap is zero
in the long run, the inflation rate in the steady state will again be equal to7The price equation leading to (4) could be derived by assuming that inflation in
consumer prices is a weighted average of inflation in domestic prices (which are determinedon the basis of a contracting framework) and foreign inflation measured in domestic-currency terms. We use the lagged value of z to reduce simultaneity bias.
10
the nominal rate of depreciation plus foreign inflation.
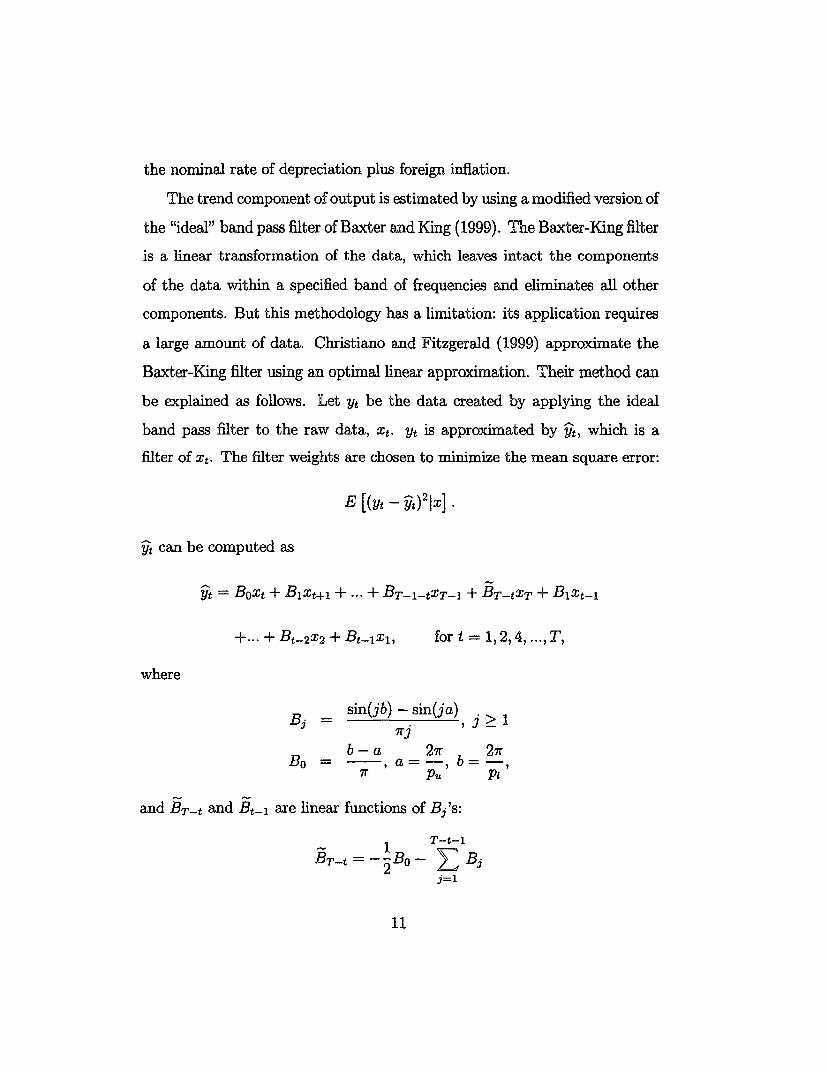
The trend component of output is estimated by using a modified version of
the "ideal" band pass filter of Baxter and King (1999). The Baxter-King filter
is a linear transformation of the data, which leaves intact the components
of the data within a specified band of frequencies and eliminates all other
components. But this methodology has a limitation: its application requires
a large amount of data. Christiano and Fitzgerald (1999) approximate the
Baxter-King filter using an optimal linear approximation. Their method can
be explained as follows. Let yt be the data created by applying the ideal
band pass filter to the raw data, xt. yt is approximated by &, which is a
filter of xt. The filter weights are chosen to minimize the mean square error:
E [(yt- gt)2Ix] .
Yt can be computed as
Yt = Boxt + B1 xt+1 + ... + BT-1-tXT-1 + BT-tXT + B 1 xt-1
+.+Bt-2X2 + Bt-lxl, fort=1,2,4,...,T,
where
Bj sin(jb) - sin(ja) j> 17Tj
b-a 2wr 27rBo = -, a=-, b=-,
ir Pu Pi
and BT-t and Bt_1 are linear functions of Bj's:
1 T-t-1
BT-t =- -B- E Bjj=1
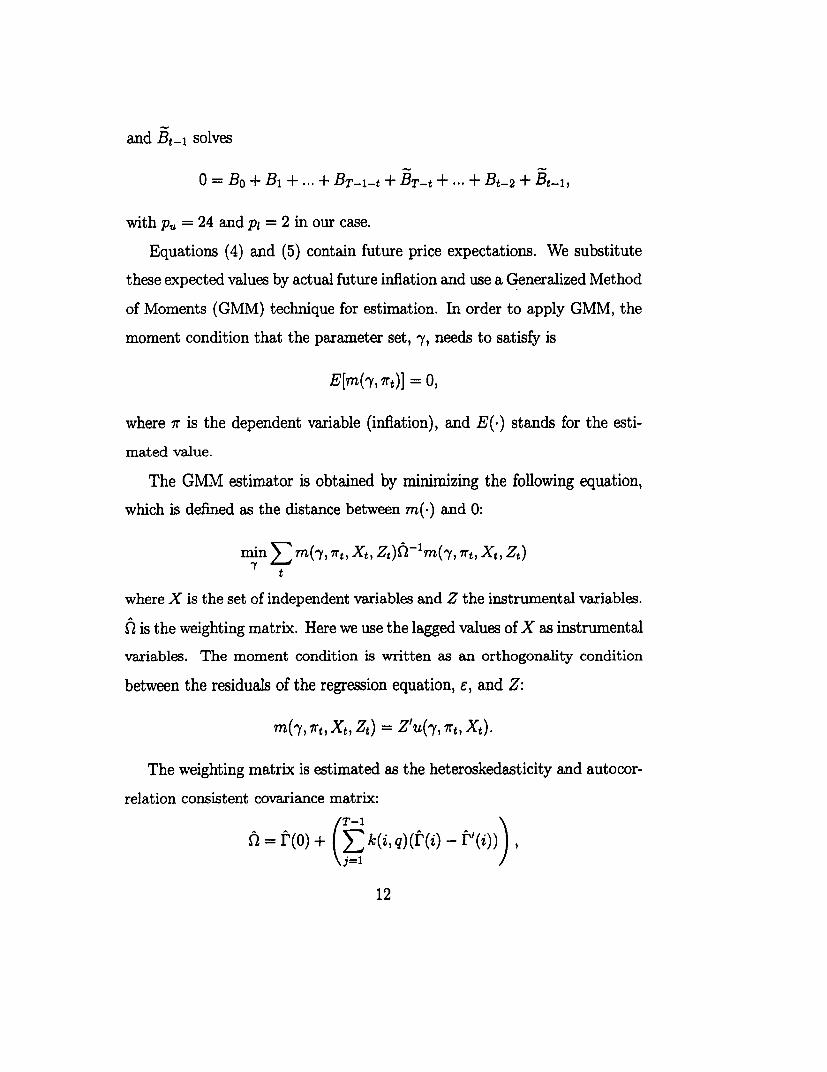
and Bt-1 solves
= Bo + B, +..+ BT-1-t +BT-t +. + Bt_2+ Bt_l,
with Pu = 24 and pL = 2 in our case.
Equations (4) and (5) contain future price expectations. We substitute
these expected values by actual future inflation and use a Generalized Method
of Moments (GMM) technique for estimation. In order to apply GMM, the
moment condition that the parameter set, y, needs to satisfy is
E[m(y, 7rt)] = 0,
where ir is the dependent variable (inflation), and E(.) stands for the esti-
mated value.
The GMM estimator is obtained by minimizing the following equation,
which is defined as the distance between m(.) and 0:
min E m(y, 7rt, Xt, Zt)ft-'m(Y, 7rt, Xt, Zt)
where X is the set of independent variables and Z the instrumental variables.
Q is the weighting matrix. Here we use the lagged values of X as instrumental
variables. The moment condition is written as an orthogonality condition
between the residuals of the regression equation, -, and Z:
m(y, rt, Xt, Zt) = Z'U(Y, Irt, Xt).
The weighting matrix is estimated as the heteroskedasticity and autocor-
relation consistent covariance matrix:T-1\
Q= r(o) + E(k(i,q)(I(i) - 1'(i)))1=
12
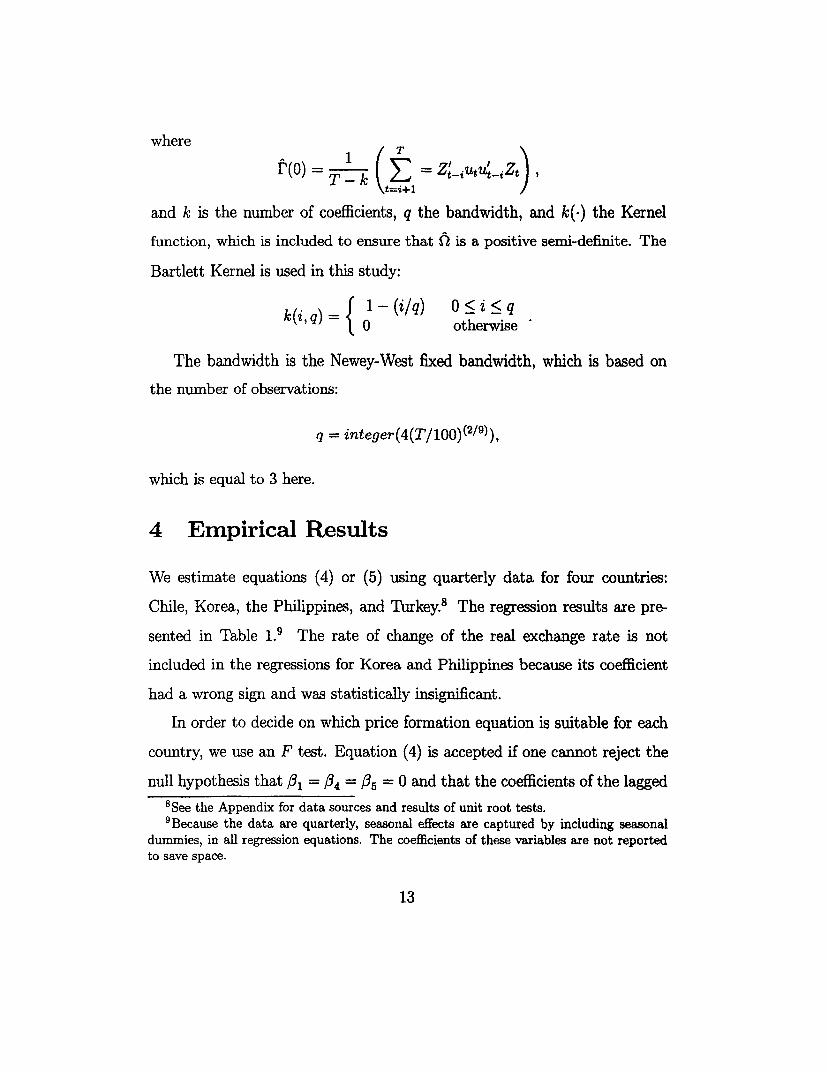
where
1(O) T- k (E =zt-iut-iztt=i+land k is the number of coefficients, q the bandwidth, and k(-) the Kernel
function, which is included to ensure that Q is a positive semi-definite. The
Bartlett Kernel is used in this study:
k(i, q) { 1-(i/q) O < i < q
The bandwidth is the Newey-West fixed bandwidth, which is based on
the number of observations:
q = integer(4(T/100)(2 /9 )),
which is equal to 3 here.
4 Empirical Results
We estimate equations (4) or (5) using quarterly data for four countries:
Chile, Korea, the Philippines, and Turkey.8 The regression results are pre-
sented in Table 1. The rate of change of the real exchange rate is not
included in the regressions for Korea and Philippines because its coefficient
had a wrong sign and was statistically insignificant.
In order to decide on which price formation equation is suitable for each
country, we use an F test. Equation (4) is accepted if one cannot reject the
null hypothesis that ,31 = ,34 = ,35 = 0 and that the coefficients of the lagged8See the Appendix for data sources and results of unit root tests.9Because the data are quarterly, seasonal effects are captured by including seasonal
dummies, in all regression equations. The coefficients of these variables are not reportedto save space.
13
output gap (which do not appear in equation (4)) are zero. The results
indicate that specification (4) is accepted for Chile and Turkey, whereas
specification (5) is the correct one for Korea and Philippines. Thus, the
duration of contracts appears to be relatively short in Chile and Turkey,
compared to Korea and the Philippines. Interestingly enough, the first two
countries are precisely those where inflation was relatively high on average
during the sample period.
For both Chile and Turkey, the estimated coefficients for the lead and
lagged values of inflation are of about the same magnitude (as predicted
by the Fuhrer-Moore specification). The sum of these coefficients is not
significantly different from unity for Turkey, but not for Chile. In addition,
for Chile, the estimated coefficient of the output gap measure has the right
sign and is significant at the 10 percent level, whereas the rate of change of
the real exchange rate has the correct sign and is highly significant. These
results imply indeed that (relative) purchasing power parity holds in the long
run. For Turkey, by contrast, the rate of depreciation of the real exchange
is not statistically significant (despite having the expected sign), and the
estimated coefficient of the output gap is wrongly sign and insignificant. For
Korea, the total effect of lagged inflation on current inflation is much higher
than the total effect of future inflation, whereas the reverse holds in the case
of the Philippines. In both countries, the sum of coefficients on the output
gap variable is positive and statistically significant, as expected.
In all of these regression equations, we do not restrict the sum of the
estimated coefficients for past and future inflation to be equal to unity. Us-
ing the unrestricted estimates, however, we do test for the validity of the
14
constraint that weights sum to unity, in order to ensure that no long-run
trade-off exists between inflation and excess demand pressures. Specifically,
we use a Wald test. The results, which are also reported in Table 1, indicate
that the null hypothesis that the sum of the estimated coefficients of past
and future inflation is equal to unity is accepted for Korea and Turkey, but
is rejected for Chile and the Philippines.
5 Concluding Remarks
The purpose of this paper has been to provide empirical estimates of con-
tracting models of the Phillips curve with backward- and forward-looking
expectations for four middle-income developing economies-Chile, Korea,
the Philippines, and Turkey. The first part reviewed various New Keyne-
sian models of the Phillips curve, including those of Taylor (1979, 1980)
and Fuhrer and Moore (1995). The second part presented the econometric
methodology and the third the estimation results. We found that contract
duration appears to be shorter in Chile and Turkey, compared to Korea and
the Philippines. The output gap has a positive effect in all countries except
Turkey, and the rate of change of the real exchange rate is significant only
in Chile. For both Chile and Turkey, past and future inflation are of about
the same magnitude, whereas in Korea (the Philippines) past inflation plays
a larger (smaller) role. Homogeneity restrictions are satisfied for Korea and
Turkey, but not for Chile and the Philippines.
The analysis in this paper can be extended in various directions. In par-
ticular, there is growing evidence for industrial countries suggesting that the
inflation process may be asymmetric, in that excess demand tends to have
15
a larger effect on inflation than an equivalent degree of excess supply. Early
contributions for industrial countries include Chadha, Masson and Meredith
(1992), and Laxton, Meredith, and Rose (1995), with more recent studies in-
cluding Dupasquier and Ricketts (1998) and Clark, Laxton, and Rose (2001).
Although some preliminary work on nonlinearities in the Phillips curve has
been done for developing countries (see Ag6nor (2002)), the scope for further
research for these countries is significant.
16
Data Surces andi uJnt Root Taests
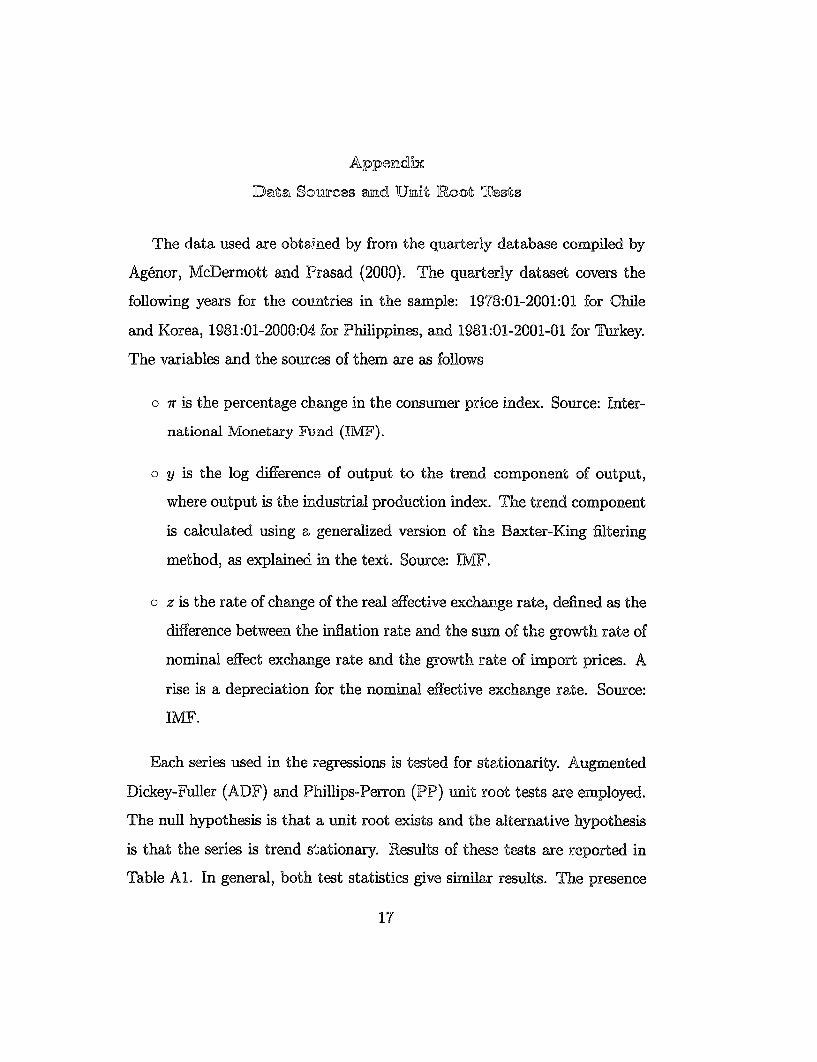
The data used are obtained by from the quarterly database compiled by
Agenor, McDermott and Prasad (2000). The quarterly dataset covers the
following years for the countries in the sample: 1978:01-2001:01 for Chile
and Korea, 1981:01-2000:04 for Philippines, and 1981:01-2001-01 for Turkey.
The variables and the sources of them axe as follows
o 7r is the percentage change in the consumner price index. Source: Inter-
national Monetary Fund (IMF).
o y is the log difference of output to the trend component of output,
where output is the ir.dustrial production index. The trend component
is calculated using a generalized version of the Baxter-King filtering
method, as explained in the text. Source: IMF.
o z is the rate of change of the real effective exchange rate, defined as the
difference between the inflation rate and the sum of the growth rate of
nominal effect exchange rate and the growth rate of import prices. A
rise is a depreciation for the nominal effective exchange rate. Source:
IMF.
Each series used in the regressions is tested for stationarity. Augmented
Dickey-Fuller (ADF) and Phillips-Perron (PP) unit root tests are employed.
The null hypothesis is that a unit root exists and the alternative hypothesis
is that the series is trend stationary. Results of these tests are reported in
Table Al. In general, both test statistics give similar results. The presence
17

of a unit root is rejected for all series, with most series being stationary at a
1 percent significance level.
18
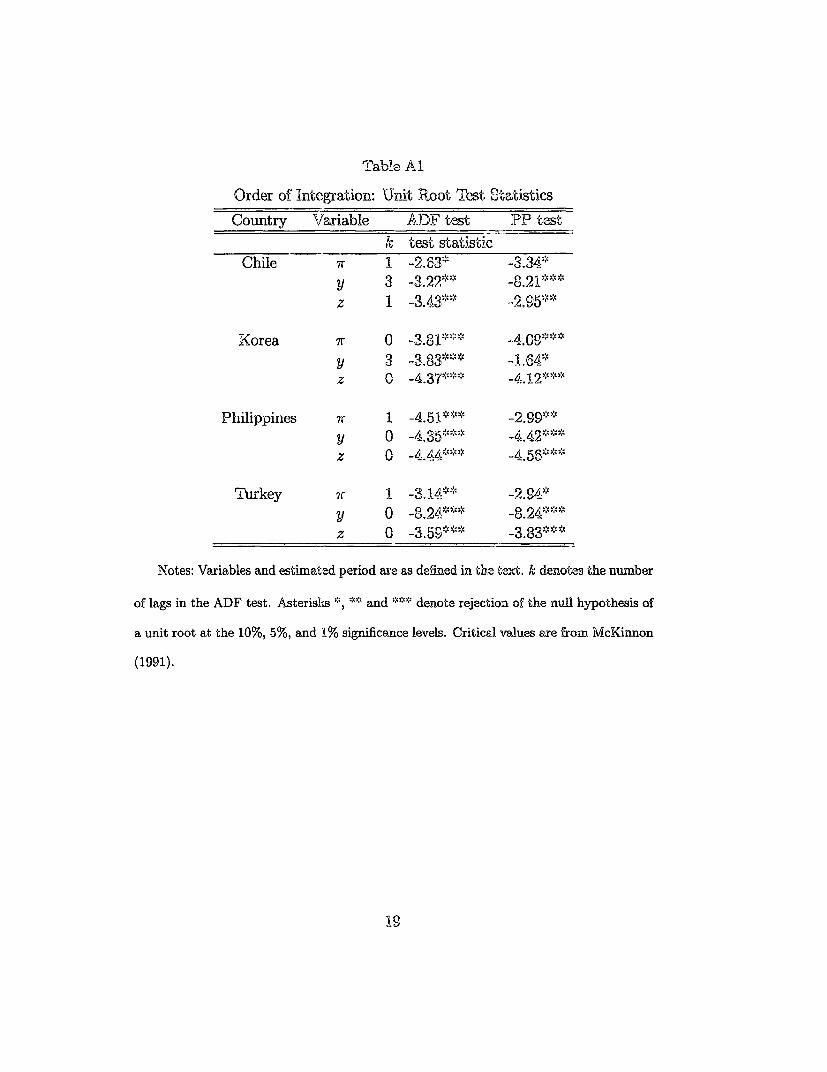
Table Al
Order of Integration: Unit Root Test St.atistics
Country Variable ADlF test PIP test
k test statisticChile ?r 1 -2.63 -334*
y 3 -3.22** -8.21***z 1 -.3.43** -2.95**
Korea 7r 0 -3.81*"
y 3 -3.83***' -1.64*z G -4.37'>* -4.12***
Philippines 7r 1 4512***.99**y 0 -4.35"6 -4.2***z 0 44*':* * .56*
Turkey 7r 1 -3.14** -2.S4*
y 0 -8.24";*:c* -8.24***
z C -3.5*** -3.83***
Notes: Variables and estimated period are as defined in the text. 1c denotes the number
of lags in the ADF test. Asterisks *, ** and ''** denote rejection of the null hypothesis of
a unit root at the 10%, 5%, and 1% significance levels. Critical values are from McKinnon
(1991).
References
Agenor, Pierre-Richard, "Monetary Policy under Flexible Exchange Rates: AnIntroduction to Inflation Targeting," in A Decade of Inflation Targeting inthe World, ed. by Norman Loayza and Raimundo Soto, Central Bank ofChile (Santiago: 2002).
Agenor, Pierre-Richard, C. John McDermott, and Eswar Prasad, "Macroeco-nomic Fluctuations in Developing Countries: Some Stylized Facts," WorldBank Economic Review, 14 (May 2000), 251-86.
Agenor, Pierre-Richard, and Peter J. Montiel, Development Macroeconomics,2nd. ed., Princeton University Press (Princeton, New Jersey: 1999).
Andersen, Torben M., "Persistency in Sticky Price Models," European EconomicReview, 42 (May 1998), 593-603.
Ball, Laurence, and David Romer, "Real Rigidities and the Non-Neutrality ofMoney," Review of Economic Studies, 57 (April 1990), 183-204.
Baxter, Marianne, and Robert G. King, "Measuring Business Cycles: Approx-imate Band-Pass Filters for Economic Time Series," Review of Economicsand Statistics, 81 (November 1999), 575-93.
Calvo, Guillermo A., "Staggered Contracts in a Utility-Maximizing Framework,"Journal of Monetary Economics, 12 (September 1983), 383-98.
Chadha, Bankim, Paul R. Masson, and Guy Meredith, "Models of Inflation andthe Costs of Disinflation," IMF Staff Papers, 39 (June 1992), 395-431.
Christiano, Lawrence J., and Terry J. Fitzgerald, "The Band Pass Filter," Fed-eral Reserve Bank of Cleveland, Working Paper No 9906 (July 1999).
Clarida, Richard, Jordi Galf, and Mark Gertler, "The Science of Monetary Pol-icy: A New Keynesian Perspective," Journal of Economic Literature, 37 (De-cember 1999), 1661-707.
Clark, Peter, Douglas Laxton, and David Rose, "An Evaluation of AlternativeMonetary Policy Rules in a Model with Capacity Constraints," Journal ofMoney, Credit, and Banking, 33 (February 2001), 42-64.
Dupasquier, Chantal, and Nicholas Ricketts, "Non-Linearities in the Output-Inflation Relationship: Some Empirical Results for Canada," Working PaperNo. 98-14, Bank of Canada (August 1998).
Erceg, Christopher J., and Andrew T. Levin, "Imperfect Credibility and InflationPersistence," unpublished, Board of Governors of the Federal Reserve System(June 2001).
Fuhrer, Jeffrey C. "The (Un)Importance of Forward-Looking Behavior in PriceSpecifications," Journal of Money, Credit, and Banking, 29 (August 1997),
20
338-50.Fuhrer, Jeffrey C., and Geoff-rey R. Moore, "Inflation Persistence," Quarterly
Journal of Economics, 110 (February 1995), 127-59.Gali, Jordi, and Mark Gertler, "Inflation Dynamics: A Structural Econometric
Analysis," Journal of Monetary Economics, 44 (October 1999), 195-222.Guerrieri, Luca, "The Inflation Persistence of Staggered Contracts," Interna-
tional Finance Discussion Paper No. 734, Board of Governors of the FederalReserve System (August 2002).
Ireland, Peter N., "Money's IRole in the Monetary Business Cycle," WorkingPaper No. 8115, National Bureau of Economic Reseazch (February 2001).
Laxton, Douglas, Guy Meredith, and D. Rose, "Asymmetric Effects of EconomicActivity on Inflation," I/iF Staff Papers, 2 (June 1995), 344-74.
Mankiw, N. Gregory, and Ricardo Reis, "Sticky Information versus Sticky Prices:a Proposal to Replace the New Keynesian Phillips C'urve," Working PaperNo. 8290, National Bureau of Economic Research (May 2001).
Roberts, John M., "New Keynesian Economics and the Phillips Curve," Journalof Money, Credit, and Banking, 27 (November 1995), 975-84., "How Well does the New Keynesian Sticrky-Price Model Fit the Data?,"
unpublished, Board of Governors of the Federal Reserve System (February2001).
Romer, David, Advanced Macroeconomics, 2nd ed., MscGraw Hill (New York:2000).
Rotemberg, Julio J., "Sticky Prices in the United States," Journal of PoliticalEconomy, 60 (November 1982), 1187-211., "Prices, Output and Hours: An Empirical Analysis based on a Sticky PriceModel," Journal of Monetary Economics, 37 (June 1996), 505-33.
Rudd, Jeremy and Karl Whelan, "New Tests of the New Keynesian PhillipsCurve," unpublished, Board of Governors of the Federal Reserve System(June 2001).
Sutherland, Alan, "Menu Costs and Aggregate Price Dynamics," in The newmacroeconomics: Imperfect Markets and Policy Effectiveness, ed. by HuwDavid Dixon and Neil Rakin, Cambridge University Press (Cambridge:1995).
Taylor, John B., "Staggered Contracts in a Macro Model," American EconomicReview, 69 (May 1979), 108-13., "Aggregate Dynamics and Staggered Contracts," Journal of Political Econ-omy, 88 (February 1980), 1-23.
21
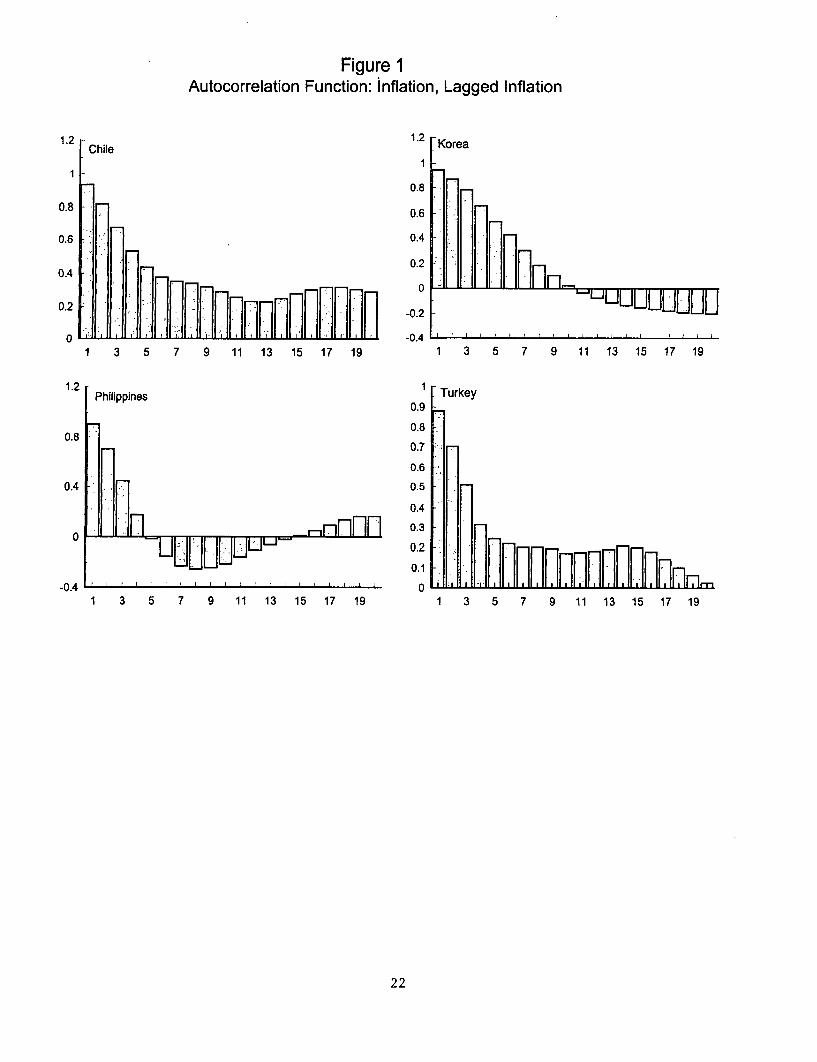
Figure 1Autocorrelation Function: inflation, Lagged Inflation
1.2 - 1.2 KoreaChile Turey
1
0.8
0.80.
060.6
1 3 5 7 9 11 13 15 17 19 1 3 5 7 9 11 13 15 17 19
20.
0.8~~~~~~~~~~~~~~~~~~.0.4~~~~~~~~~~~~~~~~~~~.
0.
0.2 -~~~~ ~~~~~~~~~~~~0.5 JUU[
0 -~~~~~~~~~~~~~~~~~~0.4
1 3 5 7 9 1 1 13 15 17 19 1 3 5 7 9 1 1 13 15 17 19
1.2 Philippines 1 Turke22
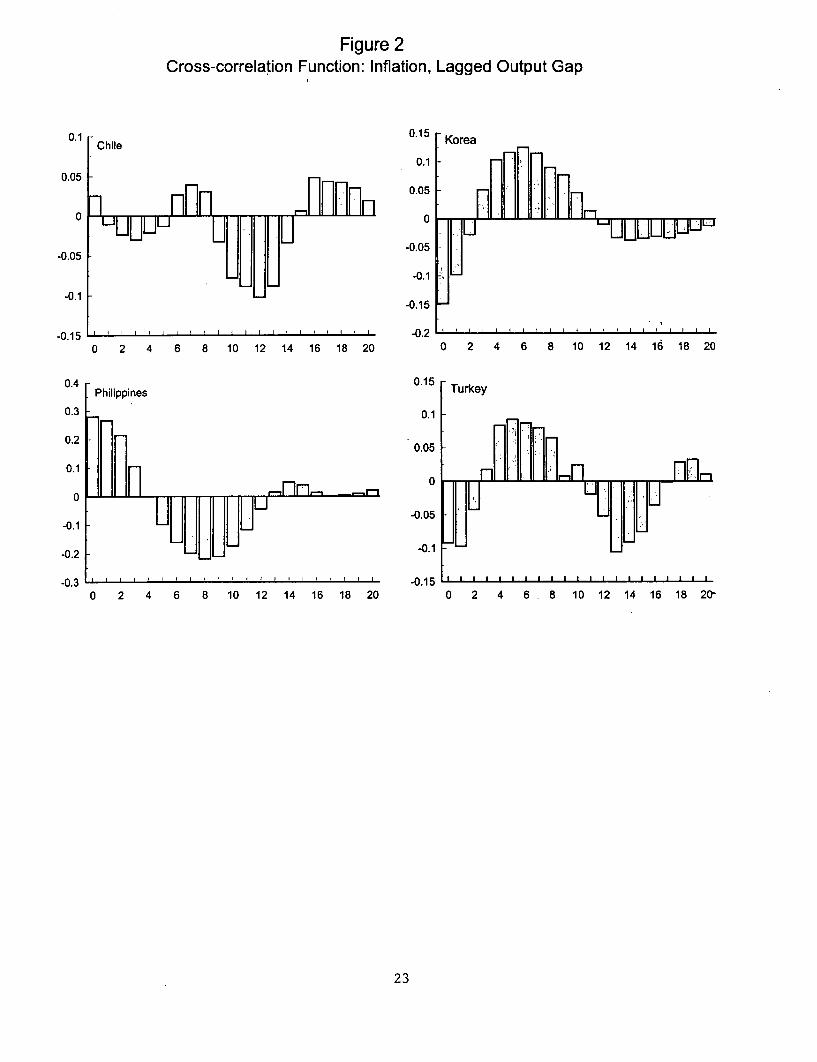
Figure 2Cross-correlation Function: Inflation, Lagged Output Gap
0.1 Chile 0.15 Korea
0.10.05
0.05
0 Fn
-0.05-0.05
-0.1~~~~~~~~~~~~~~~~~~~~-.-0.1~~~~~~~~~~~~~~~~~01
-0. 15 -0.2 l l l 0 2 4 6 8 10 12 14 16 18 20 0 2 4 6 8 10 12 14 16 18 20
0.4 Philippines 0.15 Turkey
0.3 0.1
0.2
0.1~~~~~~~~~~~~~~~~00
0-
-0.05-0.1
-0.2 0.1i
0 2 4 6 8 1 0 1 2 1 4 1 6 1 8 20 0 2 4 6 8 1 0 1 2 14 16 18 20,
2 3
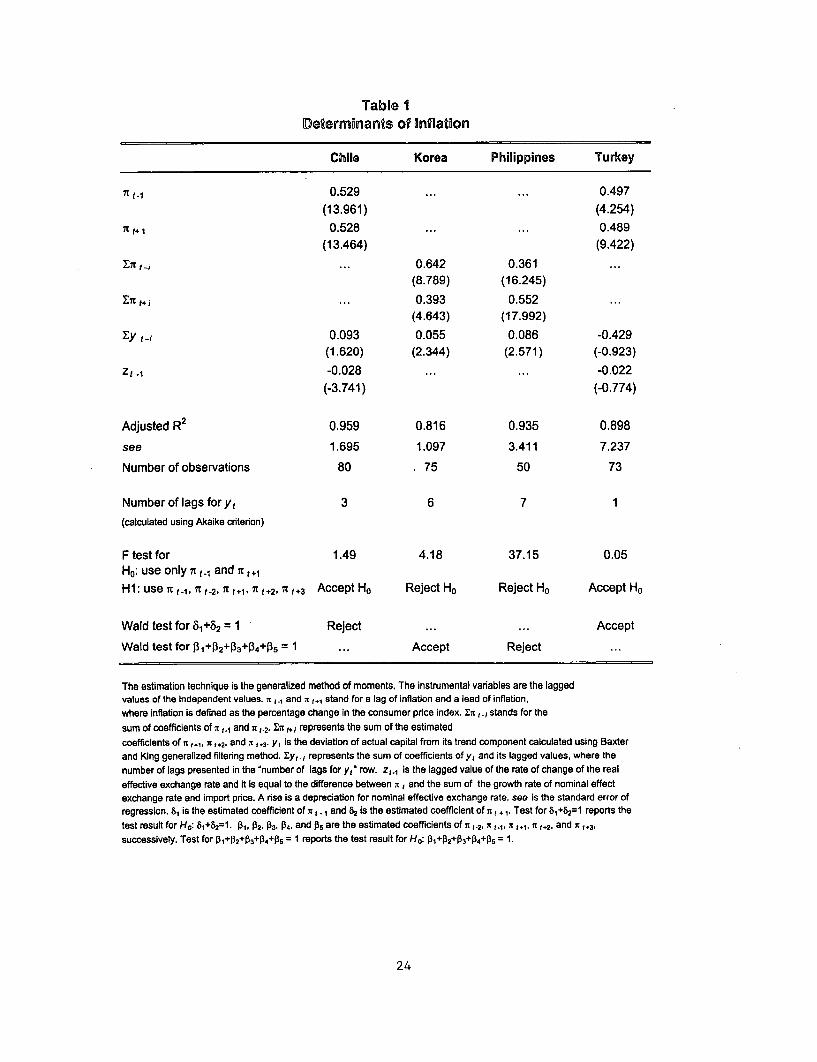
Table IDeterminants of Inflation
Chile Korea Philippines Turkey
7C t- 10.529 ... ... 0.497(13.961) (4.254)
7t t+ 1 0.528 ... ... 0.489(13.464) (9.422)
S7r ; ... 0.642 0.361 ...(8.789) (16.245)
a + i ... 0.393 0.552 ...(4.643) (17.992)
7-y ti X0.093 0.055 0.086 -0.429(1.620) (2.344) (2.571) (-0.923)
Zt -I -0.028 ... ... -0.022(-3.741) (-0.774)
Adjusted R2 0.959 0.816 0.935 0.898
see 1.695 1.097 3.411 7.237
Number of observations 80 75 50 73
Number of lags for yt 3 6 7 1(calculated using Akaike criterion)
F test for 1.49 4.18 37.15 0.05Ho: use only i t and i t +1H 1: use 7r t 1 n t -2 7l t +1, n t +2' It t +3 Accept Ho Reject Ho Reject Ho Accept Ho
Wald test for 81+52 = I Reject ... ... Accept
Wald test for 1+02+0 = I ... Accept Reject ...
The estimation technique is the generalized method of moments. The instrumental variables are the laggedvalues of the independent values. a ,., and n t+1 stand for a lag of inflation and a lead of inflation,where inflation is defined as the percentage change in the consumer price index. En t stands for thesum of coefficients of n .1 and n t2a En t I represents the sum of the estimatedcoefficients of n ,1,, n1 +2. and 7 t13 Yt is the deviation of actual capital from its trend component calculated using Baxterand King generalized filtering method. Eyt., represents the sum of coefficients of y, and its lagged values, where thenumber of lags presented in the 'number of lags for y, row. z,.1 is the lagged value of the rate of change of the realeffective exchange rate and it is equal to the difference between n 1 and the sum of the growth rate of nominal effectexchange rate and import price. A rise is a depreciation for nominal effective exchange rate. see is the standard error ofregression. &1 is the estimated coefficient of n I .I and 82 Is the estimated coefficient of a, + 1. Test for 81+82=1 reports thetest result for Ho: 1+82=1. fr, P2. 3, 04, and j5 are the estimated coefficients of n t-2, 71 .1, n 1, ,7 t+2, and a1,+3,successively. Test for PI+0 2 +03 +P4 +05 = 1 reports the test result for Ho: P1+0 2+P3+P 4+P5 = 1
24


Policy Research Working Paper Series
ContactTitle Author Date for paper
WPS3116 Dollarization of the Banking System: Gianni De Nicol6 August 2003 A. YaptencoGood or Bad? Patrick Honohan 38526
Alain Ize
WPS3117 Policy Research on Migration and David Ellerman August 2003 B. MekuriaDevelopment 82756
WPS3118 To Share or Not to Share: Does Local Beata Smarzynska August 2003 P. FlewittParticipation Matter for Spillovers from Javorcik 32724Foreign Direct Investment? Mariana Spatareanu
WPS3119 Evaluating the Impact of Conditional Laura B. Rawlings August 2003 M. ColchaoCash Transfer Programs: Lessons Gloria M. Rubio 38048from Latin America
WPS3120 Land Rights and Economic Quy-Toan Do August 2003 P. SaderDevelopment: Evidence from Vietnam Lakshmi lyer 33902
WPS3121 Do Bilateral Investment Treaties Mary Hallward-Driemeier August 2003 A. BonfieldAttract Foreign Direct Investment? 31248Only a Bit ... and They Could Bite
WPS3122 Individual Attitudes Toward Roberta Gatti August 2003 N. ObiasCorruption: Do Social Effects Matter? Stefano Paternostro 31986
Jamele Rigolini
WPS3123 Production and Cost Functions and Beatriz Tovar August 2003 G. Chenet-SmithTheir Application to the Port Sector: Sergio Jara-Diaz 36370A Literature Survey Lourdes Trujillo
WPS3124 The Impact of Structural Reforms on Neil McCulloch August 2003 M. FaltasPoverty: A Simple Methodology with 82323Extensions
WPS3125 Economic Analysis of Health Care Vicente B. Paqueo August 2003 R. GuzmanUtilization and Perceived Illness: Christian Y. Gonzalez 32993Ethnicity and Other Factors
WPS3126 Public Disclosure of Environmental Jong Ho Hong August 2003 Y. D'SouzaViolations in the Republic of Korea Benoit Laplante 31449
Craig Meisner
WPS3127 Small and Medium Enterprises Meghana Ayyagari August 2003 A. YaptencoAcross the Globe: A New Database Thorsten Beck 31823
Asli Demirgu9-Kunt
WPS3128 Child Growth, Shocks, and Food Aid Takashi Yamano August 2003 H. Sladovichin Rural Ethiopia Harold Alderman 37698
Luc Christiaensen
WPS3129 Price Caps, Efficiency Payoffs, and Antonio Estache August 2003 A. EstacheInfrastructure Contract Renegotiation Jose-Luis Guasch 81442in Latin America Lourdes Trujillo
WPS3130 The Role of Advocacy in Competition Tomas Serebrisky September 2003 G. Chenet-SmithPolicy: The Case of the Argentine 36370Gasoline Market

policy lesearch Working Papa sefiCa
ContactTitle Author Date for paper
WPS3131 Social Sector Expenditures and Christian Y. Gonzalez September 2003 P. HoltRainy-Day Funds Vicente B. Paqueo 37707
WPS3132 Regional Integration and Technology Maurice Schiff September 2003 P. FlewittDiffusion: The Case of the North Yanling Wang 32724America Free Trade Agreement
WPS3133 Emerging Trends in WTO Dispute Peter Holmes September 2003 P. FlewittSettlement: Back to the GATT? Jim Rollo 32724
Alasdair R. Young
WPS3134 Institutional Reform and the Roumeen Islam September 2003 R. IslamJudiciary: Which Way Forward? 32628
WPS3135 Trade Reforms, Market Access, Guido G. Porto September 2003 P. Flewittand Poverty in Argentina 32724
WPS3136 Legal Institutions and Financial Thorsten Beck September 2003 A. YaptencoDevelopment Ross Levine 31823
WPS3137 Using Survey Data to Assess the Guido G. Porto September 2003 P. FlewittDistributional Effects of Trade Policy 32724
WPS3138 Fiscal Federalism and Regional Raj M. Desai September 2003 V. SapinosoGrowth: Evidence from the Russian Lev M. Freinkman 81105Federation in the 1990s Itzhak Goldberg