Embed Size (px)
Citation preview
Available online at www.sciencedirect.com
International Journal of Project Management 30 (2012) 827–838www.elsevier.com/locate/ijproman
Contractors' perception of the use of costs of quality system in Malaysianbuilding construction projects
Samiaah M. Hassen Al-Tmeemy a,⁎, Hamzah Abdul- Rahman b, Zakaria Harun a
a Faculty of Engineering, University of Malaya, 50603 Kuala Lumpur, Malaysiab Research & Innovation, University of Malaya, 50603 Kuala Lumpur, Malaysia
Received 14 March 2011; received in revised form 1 December 2011; accepted 8 December 2011
Abstract
While conforming on the findings of prior researches regarding quality cost system in building companies, current research successfully illus-trates the contractors' perceptions on the importance of the quality cost system and the barriers that may constrain the implementation of the systemfor recording and collecting quality cost data. A postal and email surveys were undertaken on Malaysian building companies, focusing on the ben-efits and difficulties associated with the implementation of quality cost system. Statistical analyses based on Chi-Squared test and Relative Impor-tance Index techniques were used to investigate the significance of the findings and determine the relative importance of the factors. The mostimportant benefit of measuring quality costs is “getting management attention and increase quality awareness” as perceived by the sample ofthe study. The possible barriers that may affect the management's decision to implement quality cost system are identified and grouped into threecategories, which are culture and knowledge; system; and company. The study suggests that the level of the site staff's knowledge should be asimportant as that of the management to successfully collect and record quality costs data. The findings of this research will raise the level of aware-ness and sensitize managers and those involved with building industry about the importance of quality cost system and collecting quality costsdata.© 2011 Elsevier Ltd. APM and IPMA. All rights reserved.
Keywords: Cost of quality; Quality cost system; Building construction; Quality management; Relative Importance Index
1. Introduction
The main purpose of project management is to address thestakeholder needs and expectations; thus, dissatisfactions of aproject's stakeholders lead to extra time and cost (Tam andLe, 2007). In addition, the successful companies must deliverprojects on time and within budget, and meet specificationswhile managing project risk (Raymond and Bergeron, 2008).Achieving the stakeholder's satisfaction and the completion ofproject within predefined time, cost and quality constraints isnot an easy task in building construction (Al-Tmeemy et al.,2011). Likewise, the process of measuring quality costs isoften difficult due largely to the complexity of constructionprocesses (Aoieong et al., 2002). Hence, many economic andmathematical models have been developed to track quality
⁎ Corresponding author.
0263-7863/$36.00 © 2011 Elsevier Ltd. APM and IPMA. All rights reserved.doi:10.1016/j.ijproman.2011.12.001
costs; for example: Quality Performance Management System(CII, 1990); Quality Performed Tracking System (Davis et al.,1989); Quality Cost Matrix (Abdul-Rahman, 1995); ProcessCost Model (Aoieong et al., 2002); and Construction QualityCosts Quantifying System (Low and Yeo, 1998). Unfortunately,these models have been of little use and many companies still donot have a quality cost system in place (Kazaz et al., 2005; Loveand Irani, 2003; Miguel and Pontel, 2004).
The importance of quality management is quite noticeable inproject management literature (Choi et al., 2009; Din et al.,2010). Also the need for companies to capture and assess qual-ity costs data has been well-established in previously publishedliteratures (Abdelsalam and Gad, 2009; Dale and Plunkett,1999; Morse and Roth, 1987; Tam and Le, 2007). Several re-searchers (Miguel and Pontel, 2004; Schiffauerova and
828 S.M.H. Al-Tmeemy et al. / International Journal of Project Management 30 (2012) 827–838
Thomson, 2006b; Sower and Quarles, 2003) stated that manycompanies appreciate the necessity of the quality cost system;however, they continue to lack one. As a result, the companiesare not able to recognize how much they lose because of poorquality (Schiffauerova and Thomson, 2006b). This implies agap between existing theory and practical application regardingquality management.
In Malaysia, the application of the cost of quality concept inthe construction industry is a relatively new field of interest.Hence, the economics' sense of improving quality is not well un-derstood within the players of the building construction industry.It is no surprise therefore that some building contractors mayavoid quality improvement processes believing that these pro-cesses add only time and cost to the process of construction. Inthe same time, less satisfactory performance in the constructionindustry has led to the belief that construction projects cannotbe completed within budget and desired quality (Abdul-Rahman et al., 1996). This paper attempts to gain a deeper under-standing of quality cost practices in the Malaysian building con-struction projects. Major issues that this study set out toestablish were to study the perceptions of the contractors as tothe benefits of collecting quality cost measurements and the bar-riers to adopt quality cost system. This study is very timely asCIDB of Malaysia has mandated ISO 9001 certification as a re-quirement for G7 contractors since first January 2009. It is there-fore anticipated that registration with ISO 9000 will be increasedand will become a norm rather than an exception. This impliesthat it is imperative for construction companies to adopt continu-ous improvement and change conventional management prac-tices into a new paradigm to achieve high performance.
A literature search was used to generate the usefulness of col-lecting quality costs and the possible barriers for adopting qualitycost system, which were administered to the building construc-tion companies via a postal and e-mail surveys. The findingsfrom this research significantly contributed towards enrichingthe boundary of existing knowledge to achieve a quality costsculture within building construction. Understanding the signifi-cance of quality costs system inspires the managers and contrac-tors to effectively track and report the quality cost data. Indeed,this will alert all those involved with building industry to the ex-tent to which quality costs can reduce the costs of construction.On the other hand, knowing the barriers that halted the adoptionof the quality system will assist the contractors to overcometheir struggle against these barriers.
2. Review of cost of quality models
Several models have been developed in previous literature.Schiffauerova and Thomson (2006b) classified COQ modelsinto four groups of generic models, namely, prevention-appraisal-failure (PAF) or Crosby's model; opportunity costmodels; process cost models (PCM); and activity-based cost(ABC) models.
A most noticeable categorization model for quality costs isPAF, which was first simplified by Feigenbaum (1956). Preven-tion costs are incurred to prevent nonconforming units from beingproduced (Morse and Roth, 1987). The purpose of those costs is
to keep defects from occurring in the first place by assuring thatstandards of organizational quality and customer satisfaction aremet.
With appraisal costs come the costs of necessary activities todetermine the actual level of quality achieved relative to the de-sired levels of customer satisfaction and organizational qualitystandards (Gilmore, 1990). Appraisal costs are incurred to iden-tify nonconforming units before these are shipped to the cus-tomer (Morse and Roth, 1987).
Failure costs are incurred resulting from the existence ofpoor quality. These costs are typically classified as either inter-nal or external. Internal failure costs occur when defectivegoods are identified before shipment to customers (Morse,1993). Conversely external failure costs incur when noncon-forming products are shipped to the customers (Morse andRoth, 1987).
Crosby (1979) divided quality costs into price of confor-mance (POC) and price of non-conformance (PONC). POCpertains to the price paid for doing things right, and examplesinclude inspection and quality appraisal. PONC is the cost ofpoor quality caused by product and service failure, and examplesare rework and returns. The opportunity and intangible costmodel includes the cost of a missed opportunity, such as profitsnot earned because of lost customers and reduction in revenueowing to non-conformance (Schiffauerova and Thomson,2006b). With the PCM, the focus is on the quality costs of a par-ticular process rather than the total quality costs of an entire pro-ject (Tang et al., 2004). The last generic model is ABC, whichprovides data on how costs are actually consumed. The mainidea behind ABC is that not all activities (and thus resource con-sumption rates) are proportional to the number of units produced(Raz and Elnathan, 1999).
To sum it up, COQ is the total of all resources spent by an or-ganization to ensure that the established quality plan consistentlyachieves or exceeds standards (Bamford and Land, 2006). Theseresources are spent either for achieving quality or incurred due tolack of quality.
3. The significance of cost of quality
The quality costs are important because these costs can beextensive and could be 20% of the total sales turnover (Daleand Plunkett, 1999). Previous studies in North America haveindicated that the costs of quality are typically at 20–30% ofthe total sales (Campenella, 1999; Hansen and Mowen, 1997;Krisham et al., 2000).
In construction, Lam (1994) has claimed that quality costscan make up from 8 to 15% of the total construction costs. In1978, these costs were estimated by the UK Government tobe 10% of the UK's gross national product (Low and Yeo,1998). Low and Yeo further stated that in the USA, directcosts incurred for rework alone have been estimated to be great-er than 12% of any project costs. Hagan (1986) has warned thatthe lack of knowledge regarding quality costs will likely lead tounbalancing the inter-relationship of quality, schedule, andcost. This imbalance will continue to exist as long as the realcost of quality remains hidden among total costs.
829S.M.H. Al-Tmeemy et al. / International Journal of Project Management 30 (2012) 827–838
The uses of quality costs data have been expounded by anumber of scholars (Albright and Roth, 1992; Dale andPlunkett, 1999; Hagan, 1986; Lin and Johnson, 2004; Morseand Roth, 1987) and these are alerting management on the po-tential impact of poor quality on the financial performance ofthe company; helping management to determine the types ofactivities that are most beneficial in reducing quality costs andprioritizing quality improvement activities; establishing prioritiesfor the corrective actions needed, promoting the concept thatquality is everyone's responsibility; allowing quality-related ac-tivities to be expressed in the language of management; establish-ing bases for budgets with a view to exercising budgetary controlover the entire quality operation, assisting managers to compre-hend the financial consequences of quality and arming themwith information to formulate better strategic decisions in qualitycontrol and management; and reducing quality costs by alteringthe process in a particular project.
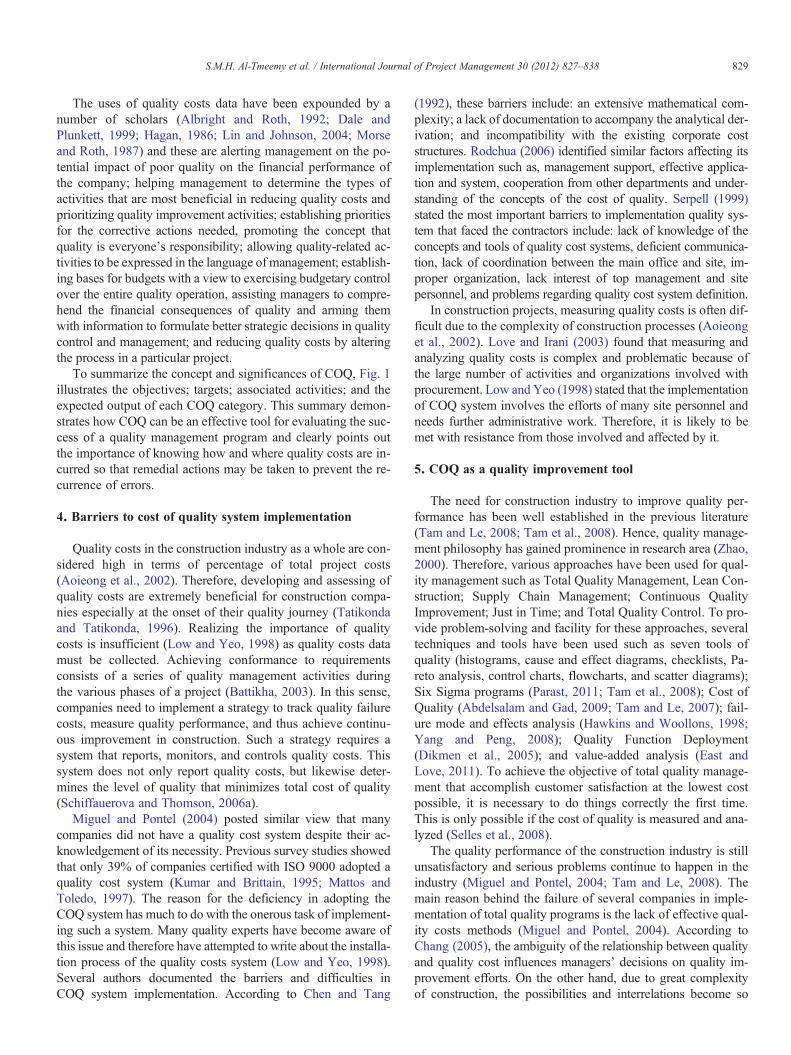
To summarize the concept and significances of COQ, Fig. 1illustrates the objectives; targets; associated activities; and theexpected output of each COQ category. This summary demon-strates how COQ can be an effective tool for evaluating the suc-cess of a quality management program and clearly points outthe importance of knowing how and where quality costs are in-curred so that remedial actions may be taken to prevent the re-currence of errors.
4. Barriers to cost of quality system implementation
Quality costs in the construction industry as a whole are con-sidered high in terms of percentage of total project costs(Aoieong et al., 2002). Therefore, developing and assessing ofquality costs are extremely beneficial for construction compa-nies especially at the onset of their quality journey (Tatikondaand Tatikonda, 1996). Realizing the importance of qualitycosts is insufficient (Low and Yeo, 1998) as quality costs datamust be collected. Achieving conformance to requirementsconsists of a series of quality management activities duringthe various phases of a project (Battikha, 2003). In this sense,companies need to implement a strategy to track quality failurecosts, measure quality performance, and thus achieve continu-ous improvement in construction. Such a strategy requires asystem that reports, monitors, and controls quality costs. Thissystem does not only report quality costs, but likewise deter-mines the level of quality that minimizes total cost of quality(Schiffauerova and Thomson, 2006a).
Miguel and Pontel (2004) posted similar view that manycompanies did not have a quality cost system despite their ac-knowledgement of its necessity. Previous survey studies showedthat only 39% of companies certified with ISO 9000 adopted aquality cost system (Kumar and Brittain, 1995; Mattos andToledo, 1997). The reason for the deficiency in adopting theCOQ system has much to do with the onerous task of implement-ing such a system. Many quality experts have become aware ofthis issue and therefore have attempted to write about the installa-tion process of the quality costs system (Low and Yeo, 1998).Several authors documented the barriers and difficulties inCOQ system implementation. According to Chen and Tang
(1992), these barriers include: an extensive mathematical com-plexity; a lack of documentation to accompany the analytical der-ivation; and incompatibility with the existing corporate coststructures. Rodchua (2006) identified similar factors affecting itsimplementation such as, management support, effective applica-tion and system, cooperation from other departments and under-standing of the concepts of the cost of quality. Serpell (1999)stated the most important barriers to implementation quality sys-tem that faced the contractors include: lack of knowledge of theconcepts and tools of quality cost systems, deficient communica-tion, lack of coordination between the main office and site, im-proper organization, lack interest of top management and sitepersonnel, and problems regarding quality cost system definition.
In construction projects, measuring quality costs is often dif-ficult due to the complexity of construction processes (Aoieonget al., 2002). Love and Irani (2003) found that measuring andanalyzing quality costs is complex and problematic because ofthe large number of activities and organizations involved withprocurement. Low and Yeo (1998) stated that the implementationof COQ system involves the efforts of many site personnel andneeds further administrative work. Therefore, it is likely to bemet with resistance from those involved and affected by it.
5. COQ as a quality improvement tool
The need for construction industry to improve quality per-formance has been well established in the previous literature(Tam and Le, 2008; Tam et al., 2008). Hence, quality manage-ment philosophy has gained prominence in research area (Zhao,2000). Therefore, various approaches have been used for qual-ity management such as Total Quality Management, Lean Con-struction; Supply Chain Management; Continuous QualityImprovement; Just in Time; and Total Quality Control. To pro-vide problem-solving and facility for these approaches, severaltechniques and tools have been used such as seven tools ofquality (histograms, cause and effect diagrams, checklists, Pa-reto analysis, control charts, flowcharts, and scatter diagrams);Six Sigma programs (Parast, 2011; Tam et al., 2008); Cost ofQuality (Abdelsalam and Gad, 2009; Tam and Le, 2007); fail-ure mode and effects analysis (Hawkins and Woollons, 1998;Yang and Peng, 2008); Quality Function Deployment(Dikmen et al., 2005); and value-added analysis (East andLove, 2011). To achieve the objective of total quality manage-ment that accomplish customer satisfaction at the lowest costpossible, it is necessary to do things correctly the first time.This is only possible if the cost of quality is measured and ana-lyzed (Selles et al., 2008).
The quality performance of the construction industry is stillunsatisfactory and serious problems continue to happen in theindustry (Miguel and Pontel, 2004; Tam and Le, 2008). Themain reason behind the failure of several companies in imple-mentation of total quality programs is the lack of effective qual-ity costs methods (Miguel and Pontel, 2004). According toChang (2005), the ambiguity of the relationship between qualityand quality cost influences managers' decisions on quality im-provement efforts. On the other hand, due to great complexityof construction, the possibilities and interrelations become so
Fig. 1. Mechanism of quality cost system.
830 S.M.H. Al-Tmeemy et al. / International Journal of Project Management 30 (2012) 827–838
fuzzy that they entail access to a decision-making aid modelbased on relevant performance evaluation (Marques et al.,2010). Ultimately, construction managers need to direct towardquantitative approaches for clear and accurate decision-making.COQ can be leveraged to support this strategy (Walker andTobias, 2006).
The reporting of COQ with detailed information on the threecategories of quality costs (i.e. prevention, appraisal and failure)outlines a clear picture of the relative distribution of qualitycosts incurred within a given period (Lin and Johnson, 2004).This information serves three purposes (Willis and Willis,1996). First, it helps to track quality problems by identifyingthe nature of these problems. Second, it shows the effectivenessof control efforts and highlights where improvements must be fo-cused. Third, it provides a baseline measure for evaluating qualityimprovement efforts in future projects.
The previous studies showed the implication of COQ forconstruction projects and how can use it to improve the qualityperformance of projects. For example, Love and Irani (2003)reviewed the quality costing systems and developed a prototypeproject management quality cost system to determine qualitycosts in construction projects. They used the system to determinethe various causes of rework that occurred tomonitor the progressof client change requirements.
According to Dale and Plunkett (1999), quality costs can bereduced by a third when a cost-effective quality managementsystem is implemented. Similarly, Crosby (1979) has foundthat a well-planned and suitably implemented cost of qualityprogram can reduce quality costs to 2.5% of total revenue.Implementing an effective quality cost program allows mostcompanies to reduce scraps/rework and poor quality costs.Moreover, it leads to the development of a strategic quality im-provement plan consistent with overall organizational goals(Rodchua, 2006).
6. Methodology
In order to investigate the perceptions of the contractors andmanagers of construction building about the benefits and theconstraints of implementation of quality cost system, a crosssectional survey involving building contractors in Kuala Lumpur,Malaysia was used. The targeted respondents for this study weredrawn from Construction Industry Development Board Malaysia(CIDB, 2008b) registered list of contractors categorized underClass G6 (tendering capacity 10 million Ringgit Malaysia) andClass G7 (tendering capacity of more than 10 million RinggitMalaysia). Kuala Lumpur was chosen as the sampling citysince it comprises the largest number of registered Class G7
831S.M.H. Al-Tmeemy et al. / International Journal of Project Management 30 (2012) 827–838
and G6 contractors. The percentage of registered contractors inthis area is around 31.25% of the total number distributed withinthe 15 Malaysian states (CIDB, 2008a), postal and email surveyswere used.
6.1. Sample size
To choose the sample for this research, the stratified sam-pling method was used to divide the sampling frame into twogroups; G6 and G7 contractors. This method yields precise es-timation and more accurate than those produced by simple ran-dom sampling; particularly, when the sampling frame isavailable in the form of a list (Kothari, 2004). Furthermore itis simple and convenient (Pedhazur and Schmelkin, 1991).
According to CIDB statistics, there were 1329 active con-tractors of grade G6 and G7 in Kuala Lumpur. Of this total,1196 contractors are involved in building construction, whichrepresented the population of this study. This population com-prises 193 (16%) contractors of G6, and 1003 (84%) contractorsof G7. In order to determine a suitable sample size, the followingequation from Czaja and Blair (2005) was applied:
ss ¼ z2 � p 1−pð Þ=c2 ð1Þwhere ss = sample size, z = standardized variable, p = percentagepicking a choice, expressed as a decimal, c = confidence interval,expressed as a decimal.
For this research, a value of 95% was established for confi-dence level (i.e. significance level of α=0.05, z=1.96), and aconfidence interval (c) of ±10% was assumed. The value of0.5 was chosen for (p) to assume the worst case percentagepicking a choice (Czaja and Blair, 2005). Based on these as-sumptions, the required sample size for the questionnaire sur-vey is 96 contractors. However, this figure requires a furthercorrection for the finite population correction. The equationfor this is given in Czaja and Blair (2005) as follows:
Newss ¼ ss= 1þ ss−1=popð Þ½ �: ð2ÞTherefore, the required sample size for the questionnaire sur-
vey is 89 contractors. Construction industry is well-known forthe poor response to questionnaire surveys; (20–30)% is be-lieved to be the norm (Akintoye, 2000; Dulaimi et al., 2003).For this reason, it was necessary to adjust the sample sizeto account for non-response. Assuming a response rate of15%, the appropriate sample size is derived from the follow-ing calculation:
Surveyss ¼ newss=responserate: ð3ÞTherefore, the sample size is duly adjusted whereby 594
contractors are targeted for the questionnaire survey. The sam-pling frame was structured in such a way that it represents thepopulation and included all companies that have a chance tobe selected. As shown in Table 1, the sample was selectedaccording to the proportion of each group in the population(Adams and Brace, 2006; Czaja and Blair, 2005). Therefore,the sample contained 95 contractors G6 and 499 contractorsG7, as shown in Table 1.
Systematic sampling consists of picking one company everycertain interval from a complete list of population (Czaja andBlair, 2005; Vaus, 2002). First step, the names of companiesfor both G6 and G7 contractors were randomly listed in sepa-rate lists. The next step, the sampling interval was calculatedby dividing the population size by required sample size. Thesampling interval was 193/95=2 for G6 contractors. Likewise,the sampling interval for G7 contractors was 1003/499=2, asshown in Table 1. The starting point was randomly chosenbased on either the first or second company in the list. Then,the sampling was conducted by choosing every second compa-ny in each list and added to the sample to obtain of 95 of G6contractors and 499 of G7 contractors.
6.2. Questionnaire development
The questionnaire survey has been drawn up to get maxi-mum information for minimum cost (Ader et al., 2008). Thequestionnaire is self-completing/sufficient and contained arange of structure questions. The self-completion questionnairecan be sent to a large number of respondents with a relativelylower cost. However, its success depends on the cooperationof the respondents (Adams and Brace, 2006). To attain an in-creased success rate of the survey, prior meetings were heldwith a group of experts to judge and assess the quality of surveyitems and its content. According to Ader et al. (2008), four tofive experts are adequate to judge the survey items. Therefore,experts consisting of two academics and three project managerswith more than 20 years work experience in the building con-struction field have vetted this survey questionnaire.
To ensure that respondents accurately able to answer the ques-tions and receive the same stimuli, the questionnaire included cleardefinitions of the terms that related to quality cost. In addition, theinitial paper/hard copy version of the questionnaire was used toconduct a pilot study prior to the full distribution of the question-naires. According to Ader et al. (2008), the pilot survey providesfeedback on errors, unexpected problems, and respondents' will-ingness to participate in the survey. A total of twenty building con-struction companies listed under Classes G6 and G7 of the CIDBdatabase were selected for this purpose. The results of the pilotsurvey provided information that was used to further improvethe final version of the survey questionnaire where some questionswere revised. Specific ideas were gained prompting some changesto the sentence structures and wording in order to provide moreclarity to the intended original purpose of the questions.
The questionnaire survey was conducted in 2008 (March–October). It was divided into two parts. The first part wasdesigned to gather general respondent's demographics character-istics (e.g. educational level, age, experience, and occupation) ofthe participating companies. The second part investigated thebenefits and barriers of adopting quality cost system to measureand track quality costs data.
6.3. Data analysis
The chi-square (χ2) test was performed on the significanceof findings. Chi-squared test is used to examine the difference
Table 1Sampling frame.
Grade Population Percentage Sample size Interval
G6 193 16% 95 2G7 1003 84% 499 2Total 1196 1005 594
832 S.M.H. Al-Tmeemy et al. / International Journal of Project Management 30 (2012) 827–838
between observed and expected frequency's distributionaccording to randomness outcome assumption (Field, 2009)using the following formula:
X2 ¼ ∑ Oi−Eið Þ2=Ei2 ð4Þ
where Oi = an observed frequency, Ei = an expected (theoreti-cal) frequency, i = response category index.
To further investigate the data, a relative importance is deter-mined to quantify the contributions of individual explanatoryvariables to a response variable (Soofi et al., 2000). Severalmethods have been used to determine the relative importance.For example, the statistical significance has been used as an in-dicator of importance (Al-Harbi, 2001; Chan et al., 2011a,b).The interpretation of statistical significance is unfounded;therefore this method is inappropriate to assess relative impor-tance (Soofi et al., 2000).
Other researchers used AHP (Analytic Hierarchy Process) toprioritize attributes, decision alternatives, and factors of a com-plex problem (Tsai et al., 2006). However AHP is a powerfuland widely-used technique for eliciting the importance of fac-tors, it is useful in circumstances which necessitate the identifi-cation of a preferred alternative from a set of alternatives (Saaty,1980).
In this study the Relative Importance Index (RII) was usedto assess the relative importance of each factor based on the nu-merical scores from the questionnaire responses RII was de-fined as “the average percentage of total explained variancecontributed by each variable across all possible subsets”(Baltes et al., 2004, p. 330). It can be performed for individualvariables as well as for groups (Carpio et al., 2007). Moreover,RII was successfully used in the previous researches to deter-mine the relative importance (Alwi and Hampson, 2003;Assaf and Al-Hejji, 2006; Chan and Kumaraswamy, 1997;Kometa et al., 1994; Le and Tam, 2008; Zeng et al., 2005)using the following equations:
RII ¼ ∑aixi=A �N ð5Þ
where ai = constant expressing the weight of the ith response, xi =level of the response given as a percentage of the total responsesfor each factor, A = highest weight, N = total number of respon-dents. The value of RII ranges from 0 to 1; a higher RII indicatesthat a particular factor is more significant than those with relative-ly lower RIIs. The RII for groups was determined by averagingthe RIIs of all individual factors within the same category(Aibinu and Jagboro, 2002; Chan and Kumaraswamy, 2002;Soofi et al., 2000).
7. Research findings
7.1. Response rate
Of the 594 questionnaires dispatched to the selected sample,153 were satisfactorily completed, pegging the total responserate at 25.7%. This figure is acceptable according to Akintoye(2000) and Dulaimi et al. (2003). Both of who have statedthat normal response rate in the construction industry for postalquestionnaires is within the range of 20–30%.
7.2. General respondents' demographics characteristics
Frequency distribution is conducted to show four main pro-files namely: educational level, age, occupation, and period ofexperience as shown in Table 2. The General Respondents' De-mographics (GRD) revealed that the majority of (90.2%) held aBachelor's degree as shown in Table 2. The highest frequencyof respondents (40.5%) was aged between (40 and 49) years.Regarding the occupation of respondents, manager occupationaccounted for the largest percentage (55.6%). Majority of re-spondents (96.1%) had more than 10 years of experience.
7.3. The benefits of quality cost measurements
The first question addressed the issues of surrounding bene-fits of quality cost system implementation and quality costsmeasurement. A scale of 1–4 (1 =disagree, 4=strongly agree)was provided for the respondents to rate their choices.Table 3 provides a visual breakdown of the answers to this sur-vey question (depicted in percentage).
The highest rank with RII of 0.99 was accorded to the ben-efit of “getting management attention and increase qualityawareness”. This was based on the finding that the majorityof respondents (92.8%) strongly agreed that quality cost mea-surement is a useful tool for gaining management attention.The remaining benefits listed according to their downwardranks are as follows: “changing the way the employees thinkabout errors” (RII=0.96); “providing means to measure thetrue impact of corrective action” (RII=0.96); “Quality costmeasurement is an effective tool for the implementation ofTQM” (RII=0.96); and “helps in identifying problem areas”(RII=0.90). Other benefits of implementation of quality costsystem are less significant, which are duly given low ranking asshown in Table 3. A highly significant difference was recordedat Pb0.01 between observed and expected frequency distributionaccording to randomness outcomes assumption.
7.4. The barriers to adopt quality system in building projects
The second question was used to explore the viewpoint ofrespondents on the barriers that prevent adoption of the qualitysystem. Respondents were asked to provide their opinions per-taining to the barriers listed in the questionnaire based on a fourpoint Likert scale (1 = most unlikely, 2 = unlikely, 3 = likely, 4 =most likely).
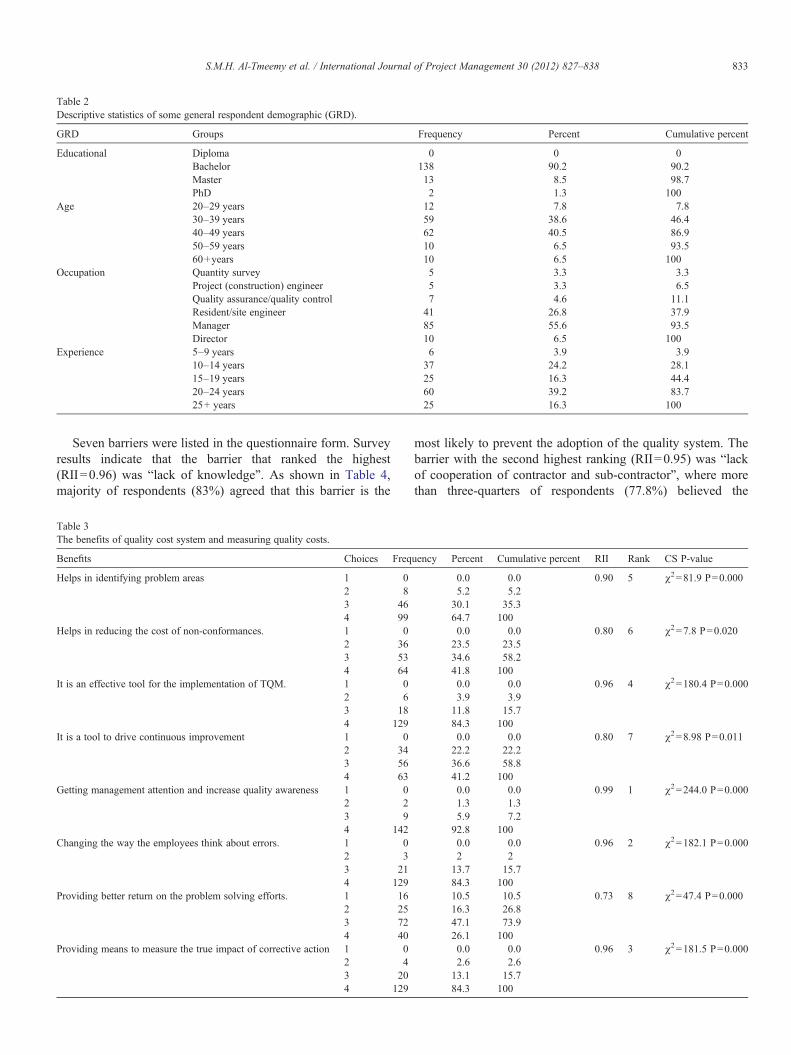
Table 2Descriptive statistics of some general respondent demographic (GRD).
GRD Groups Frequency Percent Cumulative percent
Educational Diploma 0 0 0Bachelor 138 90.2 90.2Master 13 8.5 98.7PhD 2 1.3 100
Age 20–29 years 12 7.8 7.830–39 years 59 38.6 46.440–49 years 62 40.5 86.950–59 years 10 6.5 93.560+years 10 6.5 100
Occupation Quantity survey 5 3.3 3.3Project (construction) engineer 5 3.3 6.5Quality assurance/quality control 7 4.6 11.1Resident/site engineer 41 26.8 37.9Manager 85 55.6 93.5Director 10 6.5 100
Experience 5–9 years 6 3.9 3.910–14 years 37 24.2 28.115–19 years 25 16.3 44.420–24 years 60 39.2 83.725+ years 25 16.3 100
833S.M.H. Al-Tmeemy et al. / International Journal of Project Management 30 (2012) 827–838
Seven barriers were listed in the questionnaire form. Surveyresults indicate that the barrier that ranked the highest(RII=0.96) was “lack of knowledge”. As shown in Table 4,majority of respondents (83%) agreed that this barrier is the
Table 3The benefits of quality cost system and measuring quality costs.
Benefits Choices Freq
Helps in identifying problem areas 1 02 83 464 99
Helps in reducing the cost of non-conformances. 1 02 363 534 64
It is an effective tool for the implementation of TQM. 1 02 63 184 129
It is a tool to drive continuous improvement 1 02 343 564 63
Getting management attention and increase quality awareness 1 02 23 94 142
Changing the way the employees think about errors. 1 02 33 214 129
Providing better return on the problem solving efforts. 1 162 253 724 40
Providing means to measure the true impact of corrective action 1 02 43 204 129
most likely to prevent the adoption of the quality system. Thebarrier with the second highest ranking (RII=0.95) was “lackof cooperation of contractor and sub-contractor”, where morethan three-quarters of respondents (77.8%) believed the
uency Percent Cumulative percent RII Rank CS P-value
0.0 0.0 0.90 5 χ2=81.9 P=0.0005.2 5.230.1 35.364.7 1000.0 0.0 0.80 6 χ2=7.8 P=0.02023.5 23.534.6 58.241.8 1000.0 0.0 0.96 4 χ2=180.4 P=0.0003.9 3.911.8 15.784.3 1000.0 0.0 0.80 7 χ2=8.98 P=0.01122.2 22.236.6 58.841.2 1000.0 0.0 0.99 1 χ2=244.0 P=0.0001.3 1.35.9 7.292.8 1000.0 0.0 0.96 2 χ2=182.1 P=0.0002 213.7 15.784.3 10010.5 10.5 0.73 8 χ2=47.4 P=0.00016.3 26.847.1 73.926.1 1000.0 0.0 0.96 3 χ2=181.5 P=0.0002.6 2.613.1 15.784.3 100
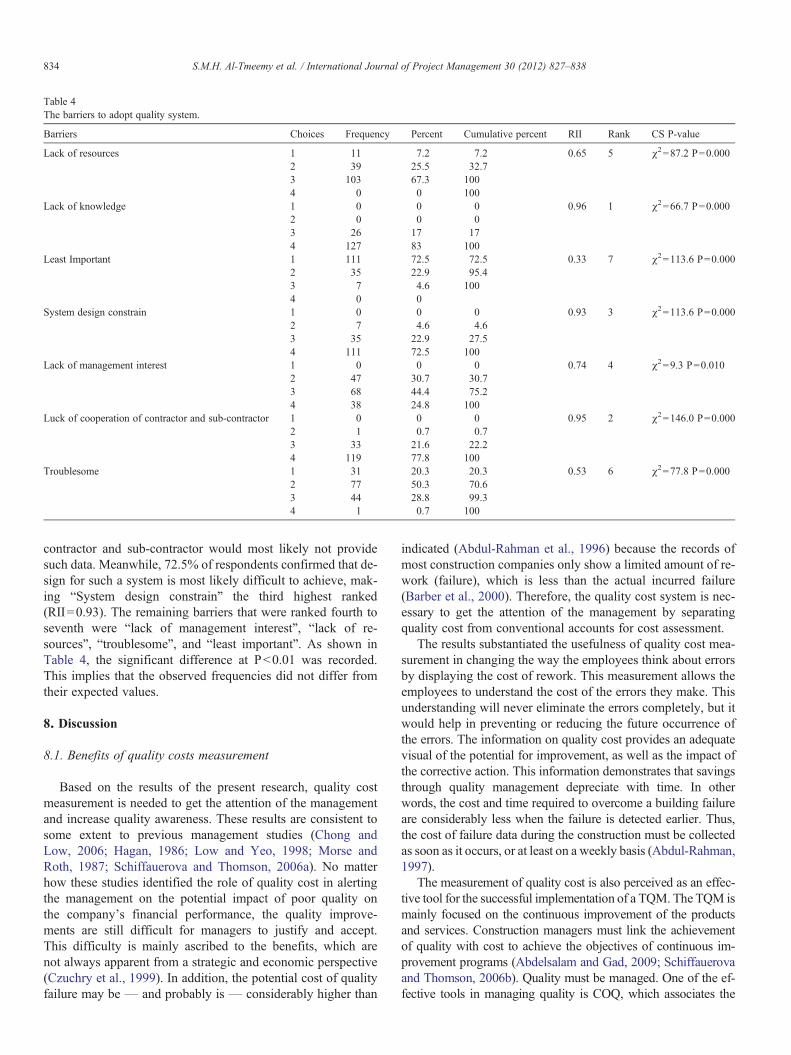
Table 4The barriers to adopt quality system.
Barriers Choices Frequency Percent Cumulative percent RII Rank CS P-value
Lack of resources 1 11 7.2 7.2 0.65 5 χ2=87.2 P=0.0002 39 25.5 32.73 103 67.3 1004 0 0 100
Lack of knowledge 1 0 0 0 0.96 1 χ2=66.7 P=0.0002 0 0 03 26 17 174 127 83 100
Least Important 1 111 72.5 72.5 0.33 7 χ2=113.6 P=0.0002 35 22.9 95.43 7 4.6 1004 0 0
System design constrain 1 0 0 0 0.93 3 χ2=113.6 P=0.0002 7 4.6 4.63 35 22.9 27.54 111 72.5 100
Lack of management interest 1 0 0 0 0.74 4 χ2=9.3 P=0.0102 47 30.7 30.73 68 44.4 75.24 38 24.8 100
Luck of cooperation of contractor and sub-contractor 1 0 0 0 0.95 2 χ2=146.0 P=0.0002 1 0.7 0.73 33 21.6 22.24 119 77.8 100
Troublesome 1 31 20.3 20.3 0.53 6 χ2=77.8 P=0.0002 77 50.3 70.63 44 28.8 99.34 1 0.7 100
834 S.M.H. Al-Tmeemy et al. / International Journal of Project Management 30 (2012) 827–838
contractor and sub-contractor would most likely not providesuch data. Meanwhile, 72.5% of respondents confirmed that de-sign for such a system is most likely difficult to achieve, mak-ing “System design constrain” the third highest ranked(RII=0.93). The remaining barriers that were ranked fourth toseventh were “lack of management interest”, “lack of re-sources”, “troublesome”, and “least important”. As shown inTable 4, the significant difference at Pb0.01 was recorded.This implies that the observed frequencies did not differ fromtheir expected values.
8. Discussion
8.1. Benefits of quality costs measurement
Based on the results of the present research, quality costmeasurement is needed to get the attention of the managementand increase quality awareness. These results are consistent tosome extent to previous management studies (Chong andLow, 2006; Hagan, 1986; Low and Yeo, 1998; Morse andRoth, 1987; Schiffauerova and Thomson, 2006a). No matterhow these studies identified the role of quality cost in alertingthe management on the potential impact of poor quality onthe company's financial performance, the quality improve-ments are still difficult for managers to justify and accept.This difficulty is mainly ascribed to the benefits, which arenot always apparent from a strategic and economic perspective(Czuchry et al., 1999). In addition, the potential cost of qualityfailure may be — and probably is — considerably higher than
indicated (Abdul-Rahman et al., 1996) because the records ofmost construction companies only show a limited amount of re-work (failure), which is less than the actual incurred failure(Barber et al., 2000). Therefore, the quality cost system is nec-essary to get the attention of the management by separatingquality cost from conventional accounts for cost assessment.
The results substantiated the usefulness of quality cost mea-surement in changing the way the employees think about errorsby displaying the cost of rework. This measurement allows theemployees to understand the cost of the errors they make. Thisunderstanding will never eliminate the errors completely, but itwould help in preventing or reducing the future occurrence ofthe errors. The information on quality cost provides an adequatevisual of the potential for improvement, as well as the impact ofthe corrective action. This information demonstrates that savingsthrough quality management depreciate with time. In otherwords, the cost and time required to overcome a building failureare considerably less when the failure is detected earlier. Thus,the cost of failure data during the construction must be collectedas soon as it occurs, or at least on a weekly basis (Abdul-Rahman,1997).
The measurement of quality cost is also perceived as an effec-tive tool for the successful implementation of a TQM. The TQM ismainly focused on the continuous improvement of the productsand services. Construction managers must link the achievementof quality with cost to achieve the objectives of continuous im-provement programs (Abdelsalam and Gad, 2009; Schiffauerovaand Thomson, 2006b). Quality must be managed. One of the ef-fective tools in managing quality is COQ, which associates the
835S.M.H. Al-Tmeemy et al. / International Journal of Project Management 30 (2012) 827–838
achievement of the quality target with the economics of thecompany.
8.2. Barriers to the adoption of quality cost system in buildingconstruction companies
The results seem contradictory as a majority of the respon-dents acknowledged the importance of collecting quality costdata; however, the “lack of knowledge” was the most significantbarrier. The logical premise is that the person who has answeredthe questionnaire does not work on site. To collect quality costdata, a company needs to implement a system (Oliver and Qu,1999) and understand the elements and principles of qualitycost (Sower and Quarles, 2003). Therefore, this process requiresskilled labor to understand the collection and classification ofquality cost. The importance of the skills of the laborer hasbeen acknowledged in several previous researches (Abdul-Rahman et al., 1996; Azim et al., 2010; Hiyassat, 2000; Lowand Goh, 1994; Tabassi and Bakar, 2009). Abdul-Rahman et al.(1996) claimed that most of the nonconformances could be pre-vented either by appropriate inspections or by the employmentof skilled employees. In the same line, Low and Goh (1994)claimed that in the shortage of skilled labor, a large number ofsemi-skilled and poorly trained laborers are employed in the pro-ject, which creates barriers to the implementation of a quality sys-tem during the construction. However, the low level of skillsamong laborers is still one of the factors affecting the low produc-tivity in theMalaysian construction industry (Ibrahim et al., 2010).
Another significant barrier in reporting quality cost data isthe reluctance of contractors and subcontractors to providedata, probably because the contractual arrangement does not in-cite the contractor and subcontractors to announce the true ex-tent of the problems (Barber et al., 2000). Another possiblereason is their lack of awareness of the real significance of qual-ity costs and to what extent these costs can affect the projectperformance (Selles et al., 2008). Apart from this factor, thereis the issue of inaccurate reporting within companies, wherethe failure cost recorded is not a true reflection of the actual sce-nario. For example, reporting of defective works on site issometimes skipped for fear of being held responsible for therectification costs. Too often, site engineers promise to rectifythe problem immediately to prevent the formal recording ofthe defect and halt the issuance of a nonconformance reportby consultants. These engineers would then hide the cost ofthe rectification by other unauthorized cost-saving measures,such as cutting corners. Thus, the instances where the projectappears to have been completed within the cost and with minimalwastage due to rework may not be entirely true.
The results indicated that the process of designing andimplementing a quality cost system is not an easy task. However,most respondents denied viewing such a system with reduced im-portance. This acknowledgement indicates that the Malaysianbuilding construction fraternity is on the right track toward under-standing and realizing the importance and usefulness of managingquality cost. In general, the quality cost system implementation ismet with resistance from the affected working level personnel be-cause of the additional workload it entailed. To further exacerbate
the situation, the top management is often unconvinced of its use-fulness (Low and Yeo, 1998). However, huge expenditures onmaterials, money, and time are wasted yearly because of ineffi-cient or nonexistent quality management procedures (Arditi andGunaydin, 1997). Despite the similarity of reasons cited in pre-vious literature for not adopting a quality cost system, an addi-tional investigation within contractors would give a clearerview of the COQ awareness in Malaysian building and con-struction companies.
To provide framework and better understanding for expres-sing the barriers to the implementation of a quality cost system,according to their interpretation, the barriers can be linked up tothree groups or categories, namely, “culture and knowledge”,“system”, and “company” as shown in Fig. 2. Culture hasbeen considered as an indicator of how things get done withinan organization (Garrett and Teizer, 2009). Culture comprisesteamwork, loyalty, commitment, participation of employees(Fong and Kwok, 2009), behavior, and attitude (Abdul-Rahman et al., 1996). To some researchers, culture is an inte-grated product of social interaction and organizational life(Harvey and Stensaker, 2008), and is associated with knowledge(Cetina, 2007; Fong and Kwok, 2009). Therefore, the barriers of“lack of knowledge” and “lack of cooperation” can be placedunder the first category (i.e., culture and knowledge). This cate-gory obtained the highest RII of 0.96.
The second group includes the barriers related to the system,which include “system design constrain”, “troublesome”, and“least important”. This group is ranked lowest, with an RII of0.60. The third group, which refers to the barriers related tothe company, has an RII of 0.7. This group includes “lack ofmanagement interest” and “lack of resources”.
9. Conclusion
The present study is concerned with the assessment of theawareness of the Malaysian building construction industry re-garding quality costs and investigating the barriers that mayconstrain the implementation of the system for recording andcollecting quality cost data. However the majority of the re-spondents acknowledged the importance of collecting qualitycost data, the level of quality cost knowledge among the sitestaff was relatively low. The present study suggests that thelevel of the site staff's knowledge should be as important asthat of the management to successfully collect and record qualitycost data. Therefore, there is a high demand on quality cost train-ing to enhance the site staff's knowledge and skill.
The necessity of establishing a quality cost system stemsfrom the fact that the implication of COQ cannot be realizedwithout reporting and establishing all the true quality costs.However, the implementation of such a system is not an easytask and it is normally met with barriers. The barriers are notknown, so overcoming them is difficult. The current researchprovided managers and participants a more informed sense toweigh the benefits against the barriers in the process of elimi-nating to or removing them.
To obtain a quantum leap with regard to achieving the resul-tant gain from the benefits of collecting quality cost data, it is
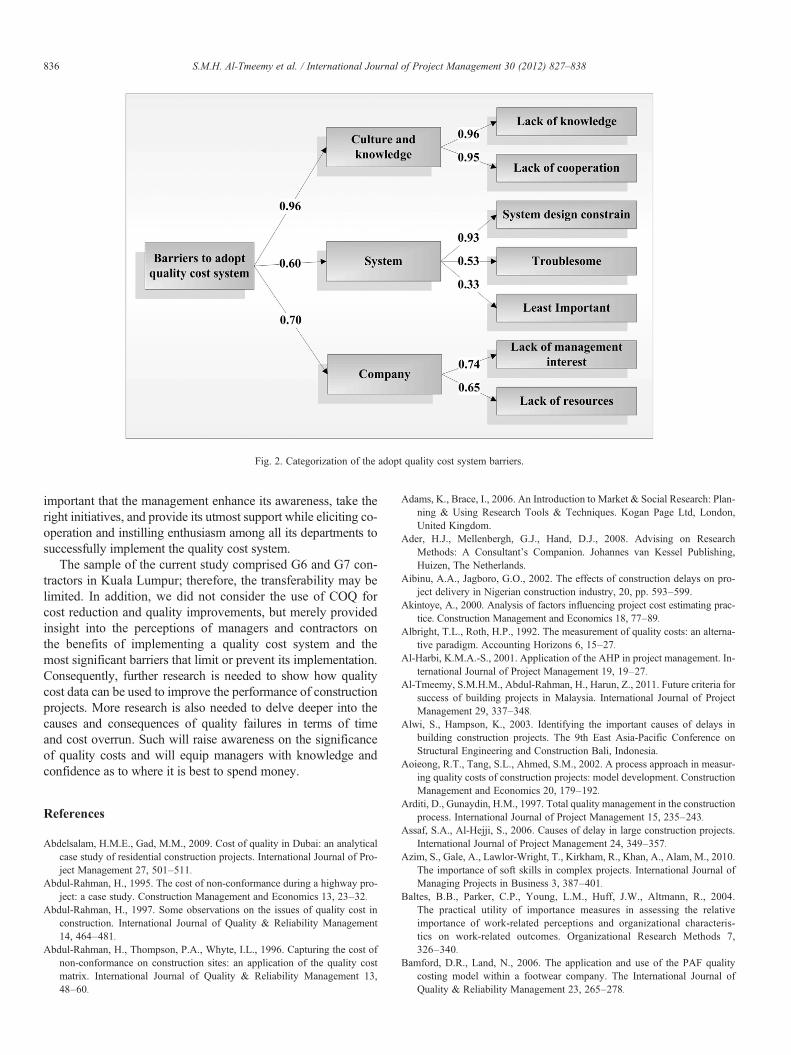
Fig. 2. Categorization of the adopt quality cost system barriers.
836 S.M.H. Al-Tmeemy et al. / International Journal of Project Management 30 (2012) 827–838
important that the management enhance its awareness, take theright initiatives, and provide its utmost support while eliciting co-operation and instilling enthusiasm among all its departments tosuccessfully implement the quality cost system.
The sample of the current study comprised G6 and G7 con-tractors in Kuala Lumpur; therefore, the transferability may belimited. In addition, we did not consider the use of COQ forcost reduction and quality improvements, but merely providedinsight into the perceptions of managers and contractors onthe benefits of implementing a quality cost system and themost significant barriers that limit or prevent its implementation.Consequently, further research is needed to show how qualitycost data can be used to improve the performance of constructionprojects. More research is also needed to delve deeper into thecauses and consequences of quality failures in terms of timeand cost overrun. Such will raise awareness on the significanceof quality costs and will equip managers with knowledge andconfidence as to where it is best to spend money.
References
Abdelsalam, H.M.E., Gad, M.M., 2009. Cost of quality in Dubai: an analyticalcase study of residential construction projects. International Journal of Pro-ject Management 27, 501–511.
Abdul-Rahman, H., 1995. The cost of non-conformance during a highway pro-ject: a case study. Construction Management and Economics 13, 23–32.
Abdul-Rahman, H., 1997. Some observations on the issues of quality cost inconstruction. International Journal of Quality & Reliability Management14, 464–481.
Abdul-Rahman, H., Thompson, P.A., Whyte, I.L., 1996. Capturing the cost ofnon-conformance on construction sites: an application of the quality costmatrix. International Journal of Quality & Reliability Management 13,48–60.
Adams, K., Brace, I., 2006. An Introduction to Market & Social Research: Plan-ning & Using Research Tools & Techniques. Kogan Page Ltd, London,United Kingdom.
Ader, H.J., Mellenbergh, G.J., Hand, D.J., 2008. Advising on ResearchMethods: A Consultant's Companion. Johannes van Kessel Publishing,Huizen, The Netherlands.
Aibinu, A.A., Jagboro, G.O., 2002. The effects of construction delays on pro-ject delivery in Nigerian construction industry, 20, pp. 593–599.
Akintoye, A., 2000. Analysis of factors influencing project cost estimating prac-tice. Construction Management and Economics 18, 77–89.
Albright, T.L., Roth, H.P., 1992. The measurement of quality costs: an alterna-tive paradigm. Accounting Horizons 6, 15–27.
Al-Harbi, K.M.A.-S., 2001. Application of the AHP in project management. In-ternational Journal of Project Management 19, 19–27.
Al-Tmeemy, S.M.H.M., Abdul-Rahman, H., Harun, Z., 2011. Future criteria forsuccess of building projects in Malaysia. International Journal of ProjectManagement 29, 337–348.
Alwi, S., Hampson, K., 2003. Identifying the important causes of delays inbuilding construction projects. The 9th East Asia-Pacific Conference onStructural Engineering and Construction Bali, Indonesia.
Aoieong, R.T., Tang, S.L., Ahmed, S.M., 2002. A process approach in measur-ing quality costs of construction projects: model development. ConstructionManagement and Economics 20, 179–192.
Arditi, D., Gunaydin, H.M., 1997. Total quality management in the constructionprocess. International Journal of Project Management 15, 235–243.
Assaf, S.A., Al-Hejji, S., 2006. Causes of delay in large construction projects.International Journal of Project Management 24, 349–357.
Azim, S., Gale, A., Lawlor-Wright, T., Kirkham, R., Khan, A., Alam, M., 2010.The importance of soft skills in complex projects. International Journal ofManaging Projects in Business 3, 387–401.
Baltes, B.B., Parker, C.P., Young, L.M., Huff, J.W., Altmann, R., 2004.The practical utility of importance measures in assessing the relativeimportance of work-related perceptions and organizational characteris-tics on work-related outcomes. Organizational Research Methods 7,326–340.
Bamford, D.R., Land, N., 2006. The application and use of the PAF qualitycosting model within a footwear company. The International Journal ofQuality & Reliability Management 23, 265–278.
837S.M.H. Al-Tmeemy et al. / International Journal of Project Management 30 (2012) 827–838
Barber, P., Graves, A., Hall, M., Sheath, D., Tomkins, C., 2000. Quality failurecosts in civil engineering projects. International Journal of Quality and Re-liability Management 17, 479–492.
Battikha, G., 2003. Quality management practice in highway construction. In-ternational Journal of Quality & Reliability Management 20, 532–550.
Campenella, J., 1999. Principles of Quality Costs: Principles Implementation,and Use. ASQC Quality Press, New York.
Carpio, C.E., Sydorovych, O., Marra, M.C., 2007. Relative importance of envi-ronmental attributes using logistic regression. Southern Agricultural Eco-nomics Association in Its Series 2007. Mobile, Alabama.
Cetina, K.K., 2007. Culture in global knowledge societies: knowledge culturesand epistemic cultures. Interdisciplinary Science Reviews 32, 361–375.
Chan, D.W., Kumaraswamy, M.M., 1997. A comparative study of causes oftime overruns in Hong Kong construction projects. International Journalof Project Management 15, 55–63.
Chan, D.W.M., Kumaraswamy, M.M., 2002. Compressing construction dura-tions: lessons learned from Hong Kong building projects. International Jour-nal of Project Management 20, 23–35.
Chan, D.W.M., Chan, A.P.C., Lam, P.T.I., Wong, J.M.W., 2011a. An empiricalsurvey of the motives and benefits of adopting guaranteed maximum priceand target cost contracts in construction. International Journal of ProjectManagement 29, 577–590.
Chan, D.W.M., Chan, A.P.C., Lam, P.T.I., Yeung, J.F.Y., Chan, J.H.L., 2011b. Riskranking and analysis in target cost contracts: empirical evidence from the con-struction industry. International Journal of Project Management 29, 751–763.
Chang, C., 2005. High quality and low costs? An application. Journal of theAcademy of Business and Economics II 172–187.
Chen, Y., Tang, K., 1992. A pictorial approach to poor-quality cost manage-ment. IEEE Transactions on Engineering Management 39, 149–157.
Choi, M., Brand, M., Kim, J., 2009. A feasibility evaluation on the outsourcingof quality testing and inspection. International Journal of Project Manage-ment 27, 89–95.
Chong, W.-K., Low, S.-P., 2006. Latent building defects: causes and designstrategies to prevent them. Journal of Performance of Constructed Facilities20, 213–221.
CIDB, 2008a.Malaysia Report. 14th Asia Construction Congress. . (Tokyo, Japan).CIDB, I.D.B.M., 2008b. Construction Projects in Local Market. CIDB Publica-
tions, Kuala Lumpur, Malaysia.CII, 1990. The Quality Performance Management System: A Blueprint for Im-
plementation Construction Industry Institute, University of Texas. CII Pub-lication, Austin, Texas, pp. 10–13.
Crosby, P.B., 1979. Quality is Free. McGraw-Hill, New York.Czaja, R., Blair, J., 2005. Designing Surveys: A Guide to Decisions and Proce-
dures. Sage Publications, Inc, United States of America.Czuchry, A.J., Yasin, M.M., Little, G.S., 1999. A practical, systematic approach
to understanding cost of quality: a field study. Industrial Management &Data Systems 99, 362–366.
Dale, B.G., Plunkett, J.J., 1999. Quality Costing. Gower Publishing Limited,England.
Davis, K., Ledbetter, W.B., Burati Jr., J.L., 1989. measuring design and construc-tion quality costs. Journal of Construction Engineering and Management 115,385–400.
Dikmen, I., Birgonul, M.T., Kiziltas, S., 2005. Strategic use of quality functiondeployment (QFD) in the construction industry. Building and Environment40, 245–255 (40 (2005)).
Din, S., Abd-Hamid, Z., Bryde, D.J., 2010. ISO 9000 certification and construc-tion project performance: the Malaysian experience. International Journal ofProject Management. doi:10.1016/j.ijproman.2010.11.001.
Dulaimi, M.F., Ling, F.Y.Y., Bajracharya, A., 2003. Organisational motivationand inter-organisational interaction in construction innovation in Singapore.Construction Management and Economics 21, 307–318.
East, E.W., Love, D.R., 2011. Value-added analysis of the construction submit-tal process. Automation in Construction. doi:10.1016/j.autcon.2011.04.008.
Feigenbaum, A.V., 1956. Total quality control. Harvard Business Review 34,93–101.
Field, A.P., 2009. Discovering Statistics Using SPSS. SAGE Publications, London.Fong, P.S.W., Kwok, C.W.C., 2009. Organizational culture and knowledge
management success at project and organizational levels in contracting
firms. Journal of Construction Engineering and Management 135,1348–1356.
Garrett, J.W., Teizer, J., 2009. Human factors analysis classification system re-lating to human error awareness taxonomy in construction safety. Journal ofConstruction Engineering and Management 135, 754–763.
Gilmore, H.L., 1990. Continuous incremental improvement: an operations strat-egy for higher quality, lower costs, and global competitiveness. SAM Ad-vanced Management Journal 55, 21–25.
Hagan, J.T., 1986. Principles of Quality Costs. American Society for QualityControl, Milwaukee, WI.
Hansen, D.R., Mowen, M.M., 1997. Management Accounting. South-WesternCollege Publishing, Cincinnati, Ohio, USA.
Harvey, L., Stensaker, B., 2008. Quality culture: understandings, boundariesand linkages. European Journal of Education 43, 427–442.
Hawkins, P.G., Woollons, D.J., 1998. Failure modes and effects analysis ofcomplex engineering systems using functional models. Artificial Intelli-gence in Engineering 12, 375–397.
Hiyassat, M.A.S., 2000. Applying the ISO standards to a construction compa-ny: a case study. International Journal of Project Management 18,275–280.
Ibrahim, A.R.B., Roy, M.H., Ahmed, Z., Imtiaz, G., 2010. An investigation ofthe status of the Malaysian construction industry. Benchmarking: An Inter-national Journal 17, 294–308.
Kazaz, A., Birgonulb, M.T., Ulubeylia, S., 2005. Cost-based analysis of qualityin developing countries: a case study of building projects. Building and En-vironment 40, 1356–1365.
Kometa, S.T., Olomolaiye, P.O., Harris, F.C., 1994. Attributes of UK construc-tion clients influencing project consultants' performance. ConstructionManagement and Economics 12, 433–443.
Kothari, C.R., 2004. Research Methodology: Methods and Techniques. NewAge International, New Delhi, India.
Krisham, S.K., Agua, A., Husain, N., 2000. Cost of quality: the hidden costs.Total Quality Management 11, 844–848.
Kumar, K., Brittain, J.C., 1995. Cost of quality: evaluating the health of Britishmanufacturing industry. The TQM Magazine, 7, pp. 50–57.
Lam, S.W., 1994. ISO 9000 in Construction. McGraw-Hill, Singapore.Le, K.N., Tam, V.W.Y., 2008. On generic skill development: an engineering
perspective. Digital Signal Processing 18, 355–363.Lin, Z.J., Johnson, S., 2004. An exploratory study on accounting for quality
management in China. Business Research 57, 620–632.Love, P.E.D., Irani, Z., 2003. A project management quality cost information
system for the construction industry. Information Management 40,649–661.
Low, S.P., Goh, K.H., 1994. Construction quality assurance: problems of im-plementation at infancy stage in Singapore. International Journal of Quality& Reliability Management 11, 23–37.
Low, S.P., Yeo, H.K.C., 1998. A construction quality costs quantifying systemfor the building industry. International Journal of Quality & ReliabilityManagement 15, 329–349.
Marques, G., Gourc, D., Lauras, M., 2010. Multi-criteria performance analysisfor decision making in project management. International Journal of ProjectManagement. doi:10.1016/j.ijproman.2010.10.002.
Mattos, J.C., Toledo, J.C., 1997. Quality costs as a quality management tool: di-agnostic of companies with ISO 9000 certification. 17th National Congressof Industrial Engineering. Gramado, Portuguese.
Miguel, P.A., Pontel, S., 2004. Assessing quality costs of external failures (war-ranty claims). International Journal of Quality & Reliability Management21, 309–318.
Morse, W.J., 1993. A handle on quality costs. CMA-the Management Account-ing Magazine, 67, pp. 21–24.
Morse, W.J., Roth, H.P., 1987. Why quality costs are important. ManagementAccounting November 42–43.
Oliver, J., Qu, W., 1999. Cost of quality reporting: some Australian evidence.International Journal of Applied Quality Management 2, 233–250.
Parast, M.M., 2011. The effect of Six Sigma projects on innovation and firmperformance. International Journal of Project Management 29, 45–55.
Pedhazur, E.J., Schmelkin, L.P., 1991. Measurement, Design, and Analysis: AnIntegrated Approach. Lawrence Erlbaum Associates Inc., Hillside, NJ.
838 S.M.H. Al-Tmeemy et al. / International Journal of Project Management 30 (2012) 827–838
Raymond, L., Bergeron, F., 2008. Project management information systems: anempirical study of their impact on project managers and project success. In-ternational Journal of Project Management 26, 213–220 (26 (2008)).
Raz, T., Elnathan, D., 1999. Activity based costing for projects. InternationalJournal of Project Management 17 (1), 61–67 (1999 17).
Rodchua, S., 2006. Factors, measures, and problems of quality costs programimplementation in the manufacturing environment. Journal of IndustrialTechnology 22, 1–6.
Saaty, T.L., 1980. The Analytic Hierarchy Process. McGraw-Hill, New York.Schiffauerova, A., Thomson, V., 2006a. A review of research on cost of quality
models and best practices. International Journal of Quality & ReliabilityManagement 23, 647–669.
Schiffauerova, A., Thomson, V., 2006b. Managing cost of quality: insight intoindustry practice. The TQM Magazine, 18, pp. 542–550.
Selles, M.E.S., Rubio, J.A.C., Mullor, J.R., 2008. Development of a quantificationproposal for hidden quality costs: applied to the construction sector. Journal ofConstruction Engineering and Management 134, 749–757.
Serpell, A., 1999. Integrating quality systems in construction projects: the Chileancase. International Journal of Project Management 17, 317–322.
Soofi, E.S., Retzer, J.J., Yasai-Ardekani, M., 2000. A framework for measuringthe importance of variables with applications to management research anddecision models. Decision Sciences 31, 595–625.
Sower, V.E., Quarles, R., 2003. Cost of quality: why more organizations do notuse it effectively. Annual Quality Congress. Sam Houston State University,Huntsville, TX, Kansas City, pp. 625–637.
Tabassi, A.A., Bakar, A.H.A., 2009. Training, motivation, and performance: thecase of human resource management in construction projects in Mashhad,Iran. International Journal of Project Management 27, 471–480.
Tam, V.W.Y., Le, K.N., 2007. Quality improvement in construction by using aVandermonde interpolation technique. International Journal of Project Man-agement 25, 815–823.
Tam, V.W.Y., Le, K.N., 2008. On using the Gaussian and hyperbolic distribu-tions to improve quality in construction. Journal of Engineering, Design andTechnology 6, 112–123.
Tam, V.W.Y., Le, K.N., Le, H.N., 2008. Using Gaussian and hyperbolic distribu-tions for quality improvement in construction: case study approach. Journal ofConstruction Engineering and Management 134, 555–561.
Tang, S.L., Aoieong, R.T., Ahmed, S.M., 2004. The use of process cost model(PCM) for measuring quality costs of construction projects: model testing.Construction Management & Economics 22, 263–275.
Tatikonda, L.U., Tatikonda, R.J., 1996. Measuring and reporting the cost ofquality. Production and Inventory Management Journal 37, 1–7.
Tsai, W.-H., Hsu, P.-Y., Cheng, J.M.-S., Chen, Y.-W., 2006. An AHP approachto assessing the relative importance weights of ERP performance measures.International Journal of Management and Enterprise Development 3,351–375.
Vaus, D.A.D., 2002. Surveys in Social Research. Allen & Unwim, Australia.Walker, D.S., Tobias, A.M., 2006. Meaningless muddles — or the art of deci-
phering manufacturing management models. Project: Magazine of the Asso-ciation for Project Management, 19, pp. 24–26.
Willis, T.H., Willis, W.D., 1996. A quality performance management systemfor industrial construction engineering projects. International Journal ofQuality and Reliability Management 13, 38–48.
Yang, J.-B., Peng, S.-C., 2008. Development of a customer satisfaction evalua-tion model for construction project management. Building and Environment43, 458–468.
Zeng, S.X., Tian, P., Tam, C.M., 2005. Quality assurance in design organisa-tions: a case study in China. Managerial Auditing Journal 20, 679–690.
Zhao, J., 2000. An optimal quality cost model. Applied Economics Letter 7,185–188.