Embed Size (px)
Citation preview

Contracts and Performance inPrivate Equity Investments ∗
Stefano Caselli Emilia Garcia-Appendini Filippo IppolitoBocconi University Bocconi University Bocconi University
[email protected] [email protected] [email protected]
August 3, 2010
Abstract
Exploiting a unique opportunity offered by the Italian private equity (PE) market, we uncovera positive relationship between the presence of covenants and several measures of performance of PEinvestments at the deal level. We conjecture that covenants contain private information availableto the contracting parties involved in the deal, and set up a structural model in which the inclusionof covenants depends on the expected increase in returns to these parties when the covenant ispresent. The structural model allows us to conclude that (i) deals with a poor governance structurehave a lower performance, (ii) PE investors have a large bargaining power, and (iii) covenants andpricing of PE deals are used by PE investors as complements.
JEL Classifications: G11, G23, G24Keywords:Private equity, venture capital, internal rate of return, covenants
∗We would like to thank MPS Venture SGR for kindly providing the data, and Francesco Corielli, Marco DaRin, Annette Schoar and two anonymous referees for helpful comments. We also thank seminar participants at theEFMA in Milan and FMA in Reno. We acknowledge financial support from CAREFIN Centre for Applied Researchin Finance. All remaining errors are our own. All authors are affiliated with the Department of Finance at BocconiUniversity, Via Roentgen 1, 20136 Milan, Italy.

Contract Characteristics andthe Returns of Private Equity Investments
Abstract
Exploiting a unique opportunity offered by the Italian private equity (PE) market, we uncovera positive relationship between the presence of covenants and several measures of performance of PEinvestments at the deal level. We conjecture that covenants contain private information availableto the contracting parties involved in the deal, and set up a structural model in which the inclusionof covenants depends on the expected increase in returns to these parties when the covenant ispresent. The structural model allows us to conclude that (i) deals with a poor governance structurehave a lower performance, (ii) PE investors have a large bargaining power, and (iii) covenants andpricing of PE deals are used by PE investors as complements.
JEL Classifications: G11, G23, G24Keywords:Private equity, venture capital, internal rate of return, covenants

1 Introduction
In this paper we examine the relationship between covenants and performance in private equity
(PE) investments, an issue that is of primary importance both for academics and practitioners. The
uniqueness and complexity of PE contracts has attracted the interest of academics as a primary
exploratory field for testing theories of optimal contracting (Kaplan and Stromberg (2002), Kaplan
and Stromberg (2004), Cumming (2008), Sahlman (1990)). At the same time, PE investors often
refer to their ability to design contracts that are more complex than plain vanilla equity and debt
as a main motive for the high profitability of their industry and a justification for charging higher
fees than mutual funds (Metrick and Yasuda (2010), Phalippou and Gottschalg (2009)).
Our major finding is that the relationship between covenants and performance is positive.
Covenants are generally associated with higher firm and investment returns, and with more success-
ful exits. Regardless of the measure of performance that one chooses − be it IRR or growth in sales,
in ROA, or in ROE (gross or annualized) − covenants are correlated with higher returns. Similarly,
covenants are associated with a higher likelihood of exiting via an IPO and a lower likelihood of
a write off. As our results are robust to different measures of performance, we conclude that the
relationship between covenants and performance is not only due to the mechanical redistribution
of cash flows associated with specific covenants, such as exit ratchets or redemption rights, which
have the effect of transferring cash flows from PE investors to insiders, or viceversa. On the con-
trary, our result suggests that covenants are associated with more fundamental differences in firm
selection, efficiency and, ultimately, profitability. Moreover, we find that the relationship between
covenants and performance is significant also when we condition for primary firm, fund and market
wide characteristics. This additional finding suggests that covenants are an important predictor of
investment performance, even after accounting for other relevant publicly observable variables.
Although the above finding may appear intuitive, it is rather non obvious. In an optimal
contracting framework, PE investors and target firm managers choose covenants so to minimize
potential agency conflicts which relate to adverse selection and double sided moral hazard (Schimdt
(2003), Cornelli and Yosha (2003), Hellman (2006), Casamatta (2003)). Generally, a model of
1

optimal contracting will offer a closed form solution in which covenants and other contractual
characteristics (the choice variables) depend solely on the parameters of the model, such as firm
and market characteristics. This in turn implies that at the optimum returns should also depend
only on the parameters of the model, and not on choice variables such as covenants.
So why do we observe a positive and significant relationship between covenants and perfor-
mance? A possible answer is that covenants are capturing private information which is observable
by some or all parties involved in the deal, but not by the wider public. While surely not the
only one, an important variable that the wider public cannot easily observe is the expectation that
the contracting parties have about future investment returns. Insofar as the inclusion of specific
covenants reveals information about expectations on returns, a regression that has returns as depen-
dent variable should include covenants as a regressors because covenants are capturing information
that is not entirely reflected in publicly observable firm and market characteristics. For example,
a lockup clause may be included in the deal only if the contracting parties believe that an IPO is
likely to occur. As an IPO is typically associated with higher returns, because it is generally the
most successful form of exit, one should expect to observe a positive relationship between lockups
and investment returns.
How can we explicitly test for the information content of covenants? As Kai and Prabhala
(2007) illustrate in the broader context of self-selection models in corporate finance, the inclusion
of covenants can be examined as a form of self selection. While self selection may be perceived as
a nuisance problem in that it leads to inconsistent estimates of parameters in a regression, it can
alternatively be employed as a test of private information theories. Puri (1996), Song (2004), Fang
(2005), Dunbar (1995) and more closely to our framework Goyal (2005) all provide examples of how
self selection can be employed to study the role of private information in relation to the choices of
economic agents.
Broadly basing our methodology on Heckman (1979) and more closely on Goyal (2005), we
then set up a structural model of self selection to examine the relationship between covenants and
performance. The model proposes a structural equation for covenants according to which the choice
of whether to include a covenant or not depends on the expected performance of the investment.
2

We conjecture that only if expected performance is sufficiently high a covenant will be included. In
particular we expect the differential between expected performance with and without the inclusion
of the covenant to determine the probability of including the covenant itself.
We then identify the reduced form equation for investment returns with and without covenants.
We conjecture that expected returns depend on firm characteristics, PE fund governance and post
investment monitoring. For the firm characteristics we employ market to book value of equity,
profitability, size, leverage and industry.
To proxy for fund governance we identify which funds are majority owned by a bank. Follow-
ing Lerner, Schoar and Wong (2007) and Hellmann, Lindsey and Puri (2008), we expect majority-
owned bank funds to have an objective function that is different from that of other funds. In
particular, the evidence suggests that majority-owned bank funds optimize the returns of the in-
vestment in equity, while also accounting for the effect that this investment has on the default risk
of the invested firm. This is particularly true when the owning bank entertains a credit relation-
ship with the invested firm, outside the fund. In the latter cases there can be a conflict between
value maximization of the equity stake and risk minimization of the credit position. As a result,
we interact fund ownership with the existence of a credit relationship and create a dummy that
takes value of one if the fund is majority owned by a bank which has a credit relationship with the
invested firm. We expect to observe lower returns in investments for which the dummy is one.
We then construct a measure of monitoring by computing the number of firms in which
a given fund manager is acting as board director. In the spirit of Lerner (1995) and Fich and
Shivdasani (2006) we expect fund managers that are simultaneously appointed as board members
of many invested firms to be less able to perform effective monitoring on firms. In other words fund
managers may be ”overstreched” and thus monitor less strictly the invested firms. Monitoring by
PE investors has a positive effect on investment returns because it leads to lower managerial moral
hazard while at the same time it maximizes the network benefits of PE sponsorship for the invested
firm. Therefore, we conjecture that, ceteris paribus, when fund managers are overstreched invested
firms perform relatively worse.
Having thus defined the independent variables of the reduced form equations of returns, we
3

can construct a reduced form equation for the use of covenants. In the reduced form equations,
we conjecture that covenants are a function of the above independent variables as well as of the
prevailing market conditions at the time of investment. As shown by Gompers and Lerner (1999,
2000), market conditions at the time of contracting have an impact on the choices of PE investors,
in particular on pricing, for which we control by including the ratio of market value of equity −as
priced in the deal− to book value of equity. We conjecture that market conditions are also likely
to affect other terms of contracting, such as the inclusion of covenants.
We then start estimating the model step by step. First, we estimate the structural equation
of covenants and compute the inverse Mills ratio that we use in the performance regressions to
adjust for the selectivity bias. To exclude the effect of bargaining power on pricing and other
redistribution effects linked to covenants we use change in sales, rather than IRR, as a main measure
of performance. Our findings are, however, robust to the various performance measures outlined
above.
Second, we estimate the performance regressions and find that fund governance is an impor-
tant determinant of performance. In particular, when the dummy for the credit relationship is one,
we observe a reduction in expected annualized sales growth in the range of 1.9 to 2.5%. Further-
more, we find that each extra firm for which a fund director is required to act as board director,
causes a drop in annualized sales growth of approximately 0.3%. We then conclude that fund gover-
nance and monitoring are two important determinants of investment performance, thus confirming
the predictions of Fich and Shivdasani (2006) on the role of monitoring in PE investments and the
findings of Hellmann, Lindsey and Puri (2008) on the effect of governance.
Finally, using the predictions from the performance regressions, we can estimate the covenant
regressions. In a Probit setup we find that the probability of including a lockup clause or an tag
along right increases with the differential in expected performance of PE investors. Furthermore,
covenants appear to be inversely related to pricing, proxied here by the market to book ratio of
equity. This indicates that pricing and covenants are complements, which suggests that they at least
partially reflect bargaining power. When PE investors have more bargaining power, they obtain
lower prices and impose more covenants. Finally, we show that the inclusion of covenants depends
4

positively on prevailing market conditions at the time of contracting. If the relative number of IPOs
and returns in public markets have been high in the six months preceding the deal, we observe a
larger use of covenants. We interpret this finding as also consistent with an explanation based on
bargaining power.
To our knowledge this is the first paper that addresses empirically the relationship between
contracts and performance in PE investments. There is existing work on the performance of PE
investments at the fund level (Ljungqvist and Richardson (2003), Kaplan and Schoar (2005), Lerner,
Schoar and Wong (2007)) but these studies are generally unconcerned about contract characteristics,
simply because contract design occurs at the investment level, not at the fund level. This suggests
that the relationship between covenants and performance necessarily requires the use of investment
level data which is, however, typically not available.
To some extent our research question has been touched upon by Cumming (2008) whose
focus is on the relationship between contracts and exits. He shows that ex-ante stronger PE control
rights increase the likelihood that an entrepreneurial firm will exit via a trade sale, rather than
through a write-off or an IPO. Although his findings indirectly shed some light on the relationship
between contracts and returns, we believe that the variability of returns irrespectively of the form
of exit remains largely unexplored.
In this paper we are able to fill this gap in the literature because we have access to an
uncommonly rich database which contains information on performance, as well as on contract
characteristics, including covenants and governance, at the investment level. We are thus able to
examine the relationship between these variables, and draw conclusions on the effect that contracts
have on returns. Thanks to MPS Venture SGR, the largest active Italian fund, we have access to a
proprietary database that contains the entire universe of completed transactions performed in Italy
by Italian PE investors during the period 1999–2008. The database contains information on the
type of investment distinguishing between early-stage, expansion capital, buy-out and turnaround
finance, exit form, internal rate of return, deal covenants, leverage, percentage of shares owned by
the PE fund, governance characteristics of the invested firm, as well as a number of other accounting
variables for target firms.
5

The rest of the paper is organized as follows. We dedicate Section 2 and 3 to the discussion
of covenants and governance in PE investments. In Sections 4 and 5 we describe the data collection
process and provide some descriptive statistics about our data. Section 6 documents the positive
relationship between covenants and performance. In Section 7 we set up the structural model of
self-selection and present the main results. Conclusions are left to Section 8.
2 Covenants in Private Equity Deals
PE contracts are characterized both by special securities, such as preferred stock, and by the
presence of covenants. The seminal paper in this field is by Kaplan and Stromberg (2002) who
study a sample of contracts between PEs and invested firms. They observe that the distinguishing
characteristic of these contracts is to allow PEs to separately allocate cash flow rights, board rights,
voting rights, liquidation rights and other control rights. These rights are often contingent on
observable measures of financial and non-financial performance.
Subsequent work investigates the effect that covenants have on incentives. There are four
types of agency problems in the PE investment process (Kaplan and Stromberg (2004), Casamatta
(2003), Schmidt (2003)). First, PE investors may be concerned that managers and other executive
inside shareholders are not maximizing the value of the investment, and similarly managers may
be concerned that PE investors do not exert enough effort (double-sided moral hazard). Second, if
insiders know more about the quality/ability of the target firm than do PE investors, then there
may be a problem of adverse selection. Third, a hold-up problem exists if managers with valuable
human capital threaten to leave the firm. The fourth agency problem relates to control : After the
investment, there will be circumstances when PE investors disagree with managers and the former
will want the right to make decisions.
The first three problems outlined above (moral hazard, adverse selection, hold up) indicate
that appropriate contract design is needed to minimize the agency costs. The literature shows that
as a response to moral hazard, PE investors typically tie managerial compensation to performance
(Holmstrom (1979)). As a response to adverse selection, PE investors screen managers of different
6

ability using – again - pay-for-performance contracts (Lazear (1986)). As an alternative screening
mechanism Ross (1977) and Diamond (1991) propose the use of liquidation rights. To deal with
hold-up problems, PE investors can introduce incentive mechanisms based on vesting of managers’
shares (Hart and Moore (1994)). Finally, control theories such as Aghion and Bolton (1992),
Dewatripont and Tirole (1994), and Dessein (2005) show that a solution to the latter problem is to
give control to PE investors in some states and to managers in others.
Covenants tied to a PE contract provide a way to implement the mechanisms necessary to
mitigate the agency and control problems outlined above. For example, Kaplan and Stromberg
(2004) find that greater internal and external risks are associated with more PE cash-flow rights
and PE control rights. Hellman (2006) shows that allocating convertible preferred equity with
automatic conversion to PEs is optimal, because it restores their incentives to promote IPOs (see
also Casamatta (2003) and Cornelli and Yosha (2003)). Cumming (2008) relates the characteristics
of PE contracts to the means by which a PE fund exits, and finds that ex-ante stronger PE control
rights increase the likelihood that an entrepreneurial firm will exit via a trade sale, rather than
through a write-off or an IPO.
In this paper we relate the variability of the performance of PE investments to the presence of
covenants. Table 1 shows the covenants that we include in our analysis: lockup clauses, permitted
transfer rights, redemption rights, tag-along rights, drag-along rights, rights of first refusal, and
exit ratchets. Lockup clauses prohibit, to some or all of the existing firm shareholders, the sale
of shares before a predetermined date. Permitted transfer rights give to some of the shareholders
the permission to make transfers of shares without having to offer them first to the remaining
shareholders. Redemption rights force the firm to buy shares at a predetermined price (a put).
Tag-along rights allow minority shareholders to include their shares in other shareholders’ sales, at
the same price. Drag-along rights force minority shareholders to sell when the majority decides to
sell their own shares. Rights of first refusal, or pre-emption rights, give existing shareholders the
right to be the first to purchase the shares owned by other shareholders, before they are sold to
new investors. Finally, exit ratchets allow shareholders to adjust their participation on the firm
depending on firm performance or on an exit (vesting).
7

Inclusion of each of these covenants in a PE contract can have an effect on managerial
incentives and on cash distribution, as well as act as a proxy for firm quality and market power.
For example, an exit ratchet tends to favor insiders in that their equity stake in the firm increases
when certain predetermined performance targets are met by the firm (cash distribution). The
presence of an exit ratchet thus has the effect of providing the incentives on managers to exert
effort and meet such a performance target (incentives). All else equal, PE investors would prefer
not to increase the equity stake of insiders; thus the inclusion of an exit ratchet in a PE contract
signals a high bargaining power of the insiders relative to the PE investors (market power). Finally,
an exit ratchet can be placed by PE investors into very profitable deals to make the investment
more attractive to insiders (firm quality).
By using several return measures that proxy for the performance of the PE investments for
different stakeholders of the investment, as well as a structural model for covenants, our approach
abstracts from cash distribution and incentive considerations, and focuses on the role of covenants
as proxies of market power and firm quality. As we shall see below, according to the structural
model the choice of whether to include a covenant or not depends on the expected performance of
the investment. As a result, the model shall enable us to uncover the determinants of inclusion of
each covenant into the PE contract, and the role of other firm characteristics in the performance of
the investments.
3 Governance of Private Equity Funds
A second way of implementing the mechanisms that mitigate the agency and control problems iden-
tified above is by imposing a correct governance structure and providing monitoring incentives. The
role of governance and monitoring in PE investments has been previously analyzed by Nikoskelainen
and Wright (2007). The authors find that value increase and return characteristics of LBOs are
to some extent related to the corporate governance mechanisms resulting from a leveraged buyout,
especially managerial equity holdings. They show that return characteristics and the probability of
a positive return are mainly related to size of the buyout target and other acquisitions carried out
8

during the holding period.
We identify two main governance measures that are relevant for addressing managerial agency
costs: First, the number of firms in which the fund manager is acting as board director. This variable
proxies for the ability of PE investors to monitor managers via direct representation in the board of
the firm (Lerner (1995)). In the spirit of Fich and Shivdasani (2006), we expect fund managers that
are simultaneously appointed as board members of many invested firms to be less able to perform
effective monitoring on firms. In other words, fund managers may be too busy to efficiently monitor
the invested firm.
Among the governance measures we also include the ownership of the fund because it has
been identified in the literature as tied to performance. Lerner, Schoar and Wong (2007) distinguish
between different classes of LPs and find that endowments’ average annual returns from PE funds
are nearly 14% greater than for the average investor. Funds selected by investment advisors and
banks lag sharply. This finding is in line with Hellmann, Lindsey and Puri (2008) who suggest
that banks as limited partners might diverge from maximizing returns on investments in order
to maximize future banking income from the portfolio of firms in which they invested. Following
these findings, we then envisage that bank ownership has a direct impact on fund governance and
an indirect one on firm governance. We therefore interact fund ownership with the existence of a
credit relationship and create a dummy that takes value of one if the fund is majority owned by a
bank which had a previous credit relationship with the invested firm. We expect to observe lower
performance in investments for which the dummy is one.
4 Data and Sample Selection
We use a proprietary database of PE deals which was provided to us by MPS Venture SGR, a
PE management company that is currently one of the most active PE players in Italy, and the
largest one in terms of assets under management. The database covers the entire universe of exited
transactions sponsored by Italian investment management companies in Italy in 1999-2005 and
exited no later than March 2008.
9

Data were collected by MPS Venture SGR from several sources. First, Bank of Italy provided
information on all investment companies managing PE investments in Italy. According to European
regulation (the 1998 Financial Services Directive), all PE investment management companies must
register with the Central Bank of their country of incorporation, and must disclose their ownership
structure as well as the names of each of the funds they manage, some of the funds’ governance
characteristics, and the aggregate number of deals made by each fund. Deal-level information is
not required to be disclosed to the Central Bank; however, the majority of Italian management
companies disclose deal information on a voluntary basis to the Italian Private Equity and Venture
Capital Association (AIFI). AIFI coverage of deal information represents 70 to 75% of all deals
registered at the Bank of Italy, depending on the year. Information disclosed by AIFI to MPS
Venture SGR includes the name of each invested company, the type and size of the investment,
the percentage of shares acquired by the PE fund, entry and exit dates, the type of exit, leverage,
IRR, and the covenants used for each deal, among others. Information provided by AIFI has then
been complemented by MPS Venture SGR on the basis of private interviews with fund managers,
so to cover the missing 25-30% of deals that were not reported to AIFI. This process has allowed a
complete mapping of all deals registered at the Bank of Italy.
Deal-level information was then merged with Bureau Van Dijk’s AIDA/Amadeus Database,
and with the Italian Balance Sheet Central Database (Centrale di Bilanci) to obtain balance sheet
information about each of the invested companies. Information about whether the invested company
had a previous relationship with the bank that owns the PE management company was obtained
from the compulsory registers of the Italian Credit Bureau (Centrale dei Rischi). Finally, data
on the activity of the board members of each fund was obtained from the registers of the Trade
Ministry (Camera di Commercio), Bank of Italy, and Italian Security and Exchange Commission
(Consob).
Due to privacy restrictions, MPS Venture SGR provided us the data without disclosing
the names of PE management companies, funds, and invested companies. This implies that we
are unable to merge our data back into publicly available databases such as Amadeus/AIDA to
complement the balance sheet information that we may be still missing. Also, we cannot distinguish
10

between first, second or higher rounds of financing to the same firm. Finally, we do not know which
firms are public or private at the time of investment.
For each deal, we were provided with information about the type of investment (early-stage,
expansion capital, buy-out and turnaround finance), the exit strategy (trade sale, IPO, write-off),
the entry and exit dates, the total and annualized internal rate of return, the deal covenants (lockups,
permitted transfer, redemption right, tag-along right, drag-along right, right of first refusal, exit
ratchet), the leverage used, the percentage of shares of the invested firm held by the PE fund, the
invested firm’s sector and its organizational form. We also have a few governance characteristics
of the management company (percentage of shares of the management company owned by type
of investor, start year of management company, number of funds managed) and of the PE fund
managing the investments (date of establishment, presences of board director appointed by the fund
to the invested firm in other portfolio firm boards, whether the fund director is external or internal
to the fund). For bank-owned PE management companies, we have information about whether the
invested firm had a previous relationship with that bank. Finally, we were provided with limited
accounting information about invested firms at the time of entry (sales, EBITDA, book value of
assets, book value of equity, book value of debt) and on the rate of growth of sales, ROA and ROE
during the investment period. We complemented the database provided by MPS Venture with
data on the Italian market (public market returns, ratio of IPOs over newly created firms, industry
leverage and ROE) using information from Datastream and AIDA/Amadeus.
5 Sample Characteristics
The sample includes 782 investments made by 87 PE funds, which are respectively owned by a
total of 58 management companies. A large fraction of the invested firms operates in the consumer
goods sector (34%), the general industrial sector (25%), and the services sector (20%). Consistently
with the structure of the Italian corporate sector, we find that most invested firms in the sample
are privately owned by individuals and families (69.28%). Banks, PE investors and managers
respectively control 1.87%, 17.04% and 11.82% of the invested firms before the investment.
11

Table 2 offers key summary statistics on the investments contained in our sample. All
investments were financed between 1999 and 2005, with 2000, 2001 and 2004 being peak years. The
median investment size is 4.1 million euros. Deals in our sample exited between 1999 and 2008
and had median annualized internal rate of return ranging from 8.6% to 49.31%, depending on the
year of exit, with the greatest performance observed during the technology bubble of 1999-2001.
As mentioned before, we classify investments in early stage, expansions, buyouts and turnarounds.
The majority of our deals are expansion financing (51.9%), followed by buyouts (26.1%), early stage
(16.2%) and turnaround (5.75%). As Panel B of Table 2 shows, early stage and expansion deals are
much smaller than buyouts and turnarounds. Buyout deals include the largest deals in our sample
(the largest one is e30 million), which however look small by international standards, particularly
if compared to the large buyouts recently witnessed in the US and the UK (see for example Table
4 of Axelson et al. (2010) for statistics on large US and European buyouts).
Most of the deals in our sample where exited via a trade sale (87.85%). In our sample, a trade
sale is defined as the sale of the firm to a well identified third party, such as another PE fund or a
corporation. IPOs and write-offs are relatively rarer, respectively 5.50% and 6.65%. Although not
tabulated, we note that IPOs are more commonly associated with buyouts and expansions than for
early-stage and turnarounds. Turnarounds are generally quite risky and are therefore more likely
to end in a write-off.
Table 3 provides a picture of the distribution of the deal covenants which include: lockups,
permitted-transfer restrictions, redemption right, tag-along right, drag-along right, rights of first
refusal, and exit ratchet. Panel A shows that tag-long rights are the most common covenant (88.49%
of the deals), followed by drag-along rights, permitted transfer and redemption righs. There is
relatively little variation in the use of covenants across the different investment types. However,
covenants are related to the form of exit. For example, the use of lockups, permitted transfers
or rights of first refusal is more commonly associated to IPOs than to deals exited otherwise. As
discussed before, this is probably due to the endogeneity between the use of covenants, investment
returns and exit strategy.
As some deals employ several covenants simultaneously, in Panel B of Table 3 we report
12

the correlations between these covenants. We find that lockups, permitted transfers, redemption
rights and rights of first refusal exhibit a positive and significant correlation. Finally, in Panel C we
analyze the distribution of covenants across time. We observe that there was a general tendency
towards more ‘covenant-lite’ contracts throughout the years, with especially obvious reductions in
the percentage of contracts including tag-along rights, drag-along rights and redemption rights.
In Table 4 we provide means and medians of several performance measures for all investments
and by investment type and exit. As measures of performance, we use gross and annualized internal
rates of returns of the PE investment, and growth in sales, in ROA, and in ROE during the
investment period. These are proxies for the returns to private equity investors (IRR), to all
stakeholders in the firm (sales growth and growth in ROA) and for equity holders (growth in
ROE). Comparing the numbers across different rows, we note that the most profitable investments
independently of the type of stakeholders to the firm were buyouts, while the less profitable ones were
early-stage investments. We also note that deals exited through and IPO performed considerably
better than trade sales.
6 The Relationship between Covenants and Performance
We start our analysis of the relationship between covenants and performance by observing the
pairwise correlation between our performance measures and covenants. As performance measures
we use the eight variables introduced before (gross and yearly IRR, sales growth, ROA growth,
and ROE growth), plus exit via an IPO and via a write-off, where the latter is an inverse measure
of performance. As covenants we include lockups, permitted transfer, redemption right, tag-along
right, drag-along right, right of first refusal, and exit ratchets. We also aggregate all of these
covenants into an index, covenant index, which contains the total number of such covenants and
measures how restrictive the contract is. For each pair of performance measure and covenant, we
report the pairwise correlation coefficient together with its significance level (p-level). Results are
contained in Table 5. The table shows that covenants are positively correlated with all of the
performance measures except write-off, as expected, although the latter negative relationship is
13

not significative. The positive correlation between performance and the presence of covenants is
persistent across all performance measures and is mostly apparent for lockup clauses, permitted
transfer, exit ratchet, and the covenant index.
Next, in Table 6 we compare the univariate differences on average performance measures
between deals that contain the above described covenants and those that do not, using parametric
t-tests and non-parametric Wilcoxon tests of differences on means. Panel A shows that the average
annualized IRR is always higher for the deals containing a covenant (X=1) relative to deals that
do not have one (X=0), and significantly so for all except drag- and tag-along rights. Similarly,
Panel B shows that annualized change in sales is higher when the covenant is present except for
tag-along rights, drag-along rights, and redemption rights, where the differences in means are not
significant. In the last line of each of the tables in Panels A and B we aggregate the covenants into
a new measure which contains a one when a deal has any covenant except tag-along right (as the
latter, we recall, is present in almost every deal). Performance is always higher when a covenant is
present relatively to when it is not present, and significantly so for most measures of performance.
The relationship between covenants and performance observed in Table 5 continues to hold. For
reasons of space, we only report the t-tests for the differences in annualized IRR (Panel A) and
annualized growth in sales (Panel B), but the results are qualitatively very similar for the other
six continuous measures of performance (annualized growth in ROA and in ROE, gross IRR, gross
growth in sales, in ROA, and in ROE).
We next explore whether the positive relationship between covenants and performance found
before can be attributed to observable characteristics about firms or deals. To this end, we per-
form a multivariate analysis where we regress each of our measures of performance on each of
our covenant dummies (or the covenant index defined before) and a set of controls. As controls,
we include a number of firm and deal characteristics (market to book value of equity of the PE
deal; pre-investment profitability, size, and leverage of the invested firm; industry dummies; type of
investment dummies; vintage year of investment dummies; investment duration), and governance
characteristics (whether the invested firm had a previous relationship with the bank owning the PE
fund, as well as the number of presences of the board director appointed by the fund to the invested
14

firm on other portfolio firms of the management company owning the fund). The equations that
we estimate have the following general form:
yi = α+ βCi + γFXFi + γGX
Gi + εi.
Here, yi refers to one of each of the ten previously identified measures of performance (gross and
annualized growth in sales, in ROE, and in ROA; gross and annualized IRR; exit through a write-off
or through an IPO). Ci are the covenants. In each model specification, we respectively include as Ci
a dummy variable for the inclusion of each covenant (lockup clauses, permitted transfer, redemption
rights, tag-along rights, drag-along rights, right of first refusal, and exit ratchet) or the covenant
index. Finally, XF refers to the firm-deal characteristics, and XG are the governance controls. In
each model specification we maintain fixed the vectors of controls XF and XG and we choose one
performance measure and one covenant dummy (or the index). As a result we estimate 80 different
models. We use OLS to estimate all equations involving a continuous measure of performance, and
probit models to estimate the equations involving exits via an IPO or a write-off. We cluster the
standard errors at the fund level to account for similar contracting strategies. The results of all
of the regressions performed above are summarized in Table 8. As reference, we include in Table
7 the definitions of the control variables included in the analysis, their mean and median, and
their pairwise correlations with one of our variables of interest (covenant index) and two of our
performance measures (IRR and growth in sales during the investment period).
Panel A of Table 8 contains the complete model specifications for the regressions of each
of our performance measures on the covenant index. In Panel B we report only the estimated β
coefficients for each of the single covenants on each of the performance measures. The estimated
coefficients of the control variables are qualitatively very similar to the ones reported in Panel A.
The first and central finding of Table 8 is that the relationship between covenants and per-
formance survives to the inclusion of the observable control variables. This is true both when
we aggregate covenants into the index (Panel A) and for each covenant by itself (Panel B). The
only cases where this positive relationship is not statistically significant are tag-along rights and
15

drag-along rights, just as we found in the univariate analysis of Table 6.
Another finding of Table 8 is that governance measures are also significantly correlated with
performance. We observe a negative relationship (i) between having had a previous relationship
with the bank owning the PE fund and the performance of the PE investment, and (ii) between
performance and the number of presences in boards of other portfolio firms of the board director
appointed by the fund to the invested firm. The former relationship is in line with Hellmann, Lindsey
and Puri (2008) who suggest that banks as limited partners might diverge from maximizing returns
on investments in order to maximize future banking income from the portfolio of firms in which
they invested. The latter is consistent with Fich and Shivdasani (2006), who find that a director
sitting simultaneously in many boards can be too “busy” to perform correct monitoring.
Returning to the fundamental issue of the positive relationship between performance and
covenants, should this relationship hold once we control for all firm, deal, fund, and market char-
acteristics? In a complete information setup the answer is no. Let us consider a simple theoretical
model in which y(C,X) is a measure of firm performance, which depends on the choice of covenants
to be included in the contract, C, and a set of exogenous parameters, X. If we assume that contracts
are chosen optimally to maximize the performance and concavity of y, then the optimal contract
must satisfy the first order condition ∂y/∂C = 0. This implies that the optimal choice function
C∗(X) depends only on X. As a consequence, the optimal value of y is y∗(C∗(X), X) = y∗(X). In
other words, performance does not depend on C. X determines both the choice of covenants C∗
and performance y∗.
So why do we observe this positive relationship between covenants and contracts, even after
controlling for all possible observable characteristics? We envisage two possibilities: sample selection
or unobserved heterogeneity.1
Let us consider first the possibility that our results are driven by sample selection. As
discussed in the data section, our sample is representative of all Italian PE deals except that it does
not contain investments that have not been exited. If it is solely due to this selection mechanism
that we arrive at observed relation between covenants and performance, then our results could be
1We thank an anonymous referee for providing the model and the basic arguments contained here and in theprevious paragraph.
16

spurious. To determine whether this is the case, we would have to study the relationships between
covenants and performance in the sample of non-exited investments, or at the very least correct for
sample selection bias using a Heckman selection model or a similar mechanism. Unfortunately, we
cannot carry out any formal analysis because we do not have any information about the deals that
have not been yet exited. While recognizing this econometric limitation, we nevertheless attempt
to argue indirectly that the effect of sample selection on our results should not be significant.
Because we cannot observe whether the relationship between covenants and performance is
reversed within the sample of unobserved deals, we shall use previous literature to infer the average
performance of the unobserved deals, as well as the average use of covenants within this sample, and
draw a conclusion on how these two should be related. On the first front (performance on unobserved
deals), previous research has shown evidence for a negative relationship between performance and
exit. For example, Cochrane (2005) estimates that average log returns to venture capital should be
substantially reduced after accounting for sample selection because market valuations are observed
only when a firm goes public, receives new financing, or is acquired; all of which are events associated
with good returns. Similarly, Phalippou and Gottschalg (2009) find that a large number of non-
exited investments are ‘living dead’ investments, i.e. deals where there has been virtually no activity
and should be in effect written off, but that have not yet been written off. These papers give us
reasons to think that the average quality of the unobserved deals is lower than the quality of the
deals that are on our sample.
Regarding the relationship between exits and covenants, we resort to Cumming (2008), which
is to the best of our knowledge the only paper that addresses the issue of the use of covenants in a
context where both exited and non-exited deals are included. Conveniently, his sample comprises
European deals, and the summary statistics for the exited deals covered in his sample are quite
similar to ours. In Table 3, Cumming (2008) reports the proportion of deals containing covenants on
the full sample of exited and non-exited investments, and on the subsamples of IPOs, acquisitions,
and write-offs. While proportions are not available for the subsample of non-exited investments,
we may infer whether there are systematic differences across exited and non-exited investments
by comparing the proportions within the complete sample with the proportions within each of
17
the exit channels using weighted averages, where weights are assigned according to how populated
each group is. We find that non-exited deals have on average less covenants than the exited deals.
For example, Cumming finds that redemption rights are present on 37% of all deals (exited and
non-exited), on 31% of IPOs, on 54% of acquisitions, and on 30% of write-offs. Because IPOs,
acquisitions and write-offs represent respectively 14.3%, 33.2% and 28.7% of the total number of
deals, then we infer that the remaining non-exited deals should have a proportion of 25.3% of
redemption rights, which is lower than for all exited categories.2 Similar exercises on the other
covenants reported by Cumming yield similar results. We conclude that non-exited deals have on
average less covenants than deals that have been exited.
Joining the arguments of the previous two paragraphs, we infer that unobserved deals have
both lower average performance and lower average number of covenants. As such, we have reasons
to believe that the positive relationship between performance and covenants should not be reversed
with the inclusion of the non-exited deals which we are not observing.
Instead, we believe that the positive relationship observed between covenants and perfor-
mance can be explained by unobserved heterogeneity. As explained above with the simplified
model, under complete information we should not observe any relationship between performance
and covenants. In reality, PE investors and particularly firm managers are privately informed about
the underlying quality of the investments, and we, as econometricians, do not have access to the
full information set. It is plausible that covenants are capturing the private information that some
or all of the parties involved in the PE investment have. Empirically, this means that the effect of
contracts on performance is capturing precisely some unobserved heterogeneity effect.
One important variable that cannot be observed easily by an econometrician is, for example,
the expectation that the contracting parties have about future returns to their investments. If the
inclusion of covenants reveals information about investors’ expectations about future performance,
a regression that has some measure of performance as a dependent variable should include covenants
as one of the regressors. This is simply because covenants are capturing information that is not
entirely reflected in publicly observable firm and market characteristics. For example, a lockup
2We calculate the proportion on non-exited deals as 0.37 − 0.143 × 0.31 − 0.332 × 0.54 − 0.287 × 0.30.
18

clause may be included in the deal only if the contracting parties believe that an IPO is likely to
occur. An IPO is typically associated with higher returns, because it generally the most successful
form of exit. As a result, we obtain a positive relationship between lockups and investment returns.
In the following section we develop a structural model of self selection that enables us to examine
the relationship between covenants and performance in the context of private information.
7 Empirical Model and Results
7.1 A structural self selection model
As previously suggested, we expect the use of covenants to be influenced by unobservable expec-
tations about investment performance. These expectations are part of the information set that
determines the shape of the contract at the time of investment, which means that the use of
covenants depends on expected performance while in turn performance depends on covenants. In
other words, covenants and performance are endogenously determined. As Li and Prabhala (2007)
illustrate, the issue of simultaneity between contract characteristics and returns is common in cor-
porate finance empirical specifications. It can be generally reconducted to a problem of simultaneity
in self-selection. More precisely, the choice of covenants represents here a form of self selection that
can be used to test for private information regarding expected returns, an interpretation that is
broadly consistent with the modeling framework of self selection of Heckman (1979).
A model set up in which covenants are jointly determined with returns is provided by Goyal
(2005), who examines the joint determination of yield spreads and covenants in a sample of debt
issues. In the framework of Goyal, an issuer’s choice of covenants depends on a consideration of
the expected reduction in yield spreads from offering a more restrictive contract and the net other
costs associated with reduced managerial flexibility.
Adapting Goyal’s model to our context, the decision to include a covenant in the PE contract
can be written as the following probit model:
Pr(Ci = 1) = f (γ(y1i − y2i) + Z ′iξ) (1)
19

where Ci is a dummy variable for the inclusion of the covenant in the contract, y1i is the
expected return on an investment with covenants, and y2i is the expected return on an investment
without covenants; in this way, (y1i−y2i) is the expected increase in performance when the covenant
is included in the contract, relative to where it is not included. Zi contains other variables that
may affect the choice of introducing a covenant apart from the expectations on performance. In
the empirical specification, Zi contains firm and fund-specific characteristics, as well as market
conditions at the time of the investment.
Expected performance is different when the covenant is included and when it is not, so we
model these two separately as a function of vectors XFi and XG
i which we defined in the previous
section:
y1i = XF ′i β1F +XG′
i β1G + u1i, (2)
y2i = XF ′i β2F +XG′
i β2G + u2i. (3)
Equation (2) is the performance regression for investments with covenants and Eq. (3) is for
investments with covenants. We cannot estimate Equations (1)–(3) separately because expected
performance is conditioned on the inclusion of the covenant or not. We therefore implement a
procedure based closely on Goyal (2005) (and which itself borrows from Lee (1978) and Maddala
(1983)) to correct for the bias.
The procedure consists in substituting the performance equations (2) and (3) into the covenant
choice equation (1). This allows us to obtain a reduced-form model in which covenants are solely
a function of firm-deal and governance characteristics, XF , and XG, as well as a vector of market
condition controls ZM :
Pr(Ci = 1) = f(XF ′
i θF +XG′i θG + ZM ′
i ξ). (4)
Equation (4) is estimated using a probit model with maximum likelihood, and the linear
predictions, ψi = XF ′i θF + XG′
i θG + ZM ′i ξ are used to calculate the inverse Mills ratio, which is
defined as φ(ψ)/(1 − Φ(ψ)) when covenants are not included and −φ(ψ)/Φ(ψ) when covenants
20

are included. As usual, φ is the standard normal density function and Φ is the standard normal
cumulative distribution function.
As Lee (1978) and Maddala (1983) show, consistent estimates of β1F , β2F , β1G and β2G
are obtained by augmenting Eqs. (2) and (3) with the inverse Mills ratio as the right-hand side
variables, and estimating the equation with OLS. Finally, by substituting the difference in expected
performance for the whole sample, y1i − y2i, into the structural probit equation (1), we obtain
consistent estimates of the structural probit model parameters γ and ξ.
7.2 Estimates from Performance Regressions
In applying the methodology described in the previous section to our data, the first important issue
to consider is that Equations (2) and (3) model the expected performance for each deal. We do
not have an explicit measure of the expected performance for each deal; the best approximation
for expected performance available to us is the realized performance, as measured by the eight
continuous measures of performance that we used previously (gross and annualized IRR, sales
growth, ROA growth, and ROE growth). We therefore use these measures in the estimations of the
reduced-form equations for returns. As variables XF and XG, we include the same sets that we
used in the OLS regressions of performance on covenants of Section 6, and for the pre-investment
market controls ZM we use the market returns for the six months previous to the investment, the
ratio of IPOs to new firms created in Italy during the six months previous to the investment, and
the average ROE for the firms in the same industry as the target firm.
In this section, we report the coefficients of the OLS estimations of Equation (3) augmented
with the inverse Mills ratio obtained by fitting Equation (4).3 Because it is difficult to interpret
the signs of the combinations of coefficient γ with β1F , β2F , β1G and β2G, we omit the probit
estimations of Equation (4); we solely compute the inverse Mills ratio from these estimations.
Finally, we postpone the discussion of the estimated coefficients for the structural model (1) to the
3In fact, the first stage involves estimation of Equations (2) and (3). For reasons of space we only report the latter.The results for the OLS estimations of Equation 2 augmented with the corresponding Mills ratio, are qualitativelyvery similar but present lower significance levels for the coefficients due to the fact that deals that do not containcovenants are in general more populated than those that have the covenant and therefore the sample size for theseestimations is much smaller (the only exceptions are tag-along rights, which are included in the majority of contracts).
21

next section.
Coefficients of Equation (3) augmented with the inverse Mills ratio obtained by fitting Equa-
tion (4) are presented in Table 9. Each column of the table contains the estimated coefficients
for the reduced-form equations for each of the seven covenants available in the sample: lock-up,
permitted transfer, redemption right, tag-along right, drag-along right, right of first refusal, and
exit ratchet. The number of observations in each regression is different as it reflects the number of
deals that do not have the corresponding covenant. All the columns have as dependent variable the
annualized growth in sales as we believe that this is the best measure of firm performance which
is neutral regarding how cashflows are distributed among the different investors. In Section 7.4 we
discuss the results for other performance measures.
The main finding of Table 9 is that governance characteristics are good predictors of perfor-
mance. Deals that have bad governance perform on average worse than those that do not. The
presence of a busy board director in the board of the portfolio firm significantly reduces performance.
Similarly, firms that are financed by funds owned by a bank that previously had a relationship with
the firm perform worse than others. The economic significance of these variables varies depending
on which covenant and sample (with or without covenant) is considered. The values reported, cor-
responding to the sample where covenants are not included, imply that a director that increases the
number of presences in boards of fund portfolio firms by one would decrease the annualized growth
in sales by 0.3 to 0.4%. Analogously, being managed by a fund owned by a bank with which the
firm had a previous relationship leads to a gross growth in sales which is, ceteris paribus, 1.7% to
2.2% lower than for firms that are not in a similar situation. Considering that the average growth
in sales is 7%, this effect is considerable.
Although in the light of the structural model presented above the regressions of Table 8 are
misspecified, we note that the negative effect of a bad governance on performance is a feature that
we had already observed there. We do not report the selection-adjusted effect on growth of sales for
the sample of deals containing the covenant; nevertheless, the negative impact of the governance
measures on the performance measures is also present in those untabulated regressions. In this case,
the ranges of the impact of one more presence of the director in the board of other portfolio firms
22

on growth of sales goes is from -0.1% to -1.4%, where the maximum value occurs when lockups are
present. Similarly, being owned by a fund with which the firm had a previous relationship leads
to a gross growth in sales which is approximately 2.5% lower than for other firms, although due to
sample size considerations the latter results are less statistically significant on the samples where
the covenants are present.
We conclude that funds with a bad governance structure in place – where by governance we
refer to the incentives towards value maximization of the management company owning the fund
that invests in the firm, as well as the degree of busyness of the board director appointed by the
PE fund to the invested firm – perform worse than those with a better governance structure. As
mentioned before, these results are consistent respectively with Hellmann, Lindsey and Puri (2008)
and with Fich and Shivdasani (2006). In Section 7.4 we shall discuss about the robustness of these
results.
7.3 Determinants of the Use of Covenants
We now turn to a discussion of the estimations of the structural equations determining the use of
covenants, Equation (1), in order to uncover what drives the variation in the choice of contracts by
PE investors. The estimated coefficients are contained in Table 10.
Panel A contains the coefficients for Equation (1), considering each covenant by itself, i.e.
independently of the inclusion or exclusion of the other covenants. Acknowledging that the inclusion
or exclusion of each covenant depends on which other covenants are present in the deal, in Panel B
we condition each covenant choice on the rest of the covenants. Both Panels A and B are estimated
using as a measure of performance the difference in the annualized increase in sales when the
covenant is included, relatively to when it is not included. Finally, because the choice of covenants
could reflect expected returns for PE investors (rather than for any general stakeholder to the firm),
in Panel C we repeat the estimations of Panel B using the difference in annualized IRR when the
covenant is included relative to when it is not included as the measure of performance.
Panel A of Table 10 shows that that the probability of including each covenant is rather
independent of the differential in general firm performance (as measured by annualized sales growth)
23

when such covenant is included, relatively to when it is not included. A notable exception for this
neutral relationship between performance differential and covenant inclusion are redemption rights,
which are unexpectedly negatively related to the differential. We explore whether this negative
relationship results because we are ignoring that the decision to include each covenant is done jointly
with all other covenants. To consider the co-determination of all covenants in a simple manner,
in Panel B we condition the choice of each covenant on the presence of the other covenants. The
negative relationship still holds after conditioning on the other covenants; however, we notice that
the presence of redemption rights are very positively correlated with lockup clauses, themselves
positively correlated with performance differential. By simply conditioning on the presence of the
other covenants we are probably failing to capture the feedback effects of the choice of one covenant
on the others, obtaining as a result this unexpected negative sign of the differential on performance
on the inclusion of the covenant.
The measure of performance used in Panels A and B is sales growth, a measure that does not
consider how returns are distributed among the different stakeholders to the firm. It is possible that
each of the stakeholders estimates the expected returns differential of including a covenant, and that
at the end the determination of which covenant to include is determined by the relative bargaining
power of each of the parties involved. As a result, the inclusion of each covenant could be neutral or
even detrimental to the overall firm performance (as seems to be the case with redemption rights),
but beneficial to some of the parties involved. To investigate this possibility from the PE investors’
point of view, we substitute the differential in sales growth with the differential in annualized IRR.
In Panel C we present the estimated coefficients for Equation (1) when we consider the differential
in annualized IRR as the measure of performance in Equations (2) and (3). We find that the
differential of IRR when the covenants are included is positively related with most covenants, and
statistically so with lockup clauses and tag along rights. We infer that the inclusion of lock-up
clauses and tag-along rights was most beneficial for PE investors than for the other stakeholders in
the firm. These covenants were probably determined by a high bargaining power of PE investors
who benefitted the most by their inclusion, even though we do not find statistical evidence that
with their inclusion the overall expected firm performance is better. Regarding the other covenants,
24

we only find a negative relationship between covenants and IRR differential for permitted transfer
clauses (although not statistically significant), and once again, for redemption rights, albeit with
a slightly lower economic significance than in the regressions in Panels A and B. However, once
again we notice that the presence of redemption rights is strongly positively correlated with the
presence of lockup clauses, themselves positively correlated with performance differential. It would
be interesting as a further research to consider a more formal model for the co-determination of all
covenants, considering the feedback effects of the choice of one covenant on the others.
Other results in Table 10 are very similar across the different panels. For example, the
negative coefficients for the market to book value of equity that are present Panels A, B, and C,
indicate that covenants are inversely related to pricing. This relationship is in fact statistically
significant for redemption rights and tag-along rights. This negative relationship indicates that
pricing and these covenants are complements, i.e., when PE investors obtain lower prices they also
impose more covenants. As well as the previous ones, these results also suggest that PE investors
have a large bargaining power.
Results in Table 10 also show that smaller firms, as well as firms that were more profitable at
the time of the investment, are more likely to contract with covenants. Using firm size as an inverse
proxy for information asymmetry, then the former result is consistent with the use of covenants
to reduce moral hazard and adverse selection. The latter result is consistent, once more, with a
high bargaining power of PE investors who use covenants to extract more returns from the most
profitable firms.
Finally, Table 10 also shows that the inclusion of covenants depends positively on prevailing
market conditions at the time of contracting. If the relative number of IPOs and returns in public
markets have been high in the six months preceding the deal, we observe in general a larger use of
covenants. Similarly, when the average industry return on equity has been high in the previous six
months before the deal, inclusion of covenants is more likely. These findings suggest that prevailing
market conditions at the time of investing affect how PE investors contract with invested firms, and
are consistent with Gompers and Lerner (1999, 2000). This finding also suggests that PE investors
have more bargaining power.
25

7.4 Robustness Checks
As robustness checks for the results for the previous section, we also perform the regressions con-
tained in Table 9 (Equation (3)) using the other continuous measures of performance (gross increase
in sales, and gross and annualized IRR, increase in ROE, and increase in ROA). The results -which
we do not report for reasons of space-, are qualitatively very similar. In particular, the negative
relationship between both our governance measures on performance appears in all of our regres-
sions, and is in most cases very strongly statistically significant independently of which covenant
or measure of performance we use. Instead, the statistical and economic significance of the rest of
the controls on performance changes slightly depending on the sample and performance measure
considered, although the signs are relatively stable across all the specifications. Therefore, we feel
comfortable in drawing inferences of the effect of governance on performance, which is rather per-
sistent and significative, and survives after controlling for the endogeneity between contracts and
performance.
We also repeat the estimations in Table 10 using the differential in the other measures of
performance (increase in ROE, increase in ROA; estimations not reported). Consistently with the
results described in the previous section, we find that the differential in performance as measured by
ROA is not related to the inclusion of covenants, with the only except being redemption rights which
are negatively correlated with the performance differential. We also find that lockup clauses and
drag-along rights are positively correlated with the differential in the increase in ROE, suggesting
that these covenants were put in place by all equity investors. The rest of the variables have roughly
the same signs as those reported in Table 10, with statistical significance varying depending on the
measure of performance used. The main conclusions of the previous section thus remain unchanged.
8 Conclusions
In this paper we examine the relationship between the performance of PE investments and contract
characteristics. We identify covenants and governance as the two main contract features that are
relevant for the analysis (Kaplan and Stromberg (2002, 2004)). Previous research shows that the
26

choice of securities is also important. However, we find that in Italy PE investors generally report
to hold common equity. This does not imply that they effectively hold a plain equity contract, as
the addition of covenants fundamentally changes the nature of the payoffs associated with their
securities.
We find that there is a strong positive relationship between the presence of covenants and
investment performance. This relationship is robust to several measures of performance of the firm;
therefore it is not dependent on how cash flows are distributed among the different parties involved
in the PE investment. The positive relationship between covenants and return is also robust to the
conditioning on several control variables that are likely to affect performance of the PE investments.
We argue that in an optimal contracting setup, this relationship between covenants and performance
should not exist, so the positive relationship must be reflecting unobserved heterogeneity / private
information available to the parties involved in the PE contracting.
Recognizing that covenants must be capturing private information, we set up structural
models of self selection according to which the choice of whether to include each covenant depends
on the expected performance of the investment. Through the structural models we observe that
investments that have weak PE governance measures (such as those that are owned by a bank,
or those that have busy directors) perform worse than than the average PE investment. The
structural models also allow us to conclude that PE investors have more bargaining power than
other shareholders, and that PE investors use pricing and covenants as complements. We model
the inclusion of each covenant independently of the others; leaving a simultaneous model for all
covenants for future research.
27

References
[1] Aghion, P. and P. Bolton (1992): “An Incomplete Contracts Approach to Financial Contract-
ing,” Review of Economic Studies 77, 338-10l
[2] Axelson, U., T. Jenkinson, P. Stromberg and M. S. Weisbach (2010): “Leverage and Pricing
in Buyouts: An Empirical Analysis”, Working Paper, SIFR
[3] BVCA (2007): “A Guide to Venture Capital Term Sheets”, British Venture Capital Associa-
tion, http://www.bvca.co.uk/
[4] Casamatta, C. (2003): “Financing and Advising: Optimal Financial Contracts with Venture
Capitalists,” Journal of Finance, 58(5), 2059–2085
[5] Cochrane, J. H. (2005): “The Risk and Return of Venture Capital,” Journal of Financial
Economics, 75(1), 3–52
[6] Cornelli, F., and O. Yosha (2003): “Stage Financing and the Role of Convertible Securities,”
Review of Economic Studies, 70(1), 1 – 32
[7] Cumming, D. (2008): “Contracts and Exits in Venture Capital Finance” Review of Financial
Studies, 21(5), 1947–1982
[8] Dessein, W. (2005): “Information and Control in Alliances and Ventures,” Journal of Finance,
60(5) 2513-2549
[9] Dewatripont, M. and J. Tirole (1994): “A Theory of Debt and Equity: Diversity of Securities
and Manager-Shareholder Congruence,” Quarterly Journal of Economics 109, 1027-1054
[10] Diamond, D. (1991): “Debt Maturity Structure and Liquidity Risk,” Quarterly Journal of
Economics 106, 709-737
[11] Dunbar, C.G. (1995): “The use of warrants as underwriter compensation in initial public
offerings,” Journal of Financial Economics, 38, 59-78
28

[12] Fang, L.H. (2005): “Investment bank reputation and the price and quality of underwriting
services,” Journal of Finance 60 (6), pp. 2729-2761
[13] Fich, Eliezer M. and A. Shivdasani (2006): “Are Busy Boards Effective Monitors?”, Journal
of Finance 61 (2), pp. 689-724
[14] Gompers, P., and J. Lerner (1999): “An analysis of compensation in the U.S. venture capital
partnership,” Journal of Financial Economics, 51 (1), 3-44
[15] Gompers, P., and J. Lerner (2000): “Money Chasing Deals? The Impact of Fund Inflows in
Private Equity Valuations,” Journal of Financial Economics, 55, 281–325
[16] Goyal, V.K. (2005): “Market discipline of bank risk: Evidence from subordinated debt con-
tracts,” Journal of Financial Intermediation, 14, 318-350
[17] Hart, O. and J. Moore (1994): “A Theory of Debt Based on the Inalienability of Human
Capital,” Quarterly Journal of Economics 109, 841-879
[18] Heckman, J.J. (1979): “Sample selection as a specification error,” Econometrica, 47, 153-161
[19] Hellmann, T. (2006): “IPOs, Acquisitions, and the Use of Convertible Securities in Venture
Capital,” Journal of Financial Economics, 81, 649-79
[20] Hellmann, T. F., L. Lindsey and M. Puri (2008): “Building Relationships Early: Banks in
Venture Capital,” Review of Financial Studies, 21(2), 513-541
[21] Holmstrom, B. (1979): “Moral Hazard and Observability,” Bell Journal of Economics 10, 74-9l
[22] Kaplan, S. and A. Schoar (2005): “Private Equity Performance: Returns, Persistence and
Capital Flows”, Journal of Finance, 60 (4), 1791–1823
[23] Kaplan, S. N. and P. Stromberg (2002): “Financial Contracting Theory Meets The Real World:
An Empirical Analysis of Venture Capital Contracts,” Review of Economic Studies, 70(2), 281–
315.
29
[24] Kaplan, S. N. and P. Stromberg (2004): “Characteristics, Contracts, and Actions: Evidence
from Venture Capitalist Analyses,” Journal of Finance, 59(5), 2173–2206.
[25] Lazear, E. (1986): “Salaries and Piece-rates,” Journal of Business 59, 405-43l
[26] Lee, L.F. (1978): “Unionism and wage rates: a simultaneous equations model with quantitative
and limited dependent variables,” Int. Econ. Rev. 19, 415-433
[27] Lerner, J. (1995): “Venture Capitalists and the Oversight of Private Firms,” Journal of Finance
50, 301-318
[28] Lerner, J., A. Schoar and W. Wong (2007): “Smart Institutions, Foolish Choices?: The Limited
Partner Performance Puzzle,” Journal of Finance 62, 731–64.
[29] Li, K. and N.R. Prabhala (2007): “Self-Selection Models in Corporate Finance,” in “Handbook
of Corporate Finance Volume I,” edited by B.Espen Eckbo, Elsevier 2007.
[30] Ljungqvist, A. and M. Richardson (2003): “The Cash-Flow, Return and Risk Characteristics
of Private Equity,” NYU, Finance Working Paper, (No. 03-001).
[31] Ljungqvist, A. and M. Richardson (2003b): “The Investment Behavior of Private Equity Fund
Managers,” Mimeo
[32] Maddala, G.S. (1983): “Limited-Dependent and Qualitative Variables in Economet-
rics,”Cambridge Univ. Press, Cambridge.
[33] Metrick, A. and A. Yasuda (2010): “The economics of private equity funds,”Review of Financial
Studies (23), pp. 2303-2341
[34] Nikoskelainen, E. and M. Wright (2007): “The Impact of Corporate Governance Mechanisms
in Value Increase in Leveraged Buyouts,” Journal of Corporate Finance 13, 511–537
[35] Phalippou, L. and O. Gottschalg (2009): “The Performance of Private Equity Funds”, Review
of Financial Studies 22(4), 1747–1776
30

[36] Puri, M. (1996): “Commercial banks in investment banking: Conflict of interest or certification
role?,” Journal of Financial Economics, 40, 373-401
[37] Ross, S. (1977): “The Determination of Financial Structure: The Incentive Signaling Ap-
proach,” Bell Journal of Economics 8, 23-40
[38] Sahlman, W. A. (1990): “The Structure and Governance of Venture Capital Organizations”,
Journal of Financial Economics 27, 473–521
[39] Schmidt, K.M. (2003): “Convertible securities and venture capital finance,”Journal of Finance
58 (5), pp. 2059-86
[40] Song, W. (2004): “Competition and coalition among underwriters: The decision to join a
syndicate,”Journal of Finance, 59, 2421-2444.
[41] Yates, G and M. Hinchliffe (2010): “A Practical Guide to Private Equity Transac-
tions,”Cambridge University Press
31

32
Table 1
Definitions of Covenants
Lockup A provision in the underwriting agreement between some or all existing
shareholders that prohibits the sale of shares before a predetermined date.
Permitted Transfer The permission to make transfers of shares without pre-emption in favor of the
remaining shareholders. The types of permitted transfers may vary according to
the class of shares. Where the class of shares is held by PE investors, there will
usually be a permitted transfer provision allowing transfers between two or more
separate funds managed by the same PE manager. These mechanisms are often
closely reviewed to ensure that the permitted transfer for the PE shares do not
allow what is, in effect, a sale to be achieved without the managers having a right
to tag along. (Yates and Hinchliffe (2010))
Redemption right Rights to force the company to purchase shares (a "put"). A put allows one
shareholder to liquidate an investment in the event an IPO or public merger
becomes unlikely. One may also negotiate a put to become effective when the
company defaults or fails to make payments upon a key employee's death, etc.
Tag-along Rights A minority shareholder protection affording the right to include their shares in
any sale of control and at the offered price (“right of co-sale”)
Drag-along Rights A majority shareholders right, obligating shareholders whose shares are bound
into the shareholders' agreement to sell their shares into an offer the majority
wishes to execute.
Right of First Refusal A negotiated obligation of the company or existing investors to offer shares to
the company or other existing investors at fair market value or a previously
negotiated price, prior to selling shares to new investors (“pre-emption right”).
Exit Ratchet An exit ratchet is used to adjust the respective shareholdings of the PE investors
and insiders depending on either the level of returns or on an exit. This technique
is principally used to find a bridge between widely differing views of a company's
value, or to provide additional incentives/rewards to the founders for delivering
excellent returns to the investors.

33
Table 2
Characteristics of Investments
Panel A –Investment size by vintage year and annualized IRR by exit year
Vintage year Exit year
Investment size (million €) Annualized IRR (%)
N Mean Median N Mean Median
1999 62 6.55 3.68 1 48.12 48.12
2000 245 7.03 4.10 10 32.62 49.31
2001 211 6.11 3.80 32 35.07 30.00
2002 52 6.87 4.20 99 8.88 13.24
2003 57 7.52 5.00 157 12.51 12.41
2004 112 6.47 4.10 166 8.74 9.75
2005 43 7.70 5.00 92 9.39 10.28
2006 - - - 139 6.25 9.76
2007 - - - 78 8.89 8.60
2008 - - - 8 -7.28 9.05
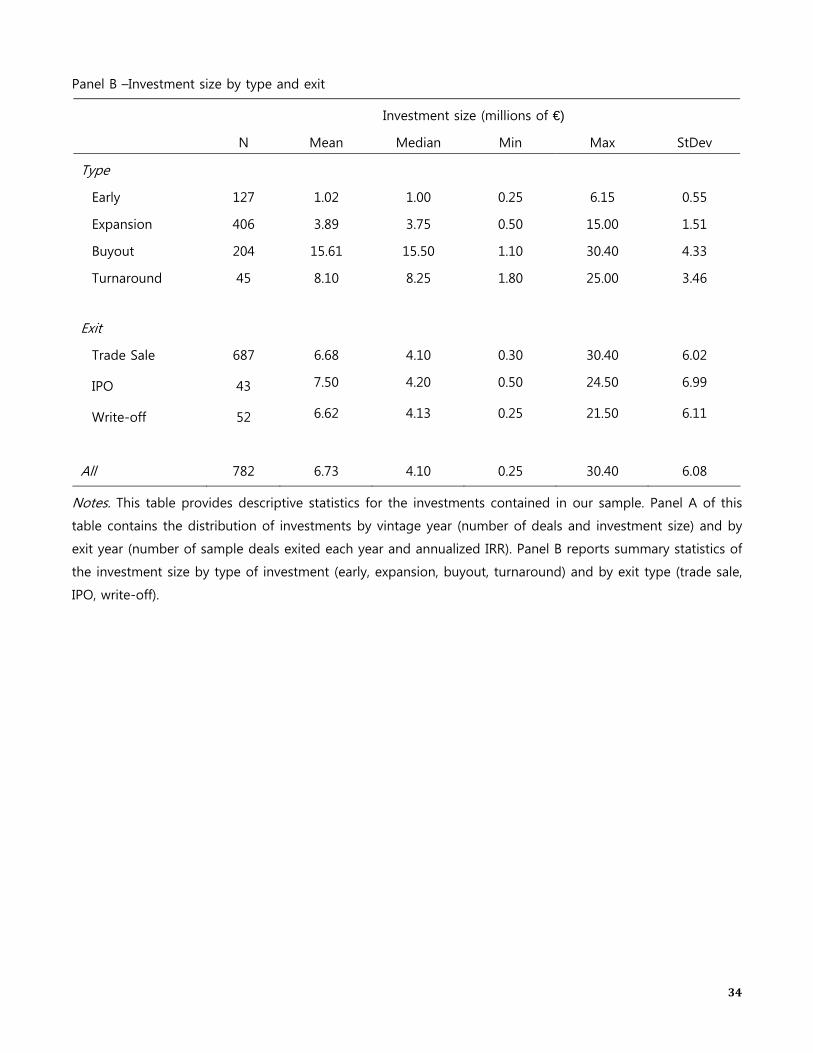
34
Panel B –Investment size by type and exit
Investment size (millions of €)
N Mean Median Min Max StDev
Type
Early 127 1.02 1.00 0.25 6.15 0.55
Expansion 406 3.89 3.75 0.50 15.00 1.51
Buyout 204 15.61 15.50 1.10 30.40 4.33
Turnaround 45 8.10 8.25 1.80 25.00 3.46
Exit
Trade Sale 687 6.68 4.10 0.30 30.40 6.02
IPO 43 7.50 4.20 0.50 24.50 6.99
Write-off 52 6.62 4.13 0.25 21.50 6.11
All 782 6.73 4.10 0.25 30.40 6.08
Notes. This table provides descriptive statistics for the investments contained in our sample. Panel A of this
table contains the distribution of investments by vintage year (number of deals and investment size) and by
exit year (number of sample deals exited each year and annualized IRR). Panel B reports summary statistics of
the investment size by type of investment (early, expansion, buyout, turnaround) and by exit type (trade sale,
IPO, write-off).
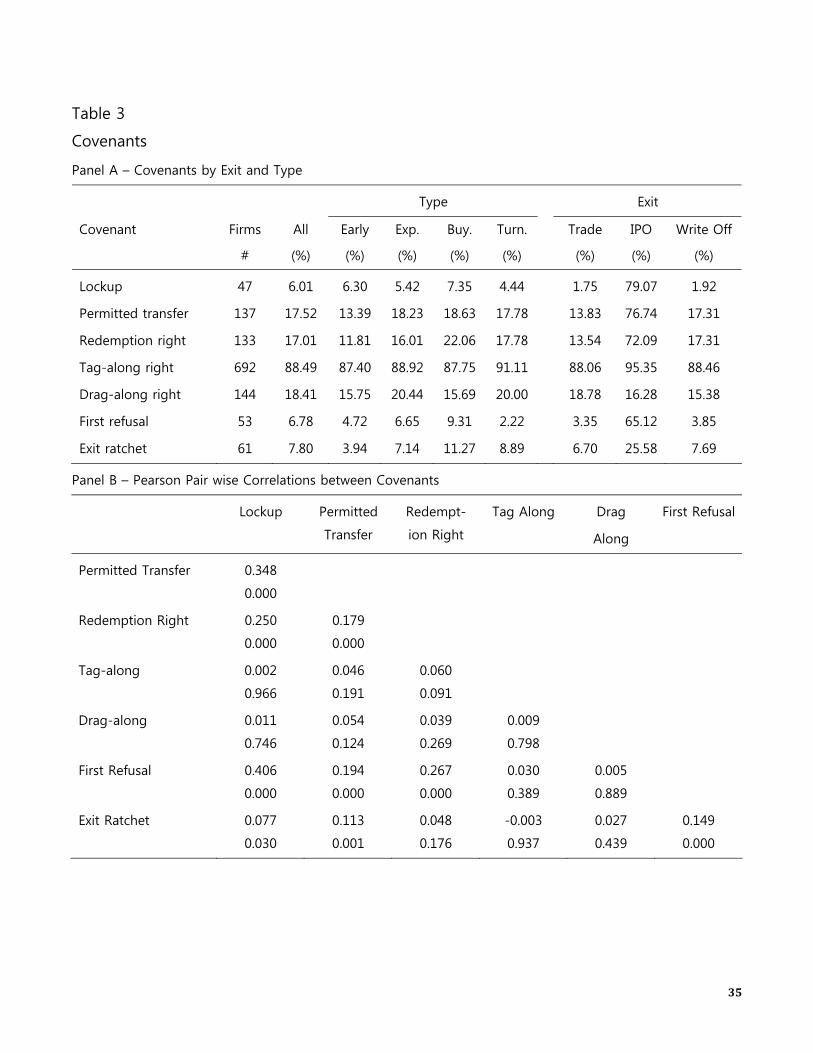
35
Table 3
Covenants
Panel A – Covenants by Exit and Type
Type Exit
Covenant Firms
#
All
(%)
Early
(%)
Exp.
(%)
Buy.
(%)
Turn.
(%)
Trade
(%)
IPO
(%)
Write Off
(%)
Lockup 47 6.01 6.30 5.42 7.35 4.44 1.75 79.07 1.92
Permitted transfer 137 17.52 13.39 18.23 18.63 17.78 13.83 76.74 17.31
Redemption right 133 17.01 11.81 16.01 22.06 17.78 13.54 72.09 17.31
Tag-along right 692 88.49 87.40 88.92 87.75 91.11 88.06 95.35 88.46
Drag-along right 144 18.41 15.75 20.44 15.69 20.00 18.78 16.28 15.38
First refusal 53 6.78 4.72 6.65 9.31 2.22 3.35 65.12 3.85
Exit ratchet 61 7.80 3.94 7.14 11.27 8.89 6.70 25.58 7.69
Panel B – Pearson Pair wise Correlations between Covenants
Lockup Permitted
Transfer
Redempt-
ion Right
Tag Along Drag
Along
First Refusal
Permitted Transfer 0.348
0.000
Redemption Right 0.250 0.179
0.000 0.000
Tag-along 0.002 0.046 0.060
0.966 0.191 0.091
Drag-along 0.011 0.054 0.039 0.009
0.746 0.124 0.269 0.798
First Refusal 0.406 0.194 0.267 0.030 0.005
0.000 0.000 0.000 0.389 0.889
Exit Ratchet 0.077 0.113 0.048 -0.003 0.027 0.149
0.030 0.001 0.176 0.937 0.439 0.000
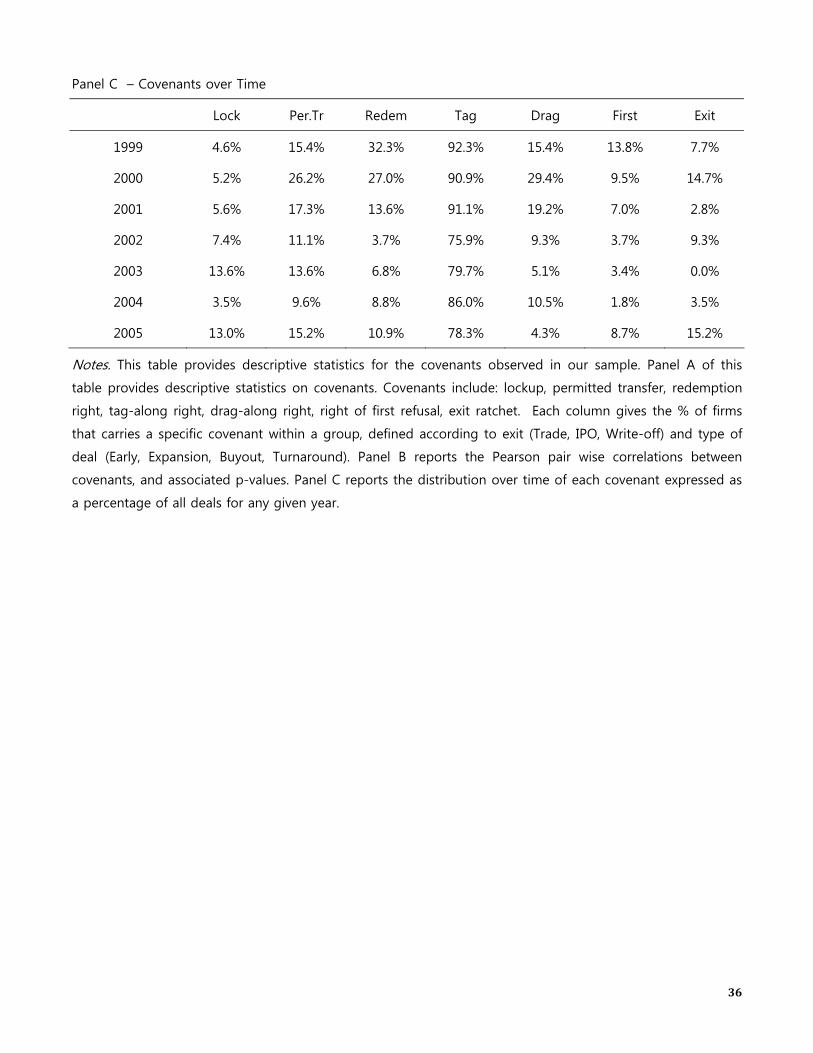
36
Panel C – Covenants over Time
Lock Per.Tr Redem Tag Drag First Exit
1999 4.6% 15.4% 32.3% 92.3% 15.4% 13.8% 7.7%
2000 5.2% 26.2% 27.0% 90.9% 29.4% 9.5% 14.7%
2001 5.6% 17.3% 13.6% 91.1% 19.2% 7.0% 2.8%
2002 7.4% 11.1% 3.7% 75.9% 9.3% 3.7% 9.3%
2003 13.6% 13.6% 6.8% 79.7% 5.1% 3.4% 0.0%
2004 3.5% 9.6% 8.8% 86.0% 10.5% 1.8% 3.5%
2005 13.0% 15.2% 10.9% 78.3% 4.3% 8.7% 15.2%
Notes. This table provides descriptive statistics for the covenants observed in our sample. Panel A of this
table provides descriptive statistics on covenants. Covenants include: lockup, permitted transfer, redemption
right, tag-along right, drag-along right, right of first refusal, exit ratchet. Each column gives the % of firms
that carries a specific covenant within a group, defined according to exit (Trade, IPO, Write-off) and type of
deal (Early, Expansion, Buyout, Turnaround). Panel B reports the Pearson pair wise correlations between
covenants, and associated p-values. Panel C reports the distribution over time of each covenant expressed as
a percentage of all deals for any given year.
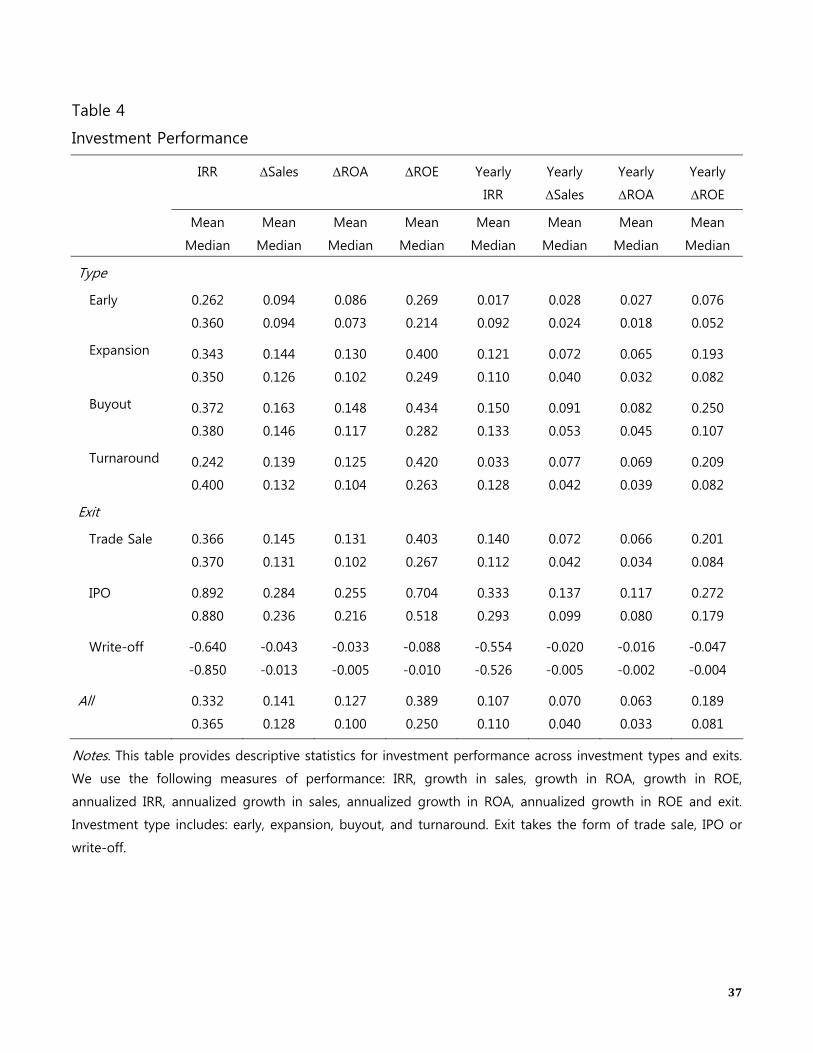
37
Table 4
Investment Performance
IRR
ΔSales
ΔROA
ΔROE Yearly
IRR
Yearly
ΔSales
Yearly
ΔROA
Yearly
ΔROE
Mean
Median
Mean
Median
Mean
Median
Mean
Median
Mean
Median
Mean
Median
Mean
Median
Mean
Median
Type
Early 0.262 0.094 0.086 0.269 0.017 0.028 0.027 0.076
0.360 0.094 0.073 0.214 0.092 0.024 0.018 0.052
Expansion 0.343 0.144 0.130 0.400 0.121 0.072 0.065 0.193
0.350 0.126 0.102 0.249 0.110 0.040 0.032 0.082
Buyout 0.372 0.163 0.148 0.434 0.150 0.091 0.082 0.250
0.380 0.146 0.117 0.282 0.133 0.053 0.045 0.107
Turnaround 0.242 0.139 0.125 0.420 0.033 0.077 0.069 0.209
0.400 0.132 0.104 0.263 0.128 0.042 0.039 0.082
Exit
Trade Sale 0.366 0.145 0.131 0.403 0.140 0.072 0.066 0.201
0.370 0.131 0.102 0.267 0.112 0.042 0.034 0.084
IPO 0.892 0.284 0.255 0.704 0.333 0.137 0.117 0.272
0.880 0.236 0.216 0.518 0.293 0.099 0.080 0.179
Write-off -0.640 -0.043 -0.033 -0.088 -0.554 -0.020 -0.016 -0.047
-0.850 -0.013 -0.005 -0.010 -0.526 -0.005 -0.002 -0.004
All 0.332 0.141 0.127 0.389 0.107 0.070 0.063 0.189
0.365 0.128 0.100 0.250 0.110 0.040 0.033 0.081
Notes. This table provides descriptive statistics for investment performance across investment types and exits.
We use the following measures of performance: IRR, growth in sales, growth in ROA, growth in ROE,
annualized IRR, annualized growth in sales, annualized growth in ROA, annualized growth in ROE and exit.
Investment type includes: early, expansion, buyout, and turnaround. Exit takes the form of trade sale, IPO or
write-off.
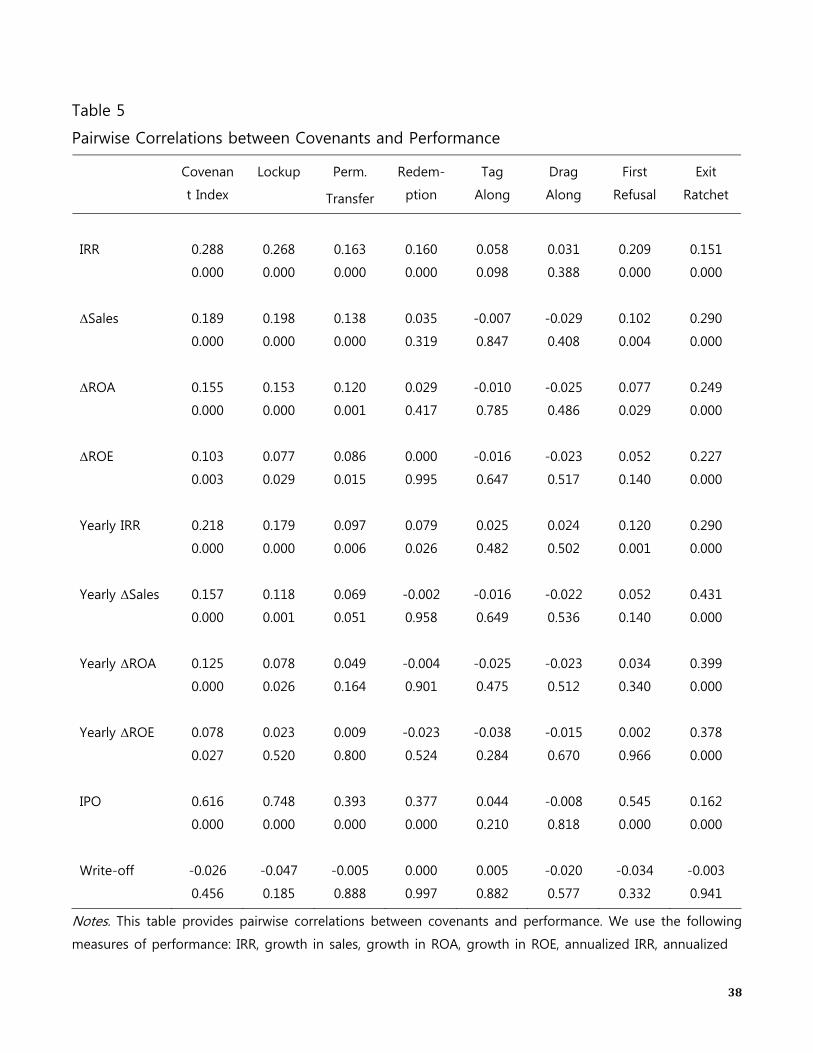
38
Table 5
Pairwise Correlations between Covenants and Performance
Covenan
t Index
Lockup Perm.
Transfer
Redem-
ption
Tag
Along
Drag
Along
First
Refusal
Exit
Ratchet
IRR 0.288 0.268 0.163 0.160 0.058 0.031 0.209 0.151
0.000 0.000 0.000 0.000 0.098 0.388 0.000 0.000
ΔSales 0.189 0.198 0.138 0.035 -0.007 -0.029 0.102 0.290
0.000 0.000 0.000 0.319 0.847 0.408 0.004 0.000
ΔROA 0.155 0.153 0.120 0.029 -0.010 -0.025 0.077 0.249
0.000 0.000 0.001 0.417 0.785 0.486 0.029 0.000
ΔROE 0.103 0.077 0.086 0.000 -0.016 -0.023 0.052 0.227
0.003 0.029 0.015 0.995 0.647 0.517 0.140 0.000
Yearly IRR 0.218 0.179 0.097 0.079 0.025 0.024 0.120 0.290
0.000 0.000 0.006 0.026 0.482 0.502 0.001 0.000
Yearly ΔSales 0.157 0.118 0.069 -0.002 -0.016 -0.022 0.052 0.431
0.000 0.001 0.051 0.958 0.649 0.536 0.140 0.000
Yearly ΔROA 0.125 0.078 0.049 -0.004 -0.025 -0.023 0.034 0.399
0.000 0.026 0.164 0.901 0.475 0.512 0.340 0.000
Yearly ΔROE 0.078 0.023 0.009 -0.023 -0.038 -0.015 0.002 0.378
0.027 0.520 0.800 0.524 0.284 0.670 0.966 0.000
IPO 0.616 0.748 0.393 0.377 0.044 -0.008 0.545 0.162
0.000 0.000 0.000 0.000 0.210 0.818 0.000 0.000
Write-off -0.026 -0.047 -0.005 0.000 0.005 -0.020 -0.034 -0.003
0.456 0.185 0.888 0.997 0.882 0.577 0.332 0.941
Notes. This table provides pairwise correlations between covenants and performance. We use the following
measures of performance: IRR, growth in sales, growth in ROA, growth in ROE, annualized IRR, annualized

39
growth in sales, annualized growth in ROA, annualized growth in ROE and exit. Exit takes the form of IPO
(high performance) or write-off (low performance). Covenants include: lockup, permitted transfer, redemption
right, tag-along right, drag-along right, right of first refusal, exit ratchet. For each correlation we report the
significance level (p-value) of each correlation coefficient.

40
Table 6
Univariate Differences in Performance across Covenants
Panel A – Yearly IRR across covenants
X
IRR if
X=0
(%)
N if X=0 IRR if
X=1 (%)
N if X=1 t-test p-val Wilcoxon z p-val
Lockup 9.5 735 25.8 47 -5.402 0.000 -5.410 0.000Permitted transfer 9.5 645 14.9 137 -2.410 0.017 -3.107 0.002
Redemption right 9.7 649 13.9 133 -1.963 0.051 -2.386 0.017
Tag-along right 8.4 90 10.7 692 -0.748 0.456 -0.756 0.450
Drag-along right 10.1 638 11.8 144 -0.863 0.389 0.556 0.578
First refusal 9.6 729 21.3 53 -3.803 0.000 -4.262 0.000
Exit ratchet 8.4 721 34.1 61 -6.669 0.000 -7.673 0.000
Panel B – Yearly change in sales across covenants
X
ΔSales
if X=0
(%)
N if X=0 ΔSales if
X=1 (%)
N if X=1 t stat p-val Wilcoxon z p-val
Lockup 6.7 735 11.4 47 -2.491 0.016 -3.866 0.000Permitted transfer 6.7 645 8.5 137 -1.666 0.097 -1.412 0.079
Redemption right 7.1 649 6.7 133 0.369 0.712 0.005 0.498
Tag-along right 7.6 90 6.9 692 0.532 0.596 1.024 0.153
Drag-along right 7.1 638 6.5 144 0.648 0.517 1.74 0.041
First refusal 6.8 729 9.3 53 -1.5 0.139 -2.288 0.011
Exit ratchet 5.6 721 23.1 61 -6.034 0.000 -6.896 0.000
Notes. This table shows how performance changes when covenants are employed. For reasons of space we
use the following two measures of performance: annualized IRR and annualized growth in sales. Covenants
include: lockup, permitted transfer, redemption right, tag-along right, drag-along right, right of first refusal,
exit ratchet. To test for differences we employ a t-test and a Wilcoxon test.

41
Table 7
Summary Statistics of Firms, Funds and Market Conditions
Variable Definition
Mean
Median
Cov Index
ρ
IRR
ρ
Δ Sales
ρ
Firm Characteristics (p-values) (p-values) (p-values)
MB Implied PE valuation divided by 1.341 -0.073 -0.020 -0.034
pre-investment book val equity 1.333 (0.038) (0.565) (0.331)
Profitability Pre-investment EBIDTA divided 0.150 0.059 0.077 0.042
by pre-inv. book value of assets 0.108 (0.093) (0.029) (0.240)
Size Log of pre-investment book 4.321 0.062 0.051 0.159
value of assets 4.252 (0.079) (0.151) (0.000)
Leverage Pre-investment ratio of debt to 0.795 -0.062 -0.044 0.016
assets 0.800 (0.079) (0.210) (0.648)
Fund Governance
Bank Ownership =1 if majority fund shares 0.611 0.001 -0.023 -0.092
owned by bank, =0 otherwise 1.000 (0.968) (0.512) (0.009)
Previous Bank Rel. =1 if firm had relationship with 0.484 0.011 -0.007 -0.102
bank owning fund, =0 othwise 0.000 0.762 0.842 0.004
Board Presences Number of presences of board 6.917 0.050 -0.065 -0.205
director in boards of other 8.000 (0.165) (0.071) (0.000)
portfolio firms
Market Conditions
MktRet. 6m Returns to Italian equity market 0.165 0.176 0.077 0.080
(S&P Mib) over previous 6m. 0.133 (0.000) (0.029) (0.023)
Ind. ROE Avg. Italian industry ROE at 8.114 0.111 -0.017 -0.071
time of investment 7.805 (0.002) (0.639) (0.043)
IPO/New Avg. ratio of IPOs to new firms 0.163 0.055 -0.022 -0.205
created in Italy over prev. 6m 0.119 (0.116) (0.531) (0.000)
Notes. This table provides definitions and summary statistics for firm and fund characteristics and market conditions, as well as their pairwise correlation with gross IRR and growth in sales. Cov index is the sum of all covenants.

42
Table 8
Regressions of Performance Measures on Covenants
Panel A – Performance and Covenant Index
(1) (2) (3) (4) (5) (6) (7) (8) (9) (10)
OLS OLS OLS OLS OLS OLS OLS OLS Probit Probit
IRR
ΔSales
ΔROA
ΔROE Yearly IRR Yearly
ΔSales
Yearly
ΔROA
Yearly
ΔROE
IPO Write-off
Covindex 0.095*** 0.028*** 0.024*** 0.064*** 0.049*** 0.019*** 0.016*** 0.040*** 1.944*** -0.036
(0.013) (0.004) (0.004) (0.018) (0.006) (0.004) (0.003) (0.011) (0.233) (0.063)
MB -0.038 0.030 -0.000 -0.076 -0.023 0.018 -0.004 -0.085 4.455*** 0.773
(0.120) (0.044) (0.042) (0.144) (0.083) (0.035) (0.033) (0.102) (1.353) (0.645)
Profitability 0.081 0.002 0.011 -0.168** -0.006 -0.025 -0.022 -0.166** 0.447 0.142
(0.081) (0.034) (0.030) (0.083) (0.039) (0.025) (0.023) (0.074) (0.440) (0.418)
Size 0.007 0.009 0.008 0.001 0.024 0.009 0.006 0.005 -0.123 0.133
(0.033) (0.012) (0.012) (0.050) (0.025) (0.011) (0.011) (0.034) (0.386) (0.174)
Leverage -0.086 0.187 0.120 0.298 -0.084 0.177 0.115 0.514 -14.363*** 1.007
(0.510) (0.124) (0.131) (0.551) (0.312) (0.118) (0.124) (0.540) (5.481) (2.851)
Prev.Relation -0.009 -0.024** -0.022** -0.104*** -0.021 -0.021** -0.019* -0.082** 0.239 -0.067
(0.025) (0.010) (0.010) (0.039) (0.018) (0.010) (0.010) (0.040) (0.270) (0.136)
Presences -0.010** -0.008*** -0.012*** -0.036*** -0.002 -0.003** -0.005*** -0.017*** -0.115* 0.013
(0.004) (0.001) (0.002) (0.007) (0.003) (0.001) (0.001) (0.006) (0.067) (0.021)
Constant 0.220 -0.033 0.074 0.495 0.025 -0.086 0.022 0.061 -4.051 -3.176
(0.439) (0.133) (0.119) (0.460) (0.306) (0.134) (0.121) (0.439) (4.020) (2.718)

43
Observations 782 782 782 782 782 782 782 782 766 782
Adj. R-sq. 0.088 0.168 0.165 0.088 0.079 0.129 0.113 0.061
Industry FE YES YES YES YES YES YES YES YES YES YES
Invest. FE YES YES YES YES YES YES YES YES YES YES
Inv. Durat. YES YES YES YES NO NO NO NO YES YES
Year FE YES YES YES YES YES YES YES YES YES YES

44
Panel B – Performance and Single Covenants
(1) (2) (3) (4) (5) (6) (7) (8) (9) (10)
OLS OLS OLS OLS OLS OLS OLS OLS Probit Probit
Covenants IRR
ΔSales
ΔROA
ΔROE Yearly IRR Yearly
ΔSales
Yearly
ΔROA
Yearly
ΔROE
IPO Write-off
Lockup 0.411*** 0.101*** 0.087*** 0.179** 0.185*** 0.053*** 0.040*** 0.075** 3.788*** -0.654
Adj. R2 0.087 0.152 0.153 0.078 0.069 0.109 0.099 0.054
Perm.Trans 0.134*** 0.046*** 0.044*** 0.131** 0.052*** 0.021** 0.016* 0.018 1.632*** 0.011
Adj. R2 0.032 0.135 0.145 0.081 0.044 0.101 0.094 0.053
Redemption 0.130*** 0.020 0.018 0.020 0.036* 0.001 0.001 -0.022 1.744*** 0.051
Adj. R2 0.030 0.118 0.131 0.071 0.040 0.096 0.091 0.053
Tag-along 0.070 0.017 0.014 0.027 0.020 0.003 -0.002 -0.045 1.053*** 0.041
Adj. R2 0.015 0.116 0.129 0.071 0.037 0.096 0.091 0.054
Drag-along 0.018 0.002 0.002 -0.014 0.018 0.003 0.001 -0.002 -0.043 -0.092
Adj. R2 0.011 0.114 0.128 0.071 0.038 0.096 0.091 0.053
First Refus. 0.269*** 0.053*** 0.036** 0.074 0.109*** 0.025 0.013 -0.009 2.258*** -0.198
Adj. R2 0.048 0.126 0.133 0.072 0.050 0.099 0.092 0.053
Exit Ratch. 0.190*** 0.128*** 0.113*** 0.432*** 0.240*** 0.167*** 0.156*** 0.613*** 0.977*** -0.046
Adj. R2 0.032 0.191 0.183 0.122 0.107 0.263 0.235 0.189
Notes. This table examines the relationship between covenants and performance in a multivariate setting. In Panel A we regress each
measure of performance on the covenant index, also controlling for firm and investment characteristics, and several fixed effects. In Panel

45
B each performance measure is regressed on each covenant, also controlling for firm and investment characteristics, and several fixed effects.
For each regression we report only the coefficient on the relevant covenant and the adjusted R-squared. We use the following measures of
performance: IRR, growth in sales, growth in ROA, growth in ROE, annualized IRR, annualized growth in sales, annualized growth in ROA,
annualized growth in ROE and exit. Exit takes the form of IPO or write-off. Covenants include: lockup, permitted transfer, redemption right,
tag-along right, drag-along right, right of first refusal, exit ratchet. Pre-investment firm characteristics include: profitability, size, leverage and
industry. Fund characteristics include: previous bank relationship (dummy) and the cumulative presences of PE directors in other boards
(presences). Investment characteristics include: market to book ratio of equity as priced in the investment, investment type (early, expansion,
buyout, turnaround), and investment date. The covenant index is the sum of all covenants. All regressions have 782 observations. Standard
errors are clustered at the fund level. in parenthesis. ***, **, and * indicate respectively significance at the 1, 5, and 10% levels.

46
Table 9
Selectivity-bias adjusted regressions for annualized growth in sales
Dependent Variable in 2nd Stage: Annualized Change in Sales
(1) (2) (3) (4) (5) (6) (7)
1st Stage
Lockup
1st Stage
Perm.
Transfer
1st Stage
Redemption
1st Stage
Tag Along
1st Stage
Drag Along
1st Stage
First Refusal
1st Stage
Exit Ratchet
Inv.Mills Ratio 0.068 -0.059 0.052 -0.049 0.015 0.129* 0.140**
(0.123) (0.070) (0.055) (0.113) (0.060) (0.078) (0.058)
MB -0.021 -0.010 0.022 -0.140 0.039 -0.008 -0.015
(0.041) (0.040) (0.044) (0.321) (0.042) (0.040) (0.027)
Profitability -0.060 -0.034 -0.054 0.090 -0.011 -0.026 -0.003
(0.042) (0.038) (0.040) (0.106) (0.028) (0.026) (0.019)
Size 0.004 0.005 0.004 0.005 0.012 0.005 -0.007
(0.014) (0.012) (0.012) (0.053) (0.012) (0.012) (0.009)
Leverage 0.310* 0.281* 0.256 0.008 0.160 0.284* 0.021
(0.165) (0.158) (0.158) (0.507) (0.167) (0.153) (0.104)
Previous Relation. -0.022** -0.019** -0.025*** -0.009 -0.017** -0.022*** -0.018***
(0.009) (0.008) (0.009) (0.028) (0.008) (0.008) (0.006)
Presences -0.003** -0.003* -0.004*** -0.007 -0.003* -0.002 -0.002*
(0.002) (0.001) (0.002) (0.006) (0.001) (0.001) (0.001)
Constant -0.131 -0.113 -0.156 0.342 -0.118 -0.129 0.135
(0.148) (0.136) (0.153) (0.958) (0.147) (0.135) (0.099)
Observations 694 645 649 90 638 713 721

47
Adjusted R-squared 0.101 0.108 0.100 0.052 0.098 0.102 0.118
Industry FE YES YES YES YES YES YES YES
Invest. FE YES YES YES YES YES YES YES
Inv. Durat. YES YES YES YES YES YES YES
Year FE YES YES YES YES YES YES YES
Notes. This table examines the selectivity bias in the relationship between covenants and change in sales following the procedure of Goyal
(2005). The dependent variable in all regressions is change in sales. The tabulated regressions are as in Eq.(2) augmented with the inverted
Mills ratio estimated in the first stage. The first stage is different for each column and is obtained by running Eq.(4) respectively on each
covenant. Covenants include: lockup, permitted transfer, redemption right, tag-along right, drag-along right, right of first refusal, exit ratchet.
Pre-investment firm characteristics include: profitability, size, leverage and industry. Fund characteristics include: previous bank relationship
(dummy) and the cumulative presences of PE directors in other boards (presences). Investment characteristics include: market to book ratio
of equity as priced in the investment, investment type (early, expansion, buyout, turnaround), and investment date. Standard errors are
clustered at the fund level. in parenthesis. ***, **, and * indicate respectively significance at the 1, 5, and 10% levels.

48
Table 10
Probit regressions predicting the use of covenants
Panel A –Single Covenants
(1) (2) (3) (4) (5) (6) (7)
Probit Probit Probit Probit Probit Probit Probit
Lockup Perm.
Transfer
Redemption Tag Along Drag Along First Refusal Exit
Ratchet
Differential 0.235 -0.159 -0.546* 0.219 -1.298 -0.174 0.105
(0.166) (0.389) (0.284) (0.506) (0.803) (0.246) (0.083)
MB 0.013 0.006 -0.288** -0.606*** -0.180 -0.014 0.054
(0.060) (0.120) (0.117) (0.102) (0.200) (0.069) (0.071)
Profitability 0.048 0.025 0.160** 0.022 -0.052 -0.002 0.049
(0.035) (0.083) (0.066) (0.097) (0.092) (0.027) (0.046)
Size -0.062** -0.026 -0.004 -0.073** 0.004 0.004 0.037*
(0.026) (0.038) (0.034) (0.030) (0.052) (0.021) (0.021)
Leverage -0.040 0.370 -0.564 -0.421 -0.936** -0.314* 0.236
(0.291) (0.598) (0.431) (0.390) (0.453) (0.172) (0.262)
Relationship 0.035* 0.006 0.025 -0.018 -0.005 -0.003 -0.010
(0.018) (0.023) (0.025) (0.021) (0.028) (0.018) (0.015)
Presences 0.003 -0.002 0.009* 0.007 0.002 -0.002 -0.000
(0.003) (0.005) (0.005) (0.005) (0.005) (0.002) (0.002)
MktRet. 6m -0.040* 0.168*** 0.100** 0.059* 0.277*** 0.026 0.086***
(0.024) (0.049) (0.040) (0.035) (0.066) (0.021) (0.029)
Ind. ROE -0.002 0.007 0.015** 0.007* 0.021** 0.009** 0.002
(0.004) (0.007) (0.008) (0.004) (0.009) (0.005) (0.004)
IPO/New -0.038 0.427*** 0.204** 0.248*** 0.615*** 0.042 0.130
(0.048) (0.119) (0.103) (0.096) (0.154) (0.066) (0.103)
Observations 741 782 782 782 782 766 782
Industry FE YES YES YES YES YES YES YES
Invest. FE YES YES YES YES YES YES YES

49
Panel B – Controlling for Other Covenants
(1) (2) (3) (4) (5) (6) (7)
Lockup Perm.
Transfer
Redemption Tag Along Drag Along First Refusal Exit
Ratchet
Differential 0.043 -0.036 -0.682** 0.186 -1.232 -0.002 0.114 (0.064) (0.390) (0.284) (0.485) (0.796) (0.157) (0.078)MB 0.037 0.065 -0.256** -0.586*** -0.202 -0.018 0.035 (0.025) (0.130) (0.118) (0.101) (0.198) (0.038) (0.065)Profitability 0.021 -0.070 0.139* 0.015 -0.056 -0.034** 0.047 (0.013) (0.075) (0.074) (0.093) (0.093) (0.016) (0.042)Size -0.008 -0.008 0.014 -0.070** 0.003 0.001 0.033* (0.009) (0.038) (0.033) (0.029) (0.053) (0.011) (0.019)Leverage -0.090 0.894 -0.360 -0.421 -0.968** -0.105 0.331 (0.114) (0.636) (0.426) (0.387) (0.454) (0.123) (0.256)Relationship 0.008 -0.008 0.018 -0.018 -0.004 0.001 -0.011 (0.007) (0.023) (0.024) (0.020) (0.029) (0.010) (0.014)Presences 0.002 -0.005 0.010** 0.006 0.002 -0.003* 0.000
(0.001) (0.005) (0.005) (0.005) (0.005) (0.001) (0.002)MktRet. 6m -0.035*** 0.180*** 0.086** 0.047 0.272*** 0.025* 0.078*** (0.012) (0.048) (0.041) (0.034) (0.065) (0.015) (0.029)Ind. ROE -0.002 0.003 0.011 0.006 0.021** 0.006** 0.000 (0.001) (0.006) (0.007) (0.004) (0.009) (0.003) (0.004)IPO/New -0.064** 0.457*** 0.168* 0.214** 0.605*** 0.055 0.117 (0.026) (0.114) (0.099) (0.093) (0.154) (0.042) (0.095)Lockup 0.573*** 0.243*** -0.049 0.036 0.326*** 0.015 (0.084) (0.093) (0.055) (0.071) (0.095) (0.037)Permitted Tr. 0.129*** 0.048 0.032 0.022 0.001 0.024 (0.032) (0.034) (0.025) (0.040) (0.010) (0.024)Redemption 0.027 0.051 0.034 -0.004 0.052** -0.013 (0.017) (0.036) (0.023) (0.037) (0.024) (0.015)Tag Along -0.007 0.066* 0.046 -0.034 0.011 -0.018 (0.013) (0.037) (0.033) (0.051) (0.009) (0.026)Drag Along -0.000 0.025 -0.001 -0.006 -0.010 0.014 (0.007) (0.036) (0.030) (0.027) (0.007) (0.019)First Refusal 0.256*** 0.026 0.211*** 0.062*** -0.033 0.132** (0.070) (0.055) (0.077) (0.020) (0.049) (0.062)Exit Ratchet -0.008* 0.064 -0.009 -0.039 0.021 0.066* (0.005) (0.058) (0.044) (0.042) (0.053) (0.034)
Observations 741 782 782 782 782 766 782Industry FE YES YES YES YES YES YES YESInvest. FE YES YES YES YES YES YES YES

50
Panel C – Differential on Yearly IRR as a measure of performance
(1) (2) (3) (4) (5) (6) (7)
Lockup Perm.
Transfer
Redemption Tag Along Drag Along First Refusal Exit
Ratchet
Differential 0.122** -0.185 -0.407** 0.202** 0.081 0.001 0.035 (0.062) (0.200) (0.161) (0.089) (0.191) (0.044) (0.074)MB 0.018 0.089 -0.317** -0.571*** 0.005 -0.019 0.003 (0.023) (0.130) (0.128) (0.098) (0.175) (0.043) (0.068)Profitability 0.018* -0.053 0.106 0.043 -0.031 -0.034* 0.034 (0.011) (0.077) (0.069) (0.082) (0.087) (0.020) (0.053)Size -0.020** -0.012 -0.023 -0.060** 0.012 0.001 0.030 (0.010) (0.037) (0.035) (0.028) (0.053) (0.011) (0.019)Leverage 0.074 0.720 -0.057 -0.253 -0.871* -0.104 0.388 (0.118) (0.510) (0.436) (0.390) (0.500) (0.135) (0.279)Relationship 0.018** 0.004 0.044* -0.006 0.009 0.001 -0.014 (0.009) (0.024) (0.026) (0.019) (0.026) (0.009) (0.015)Presences 0.003** -0.003 0.008* 0.004 0.002 -0.003* -0.001
(0.001) (0.005) (0.005) (0.004) (0.005) (0.001) (0.003)MktRet. 6m -0.042*** 0.177*** 0.099** 0.060* 0.183*** 0.025* 0.067** (0.014) (0.048) (0.041) (0.032) (0.042) (0.014) (0.027)Ind. ROE -0.002 0.002 0.008 -0.001 0.012* 0.006** 0.002 (0.001) (0.006) (0.008) (0.005) (0.007) (0.003) (0.004)IPO/New -0.062*** 0.475*** 0.257** 0.265*** 0.401*** 0.055 0.045 (0.024) (0.119) (0.106) (0.087) (0.112) (0.037) (0.095)Lockup 0.575*** 0.263*** -0.038 0.043 0.326*** 0.010 (0.084) (0.094) (0.052) (0.074) (0.093) (0.034)Permitted Tr. 0.122*** 0.045 0.032 0.023 0.001 0.026 (0.031) (0.034) (0.025) (0.040) (0.010) (0.024)Redemption 0.028* 0.047 0.029 -0.004 0.052** -0.012 (0.017) (0.035) (0.024) (0.037) (0.024) (0.016)Tag Along -0.007 0.065* 0.049 -0.035 0.011 -0.016 (0.012) (0.038) (0.033) (0.051) (0.008) (0.025)Drag Along 0.001 0.021 0.001 -0.004 -0.010 0.015 (0.008) (0.037) (0.031) (0.026) (0.007) (0.020)First Refusal 0.262*** 0.028 0.213*** 0.060*** -0.039 0.128** (0.071) (0.055) (0.078) (0.020) (0.048) (0.061)Exit Ratchet -0.008* 0.062 -0.014 -0.028 0.021 0.066** (0.004) (0.058) (0.043) (0.039) (0.053) (0.033) Observations 741 782 782 782 782 766 782Industry FE YES YES YES YES YES YES YESInvest. FE YES YES YES YES YES YES YES

51
Notes. . This table examines the determinants of the use of covenants after controlling for the selection bias.
More precisely Columns (1)-(7) provide the estimation of Eq.(1) for each covenant plus the covenant dummy.
The table reports the marginal effect, that is, the change in the probability for an infinitesimal change in each
independent, continuous variable and reports the discrete change in the probability for dummy variables.
Differential is calculated as the difference between the expected returns fitted in Eq.(3) and Eq.(2). Covenants
include: lockup, permitted transfer, redemption right, tag-along right, drag-along right, right of first refusal,
exit ratchet. Pre-investment firm characteristics include: profitability, size, leverage and industry. Fund
characteristics include: previous bank relationship (dummy) and the cumulative presences of PE directors in
other boards (presences). Investment characteristics include: market to book ratio of equity as priced in the
investment, and investment type (early, expansion, buyout, turnaround). Pre-investment market conditions
include: (i) market returns (S&P Mib) over the previous 6 months, (ii) ratio of IPOs to new firms created in
Italy in the previous 6 months, and (iii) industry ROE at the time of investment. The measure of performance
used in Panels A and B is the annualized sales growth, while in Panel C it refers to the annualized IRR.
Standard errors are clustered at the fund level. in parenthesis. ***, **, and * indicate respectively significance
at the 1, 5, and 10% levels.