Embed Size (px)
Citation preview
Geosciences
Department of Geological Sciences, Institute for Coastal Science and Policy,
Coastal Water Resources Center,East Carolina University
Contribution of Citizen Science Towards Assessing Impacts of Sea-level Rise on the Extent of
Groundwater and Marine Inundation on a Barrier Island Setting
Alex K Manda
2Geological Sciences
What is Citizen Science?
Citizen science is a tool that connects the public to the scientific community with the goal of expanding scientific knowledge and literacy (Bonney et al. 2009).
3Geological Sciences
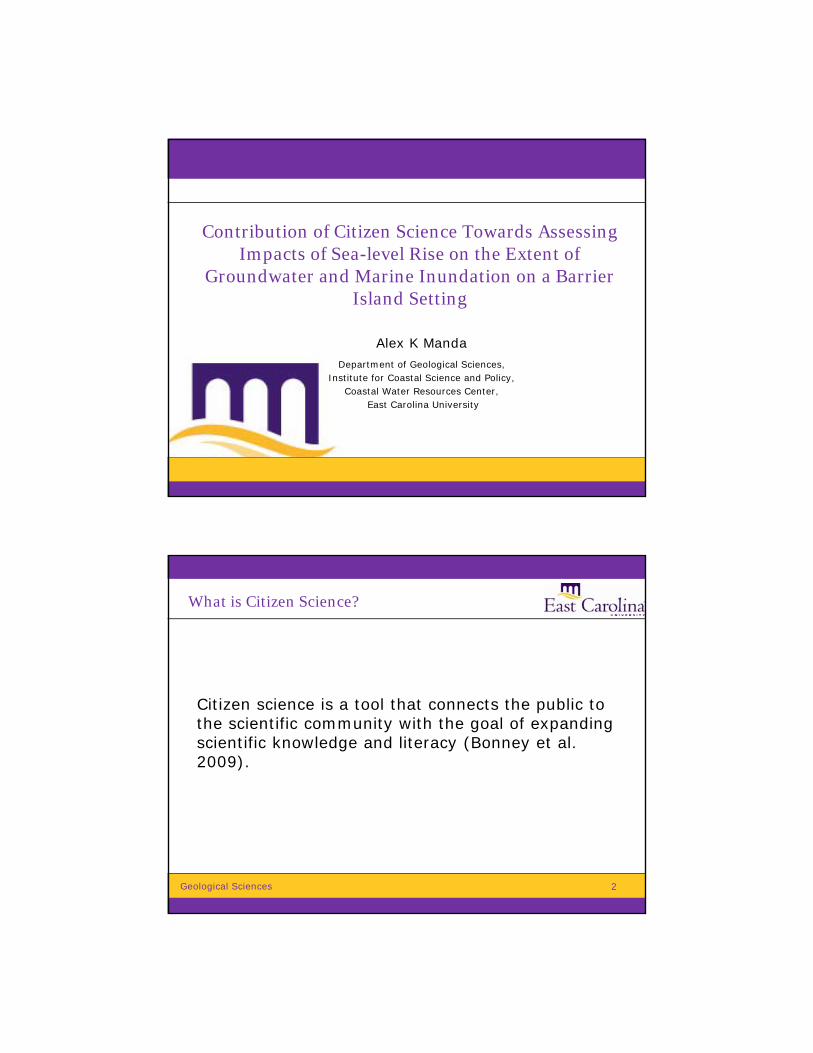
Project Development
Community EngagementNC Coastal FederationNC Aquarium @PKS
Towns on Bogue BanksTrinity Center PKS
Scientific ResearchImpacts of sea-level
rise and climate change on groundwater
Citizen ScienceGroundwater level and
and stormwatermonitoring
4Geological Sciences
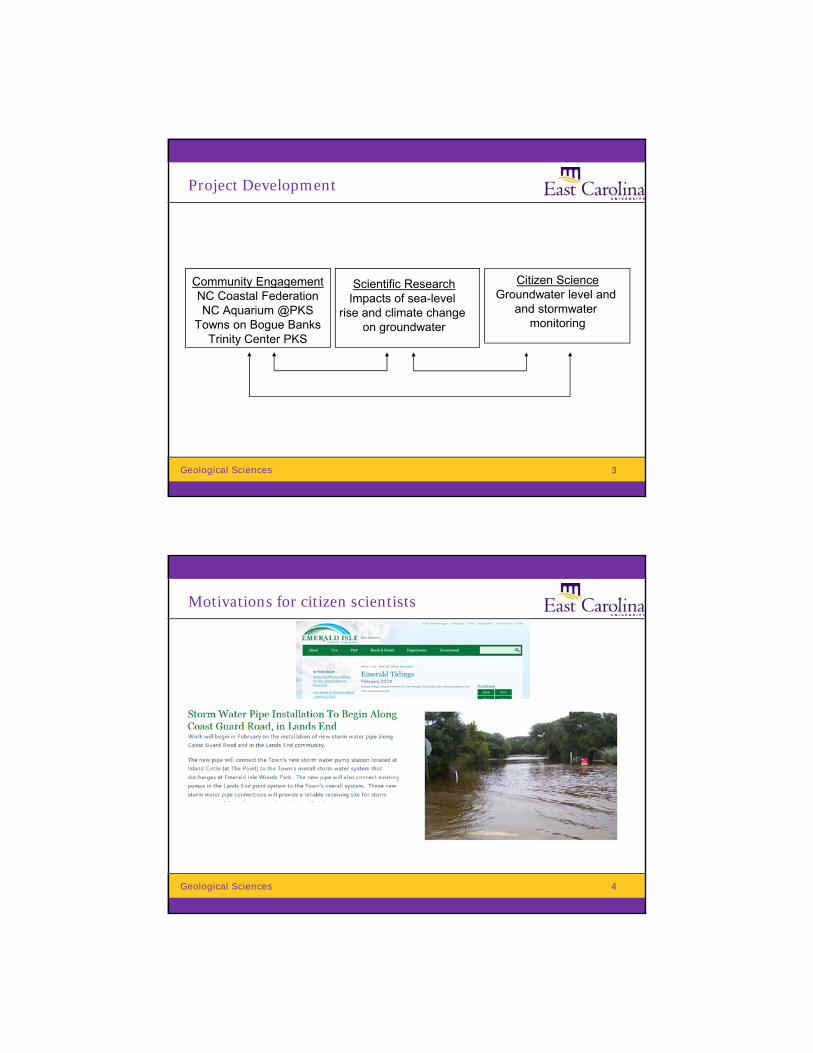
Motivations for citizen scientists
5Geological Sciences
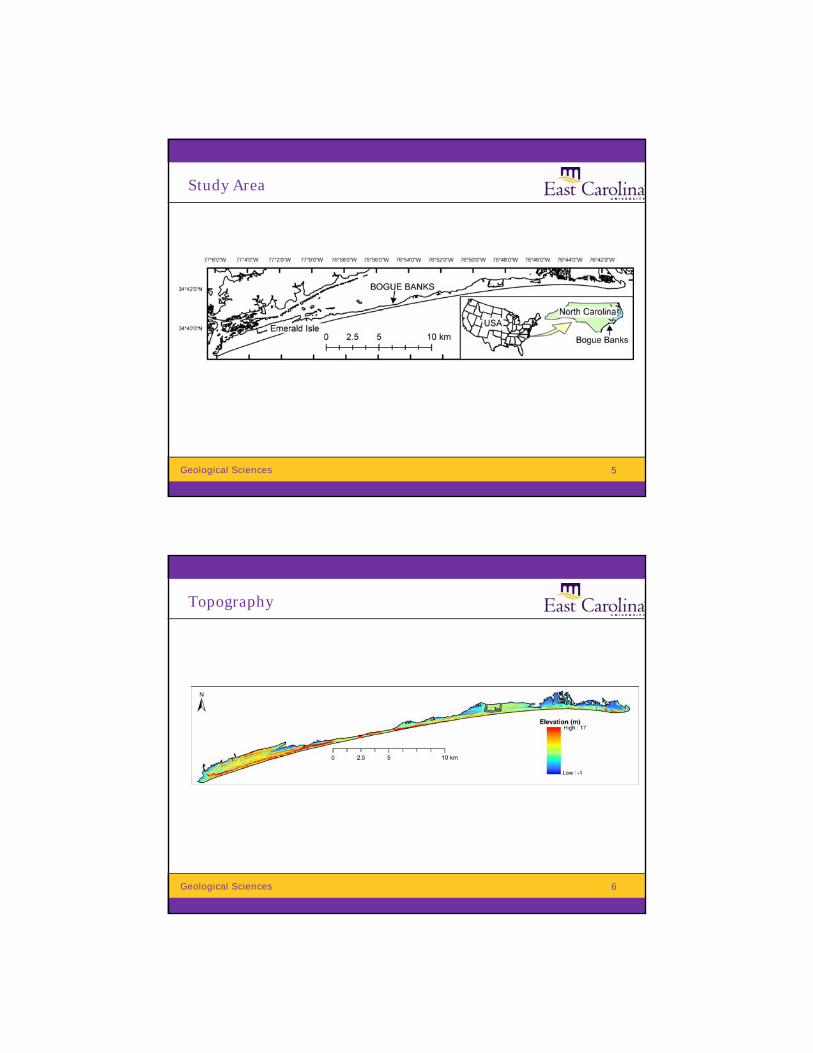
Study Area
6Geological Sciences
Topography
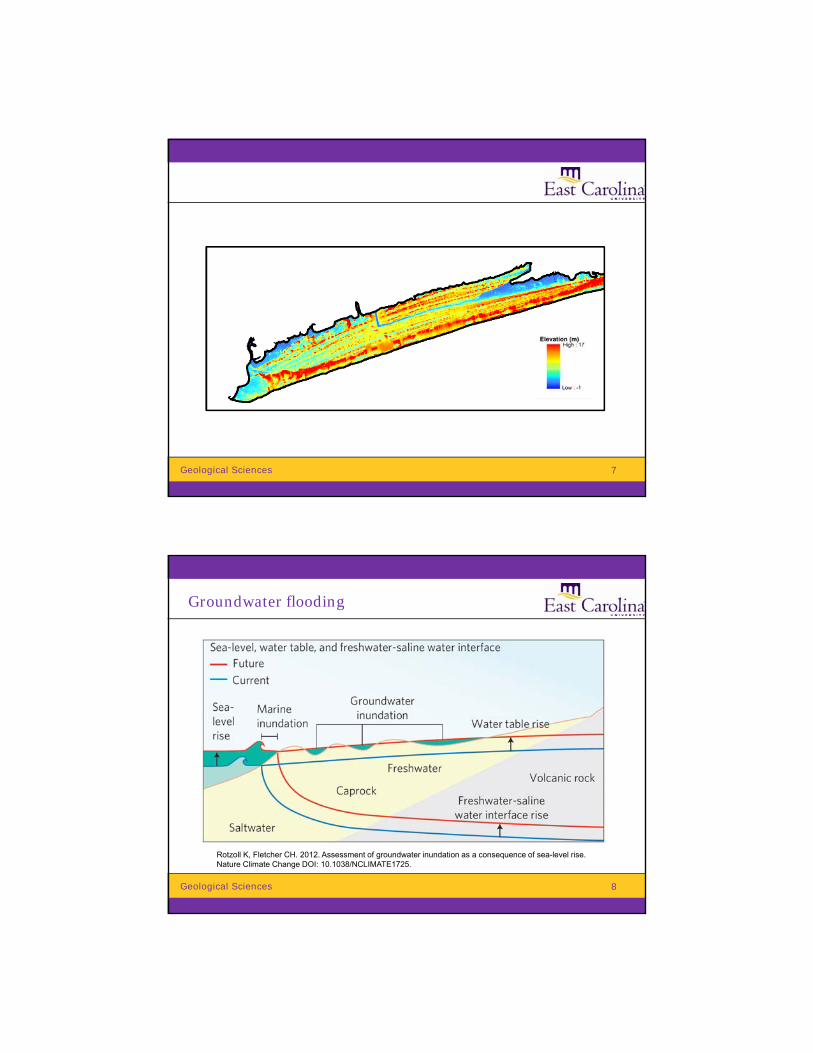
7Geological Sciences
8Geological Sciences
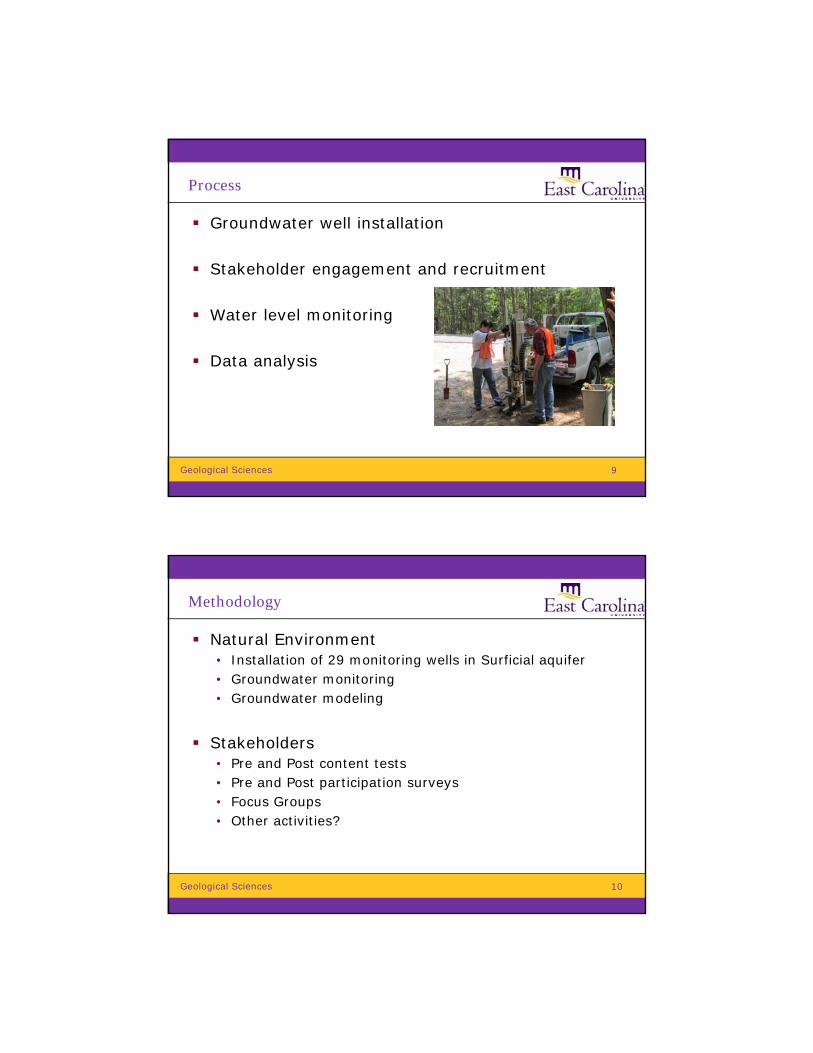
Groundwater flooding
Rotzoll K, Fletcher CH. 2012. Assessment of groundwater inundation as a consequence of sea-level rise. Nature Climate Change DOI: 10.1038/NCLIMATE1725.
9Geological Sciences
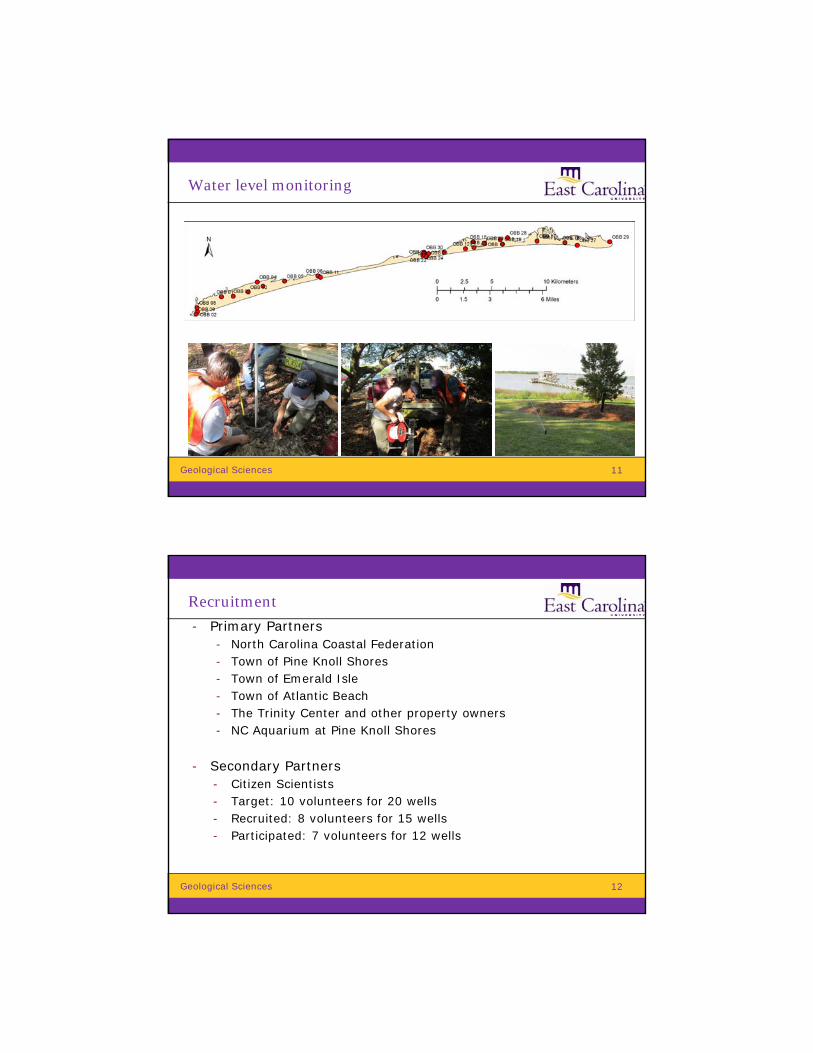
Process
Groundwater well installation
Stakeholder engagement and recruitment
Water level monitoring
Data analysis
10Geological Sciences
Methodology
Natural Environment• Installation of 29 monitoring wells in Surficial aquifer• Groundwater monitoring• Groundwater modeling
Stakeholders• Pre and Post content tests• Pre and Post participation surveys• Focus Groups• Other activities?
11Geological Sciences
Water level monitoring
12Geological Sciences
Recruitment
- Primary Partners- North Carolina Coastal Federation- Town of Pine Knoll Shores- Town of Emerald Isle- Town of Atlantic Beach- The Trinity Center and other property owners- NC Aquarium at Pine Knoll Shores
- Secondary Partners- Citizen Scientists - Target: 10 volunteers for 20 wells - Recruited: 8 volunteers for 15 wells - Participated: 7 volunteers for 12 wells
13Geological Sciences
Groundwater level Monitoring
Manual water level measurements Synchronous water level measurements (e.g.,
once a week on Friday @10AM) 10-week period
14Geological Sciences
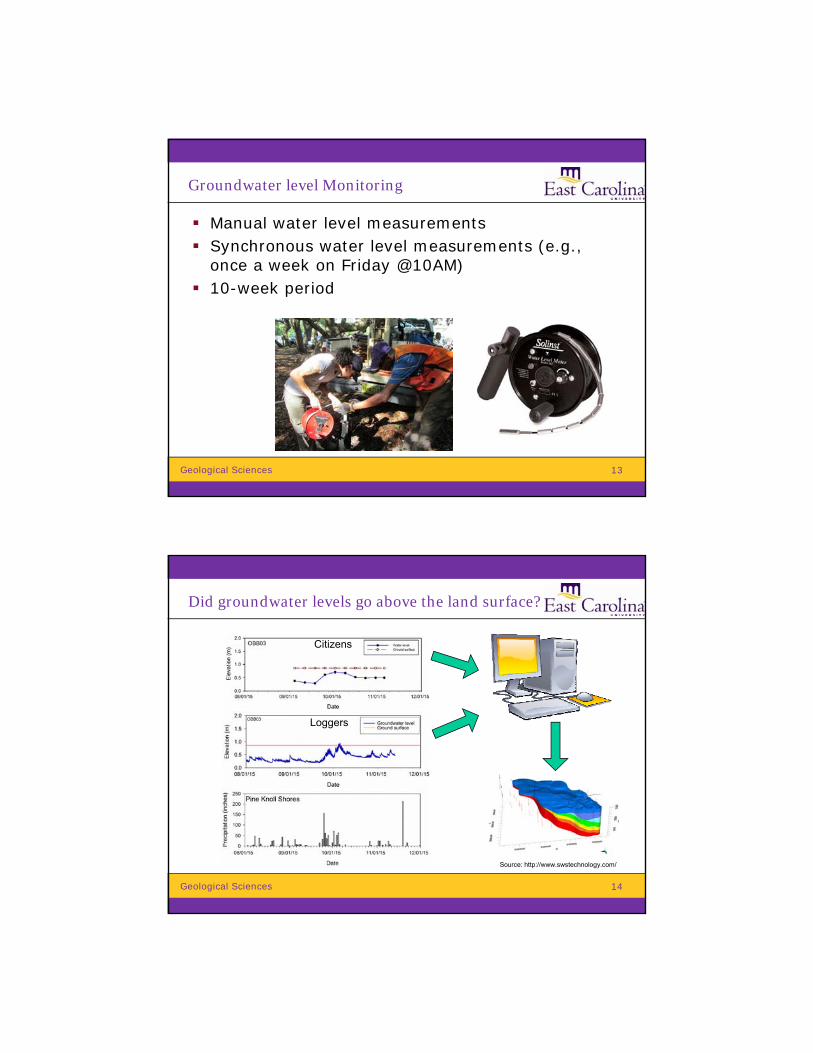
Did groundwater levels go above the land surface?
Citizens
Loggers
Source: http://www.swstechnology.com/
15Geological Sciences
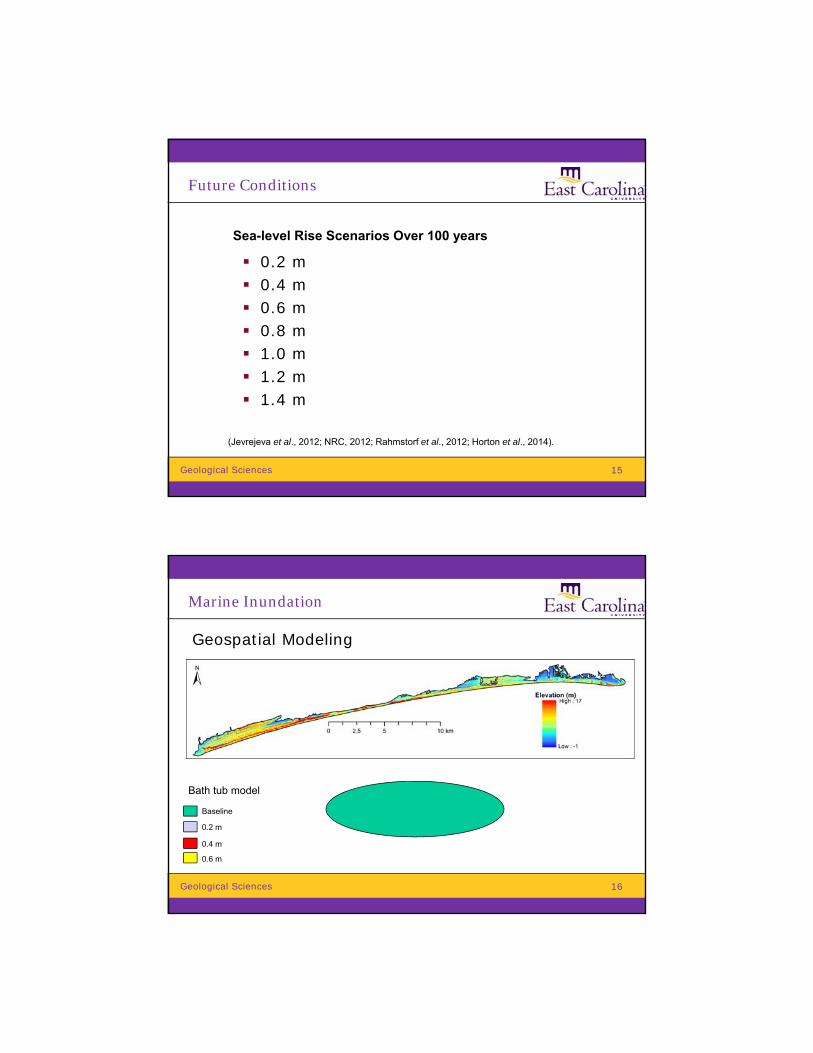
Future Conditions
0.2 m 0.4 m 0.6 m 0.8 m 1.0 m 1.2 m 1.4 m
Sea-level Rise Scenarios Over 100 years
(Jevrejeva et al., 2012; NRC, 2012; Rahmstorf et al., 2012; Horton et al., 2014).
16Geological Sciences
Marine Inundation
Geospatial Modeling
Bath tub model
Baseline
0.2 m
0.4 m
0.6 m
17Geological Sciences
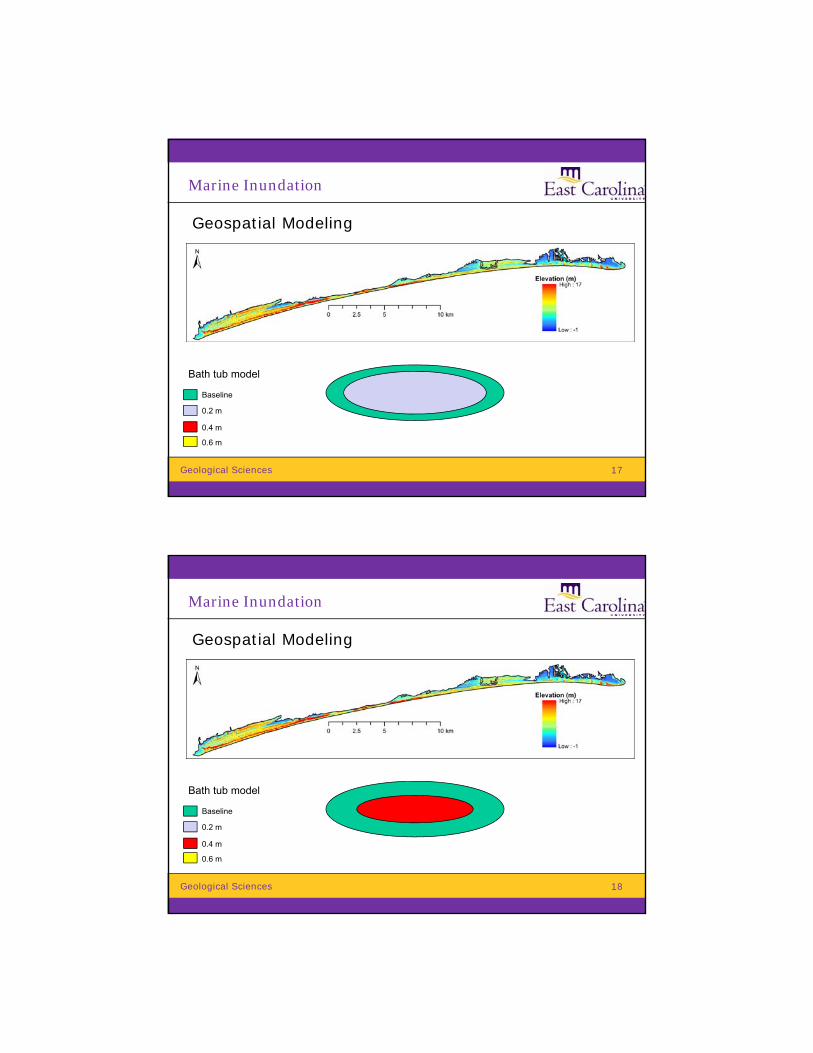
Marine Inundation
Geospatial Modeling
Bath tub model
Baseline
0.2 m
0.4 m
0.6 m
18Geological Sciences
Marine Inundation
Geospatial Modeling
Bath tub model
Baseline
0.2 m
0.4 m
0.6 m
19Geological Sciences
Marine Inundation
Geospatial Modeling
Bath tub model
Baseline
0.2 m
0.4 m
0.6 m
20Geological Sciences
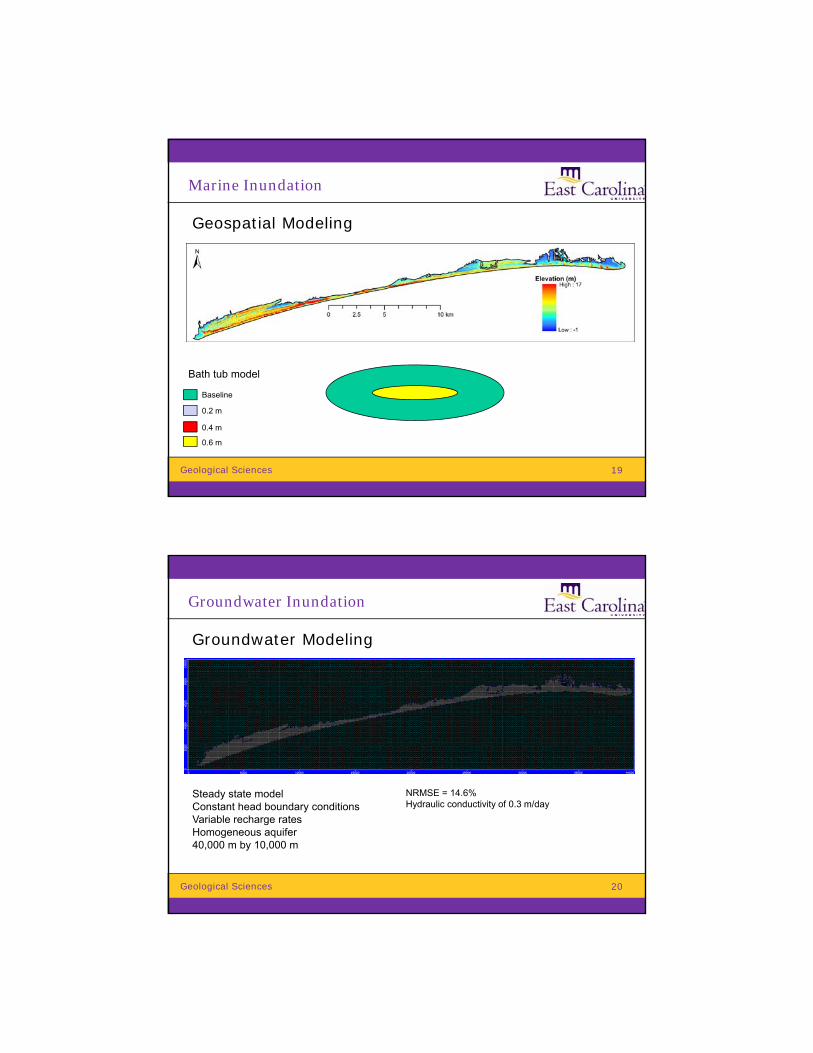
Groundwater Inundation
Groundwater Modeling
Steady state modelConstant head boundary conditionsVariable recharge ratesHomogeneous aquifer40,000 m by 10,000 m
NRMSE = 14.6% Hydraulic conductivity of 0.3 m/day
21Geological Sciences
Water table contour maps
Sea-level rise = 1.4 m
Baseline Conditions
22Geological Sciences
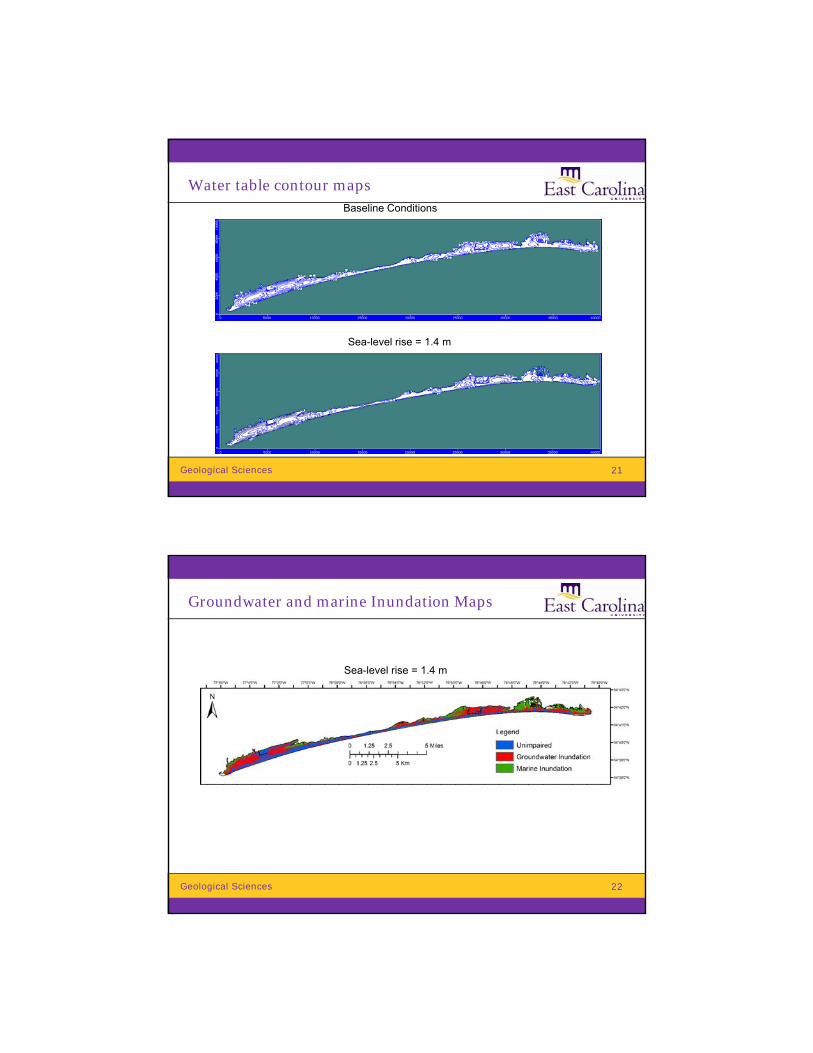
Groundwater and marine Inundation Maps
Sea-level rise = 1.4 m
23Geological Sciences
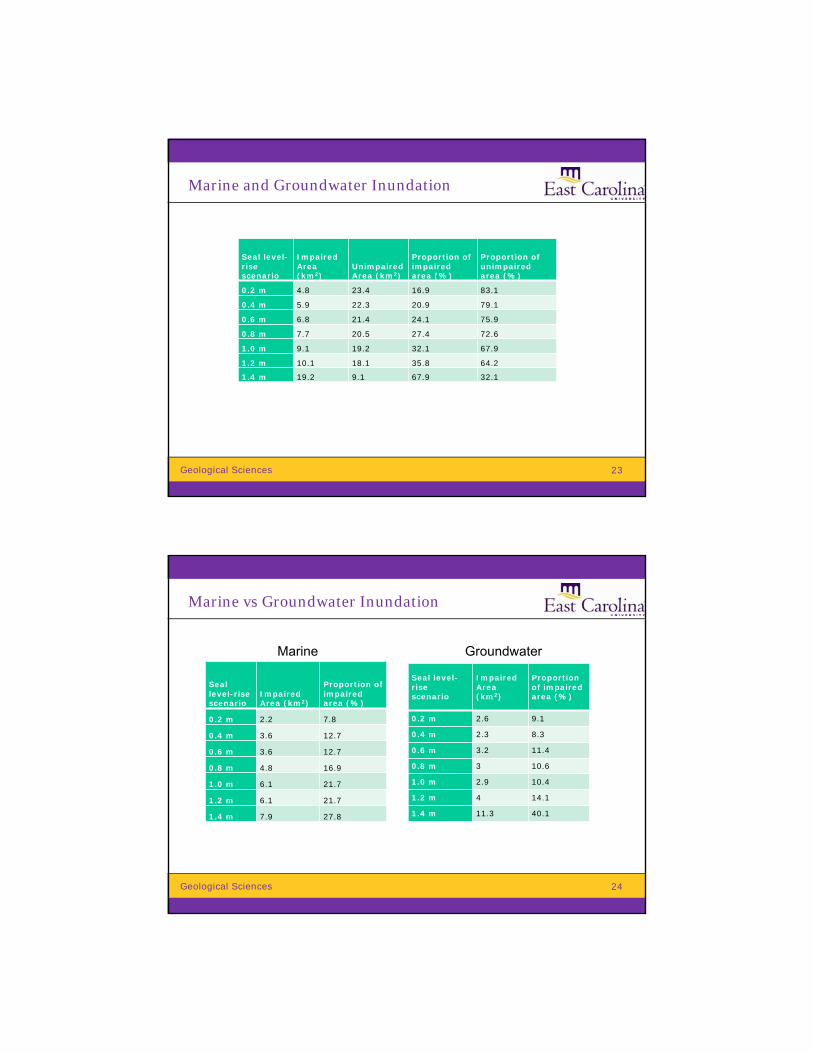
Marine and Groundwater Inundation
Seal level-rise scenario
Impaired Area (km2)
Unimpaired Area (km2)
Proportion of impaired area (%)
Proportion of unimpaired area (%)
0.2 m 4.8 23.4 16.9 83.1
0.4 m 5.9 22.3 20.9 79.1
0.6 m 6.8 21.4 24.1 75.9
0.8 m 7.7 20.5 27.4 72.6
1.0 m 9.1 19.2 32.1 67.9
1.2 m 10.1 18.1 35.8 64.2
1.4 m 19.2 9.1 67.9 32.1
24Geological Sciences
Marine vs Groundwater Inundation
Seal level-rise scenario
Impaired Area (km2)
Proportion of impaired area (%)
0.2 m 2.2 7.8
0.4 m 3.6 12.7
0.6 m 3.6 12.7
0.8 m 4.8 16.9
1.0 m 6.1 21.7
1.2 m 6.1 21.7
1.4 m 7.9 27.8
Seal level-rise scenario
Impaired Area (km2)
Proportion of impaired area (%)
0.2 m 2.6 9.1
0.4 m 2.3 8.3
0.6 m 3.2 11.4
0.8 m 3 10.6
1.0 m 2.9 10.4
1.2 m 4 14.1
1.4 m 11.3 40.1
Marine Groundwater
25Geological Sciences
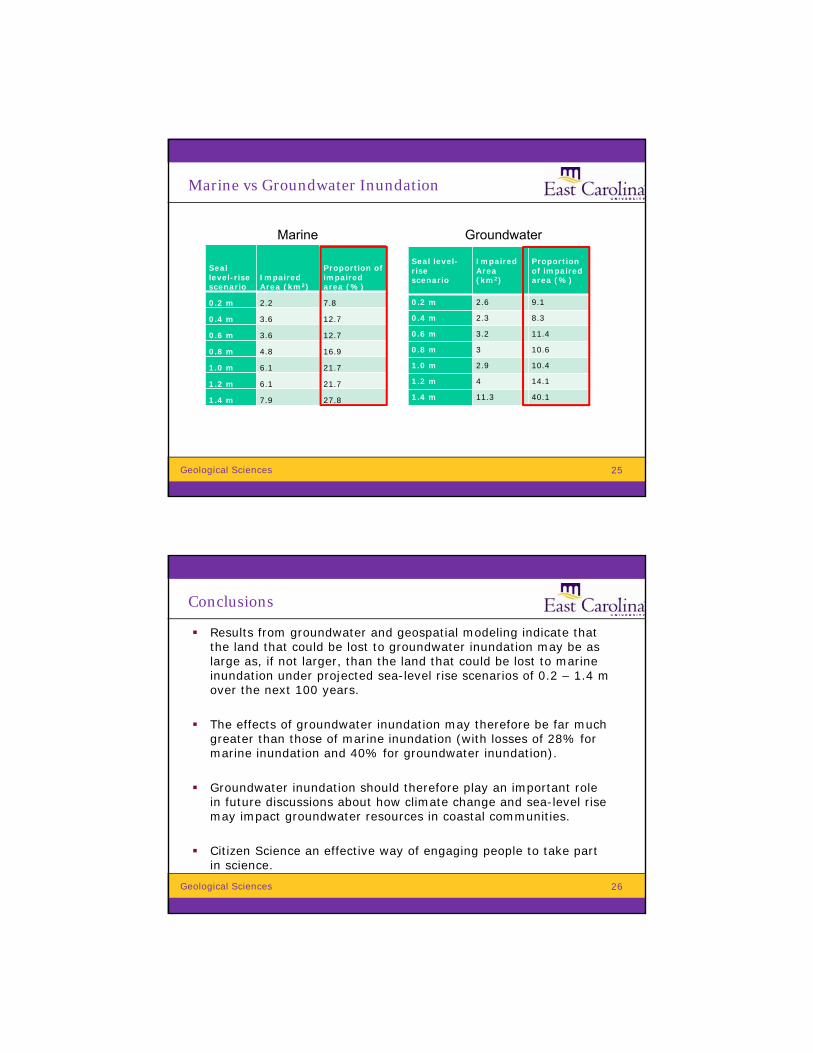
Marine vs Groundwater Inundation
Seal level-rise scenario
Impaired Area (km2)
Proportion of impaired area (%)
0.2 m 2.2 7.8
0.4 m 3.6 12.7
0.6 m 3.6 12.7
0.8 m 4.8 16.9
1.0 m 6.1 21.7
1.2 m 6.1 21.7
1.4 m 7.9 27.8
Seal level-rise scenario
Impaired Area (km2)
Proportion of impaired area (%)
0.2 m 2.6 9.1
0.4 m 2.3 8.3
0.6 m 3.2 11.4
0.8 m 3 10.6
1.0 m 2.9 10.4
1.2 m 4 14.1
1.4 m 11.3 40.1
Marine Groundwater
26Geological Sciences
Conclusions
Results from groundwater and geospatial modeling indicate that the land that could be lost to groundwater inundation may be as large as, if not larger, than the land that could be lost to marine inundation under projected sea-level rise scenarios of 0.2 – 1.4 m over the next 100 years.
The effects of groundwater inundation may therefore be far much greater than those of marine inundation (with losses of 28% for marine inundation and 40% for groundwater inundation).
Groundwater inundation should therefore play an important role in future discussions about how climate change and sea-level rise may impact groundwater resources in coastal communities.
Citizen Science an effective way of engaging people to take part in science.
27Geological Sciences
Acknowledgments
North Carolina Sea Grant North Carolina Water Resources Research Institute National Science Foundation (Award #1644650) North Carolina Coastal Federation North Carolina Aquarium at Pine Knoll Shores Atlantic Beach Emerald Isle Pine Knoll Shores The Trinity Center Citizen Scientists John Woods, James Owers, Jim Watson, and GEOL graduate and
undergraduate students Tom Allen, Dept. of Geography and Environmental Planning Engagement and Outreach Scholar Academy, East Carolina University
28Geological Sciences
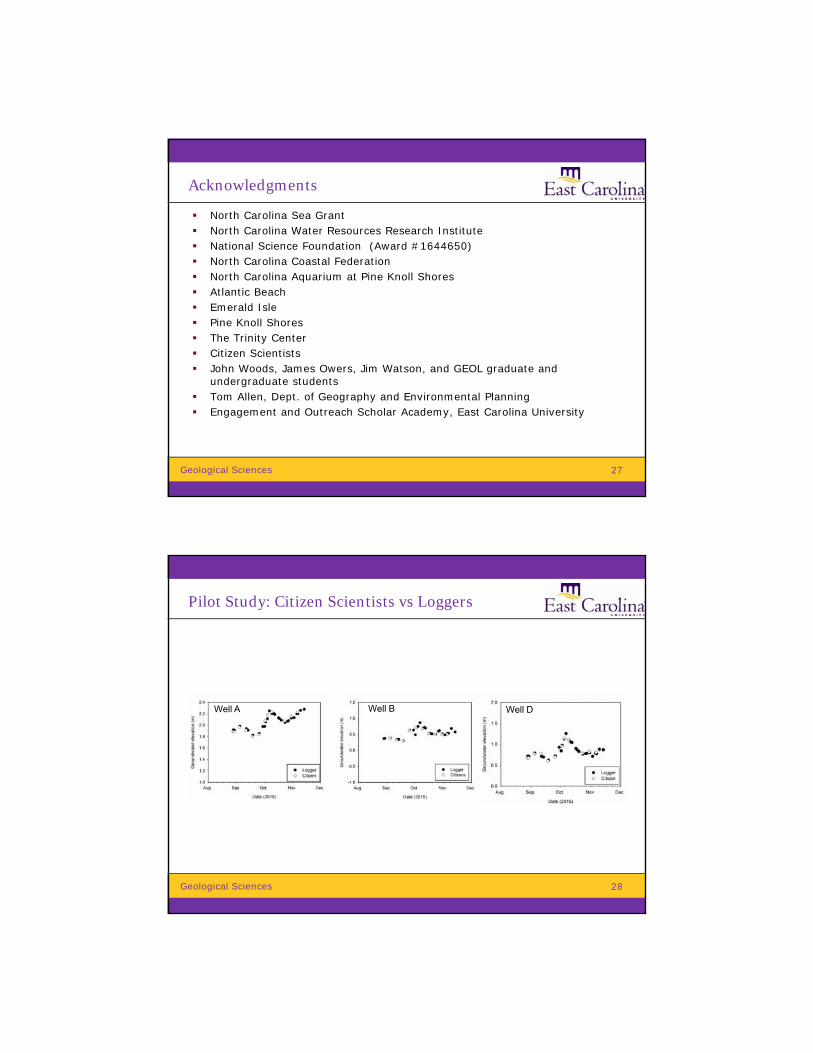
Pilot Study: Citizen Scientists vs Loggers
Well C
Well DWell BWell A
29Geological Sciences
Citizen Scientists vs Loggers
Line of equality
Line of equality
Line of equality
30Geological Sciences
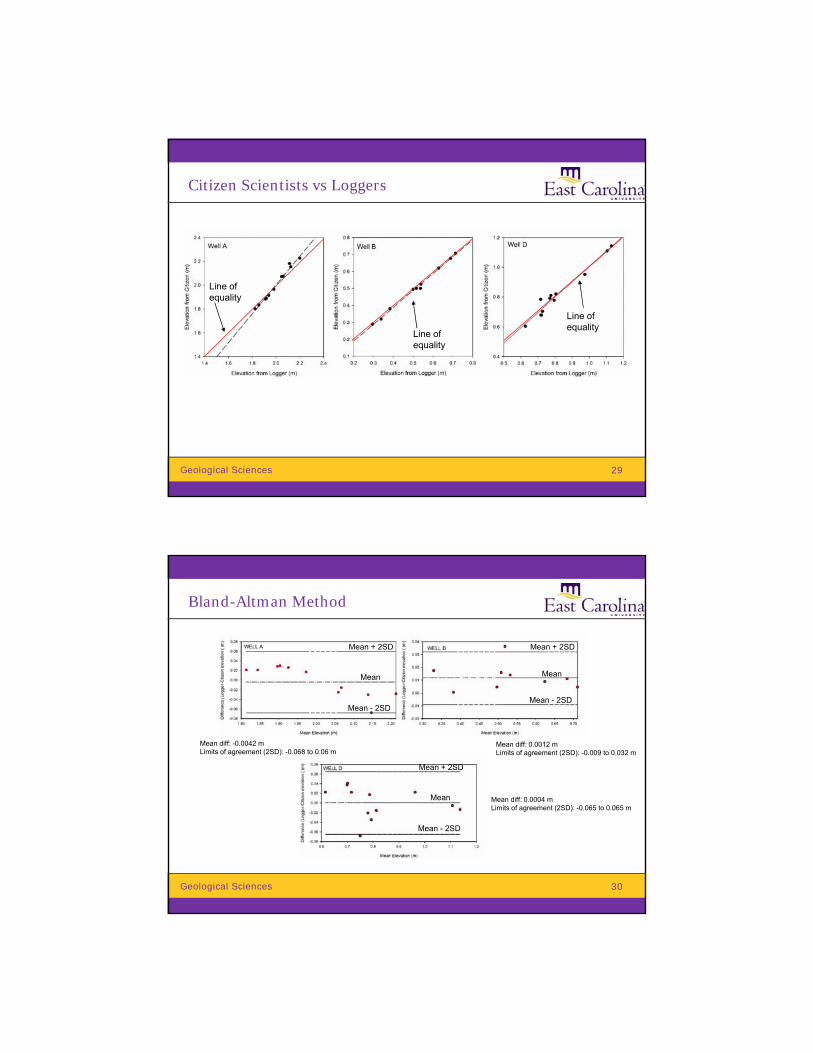
Bland-Altman Method
Mean
Mean + 2SD
Mean - 2SD
Mean
Mean + 2SD
Mean - 2SD
Mean
Mean + 2SD
Mean - 2SD
Mean diff: -0.0042 mLimits of agreement (2SD): -0.068 to 0.06 m
Mean diff: 0.0012 mLimits of agreement (2SD): -0.009 to 0.032 m
Mean diff: 0.0004 mLimits of agreement (2SD): -0.065 to 0.065 m
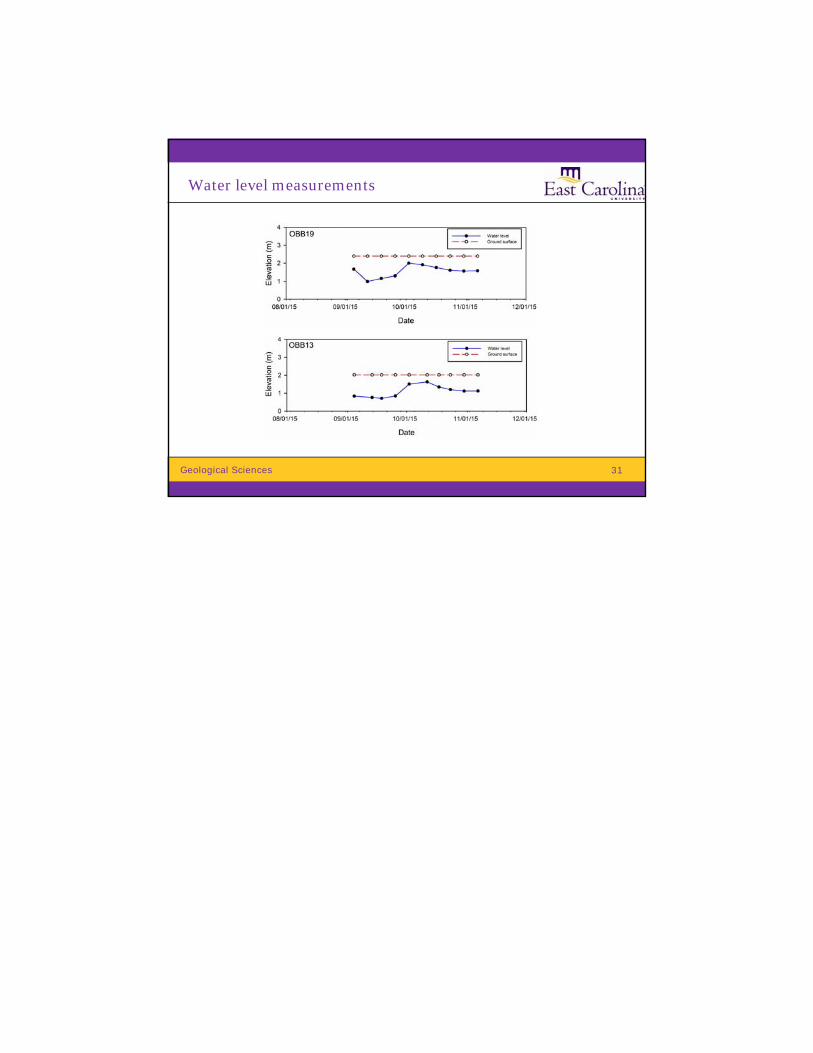
31Geological Sciences
Water level measurements