Embed Size (px)
Citation preview

1/9
Contribution of damage mechanisms comprehension of interlock-
reinforced composite materials
J. Schneider 1, 2, Z. Aboura 1, K. Khellil 1, M.L Benzeggagh 1 and D. Marsal 2
1 Université de Technologie de Compiègne, Laboratoire de Mécanique Roberval UMR CNRS 6253, Dep
GM – Polymères et Composites, BP 20529-60206 Compiègne Cedex, France. 2 SNECMA Villaroche – 77550 Moissy-Cramayel.
ABSTRACT Recent improvements of weaving tools in synergy with the evolution of the composite fields allow
manufacturing of advanced woven composite. Thanks to these techniques, new generation of composite
with a through-the-thickness reinforcement appears. This reinforcement offers a high delamination
resistance and generates a strong capacity to dissipate energy by damage. However, using such
composites involves, among other things, an understanding of the damage mechanisms. Thus, the aim of
this work is to study the damage mechanisms at work in an interlock woven composite.
1. INTRODUCTION
Fibre reinforced polymer (FRP) composites are used in almost every type of advanced
engineering structure, (aircraft, helicopters, spacecraft, boats, ships and offshore
platforms, automobiles…). A key factor driving the increase of applications of
composites over recent years is the development of new advanced generation of FRP
materials. Thus, in the last 15 years, with the development of FRP composites
reinforced with a three-dimensional (3D) fibre structure, a major stride has been made.
The development of this new generation of materials reaches a commercial level and
can be used in both traditional and emerging markets.
Studying these materials requires new experimental approaches in accordance with the
complexity of their architectures. Indeed, considering the large dimensions of the
volume representative element (VRE), strain measurements should be done with new
measurement techniques and qualify them. Moreover, damage mechanisms in these
materials are also complex and specific [1]. Therefore a crosschecking of several
investigation techniques should be performed in order to understand their ruin process.
This article approaches the mechanical behaviour of an interlock graphite / epoxy
composite.
The first part of the study will focus on validating the techniques of strain measurement
comparing several approaches. The second part will analyze the damage mechanisms of
these materials. We will present the step adopted as well as an example of ruin scenario
in the case of uniaxial tensile tests.

2/9
2. MATERIAL PRESENTATION AND EXPERIMENTAL PROCEDURE
Three main types of interlocks exist, the layer-layer angle interlock, the layer to layer
angle interlock, and the orthogonal interlock. The major advantages of these materials
lie in their damage tolerance and delamination resistance. The materials investigated in
this paper are graphite / epoxy balanced and unbalanced layer-layer angle interlock
(Fig.1).
Figure 1: Example of an interlock composite using yarn paths from Wisetex (MTM-KUL)
Tensile, compressive and flexure tests are conducted on both warp and weft directions:
In the tensile test case, a ± 45° test is added. On this paper, we will focus on the tensile
test.
Due to size of the VRE (greater than 15mm in both warp and weft direction), the test
piece dimensions are different from the ones usually used. The geometry was
established using finite element approach, bearing in mind that one VRE should be
present in useful area. Thus, all specimens are dog-bone shape with an adequate width,
transition radius and 10 mm thick.
For the same reasons, strain measurement cannot be done with small gage. So, for this
study, longitudinal strain gauges of 10mm, 20mm, 60mm and an extensometer with
50mm rage measurement were selected. For transversal strain measurement, the gage
lengths used were 5 mm, 10 mm and 20 mm.
Strain field measurement technique from digital images [2] was used in complement.
Figure 2 illustrates a tensile test with an example of various gages and the extensometer
placement on the specimen.
Figure 2: Example of a complex instrumentation (gauges of 10mm, 20mm, 60mm and
extensometer) used for weft tensile test presented in figure 3.b

3/9
3. EXPERIMENTAL RESULTS
3.1 Reinforced experimental procedure
Figures 3a and 3b show the evolution of the different strain gages responses versus time
for tensile tests along, respectively, warp and weft direction. During the tests, loading -
unloading cycles with tensile dwell time were carried out.
Considering the behaviour of the material in the warp and the weft direction, the
straight part of curves for all gages are partially identical (comparable elasticity) except
for the extensometer and the 60mm gage in the warp case (Fig. 3.a).
A difference is notable for the maximum values reached for all gages. For the warp
direction, the lower and the upper value are reached with respectively the 60 mm gage
and the extensometer. It should be noted that these two instrumentations are laid out on
the side of the specimen.
In warp case (Fig. 3.a), the three same gages with 20mm length, indicates a rather close
answer, but a difference persists. Effect of the gage site on the measured value highlight
the heterogeneity of this type of material [3]. This phenomenon exists from the start of
the tests [4] but becomes notable for significant deformations. That explains a limited
assignment on the rigidity modulus.
During weft direction tensile test (Fig. 3.b), all longitudinal gages saturate prematurely
(lower than 1 %). The signal of the gage is observable again in phase of discharge,
probably due to the closing of the crack (60mm length gage in Fig. 3.b). Therefore, the
saturation of the gages was due to the nature of the produced damage. The microscopic
observations (fig. 4), carried out during the tests, confirm microscopic cracks presence
under the strain gages. These microscopic cracks involve a local strain which produce a
loss of the gage electric resistance and have no effect on the extensometer
measurement.
Figure 3.a: Results of a complex
instrumentation for a warp direction tensile test
Figure 3.b: Results of a complex
instrumentation for a weft direction tensile test
Figure 4: Microscope inspections of a weft tensile specimen
Cracks position under
strain gage

4/9
No general tendency could be done on the size and site of the gage. The position of the
gage is very significant especially if its length is low. We have to be careful about the
local deformation included in the measurement size. This point generates a reflection
on the quantification of the local heterogeneity and its influence on the veracity of
measurement.
3.2 Strain fields procedure
In order to avoid previous problems, crosschecking of the gages measurements with the
strain fields analysis technique was required.
Figure 5 shows meshing deformation into the two directions of the woven. Supposed
heterogeneities are confirmed and explain the disturbances previously observed. It is
obvious that low-size gage will be strongly affected by local behaviour of material. At
beginning of the tests, the same heterogeneity exists in the warp and weft direction. In a
small strain case, noise couldn’t be considered negligible and filtering was necessary
[5].
The warp strain field results let appears a non linear deformation of the section. This
phenomenon can explain the difference between 60mm length gage and 50mm length
extensometer positioning on the side of the specimen.
Figure 5: Meshing deformation of the face of sample during uniaxial tensile test along
warp (left) and weft (right) direction
To check the veracity of the strain field measurement technique, a 20 mm length gage
was placed under the strain field measurement area (Fig. 6). According to the
dimensions of the real gage, virtual gage was calculated from the longitudinal strain
field. Thus, comparison test of the two techniques on the same area containing same
heterogeneities was performed.
The figures 7a and 7b present results of the comparison test. The evolution of the real
10mm and 20mm length gage and virtual gage responses versus time was shown for
tensile tests along, respectively, warp and weft direction.
Figure 6: Longitudinal strain field and grid gage position
5/9
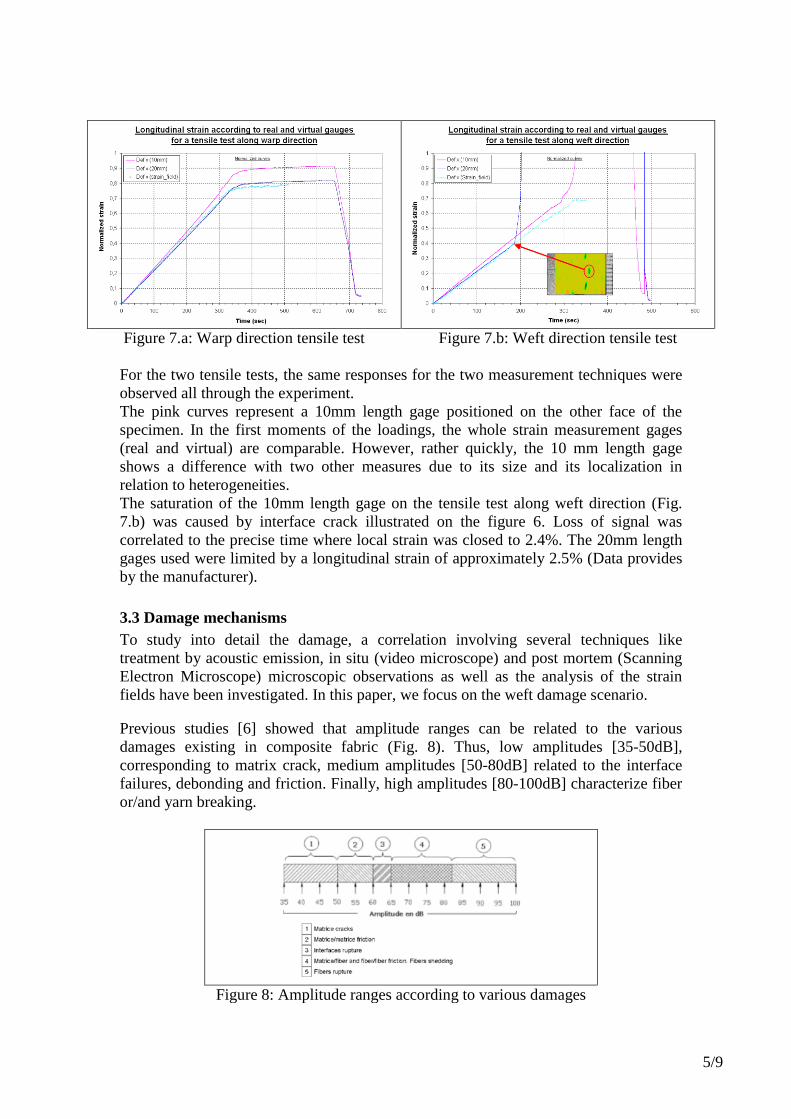
Figure 7.a: Warp direction tensile test Figure 7.b: Weft direction tensile test
For the two tensile tests, the same responses for the two measurement techniques were
observed all through the experiment.
The pink curves represent a 10mm length gage positioned on the other face of the
specimen. In the first moments of the loadings, the whole strain measurement gages
(real and virtual) are comparable. However, rather quickly, the 10 mm length gage
shows a difference with two other measures due to its size and its localization in
relation to heterogeneities.
The saturation of the 10mm length gage on the tensile test along weft direction (Fig.
7.b) was caused by interface crack illustrated on the figure 6. Loss of signal was
correlated to the precise time where local strain was closed to 2.4%. The 20mm length
gages used were limited by a longitudinal strain of approximately 2.5% (Data provides
by the manufacturer).
3.3 Damage mechanisms
To study into detail the damage, a correlation involving several techniques like
treatment by acoustic emission, in situ (video microscope) and post mortem (Scanning
Electron Microscope) microscopic observations as well as the analysis of the strain
fields have been investigated. In this paper, we focus on the weft damage scenario.
Previous studies [6] showed that amplitude ranges can be related to the various
damages existing in composite fabric (Fig. 8). Thus, low amplitudes [35-50dB],
corresponding to matrix crack, medium amplitudes [50-80dB] related to the interface
failures, debonding and friction. Finally, high amplitudes [80-100dB] characterize fiber
or/and yarn breaking.
Figure 8: Amplitude ranges according to various damages

6/9
Acoustic emission treatment provides significant information concerning the nature of
dominating damage in the material. For example, to determine shear modulus and
characterize the viscoelastic behavior of the polymer matrix, 45° off-axis dwell time
tests were performed. Compared to tensile tests in the weft or warp direction, the
acoustic activity is mainly undertaken by amplitudes inferior to 60dB (Fig. 9). It is
necessary to wait the last loading to see high amplitude acoustic emissions in the off-
axis case. The differences in damage between these two tests were clearly illustrated by
the technique.
Figure 9: Acoustic activity during a tensile test in the warp direction (on the left) and at
45° off-axis (on the right)
With treatments considering counts, energy and amplitude, damage chronology could
be established.
For a weft direction loading, all the amplitude ranges occur and increase from the start
of the test. However, a significant growth of high amplitudes was observed from the
fifth loading. These large fiber breakings generate a decrease of rigidity which hasn’t
been seen previously. Before that, matrix and interface damage manage the mechanical
behaviour and have no effect on rigidity. For the weft direction instance, acoustic
emissions of amplitude higher than 60dB didn’t occur at the beginning of test. Different
undulations between the tensed warp and the tensed weft yarns could explain that
phenomenon.
The appearance of the first damages in the matrix and the interfaces was confirmed by
in-situ fractographies (Fig. 10) and strain fields analysis overprinted with
microstructure (Fig.11).
Figure 10: Example of matrix damages and cracks

7/9
Figure 11 informs on complexity and heterogeneity of strains during a tensile test on
the side of the specimen.
Local shear and longitudinal strain (11.a and 11.c) occur in the whole thickness of the
composite and produce inter-yarn cracks. Greater local disband (11.b) can be seen on
surface due to its specific woven.
Figure 11.a: Longitudinal
strain field for a weft tensile
test
Figure 11.b: Strain field in
the thickness for a weft
tensile test
Figure 11.c: Shearing strain
field for a weft tensile
test
The delicate issue of the strain fields is about surface information. Indeed, damage
mechanisms between the side and the core of the woven can be different. Moreover, the
weave comprise different plane including or not weft fill (Fig. 12). For example, strain
fields on figure 11 were specified in a plane confounded with the weft fill paths. In this
location, matrix and interface rupture generate local disbond at the weft and warp
strand interfaces. On a plan without weft tow, cracks and damage mechanisms are not
deviated by these yarns.
That divergence generates different topographies of cracking between these plans
illustrated by the figure 12.
Figure 12.a: Fractography in a plan
confounded with the weft tow column
Figure 12.b: Fractography in a plan between
two columns of weft tow
Post mortem scanning electron microscope observations allow a possible localization of
the primary damages. It would seem that they occur at the interface yarn/yarn and
inside yarn and generate thereafter matrix cracks and local debonding. A strain field
analysis method at this scale is in progress to confirm that information.

8/9
Those different damages produce acoustic activity which covers all the amplitude
ranges. Due to the complexity of the pattern, differences of stress levels and/or stress
directions can be observed in the yarn. Thus, each fill having its own behaviour,
damaged zone on matrix and interfaces are created and finally generate cracks. For a
high damaged level of the interfaces and matrix, warp yarn columns have a movement
compared to the other and only weft yarns absorb loading and began to break.
To ensure the validity of the study and confirm that final fracture at 90° of the specimen
were caused by these damages, fractographic analysis on various plans was investigated
(Fig. 13). Finally, cracks overprint corroborate that damages observed on the sides were
similar to those in the core of the composite.
Figure 13: 3D and overprint representation of the various plans seen under microscope
According to acoustic emission, microscopic observations and strain fields analysis, a
first damage scenario for a tensile test along the weft direction were realized for this
interlock reinforced composite (Fig. 14).
Figure 14: Damage scenario for tensile test along weft direction

9/9
4. CONCLUSIONS
The interest of the interlocks lies in the diversity of architectures. These architectures
must be thought in order to fulfill the requirements of the design. Nevertheless, this step
can be carried out only if the mechanical behavior of these structures is well
understood.
The complexity of these architectures imposes a sophistication of the testing methods,
and it’s necessary to keep in mind dimensions of the unit cell, to have an idea of the
measuring device to set up.
Thus, acoustic emission, strain fields analysis, in-situ and post mortem microscopic
observations are used together in order to understand the damage mechanisms.
The strain field analysis also highlighted the fact that using strain gages and
extensometer with such composites could give a partial information on the damage
mechanisms and even be useless depending on the stress level considered.
This study proposes a methodology of analysis of damage process of interlock
reinforced composite materials, a scenario of ruin under tensile test along weft direction
was thus proposed.
REFERENCES
1. J.P. Quinn, A.T. McIlhagger, R. McIlhagger, "Examination of the 3D woven
composites". Composites Part A : Applied science and manufacturing 2008 :
273-283.
2. G. Besnard, F. Hild, and S. Roux, "Finite-element displacement fields analysis
from digital images: Application to Portevin-Le Châtelier bands". Experimental
Techniques, vol. 46, pp 789-803, 2006.
3. R.D. Hale, "An experimental investigation into strain distribution in 2D and 3D
textile composites". Composites Science and Technology, vol. 63, pp 2171-
2185, 2003.
4. P. Feissel, J. Schneider, Z. Aboura, P. Villon, "Calcul des déformations à partir
de measures de champs de déplacement : Filtrage par Approximation Diffuse".
Journée Scientifique et Technique Européenne : Apports des techniques de
mesure de champs (AMAC), Metz, France, February 7 2008.
5. S. Avril, P. Feissel, F. Pierron and P. Villon, "Estimation of strain field from
full-field displacement noisy data". European Journal of Computational
Mechanics, accepted.
6. S. Barré, M.L Benzeggagh "On the use of acoustic emission to investigate
damage mechanics in glass-fibre-reinforced polypropylene", Comp. Sci. Tech.,
1994, 52, pp 369-376.