Embed Size (px)
Citation preview
Contribution of linear thermal bridges to the overall thermal performance of the building envelope: dynamic analysis
N. Simões1,2, J. Prata1,2 & A. Tadeu1,2 1CICC, Department of Civil Engineering, University of Coimbra, Portugal 2ITeCons – Institute for Research and Technological Development in Construction Sciences, Portugal
Abstract
In this paper we analyse the influence of linear thermal bridges (LTB) on the overall thermal performance of the building envelope. Two different models are used: a 1D heat transfer model that does not take into account the 2D dynamic heat flow through the LTB, and a 2D heat transfer model that computes the energy through the LTB. The first is used to evaluate overall energy balance of the building envelope, while the latter assesses heat transfer through the LTB. The results are then compared to estimate the importance of modelling the LTB. The compatibility of the two numerical approaches is verified by computing the heat transfer through a 1D multilayered wall. This comparison showed that similar hourly results are obtained by the two models. The proposed approach is then applied to a building that is considered to be representative of the Portuguese building stock. The results show the contribution of LTB to the overall thermal performance of the building envelope and demonstrate the importance of assuming 2D heat transfer through the LTB in the dynamic simulation of buildings. Thus, we may conclude that a simplified analysis using a 1D modelling approach could lead to major errors when estimating building loads. Keywords: linear thermal bridges, reference building, building energy simulation, 2D heat transfer, transient analysis.
Eco-Architecture V 321
www.witpress.com, ISSN 1743-3509 (on-line) WIT Transactions on Ecology on The Built Environment, Vol 142, © 2014 WIT Press
doi:10.2495/ARC140281
1 Introduction
During the last two decades several whole building dynamic simulation programs have been developed in order to evaluate the thermal performance of buildings by calculating the energy required for heating and cooling [1]. The required primary energy is estimated depending on the installed technical systems and energy sources. However, most of these programs assume one-dimensional (1D) heat transfer and do not take into account the two-dimensional (2D) and three-dimensional (3D) dynamic heat flows that occur through linear thermal bridges (LTB) in building envelopes. These thermal bridges are the result of building elements junctions, such as corners, wall to floor and wall to ceiling junctions. This simplified analysis may leads to serious errors in building loads estimations as shown by Kosny and Kossecka [2]. Several studies have been undertaken by different researchers in order to analyse the contribution of thermal bridges to the global energy performance of buildings, under dynamic conditions, and also to verify how to introduce thermal bridging analysis into building energy simulations. Most of them propose simplified numerical approaches to be implemented in dynamic simulation software. Gao et al. [3] used a reduction technique to lessen the complexity of a 3D heat transfer model. They used this model to study the dynamic behaviour of thermal bridges in a simplified form and presented the results in 3D dynamic simulation software – TRNSYS [4]. Gao’s work shows that, in the case studied, the thermal bridges lead to a potential increase of 9 to 19% of total heat loss through the building envelope [3]. Déqué et al. [5] proposed an algorithm based on the integration of a simplified dynamic treatment of thermal bridges in the Clim 2000 software [6], showing the advantage of accurately modelling the thermal bridges over conventional approaches that use tabulated values. They concluded that a better estimation of heat loss through thermal bridges, particularly in T and L shaped structures, may represent an increase of 5% of the total heat loss of a building. Martin et al. [7] have developed a methodology to calculate an equivalent wall with the same dynamic thermal behaviour of a thermal bridge. The equivalent wall has the same internal heat flow and surface temperatures of the analysed thermal bridge. This way, an additional 1D heat flow is imposed in building energy simulation programs to simulate thermal bridges, ensuring an equivalent energy balance. Ascione et al. [8, 9] have proposed a new simplified state space method for implementing 2D and 3D heat transfer in dynamic energy simulation software. Other approaches can be assumed to consider LTB in the building energy simulations. The Portuguese energy system code predicts that energy consumption for heating is increased by 5%, due to the existence of LTB [10]. However, there are still doubts about the real impact of LTB on the energy performance of buildings. The influence of LTB is dependent of the type of building solutions and the treatment given to the junctions between their elements. Since building solutions used in each country may be different, studies should consider the building technology typically used, particularly regarding the position and the thickness of insulating materials, and also the eventual detailed correction made to thermal bridges.
322 Eco-Architecture V
www.witpress.com, ISSN 1743-3509 (on-line) WIT Transactions on Ecology on The Built Environment, Vol 142, © 2014 WIT Press
In the present paper the influence of LTB on the overall thermal performance of the building envelope is analysed. For this purpose, two different models are used. A 1D heat transfer model that does not take into account the 2D dynamic heat flows through the LTB is used to estimate the energy balance of the building envelope. Then, a 2D heat transfer model is used to assess the heat transfer through the LTB. The results are then compared to evaluate the contribution of the LTB. Heat transfer through a 1D multilayered wall is simulated using both 1D and 2D numerical models in order to verify the compatibility of the two numerical approaches. This comparison showed that similar hourly results are obtained by using the two models, which confirm that they may be used together to estimate the overall energy balance of the envelope of a building. The proposed approach is then applied to a building that is considered to be representative of the Portuguese building stock. Results show the contribution of LTB to the overall energy performance of the building envelope and demonstrate the importance of assuming 2D heat transfer through the LTB in the dynamic simulation of buildings thus concluding that a simplified analysis using only 1D modelling approaches could lead to an underestimation of heat flow.
2 Dynamic numerical simulation
2.1 1D and 2D heat transfer models
2.1.1 EnergyPlus In this study a 1D building energy simulation program (EnergyPlus) that does not take into account the 2D dynamic heat flow through LTB is used to evaluate the energy balance of a building envelope. The EnergyPlus is constituted by different models that work together to calculate the energy required for heating and cooling a building with a variety of systems and energy sources [11]. For that purpose the fundamental heat balance principles are applied. Heat diffusion through the building constructive elements is simulated considering 1D transient heat transfer. The properties of the construction materials and the indoor air temperature are assumed to be constant. The heat diffusion equation is solved using conduction transfer functions (CTF) derived from state-space models. The program uses hourly weather information and considers the geometry and the constructive description of the building, its use and occupation patterns, its installed power for lighting systems, loading equipment and its air conditioning and other systems characteristics. The EnergyPlus structure is based on five different simulation managers. The EnergyPlus simulation manager controls the entire simulation process. A surface heat balance manager is responsible for the heat and mass balance on each surface, taking into account the conduction, convection, radiation and mass transfer effects. An air heat balance manager is responsible for the air handling provided by ventilation systems, air exhaust and infiltrations. For each set point, responses given by the heat and mass balance simulation modules are transmitted to the building systems simulation manager that controls the HVAC and the
Eco-Architecture V 323
www.witpress.com, ISSN 1743-3509 (on-line) WIT Transactions on Ecology on The Built Environment, Vol 142, © 2014 WIT Press

electrical systems. An integrated solution manager enables the integration between the different modules using an iterative scheme. In order to make the interaction between the user and the EnergyPlus easier, a user-friendly graphical interface (Design builder) is used. All data is edited and introduced into the program by the user.
2.1.2 Bistra A 2D thermal analysis program (Bistra from Physibel) [12] based on the Cranck-Nicolson finite difference method, is used to assess the transient heat transfer across different types of LTB. The time-dependent boundary conditions are described using external user-defined functions. Solar absorption in all nodes, per time step, is calculated taking into account the solar properties of the materials (reflection and transmission factors) and the solar irradiation data (direct and diffuse solar radiation which also includes the ground reflected radiation). The distribution of the reflected radiation to the surfaces of the geometrical model is based on view factors. The solar obstacles and the shading resulting from the geometry of object itself are also considered in the simulations.
2.2 Compatibility between the two numerical models
The heat transfer through a 1D multilayered wall (Figure 1), oriented east with 22.26 m2 area, is simulated using both 1D and 2D numerical models. This comparison allows us to verify the compatibility of the two numerical approaches. The simulation is unidirectional, neglecting linear thermal bridges as well as structural elements and glazed areas of the building envelope. Figure 1 shows the detail of the wall considered in the simulation.
Figure 1: Wall detail considered in the simulation.
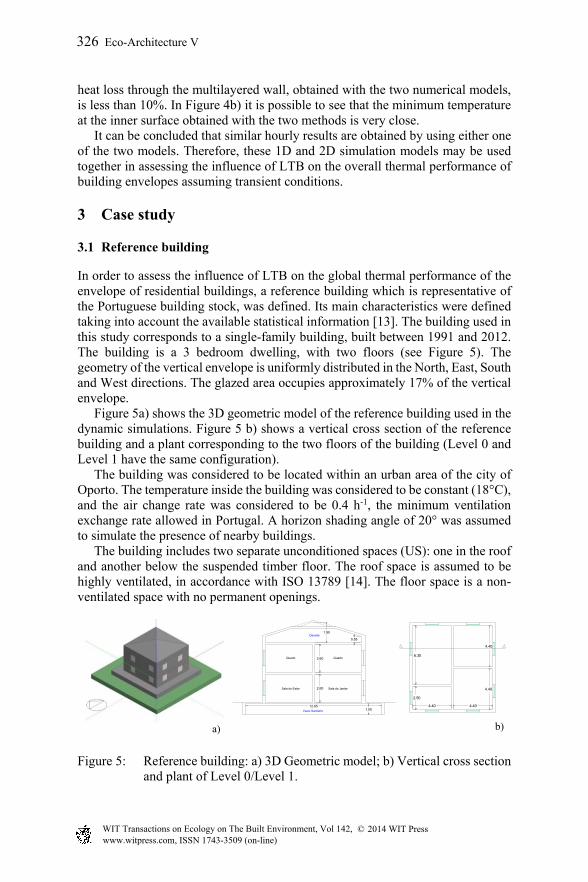
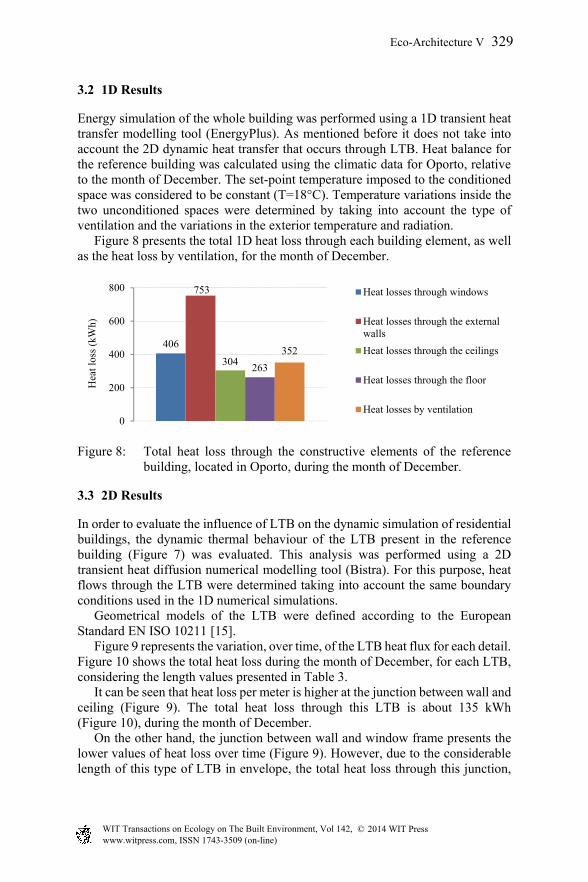
Simulations were performed for the month of December. The climate data is for Oporto, located in the northern region of Portugal. The variation of the outdoor temperature, considered in both simulations, is presented in Figure 2. The indoor temperature was assumed to be constant (Ti=20°C). Simulations took into account the variation of the mean values of horizontal global and diffuse radiation (seen in Figure 3a)) and Figure 3b)), respectively). Simulations were performed assuming that there are no internal gains. Figure 4a) and Figure 4b) present the simulated heat loss through the wall and the lowest temperature at the inner surface of the wall, respectively, obtained with both 1D and 2D numerical models. It can be seen that the difference between in
MDF Board 18 mm
Hollow Brick Masonry 15 cm
interior exterior
Hollow Brick Masonry 20 cm
ETICS 6 cm
interior exterior
Air layer 10 cm
Air layer 5.5 cm
324 Eco-Architecture V
www.witpress.com, ISSN 1743-3509 (on-line) WIT Transactions on Ecology on The Built Environment, Vol 142, © 2014 WIT Press
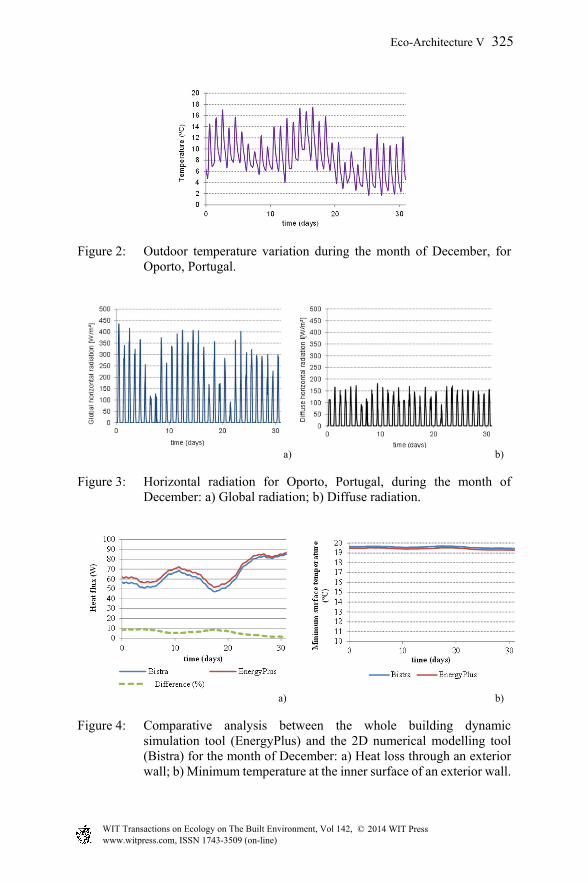
Figure 2: Outdoor temperature variation during the month of December, for Oporto, Portugal.
a) b)
Figure 3: Horizontal radiation for Oporto, Portugal, during the month of December: a) Global radiation; b) Diffuse radiation.
a) b)
Figure 4: Comparative analysis between the whole building dynamic simulation tool (EnergyPlus) and the 2D numerical modelling tool (Bistra) for the month of December: a) Heat loss through an exterior wall; b) Minimum temperature at the inner surface of an exterior wall.
Eco-Architecture V 325
www.witpress.com, ISSN 1743-3509 (on-line) WIT Transactions on Ecology on The Built Environment, Vol 142, © 2014 WIT Press
heat loss through the multilayered wall, obtained with the two numerical models, is less than 10%. In Figure 4b) it is possible to see that the minimum temperature at the inner surface obtained with the two methods is very close. It can be concluded that similar hourly results are obtained by using either one of the two models. Therefore, these 1D and 2D simulation models may be used together in assessing the influence of LTB on the overall thermal performance of building envelopes assuming transient conditions.
3 Case study
3.1 Reference building
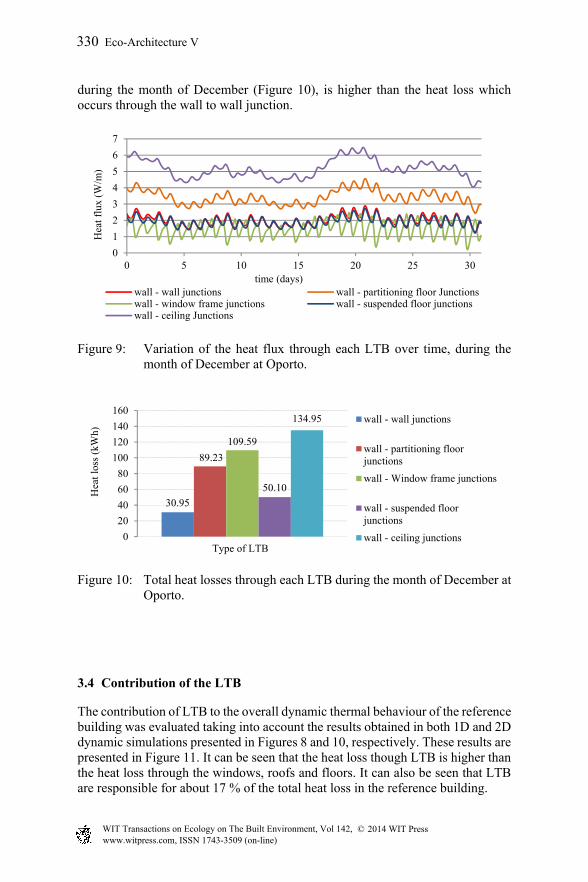
In order to assess the influence of LTB on the global thermal performance of the envelope of residential buildings, a reference building which is representative of the Portuguese building stock, was defined. Its main characteristics were defined taking into account the available statistical information [13]. The building used in this study corresponds to a single-family building, built between 1991 and 2012. The building is a 3 bedroom dwelling, with two floors (see Figure 5). The geometry of the vertical envelope is uniformly distributed in the North, East, South and West directions. The glazed area occupies approximately 17% of the vertical envelope. Figure 5a) shows the 3D geometric model of the reference building used in the dynamic simulations. Figure 5 b) shows a vertical cross section of the reference building and a plant corresponding to the two floors of the building (Level 0 and Level 1 have the same configuration). The building was considered to be located within an urban area of the city of Oporto. The temperature inside the building was considered to be constant (18°C), and the air change rate was considered to be 0.4 h-1, the minimum ventilation exchange rate allowed in Portugal. A horizon shading angle of 20° was assumed to simulate the presence of nearby buildings. The building includes two separate unconditioned spaces (US): one in the roof and another below the suspended timber floor. The roof space is assumed to be highly ventilated, in accordance with ISO 13789 [14]. The floor space is a non-ventilated space with no permanent openings.
a) b)
Figure 5: Reference building: a) 3D Geometric model; b) Vertical cross section and plant of Level 0/Level 1.
Vazio Sanitário
Desvão
Quarto
Sala de Jantar
Quarto
Sala de Estar
1.0012.65
2.60
2.60
0.55
1.90
4.40 4.40
6.30
2.50
4.40
4.40
326 Eco-Architecture V
www.witpress.com, ISSN 1743-3509 (on-line) WIT Transactions on Ecology on The Built Environment, Vol 142, © 2014 WIT Press

The envelope consists of insulated double walls, ceilings and floors, and double glazed windows in aluminium without thermal break. Figure 6 shows the details of the construction elements that make up the envelope of the reference building.
Figure 6: Construction elements’ details.
The thermophysical characteristics of the construction solutions of the components of the envelope are listed in Table 1. The surface areas of the construction elements are listed in Table 2.
Table 1: Thermophysical characteristics of the materials of the construction elements.
Constructive material Thermal
conductivity λ [W/(m.ºC)]
Density [kg/m3]
Specific heat Cp
[kJ/(kg.K)] 1 Mortar 1.3 1900 0.84 2 Brick masonry 11 0.407 870 0.84 3 EPS thermal insulation 0.042 14 1.40 4 Ceramic blocks voided slab 0.77 1760 0.84 5 Floor tile 1.3 2.3 0.84 6 Lightweight floor screed 0.7 1.2 0.84 7 Air layer 0.972 1.184 1.01 8 Plasterboard 0.25 850 0.84 9 Air layer 0.556 1.184 1.01
10 Glass 1.0 2500 0.75 11 EPDM 0.25 1150 1.00 12 Aluminium 160.0 2800 0.88
Eco-Architecture V 327
www.witpress.com, ISSN 1743-3509 (on-line) WIT Transactions on Ecology on The Built Environment, Vol 142, © 2014 WIT Press

Table 2: Surface areas of the construction elements of the reference building.
Constructive element [m²]
Outer walls 152.04 Outer fenestration elements 31.0
Suspended floor 77.5 Ceiling 77.5
Figure 7 shows the detail drawings of the LTB of the reference building. The length of each LTB is listed in Table 3.
Figure 7: Detail drawings of the LTB of the reference building.
Table 3: Length of the LTB of the reference building.
LTB detail Length [m] Wall – suspended floor junction 35.2 Wall – partitioning floor junction 35.2
Wall – ceiling junction 35.2 Wall – wall junction 20.8
Wall – window frame junction 103.3
Wall - wall junction Wall – partitioning floor junction Wall - window frame
junction
Wall - ceiling junction Wall - suspended floor junction
interiorexterior
inte
rior
exte
rior
exterior interior
inte
rior
inte
rior
exterior interior
exterior interior
exterior interior
inte
rior
US
exterior US
US
inte
rior
exterior interior
US
exte
rior
328 Eco-Architecture V
www.witpress.com, ISSN 1743-3509 (on-line) WIT Transactions on Ecology on The Built Environment, Vol 142, © 2014 WIT Press
3.2 1D Results
Energy simulation of the whole building was performed using a 1D transient heat transfer modelling tool (EnergyPlus). As mentioned before it does not take into account the 2D dynamic heat transfer that occurs through LTB. Heat balance for the reference building was calculated using the climatic data for Oporto, relative to the month of December. The set-point temperature imposed to the conditioned space was considered to be constant (T=18°C). Temperature variations inside the two unconditioned spaces were determined by taking into account the type of ventilation and the variations in the exterior temperature and radiation. Figure 8 presents the total 1D heat loss through each building element, as well as the heat loss by ventilation, for the month of December.
Figure 8: Total heat loss through the constructive elements of the reference building, located in Oporto, during the month of December.
3.3 2D Results
In order to evaluate the influence of LTB on the dynamic simulation of residential buildings, the dynamic thermal behaviour of the LTB present in the reference building (Figure 7) was evaluated. This analysis was performed using a 2D transient heat diffusion numerical modelling tool (Bistra). For this purpose, heat flows through the LTB were determined taking into account the same boundary conditions used in the 1D numerical simulations. Geometrical models of the LTB were defined according to the European Standard EN ISO 10211 [15]. Figure 9 represents the variation, over time, of the LTB heat flux for each detail. Figure 10 shows the total heat loss during the month of December, for each LTB, considering the length values presented in Table 3. It can be seen that heat loss per meter is higher at the junction between wall and ceiling (Figure 9). The total heat loss through this LTB is about 135 kWh (Figure 10), during the month of December. On the other hand, the junction between wall and window frame presents the lower values of heat loss over time (Figure 9). However, due to the considerable length of this type of LTB in envelope, the total heat loss through this junction,
406
753
304263
352
0
200
400
600
800
Hea
t los
s (k
Wh)
Heat losses through windows
Heat losses through the externalwalls
Heat losses through the ceilings
Heat losses through the floor
Heat losses by ventilation
Eco-Architecture V 329
www.witpress.com, ISSN 1743-3509 (on-line) WIT Transactions on Ecology on The Built Environment, Vol 142, © 2014 WIT Press
during the month of December (Figure 10), is higher than the heat loss which occurs through the wall to wall junction.
Figure 9: Variation of the heat flux through each LTB over time, during the month of December at Oporto.
Figure 10: Total heat losses through each LTB during the month of December at Oporto.
3.4 Contribution of the LTB
The contribution of LTB to the overall dynamic thermal behaviour of the reference building was evaluated taking into account the results obtained in both 1D and 2D dynamic simulations presented in Figures 8 and 10, respectively. These results are presented in Figure 11. It can be seen that the heat loss though LTB is higher than the heat loss through the windows, roofs and floors. It can also be seen that LTB are responsible for about 17 % of the total heat loss in the reference building.
0
1
2
3
4
5
6
7
0 5 10 15 20 25 30
Hea
t flu
x (W
/m)
time (days)wall - wall junctions wall - partitioning floor Junctionswall - window frame junctions wall - suspended floor junctionswall - ceiling Junctions
30.95
89.23
109.59
50.10
134.95
0
20
40
60
80
100
120
140
160
Hea
t los
s (k
Wh)
Type of LTB
wall - wall junctions
wall - partitioning floorjunctions
wall - Window frame junctions
wall - suspended floorjunctions
wall - ceiling junctions
330 Eco-Architecture V
www.witpress.com, ISSN 1743-3509 (on-line) WIT Transactions on Ecology on The Built Environment, Vol 142, © 2014 WIT Press

Figure 11: Contribution of each building element to the overall thermal performance of the reference building envelope.
4 Conclusions
In this paper, the authors have analysed the influence of linear thermal bridges (LTBs) on the overall thermal performance of a residential building. A 1D whole building dynamic simulation model was used to evaluate the energy balance of the building envelope. Since this model does not compute 2D heat transfer through LTB, a 2D heat transfer model was also used to assess heat loss through these junctions. A 1D multi-layered wall was first simulated using both numerical models. Results confirmed the compatibility of the two numerical approaches. The proposed methodology was then applied to a reference building representative of Portuguese building stock. The results have shown that, in this case study, LTB are responsible for about 17% of the total heat loss in the simulated building. These results allow us to conclude that a simplified analysis that uses a 1D modelling approach could lead to considerable errors when estimating building thermal performance. We can also conclude that a simplified approach may underestimate the building global heating needs. In future work, other simulations will be performed considering different types of construction materials and taking into account different insulation layer placements and thicknesses.
Acknowledgements
The research work presented herein was supported by the FEDER funds through the Operational Programme for Competitiveness Factors – COMPETE and national funds through the FCT, under research project PTDC/ECM/114189/2009. This work has also been supported by the Energy and Mobility for Sustainable Regions – EMSURE – Project (CENTRO-07-0224-FEDER-002004) and by FEDER funds through COMPETE and QREN, under the project FCOMP-05-0128-FEDER-022994.
16%
30%
12%11%
17%
14% Heat losses through windows
Heat losses through the external walls
Heat losses through the ceilings
Heat losses through the floor
Heat losses through the LTB
Heat losses by ventilation
Eco-Architecture V 331
www.witpress.com, ISSN 1743-3509 (on-line) WIT Transactions on Ecology on The Built Environment, Vol 142, © 2014 WIT Press
References
[1] P. Narowski, J. Stasierski and P. Wereszczyński, Modelling of conduction transfer functions for typical thermal bridges identified in BIM data, Proceedings of Building Simulation 2011: 12th Conference of International Building Performance Simulation Association, Sydney, pp. 14–16, 2011.
[2] J. Kosny, E. Kossecka, Multi-dimensional heat transfer through complex building envelope assemblies in hourly energy simulation programs, Energy and Buildings, 34, pp. 445–454, 2002.
[3] Y. Gao, JJ. Roux, L.H. Zhao, Y. Jiang, Dynamical building simulation: A low order model for thermal bridges losses, Energy and Buildings 40, pp. 2236–2243, 2008.
[4] TRNSYS – A transient System Simulation Program, Madison, Solar Energy Laboratory University of Wisconsin, Madison, WSA, 1990.
[5] F. Déqué, F. Ollivier, JJ. Roux, Effect of 2D modelling of thermal bridges on the energy performance of buildings: numerical application on the Matisse apartment, Energy and Buildings, 33(6), pp. 583–7, 2001.
[6] D. Bonneau, FX. D. Rongere, Covalet, B. Gautier, Clim 2000: modular software for energy simulation in buildings, in: Proceedings of the IBPSA Third International Conference on Building Simulation ’93, University of Adelaide, Australia, August, pp. 85–91, 1993.
[7] K. Martin, C. Escudero, A. Erkoreka, I. Flores, J.M. Sala, Equivalent wall method for dynamic characterisation of thermal bridges, Energy and Buildings, 55, pp. 704–714, 2012.
[8] F. Ascione, N. Bianco, R.F.D. Masi, F. Rossi and G.P. Vanoli, Simplified state space representation for evaluating thermal bridges in building: Modelling, application and validation of a methodology, Applied Thermal Engineering, 61, pp. 344–354, 2013.
[9] F. Ascione, N. Bianco, G. M. Mauro, M. Musto, G. Turni, and G. P. Vanoli, Experimental validation of a numerical code by thin film heat flux sensors for the resolution of thermal bridges in dynamic conditions, Applied Energy, 124, pp. 213–222, 2014.
[10] Portuguese Law no. 58/2013, 20th August 2013 – directive 349-D/2013, 2 December 2013.
[11] U.S. Department of Energy-EERE, EnergyPlus – The Reference to EnergyPlus Calculations, October 2013.
[12] Physibel software for thermal simulation – Bistra v3.0w Manual 01.2010, http://www.physibel.be/
[13] ICESD – Survey on Energy Consumption in Domestic Sector and ECH – Construction and Housing Statistics, ADENE database.
[14] ISO 13789, Thermal performance of buildings – Transmission and ventilation heat transfer coefficients – Calculation method, 2007.
[15] ISO 10211, Thermal bridges in building construction – Heat flows and surface temperatures – Detailed calculations, 2007.
332 Eco-Architecture V
www.witpress.com, ISSN 1743-3509 (on-line) WIT Transactions on Ecology on The Built Environment, Vol 142, © 2014 WIT Press