Embed Size (px)
Citation preview

Ech-Chafay et al., JMES, 2017, 8 (6), pp. 1921-1928 1921
JMES, 2017 Volume 8, Issue 6, Page 1921-1928
1. Introduction
The quality of water in the world has experienced in recent years deterioration because of uncontrolled both
domestic and industrial wastes and the intensive use of chemical fertilizers in agriculture. They produce a
chemical change in the water and make it unsuitable for desired uses [1, 2]. Many studies have also been
reported on the study of different effects of industrial and urban wastes on the evolution of the quality of surface
water and the pollution of inland aquatic ecosystems [3, 4].
Moulouya is the largest river flowing into the Mediterranean in Morocco. Along more than 500 km, it drains
almost all of eastern Morocco, and it is particularly affected by pollution due to the growing population of the
coastal centers, the continuous development of industry and agriculture and the presence of mineral deposit [5].
Indeed, liquid domestic and industrial waste sources generated by the cities of Tounfite, Boumia, Zaida
Missour, Outat El Haj, Tindit and Guercif are dumped directly into the river from a precarious and without any
prior treatment. Moreover, there are mining waste, laundry waste and metal residues which can be a major
source of contamination of the aquatic ecosystem of the river [5].
The city of Missour located 205 km from Fez in the province of Boulmane is one of those centers. The presence
of the Middle Atlas chain in its northwest boundary, the High Atlas in south and the remoteness of the
Mediterranean mitigates the marine influences like rain and gives the region a semi-arid climate accompanied
by long periods of drought (waters resources in Morocco) which has a direct impact on the water level in the
region. This work is a contribution to the evaluation of the quality of surface water in that region by a space-
time monitoring of the evaluation of a number of physical and chemical parameters listed above.
Copyright © 2017,
University of Mohammed Premier
Oujda Morocco
Journal of Materials and Environmental Sciences ISSN : 2028-2508
http://www.jmaterenvironsci.com/
Received 23 Mai 2016,
Revised 07 Mar 2017,
Accepted 11 Mar 2017
Keywords
Water quality;
Physical chemistry;
Missour;
Oued Moulouya ;
Morocco
H. Ech-chafay
+212670033873
Abstract
The present work is to assess the quality of water of the Oued Moulouya in cities of Outat
El Haj and Missour, in order to have the level of collaboration of the domestic pollution of
these two cities to the degradation of this ecosystem. This study concerns the analysis of
physical-chemical parameters (T °, pH, EC, turbidity, TSS, O2, BOD5, COD, MO, Cl, TH,
HCO3-, PO4
3-, P, and NO3
-, NO2
- , SO4
2-) of the Oued Moulouya waters in Outat El Haj and
Missour to establish a diagnosis of the state of pollution of surface waters of this river.
Thus, the water samples were collected at six stations for one year from November 2014 to
October 2015 (12 samples). The analysis results show that the water of stations are
bicarbonated with calcium and magnesium and they also show that in the stations, where
the wastewater are discharged from the cities of Missour and Outat El Haj, there is an
increase in the levels of BOD5, PO43-
, chlorides, TSS, COD, MO, and a decrease in the
dissolved oxygen levels. Analysis of nitrates and orthophosphates of the water give very
low values. The values of certain parameters such as temperature, the potential of
hydrogen, conductivity, alkalis, sulphates, chlorides generally testify that the waters of the
Oued are of good quality according to Moroccan standards. Furthermore, the pollution
degree differs from one site to another depending on the distance and the remoteness of the
source of pollution.
Contribution to the Physico-Chemical Study of the Moulouya Waters in the
Region Outat El Haj and Missour
H. Ech-chafay1, T. Hachi
1, M. Najy
1, Fatimetou Salma M.M.O.S
1, K. El kharrim
1, D. Belghyti
1
1. Laboratory of Environment and Renewable Energies, Ibn Tofail University, Faculty of Science, BP133, 14000 Kenitra,
Morocco

Ech-Chafay et al., JMES, 2017, 8 (6), pp. 1921-1928 1922
Experimental details
1.1. Overview of the study area
The region recognizes certain population growth accompanied by rapid urbanization, and is characterized by a
semi-arid climate with very low and irregular pluviometry. The monthly precipitation regime indicates
maximums recorded between April and May and minimums in July and August (between 4.09 and 6.93mm).
The soils of the region are divided between Hamri, Shooting and Harch.
Figure 1: Location of the study area and sampling sites
The study area is part of the watershed of Moulouya; middle Moulouya is located between latitudes 32 ° 50 'N
and 33 ° 50' S and either side of longitude4th W. For the total area of 16,800 km3, middle Moulouya has 6% of
mountains ( medium and high Atlas), 55% of plateaus (Rekkame) and 39% of plains which form the valley itself
(combe & Simont, 1971). It is located between Missour and Outat El Haj (average Moulouya) and lies between
the latitudes 32 ° 50'N and 33 ° 50'N.
1.2. Choice of stations:
We chose six sampling stations in the region of Outat El Haj and Missour : six at the Oued of Moulouya, three
in Outat El Haj and three in Missour (Figure 1). The choice of stations is based on the nature of water (waste
water, natural waters), which were selected so that they are accessible and reflect the actual characteristics of
surface waters of the Oued of Moulouya in the area, and existing to the proximity of the stations to the
discharges of domestic sewage
- The M1 station: located on Oued Moulouya at the entrance of Missour.
- The M2 station: located on Oued Moulouya downstream of domestic wastes.
- The M3 station: located on Oued Moulouya at the exit of Missour.
- The M4 station: located on Oued Moulouya at the entrance of Outat El Haj
- The M5 station: located on Oued Moulouya after the source of Jorf El Hmam
- The station M6: situated on Oued Moulouya at the exit of Outat El Haj
1.3. Methods of water analysis:
Along the middle Moulouya (study area), twelve samples monthly were carried out during the period from
November 2014 to October 2015.

Ech-Chafay et al., JMES, 2017, 8 (6), pp. 1921-1928 1923
Some physic-chemical parameters change during transport and storage of samples of the sampling site (Ground)
to the laboratory therefore it is always better to make on-site measurements. In situ measurements of
temperature, pH, electrical conductivity, dissolved oxygen and turbidity were conducted respectively by a
mercury thermometer, a pH meter PH-2006, a conductivity meter WTW (Cond 315i), an oximeter EUTCH
(CyberScan DO300) and turbidimeter HACH 2100N.
The measurements of all physical and chemical parameters are performed within 48 hours after the sampling,
with the standard methods usually adopted by this type of analysis [7, 8].
The suspended matter content (TSS) was obtained by weight difference of the filter membrane (d = 0,45μ)
before and after filtration. Chlorides and organic matter were determined respectively by Mohr's method and by
oxidation with potassium permanganate. The TH hardness, bicarbonates were evaluated by titrimetric assay
.The BOD5 was measured using a BOD meter. The COD measurement was performed by the potassium
dichromate method. Sulphate (SO42-
) by the nephelometric method; orthophosphate (PO43-
), nitrates (NO3-) and
nitrite (NO2-) were measured using a spectrophotometer, respectively, by the method of ammonium Molybdate,
by the method of salysilate [9] and by the method of Zamballi [24].
2. Resultats and Discussion
2.1. The water temperature and Potential of hydrogen (pH):
The average water temperature has a significant spatial variation from upstream to downstream, and it depends
on climatic variations and not on the studied stations of watercourses [10].
The recorded results show that the temperature is between 19.6 ° C and 21.3 ° C (Figure 2), and these values are
considered limits ranging from 20 to 30 ° C. This is a favorable temperature for bacterial growth (assimilative
phenomenon), parasites, mosquito larvae and other microbial germs.
In our case, the temperature is not substantially high because the measurements were performed in the morning
and water regularly flows from the mountains to the mouth.
Figure 2 shows the spatial variation in pH at the various studied stations. The analysis shows that the measured
average of pH range between 7.36 and 7.51 and shows no significant variation. They remain somewhat neutral
and express alkalinity of different stations (upstream-downstream).
The minimum values are recorded in summer while the maximum values are recorded in winter.
The pH increase during the winter period (flood period) may be due to the abundance of carbonate formations at
the middle Moulouya watershed and are washed out by rain and flood of the Oued, and organic matter in the
wastewater discharge does the city of Missouri which explain the low pH decrease in the M2 and the gradient of
M2 to M6 could be related to self-purification phenomenon.
7.2
7.25
7.3
7.35
7.4
7.45
7.5
7.55
0
5
10
15
20
25
M1 M2 M3 M4 M5 M6Stations
T°pH° C p H
Figure 2: Spatial variation of temperature and potential of hydrogen

Ech-Chafay et al., JMES, 2017, 8 (6), pp. 1921-1928 1924
2.2. The electrical conductivity (EC)
The conductivity measurement is a good assessment of the degree of mineralization of water in which each ion
acts by its concentration and its specific conductivity [17]. The reported average values show small variations.
They fluctuate between 1151µs/cm (microsiemens/cm) at the M6 station and 1387 microseconds µs/ cm in the
M4 station with an average of 1 256 µs/ cm in surface waters of the Oued of Moulouya, not exceeding the
Moroccan standards of surface water ( 2700 µs / cm) [6], Indicating low mineralization attributed to waste water
in the study area cities.Which classifies these waters in the right grid of surface water [6].
Figure 3: Spatial variation of the electrical conductivity
2.3. Turbidity and TSS
Turbidity measures the water content of the particles in suspensions, associated with the transport of water
which is of a mineral nature and by the presence of microorganism [24] .The latter increases from the upstream
to downstream of 175.1 to 277.2 NTU, with an average value of 196 NTU (Figure 4). These recorded turbidity
levels are well above the acceptable limits intended for water of human consumption that is 5 NTU [12].
Figure 4: Spatial variation of the turbidity and TSS
The spatial average of suspended solids (TSS) increased in parallel with the turbidity from the upstream to
downstream of the discharge of the towns of Missour, Outat El Haj and which are driven by heavy rains varying
from 356.8 to 411 , 2 mg / L (Figure 4). the MES recorded values exceed the standard of surface water which is
50 mg / L. The suspended solids levels are proportional to the flow and reach their greatest values during the
0
200
400
600
800
1000
1200
1400
1600
M1 M2 M3 M4 M5 M6
CE
(µs/
cm)
Stations
CE
0
100
200
300
400
500
600
700
0
50
100
150
200
250
300
350
M1 M2 M3 M4 M5 M6
Turb
idit
y (N
TU)
Stations
NTU
TSS
(mg/
l)

Ech-Chafay et al., JMES, 2017, 8 (6), pp. 1921-1928 1925
flood periods, resulting in bacterial contamination in summer with an increased capacity of drop [13]. It is
noteworthy that the high values recorded at stations are due to industrial and domestic waste.
2.4. Bicarbonate (HCO3-), Chlorides (Cl
-) and Total hardness (TH)
In figure 5, we notice that the recorded levels in the studied stations remains almost constant with an average of
132.5 mg / l, and we notice that the variations in alkalinity between the different dates samples are mainly
related to variations in precipitation. This is explained by the significant dissolution of calcite in the watershed
of Moulouya during the winter period, which is attributed to the increased flow in various tributaries of the mold
[14].
Figure 5: Spatial variation of the bicarbonate, chlorides and total hardness
The concentrations of chloride in the Oued of Moulouya vary in the same direction as the total water of
mineralization. The concentrations of chloride ions found in the waters of the Moulouya (Figure 5) ranged from
158.9 mg / l in the M6 station and 176.8 mg / l in the M4 station.
For the six stations of the study area, chlorides record some levels that are lower than the Moroccan standards
set at 750 mg / l, which classifies these waters in the excellent class of grid quality of surface water [17].
The total water hardness (TH) is a parameter directly connected to the amount of calcium and magnesium in
water [8]. The waters of the Oued of Moulouya are characterized by a total hardness especially at the studied
stations. These high values (> 30 ° F) could be explained by the disposal of domestic and industrial wastewater
and the nature of sedimentary rocks through which water runoff. The hardness varies between 410.3 ° F
recorded at the M6 station and 594.5 ° F recorded at the M4 station (Figure 5).
2.5. Biochemical Oxygen Demand (BOD5), Chemical Oxygen Demand (COD) and Organic Matter (OM) :
Figure 6 shows an increase of BOD5 of the Moulouya river waters from its upstream to its downstream
reflecting the river’s pollution effect. Indeed, the mean values of BOD5 vary between 17.5 mg / l at the station
M1, and 46.2 mg / l in the station M2. The downstream portion of the study area (M2, M6) receives raw sewage
with rich organic matter and nutrients from urban agglomerations of Missour and Outat El Haj, causing a
considerable increase in the organic load of surface water in a small space.
At the Oued Moulouya (M4 and M5 stations), we can notice a decreasing gradient of BOD5, reflecting the self-
purifying effect of the river. The average of the values is recorded at the study sites above the standard set for
the surface water which is 10 mg / l [24].
The pattern of evolution of the COD and the MO is identical to that of BOD5. The contents of COD and MO
recorded at the level of the studied waters are respectively between 73.8 mg / l 37.7 mg / l in the M4 station and
0
100
200
300
400
500
600
700
0
20
40
60
80
100
120
140
160
180
200
M1 M2 M3 M4 M5 M6
Cl,
HC
O3
-(m
g/l)
Stations
HCO3-
Cl-
TH
(mg/
l)

Ech-Chafay et al., JMES, 2017, 8 (6), pp. 1921-1928 1926
141.6 mg / l 74.9 mg / l in M6, (Figure 6). All rates based on organic materials and COD exceed the values
indicated by the surface water quality grid estimated at 5 mg / l for the MO and 40 mg / l for COD [11], this
could be explained firstly by the direct result of discharges of sewage and secondly by the creation of conditions
of the organic matter degradation by microorganisms whose activity and multiplication require oxygen.
Figure 6: Spatial variation of COD, BOD5 and OM
2.6. Orthophosphate (PO43-
)
Phosphorus is one of the most important nutrients in nature. It is a biogenic element essential to the growth of
algae, bacteria and protozoa [15]. The elevated levels of this element in surface waters can cause eutrophication
[16]. The Levels found in the river are low, and the concentrations in PO43-
of different water stations range
around 0.3 mg/l and 0.8 mg/l (Figure 7). The highest values are displayed in the stations M2 and M6 and this
can be explained by the proximity of the latter to the discharges of domestic sewage of Missour and Outat El
Haj [17]. Phosphate levels are proportionally increasing in orthophosphate whose values are ranging from 0.08
to 0.26 mg/l.
0
20
40
60
80
100
120
140
160
M1 M2 M3 M4 M5 M6
CO
D, B
OD
5,
MO
(m
g d
'O2
/l)
Stations
COD
BOD5
OM
0
0.1
0.2
0.3
0.4
0.5
0.6
0.7
0.8
0.9
M1 M2 M3 M4 M5 M6
PO
43
-, P
(m
g/l)
Stations
PO43-
P
Figure 7: Spatial variation of the phosphorus and orthophosphate
Ech-Chafay et al., JMES, 2017, 8 (6), pp. 1921-1928 1927
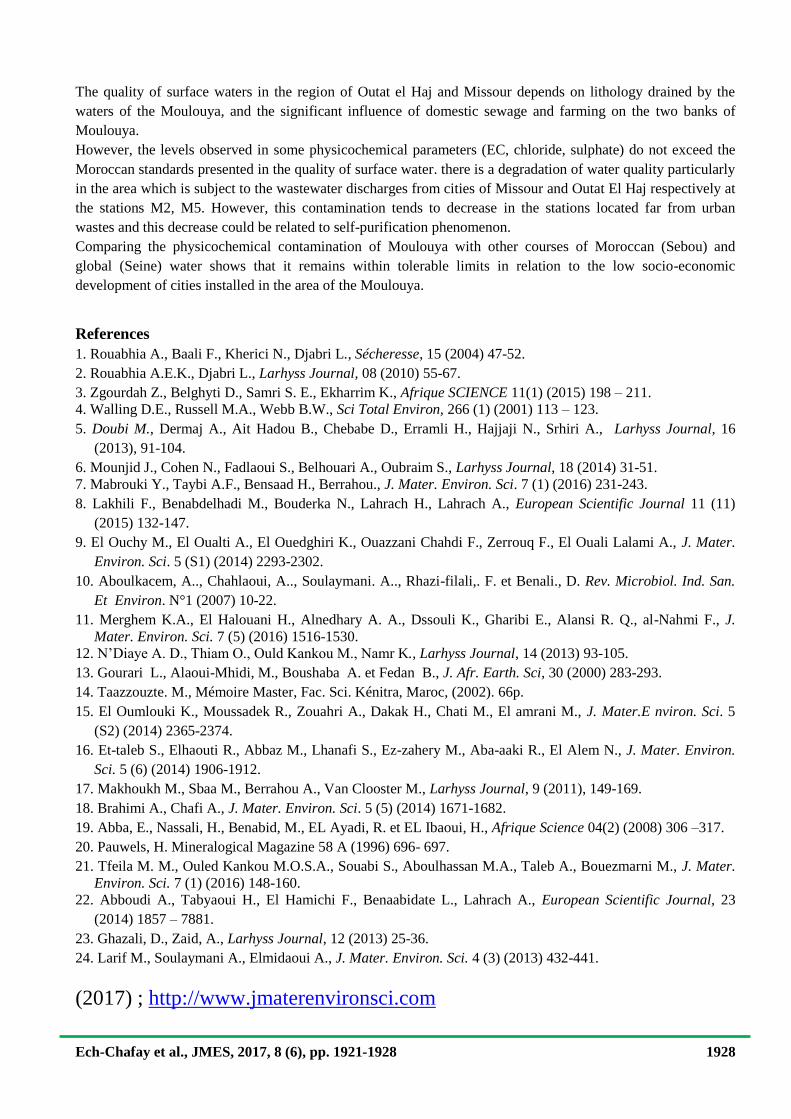
2.7. Nitrite (NO2-) and Sulfates :
Nitrate levels evolve inversely proportional way there nitrites with values ranging from 0.16 to 0.37 mg / l
(Figure 9): this could be explained by denitrification of nitrate to nitrite by bacteria autotrophic Nitrosomonas
and Nitrobacters which respectively realize the oxidation of ammonium in nitrite and the oxidation of nitrite in
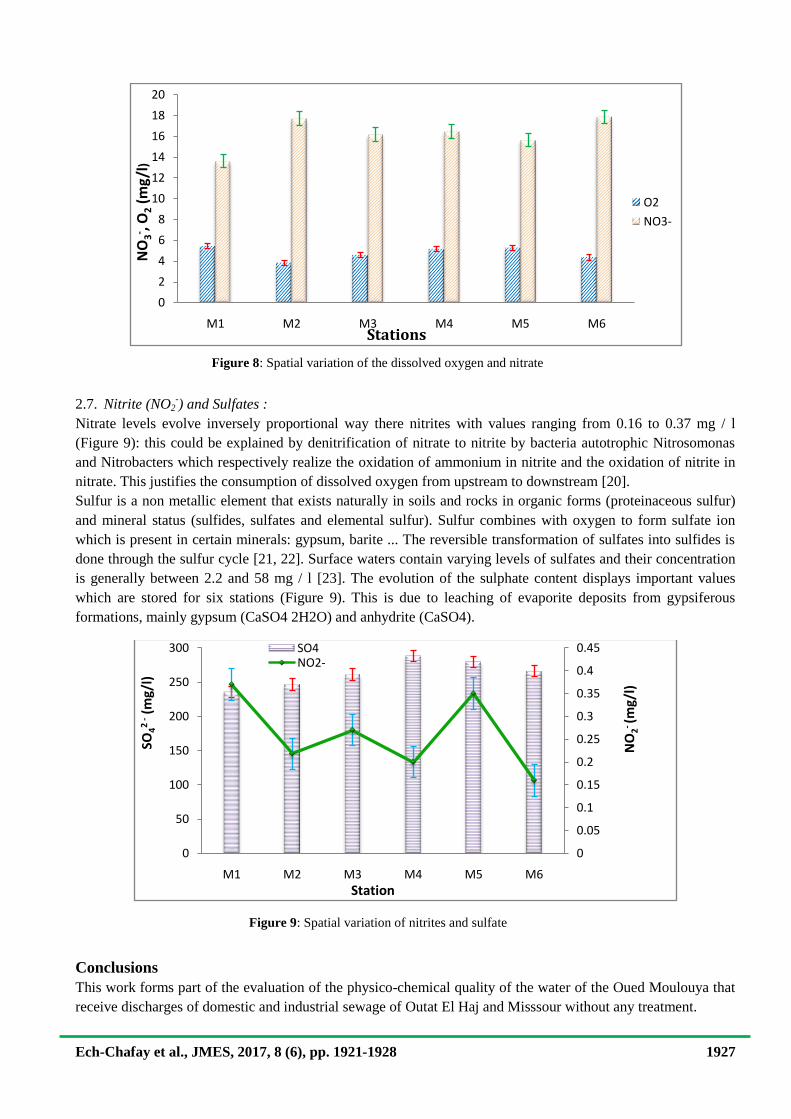
nitrate. This justifies the consumption of dissolved oxygen from upstream to downstream [20].
Sulfur is a non metallic element that exists naturally in soils and rocks in organic forms (proteinaceous sulfur)
and mineral status (sulfides, sulfates and elemental sulfur). Sulfur combines with oxygen to form sulfate ion
which is present in certain minerals: gypsum, barite ... The reversible transformation of sulfates into sulfides is
done through the sulfur cycle [21, 22]. Surface waters contain varying levels of sulfates and their concentration
is generally between 2.2 and 58 mg / l [23]. The evolution of the sulphate content displays important values
which are stored for six stations (Figure 9). This is due to leaching of evaporite deposits from gypsiferous
formations, mainly gypsum (CaSO4 2H2O) and anhydrite (CaSO4).
Conclusions
This work forms part of the evaluation of the physico-chemical quality of the water of the Oued Moulouya that
receive discharges of domestic and industrial sewage of Outat El Haj and Misssour without any treatment.
0
2
4
6
8
10
12
14
16
18
20
M1 M2 M3 M4 M5 M6
NO
3- ,
O2
(mg/
l)
Stations
O2
NO3-
0
0.05
0.1
0.15
0.2
0.25
0.3
0.35
0.4
0.45
0
50
100
150
200
250
300
M1 M2 M3 M4 M5 M6
SO4
2 -
(mg/
l)
Station
SO4NO2-
NO
2-(m
g/l)
Figure 9: Spatial variation of nitrites and sulfate
Figure 8: Spatial variation of the dissolved oxygen and nitrate
Ech-Chafay et al., JMES, 2017, 8 (6), pp. 1921-1928 1928
The quality of surface waters in the region of Outat el Haj and Missour depends on lithology drained by the
waters of the Moulouya, and the significant influence of domestic sewage and farming on the two banks of
Moulouya.
However, the levels observed in some physicochemical parameters (EC, chloride, sulphate) do not exceed the
Moroccan standards presented in the quality of surface water. there is a degradation of water quality particularly
in the area which is subject to the wastewater discharges from cities of Missour and Outat El Haj respectively at
the stations M2, M5. However, this contamination tends to decrease in the stations located far from urban
wastes and this decrease could be related to self-purification phenomenon.
Comparing the physicochemical contamination of Moulouya with other courses of Moroccan (Sebou) and
global (Seine) water shows that it remains within tolerable limits in relation to the low socio-economic
development of cities installed in the area of the Moulouya.
References
1. Rouabhia A., Baali F., Kherici N., Djabri L., Sécheresse, 15 (2004) 47-52.
2. Rouabhia A.E.K., Djabri L., Larhyss Journal, 08 (2010) 55-67.
3. Zgourdah Z., Belghyti D., Samri S. E., Ekharrim K., Afrique SCIENCE 11(1) (2015) 198 – 211.
4. Walling D.E., Russell M.A., Webb B.W., Sci Total Environ, 266 (1) (2001) 113 – 123.
5. Doubi M., Dermaj A., Ait Hadou B., Chebabe D., Erramli H., Hajjaji N., Srhiri A., Larhyss Journal, 16
(2013), 91-104.
6. Mounjid J., Cohen N., Fadlaoui S., Belhouari A., Oubraim S., Larhyss Journal, 18 (2014) 31-51.
7. Mabrouki Y., Taybi A.F., Bensaad H., Berrahou., J. Mater. Environ. Sci. 7 (1) (2016) 231-243.
8. Lakhili F., Benabdelhadi M., Bouderka N., Lahrach H., Lahrach A., European Scientific Journal 11 (11)
(2015) 132-147.
9. El Ouchy M., El Oualti A., El Ouedghiri K., Ouazzani Chahdi F., Zerrouq F., El Ouali Lalami A., J. Mater.
Environ. Sci. 5 (S1) (2014) 2293-2302.
10. Aboulkacem, A.., Chahlaoui, A.., Soulaymani. A.., Rhazi-filali,. F. et Benali., D. Rev. Microbiol. Ind. San.
Et Environ. N°1 (2007) 10-22.
11. Merghem K.A., El Halouani H., Alnedhary A. A., Dssouli K., Gharibi E., Alansi R. Q., al-Nahmi F., J.
Mater. Environ. Sci. 7 (5) (2016) 1516-1530.
12. N’Diaye A. D., Thiam O., Ould Kankou M., Namr K., Larhyss Journal, 14 (2013) 93-105.
13. Gourari L., Alaoui-Mhidi, M., Boushaba A. et Fedan B., J. Afr. Earth. Sci, 30 (2000) 283-293.
14. Taazzouzte. M., Mémoire Master, Fac. Sci. Kénitra, Maroc, (2002). 66p.
15. El Oumlouki K., Moussadek R., Zouahri A., Dakak H., Chati M., El amrani M., J. Mater.E nviron. Sci. 5
(S2) (2014) 2365-2374.
16. Et-taleb S., Elhaouti R., Abbaz M., Lhanafi S., Ez-zahery M., Aba-aaki R., El Alem N., J. Mater. Environ.
Sci. 5 (6) (2014) 1906-1912.
17. Makhoukh M., Sbaa M., Berrahou A., Van Clooster M., Larhyss Journal, 9 (2011), 149-169.
18. Brahimi A., Chafi A., J. Mater. Environ. Sci. 5 (5) (2014) 1671-1682.
19. Abba, E., Nassali, H., Benabid, M., EL Ayadi, R. et EL Ibaoui, H., Afrique Science 04(2) (2008) 306 –317.
20. Pauwels, H. Mineralogical Magazine 58 A (1996) 696- 697.
21. Tfeila M. M., Ouled Kankou M.O.S.A., Souabi S., Aboulhassan M.A., Taleb A., Bouezmarni M., J. Mater.
Environ. Sci. 7 (1) (2016) 148-160.
22. Abboudi A., Tabyaoui H., El Hamichi F., Benaabidate L., Lahrach A., European Scientific Journal, 23
(2014) 1857 – 7881.
23. Ghazali, D., Zaid, A., Larhyss Journal, 12 (2013) 25-36.
24. Larif M., Soulaymani A., Elmidaoui A., J. Mater. Environ. Sci. 4 (3) (2013) 432-441.
(2017) ; http://www.jmaterenvironsci.com


![MISSOUR][ COURTIIOlJSES](https://img.pdfslide.net/doc/110x75/61fe1a77677afe4ca028a242/missour-courtiioljses.jpg)