Embed Size (px)
Citation preview
Eimear Kenny, PhDThe Charles Bronfman Institute of Personalized Medicine
Icahn School of Medicine at Mount Sinai2018.05.02 @EimearEKenny
Missing Heritability Ten Years On
Contributions of diverse populations and expanded catalogues of human variation to our
understanding of low frequency and rare variants

Human Genetic History is Complex!And has changed dramatically recently:
Henn, Cavalli-Sforza, Feldman, PNAS 2012

Genes mirror geography: lessons from the Thousand Genomes Project
ACB 96
ASW 61BEB 86
CDX 93
CEU 99
CHB 103
CHS 105
CLM 94
ESN 99
FIN 99
GBR 90
GIH 103GWD 113
IBS 107
ITU 102
JPT 104
KHV 99
LWK 99
MSL 85
MXL 64
PEL 85
PJL 96
PUR 104
STU 102
TSI 107
YRI 108

Chinese HanEast AsiaGlobally shared
ACB 96
ASW 61BEB 86
CDX 93
CEU 99
CHB 103
CHS 105
CLM 94
ESN 99
FIN 99
GBR 90
GIH 103GWD 113
IBS 107
ITU 102
JPT 104
KHV 99
LWK 99
MSL 85
MXL 64
PEL 85
PJL 96
PUR 104
STU 102
TSI 107
YRI 108
Common variants are shared globally

Chinese HanEast AsiaGlobally shared
ACB 96
ASW 61BEB 86
CDX 93
CEU 99
CHB 103
CHS 105
CLM 94
ESN 99
FIN 99
GBR 90
GIH 103GWD 113
IBS 107
ITU 102
JPT 104
KHV 99
LWK 99
MSL 85
MXL 64
PEL 85
PJL 96
PUR 104
STU 102
TSI 107
YRI 108
Rare variants are geospatially restricted

Common variants reveal population structure in Europe
Novembre et al “Genes mirror geography in Europe” Nature (2008)

7
European
African
N. AmericanMexican
Colombian
Af. Amer.
7
Latin America genetic diversity show signatures of European, African and Native American ancestry
Native American
African
European
Dominican Republic
Honduras
Mexico
Puerto Rican
Ecuador

Fu et al “Analysis of 6,515 exomes reveals the recent origins of most human protein-coding variation” Nature (2013)

Recent demography expected to play a considerable role in rare variant mapping
PCA (common SNPs)

Recent demography expected to play a considerable role in rare variant mappingPCA (common SNPs)
IBD-network(rare haplotypes)
24K New Yorkers (BioMe Biobank)

Large and increasingly diverse reference sequence databases

●
●
●
●●●
Population size6−1415−100101−200201−500501−2000>2000
●●●●●●●
RegionAfricaAmericasCentralSouthAsiaEastAsiaEuropeMiddleEastOceaniaAfrican-American
Native American
Native Hawaiian
Cuba
Dominican Republic
PuertoRico
MexicoJapan
India
www.pagestudy.org
Wojcik et al. “Genetic diversity turns a new PAGE in our understanding of complex traits” (2017) biorXiv
52K participants200+ phenotypes (+ 1 Biobank)1 genetic platform
NHGRI Population Architecture using Genomics and Epidemiology (PAGE) Study

Over 30,000 segregating clinical variants from medical databasesPAGE ExAC 1000 Genomes
Study Populations
Sample Size (N) 51,698 60,706 2,504
Population Labels 99 5 26
Phenotypes (Yes/No) Yes No No
Clinical content (Total, polymorphic)
Overall 63,902 (36,247) 234,585 (101,203) 237,620 (41,386)
ClinVar Total 21,720 (15,793) 131,325 (62,350) 132,238 (30,519)
Pathogenic 7,186 (2,276) 45,180 (9,779) 44,230 (1,643)
Likely pathogenic 623 (320)
Uncertain significance 4,133 (3,805) 51,852 (24,705) 52,822 (8,473)
Benign/Likely benign 6,483 (6,411) 33,306 (27,201) 34,077 (19,844)
Conflicted 1,702 (1,567) 310 (294) 299 (216)
Other 423 (351) 667 (371) 810 (343)
Not provided 1,172 (1,063)
Within ACMG genes 2,496 (1,477) 42,023 (10,358) 43,580 (4,302)
HGMD 16,381 (10,445) 146,304 (32,208) 145,240 (12,279)
Predicted loss-of-function 38,950 (16,233)
ACMG-59 genes 2,740 (1,596)

Applying ACMG criteria to PAGE populations reveals 2,820 variants with MAF>0.05
586 variants26% (n=153) not in other databases
Clinical assertion

●●●●●
●
MAF<0.0050.005−0.010.01−0.0250.025−0.05>0.05singleton
●
●
●●●●
Population size<1515−5051−100101−250251−1000>1000
Worldwide frequencies of ClinVar conflicted variant SCN5A.pV195L
South AmericanMAF= 0.0595
95% CI: 0.0499-0.0702
Native American
African American
Asian American
LongQT syndrome, autosomal dominant Current status on ClinVar: Conflicted Risk allele is allele shown here: A
Risk allele frequencies in gnomAD
Latino=0.04African=0.003
East Asian=0.0029South Asian=0.0018
13 SubpopulationsBari, Chile, Colombia, HGDP Colombian,
Ecuador, El Salvador, Honduras, Peru, Pima, Puno,Yukpa, Zapotec

●●●●●
●
MAF<0.0050.005−0.010.01−0.0250.025−0.05>0.05singleton
●
●
●●●●
Population size<1515−5051−100101−250251−1000>1000
Native AmericanAfrican American
Asian American
Papua New Guinea MAF=0.058
95% CI: 0.016-0.191
Native HawaiianMAF=0.028
95% CI: 0.022-0.032
- Gene is associated with autosomal dominant cardiomyopathy - Current status on ClinVar: Conflicted - Risk allele is allele shown here: T Only seen 5 copies in gnomAD
South Asian MAF=0.0001
Worldwide frequencies of ClinVar conflicted TNNT2.c5564G>A splice variant

Additional 40% variants above 5% MAF using fine-grained population labels in PAGE
*To account for differences in sample size, we include only those variants where the lower bound of 95% confidence interval of risk allele frequency > 0.05Country/Region-of-origin
population labels(N=99)
Sub-continental levelpopulation labels
(N=11)PAGE 52K participants
3866*
2790*
Perc
ent C
linVa
rVar
iant
s 40%

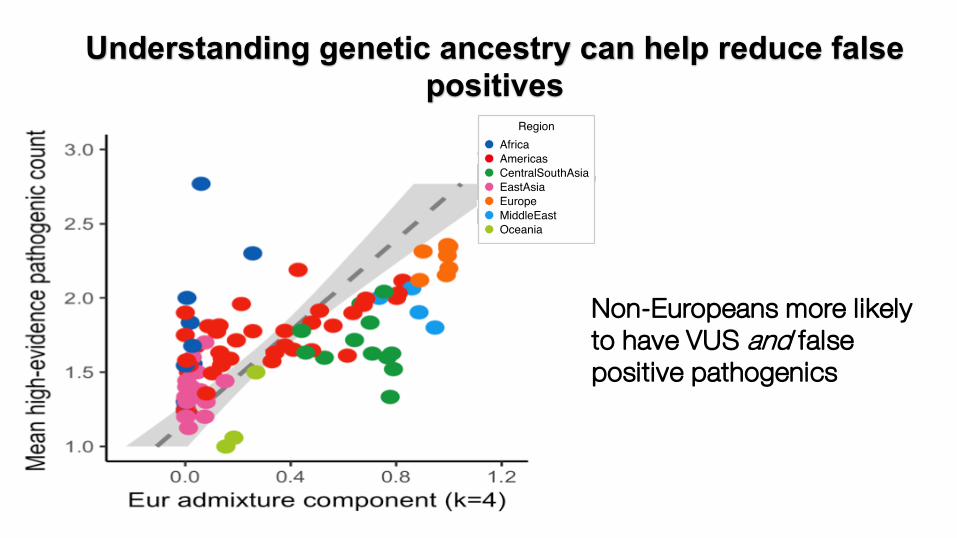
Understanding genetic ancestry can help reduce false positives
●●●●● ● ●● ●●
●●● ●●●●●●● ●●● ●●●●●●●●●● ●●● ●●●● ●● ●●●● ●●●●● ●●●● ●● ●●●●●●●● ●● ●● ●●●●●●●●●●●●● ●●●● ●●●●● ●●●●● ●●●●●●●●●●●●●●●●●●●●●● ●●●●●● ●●●● ● ●●●● ●●●●●●●●●●●●●●● ●●●●●● ●●● ●●●● ●● ●●●● ●●●●●● ●●●●●●●●●●●● ●● ●●●● ●● ●●●● ● ●●● ●● ● ●● ● ●●●●● ● ●●●● ●●●●●●●● ●●●●●●● ●●●●●● ●● ●●●●●●●●●●●●●●●● ●● ●●●● ●●● ●●●●●●●●●●●●●●●●●●● ●●●●●●●●● ●●● ●●● ●●●●●●● ●●●●● ●● ●●● ● ●●●●●●●●● ●●●● ●●● ●● ●●● ●●● ● ●●●●● ●●●●●●●●●●●●●●●● ●●●● ●●● ●●●●●●●● ●●●● ●●●● ●●● ●●● ●●● ●●●●● ● ●●●●●●●●● ●●●●●●●●●●● ●●●●● ●●●● ●●●●●●●● ●●● ●●●● ●● ●● ●● ●●● ●● ●●●● ●●●●●●●●●●●●●●●●●●●●●● ●● ●● ● ●●●●● ● ●●●● ●●●●● ●●●●● ●●●●●●●●●● ●●● ●● ●●● ●●●●● ●●● ●●● ●● ●●● ●●● ●● ●●●●●●● ●●● ●●●●●● ●●● ●●●● ●●● ● ●●●●● ●●● ●●● ●●●●● ●●● ●●●● ● ●●●● ●●●● ● ●●●●● ●●● ●●●●●● ●●●●●● ●●●●●●●● ●● ● ●●●●●●●●●● ●●●●●●●●● ●● ●●●● ●●● ●●●●●●●●● ●●● ●●●● ●●●●●●●● ●●●● ●●●●●●●● ●●●●●●●●●●● ●●●●●●●●● ●● ●●●●● ●●●●●●● ●●●● ●●●● ●●●●● ●●●● ●●●● ●● ●●● ●●●● ●●●● ●●●● ●●● ●●● ●●●● ●● ● ●●● ● ●●●●● ●●●● ● ●●●● ●● ●● ●●● ●●●● ●●●● ●● ●●●●
●●●●● ●●●
● ●● ●●●●●● ●●●●●●●●●●● ●● ●●●
●●●
●●● ●●●● ●●●● ●●● ●● ●●●●● ●● ●●●●● ●● ●●●● ●●● ●● ●●● ●●●●● ●● ●●●● ●●● ●● ●●●● ●●●●●●●●●●● ●●●●●● ●● ●●●●
AfricaAmericas
EuropeMiddle East
Cntrl South AsiaEast AsiaOceania
0 10 20 30
●●● ●●●● ●●●● ●●● ●● ●●●●● ●● ●●●●● ●● ●●●● ●●● ●● ●●● ●●●●● ●● ●●●● ●●● ●● ●●●● ●●●●●●●●●●● ●●●●●● ●● ●●●●HawaiianPapuan
Melanesian
0 10 20 30
●●
●
●● ●●
●● ●●●●●● ●●●●●●●●●●● ●● ●●●
● ●
●
●
●
●●●
●●
●
●
OroqenDaur
JapaneseMongola
NaxiXibo
YakutHezhen
JapanKoreaLahu
CambodianChina
DaiHan
Hong KongPhilippines
TaiwanTu
TujiaHan N China
MiaoYi
She
0 10 20 30
●●
● ●●●●● ●● ●●●● ●● ●●● ●● ●●● ●● ●●● ● ●●●● ● ●●● ●●●●● ●●● ●●●●●●●● ●●● ●●●●● ●●●●●●●●● ●●● ●●● ● ●●● ●● ●●●●●● ●●●●● ● ●●●●●●● ●●● ●● ● ●●● ●●●● ●●● ●● ●● ●●● ●●● ●● ●●● ●● ●● ●● ●●●● ● ●● ●●● ●●●●●●● ●●●●● ●●●●●●● ●●●●● ●● ●●● ●● ●●●●● ●●● ●● ●●● ●●●●●●●● ●●● ●●●●●● ●● ●●● ● ●●●● ● ●● ● ●●● ●●● ●● ●● ●●●●●● ●●● ●● ● ●● ●●●● ●●●●●●●●●●● ●●●●●● ● ●●●● ●● ● ●● ● ●●● ●● ●●●●●●● ● ●●● ● ●●●● ● ●● ●●●●● ●●● ●●● ●●● ●●●● ●●●●
●
●●●● ●●● ●●● ●●●●● ●●● ●●●● ● ●●●● ●●●● ● ●●●●● ●●● ●
●
● ●●● ●●●●●●●●●●●●● ●●● ●●●●● ●● ●●● ●●●●●●●●● ●
● ●●
●●●●●●●●●●●●●● ●● ●●●● ●●●● ●● ●●●●●●● ●● ●●● ●●● ● ● ●● ●● ●●●●●●● ●● ●●● ●●● ●●●●●●●● ●●●
●
●● ●●
●●●●●●●●●● ●●●●●●●● ●●●●●●●● ●● ●● ●●●●●● ●●●●● ●● ●●●●● ●●●● ●●●●● ●●●●●●●●●●●● ●●● ●●●●
●●●● ●●● ●●●●
●●
●●●● ●●●●● ●●●
●
● ● ●
GrenadaJamaica
African−AmericanAntigua and Barbuda
BarbadosBelize
Dominican RepublicGarifuna
HaitiPanama
CubaGuyana
Puerto RicoTrinidad Tobago
VenezuelaArgentina
BrazilColombia
Costa RicaGuatemala
HondurasMexico
Native AmericanChile
EcuadorEl Salvador
MayaOaxacan
PeruZapotec
PimaColombian
BariKaritiana
WaraoYukpaSurui
0 10 20 30count
●●
●
●●
●●● ●
● ●
KhomaniBantu So. Africa
MandenkaMbuti Pygmy
West AfricaNama
Bantu KenyaBiaka Pygmy
SanYoruba
0 10 20 30
●
●●● ●●
●●●●
KalashPathanBalochi
BurushoHazara
PakistanUygurSindhi
BangladeshBrahui
IndiaMakrani
0 10 20 30
MozabiteBedouin
PalestinianDruze
0 10 20 30
●
●
TuscanFrenchAdygeiItalian
OrcadianBasqueRussian
Sardinian
0 10 20 30
Mean pathogenic count

●
●
●
●●●
Population size6−1415−100101−200201−500501−2000>2000
●●●●●●●
RegionAfricaAmericasCentralSouthAsiaEastAsiaEuropeMiddleEastOceania
Mean PC1 per population
Mea
n pa
thog
enic
coun
t
In a linear model, Countspathogenic ~ PC1 + F
PC1 and F coefficient together explain ~36% of the variance in pathogenicity countsZ >20, p<10e-16
Understanding genetic ancestry can help reduce false positives
●
●
●
●●●
Population size6−1415−100101−200201−500501−2000>2000
●●●●●●●
RegionAfricaAmericasCentralSouthAsiaEastAsiaEuropeMiddleEastOceania
Non-Europeans more likely to have VUS and false positive pathogenics
Understanding genetic ancestry can help reduce false positives
●
●
●
●●●
Population size6−1415−100101−200201−500501−2000>2000
●●●●●●●
RegionAfricaAmericasCentralSouthAsiaEastAsiaEuropeMiddleEastOceania
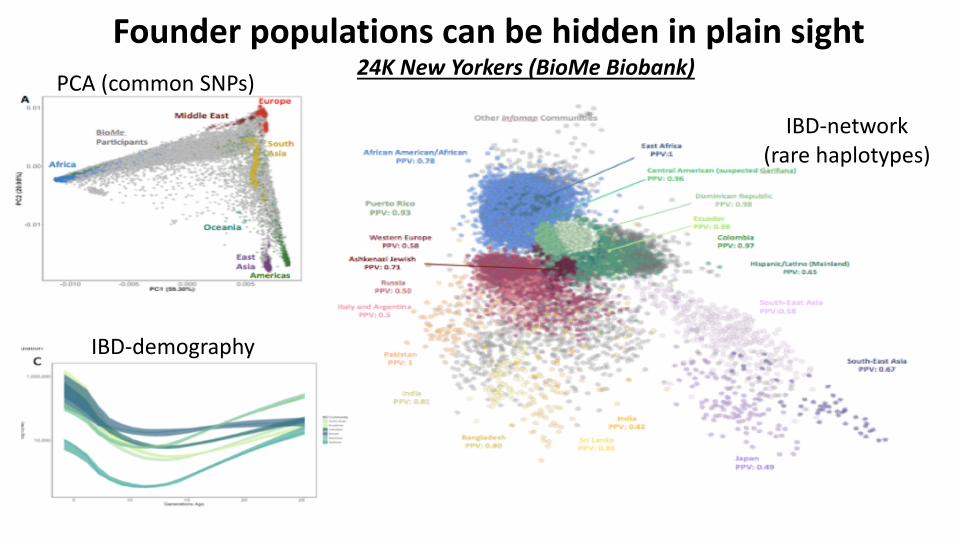
Founder populations can be hidden in plain sightPCA (common SNPs)
IBD-network(rare haplotypes)
IBD-demography
24K New Yorkers (BioMe Biobank)

22% Geisinger cohort in large connected pedigree

Recent demography expected to play a considerable role in rare variant mapping14,181,681,196 IBD tracts present in 487,409
UK Biobank participantsNorway versus UK Region
Median Degree of Sharing
Norway versus UK Region
Median Degree of Sharing
Shetland Isles (0.1)
Orkney (0.085)
Outer Hebrides (0.09)

Stanford UniversityGenevieve Wojcik
Elena Sorokinthe Bustamante labCarlos Bustamante
PAGE-II CollaboratorsLucia Hindorff (NHGRI)
Kari North (UNC)Chris Carlson (Fred Hutch)
Charles Kooperberg (Fred Hutch)Chris Haiman (MEC)
Ruth Loos (MSSM)Tara Matise (Rutgers)
Steve Buyske (Rutgers)Jose-Luis Ambite (USC)
AcknowledgementsIcahn School of Medicine at Mount Sinai
Gillian BelbinSinead CullinaStephane WenricHannah PoisnerMuh-Ching YeeJackie Odgis
Institute of Personalized Medicine
Noura Abul-HusnGirish NadkarniTielman Van Vleck
Amanda Merkelson
Bernadette Liggayu
Patrick ShanleyRuth Loos
Erwin Bottinger
Judy Cho
University of ColoradoChris Gignoux
Funding NIH/NHGRI/NHLBIU01HG109391U01HG009080X01HL134588