Embed Size (px)
Citation preview
DOCUMENT RESUME
ED 061 103 SE 013 582
AUTHOR Rowe, Mary BuddTITLE Wait-Time and Rewards as Instructional Variables:
Their Influence on Language, Logic, and FateControl.
PUB DATE Apr 72NOTE 32p.; Presented at the National Association for
Research in Science Teaching, Chicago, Illinois,April 1972
EDRS PRICE MF-$0.65 HC-$3.29DESCRIPTORS Educational Research; Ele entary School Scie ce:
*Instruction; Interaction Process Analysis;*Questioning Techniques; *Research Reviews(Publications) ; Student Characteristics; TeacherCharacteristics
IDENTIFIERS NARST
ABSTRACTElementary science teachers allow an average of one
second for a response to a question, and follow a student response bya comment within an average of nine-tenths of a second. When thesetwo "wait times" are extended to three to five seconds, a number ofchanges occur in student variables. There are increases in the lengthof the response, the number of unsolicited appropriate responses,student confidence, incidence of speculative responses, incidence ofchild-child data comparisons, incidence of evidence-inferencestatements, frequency of student questions, and incidence ofresponses from "relatively slow" students. The number of teacherquestions which do not elicit a response decreases. Teachercharacteristics change as wait-times increase. There is an increasedflexibility of teacher responses, the questioning pattern becomesmore variable, teacher expectations for performance of students ratedas "slow" may change. These generalizations are based upon five yearsof study of video-taped lessons or micro-teaching sessions. Thesestudies also suggest some research hypotheses concerning the effectof verbal reward and wait-time on students' perceptions of theirdegree of environmental control: low incidence of verbal reward and along wait-time may reduce fatalism. (Author/AL)
ABSTRACT
TITLE: WAIT-TIME AND REWARDS AS INSTRUCTIONAL VARIABTRS: THEIR INFLUENCEON LANGUAGE, LOGIC, AND FATE CONTROL.
AUTHOR:ADDRESS
Mary Budd RoweTeachers CollegeColumbia UniversityNew York City, New York 10027
(212) 870 - 4042
MEETING: National Association for Research in Science Teaching
April 1972
U.S. DEPARTMENT OF HEAEPUCATION & WELFAROFFICE OF EDUCATION
THIS DOCUMENT HAS BEENDUCFD EXACTLY AS RECEiVErTHE PERSON OR ORGANIZATIOIINATINO IT POINTS OF VIEW 0IONS STATED DO NOT NECESREPRESENT OFFICIAL OFFICE CCATION POSITION OR POLICY
ABSTRACT: The paper summarizes work of five years on influence of avariable called teacher wait-time on development of language
and logic in children taking part in elementary science
programs. Analysis of over 300 tape recordings showed meanwait-time to be on the order of one second. After a teacherasks a question students must begin a response within anaverage time of one second. If they do not the teacherrepeats, rephrases or asks a different question or calls
on others. A second potential wait-time is involved. Whena student makes a response, the teacher reacts or asksanother question within an average time of 0.9 seconds.
When mean wait-times of three to five seconds are achievedthrough training, analysis of more than 900 tapes showschanged values on nine student variables: 1. The lengthof responses increases. 2. The number of unsolicited butappropriate responses increases. 3. Failures to respond
decrease. 4. Confidence as reflected in decrease ofinflected responses increases. 5. Incidence of speculativeresponses increases. 6. Incidence of child-childccmparisons of data increases. 7. Incidence of evidence-inference statements increases. 8. The frequency ofstudent questions increases. 9. Incidence of responsesfrom students rated by teachers as relatively slow increases.
Servo-chart plots of recordings show that students discussingscience phenomena tend to speak in bursts with intervals of
three to five seconds between bursts being fairly common.The average post-student response wait-time of 0.9 secondsapparently intervenes between bursts to prevent completionof a thought.
Over time a classroom on the prolonged wiat-time scheduletakes on other properties. Three teacher variables change:1. Response flexibility scores increase: 2. Teacherquestioning pattern becomes more variable: 3. There issome indication that teacher expectations for performanceof students rated as relatively slow improves.
A model which involves the relation of wait-time and rewardas input variables to language, logic, and fate control ascomplex outcome variables is discussed.
1
WAIT-TIME AND REWARDS AS INSTRUCTIONAL VARIABLES,THEIR INFLUENCE ON LANGUAGE, LOGIC, AND FATE CONTROL'
bY
Eary Budd RoweTeachers College, Columbia University
New York, New York
"The paradigm observer is not the manwho sees and reports what all normalobservers see and report, but the manwho sees in familiar objects what noone else has seen before."
-Norwood Russell Hansonin Patterns of Discovery
Introduction
All of the major elementary science programs extant today were designedto provoke children to inquire about relationships among natural phenomena.All of them provide situations meant to be suitable for the development inchildren of certain skills and a viable knowledge structure. In spite ofprovocative stimuli, the people who prepared the programs had to admit thatthe amount and quality of inquiny actually occurring fell uell below expecta-tions. While some people connected with the projects blamed the situationon the teachers' lack of science knowledge, certain observations made by meand those working in my group made us think that this generally held explana-tion was too superficial. The evidence we had: though fragmentary, did notsupport that view.
We found, for example, that children taught by teachers with considerabletraining in one of the programs did not exhibit substanially different ratesof inquiry from those taught by teachers with less exposure to the programs.Neither were we able to distinguish different patterns of inquiry in one pro-gram as compared with another. With a few marked exceptions which will bediscussed shortly, the quality of discourse tended to stay,at elow level andthe pattern of interchange between teachers and children still more sloselyresembled an inquisition than a joint investigation or a reasonable conversation.
That we could further discount the "lack of knowledge" argument as aprimary factor seemed to be demonstrated in data from two conferences fundedby the National Science Foundation in which we had the opportunity to comparethe instruction of children as carried out by a total of 54 scientists and.
/Work described in this paper is being supported by grants from the AlcoaFoundation, International Nickel Company of Canada, Shell Companies Foundation,The Xerox Corporation, The Mary Duke Biddle Foundation, and the HebrewTechnical Institute.
In addition, a post-doctoral appointment at New York University hadpermitted the author to spend more time on investigations than would be possiblewhen carrying a normal professional load. The appointment was funded throughthe United States Office of Education.
2
science ed cators with instruction as conducted by a sample of classroom
teachers. It was clear that some factors other than knowledge differencesmust be at work because the patterns of questions and responses were remarkably
alike. To make that determination, we conceptualized the classroom as a two-
player system consisting of a teacher and the collection of students (treated
as the other player). Teachers had four kinds of verbal moves available to
them--structuring, soliciting, responding, and reacting or evaluating. In
theory, students engaging in inquiry would have the same set of moves available
,to them. By simply categorizing the sequence of moves and plotting themapproximately on a time line, the patterns of interaction could be clearly
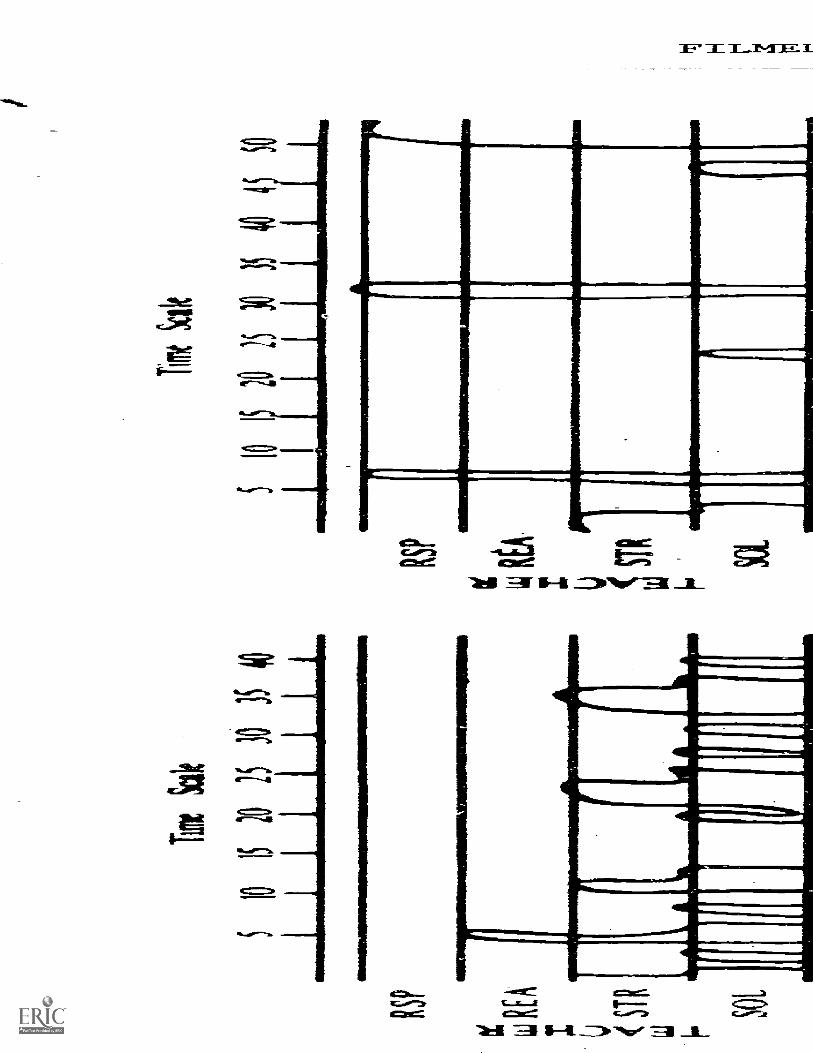
displayed. Figure I, for example, ahows what the "inquisition" looks like.
It is characterized by a rapid question-answer sequence with the solicitationcoming usually from the teacher. Figure II, on the other hand, shows what aninquiry pattern or a conversational pattern looks like. In addition, we foundthat whatever pattern the teacher exhibited when working with four childrenclosely resembled the pattern displayed when carrying on a discussion with a
whole class of children.
The fact that the appearacne of one or two graphs made from recordingsof micro-teaching sessions mirrored the form found for each teacher when work-
ing with a whole class suggested that size of groups could not be a majorfactor in determining whether an inquiry pattern would or would not develop.
Thus we are left with none of the usual remedies for improving inquiry. We
could not blame its low incidence on lack of materials, or on lack of knowledge
on program or on group size, at least net within rather broad limits.
Wait-Time
After visiting and recording examples of science instruction carriedout in classrooms located in suburban, urban, and rural areas, it finally be-came clear that while different curricula served as the vehicle of instruction,almost all of the discourse had one stable property. With the exeption of afew individuals (three in two hundred recordings) the pace of instructionwas very fast. Teachers allcwedchildren an average time of only one secondto start an answer to a question. If children did not begin a reply withinone second, teachers usually either repeated the questions or called on others
to respond. When children did respond, teachers usually waited slightly lessthan a second (average of 0.9 seconds) before commenting on the response,asking another questions or moving to a new topic.
In the few classrooms where inquiry was going on, the discourse wasmarked by the appearance in the speech of the children of speculation, con-versational sequences, alternative explanations, and arguments over the inter-pretation of data. Such classrooms differed from the others in one respect;the average wait-times seemed to be slightly in excess of three seconds. It
appeared that more of the desired inquiry behaviors occurred in classroomswhere teachers had longer wait-times.
One other observation connected with wait-time caught our attention.We asked teachers to tell us who, in their judgements, were their five best
and five worst students. When we examined the amount of wait-time given onthe average, to each group we found that the top five get nearly two secondsto answer while the bottom five get slightly less than one second (0.9 seconds).
This last small piece of inquiry alerted us to another variable, rewardfrequency, to which we had given no attention. The amount of sanctioningbehavior directed toward the two groups differed. The bottom-ranked children
3
3
actually received more overt verbal praise than the top-ranked children butit was difficult to know with certainty what was being rewarded. The topgroups received relatively less evaluative comment from their teachers butthe rewards were usually more pertinent to the responses made by the children.The bottom groups gathered both more praise as well as more negative commentbut its intent was far more ambiguous. It seemed that teachers rewarded thetop groups for correct responses but they rewarded the bottom groups for bothcorrect and incorrect responses. Presumably the intent of some of this rewardbehavior must be to encourage participation.
We guessed that a clear teacher expectation pattern develops early inthe history of each classroom. Differences in the wait-time and reward patternsadministed to children ranked at the top as compared with those at the bottomsuggest that teachers unconsciously act in such a way as to confirm theirexpectations.
So we came to focus our attention on two imput variables, wait-time andreward. This paper will focus on wait-time but it will be necessary to com-ment briefly on the possible effect of sanctions so the reader will under-stand why this variable had to be brought some what under control.
Reward
Exploration and inquiry require students to put together ideas in newways, to try out new thoughts, to take risks. For that they not only needtime but they need a sense of being safe. Sanctioning behavior, no matterhow well intended, carries with it an implicit message: "Big brother willget you if you dontt watch out." Judgement by an external source which oftenbehaves whimsically in the view of children cramps investigation.
To grow a scientific think SYSTEM takes time end a great deal of sharedexperience, free of the notion of cheating and the fear of teacher reprisalin the form of verbal pats or paddles. It is in talking about what we havedone and observed and in arguing about what we make of our experiences thatideas multiply, become refined and finally eventuate in new questions andexperiments. It is in preserving for ourselves the right to be wrong thatwe gain courage to try out new ideas, to explore more alternatives, toobjectively evaluate our own work as well as that of others. The new scienceprograms depend heavily on an intrinsic rather than an extrinsic motivationmodel. Conceptual conflict is meant to drive inquiry along just as it doesin the scientific enterprise.
Ere begin to suspect then that at least when we wanted children to engagein problem solving behavior, in contrast to skill acquisition, wait-timesshould be high and reward schedules should be reduced. High rates of reward-ing would undermine confidence and act as distractors. In addition, itmight encourage premature termination of search, a disposition to choosethe first alternative that comes to mind. Certainly it would discourrAlesharing of ideas between students since then someone else could walk off withpraise for a performance first carried out by another child.
4
Simulation Studies
In an attempt to understand something of the effects of reward andwait-time on problem solving behavior of students, two simulation studieswere undertaken. In connection with our interest in reward, F.X. Lawlorgave a problem solving task to children under circumstances that simulatedreward patterns common in classroomsaCWe group of children received overtverbal rewards on a random schedule. The random schedule comes closest tomatching what had been observed to occur in classrooms. A second group ofchildren received reward for correct responses, the pertinent reward condition.A third group of children received no overt verbal rewards as they worked.Lawlor found the problem solving efficiency of the group which received the
ambiguous reward treatment to be significantly below the performance of the
other two groups. Boys prospered in the no reward condition while girlsfared slightly better on the pertinent reward condition. Lawlor's work lentimpetus to our earlier supposition that in problem solving situations or in-quiry situations, reward may function to distract students from the task.
L. Ogunyemi carried out another simulation which had as its intent anattempt to learn something about the function of listening in discussions ofsimple physical phenomena. (2) Students brought up under a fast wait-timeschedule coupled with an ambiguous reward schedule probably do not get muchfrom listening to each other. They are trained to hear the te9cher, if theyhear anything. When students are asked to report what they cbserve, as isthe case in classroom discussions about science phenomena, those who actuallydo the talking may get some reinforcement. Does discussion benefit them orthe rest of the class members?
Ogunyemi exposed individual students to a matrix problem that involvedthe use of colored dowels of different dimensions. One treatment groupexamined the matrix but did no talking about it. In addition to whateverthey observed on their own they heard a tape recording of other studentstalking about their observations. Another treatment group , after observingthe matrix, heard a teacher and students discuss it. Members of the thirdtreatment group were encouraged to state all their observations. All threewere then given a set of tasks to do involving the matrix. Ogunyemi thoughtthat the opportunity to verbalize might improve the scores of students buthe did not find that to be the case. What he did find was what we had sus-pected, namely, that stndentswitha history of fast wait-time instructiontended to ignore information supplied by other students. (Tape recordingshad previously been made in classrooms from which Ogunyemi's subjects came.)Again males responded womwhat differently from females. The females appar-ently listened tothe teacher talk but not to the talk of other students.Males paid no attention to any source of verbalized information, if performanceon the test tasks is taken as the indicator.
Circumstantial evidence leads to the inference that conversation inwhich students build on each other's ideas cannot develop in classroomsoperated on a fast wait-time schedule.
5
Servo-chart Plots Show SeveralSpecies of Wait-Times
In micro-teaching situations we began to examine what happened whenwait-times were experimentally manipulated. Since our earlier work showedthat a group of four or more students makes a satisfactory model of thespeech patterns to be expected of whole classes, this convenient approxima-tion of the classroom discourse allowed us to gather a great deal of datafairly rapidly. Analysis of audio-and video-tapes immediately presentedanother problem to us. It became clear that our estimates of wait-timewere too high. By the time the stopwatch was punched the discourse hadmoved on. We needed to find another way to measure wait-time that wouldnot be hampered by the fact that motor responses (those necessary toactuate the clock) are very slow in comparison to mental responses.
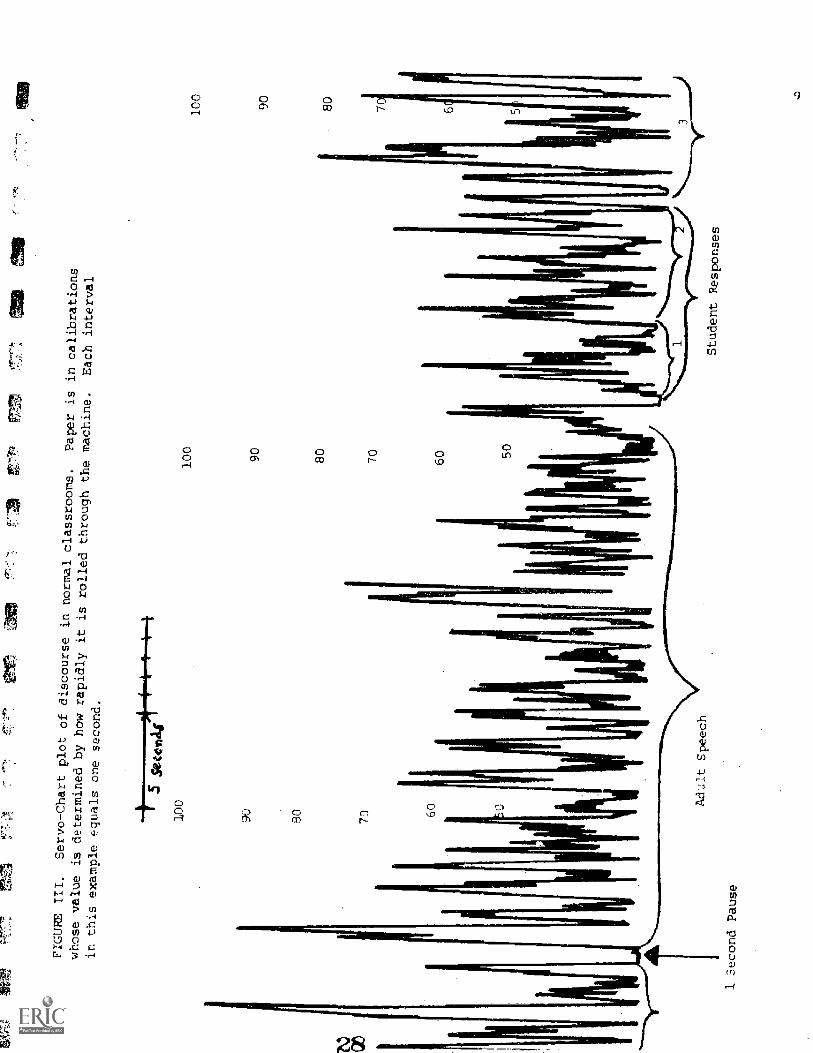
This problem was partially solved by delivering the sound into aserve-chart plotter. With a rectifier inserted between the tape recorderand the plotter, the needle could be made to track horizontally when therewere silences. The paper for the plotter is calibrated. By running thethe plotter as fast as it will go, each calibration comes to represent onesecond. As Figure III shows, the incidence of pauses as long as one secondin a classroom where the teacher is not alerted to wait-time is very small.The height of the peaks simply indicates the amplitude of sound generated.One other interesting aspectof the plots is worth noting before going on.Children generate speech at a slower rate, on the average, than teachers do.This will be reflected in the plots by the width of the curves somewhatbelow the peaks.
Close examination of the servo-chart plots explains to some degree thedynamics involved in some of the outcome variables described below.
6
Species of Wait-Time
a. The two-player model: (See figures and
Instruction was conceptualized as a game in which there are two
players. The teacher is one player and the set of students constitutes
the other player. Four kinds of moves are available to each player.
1. Structuring in which a player gives directions, states
procedures, suggests changes. e.g., "Let's put thethermometer in the ice water.
2. Soliciting in which a player asks a question. .g., "Why
do you thing that happened?"
3. Responding in which a player answers a solicitation or
responds to a structuring suggestion or builds on the
response of another player or reports data. (e.g., "When I
put the thermometer in ice water it went down to 4 degrees.")
4. Reacting in which a player evaluates statements made by other
players. It includes verbal rewards and punishments. (e.g.,
"good," "fine," "OK," "that is not right," etc.) as well asappraisal (That doesn't work the way you said because the
light is on.").
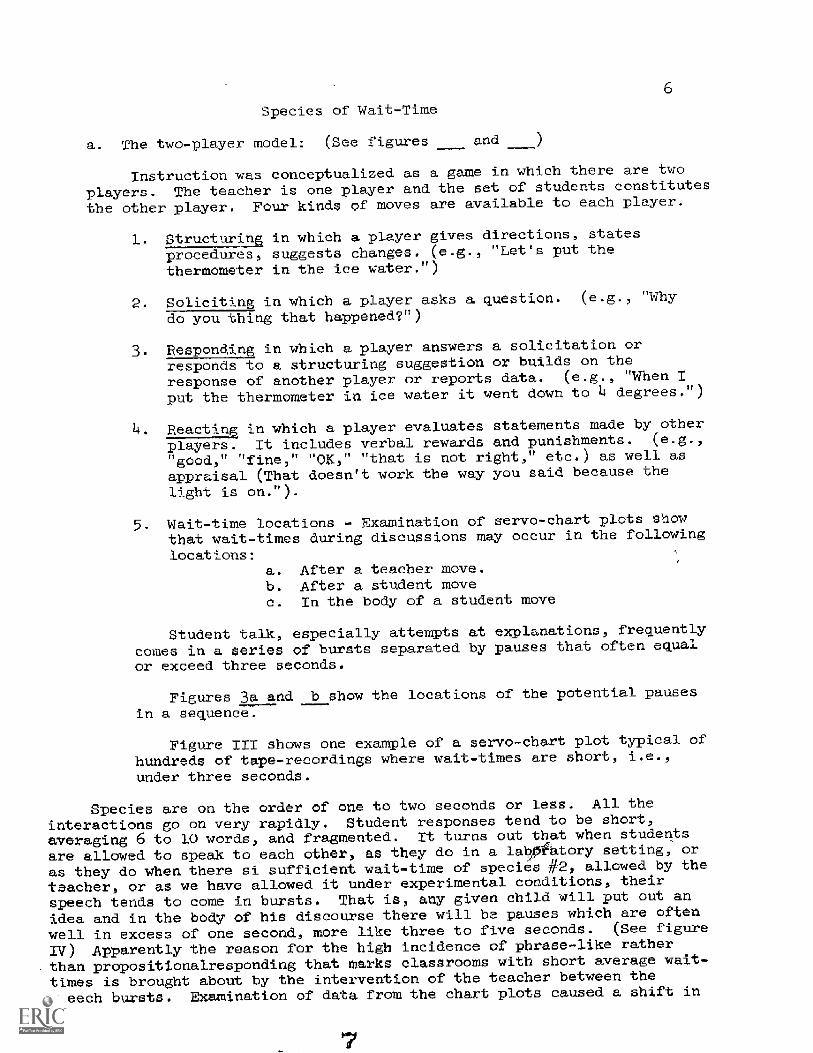
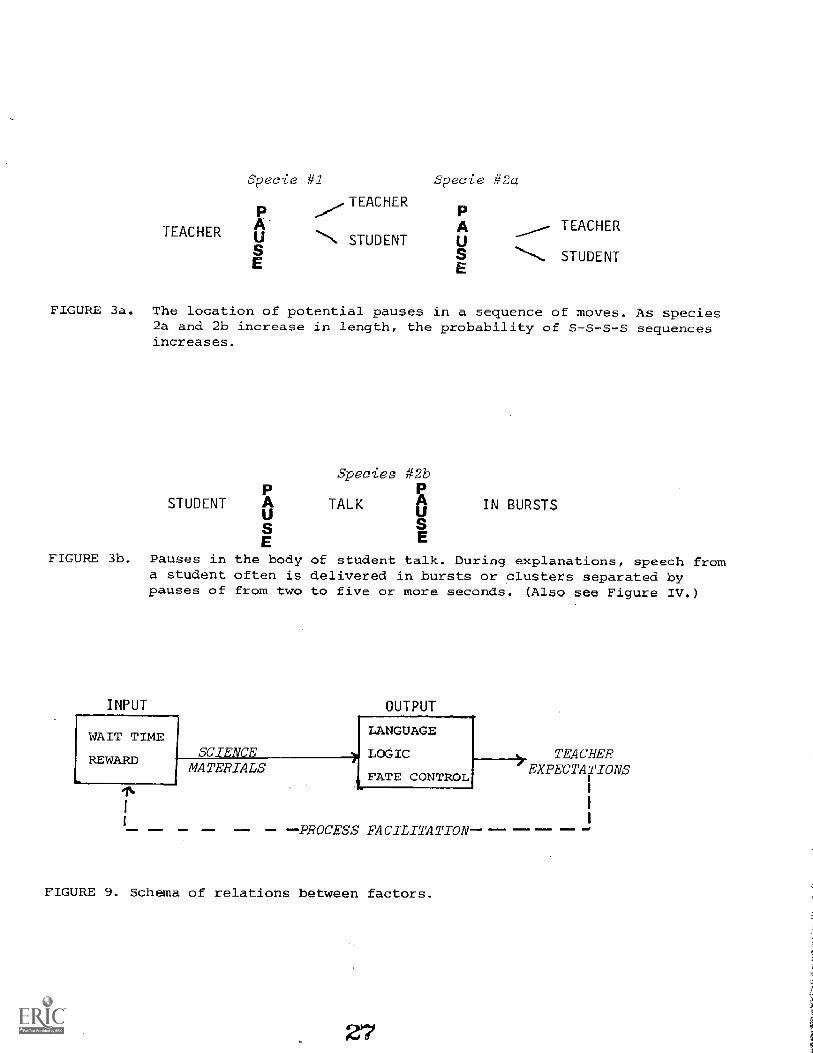
5. Wait-time locations - Examination of servo-chart plots showthat wait-times during discussions may occur in the following
locations:a. After a teacher move.b. After a student movec. In the body of a student move
Student talk, especially attempts at explanations, frequently
comes in a series of bursts separated by pauses that often equalor exceed three seconds.
Figures 3a and _b_show the locations of the potential pauses
in a sequence.
Figure III shows one example of a servo-chart plot typical of
hundreds of tape-recordings where wait-times are short, i.e.
under three seconds.
Species are on the order of one to two seconds or less. All the
interactions go on very rapidly. Student responses tend to be short,averaging 6 to 10 words, and fragmented. It turns out that when students
are allowed to speak to each other, as they do in a labOatory setting, or
as they do when there si sufficient wait-time of species #2, allowed by the
teacher, or as we have allowed it under experimental conditions, their
speech tends to come in bursts. That is, any given child will put out an
idea and in the body of his discourse there will be pauses which are often
well in excess of one second, more like three to five seconds. (See figure
IV) Apparently the reason for the high incidence of phrase-like ratherthan propositionalresponding that marks classrooms with short average wait-
times is brought about by the intervention of the teacher between the
speech bursts. Examination of data from the chart plots caused a shift in
7
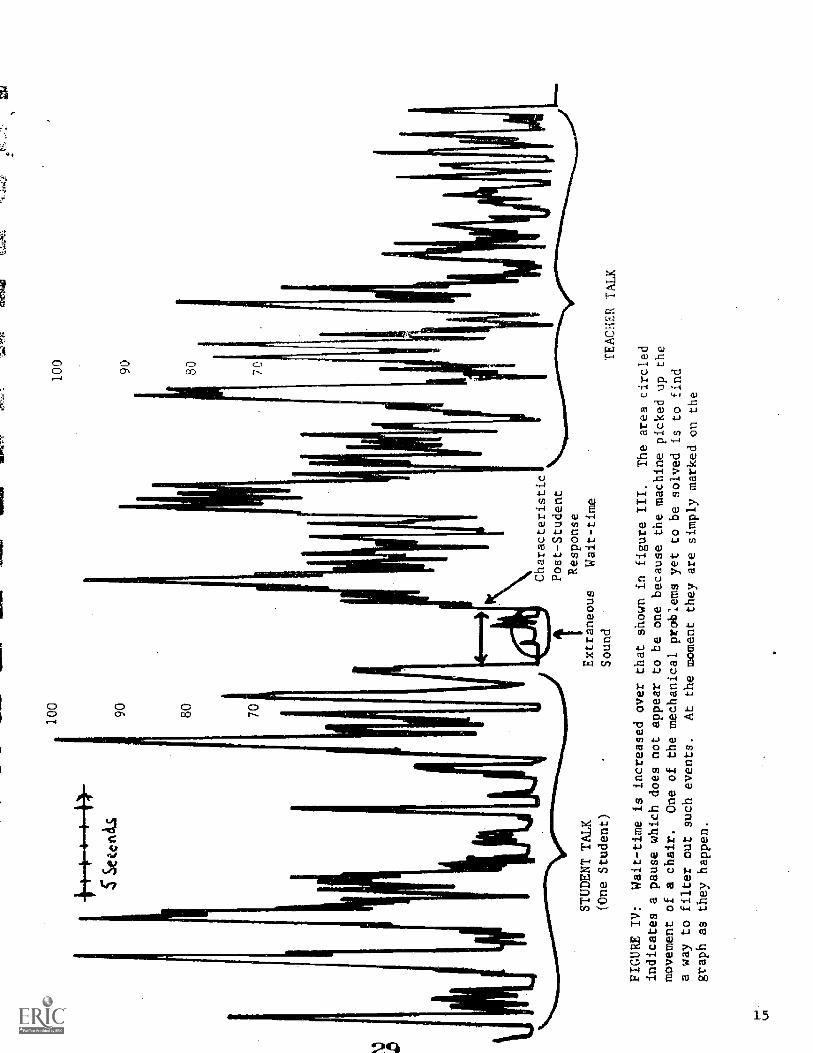
7our focus to the second wait-time the post-student response wait. Priorto the use of the servo-chart plotter we had paid most attention to thefirst species of wait-time, the amount of time teachers gave to students tobegin an answer. The chart plots showed us that the second wait-time, theone which is potentially available after a student response, might accountfor even more variance in the outcome variables. If the teacher "held on"after a speech burst, then the incidence of extended explanation and theoccurrence of alternative interpretations tended to increase. Figure rv,shows what typical speech bursts look like when delivered by a studenttrying to explain something he experienced with his science materials ifhe is left uninterupted. Mapping experience into language is an arduousprocess. Cutting off those pauses probably discourages expression andpractice of propositional thought.
When a teacher first begins to experiment with wait-time species 2,post student response is difficult to influence. The teacher tends toreact very quickly and so do students. Students call out answers. Thereare few examples of what might be called a discussion (conversation) inwhich students respond to ideas introduced by other students. (See thediscussion on training techniques.) After a time, however, this patterngradually changes and the between-student pauses increase. Figure V shouldbe contrasted with Figure III. It illustrates both the change in species 2pauses and the increase in the length of student statements. (See AppendixA for a sample of transcript which illustrates the conversational ratherthan the inquisitional mode.)
Student and Teacher Outcome Variables
In the series of investigations to be described below the followingoutcome variables became the focus of attention.
a. Student Outcome Variablim
1. The length of student responses increased. Under a fastschedule, responses tend to consist of short phrases andrarely exhibit explanation of any complexity. Data fromthe chart plots suggest that the second wait-time, when itis prolonged, contributes measurably to the appearance oflonger statements.
2. The number of unsolicited but a.proariate student responsesncreases. This outcome is more responsive to the secondhen the first wait-time, but is influenced by both.
Failures to ressond decreased. "1 don't know" or no responseswere often as high as 3 normal classrooms, i.e., inclassrooms where the mean wait-time fell at one second or less.This outcome is more susceptible to manipulation by the firstwait-time, the pause which the teacher allows before callingon anot.iler student or repeating the question. (It alsohappens to be responsive to reward incidence.)
8
4 Confidence as reflected in fewer inflected responses increased.Under a fast schedule, responses tend to be phrased as thoughthe child were saying, "Is that what you want/" In the middleof a prolonged fast sequence you can ask a child his name andit will not be unusual to have him respond with a question markin his tone. This confidence indicator, inflected responding,is also susceptible to the reward variable. As reward increasesso does the incidence of inflected responses.
5. The incidence cf speculative thinking increased. This isinfluenced by both classes of wait-times.
6. Teacher-centered show and tell decreases and student-studentcomparing Increases. Under a fast schedule and a high rewardor sanctioning schedule, children "stack up" waiting to tell theteacher. There is very little indication that they listen toeach other. This variable will not be examined in detail inthis paper since it seems to be influenced as much by thereward pattern as by the pacing.
7. More evidence followed by or preceded by inference statementsoccurred. Under a fast schedule, the incidence of qualifiedinferences is extremely low. When the second wait-time islengthened this outcome variable changes in a desired direction.
8. The number of questions asked by children increased and thenumber of experiments they proposed increased. It is a wellestablished fact from classroom interaction studies thatstudents do not ask questions very often. When they do, thequestions are usually for clarification of procedures andare rarely ever directed at other students. This outcomevariable seems to be susceptible to both classes of wait-times.
9. "Slow" student c ntributions increased. Under a fast schinidlemost responses came from a particular faction of the class.When wait-times were increased, the sources of responsebecame more varied. Interestingly, this outcome gradually(apparently) influences teacher expectations. (Although wehave not had time to investigate it in any detail yet, itseems to be both surprising and rewarding to the teachersthat students who do not usuallY respond as readily begin todo so.
b. Teacher Outcome Variables
Once wait-time is changed and the behavior is stabilized fora period, certain characteristics of teacher input variables change.They are regarded here as outcome variables because they are in-fluenced by the wait-time factor.
9
1. Teachers exhibit greater reseonse flexibility as indicated by theoccurrence of fewer discourse errors. Under a rapid schedule, thenormal situation obtaining in classrooms, the probability that adetectable discontinuit- in the discourse occurs increases.Conversation does not build into structural propositions. Insteadthe sequence of discourse resembles a smorgasbord line in whicheveryone goes along commenting on what he passes and picks up butnobody pays any attention to or gives any indication that he hasheard the comments of others. If a teaching machine asks aquestion and a student responds wial something that is not instorage, the machine either goes on to the next question as thoughnothing happened or it cycles back and repeats, sometimes withprogressive cuing. In either case a "discontinuity" is scoredagainst the discourse. Our tapes suggest that frequently theteacher on a fast schedule achieves a less favorable flexibilityscore than does a moderately good computer program. At least thecomputer program has the advantage of leaving the response timeup to the student. The flexibility score increases with increasesin wait-times. It is computed by simply counting the mismatchesbetween a student statement and a teacher response or reaction.See appendix A for an example of discourse in which there aremismatches.)
Number and kind of teacher questions changes.
a. The total number of questions decreases per a fifteen minuteinterval. Prior to wait-time training it Was not usual tofind as many as seven to ten questions asked by the teacherper minute: The mean number of questions averages betweentwo and three per minute. (Inner city rates tend to beslightly higher than suburban rates. Samples of taperecordings made in the Cumberland Mountains, in Louisianaand in North Carollne show mean rates of 2.2 questions perminute.) As wait-times increase the rate of questikaingdrops. For teachers who have achieved criterion wait-timesof three seconds or longer mean question rates tend toapproach 0.4 per minute. This follows from the fact thatstudent responses become longer; unsolicited student responsesincrease; there are more pauses between speakers as well aswithin the speech of speakers.
The net variability in teacher questions increases asteachers achieve criterion wait-times of three seconds.Figure V. shws how the pattern of questions changed fora sample of 74 teachers who achieved criterion wait-timesof three seconds or longer.
Teacher expectations for erformance of certain children seem tochange. In micro-teaching situations, we grouped children whomteachers did not know into pairs consisting of two children ratedby their school as high verbal or two rated as low verbal or wepaired one high with one low verbal. We told the teachers they hadone of these combinations and the task was to do some science andemploy a longer wait-time; then they were to judge with which kindof combination of children they were working. At the end of 20minutes they made their judgements. They tended to make the
10
following kinds of errors:
a. They rated a high and low combination as two highs;They tended bo rate two highs correctly most of the timebut occasionally rated them as a high and a low;
c. Two high verbals were occasionally (about 15% of the timeevaluated as a high and a low.
The fact that 26 teachers who identified their five best and fivepoorest students gave the best students more time to reply to questionsleads one to suspect that the relationship of wait-time to expectationsshould be investigated in more detail. At the moment all we haveaccumulated over the last five years are unsolicited comments from teacherson longer wait-time schedules that members of the bottom group perform innew and surprising ways. That teachers may modify expectations graduallyis indicated by comments about a student such as, "He has not done anythinglike that before. Maybe he has a special aptitude for science." It maybe useful to study the influence of wait-time and rewards on teacherexpectations in a more systematic way. We have not had an opprotunity,however, to discover whether the effect on expectations is general or howlong it persists. Neither do we know how it may change the real per-formance of the students rated at the bottom of the class, gtven that thepattern of responding could be sustained.
Types of Wait-Time Investigations Pursued.
Over the last six years the investigations of wait-time have beenquite varied in form as befits applied research where the primary goalis producing desirable outcomes in operating systems.
In vitro studies - The variable was identified first through regularobservations of 36 primary grade classrooms in six snhools in which theScience Curriculum Improvement Study (SCIS) was being taught. Six (+) 4-aperecordings were made in each of the rooms during the years. (A total of103 tapes) Once the fact of short wait-times, high question frequency andrewards was recognized it became a metter of interest to determine howgeneral the phenomenon was. It could be the case, after all, that some.thingabout SCIS prompted the inquisitional pattern or that the pattern wasunique to primary grades or that speech in the region of the six schools(New York and New Jersey) was always fast-paced. In the following yearwe collected 84 tapes made in classrooms scattered around the countrywhere SCIS as well as other science curricula were being taught. Wait-timestypically fel) below three seconds. A sample of 34 tapes made of fourthgrade classrooms showed mean wait-times to 1.3 seconds and only one outcomevariable to be significantly different. The mean length of student responseswas 14 rather than 8 words. Thus it seemed safe to infer that short wait-times were not localized in forst and second grade classrooms. In additionthere are accumulated a miscellaneous collection of tapes sent by teacherswho have begun to experiment on their own with the wait-time veriable. Inrecent years tapes of fourth, fifth and a few high school groups show mean
11
wait-time- to be well under 3 seconds, ranging from 1 second to 2.8seconds.
Micro-studie
11
- In order to study the influence of prolonged wait-times which did not seem to be occurring with sufficient frequency in naturalsettings a series of micro-studies was begun. These took two forms:
a. The staff worked with small groups of students, finallysettling on four as producing a reasonable facsimile ofa classroom. Here the effort was to increase wait-timesand to study the effect on the outcome variables describedearlier. Both audio and video tapes were used. Studentscame from different grade levels and the lessons wereselected from various curricula. Here the effort was toattempt to identify the relative influence of the twospecies of wait-time, the pause occurring after asolicitation and the pause following a student response. ,We attempted to manipulate these independently. Thus thesame lesson would be taught to different groups of childrenbut the sequence of treatments would be as follows.
Treatment ITreatment IITreatment IIITreatment IV
Standard Wait-timesWait-time #1 long, #2 shortWait-time #1 short, #2 longBoth wait-times long
b. A pool of six lessons were prepared. 96 teachers engaged ina series of teach-twice cycles designed to get them toproduce criterion wait-times of three secondo. They eachtaught the same four students in each cycle.
In order to minimize the i fluence of sequence of lessons, the sixlessons were grouped into three sequences. One third of the group dideach sequence. This decision would make it safer to infer that differenceson the outcome variables, if there were any, could be attributed to theinfluence of the wait-time changes. The treatment sequence went as follows:
Base line tape. No instruction on wait-times prior to taping.Play back discussion of wait-time. Portions of the tapetranscribed by the teacher.
b. Tape 2. Wait-times and outcome variables discussed.Portions of the tape transcribed by the teacher
c. Tape 3. Analyzed and techniques for getti g control of thepost-student wait-time discussed. See training suggestionsdescribed later.)
1222_21. Analyzed in the same way.
e. Tape 5. Analyzed in the same way.
12
f. Tape 6. Analyzed.
All tapes were transcribed, coded. Wait-times were measured, theoutcome variables identified and their values determined.
Return to the classroom - Twelve teachers with criterion wait-times in the teach-twice cycles were studied and given help in the
classroom. For a period of one year observations and tape recordingswere made at approximately two week intervals (once a week for thefirst four weeks and then at longer intervals). In addition fourother teachers elected to study the influence of wai;-time in their
own classes and to supply us with tapes and transcripts. A total of74 tapes were accumulated in this phase.
Analyzing Transcripts
Figure VII a and b show a typical analysis of a transcript. Inaddition, the questions woald be categorized according to two systems,
one modified from Ashner and Gallagher (3) and the system developed byT.W. Parsons (4). The primary objective was not to study questioning per se,namely as an input variable, but rather to study teacher questions as anoutcome variable. We were asking whether the pattern of question askingspontaneously changes as a result of increases in wait-time.
The Aschner and Gallagher categories were five in number:
1. Routine questions concerning procedures and structuring of
discussion.
2. Cognitive memory questions
3. Convergent questions requiring the analysis and integrationof given or remembered data.
4. Evaluative questions.
5. Divergent questions.
The Parsons' categories used were the following:
1. Rhetorical questions2. Information questions3. Leading questions4. Probing questions
The latter categories proved more useful since they could be identifiedmore easily by teachers and coding required less interpretation of intent.(Intercoder agreement for Ashner and Gallagher varied from 7 to 84%. For
Parsons system agreement varied from 76% to 94%.)
13

13-13-
Computation of Mean Wait7Time
As Figures 3a and b show' pauses can occur in three locations. Wait-
times for each of these locations were recorded separately. The sum of
seconds for each species of pause was divided hy the total number of occurrences
for that species. This has the effect ofwaighting each category according
to its frequency of occurrence. The overall mean wait-time was then computed
from these means.
The studies summarized in this paper as well as the one reported byGarigliano show mean wait-times prior to training to be on the order of one
to two seconds. Garigliano did not succeed in getting any of the people in
his training group to criterion of three seconds or longer. However, his
work verifies that most of the outcome variables are as described for wait-
times which are short.
Values of the outcome variables begin to shift in a favorable direction
once mean wait-times equal or exceed three seconds. (See, for example, Table
I ) Classes which are maintained on criterion for prolonged periods gradually
change in a number of characteristics. Figure VIII shows the kinds of shiftstypical of the 12 classes for which recordings were made over a period of 18
to 21 weeks. It should be noted, however, that in the second or third week
there is a tendency for teachers to regress on wait-time. Apparently agradual 'role shift occurs for both teachers and students. During this adjust-ment stage teachers will complain that they can no longer decide when to
intervene. Once through this period, however, criterion times are generally
sustained. Figure IX illustrates the set of inter-dependent relationships
which seem to be involved. This model requires considerably more long terminvestigation. At the moment it serves to retind us that we are discussinga system which gradually changes over time on a number of dimensions.
SOme Related Variables In Needof Further Research
.
1-The model which is governing the research is shown in Figure IX. It
includes input and output variables.
1. Process Facilitation
This phase of our work is not much developed. In response to the changeddynamics in classrooms where teachers are working under schedules of lowrewards and extended wait-times, role relationschange. Certain kinds ofdecisions that formerTy belonged exclusively to the teacher shift gradually
to the children. They now face the problem of getting the resources intheir groups available, i.e., getting all the ideas out and evaluated. More
organizational problems and interdependence stresses develop. The presence
of science phenomena that provoke controversy creates a situation which isnearly ideal for teaching children how to maximize group productivity. We
are operating on a model of science as an argument driven enterprise.)
H. Wiethake has collected data for two years on samples of trained and
untrained children. That work is still in progress but even in this prelim-inary stage of development, the data from Wiethake's tape recordings in
AAAS-SAPA classrooms suggest a highly facilitative function is being served
14
by process training. As a part of this stage of research, somc work should
be done concerning direct training of students to take time both to frame
replies and to hear other student. (For example, a preliminary indicatorof the effect of such training is the frequency of interuptions.)
2. Fate Control
We are postulating a relationship between the factors of wait-time, re-ward, process facilitation and an outcome variable called "fate control".Fate control is defined as the belief that events that happen to you or that
may happen to you are in some measure under your own control. Things youdo now have some consequence for how things will be at another point in
time which is not yet reached. To do that kind of believing requires someview about the nature of the world. A capricious world acts against thedevelopment of that belief. The scientist, for example, cannot tolerate atotally whimsical world. If the world were capricious, Prediction would beimpossible. When prediction is impossible planning becomes irrelevant.
For very young children the world is essentially whimsical. They do
not see much connection between today's events and those that happened on
some yesterday. To predict tomorrow's events with some kind of confidenceis out of the question. Magic and the gods (the latter may include anyauthority figure) govern their world. A modern technological society couldnever develop nor could it survive by operating under such a conception.
The conception of a chance, whimsical, potentially uncontrollable worldeventually brings humans to the point of abdication from all attempts to
cope or to change conditions around them. Planning becomes irrelevant sinceplans depend on some continuity between events and there is none under the
"craps" model of the world. Think of fate control es a variable whosevalue depends on where in a continuum you stand. Suppose there are two kinds
of people in the world, craps shooters and bowlers. The craps shooter livestotally in the present. If his luck is good he is happy and he feels "blessed".
But the outcome of the game, given that the dice are honest, had nothing to
do with him. When he shakes and rolls his fate rides on the dice. His
future is left entirely to chance.
The bowler, on the other hand, knows that there is some indeterminacywhen he throws the ball but he also knows that according to how he analyzesthe situation and acts, he can increase the probability of a favorable out-
come. He can discover ways to improve his score. In fact, when the ballleaves his hand, in contrast to the situatuion with the craps player, itcArries a kind of "message" out into the environment from the player. Theboialer stands relatively higher on fate control than does the craps shooter.
He can dream of what might be and then begin to move toward it. But the
craps shooter must live forever with what is. Childrenwho grow up underthe craps model often arrive at the age of work unequipped to operateeffectively as producers or consumers. From the work of Rotter, Lefcourtand others it appears that two people of comparable intelligence who standat different positions on a fate control measure behave differently inproblematical situations. The bowlers are more aggressive about collectinginformation and more insistent on exploring solutions than are the crapsplayers. Bdwlers act as though there is a way out. Craps shooters act asif there is no way out.
15-1
It is a matter of some interest, then, to see what in the schoolenvironment contributes to the development of children who believe andact as though their fates were, at least in some measure, under their owncontrol. At the moment our speculation can be summed up in the followingway:
In the presence of stimulating science materials, a low incidence ofovert verbal rewards during inquiry sessions, protracted wait-times, andwith some facilitation training, children who are craps shooters can becomebowlers. At least that is an hypothesis worth evaluating.
The pertinence of the low reward schedule to the fate control variableshould be obvious. If the usual classroom sanctioning behavior is bothintense and whimsical, then the situation encouragas craps. If wait-timesare short rather than long, the sense of powerlessnass that marks the crapsshooter will be enhanced. Protracted wait-times, low overt verbal rewardsand process facilitation training encourage development of bowlers. It ishoped that other researchers will join us in finding ways to operationalizethe fate control variable.
3. Personality Variable
There has been some suggestion that a personality variable may beinvolved in the wait-tim shift. One might postulate that persons scoringhigh on a dogmatism scale would tend to exhibit shorter wait-times.
Summary
Figure IX illustrates the set of relationships postulated in this paper.Three input conditions, wait-time, reward, process facilitation influencethe values of three output conditions, language, logic, fate control. Thechanged values of the output conditions, in turn, alter teacher expectations.As teacher expectations change the input conditions take on new values. Sothe system is potentially dynamic. This paper has focused primarily on theinfluence of the wait-time variable on nine outcome variables.
16
BIBLIOGRAPHY
Borg, Walter. "The Minicourse as a Vehicle for Changing Behavior,The Research Evidence," Fax West Laboratory for Educational
Research and Development, 1969. (Borg worked with olderstudents hut found pauses to be below a 3-second criterion.)
Garigliano, L.J. The Relation of Wait-Time to Student Behaviors
Science Curriculum Improvement Study Lessons, Uhpublished
Ed.D. dissertation, Teachers College, Columbia University,
New York, 1972.
Kondo Alan K. "A Stuay of the Questioning Behavior of Teachersin the Science Curriculum Improvement Study Teaching the
Unit on Material Objects." Unpublished Ed.D. dissertation,Teachers College, ColuMbla University, New York, 1968.
Lawlor, Francis X. "The Effects of Verbal Reward on the Behaviorof Children in the Primary Grades at a Cognitive Task Typical
of the New Elementary Science Curricula." Journal of Research
in Science Teaching, Vol. 7, No. 4 1970, pp. 327-340.
Lefcourt, Herbert, "Internal Versus External Control of Reinforcement:
A Review. Psychological Bulletin, Vol. 65, No. 4, pp. 206-220,
1966.
Ogunyemi, Ebenezer 0. "The Effects of Different Sources of VerbalizedInformation on Performance at a Science-Related Cognitive Task."
Unpublished doctoral dissertation, Teachers College, Columbia
University, 1970.
Parsons, Theodore W. Guided Self-Analysis System for ProfessionalDevelopment Education Series. 2140 Shattuck Ave., Berkeley,
California, 1971.
Rotter, Julian B. "Generalized Expectancies for Internal VersusExternal Control of Reinforcement." Psychological Monographs:
General and Applied. Whole No. 609, Vol. 80, No. 1, 1966.
Wiethake, Henry. The Use of Group Dynamics Training to FosterVerbal Interaction in the Elementary Science Classroom.Paper presented at the National Science Teacher AssociationAnnual meeting, Washington, D.C., 1971.
17
17
For descriptions of classroom interaction instruments referred to,see Volumes A and B of the Classroom Interaction NewsletterMirrors for Behavior II: An Anthology of ObservationInstruments, edited by Anita Simon and E. Gil Boyer, Spring,1970. Published by Research for Better Schools, 1700 MarketStreet, Philadelphia, Pennsylvania 19103.
A cknowledvnent s
Much credit is due to Dr. Francis X. Lawlorwho has taken part in these studies since theirinception. Graduate assistants and classi.00mteachers wl:o participated must also be credited.This kind of research is something done withpeople, not something done to them.
18
18
APPENDIX A
Some Training Techniques
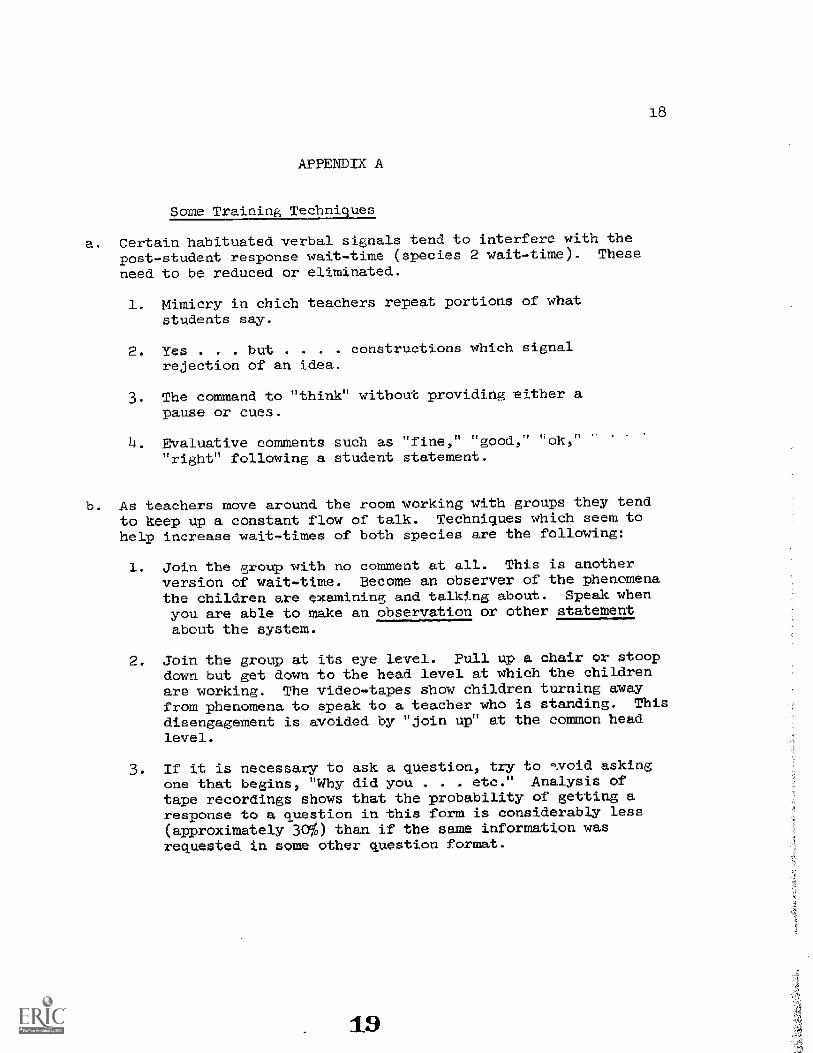
Certain habituated verbal signals tend to interfere with thepost-student response wait-time (species 2 wait-time ). These
need to be reduced or eliminated.
1. Mimicry in chich teachers repeat portions of whatstudents say.
2. Yes . . but . . . . constructions which signalrejection of an idea.
The command to "think" without providing either apause or cues.
Evaluative comments such as "fine," "good," "ok,""right" following a student statement.
b. As teachers move around the room working with groups they tend
to keep up a constant flow of talk. Techniques which seem tohelp increase wait-times of both species are the following:
1. Join the group with no comment at all. This is anotherversion of wait-time. Become an observer of the phenomenathe children are examining and talking about. Speak whenyou are able to make an observation or other statementabout the system.
Join the group at its eye level. Pull up a chair or stoopdown but get down to the head level at which the childrenare working. The video-tapes show children turning awayfrom phenomena to speak to a teacher who is standing. Thisdisengagement is avoided by "join up" at the common headlevel.
3. If it is necessary to ask a question, try to ',,void asking
one that begins, "Why did you . . . etc." Analysis oftape recordings shows that the probability of getting aresponse to a question in this form is considerably less(approximately 30%) than if the same information wasrequested in some other question format.
19

4. Lose eye contact. At first children try to mediate theirarguments through the teacher. The flow of discoursedirectly from one child to another increases when theteacher loses eye contact with the speakers.
5. Make most comments, especially in the early stages ofhelping children to work collaboratively, on processesyou observe going on between them. This processfacilitation function need not be served exclusively bythe teacher. The children can learn to provide the sameservice to their own work groups.
One of the process facilitation techniques has a close analog withskills being taught in the science program. It has two or three state-ments in it, depending on conditions. The speaker says:
"I observe
"I infer
"I feel
X." Where X is any statement that he can makeabout the group, e.g., "I observe that some-one interrupted Gregory every time be spoke."
Where Y is an inference based on the obser-vation X, e.g., "I infer that you are not in-terested in what be has to say."
Z." Where Z is a statement about how the observa-tion-inference feels to you. "I feel you aremissing some good ideas."
Some simple group skills training for children, seems to encourageproductive discourse.
c. Support for the change. At about the end of the second orthird week, teachers experimenting with wait-times appearto go through a period of frustrating indecision. Theycannot decide when to intervene. If they do not receiveencouragement in this interval their mean wait-times tendto dip back to pre-criterion values. 4
20
05P
0,51
Ct
C1(
;11)ixlbq
CI
1)1ci
015
Fi
0R
EA
z ILL'
ijso
t.
STR
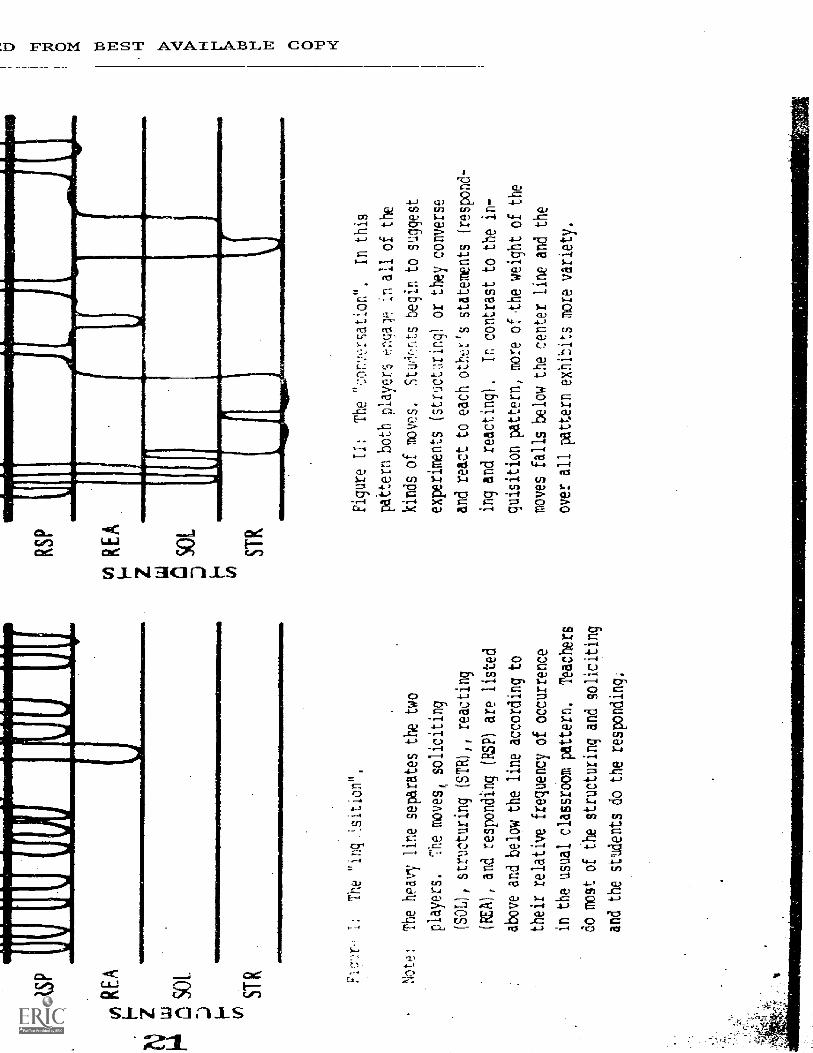
The
"in
git ion"
Notel
The heavy line separates the two
players.
The moves
soliciting
(SOL), structuring (STR) reacting
(REA), and responding (RSP) are listed
above and below the line according to
their relative frequency of
occurrence
in the usual classroom pattern.
Teachers
do most of the structuring and soliciting
and the students do the responding.
Figure II:
The ":uwrsation",
In this
pattern, both players engale in all of the
kinds of moves. Stuts begin to suggest
experiments (stulcUring) or they
converse
and react, to each othr's statements (respond-
ing and reacting),
in contrast to the in-
quisition, pattern, more of the weight of the
moves falls below the, center line and the
over all pattern exh. its more variety.
FILMED FROM BEST AVAILABLE COPY
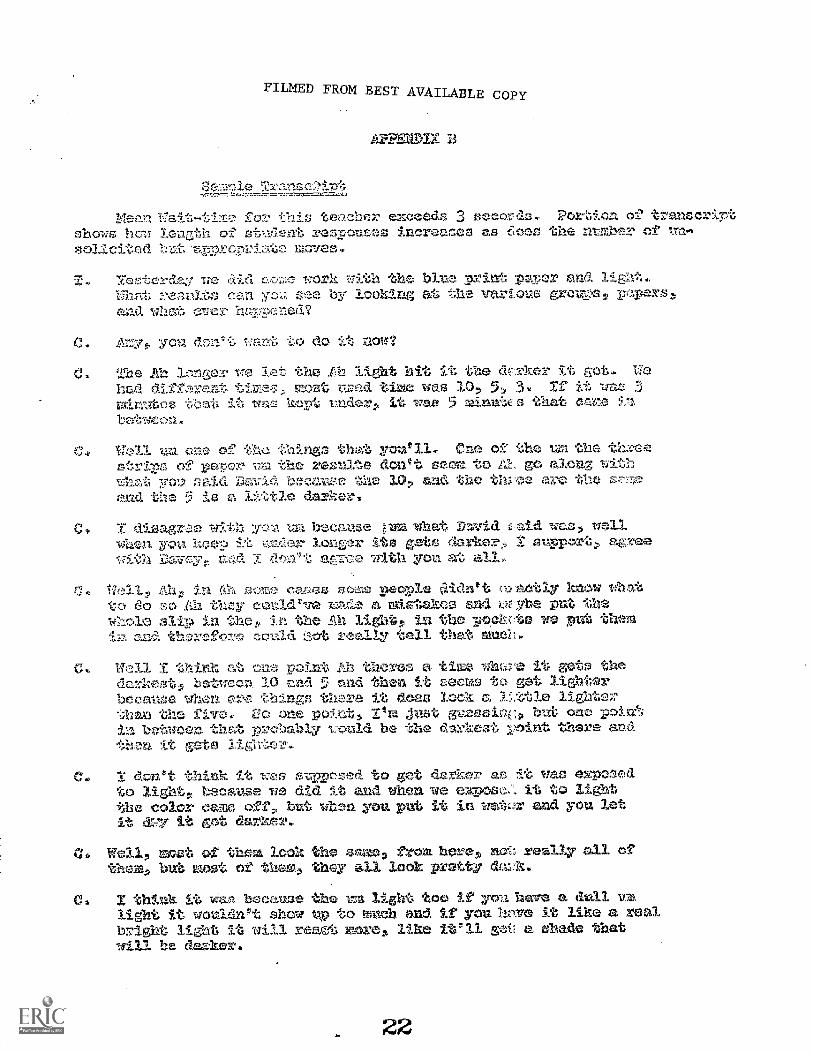
NNIn TZalt-ti:Te fo,-, thin teaaber exceeds 3 e2o Pori-tion of tremserirt11C7 Ug.i DI 2iñ 7-'eStdCafg';S increvzes as triof.7,,r, the- melfoer of
801.1cited t arforeirroiate.
Yesterday we did cv-.7,e the Wale print pansr anaUhFtt reaullt,s ca,u yo,;. see by looking at the varioua greuys papars:and whnt ever- hapmeed?
C. Ar,y. yo w. d;..7,ntt want to do it noin
tale All 1z:19.--1.1-0. let the Lb light hit it the drker it got. Wehad digTeFozt tiuie, moat u131'.1d tive was 5, 3. Xf it was 3raintes tbat it wl.w; kept mder, it -marl 5 mialkace that caubetween.
C4 Nell nu one of the tb.ings th cU (Ina o the 111he throestt-ths of patep Ina tho r010.743:::'r0 dont sectz to go alca:z with
naid Da71:14 incallze the 10, and the th:=.0e are the an:7,eaud tIle 5 is s
C t disagr:.,e with In because Inut nhat Dmrid [aid was wellwben you hee9 i7:2;Ider longer dts gabs darke.72.; I support.> agreewith Daveyr 1ZriT:1 {1f7-n11,-,, afe with you at all,
i7Il Ahr In 4h some caaes so-me people ctidzet aotLy know ubatto do ao Ah thsy eet7id've kTe,de a Akietakeo and rg.yhe put thew2acle 3tL i thet, in the Slt? light!, in no ppakz-tt3 -.4e. put them
aza therafaI'e conld rea.11y tell that much.
Well :r. tkark f CI1 :1 peint .A13 theres a tir,,e whtr.zei it gets theclarl;eatff, between 10 and 5 and then it 2eCri9 1.10 gat light.boosasie *alum are thingE thrre it does 3.00k 15.tt1e nghtez.than the five. Va one poj.z-Ltl. rrd ;just go213s1 ncg. but onz.1in between. that 3D2e7...)ably t-Quid be the daxtezt 0.1..ye6 there andtilen gets li,glitor.
C. derft think It T:Os anyeezed to get dsrker as it was exposedto lightv beastize we did it wad. when we expose_ it to lightthe co1or cam off, but ulifn you put it in watir arad you letit trz-7 it got darker.
Wi, nor.,t of them lcok the wacra from heye., re0_ly all oftinTraz:, btrh most of thaw:s they' all look pretty
0. I think it wan bocauue th e. zza lizht too if you hare a dull vz,light it woule...n't shcw up to nazb and if you .11ZWO it like a :realbright light it will react. more:, like it'll gt--3;ii a shade that
daz'kere
22
FILMED FROM BEST AVAILABLE COPY
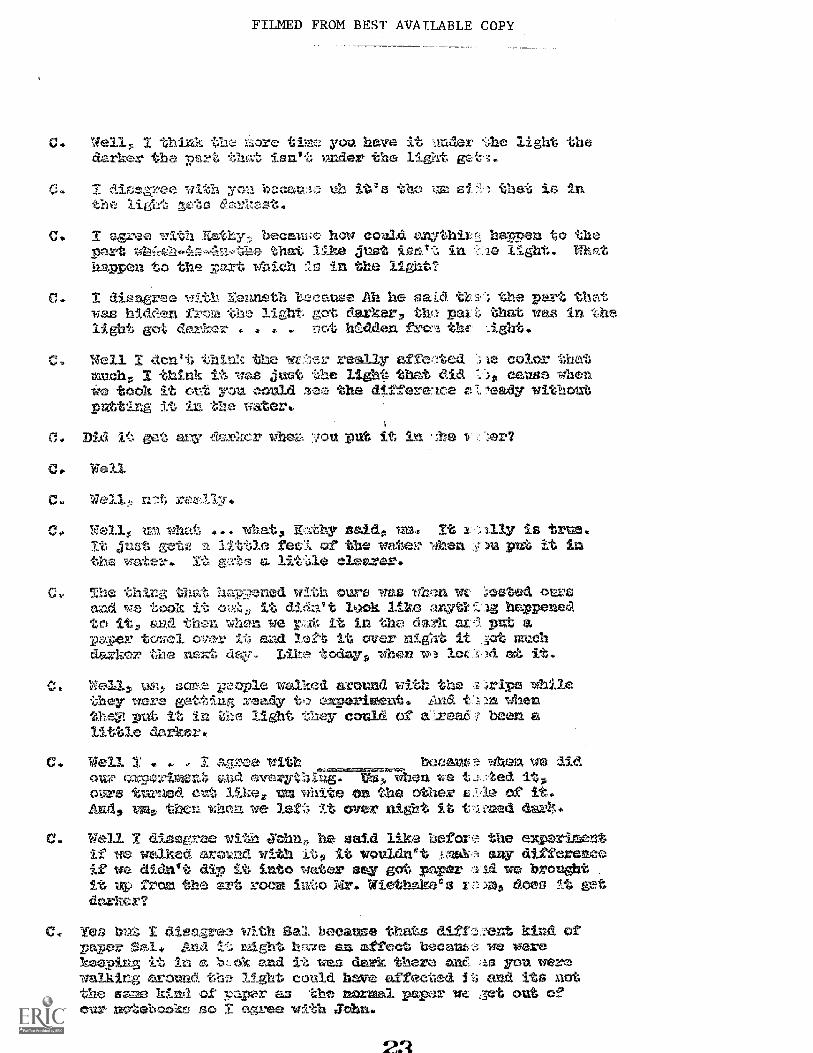
C. Well, Xth ink -iore time you have it ,Andor the light thedarker the part, tho.t isn't vnder the light get3.
c T dicsgTec with you hecaoi uh it'the liat gets
the si that i6 in
et Yes
C. I agree. with ICathy!, becsw4e how could anythiLap;=),zt that like just isn"',1 inhappen to the Ilaxt which :To in the light?
disagree wit!...; Ne3Lneth t*cause Ah he sai.d. t.Was hideLen from the light got darker, thf.: paKi;light got darkor riot le.daen fraithc
Well I don't thin!:: the !ri'rer really afge;e6e1msoh I think it Wa8 just the lighl= that did
took it out you could zoo the dtfferelceputting it 1.11. the vater.
to thela light. What
the part thc.tthat was In "che_ight.
le color thatcause when
vady without
Dia it act auTy drarkcr whola :?-ou put it in
Well
Well n7lt re11-7,1y.
1711-1iha ... whet, .T.t.Ithy said, mat ItIt just get2 little fetl of the wate l? whenthe water.. ts4.,s a litUe clearer.
C thixg thct hap?ned with ours was whf.ultmmad we took it it didn't Zook like anwti.to it, and th.en when we p!rit it in tho da2,k mr,3
emd Ieft it over night it .
darker the neIrt dfiw,. Like today, whem 14,11
C e1I um, sera people walked around ulth the 2they were gettIng ready t experiment. And 1;thea: put it in tl'.e light t'aey could of a .reee:little darker.
Weil agxce with bocarts.i:
c,nd everzr2..ng. M when t.Te 1.1.?
ours turned tat like, white on the otherAnd, lam, then v:hen we let;:, It over night it
C. Wall 1 diseuree with John, he said like hefor,if we walked ermad with it, it woulchtvtif we didn't dip it into water say got paperit up from the art room inoldr. Wieth4...kesdarker?
311y is tru:s.m put it im
.;ested oursheppenea
put a;et =ehNi at it.
;rips whilewhen
been a
whenHwe lid7ted ,Ac? or it.
imed da0r,.
the experimentany difference4wo broughtAn, does :1:t get
br T diss.,-=ree with Sal because thats dierent kind ofpaper 9a1. And it Eight hve am affect becaut:; we werekeeping it In a hLok and it viv.s dark thero ane, :Is you werewalking around the light could have affeetedii.; and tts notthe s7,77e kInd of 7,)per as the normal papor-uz :3et out ofcur notetscoko so I agree with Jbha.
FILMED FROM BEST AVAILABLE COPY
waa 1. 4' =,k:taka5
vho"I:4;5'f -0-aex-aw ;.,,Alk3 .:-:ont:5,701nv
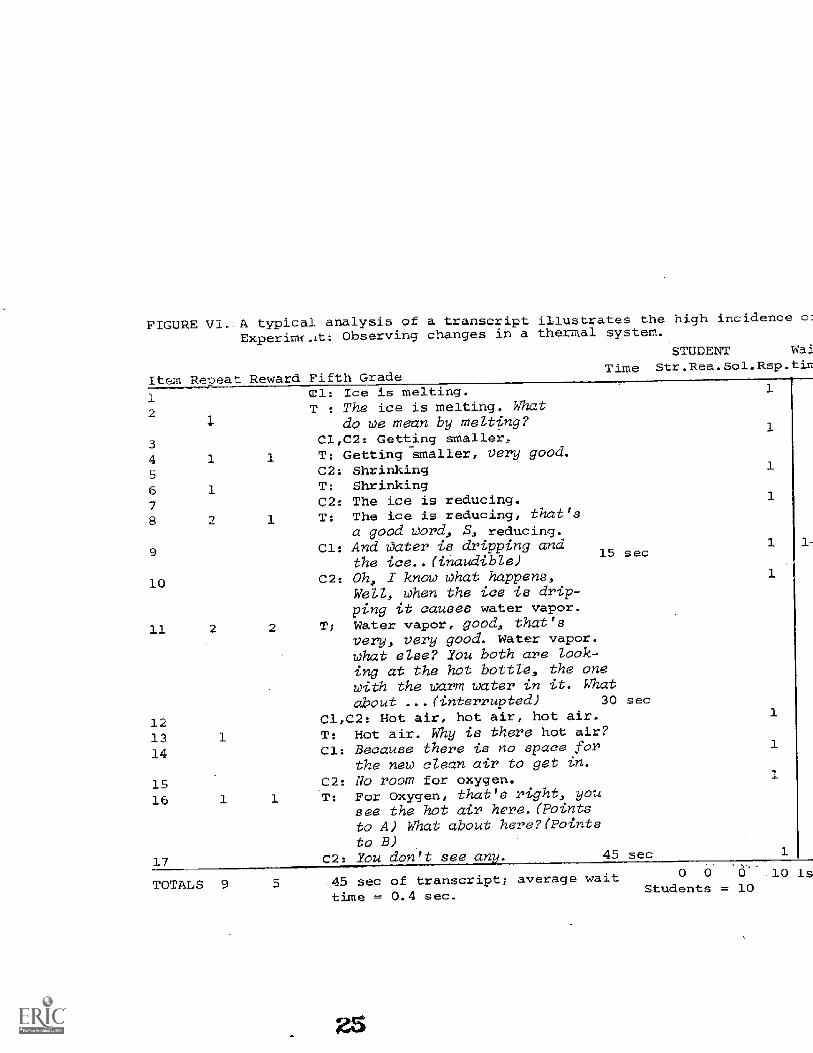
FIGURE VI. A typical analysis of a transcript illustrates the high incidence co:Experime.it: Observing changes in a thermal system.
Itcm Re,)eat
1Cl: Ice is melting.
2 T : The ice is melting. What1 do we mean by melting?
3 Cl,C2: Getting smaller,
4 1 1 T: Getting smaller, very good.
5 C2: Shrinking
6 T: Shrinking
7 C2: The ice is reducing.
1 T: The ice is reducing, that'sa good word, S, reducing.
9 Cl: And Oater is dripping andthe ice..(inaudible)
15 sec
10 C2: Oh, 1 know what happens,Well, when the ice is drip-ping it causes water vapor.
11 2 2 Water vapor, good, that'svery, very good. Water vapor.what else? You both are look-ing at the hot bottte, the onewith the warm water in it. Whatabout ...(interrupted) 30 sec
12 Cl,C2: Hot air, hot air, hot air. 1
13 1 T: Hot air. Why is there hot air?
14 Cl: Because there is no space forthe new clean air to get in.
15 C2: No room for oxygen. 1
16 1 1 T; For Oxygen, that's right, yousee the hot air here.(Pcintsto A) What about here?(Pointsto B)
17 C2: You don't see an 45 sec
eward Fifth ade
STUDENT Wai
Time S r.Rea.sol.Rs .tim
1-
TOTALS 9 .45 sec of transcript; average waittime = 0.4 sec.
0 0 0 10 lsStudents = 10
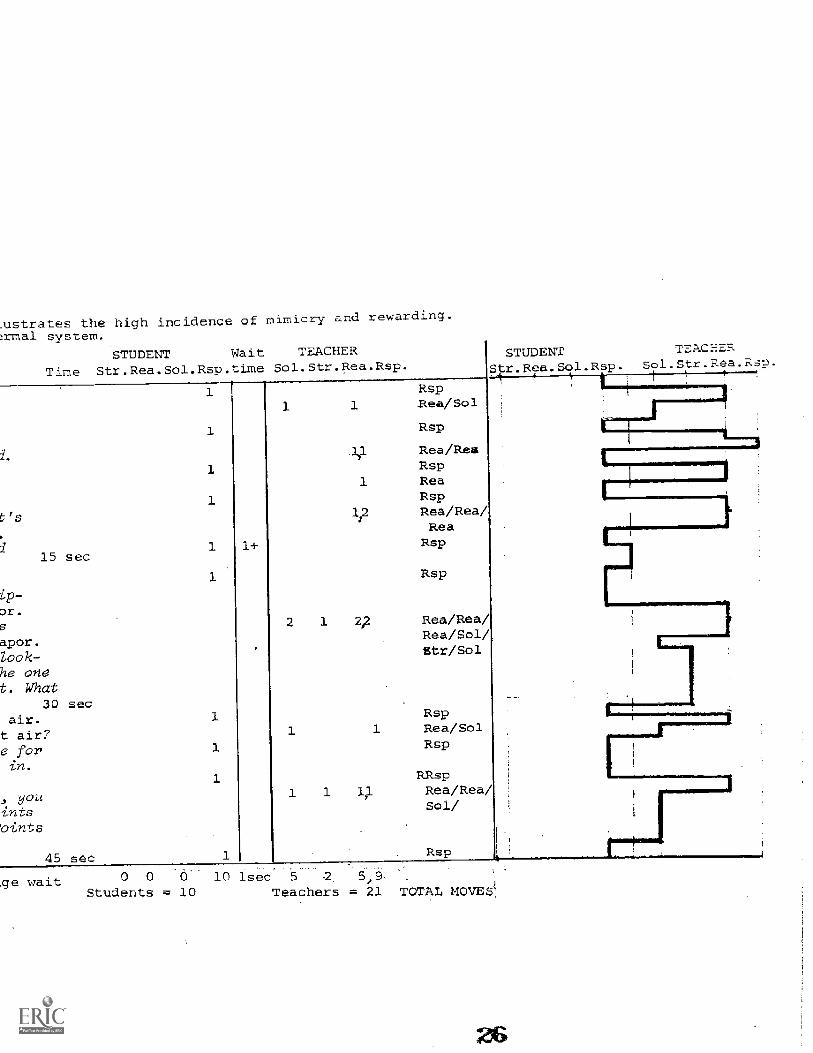
ustrates the high incidence of mimicry and rewarding.
1.7-ma1 system.
STUDENT Wait TEACHER
Time Str.Rea.Sol.Rsp.time S01.Str.Rea.Rsp.
15 sec
ip-or .
apor.look-he onet. What
30 secair.t air?e for
n.
, youints'ointa
1
1
1
1
1
1
1
102
RspRea/Sol
Rsp
Rea/ReaRspReaRspRea/Rea/ReaRsp
Rsp
212 Rea/Rea/Rea/Sol/!Mr/Sol
Rsp1 Rea/Sol
Rsp
STUDENTt .Rea.Sol.Rs
TEACY_ER1.Str.Rea.
RRsn1 Rea/Rea/
Sol/
45 sec R:
10 lseo 5 2.
Teachers = 21 TOTAL MOVE&.ge wait 0 0
Students = 10
TEACHER
Specie #1 Specie
TEACHERP ----- PA A TEACHER
---------STUDENT
STUDENT
FIGURE 3a. The location of potential pauses in a sequence of moves. As species2a and 2b increase in length, the probability of S-S-S-S sequencesincreases.
STUDENT A
Species #2b
TALK IN BURSTS
FIGURE 3b. Pauses in the body of student talk. Daring explanations, speech froma student often is delivered in bursts or clusters separated bypauses of from two to five or more seconds. (Also see Figure IV.)
INPUT
IWAIT TIME
REWARD SCIENOMATERIALS
OUTPUT
LANGUAGE
_1 LOGIC
FATE CONTROL
PROCESS FACILITATION
FIGURE 9. Schema of relations between factors.
27
TEACHEREXPECTATIONS
EIM
FIGURE ru.
Servo-Chart plot of discourse
in normal. classrooms.
Paper is in calibrations
whose value is determined
by how rapidly it is rolled
through the machine.
Each interval
ih this example, equals
one second.
100
5se
cona
il
1 Second Pause
100
90
80
70
60
Student Responses
100
90
..11
11M
it....
0
STUDENT TALK
(Ont. Studtnt)
Etraneous
Sound
100 90
airM
10
Characteristic
Post-Student
Response
Wait-time
TEACHER TALK
FIGURE IV:
Wait-time is increased over that shown in
figure III.
The area circled
indicates a pause which does
not appear to be one because the machine picked
up the
movement of a chair.
One of the, mechanical problems yet to be solved
is to find
a. way to filter out such events.
At the moment they are simply marked
on the
graph as they happen.
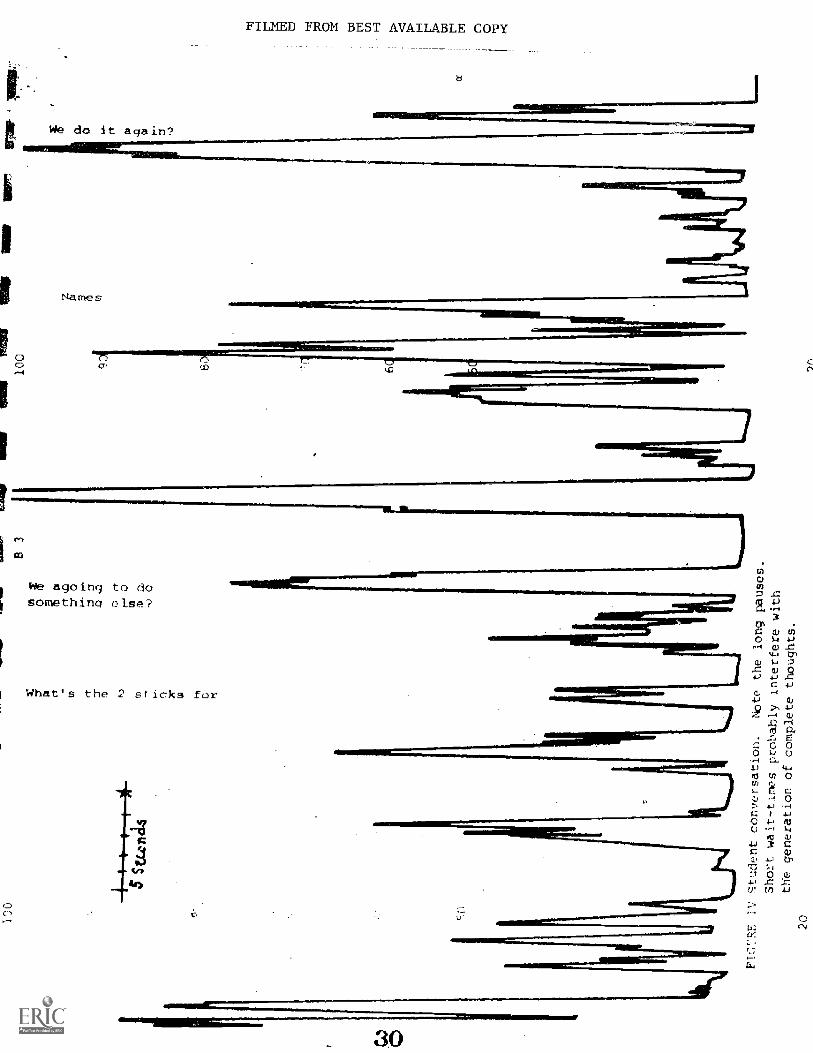
F=RE IV ;:t-udz.nt cOnversation..
Note the long
pauses,.
Short wait-times
prol,ably Interfere with
the generation: of complete
thoughts-
20
=mg
mmom
REMI
IMIP
WIME
mem
z
?ft
100
90
80
70
60
50
40
30
20
10
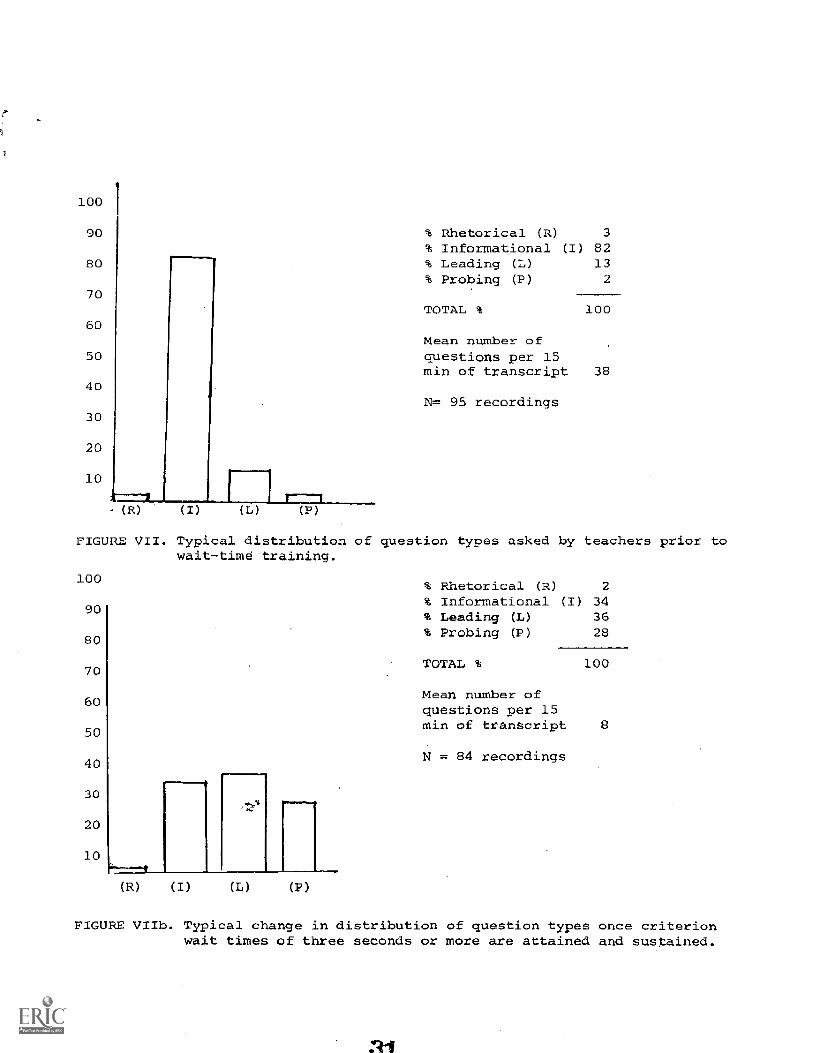
% Rhetorical (R) 3
% Informational (I) 82% Leading (L) 13
% Probing (P) 2
TOTAL % 100
Mean number ofquestions per 15min of transcript 38
N= 95 recordings
FIGURE VII. Typical distribution of question types asked by teachers prior towait-timd-training.
100
90
80
70
50
40
30
20
10
% Rhetorical (R) 2
% Informational (I) 34% Leading (L) 36% Probing (P) 28
TOTAL % 100
Mean number ofquestions per 15min of transcript
N = 84 recordings
FIGURE VIIb. Typical change in distribution of ques ion types once criterionwait times of three seconds or more are attained and sustained.
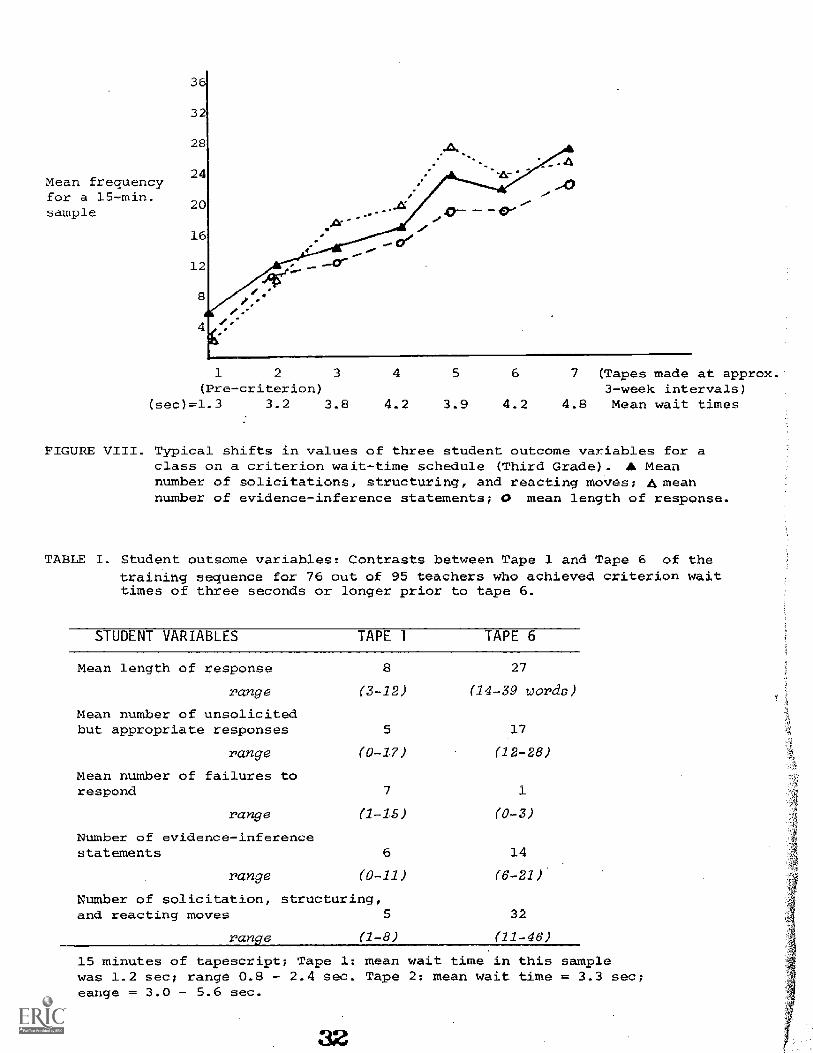
Mean frequencyfor a 15-min.sample
1 2
(Pre-criterion)(sec)=1.3 3.2 3.8
4 5 6 7 (Tapes made at approx.3-week intervals)
4.2 3.9 4.2 4.8 Mean wait times
FIGURE VIII. Typical shifts in values of three student outcome variables for aclass on a criterion wait-time schedule (Third Grade). A Meannumber of solicitations, structuring, and reacting moVes; Ameannumber of evidence-inference statements; 0 mean length of response.
TABLE I. Student outsome variables: Contrasts between Tape 1 and Tape 6 of thetraining sequence for 76 out of 95 teachers who achieved criterion waittimes of three seconds or longer prior to tape 6.
STUDENT VARIABLES
Mean length of response
range
Mean number of unsolicitedbut appropriate responses
TAPE 1
8
(3-12)
5
TAPE 6
range (0-17)
Mean number of failures torespond 7
range (1-15)
Number of evidence-inferencestatements 6
range (0-11)
27
(14-39 words)
17
(12-28)
1
(0-3)
14
(6-21)
Number of solicitation, structuring,and reacting moves 5 32
range (1-8) (11-48)
15 minutes of tapescript; Tape 1: mean wait time in this samplewas 1.2 sec; range 0.8 - 2.4 sec. Tape 2: mean wait time = 3.3 sec;eange = 3.0 - 5.6 sec.


![7 Billy Budd [12]](https://img.pdfslide.net/doc/110x75/577d39c21a28ab3a6b9a7a1c/7-billy-budd-12.jpg)
![Agile Working - what it is and why it matters [John Eary]](https://img.pdfslide.net/doc/110x75/55a50c3f1a28abdf588b46c3/agile-working-what-it-is-and-why-it-matters-john-eary.jpg)