Embed Size (px)
Citation preview
Controlled Substance Prescribing Trends and Physician and Pharmacy Utilization Patterns: Epidemiological Analysis of the Maine Prescription Monitoring Program, 2006 - 2010
Kenneth McCall, PharmDChunhao Tu, PhD
Matthew Lacroix, PharmDKevin Wallace, MDChristina Holt, MD
Jonathan Balk, PharmD Candidate
Outline
• Background• Pharmacoepidemiological PMP Analysis– Methods– Prescription trends from 2006-2010– Physician and pharmacy utilization patterns
• Future Directions

BACKGROUND
www.maine.gov/pmp 4
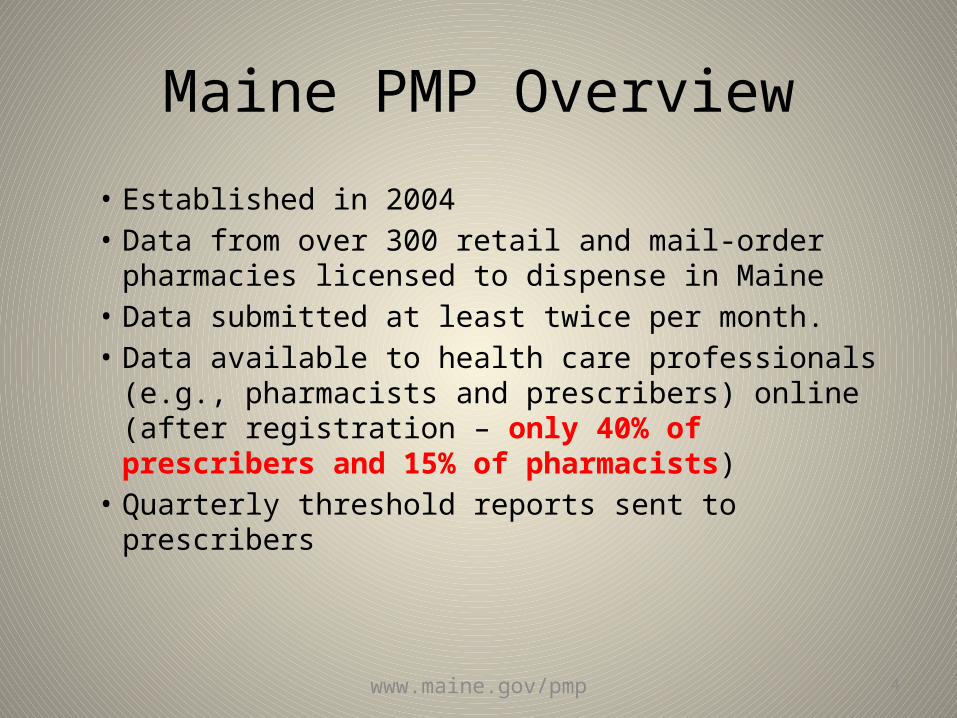
Maine PMP Overview
• Established in 2004• Data from over 300 retail and mail-order
pharmacies licensed to dispense in Maine• Data submitted at least twice per month.• Data available to health care professionals (e.g.,
pharmacists and prescribers) online (after registration – only 40% of prescribers and 15% of pharmacists)
• Quarterly threshold reports sent to prescribers
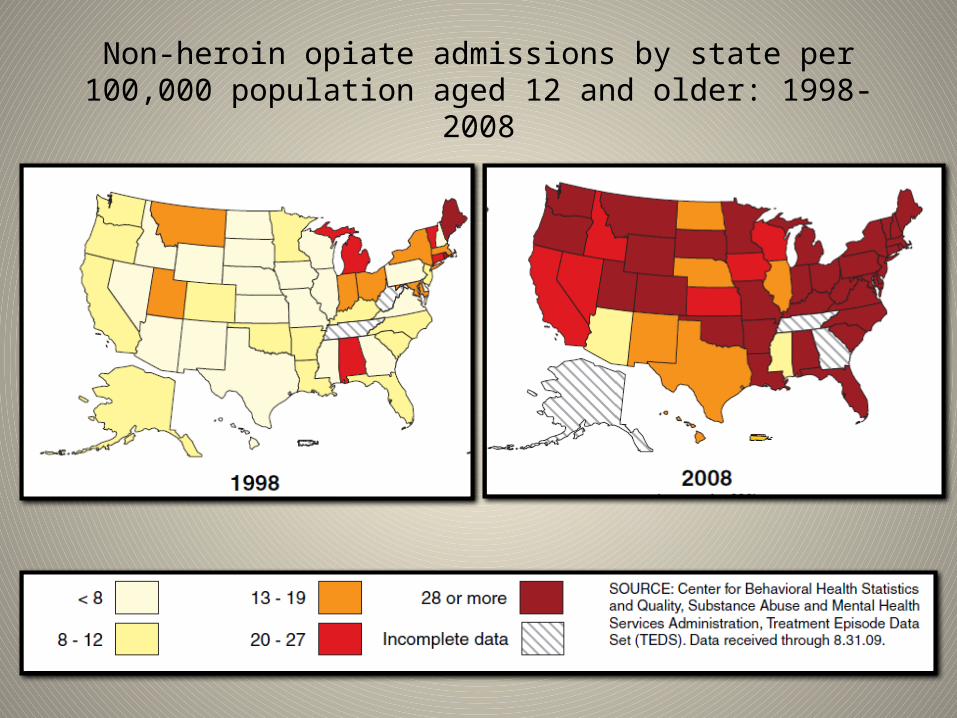
Non-heroin opiate admissions by state per 100,000 population aged 12 and older: 1998-2008

MAINE LEADS THE NATION IN ADMISSIONS FOR PRESCRIPTION OPIOID ABUSE
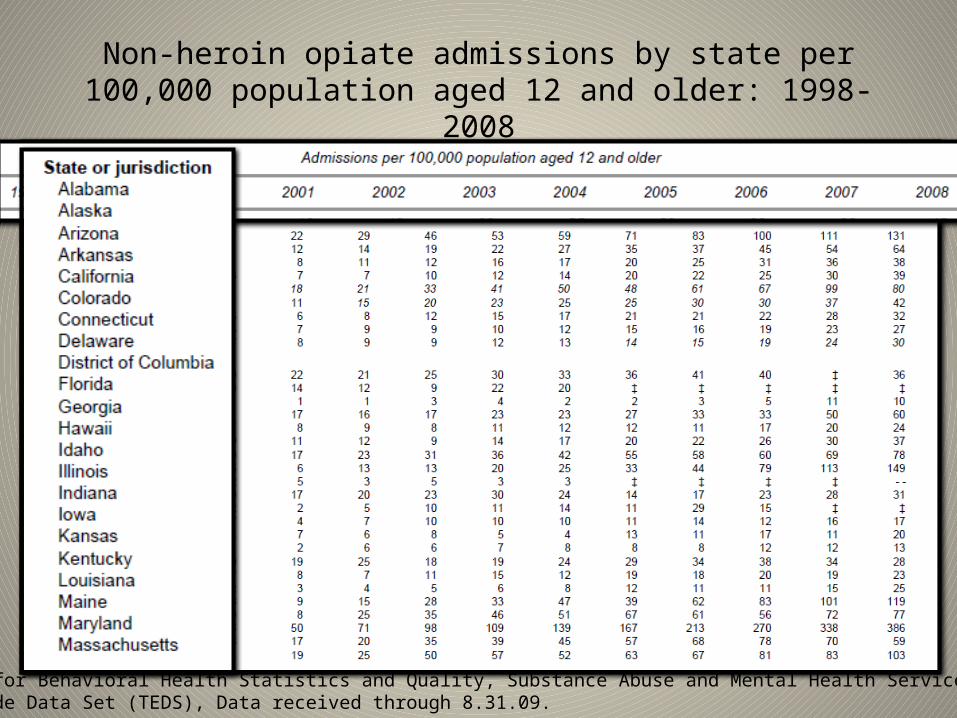
Non-heroin opiate admissions by state per 100,000 population aged 12 and older: 1998-2008
Source: Center for Behavioral Health Statistics and Quality, Substance Abuse and Mental Health Services Administration,Treatment Episode Data Set (TEDS), Data received through 8.31.09.
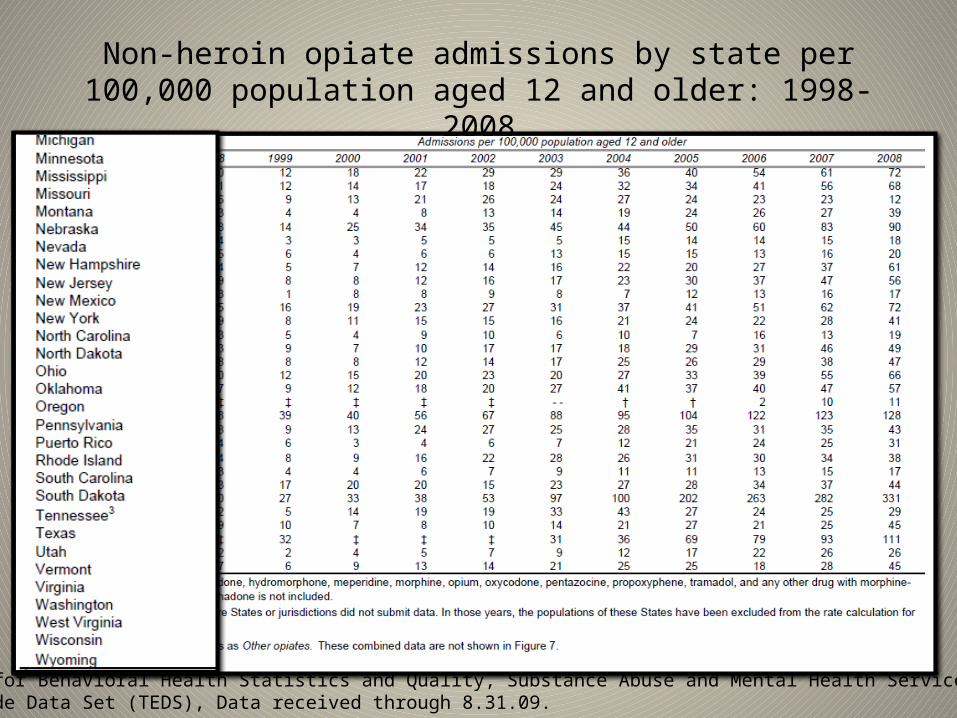
Non-heroin opiate admissions by state per 100,000 population aged 12 and older: 1998-2008
Source: Center for Behavioral Health Statistics and Quality, Substance Abuse and Mental Health Services Administration,Treatment Episode Data Set (TEDS), Data received through 8.31.09.
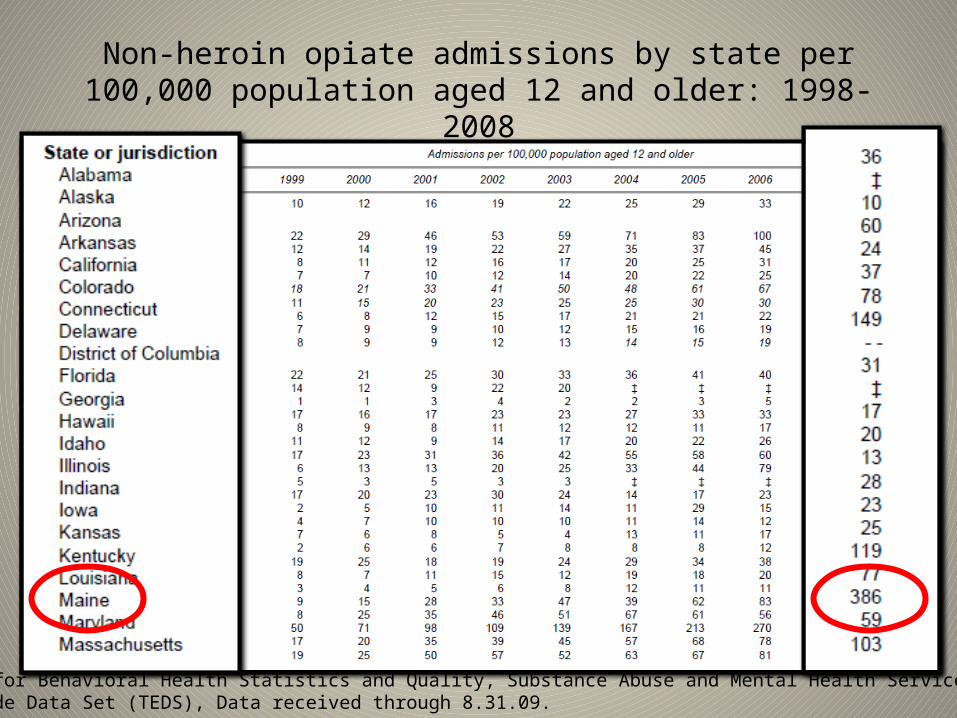
Non-heroin opiate admissions by state per 100,000 population aged 12 and older: 1998-2008
Source: Center for Behavioral Health Statistics and Quality, Substance Abuse and Mental Health Services Administration,Treatment Episode Data Set (TEDS), Data received through 8.31.09.

MAINE LEADS THE NATION IN ADMISSIONS FOR PRESCRIPTION OPIOID ABUSE
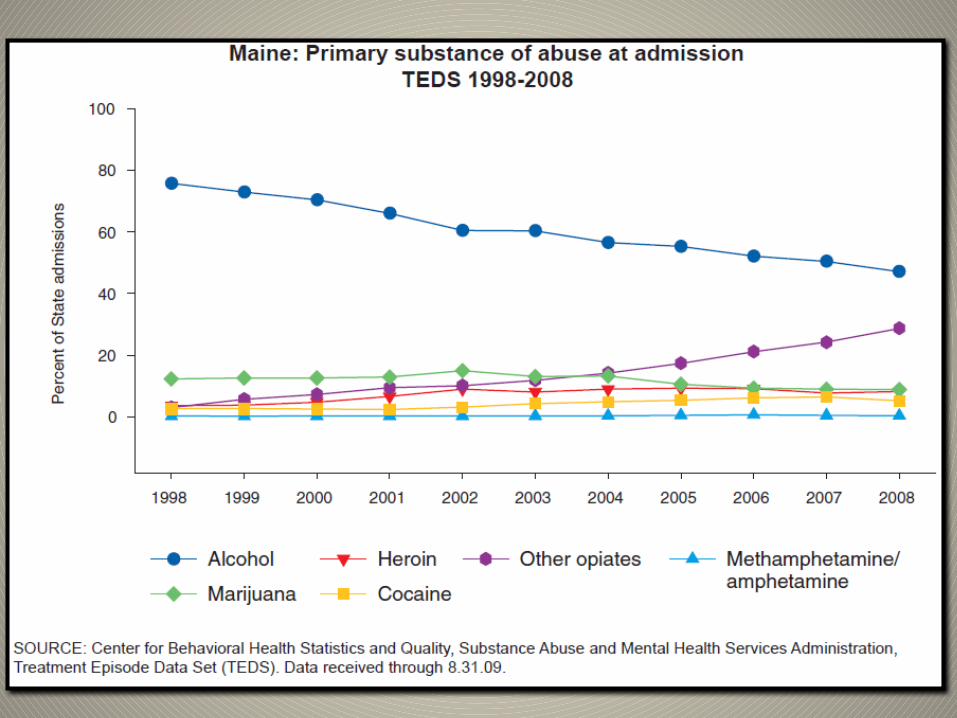

IN MAINE, THERE WERE MORE ADMISSIONS FOR PRESCRIPTION OPIOID ABUSE IN 2010 THAN FOR ALCOHOL
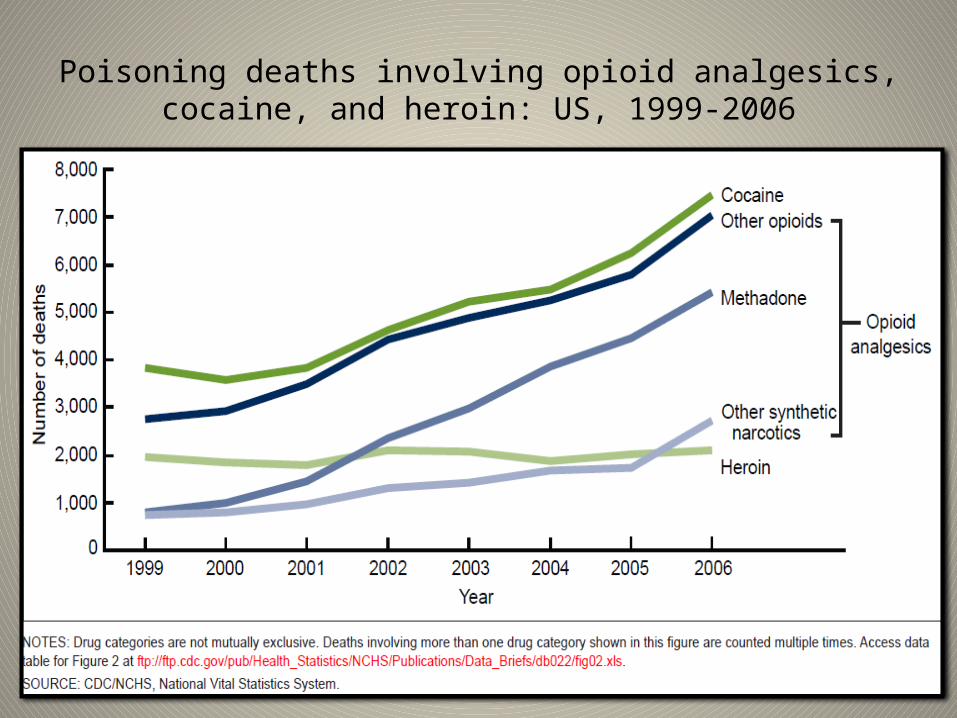
Poisoning deaths involving opioid analgesics, cocaine, and heroin: US, 1999-2006
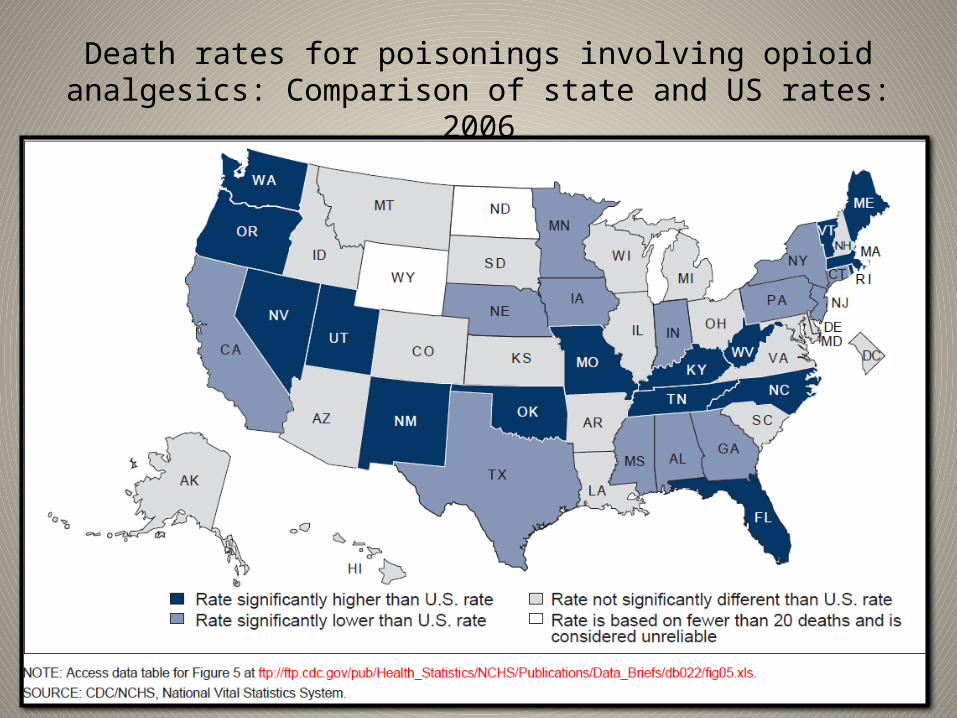
Death rates for poisonings involving opioid analgesics: Comparison of state and US rates: 2006

IN MAINE, THERE ARE MORE DEATHS EACH YEAR FROM OPIOID POSIONING THAN FROM AUTOMODILE ACCIDENTS
Pharmacoepidemiological PMP Analysis
Methods
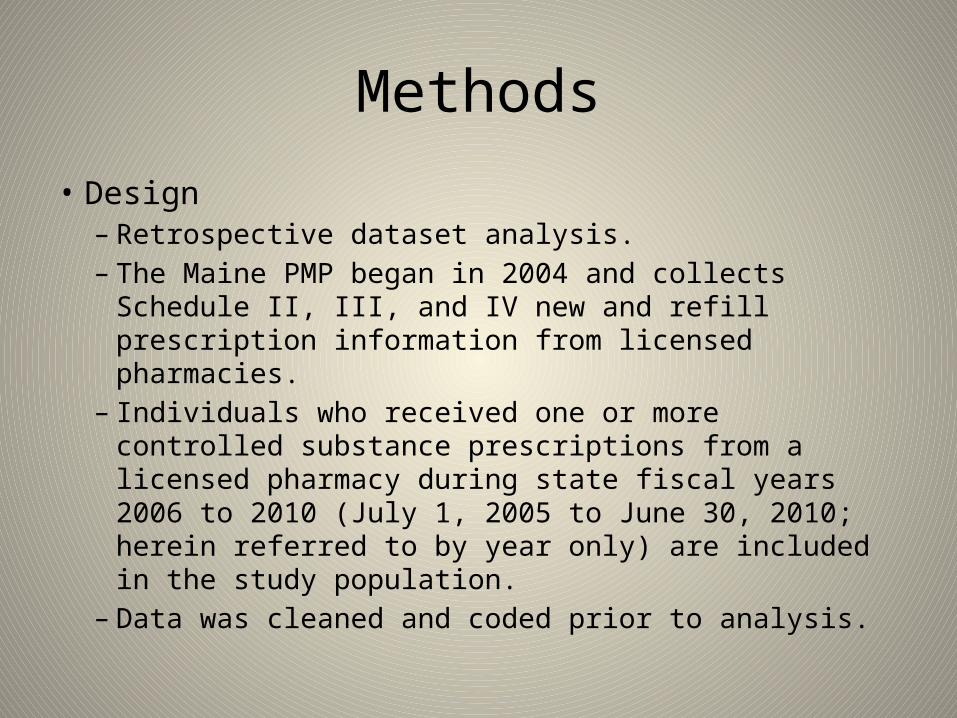
• Design– Retrospective dataset analysis.– The Maine PMP began in 2004 and collects Schedule II,
III, and IV new and refill prescription information from licensed pharmacies.
– Individuals who received one or more controlled substance prescriptions from a licensed pharmacy during state fiscal years 2006 to 2010 (July 1, 2005 to June 30, 2010; herein referred to by year only) are included in the study population.
– Data was cleaned and coded prior to analysis.
Methods
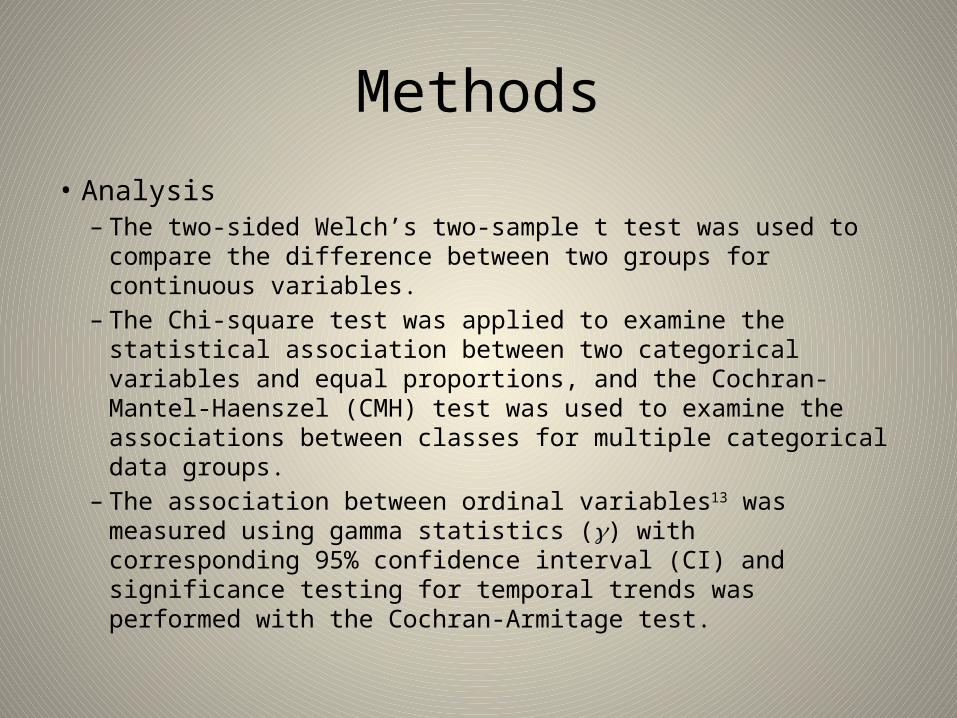
• Analysis– The two-sided Welch’s two-sample t test was used to compare
the difference between two groups for continuous variables. – The Chi-square test was applied to examine the statistical
association between two categorical variables and equal proportions, and the Cochran-Mantel-Haenszel (CMH) test was used to examine the associations between classes for multiple categorical data groups.
– The association between ordinal variables13 was measured using gamma statistics () with corresponding 95% confidence interval (CI) and significance testing for temporal trends was performed with the Cochran-Armitage test.
PRESCRIPTION TRENDS FROM 2006-2010
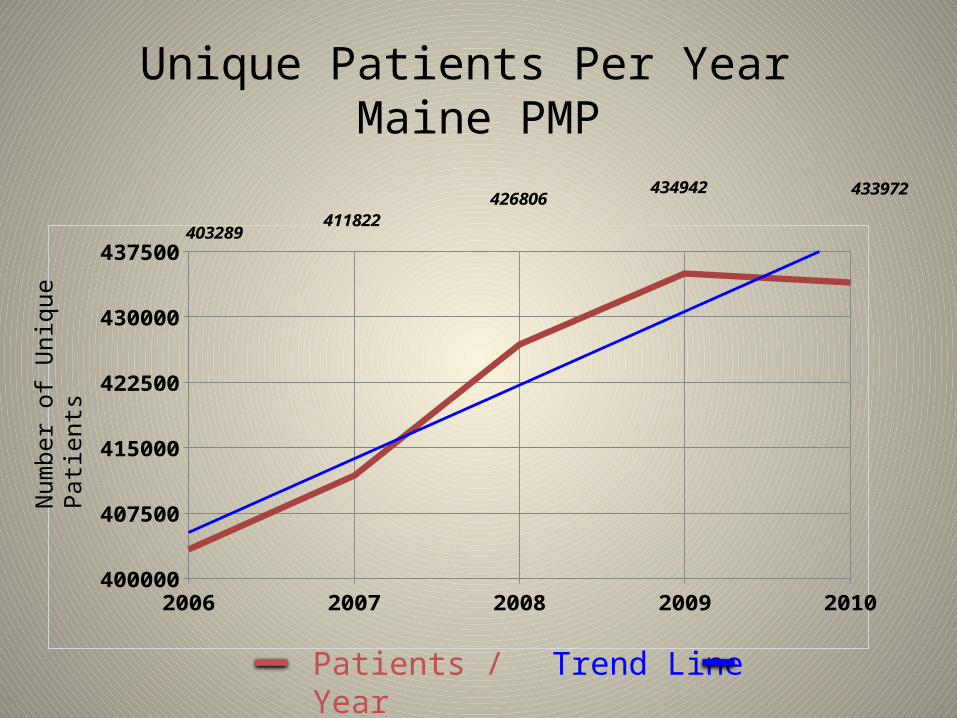
Unique Patients Per Year Maine PMP
2006 2007 2008 2009 2010400000
407500
415000
422500
430000
437500403289
411822426806
434942 433972
Num
ber o
f Uni
que
Patie
nts
Patients / Year Trend Line
Number of unique patients per year increased by 31,653 from 2006-2009, while the US census bureau estimates
the Maine population only grew by around 5,000
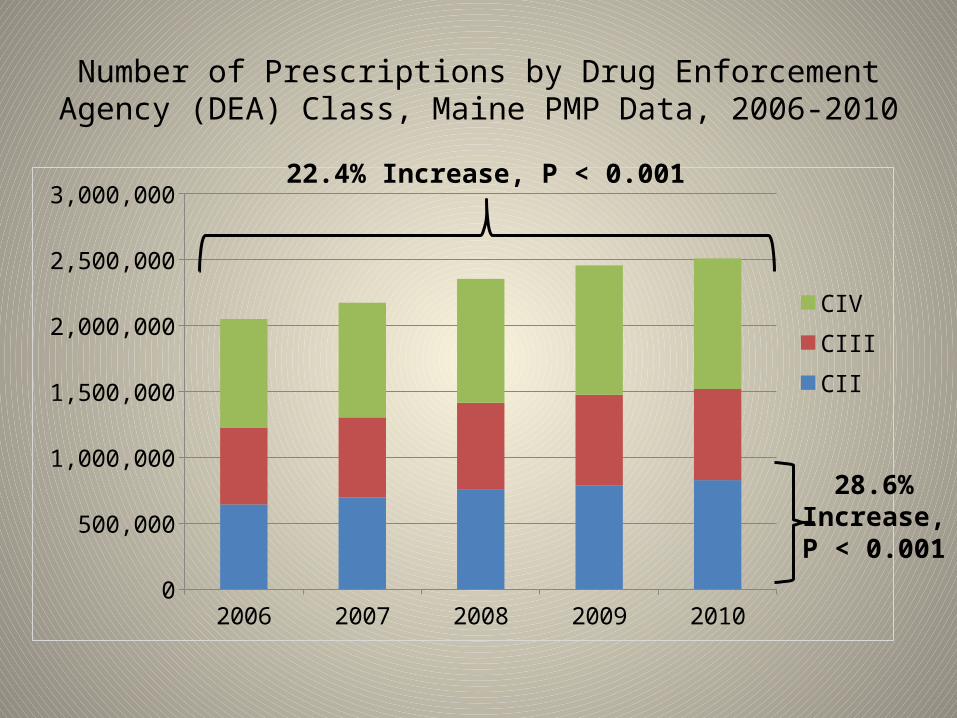
Number of Prescriptions by Drug Enforcement Agency (DEA) Class, Maine PMP Data, 2006-2010
2006 2007 2008 2009 20100
500,000
1,000,000
1,500,000
2,000,000
2,500,000
3,000,000
CIV
CIII
CII
22.4% Increase, P < 0.001
28.6%Increase,P < 0.001
Prescriptions for controlled drugs increased by 22.4% in 5 years, whereas the estimated Maine population only increased by 0.4%.

Class II drugs, which have the highest potential for abuse, had the greatest rate of increase in prescriptions among DEA classes from
2006 to 2010.
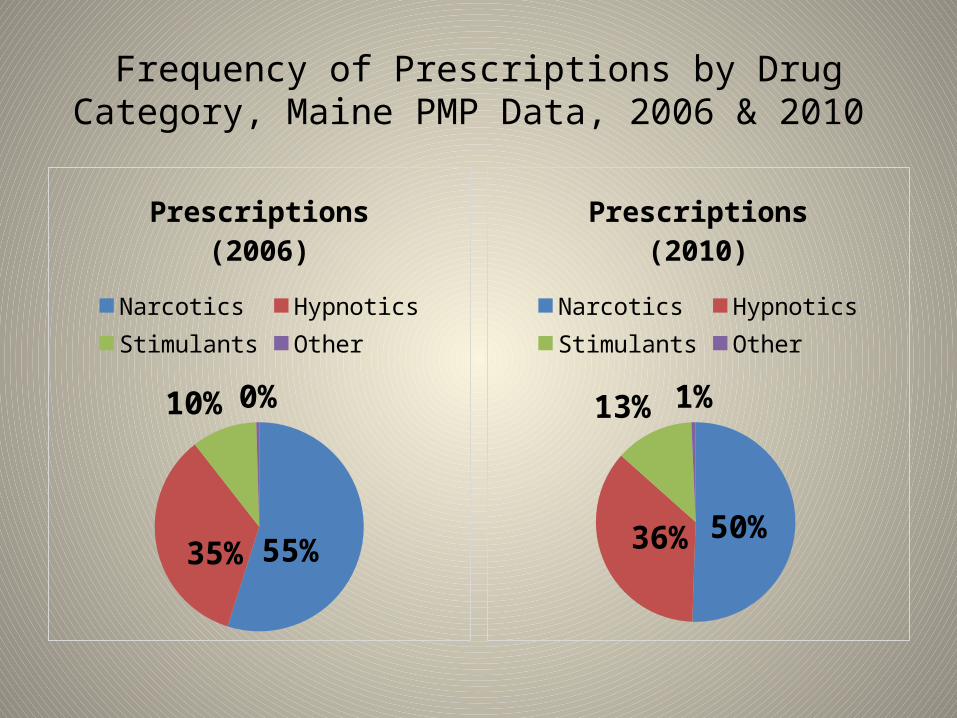
Frequency of Prescriptions by Drug Category, Maine PMP Data, 2006 & 2010
55%
35%
10% 0%
Prescriptions (2006)
Narcotics HypnoticsStimulants Other
50%36
%
13%
1%
Prescriptions (2010)
Narcotics HypnoticsStimulants Other

Narcotics are the most frequently prescribed drug category and stimulants are the fastest growing drug category.
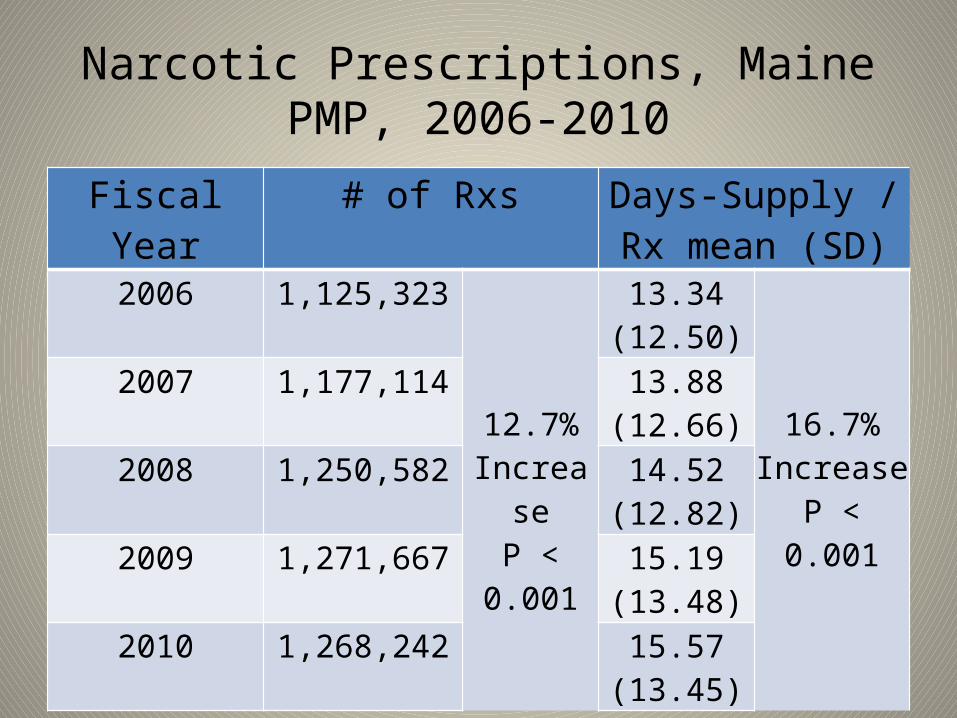
Narcotic Prescriptions, Maine PMP, 2006-2010
Fiscal Year # of Rxs Days-Supply / Rx mean (SD)
2006 1,125,323
12.7%IncreaseP < 0.001
13.34 (12.50)
16.7% Increase P < 0.001
2007 1,177,114 13.88 (12.66)
2008 1,250,582 14.52 (12.82)
2009 1,271,667 15.19 (13.48)
2010 1,268,242 15.57 (13.45)
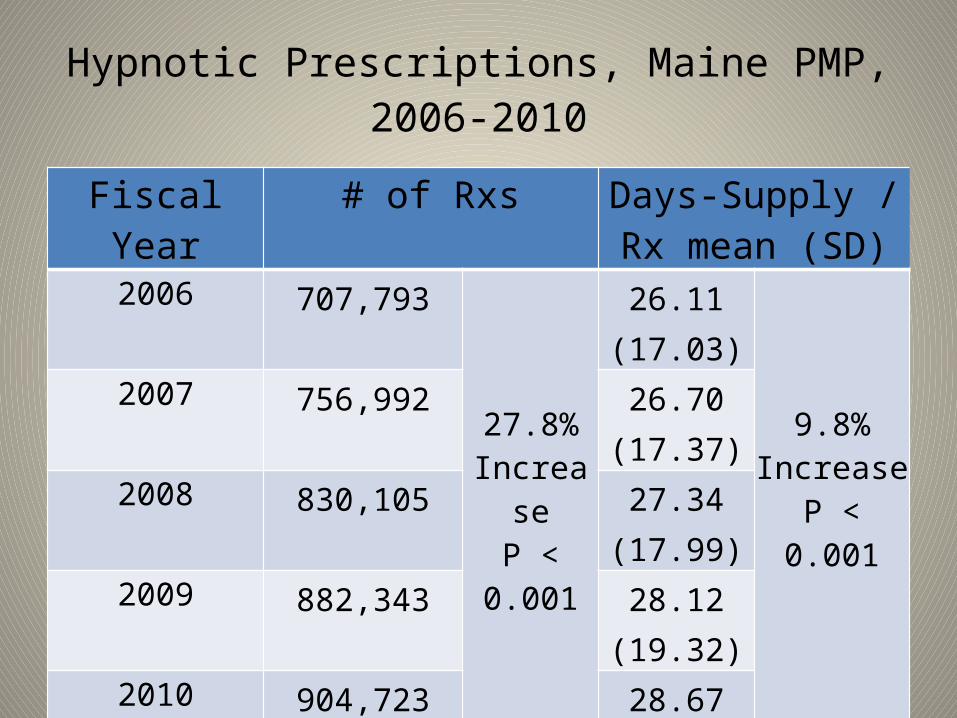
Hypnotic Prescriptions, Maine PMP, 2006-2010
Fiscal Year # of Rxs Days-Supply / Rx mean (SD)
2006 707,793
27.8%IncreaseP < 0.001
26.11 (17.03)
9.8% Increase P < 0.001
2007 756,992 26.70 (17.37)
2008 830,105 27.34 (17.99)
2009 882,343 28.12 (19.32)
2010 904,723 28.67 (19.60)
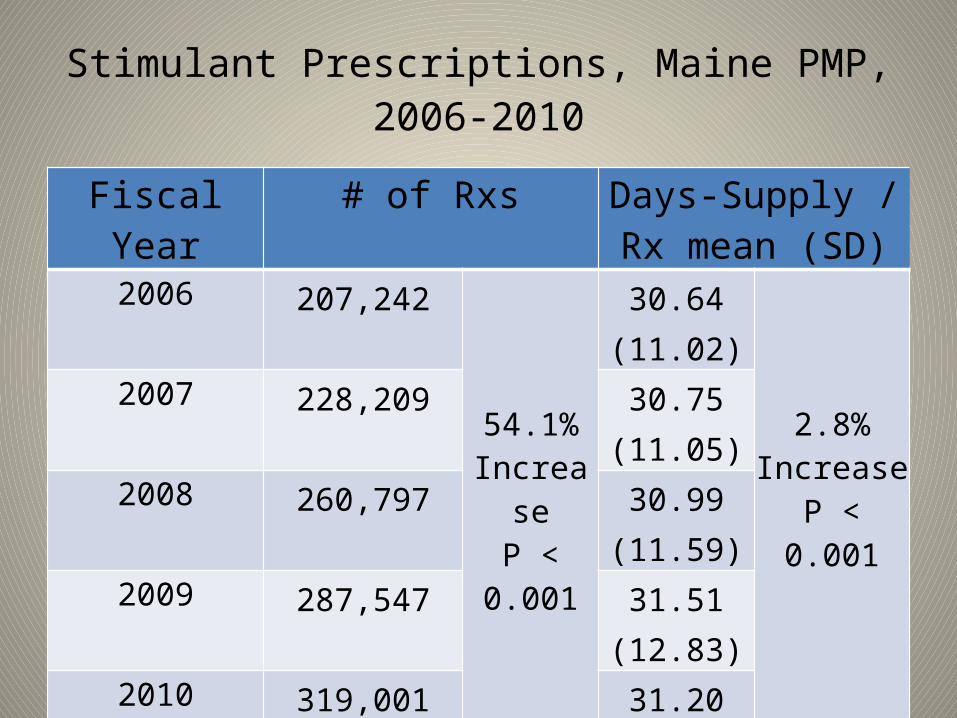
Stimulant Prescriptions, Maine PMP, 2006-2010
Fiscal Year # of Rxs Days-Supply / Rx mean (SD)
2006 207,242
54.1%IncreaseP < 0.001
30.64 (11.02)
2.8% Increase P < 0.001
2007 228,209 30.75 (11.05)
2008 260,797 30.99 (11.59)
2009 287,547 31.51 (12.83)
2010 319,001 31.20 (13.18)
The mean days-supply per prescription has significantly increased for all controlled drug categories; narcotics, hypnotics, and
stimulants.
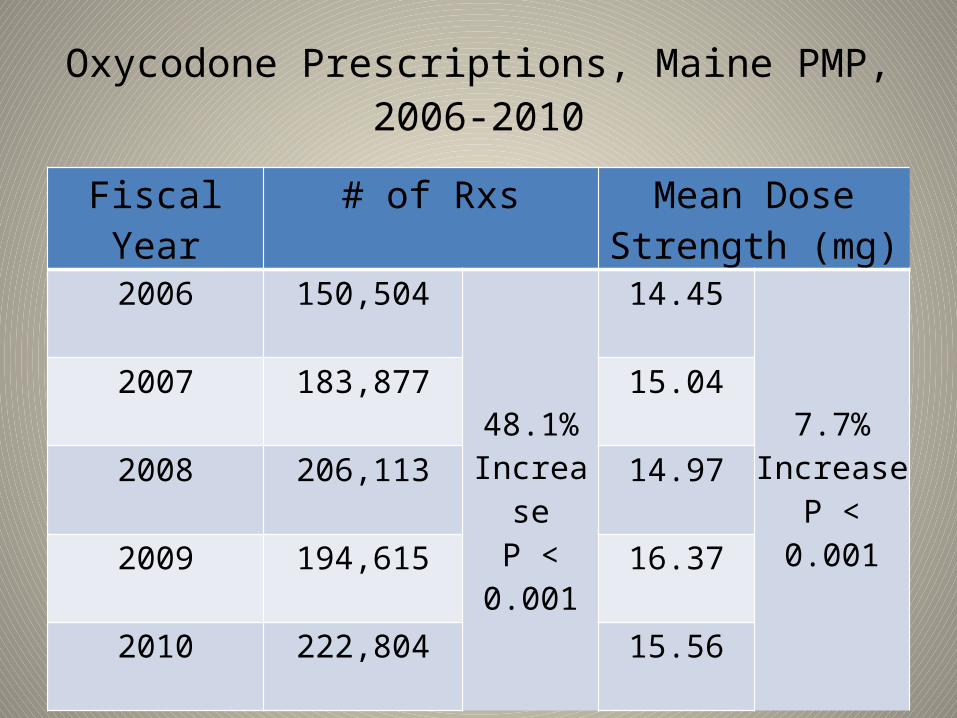
Oxycodone Prescriptions, Maine PMP, 2006-2010
Fiscal Year # of Rxs Mean Dose Strength (mg)
2006 150,504
48.1%IncreaseP < 0.001
14.45
7.7% Increase P < 0.001
2007 183,877 15.04
2008 206,113 14.97
2009 194,615 16.37
2010 222,804 15.56
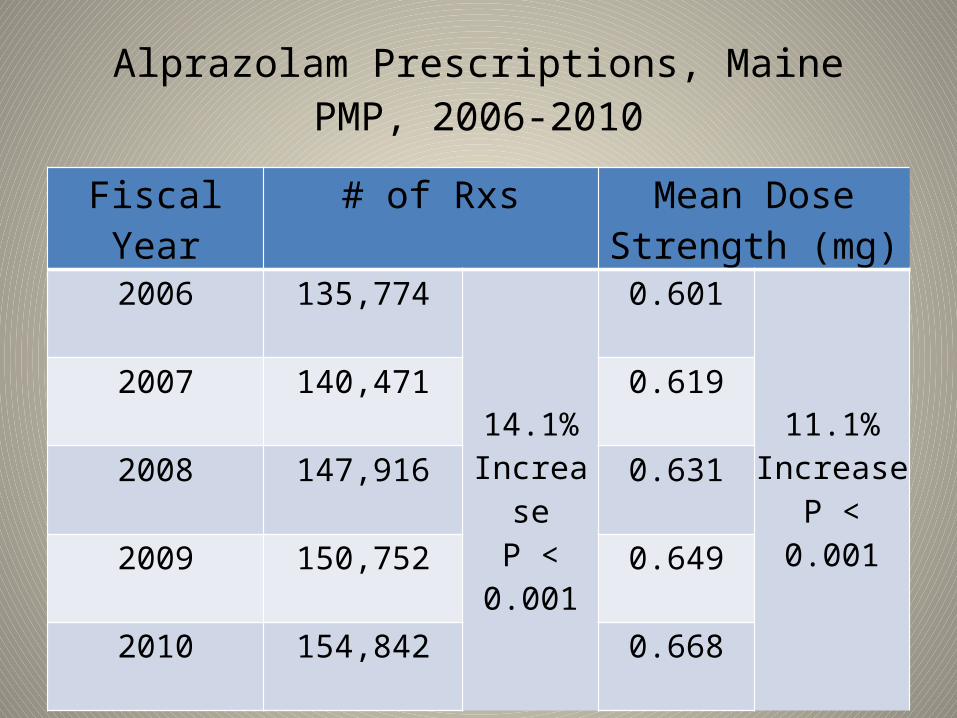
Alprazolam Prescriptions, Maine PMP, 2006-2010
Fiscal Year # of Rxs Mean Dose Strength (mg)
2006 135,774
14.1%IncreaseP < 0.001
0.601
11.1% Increase P < 0.001
2007 140,471 0.619
2008 147,916 0.631
2009 150,752 0.649
2010 154,842 0.668
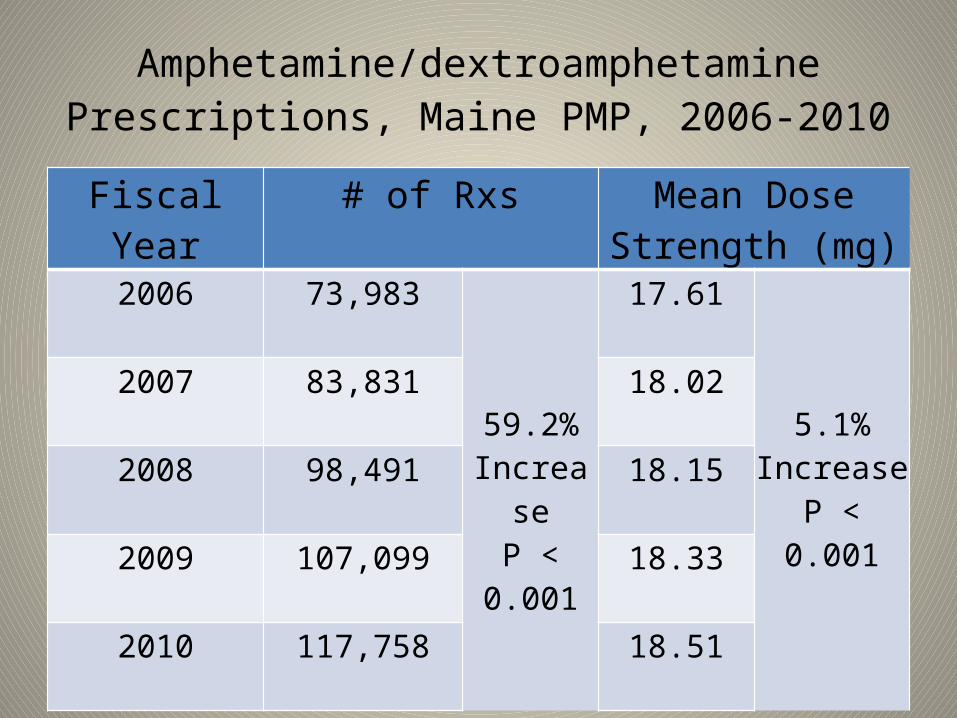
Amphetamine/dextroamphetamine Prescriptions, Maine PMP, 2006-2010
Fiscal Year # of Rxs Mean Dose Strength (mg)
2006 73,983
59.2%IncreaseP < 0.001
17.61
5.1% Increase P < 0.001
2007 83,831 18.02
2008 98,491 18.15
2009 107,099 18.33
2010 117,758 18.51
The mean dose per tablet of oxycodone, alprazolam, and amphetamine/dextroamphetamine has significantly increased.
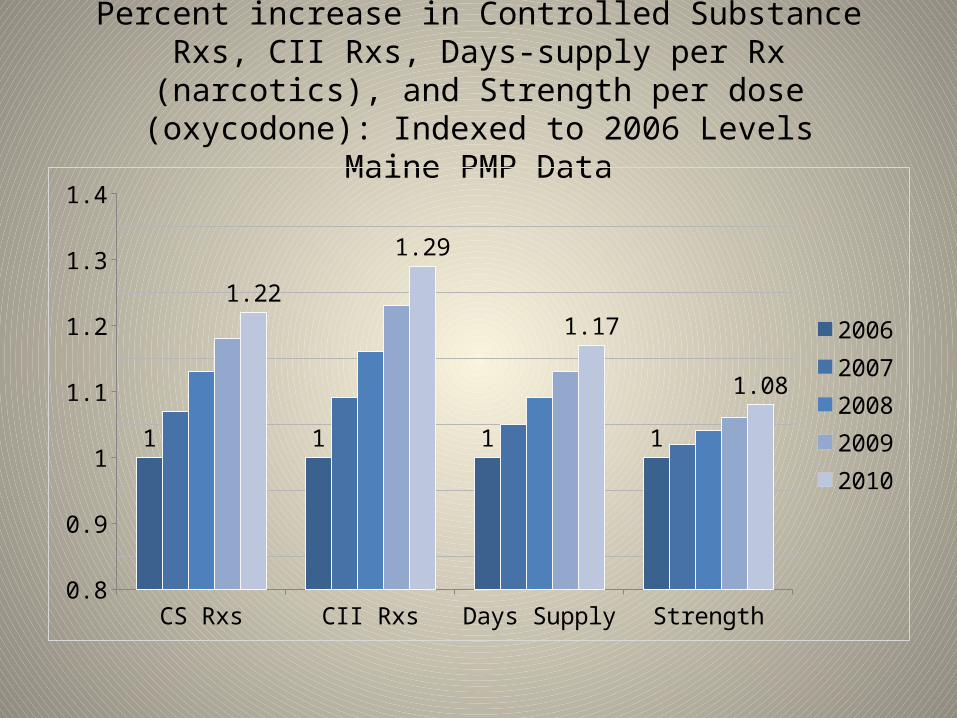
Percent increase in Controlled Substance Rxs, CII Rxs, Days-supply per Rx (narcotics), and Strength per dose (oxycodone):
Indexed to 2006 LevelsMaine PMP Data
CS Rxs CII Rxs Days Supply Strength0.8
0.9
1
1.1
1.2
1.3
1.4
1 1 1 1
1.22
1.29
1.17
1.08
20062007200820092010
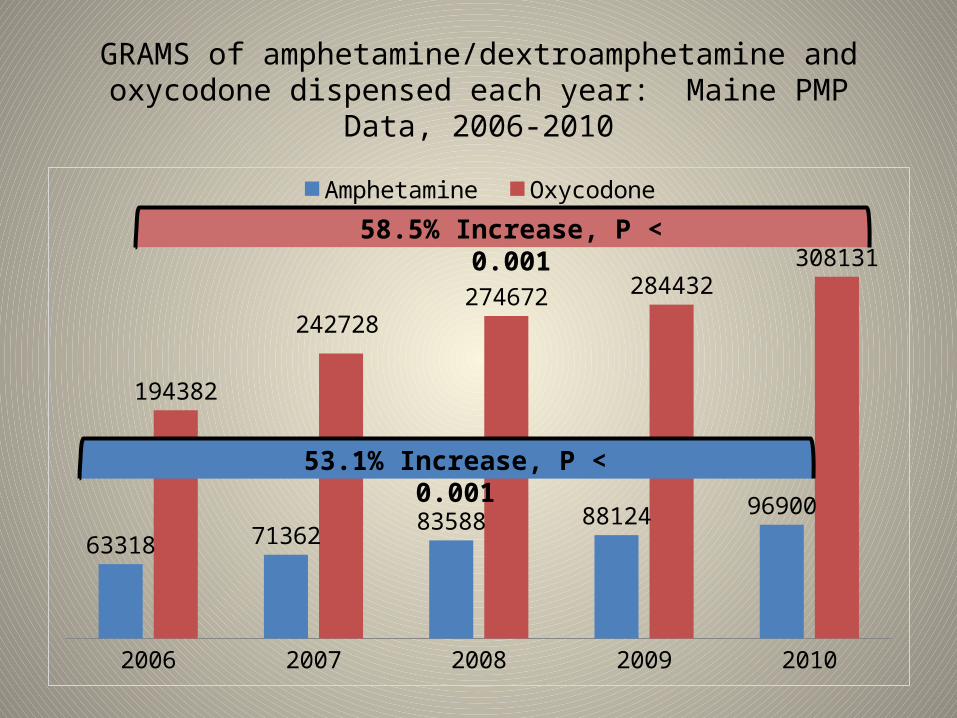
GRAMS of amphetamine/dextroamphetamine and oxycodone dispensed each year: Maine PMP Data, 2006-2010
2006 2007 2008 2009 2010
63318 7136283588 88124 96900
194382
242728274672 284432
308131
Amphetamine Oxycodone
53.1% Increase, P < 0.001
58.5% Increase, P < 0.001
In 2010, more than 300,000 grams of oxycodone and nearly 100,00 grams of amphetamine were dispensed to patients in Maine. Compared to
2006, this represents a significant 58.5% and 53.1% increase, respectively.
PHYSICIAN AND PHARMACY UTILIZATION PATTERNS
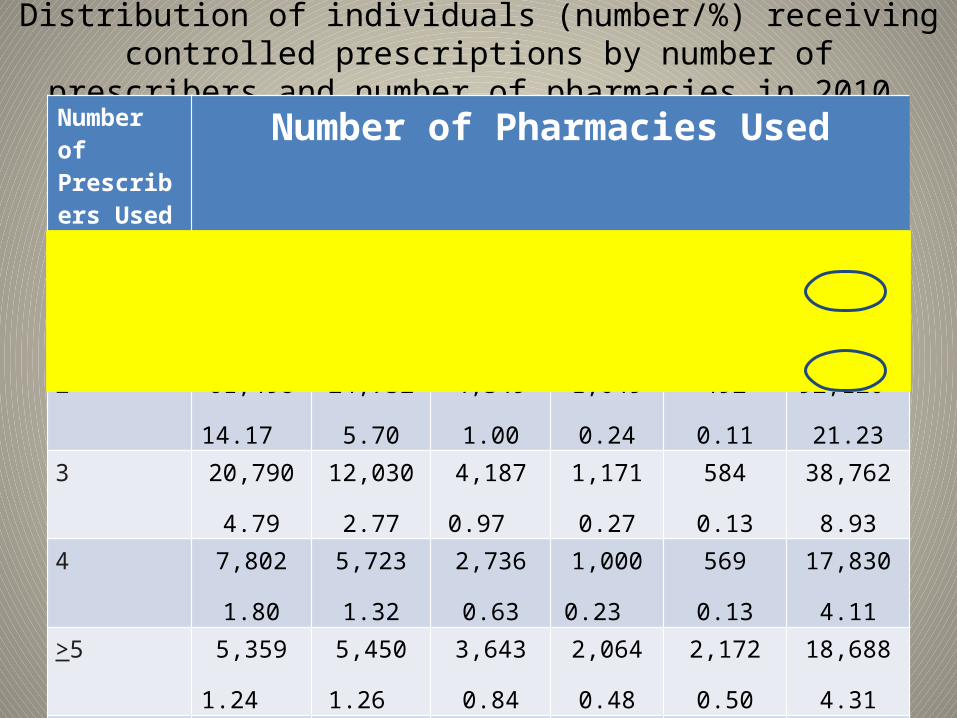
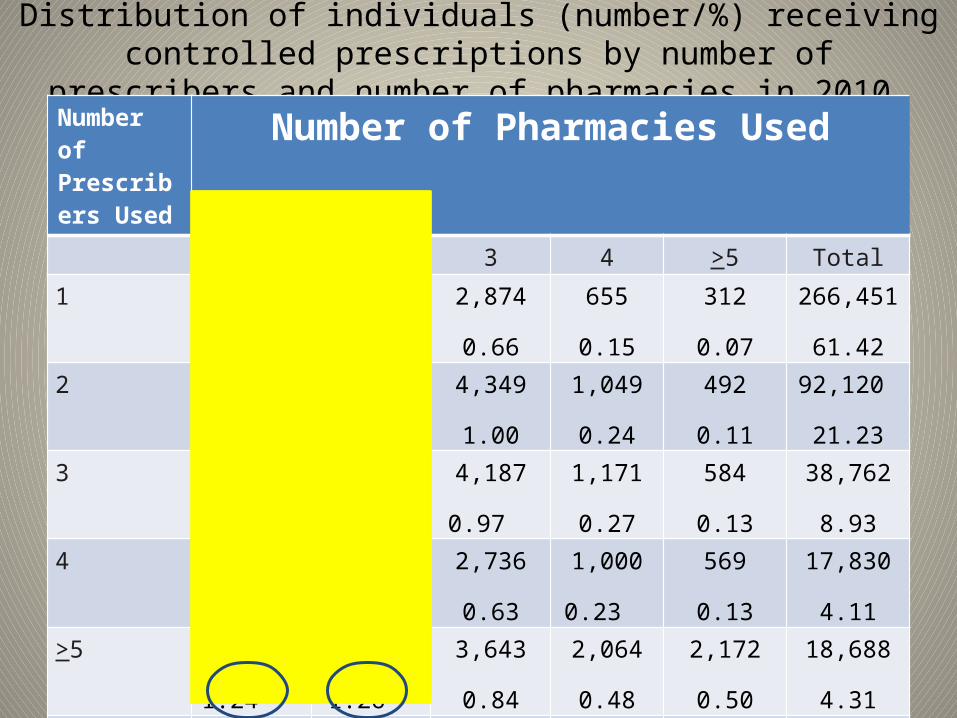
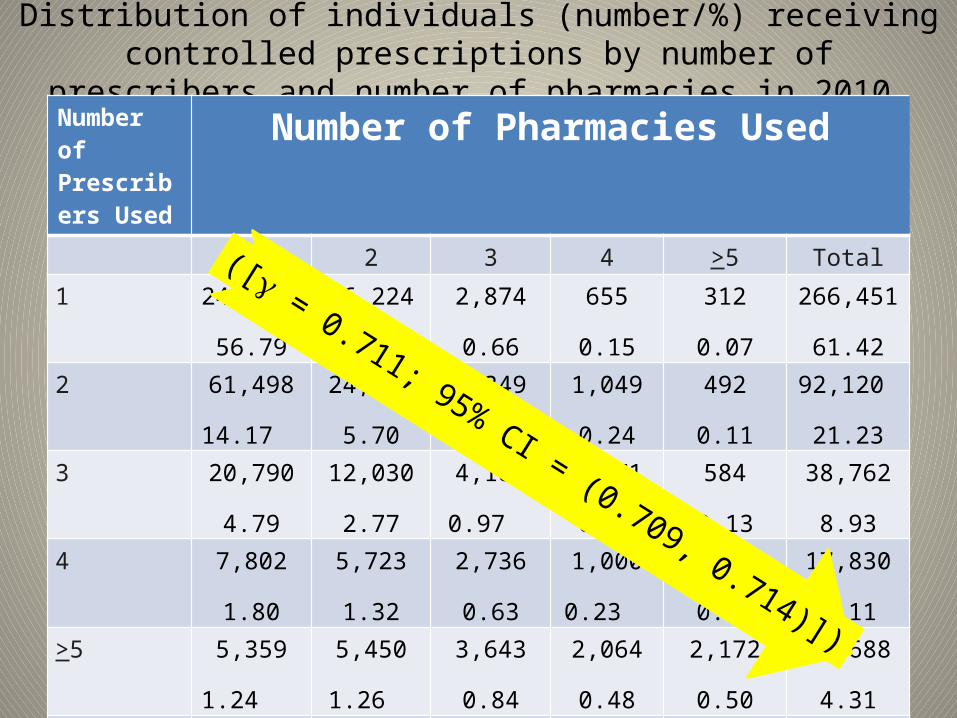
Distribution of individuals (number/%) receiving controlled prescriptions by number of prescribers and number of pharmacies in 2010
Number of Prescribers Used
Number of Pharmacies Used
1 2 3 4 >5 Total
1 246,386
56.79
16,224
3.74
2,874
0.66
655
0.15
312
0.07
266,451
61.422 61,498
14.17
24,732
5.70
4,349
1.00
1,049
0.24
492
0.11
92,120
21.233 20,790
4.79
12,030
2.77
4,187
0.97
1,171
0.27
584
0.13
38,762
8.934 7,802
1.80
5,723
1.32
2,736
0.63
1,000
0.23
569
0.13
17,830
4.11>5 5,359
1.24
5,450
1.26
3,643
0.84
2,064
0.48
2,172
0.50
18,688
4.31Total 341,835
78.79
64,159
14.79
17,789
4.10
5,939
1.37
4,129
0.95
433,851
100.00
• Most individuals (82.7%) obtained their prescriptions for controlled drugs from one or two prescribers in 2010.
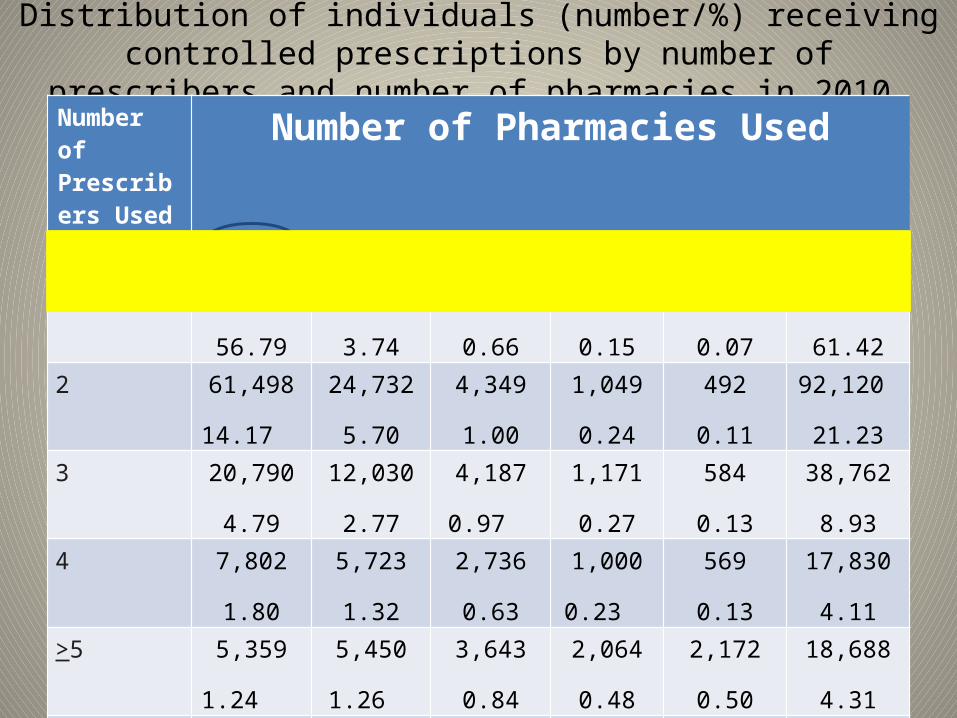
Distribution of individuals (number/%) receiving controlled prescriptions by number of prescribers and number of pharmacies in 2010
Number of Prescribers Used
Number of Pharmacies Used
1 2 3 4 >5 Total
1 246,386
56.79
16,224
3.74
2,874
0.66
655
0.15
312
0.07
266,451
61.422 61,498
14.17
24,732
5.70
4,349
1.00
1,049
0.24
492
0.11
92,120
21.233 20,790
4.79
12,030
2.77
4,187
0.97
1,171
0.27
584
0.13
38,762
8.934 7,802
1.80
5,723
1.32
2,736
0.63
1,000
0.23
569
0.13
17,830
4.11>5 5,359
1.24
5,450
1.26
3,643
0.84
2,064
0.48
2,172
0.50
18,688
4.31Total 341,835
78.79
64,159
14.79
17,789
4.10
5,939
1.37
4,129
0.95
433,851
100.00
• Most individuals (93.6%) received their prescribed controlled drugs from one or two pharmacies in 2010.
Distribution of individuals (number/%) receiving controlled prescriptions by number of prescribers and number of pharmacies in 2010
Number of Prescribers Used
Number of Pharmacies Used
1 2 3 4 >5 Total
1 246,386
56.79
16,224
3.74
2,874
0.66
655
0.15
312
0.07
266,451
61.422 61,498
14.17
24,732
5.70
4,349
1.00
1,049
0.24
492
0.11
92,120
21.233 20,790
4.79
12,030
2.77
4,187
0.97
1,171
0.27
584
0.13
38,762
8.934 7,802
1.80
5,723
1.32
2,736
0.63
1,000
0.23
569
0.13
17,830
4.11>5 5,359
1.24
5,450
1.26
3,643
0.84
2,064
0.48
2,172
0.50
18,688
4.31Total 341,835
78.79
64,159
14.79
17,789
4.10
5,939
1.37
4,129
0.95
433,851
100.00
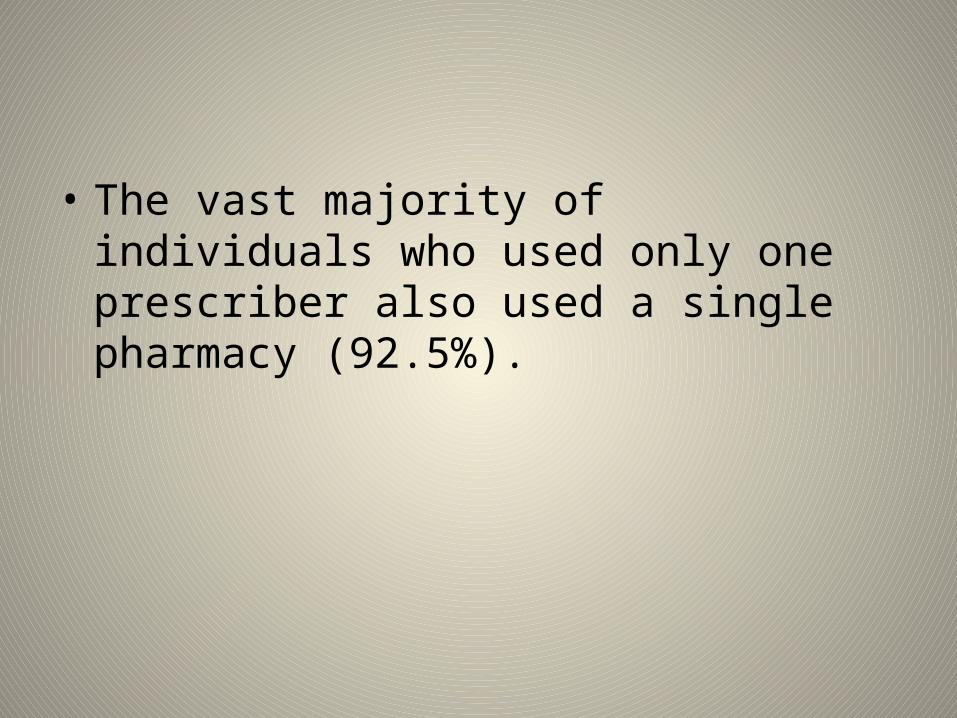
• The vast majority of individuals who used only one prescriber also used a single pharmacy (92.5%).
Distribution of individuals (number/%) receiving controlled prescriptions by number of prescribers and number of pharmacies in 2010
Number of Prescribers Used
Number of Pharmacies Used
1 2 3 4 >5 Total
1 246,386
56.79
16,224
3.74
2,874
0.66
655
0.15
312
0.07
266,451
61.422 61,498
14.17
24,732
5.70
4,349
1.00
1,049
0.24
492
0.11
92,120
21.233 20,790
4.79
12,030
2.77
4,187
0.97
1,171
0.27
584
0.13
38,762
8.934 7,802
1.80
5,723
1.32
2,736
0.63
1,000
0.23
569
0.13
17,830
4.11>5 5,359
1.24
5,450
1.26
3,643
0.84
2,064
0.48
2,172
0.50
18,688
4.31Total 341,835
78.79
64,159
14.79
17,789
4.10
5,939
1.37
4,129
0.95
433,851
100.00
([ = 0.711; 95% CI = (0.709, 0.714)])
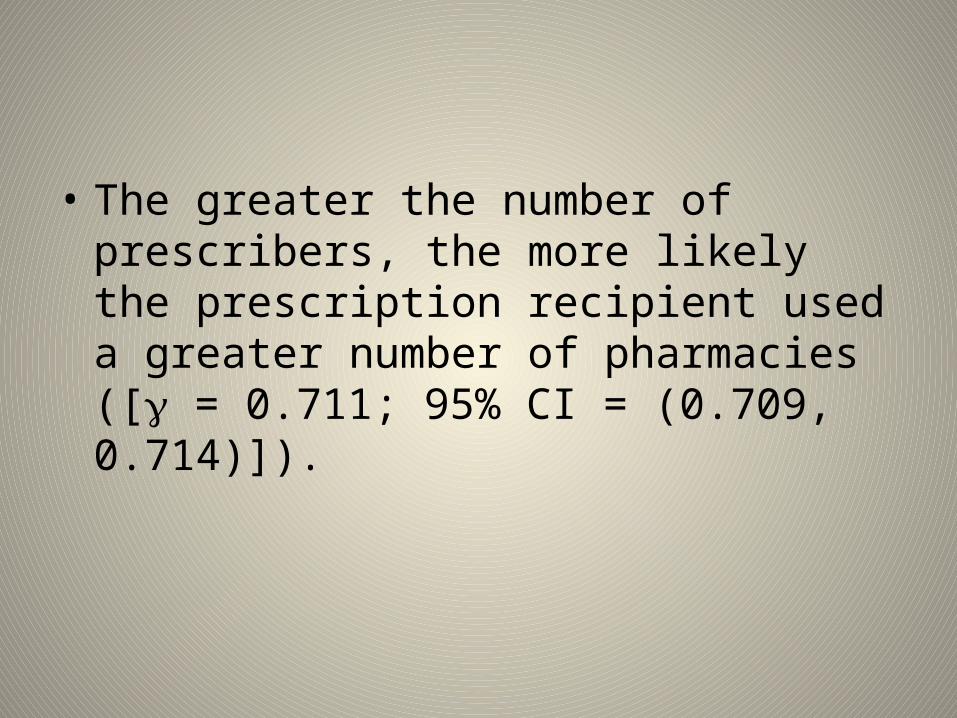
• The greater the number of prescribers, the more likely the prescription recipient used a greater number of pharmacies ([ = 0.711; 95% CI = (0.709, 0.714)]).
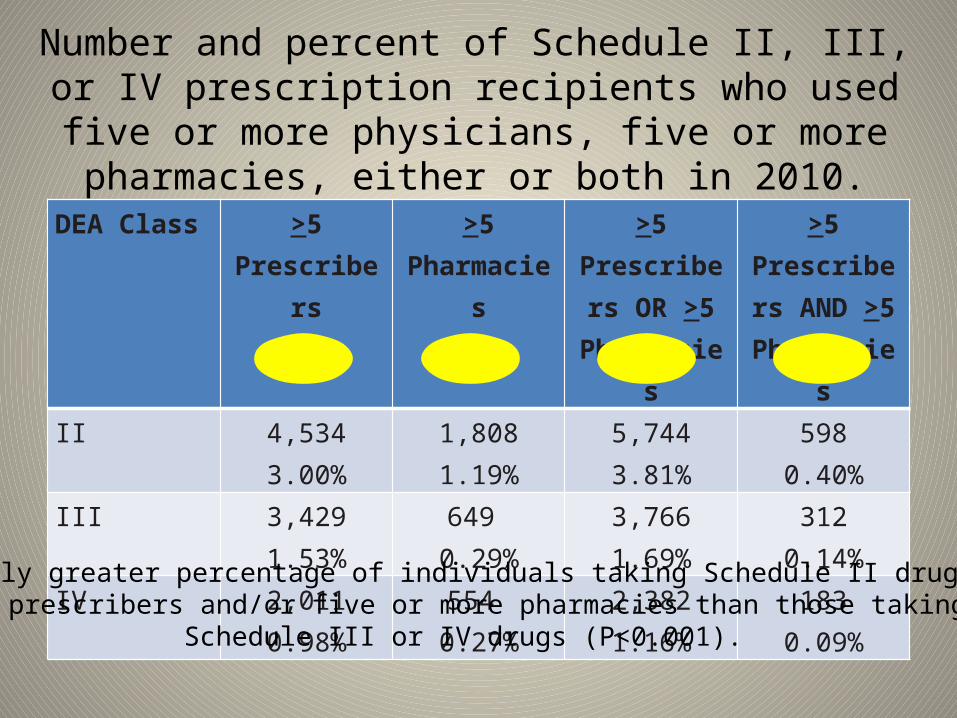
Number and percent of Schedule II, III, or IV prescription recipients who used five or more physicians, five or more
pharmacies, either or both in 2010.DEA Class >5 Prescribers >5
Pharmacies>5 Prescribers
OR >5 Pharmacies
>5 Prescribers AND >5
PharmaciesII 4,534
3.00%1,8081.19%
5,7443.81%
5980.40%
III 3,4291.53%
649 0.29%
3,7661.69%
3120.14%
IV 2,0110.98%
554 0.27%
2,3821.16%
1830.09%
A significantly greater percentage of individuals taking Schedule II drugs used five or more prescribers and/or five or more pharmacies than those taking only
Schedule III or IV drugs (P<0.001).
Future Directions
• Geographic analysis• Data linkages with state mortality data• Pediatric and Geriatric prescribing trends• Prescribing trends among prescribers who are
registered with PMP versus prescribers who are not registered

QUESTIONS?