Embed Size (px)
Citation preview

MWOA 38th Annual Conference
Grand Rapids, MN July 24, 2014
Bill Marten, PE, BCEE Eric Lynne, PE
CONTROLLING ACTIVATED SLUDGE
BULKING & FOAMING: FROM THEORY TO PRACTICE
Page 2| July 24, 2014 MWOA 38th Annual Conference
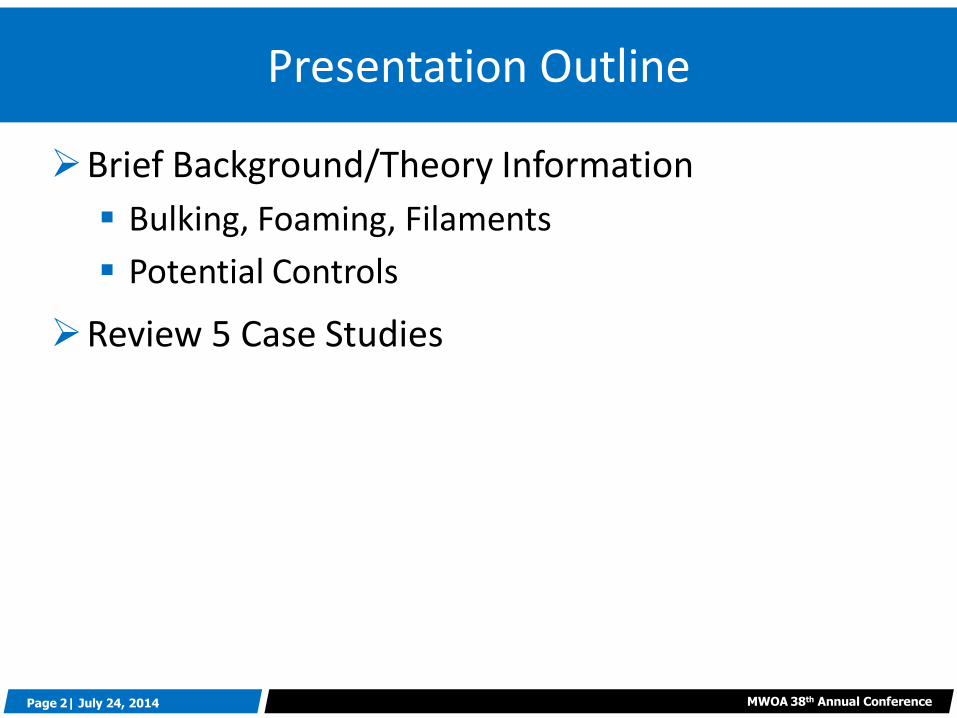
Presentation Outline
Brief Background/Theory Information
Bulking, Foaming, Filaments
Potential Controls
Review 5 Case Studies
Page 3| July 24, 2014 MWOA 38th Annual Conference
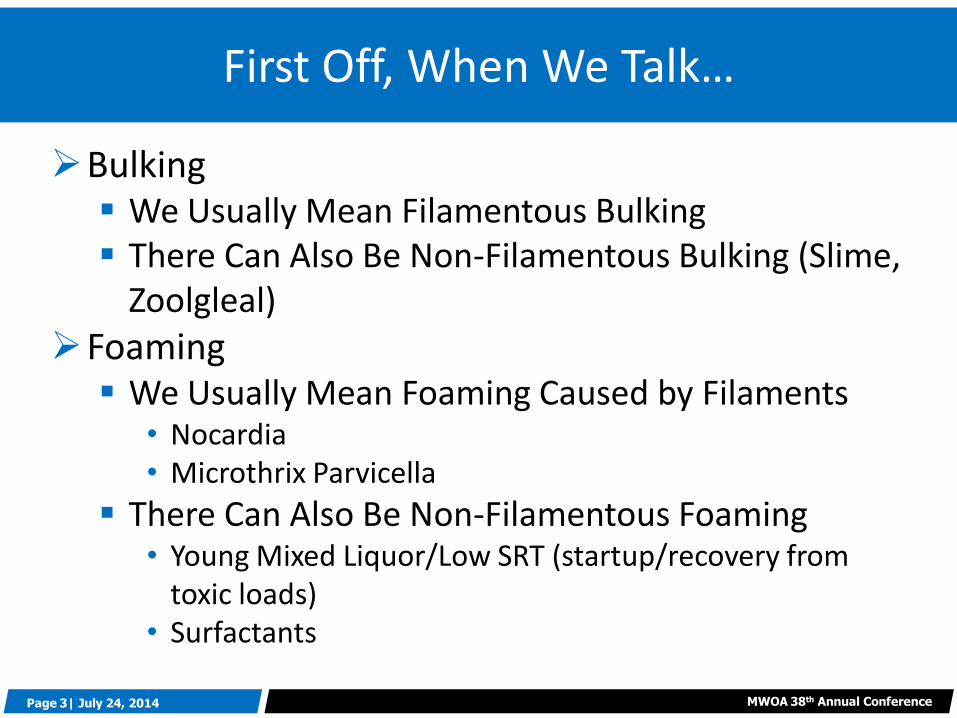
Bulking We Usually Mean Filamentous Bulking There Can Also Be Non-Filamentous Bulking (Slime,
Zoolgleal)
Foaming We Usually Mean Foaming Caused by Filaments
• Nocardia • Microthrix Parvicella
There Can Also Be Non-Filamentous Foaming • Young Mixed Liquor/Low SRT (startup/recovery from
toxic loads) • Surfactants
First Off, When We Talk…
Page 4| July 24, 2014 MWOA 38th Annual Conference
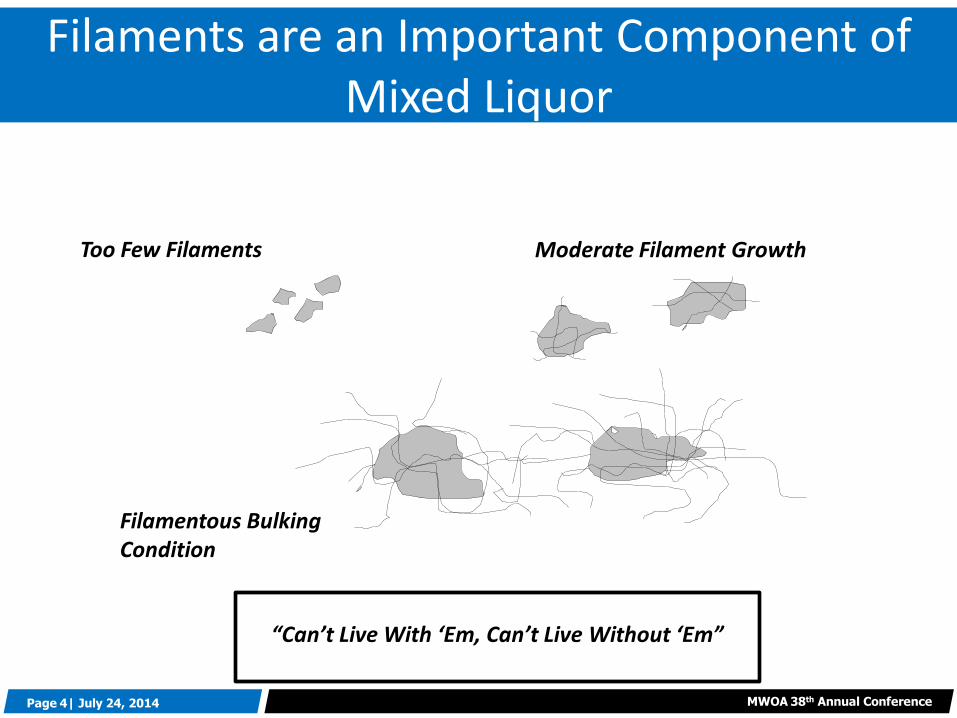
Filaments are an Important Component of Mixed Liquor
Too Few Filaments Moderate Filament Growth
Filamentous Bulking Condition
“Can’t Live With ‘Em, Can’t Live Without ‘Em”
Page 5| July 24, 2014 MWOA 38th Annual Conference
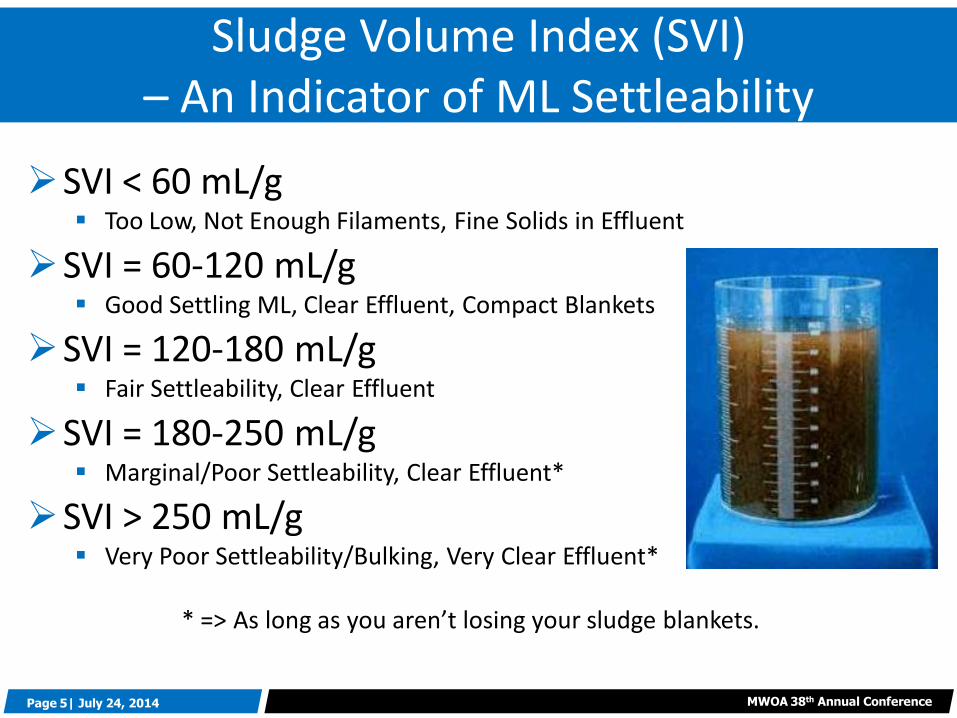
Sludge Volume Index (SVI) – An Indicator of ML Settleability
SVI < 60 mL/g Too Low, Not Enough Filaments, Fine Solids in Effluent
SVI = 60-120 mL/g Good Settling ML, Clear Effluent, Compact Blankets
SVI = 120-180 mL/g Fair Settleability, Clear Effluent
SVI = 180-250 mL/g Marginal/Poor Settleability, Clear Effluent*
SVI > 250 mL/g Very Poor Settleability/Bulking, Very Clear Effluent*
* => As long as you aren’t losing your sludge blankets.
Page 6| July 24, 2014 MWOA 38th Annual Conference
Needed Compound Lacking or in Short Supply
Nutrient Deficiency
Low Dissolved Oxygen Concentrations
Low Substrate (Food/BOD) Concentrations
Septicity (Sulfides, Volatile Acids)
High SRT
Different causes result in the propagation of different
filamentous organisms.
Primary Causes of Bulking/Foaming
Page 7| July 24, 2014 MWOA 38th Annual Conference
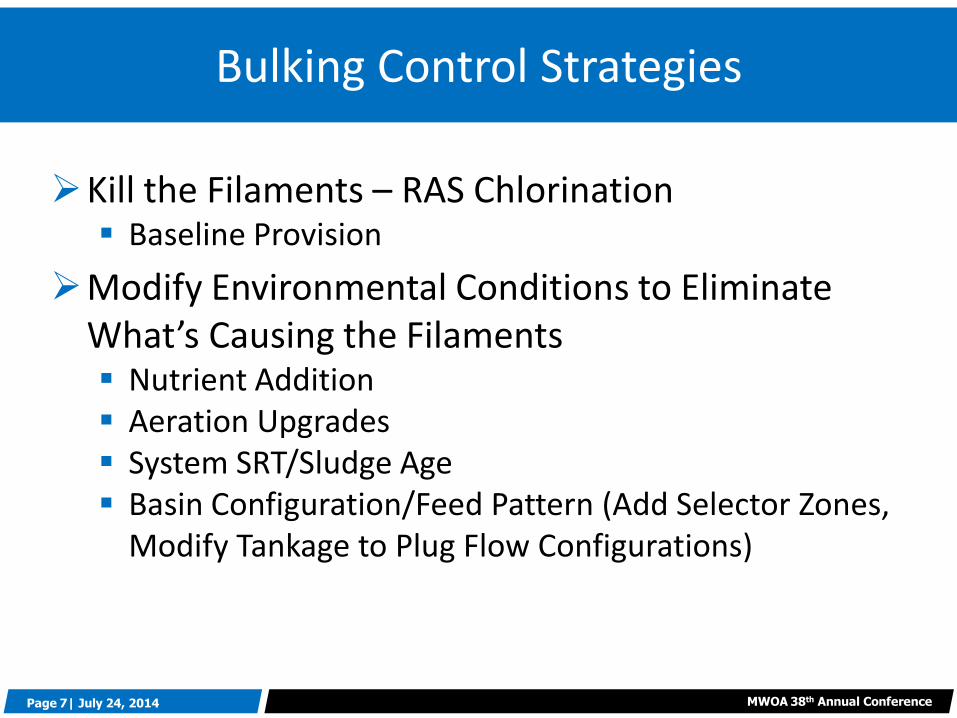
Bulking Control Strategies
Kill the Filaments – RAS Chlorination Baseline Provision
Modify Environmental Conditions to Eliminate What’s Causing the Filaments Nutrient Addition Aeration Upgrades System SRT/Sludge Age Basin Configuration/Feed Pattern (Add Selector Zones,
Modify Tankage to Plug Flow Configurations)
Page 8| July 24, 2014 MWOA 38th Annual Conference
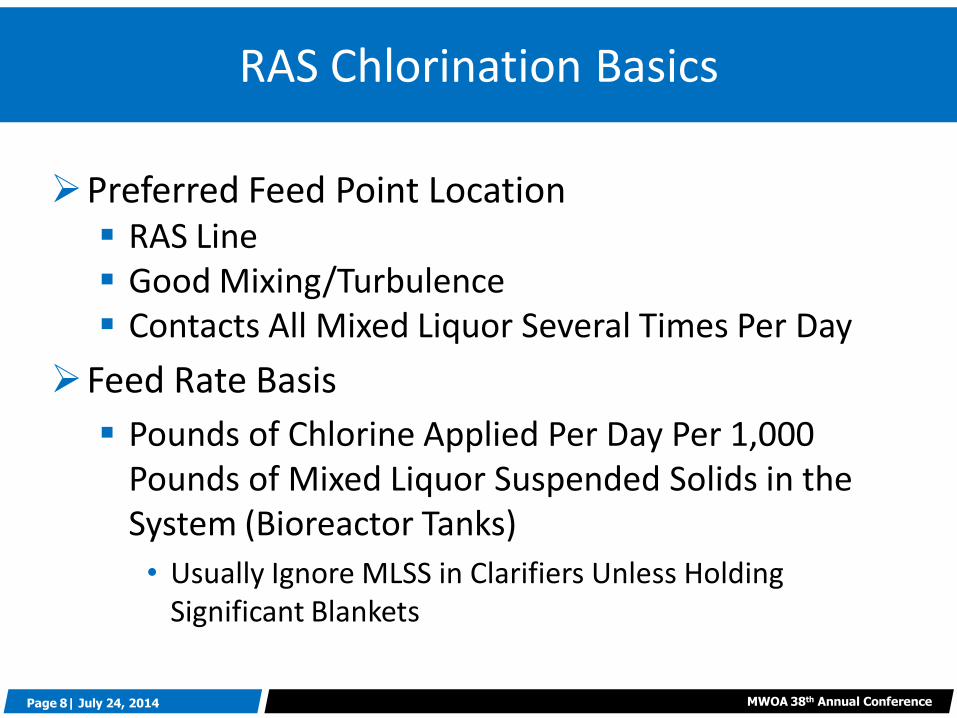
RAS Chlorination Basics
Preferred Feed Point Location RAS Line Good Mixing/Turbulence Contacts All Mixed Liquor Several Times Per Day
Feed Rate Basis
Pounds of Chlorine Applied Per Day Per 1,000 Pounds of Mixed Liquor Suspended Solids in the System (Bioreactor Tanks)
• Usually Ignore MLSS in Clarifiers Unless Holding Significant Blankets
Page 9| July 24, 2014 MWOA 38th Annual Conference
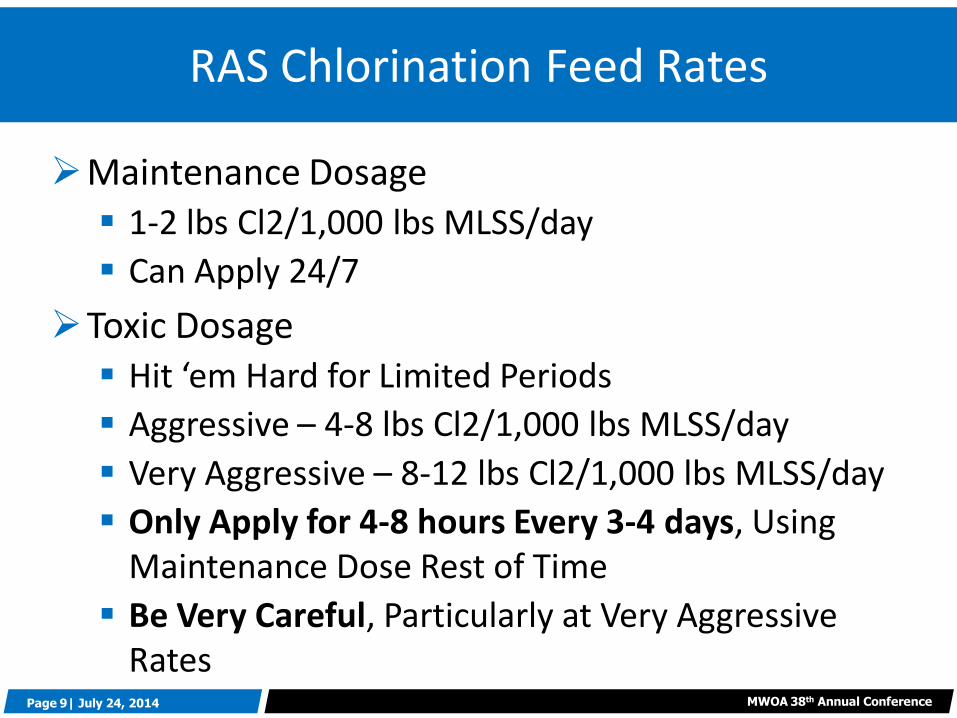
RAS Chlorination Feed Rates
Maintenance Dosage 1-2 lbs Cl2/1,000 lbs MLSS/day
Can Apply 24/7
Toxic Dosage Hit ‘em Hard for Limited Periods
Aggressive – 4-8 lbs Cl2/1,000 lbs MLSS/day
Very Aggressive – 8-12 lbs Cl2/1,000 lbs MLSS/day
Only Apply for 4-8 hours Every 3-4 days, Using Maintenance Dose Rest of Time
Be Very Careful, Particularly at Very Aggressive Rates
Page 10| July 24, 2014 MWOA 38th Annual Conference
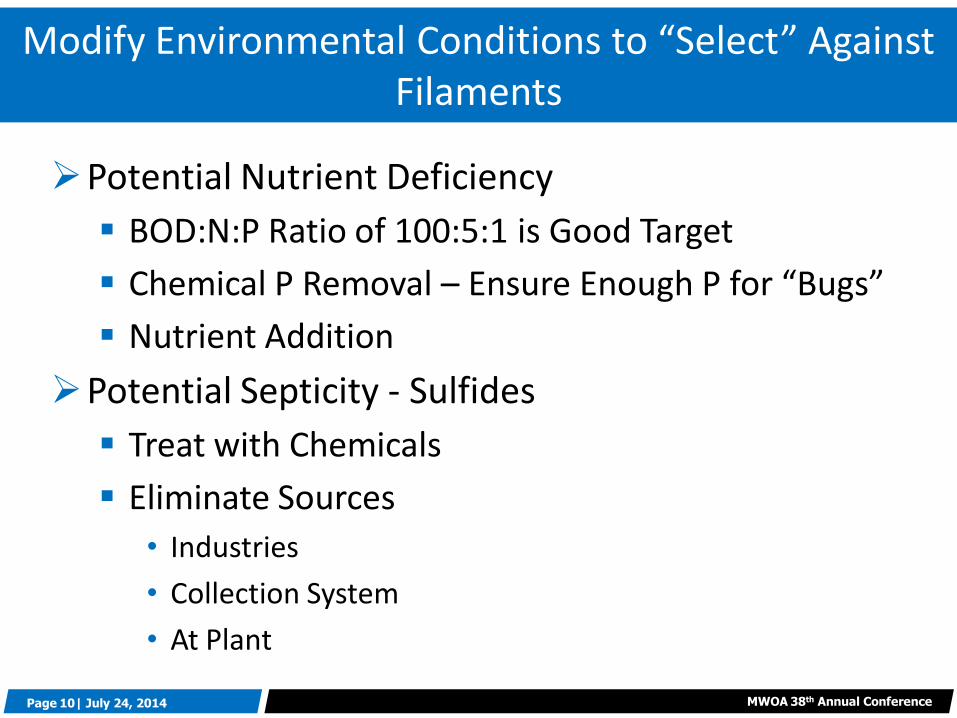
Modify Environmental Conditions to “Select” Against Filaments
Potential Nutrient Deficiency
BOD:N:P Ratio of 100:5:1 is Good Target
Chemical P Removal – Ensure Enough P for “Bugs”
Nutrient Addition
Potential Septicity - Sulfides
Treat with Chemicals
Eliminate Sources
• Industries
• Collection System
• At Plant
Page 11| July 24, 2014 MWOA 38th Annual Conference
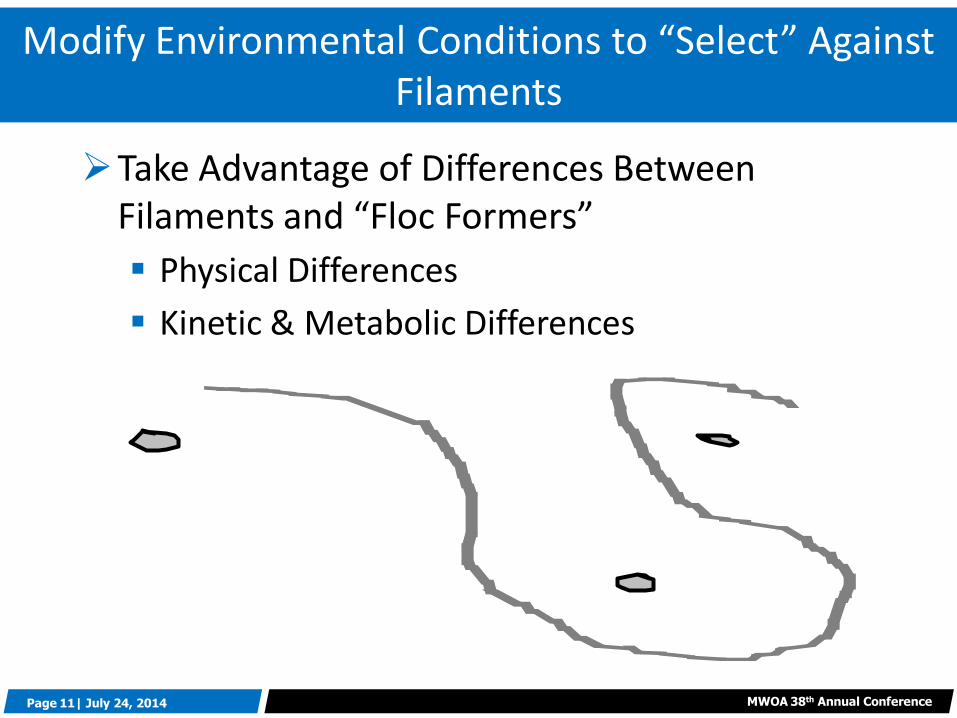
Take Advantage of Differences Between Filaments and “Floc Formers”
Physical Differences
Kinetic & Metabolic Differences
Modify Environmental Conditions to “Select” Against Filaments
Page 12| July 24, 2014 MWOA 38th Annual Conference
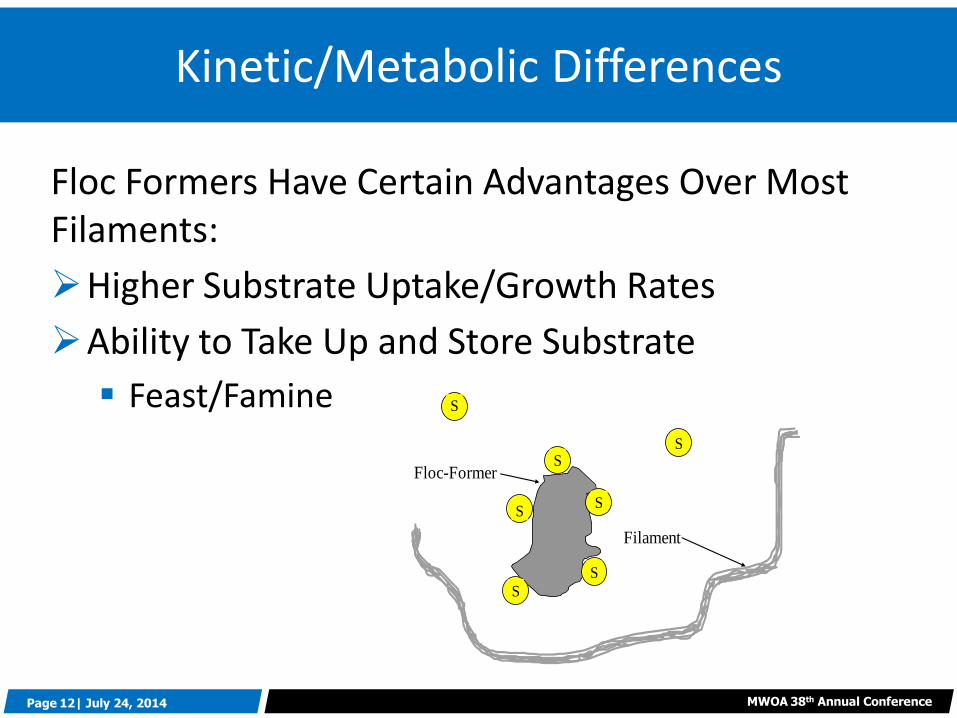
Kinetic/Metabolic Differences
Floc Formers Have Certain Advantages Over Most Filaments:
Higher Substrate Uptake/Growth Rates
Ability to Take Up and Store Substrate
Feast/Famine
Floc-Former
Filament
S
S
S
S
S
S
S
Page 13| July 24, 2014 MWOA 38th Annual Conference
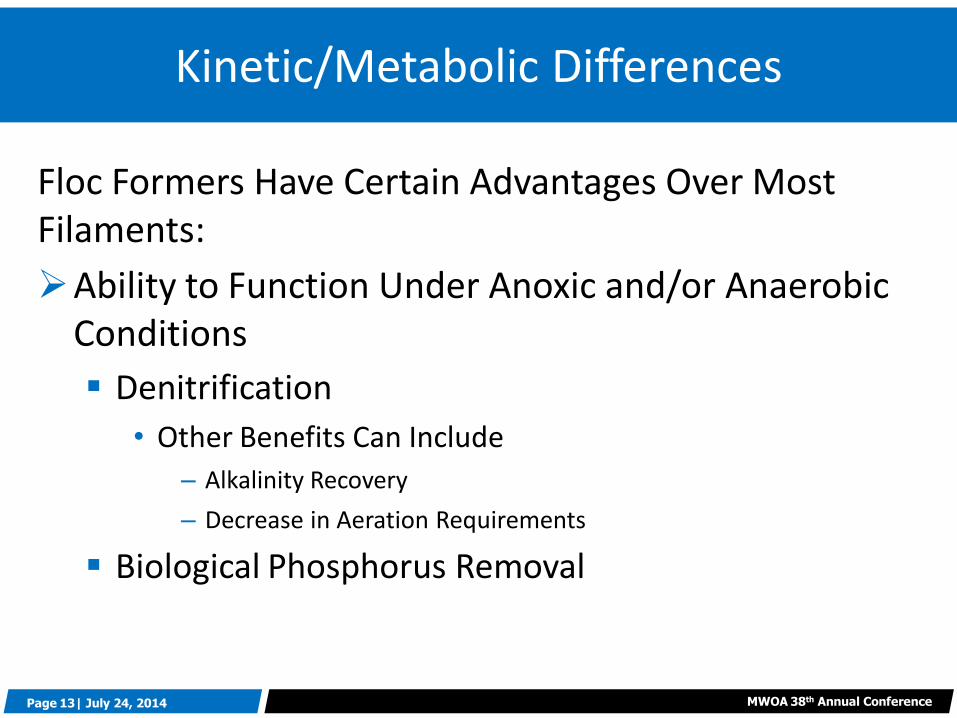
Kinetic/Metabolic Differences
Floc Formers Have Certain Advantages Over Most Filaments:
Ability to Function Under Anoxic and/or Anaerobic Conditions
Denitrification
• Other Benefits Can Include
– Alkalinity Recovery
– Decrease in Aeration Requirements
Biological Phosphorus Removal
Page 14| July 24, 2014 MWOA 38th Annual Conference
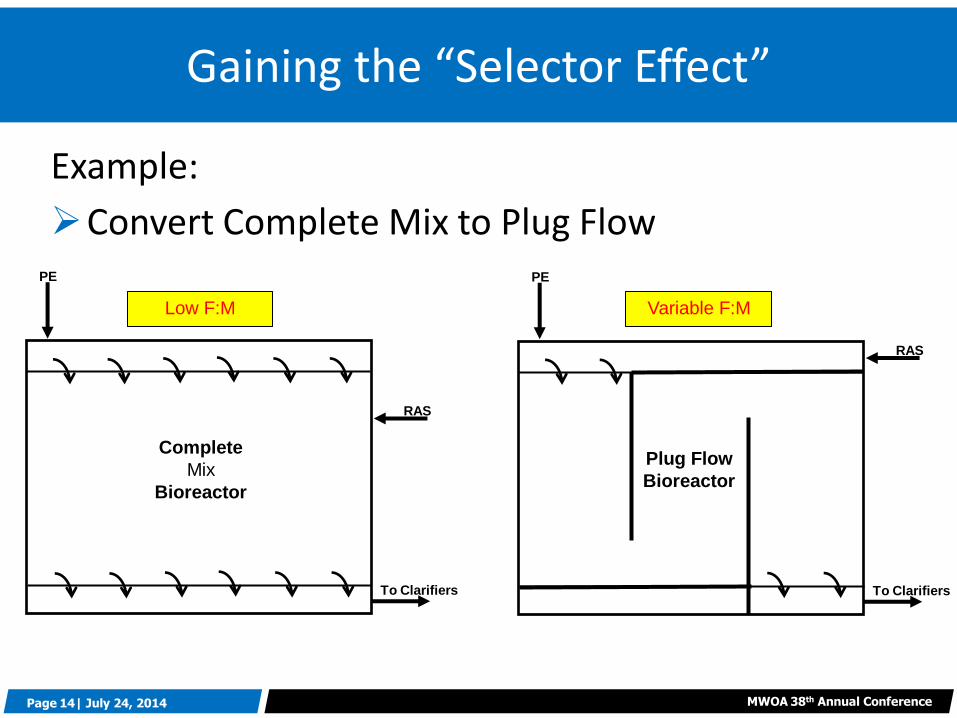
Gaining the “Selector Effect”
Example:
Convert Complete Mix to Plug Flow
RAS
PE
To Clarifiers
Complete
Mix
Bioreactor
RAS
PE
To Clarifiers
Plug Flow
Bioreactor
Variable F:M Low F:M
Page 15| July 24, 2014 MWOA 38th Annual Conference
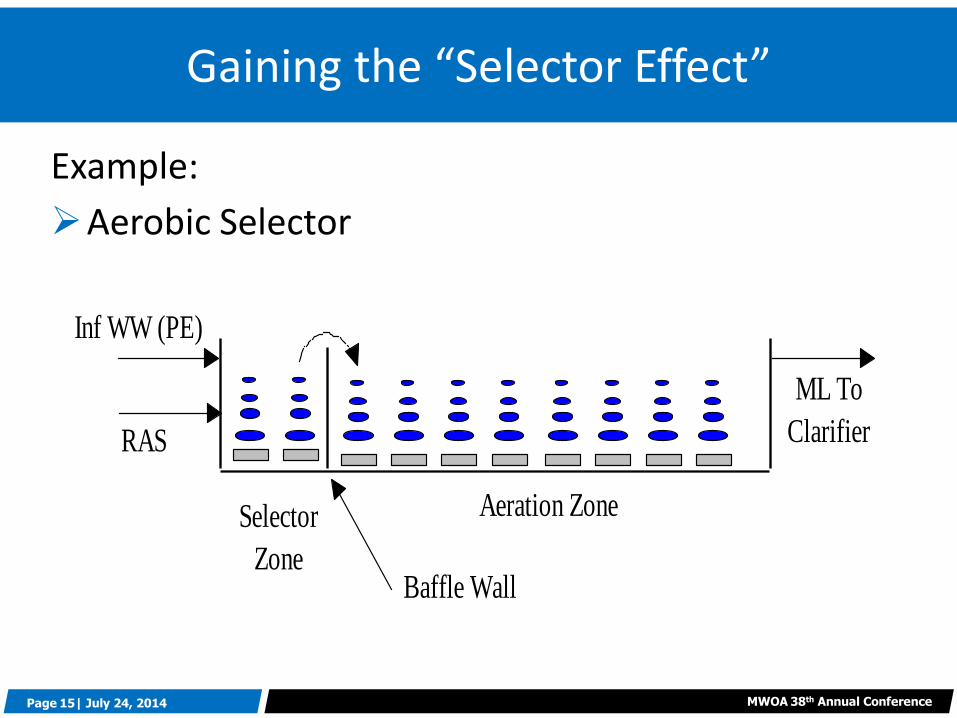
Gaining the “Selector Effect”
Example:
Aerobic Selector
ML To
Clarifier
Inf WW (PE)
RAS
Baffle Wall
Selector
Zone
Aeration Zone
Page 16| July 24, 2014 MWOA 38th Annual Conference
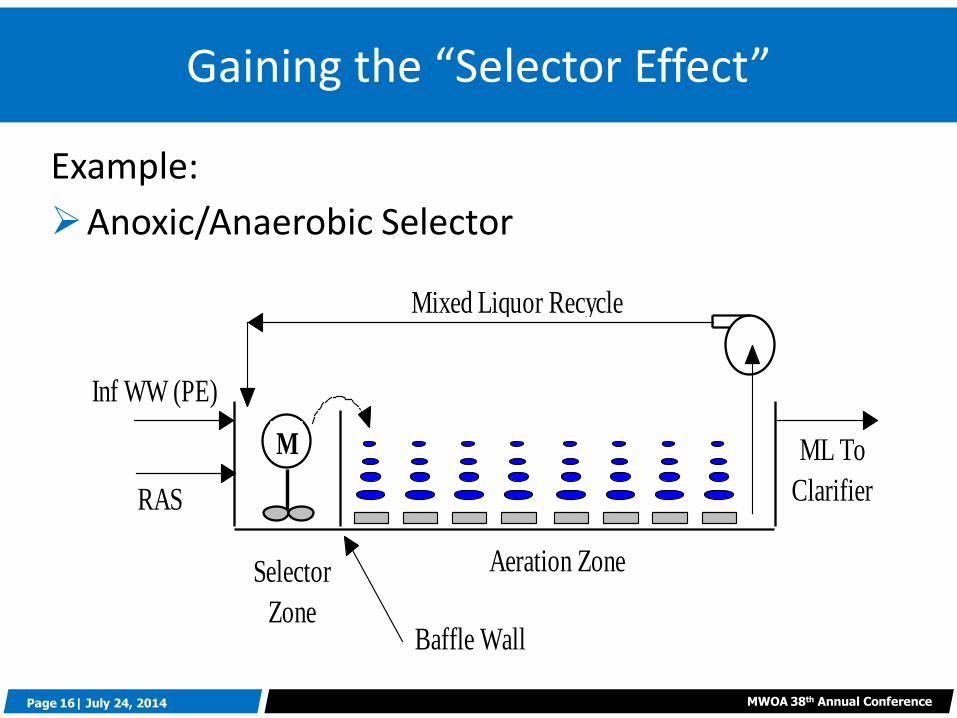
Gaining the “Selector Effect”
Example:
Anoxic/Anaerobic Selector
ML To
Clarifier
Inf WW (PE)
RAS
Baffle Wall
Selector
Zone
Aeration Zone
M
Mixed Liquor Recycle
Page 17| July 24, 2014 MWOA 38th Annual Conference
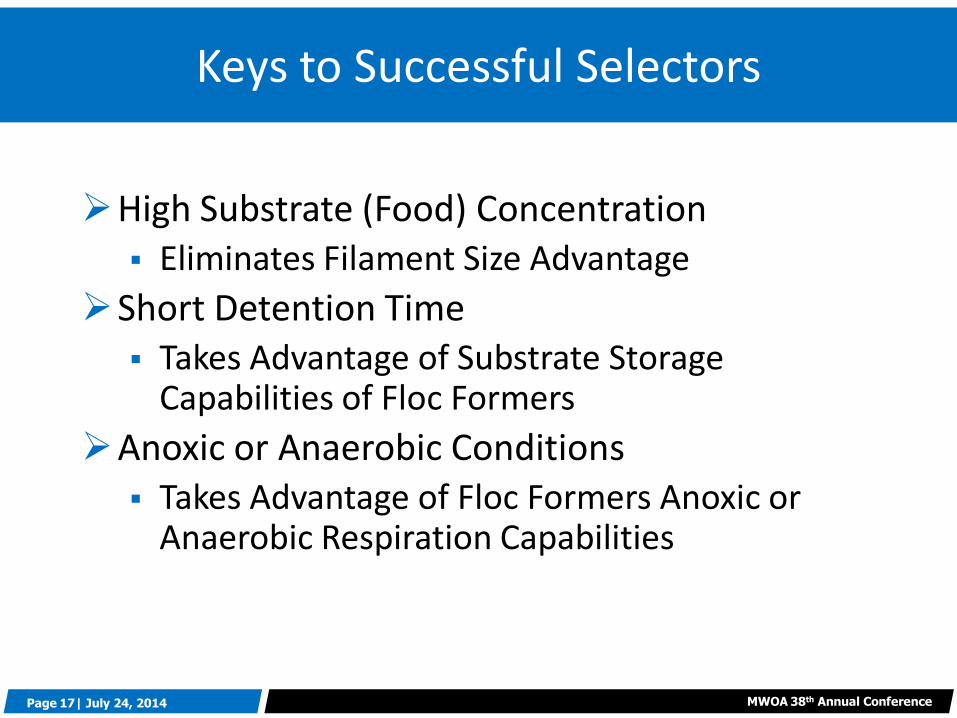
Keys to Successful Selectors
High Substrate (Food) Concentration Eliminates Filament Size Advantage
Short Detention Time Takes Advantage of Substrate Storage
Capabilities of Floc Formers
Anoxic or Anaerobic Conditions Takes Advantage of Floc Formers Anoxic or
Anaerobic Respiration Capabilities
Page 18| July 24, 2014 MWOA 38th Annual Conference
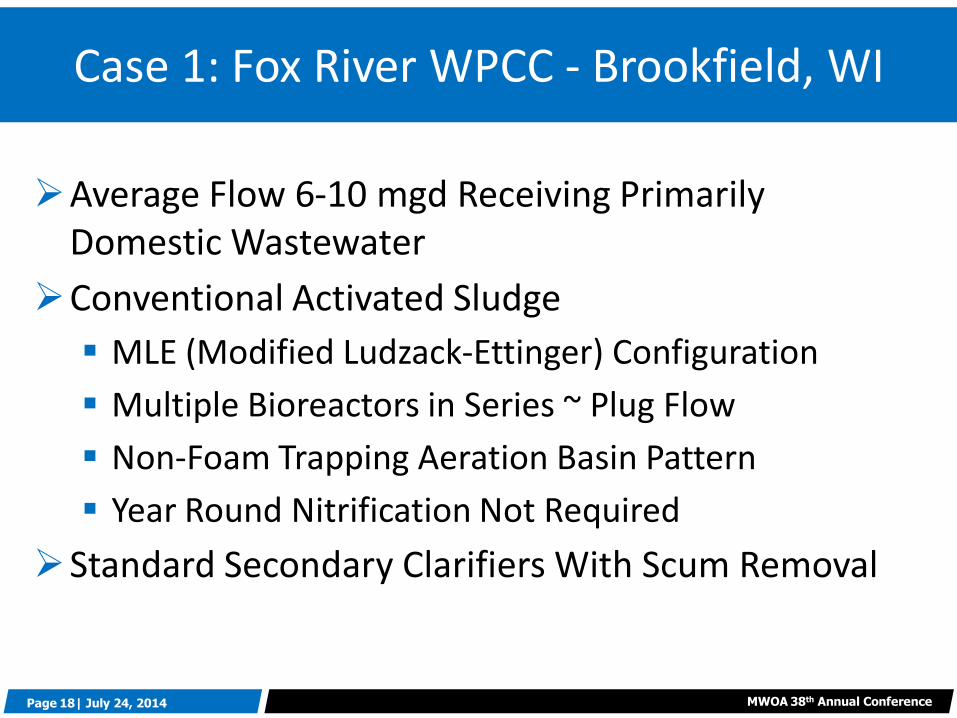
Average Flow 6-10 mgd Receiving Primarily Domestic Wastewater
Conventional Activated Sludge
MLE (Modified Ludzack-Ettinger) Configuration
Multiple Bioreactors in Series ~ Plug Flow
Non-Foam Trapping Aeration Basin Pattern
Year Round Nitrification Not Required
Standard Secondary Clarifiers With Scum Removal
Case 1: Fox River WPCC - Brookfield, WI
Page 19| July 24, 2014 MWOA 38th Annual Conference
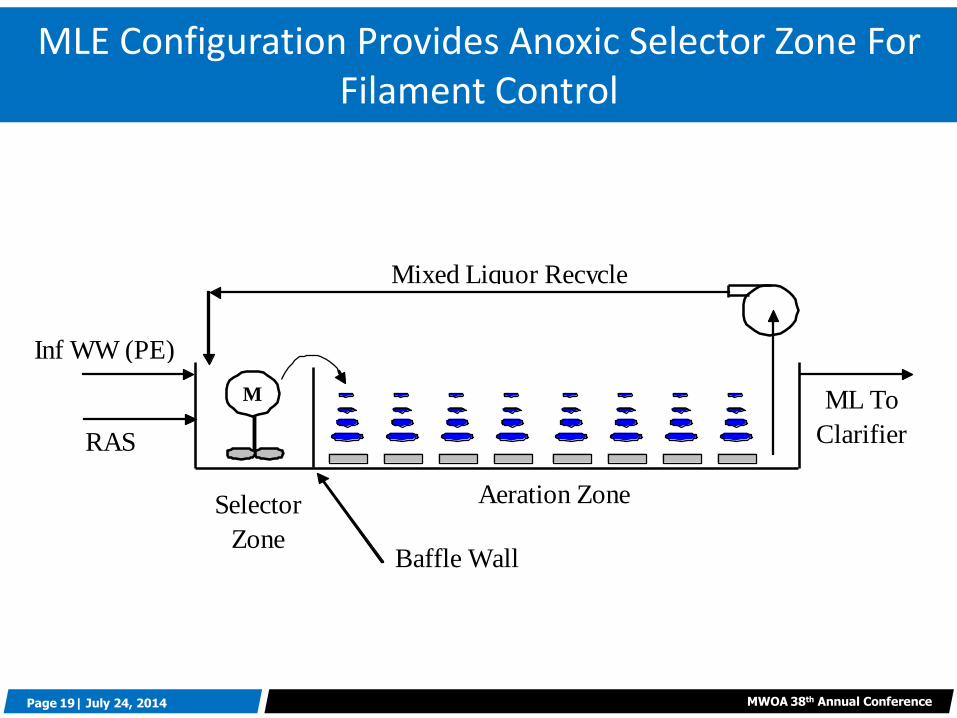
MLE Configuration Provides Anoxic Selector Zone For Filament Control
ML To
Clarifier
Inf WW (PE)
RAS
Baffle Wall
Selector
Zone
Aeration Zone
M
Mixed Liquor Recycle
Page 20| July 24, 2014 MWOA 38th Annual Conference
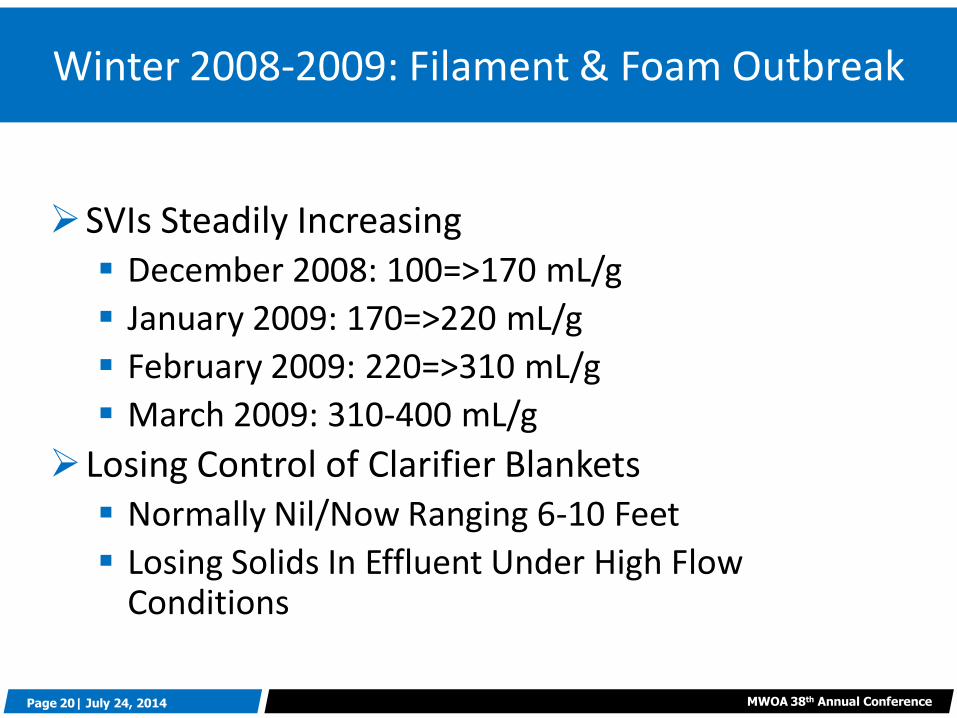
Winter 2008-2009: Filament & Foam Outbreak
SVIs Steadily Increasing December 2008: 100=>170 mL/g
January 2009: 170=>220 mL/g
February 2009: 220=>310 mL/g
March 2009: 310-400 mL/g
Losing Control of Clarifier Blankets Normally Nil/Now Ranging 6-10 Feet
Losing Solids In Effluent Under High Flow Conditions
Page 21| July 24, 2014 MWOA 38th Annual Conference
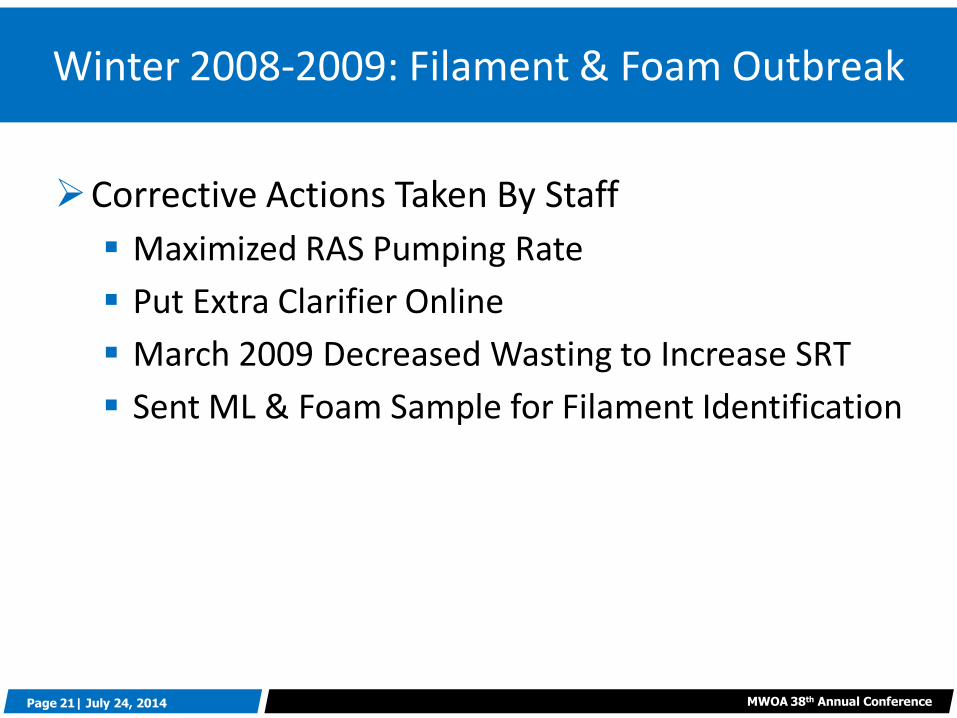
Corrective Actions Taken By Staff
Maximized RAS Pumping Rate
Put Extra Clarifier Online
March 2009 Decreased Wasting to Increase SRT
Sent ML & Foam Sample for Filament Identification
Winter 2008-2009: Filament & Foam Outbreak
Page 22| July 24, 2014 MWOA 38th Annual Conference
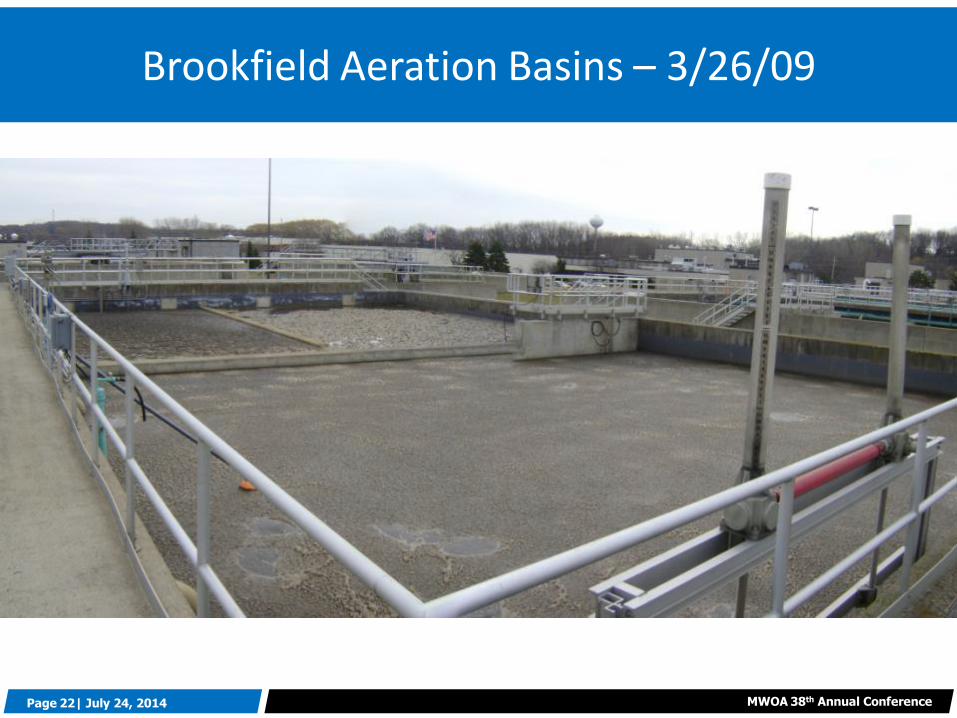
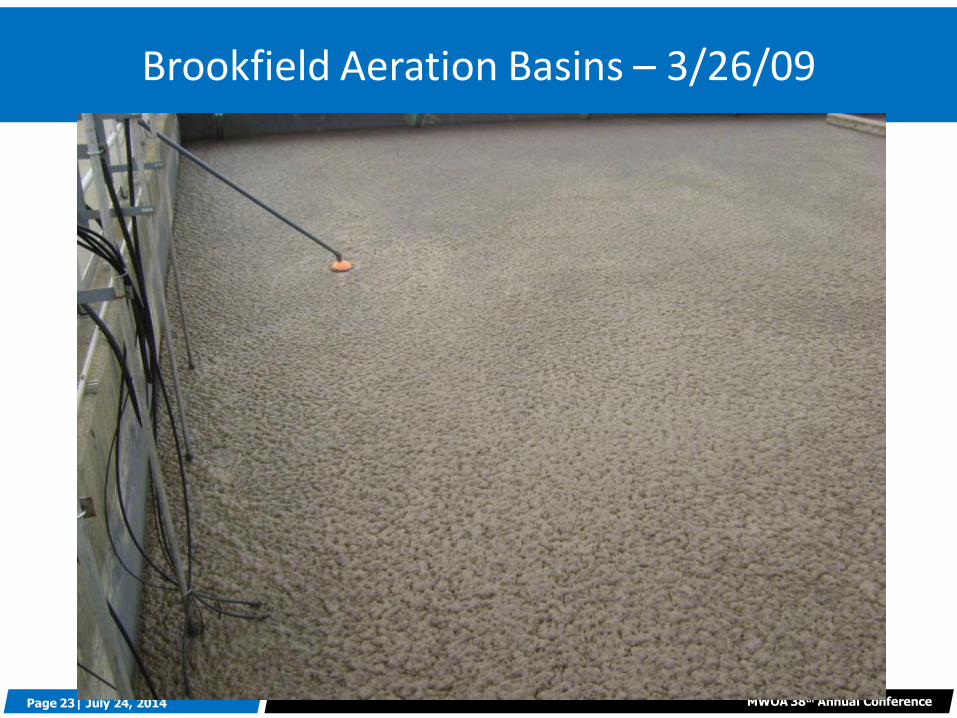
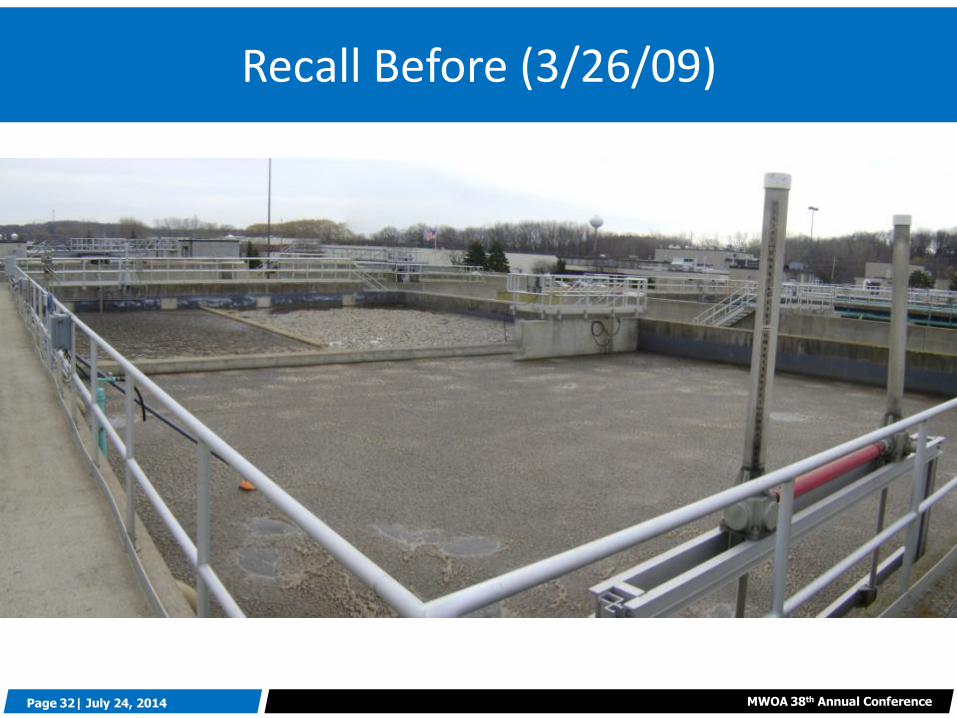
Brookfield Aeration Basins – 3/26/09
Page 23| July 24, 2014 MWOA 38th Annual Conference
Brookfield Aeration Basins – 3/26/09
Page 24| July 24, 2014 MWOA 38th Annual Conference
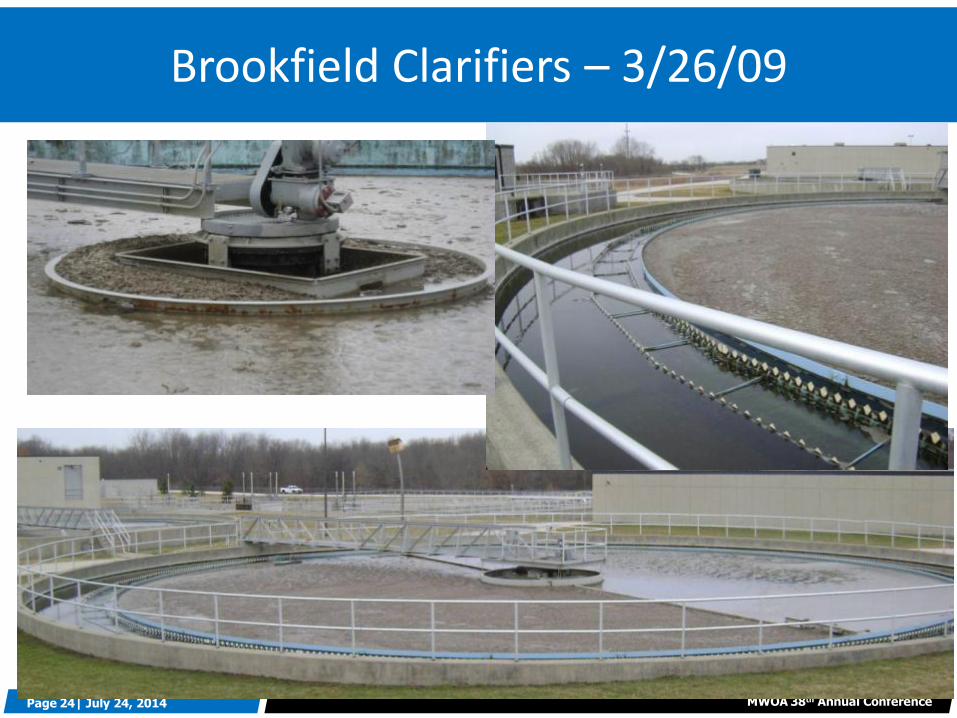
Brookfield Clarifiers – 3/26/09
Page 25| July 24, 2014 MWOA 38th Annual Conference
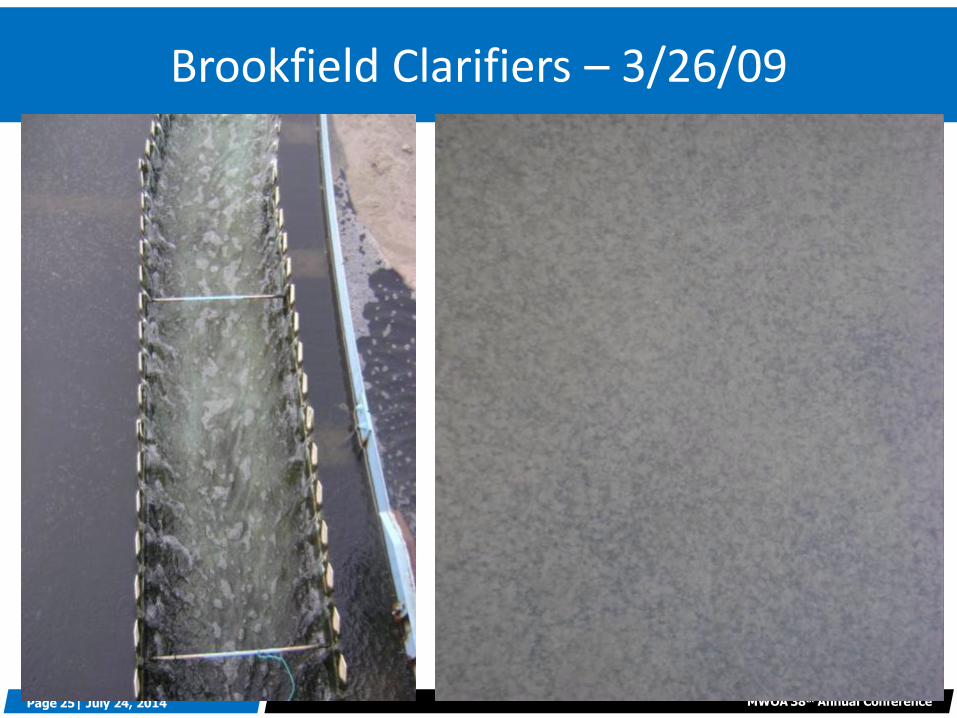
Brookfield Clarifiers – 3/26/09
Page 26| July 24, 2014 MWOA 38th Annual Conference
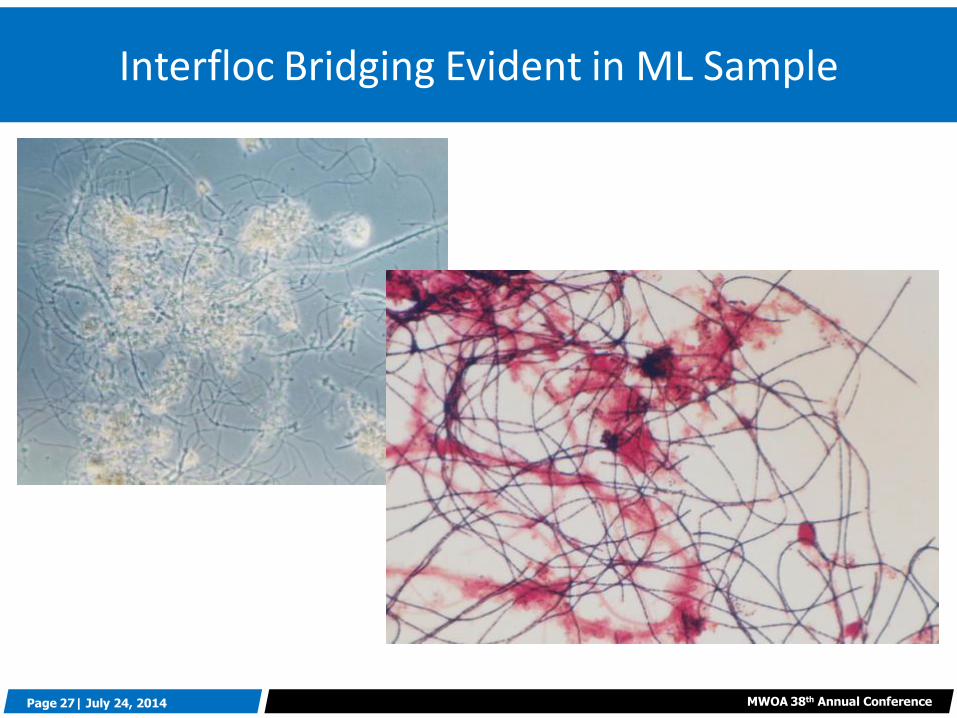
Mixed Liquor Sample
Mature Population Indicative of Nitrifying A.S.
High Level of Microthrix Parvicella
• 5.5 on Scale of 0-6
Moderate to High Level of Type 0041 Filaments
• 4 to 4.5 on 0-6 Scale
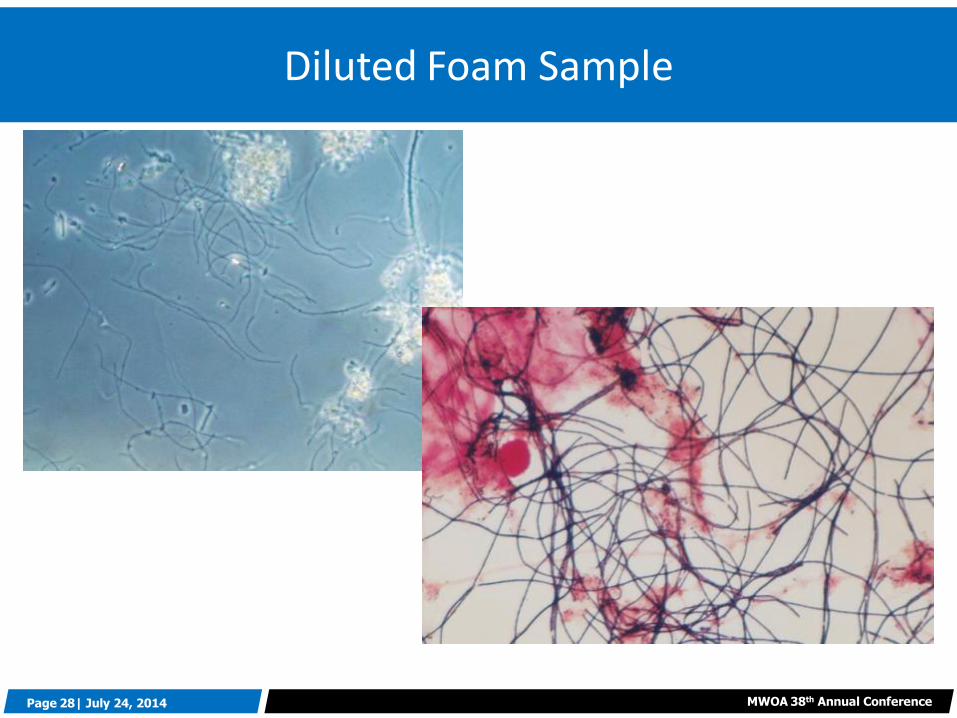
Foam Sample
Microthrix Parvicella
Microscopic Evaluation Results
Page 27| July 24, 2014 MWOA 38th Annual Conference
Interfloc Bridging Evident in ML Sample
Page 28| July 24, 2014 MWOA 38th Annual Conference
Diluted Foam Sample
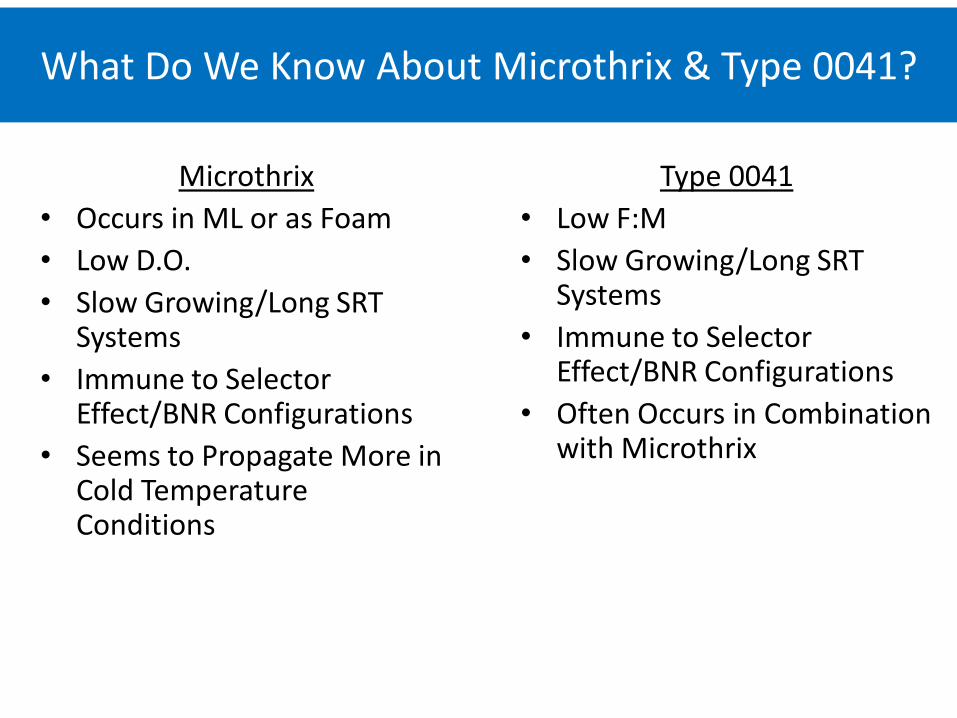
What Do We Know About Microthrix & Type 0041?
Microthrix
• Occurs in ML or as Foam
• Low D.O.
• Slow Growing/Long SRT Systems
• Immune to Selector Effect/BNR Configurations
• Seems to Propagate More in Cold Temperature Conditions
Type 0041
• Low F:M
• Slow Growing/Long SRT Systems
• Immune to Selector Effect/BNR Configurations
• Often Occurs in Combination with Microthrix
Page 30| July 24, 2014 MWOA 38th Annual Conference
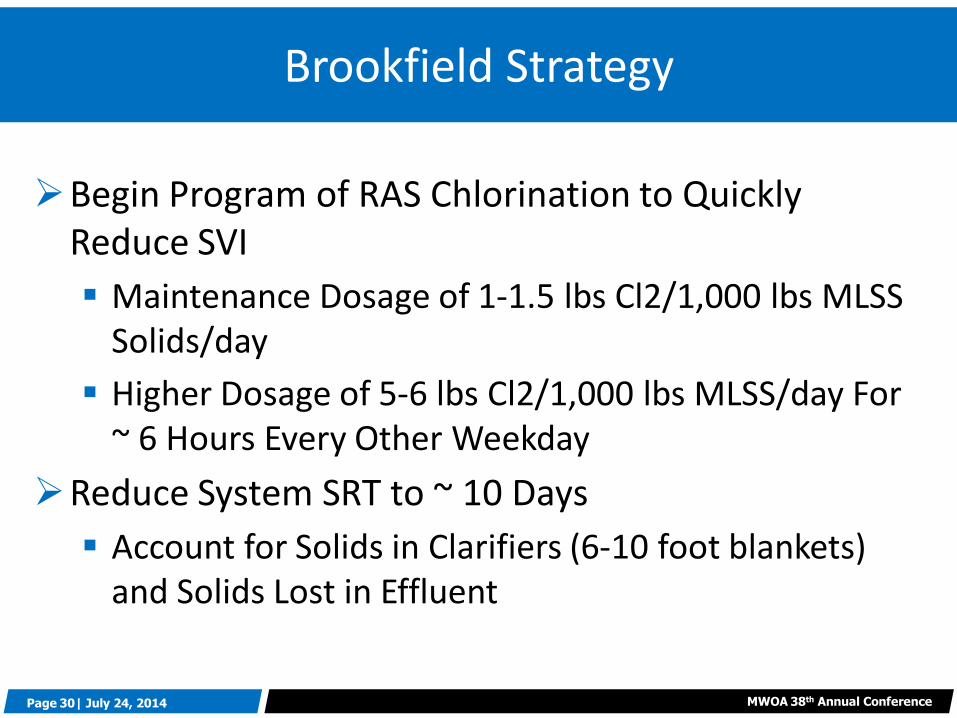
Begin Program of RAS Chlorination to Quickly Reduce SVI
Maintenance Dosage of 1-1.5 lbs Cl2/1,000 lbs MLSS Solids/day
Higher Dosage of 5-6 lbs Cl2/1,000 lbs MLSS/day For ~ 6 Hours Every Other Weekday
Reduce System SRT to ~ 10 Days
Account for Solids in Clarifiers (6-10 foot blankets) and Solids Lost in Effluent
Brookfield Strategy
Page 31| July 24, 2014 MWOA 38th Annual Conference
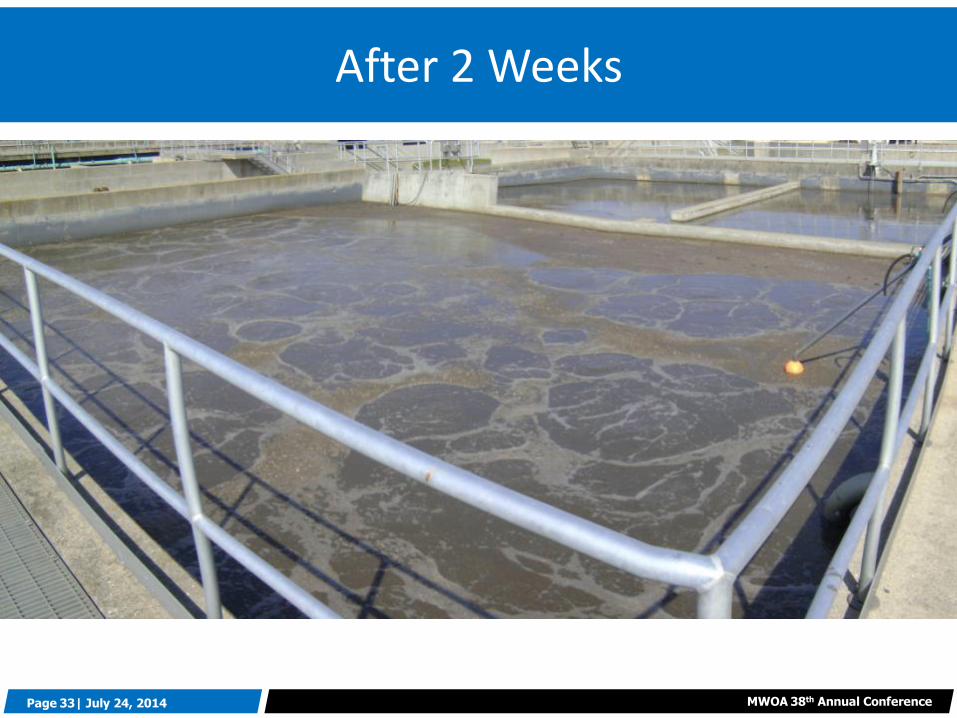
SVIs < 200 mL/g (From High of 400 mL/g)
Filament Counts ~ 3 (on 0-6 Scale)
Very Little Foam
Clarifier Blankets < 2 feet in All Clarifiers
Continuing Maintenance Chlorine Dosage & Using Higher Dosage 1-2 Times/Week for 4-6 Hours Per Time
Results Within ~ 2 Weeks
Page 32| July 24, 2014 MWOA 38th Annual Conference
Recall Before (3/26/09)
Page 33| July 24, 2014 MWOA 38th Annual Conference
After 2 Weeks
Page 34| July 24, 2014 MWOA 38th Annual Conference
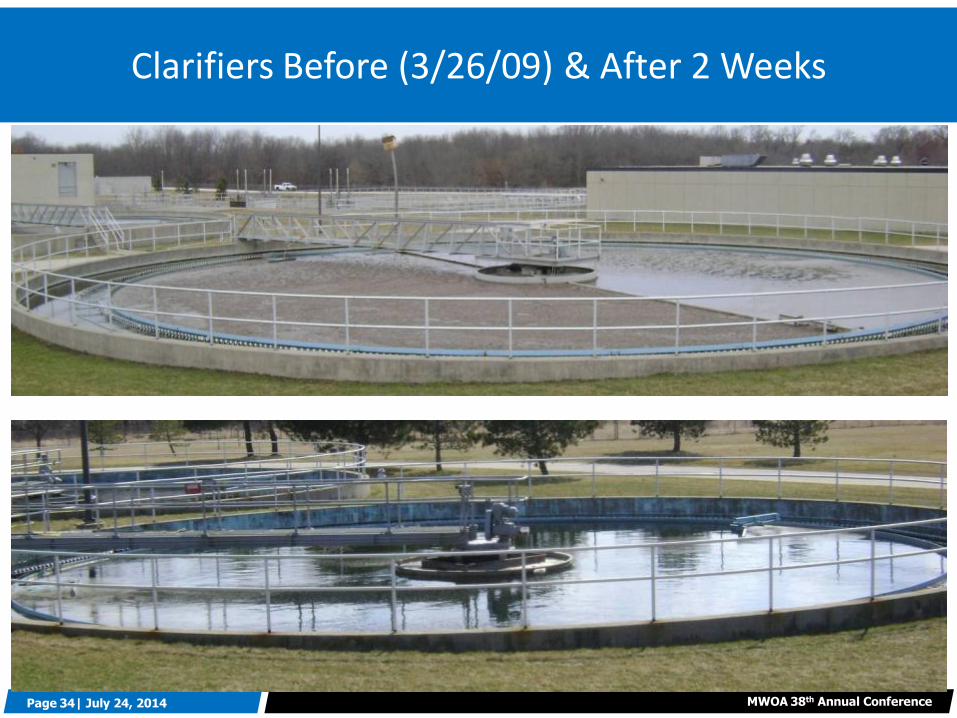
Clarifiers Before (3/26/09) & After 2 Weeks
Page 35| July 24, 2014 MWOA 38th Annual Conference
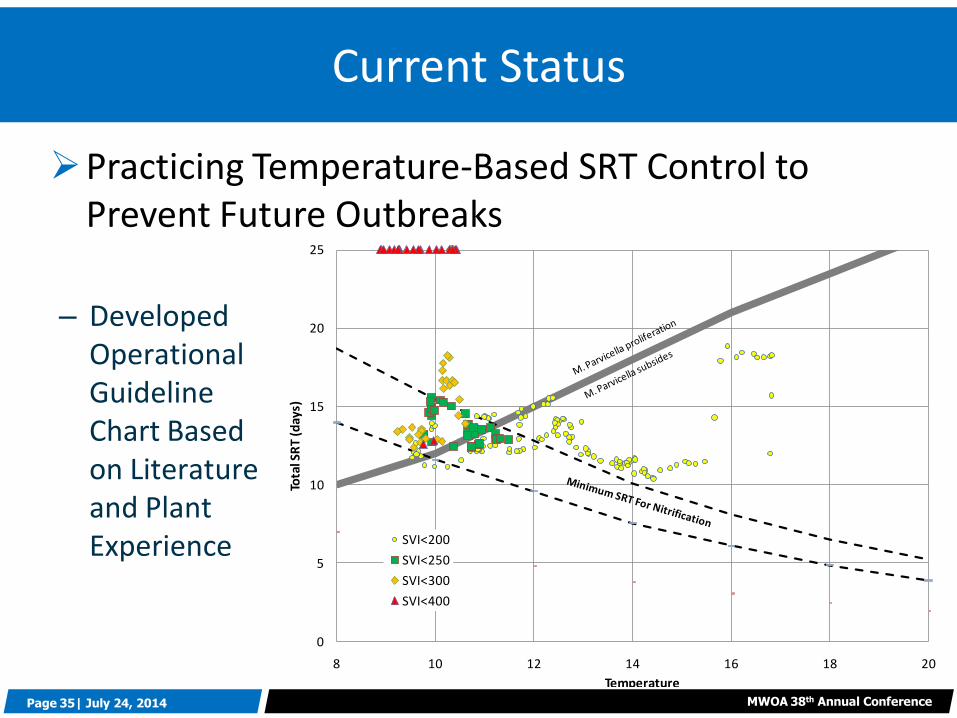
Practicing Temperature-Based SRT Control to Prevent Future Outbreaks
Current Status
0
5
10
15
20
25
8 10 12 14 16 18 20
Tota
l SR
T (d
ays)
Temperature
SVI<200
SVI<250
SVI<300
SVI<400
– Developed Operational Guideline Chart Based on Literature and Plant Experience
Page 36| July 24, 2014 MWOA 38th Annual Conference
Activated Sludge Replacing RBC Plant
Average Flow 2-3 mgd Receiving Primarily Domestic Wastewater
BNR Activated Sludge Three 2-Pass Reactors ~ Plug Flow, Non-Foam
Trapping
Future: Combination Anaerobic/Anoxic Selector Zones
State of Art Secondary Clarifiers
Flow Paced RAS Pumping
Case 2: Marquette, MI WWTP
Page 37| July 24, 2014 MWOA 38th Annual Conference
Significant Digester Foaming Problems No Excessive Foam in Activated Sludge System
Chemical P Removal – Adding Ferric Chloride to Raw Wastewater Upstream of Primaries
Experienced Increasing SVI From January – Early March 2009 Increase From 80-90 mL/g to 200-240 mL/g
Secondary Clarifier Blankets of 10-12 feet or more
2008-2009 Issues
Page 38| July 24, 2014 MWOA 38th Annual Conference
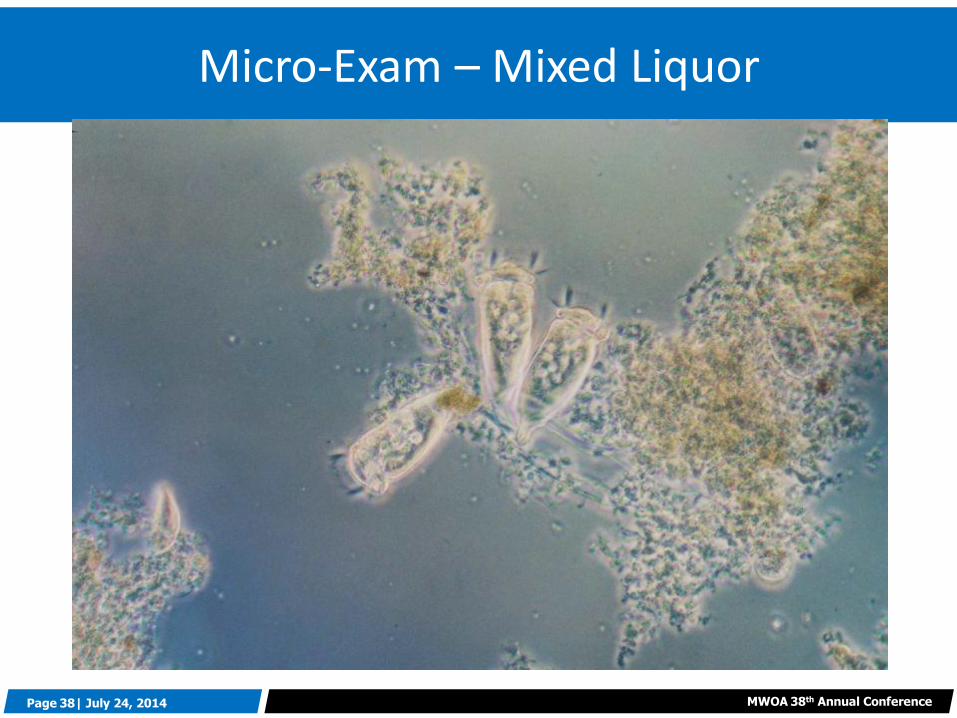
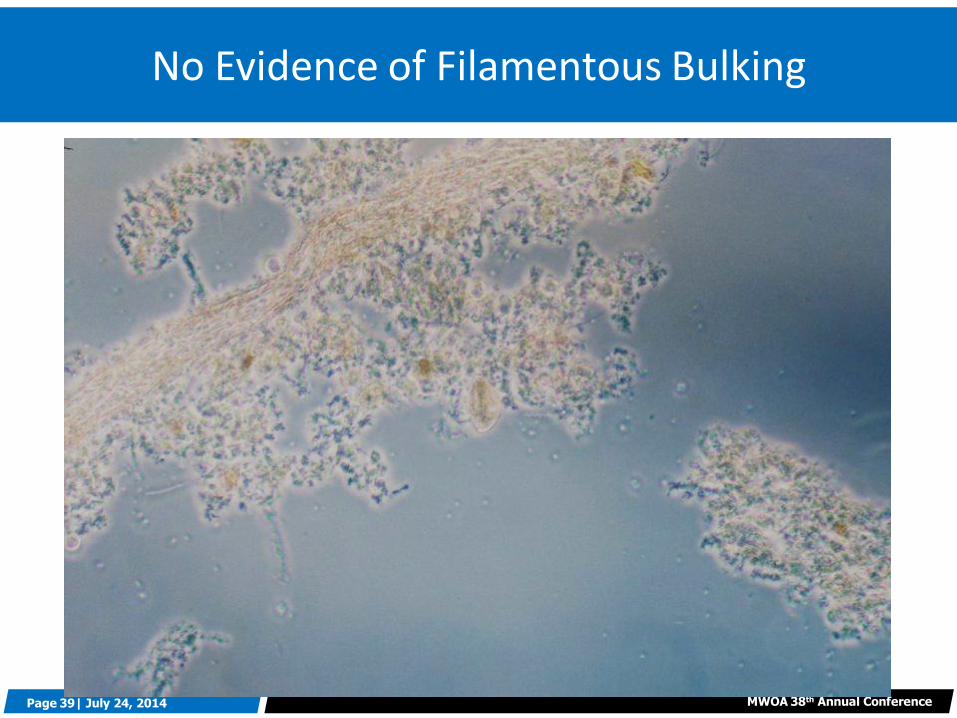
Micro-Exam – Mixed Liquor
Page 39| July 24, 2014 MWOA 38th Annual Conference
No Evidence of Filamentous Bulking
Page 40| July 24, 2014 MWOA 38th Annual Conference
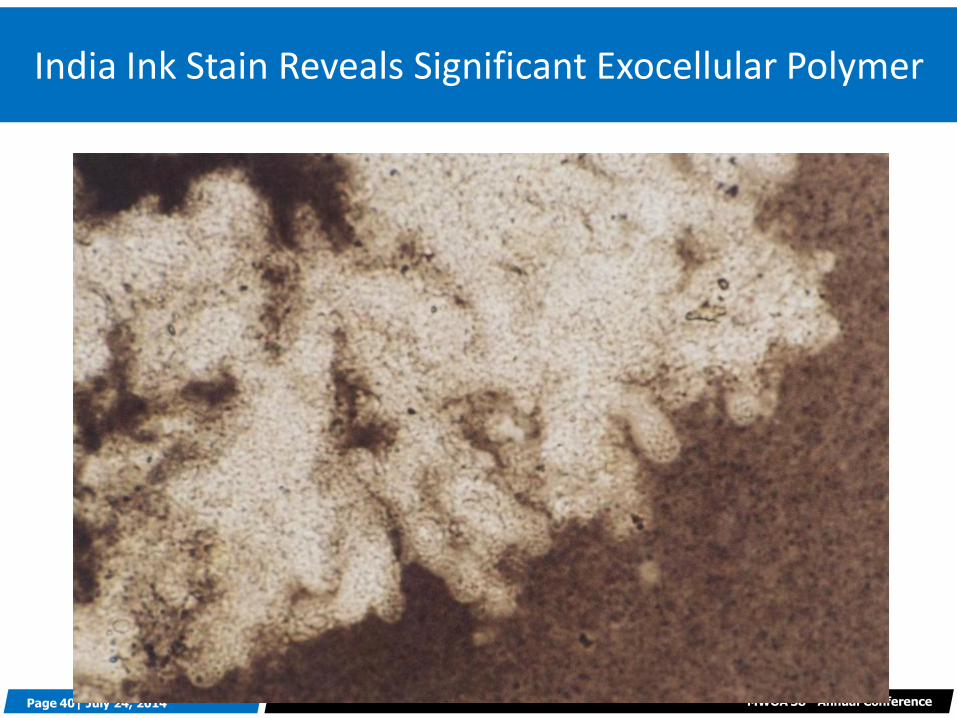
India Ink Stain Reveals Significant Exocellular Polymer
Page 41| July 24, 2014 MWOA 38th Annual Conference
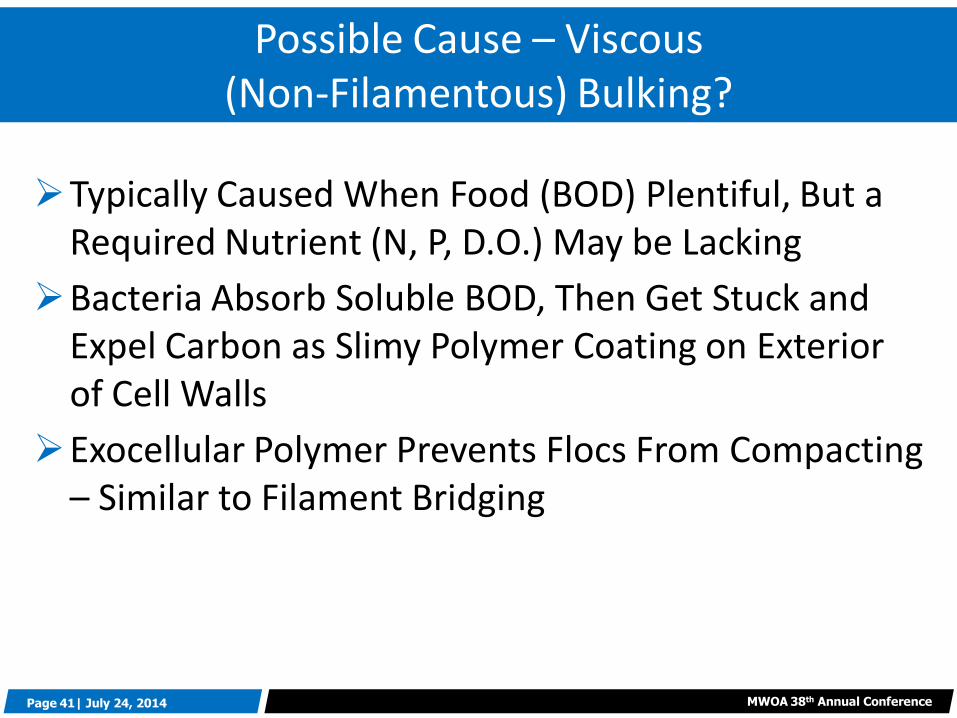
Typically Caused When Food (BOD) Plentiful, But a Required Nutrient (N, P, D.O.) May be Lacking
Bacteria Absorb Soluble BOD, Then Get Stuck and Expel Carbon as Slimy Polymer Coating on Exterior of Cell Walls
Exocellular Polymer Prevents Flocs From Compacting – Similar to Filament Bridging
Possible Cause – Viscous (Non-Filamentous) Bulking?
Page 42| July 24, 2014 MWOA 38th Annual Conference
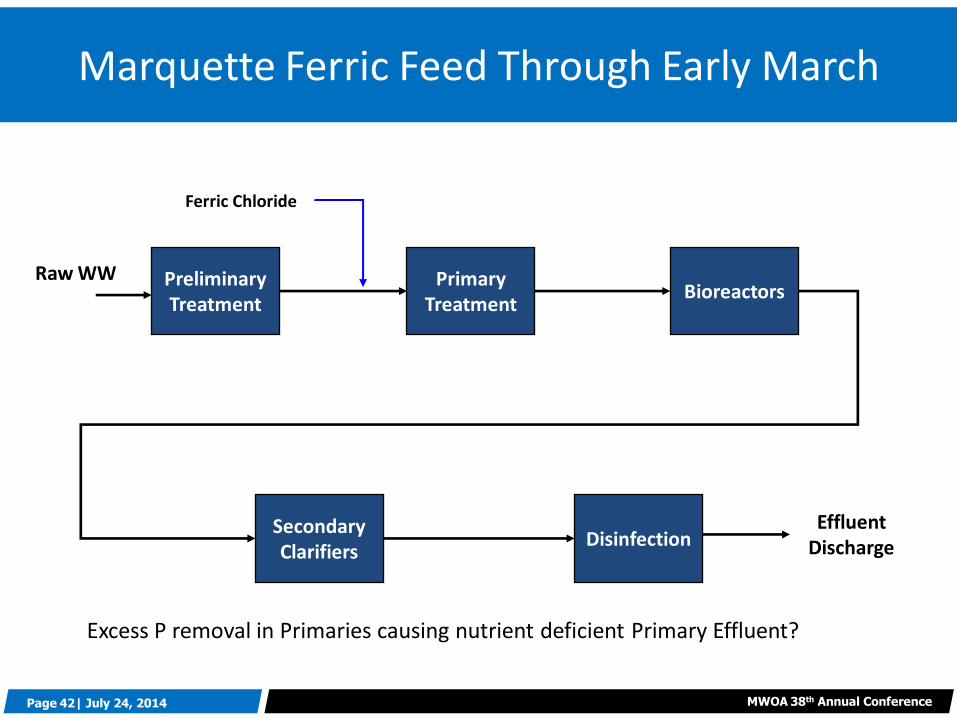
Marquette Ferric Feed Through Early March
Preliminary Treatment
Primary Treatment
Bioreactors
Secondary Clarifiers
Disinfection
Raw WW
Effluent Discharge
Ferric Chloride
Excess P removal in Primaries causing nutrient deficient Primary Effluent?
Page 43| July 24, 2014 MWOA 38th Annual Conference
Brought 3rd Aeration Basin Online to Reduce MLSS Concentration & Minimize Clarifier Solids Loading
Increased RAS Pumping Rate Out of Clarifiers
Split Ferric Feed Between Primaries and Just Upstream of Secondary Clarifiers
Corrective Actions Taken Mid-March
Page 44| July 24, 2014 MWOA 38th Annual Conference
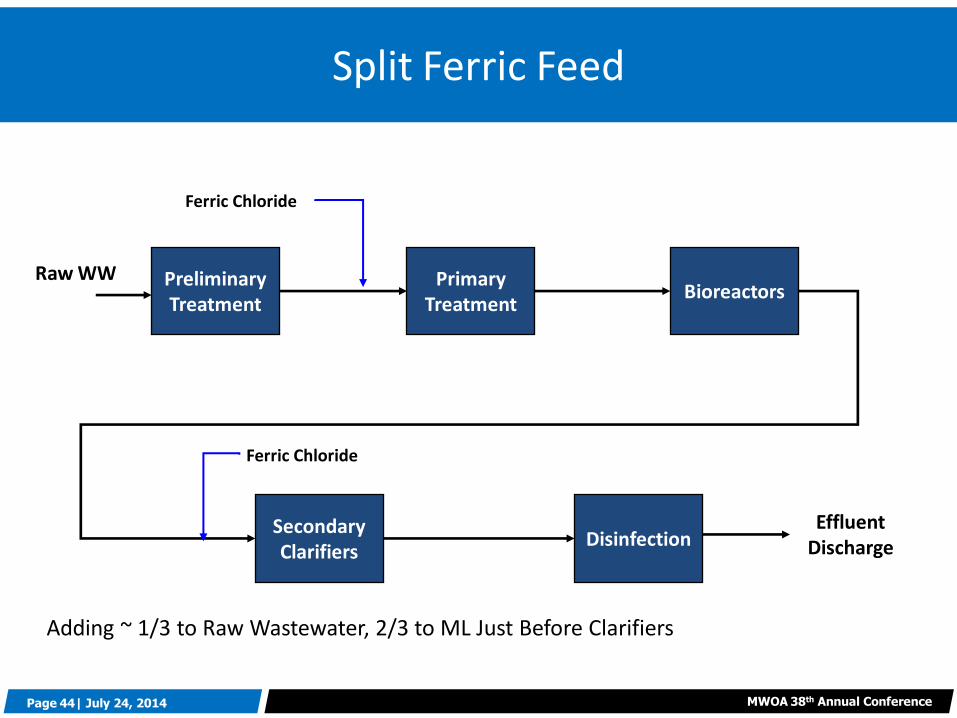
Split Ferric Feed
Preliminary Treatment
Primary Treatment
Bioreactors
Secondary Clarifiers
Disinfection
Raw WW
Effluent Discharge
Ferric Chloride
Ferric Chloride
Adding ~ 1/3 to Raw Wastewater, 2/3 to ML Just Before Clarifiers
Page 45| July 24, 2014 MWOA 38th Annual Conference
SVIs Dropped Back to Normal Range of 90-120 mL/g
Blankets Dropped to < 2 Feet
No Change in Digester Foaming Problems
Results – Early April
Page 46| July 24, 2014 MWOA 38th Annual Conference
2-3 MGD WWTP Serving Mix of Industrial & Residential
Flow Train: Primary Clarification
Roughing Trickling Filters Complete Mix Aeration Tanks Secondary Clarifiers Disinfection
Try to Avoid Nitrification
Undergoing Major Upgrade
TF Media Replacement
Plug Flow Aeration Basins
Case 3: Faribault, MN
Page 47| July 24, 2014 MWOA 38th Annual Conference
High Secondary Clarifier Blankets (> 12 feet)
Low SRT (~ 3-5 days), Partial Bypass of Roughing Filters, Adequate D.O. in Aeration Tanks
SVIs Rising (250-300+mL/g)
Losing Blankets Under High/Storm Flows
Filament Outbreak Summer 2009
Page 48| July 24, 2014 MWOA 38th Annual Conference
Initiate Chlorination of Aeration Tank Effluent
~2.5 lbs Cl2/1,000 lbs MLSS/day
ML Sample Sent for Microscopic Examination
Predominant Filament Identified as 021N
Actions Taken
Page 49| July 24, 2014 MWOA 38th Annual Conference
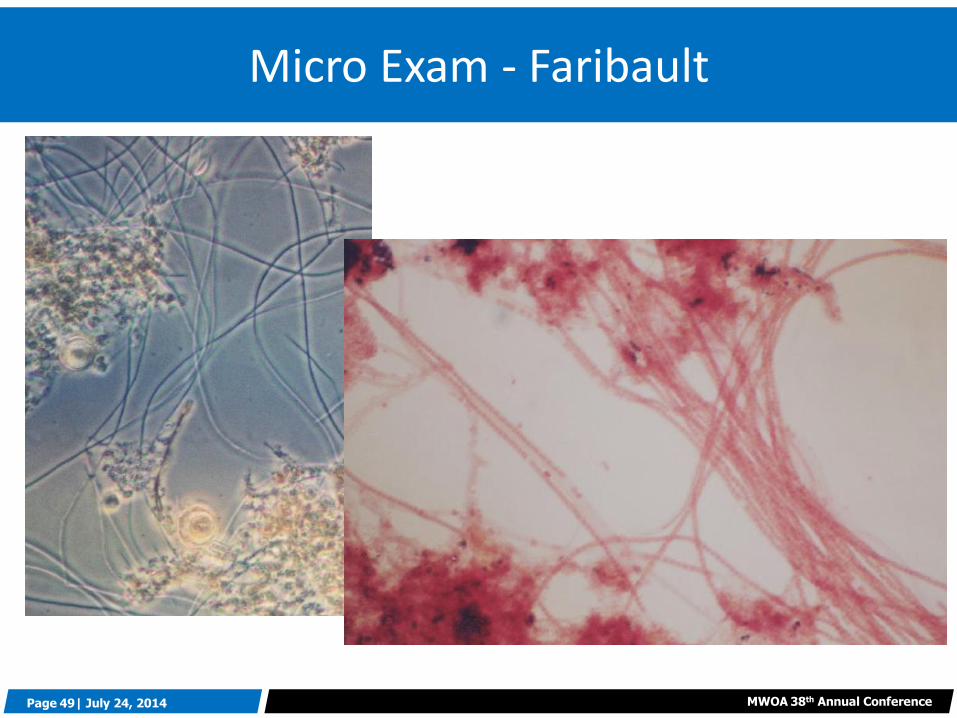
Micro Exam - Faribault
Page 50| July 24, 2014 MWOA 38th Annual Conference
Large, Long Filament
Reported Possible Causes
High Organic Acids
Hydrogen Sulfide/Septic Conditions
Nutrient Deficiency
Organic Acids & Nutrient Deficiency Ruled Out
Activated Sludge Influent Tested for Sulfides
> 2 mg/L
O21N Reported to Occur @ Sulfides of 0.4 mg/L
Filament 021N
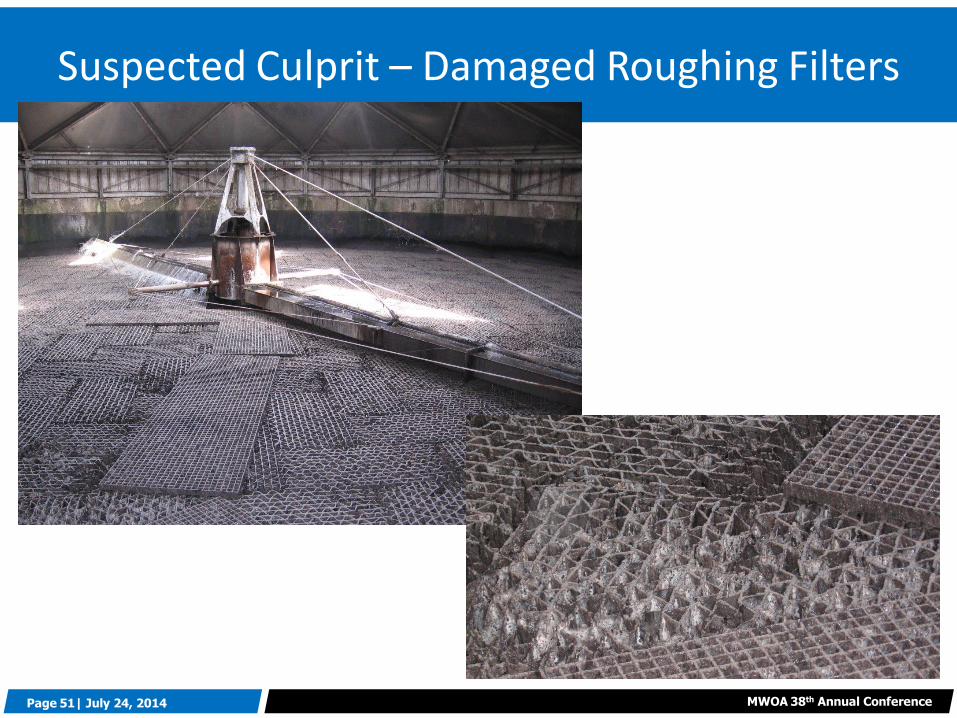
Page 51| July 24, 2014 MWOA 38th Annual Conference
Suspected Culprit – Damaged Roughing Filters
Page 52| July 24, 2014 MWOA 38th Annual Conference
ML Chlorination 2.5 lbs Cl2/1,000 lbs MLSS/d
Lowered SVIs to <150 mL/g
Brought Clarifier Blankets Under Control
Evaluated AI Chlorination vs ML Chlorination AI Chlorination Would Require 200+ lbs/day Cl2
ML Chlorination Would Require 30-60 lbs/day Cl2
Result – Use ML Chlorination as Required
Long Term Plant Upgrade Has Resolved Septicity/H2S Problem and
Filament Outbreaks Have Ended
Faribault Results
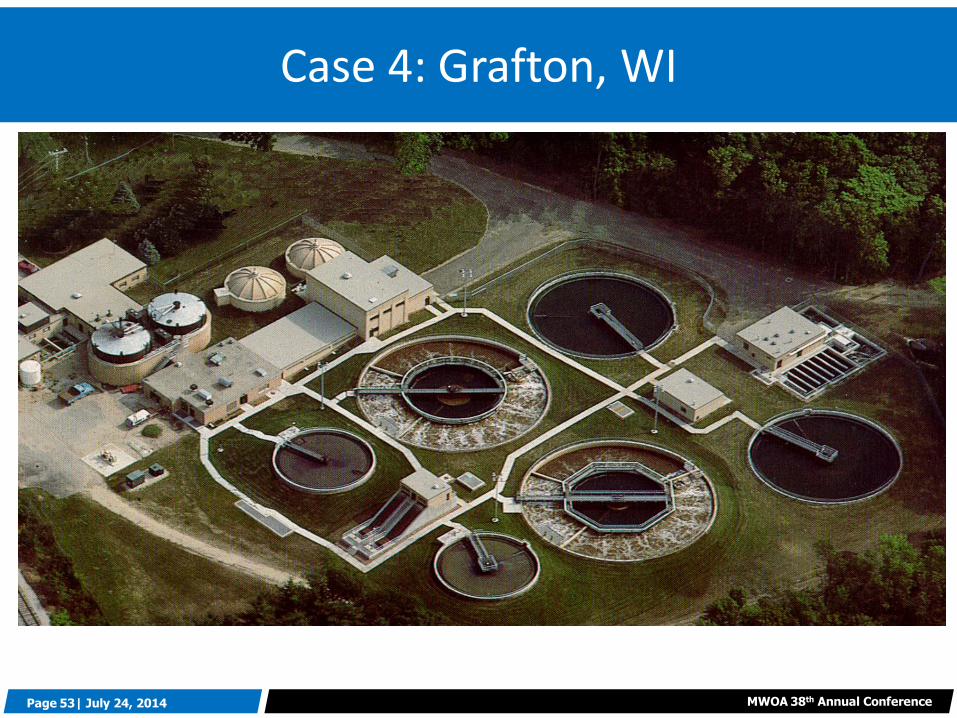
Page 53| July 24, 2014 MWOA 38th Annual Conference
Case 4: Grafton, WI
Page 54| July 24, 2014 MWOA 38th Annual Conference
Prior to 2005, Filaments Common
− 021N & Spaerotilus/S.Natans Typical
Filamentous Outbreaks (6) in 2003
− Control w/CL Feed, 58 days/613 lbs
Filamentous Outbreaks (12) in 2004
− CL Feed Jan-Oct; 149 days/2,023 lbs
(93% Increase in 2004 CL Usage)
Grafton Package Plant Historical Performance
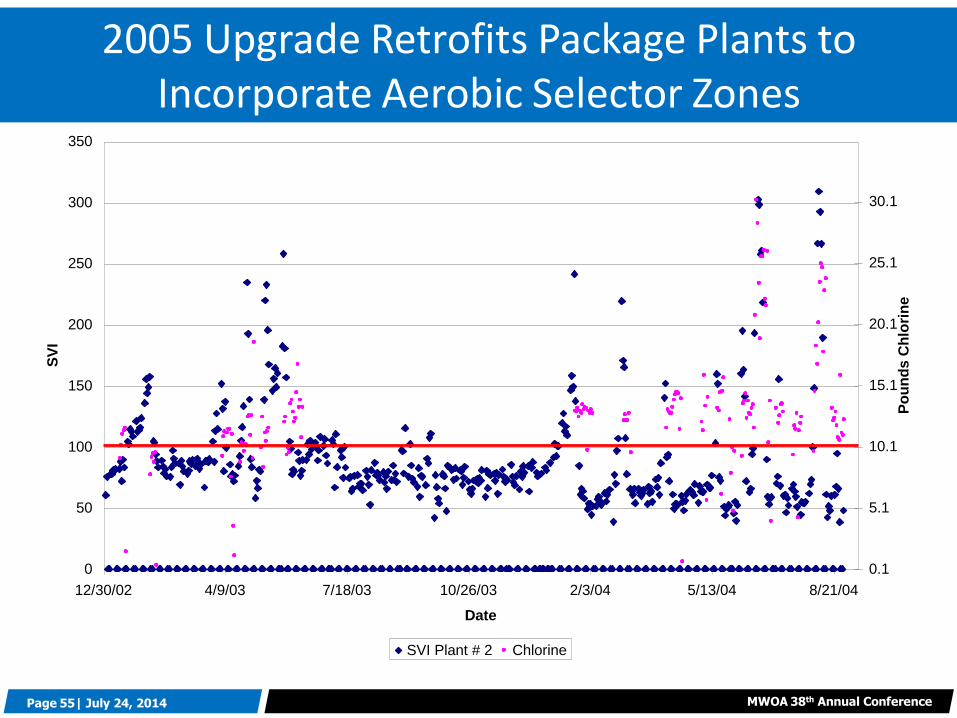
Page 55| July 24, 2014 MWOA 38th Annual Conference
2005 Upgrade Retrofits Package Plants to Incorporate Aerobic Selector Zones SVI--Plant # 2 Before Selector
0
50
100
150
200
250
300
350
12/30/02 4/9/03 7/18/03 10/26/03 2/3/04 5/13/04 8/21/04
Date
SV
I
0.1
5.1
10.1
15.1
20.1
25.1
30.1
Po
un
ds C
hlo
rin
e
SVI Plant # 2 Chlorine
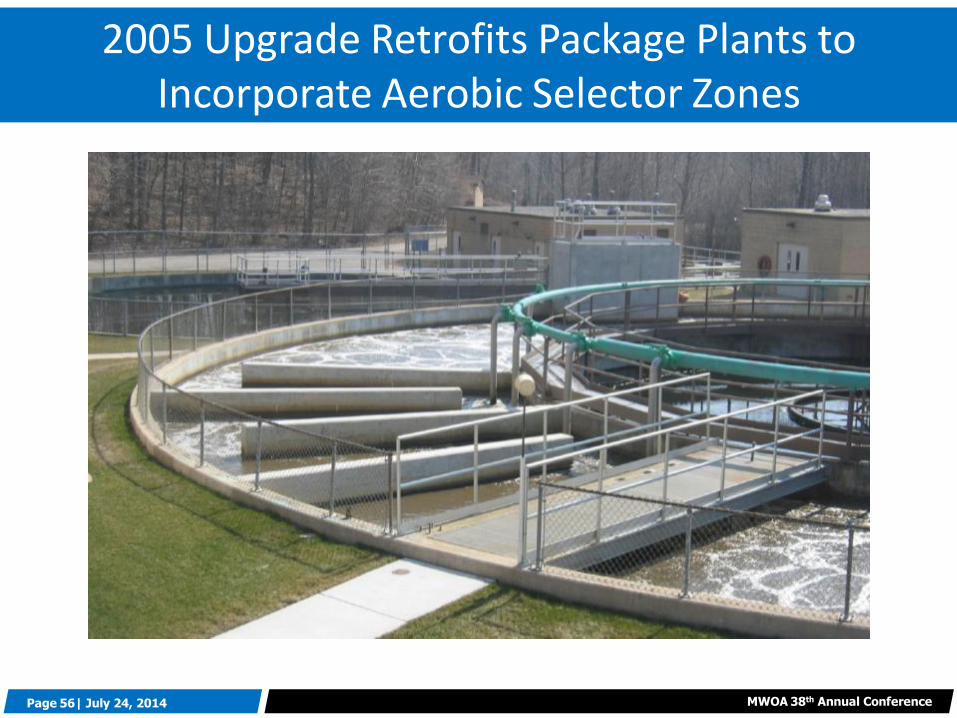
Page 56| July 24, 2014 MWOA 38th Annual Conference
2005 Upgrade Retrofits Package Plants to Incorporate Aerobic Selector Zones
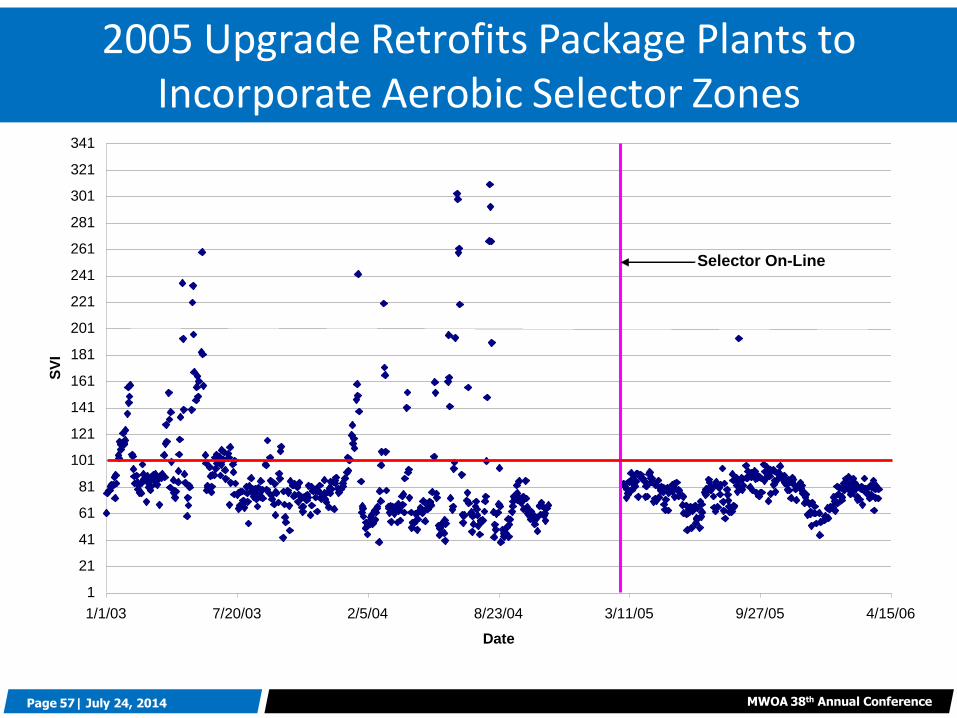
Page 57| July 24, 2014 MWOA 38th Annual Conference
2005 Upgrade Retrofits Package Plants to Incorporate Aerobic Selector Zones Plant # 2 SVI
1
21
41
61
81
101
121
141
161
181
201
221
241
261
281
301
321
341
1/1/03 7/20/03 2/5/04 8/23/04 3/11/05 9/27/05 4/15/06
Date
SV
I
Selector On-Line
Page 58| July 24, 2014 MWOA 38th Annual Conference
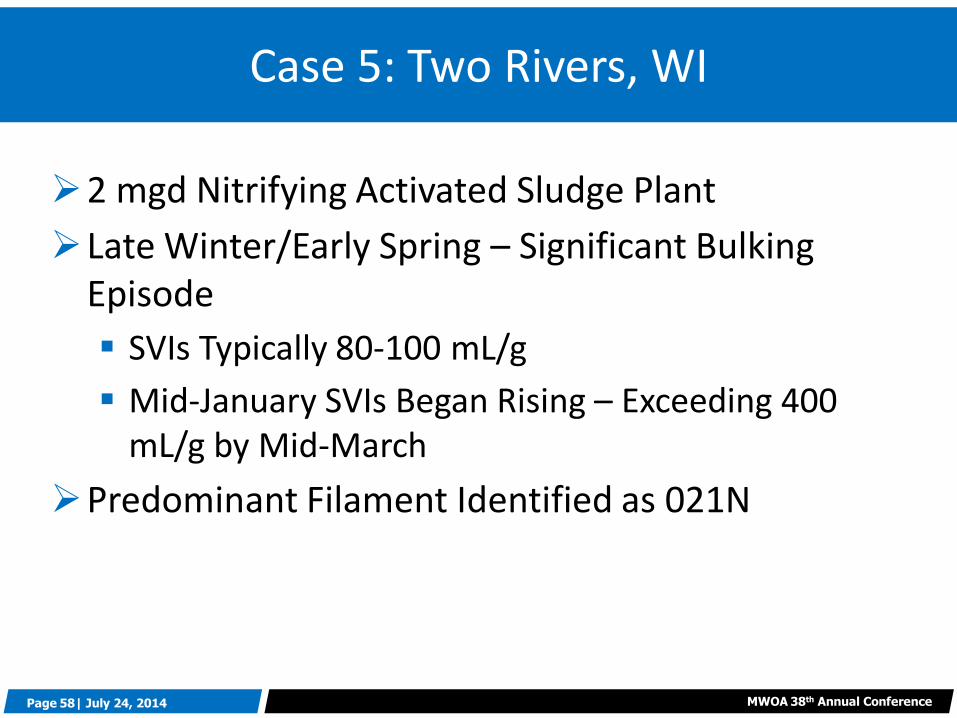
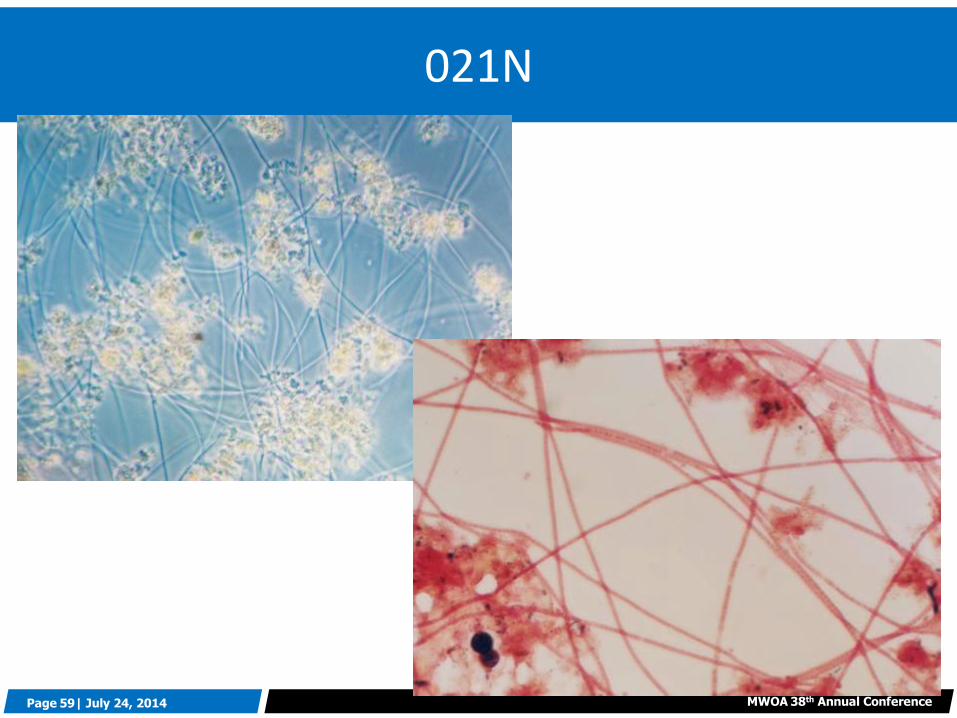
Case 5: Two Rivers, WI
2 mgd Nitrifying Activated Sludge Plant
Late Winter/Early Spring – Significant Bulking Episode
SVIs Typically 80-100 mL/g
Mid-January SVIs Began Rising – Exceeding 400 mL/g by Mid-March
Predominant Filament Identified as 021N
Page 59| July 24, 2014 MWOA 38th Annual Conference
021N
Page 60| July 24, 2014 MWOA 38th Annual Conference
Begin RAS Chlorination at 1.5-2 lbs Cl2/1,000 lbs MLSS/day
Adjust FeCl3 Feed Practice Using Excel Based Spreadsheet
Overfeeding Ferric to Primary Influent Causing Nutrient Deficient Condition
Practice SRT-Based Wasting Using Excel Based Spreadsheet
SVIs Below 140 mL/g Within a Month of Implementing RAS Chlorination
Two Rivers Response
Page 61| July 24, 2014 MWOA 38th Annual Conference
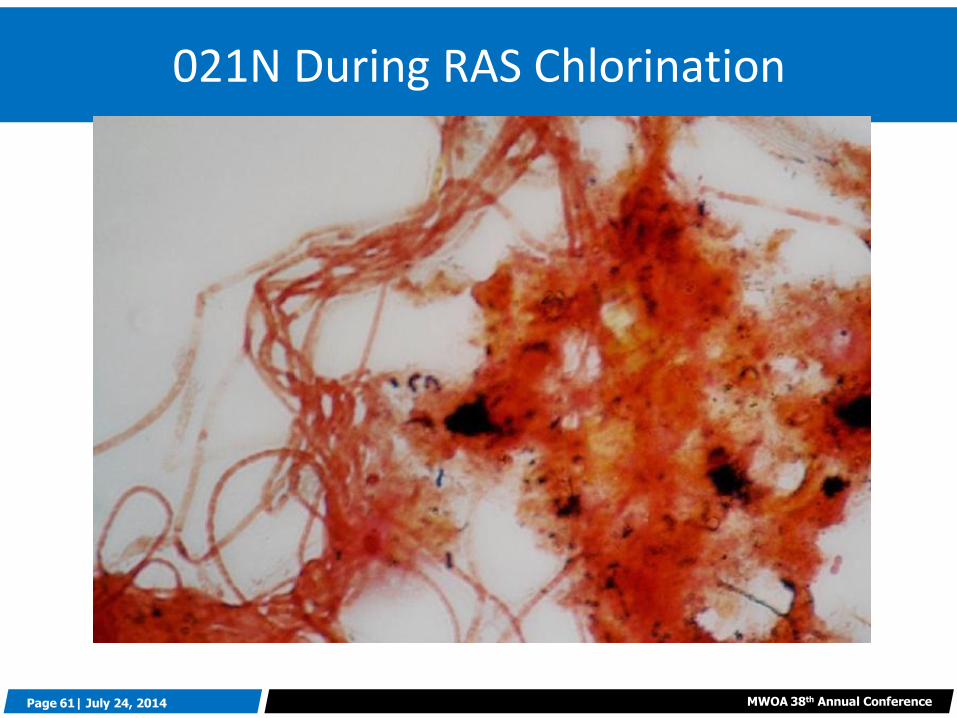
021N During RAS Chlorination
Page 62| July 24, 2014 MWOA 38th Annual Conference
Not All Filaments Can Be Controlled By Selectors
Not All Bulking Caused By Filaments
Microscopic Examination/Identification Provides Very Valuable Information Potential Causes
Corrective Actions
Key Fundamentals Can’t Be Taken For Granted SRT Based Process Control with Regular Micro Exams
Control P Removal Chemical Dosages to Avoid Nutrient Deficient Conditions
Maintain Provisions for RAS Chlorination
Concluding Thoughts
Page 63| July 24, 2014 MWOA 38th Annual Conference
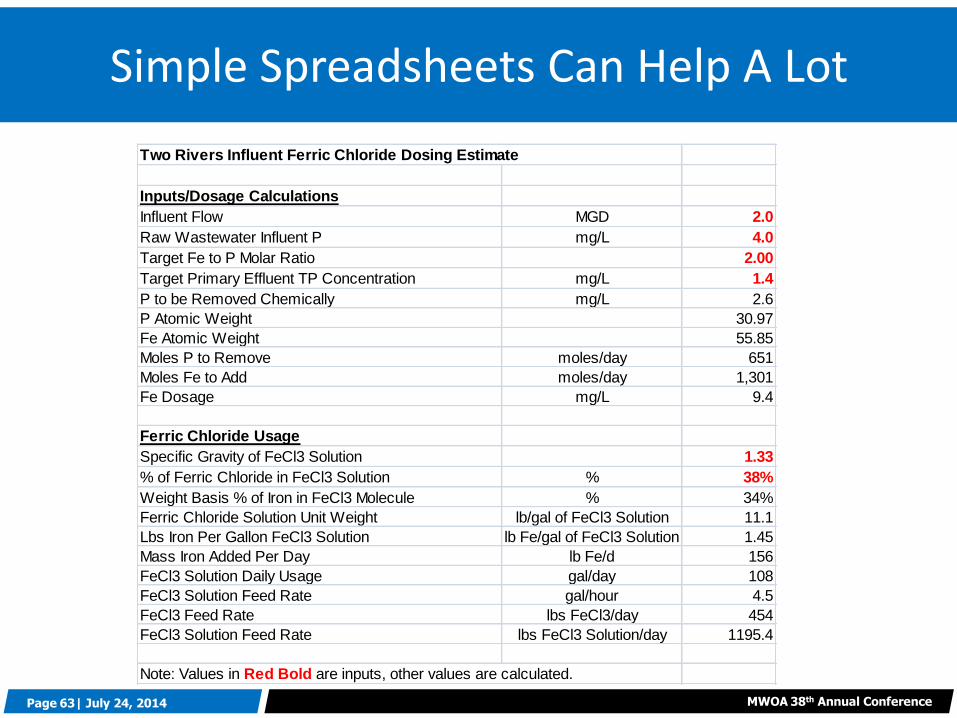
Simple Spreadsheets Can Help A Lot
Two Rivers Influent Ferric Chloride Dosing Estimate
Inputs/Dosage Calculations
Influent Flow MGD 2.0
Raw Wastewater Influent P mg/L 4.0
Target Fe to P Molar Ratio 2.00
Target Primary Effluent TP Concentration mg/L 1.4
P to be Removed Chemically mg/L 2.6
P Atomic Weight 30.97
Fe Atomic Weight 55.85
Moles P to Remove moles/day 651
Moles Fe to Add moles/day 1,301
Fe Dosage mg/L 9.4
Ferric Chloride Usage
Specific Gravity of FeCl3 Solution 1.33
% of Ferric Chloride in FeCl3 Solution % 38%
Weight Basis % of Iron in FeCl3 Molecule % 34%
Ferric Chloride Solution Unit Weight lb/gal of FeCl3 Solution 11.1
Lbs Iron Per Gallon FeCl3 Solution lb Fe/gal of FeCl3 Solution 1.45
Mass Iron Added Per Day lb Fe/d 156
FeCl3 Solution Daily Usage gal/day 108
FeCl3 Solution Feed Rate gal/hour 4.5
FeCl3 Feed Rate lbs FeCl3/day 454
FeCl3 Solution Feed Rate lbs FeCl3 Solution/day 1195.4
Note: Values in Red Bold are inputs, other values are calculated.
Page 64| July 24, 2014 MWOA 38th Annual Conference
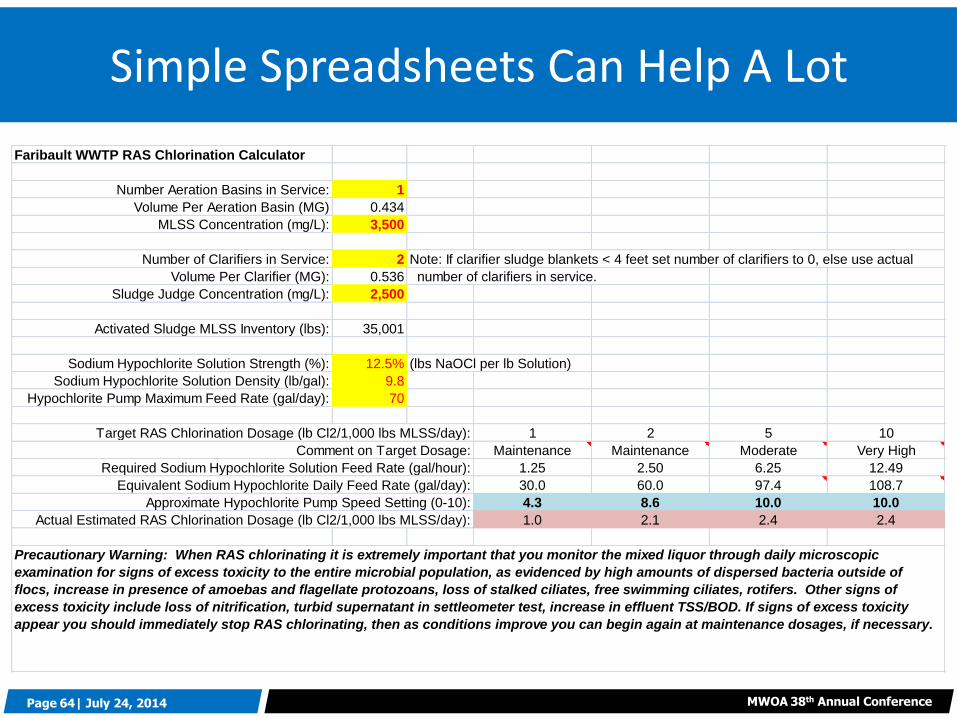
Faribault WWTP RAS Chlorination Calculator
Number Aeration Basins in Service: 1
Volume Per Aeration Basin (MG) 0.434
MLSS Concentration (mg/L): 3,500
Number of Clarifiers in Service: 2 Note: If clarifier sludge blankets < 4 feet set number of clarifiers to 0, else use actual
Volume Per Clarifier (MG): 0.536 number of clarifiers in service.
Sludge Judge Concentration (mg/L): 2,500
Activated Sludge MLSS Inventory (lbs): 35,001
Sodium Hypochlorite Solution Strength (%): 12.5% (lbs NaOCl per lb Solution)
Sodium Hypochlorite Solution Density (lb/gal): 9.8
Hypochlorite Pump Maximum Feed Rate (gal/day): 70
1 2 5 10
Maintenance Maintenance Moderate Very High
1.25 2.50 6.25 12.49
30.0 60.0 97.4 108.7
Approximate Hypochlorite Pump Speed Setting (0-10): 4.3 8.6 10.0 10.0
Actual Estimated RAS Chlorination Dosage (lb Cl2/1,000 lbs MLSS/day): 1.0 2.1 2.4 2.4
Target RAS Chlorination Dosage (lb Cl2/1,000 lbs MLSS/day):
Comment on Target Dosage:
Required Sodium Hypochlorite Solution Feed Rate (gal/hour):
Equivalent Sodium Hypochlorite Daily Feed Rate (gal/day):
Precautionary Warning: When RAS chlorinating it is extremely important that you monitor the mixed liquor through daily microscopic
examination for signs of excess toxicity to the entire microbial population, as evidenced by high amounts of dispersed bacteria outside of
flocs, increase in presence of amoebas and flagellate protozoans, loss of stalked ciliates, free swimming ciliates, rotifers. Other signs of
excess toxicity include loss of nitrification, turbid supernatant in settleometer test, increase in effluent TSS/BOD. If signs of excess toxicity
appear you should immediately stop RAS chlorinating, then as conditions improve you can begin again at maintenance dosages, if necessary.
Simple Spreadsheets Can Help A Lot
Page 65| July 24, 2014 MWOA 38th Annual Conference
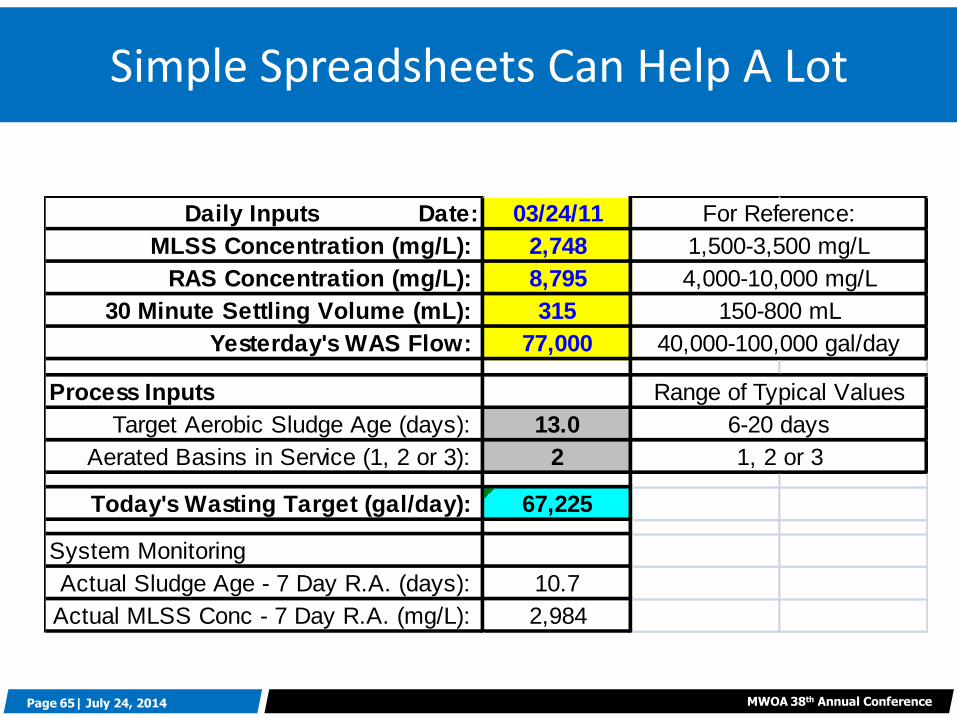
Simple Spreadsheets Can Help A Lot
Daily Inputs Date: 03/24/11
MLSS Concentration (mg/L): 2,748
RAS Concentration (mg/L): 8,795
30 Minute Settling Volume (mL): 315
Yesterday's WAS Flow: 77,000
Process Inputs
Target Aerobic Sludge Age (days): 13.0
Aerated Basins in Service (1, 2 or 3): 2
Today's Wasting Target (gal/day): 67,225
System Monitoring
Actual Sludge Age - 7 Day R.A. (days): 10.7
Actual MLSS Conc - 7 Day R.A. (mg/L): 2,984
For Reference:
Range of Typical Values
6-20 days
1,500-3,500 mg/L
4,000-10,000 mg/L
40,000-100,000 gal/day
1, 2 or 3
150-800 mL
Page 66| July 24, 2014 MWOA 38th Annual Conference
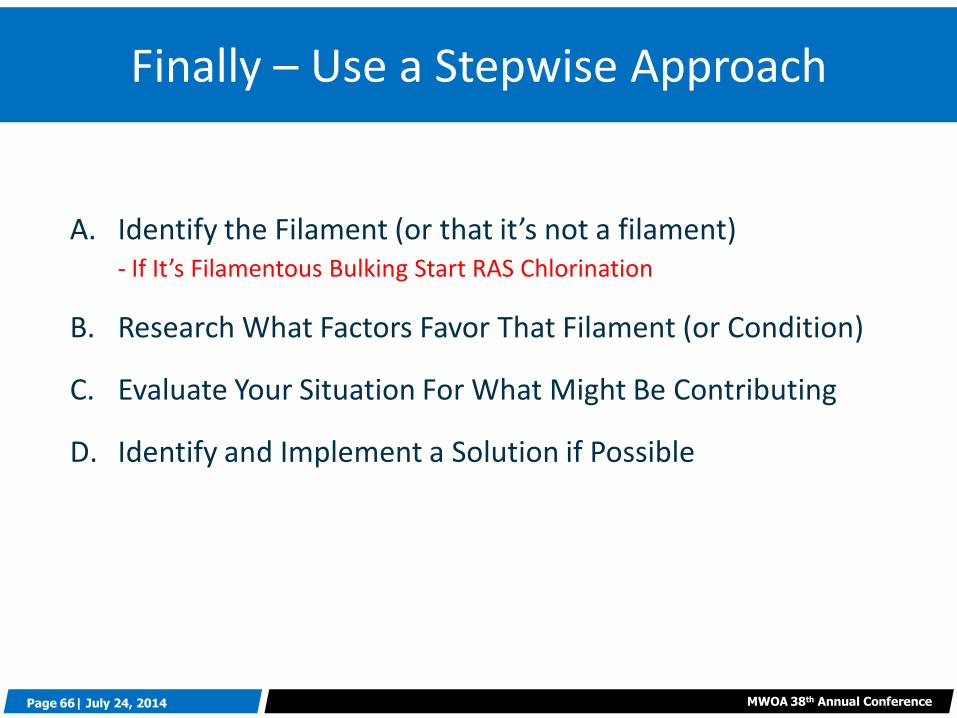
Finally – Use a Stepwise Approach
A. Identify the Filament (or that it’s not a filament) - If It’s Filamentous Bulking Start RAS Chlorination
B. Research What Factors Favor That Filament (or Condition)
C. Evaluate Your Situation For What Might Be Contributing
D. Identify and Implement a Solution if Possible
Page 67| July 24, 2014 MWOA 38th Annual Conference
Thanks for your attention!
Bill Marten, PE, BCEE 731 N. Jackson Street, Suite 610 Milwaukee, WI 53202 Phone: 414-217-6909 Email: [email protected]