Embed Size (px)
Citation preview

NBER WORKING PAPER SERIES
CONTROLLING HEALTH CARE COSTS THROUGH LIMITED NETWORK INSURANCE PLANS:EVIDENCE FROM MASSACHUSETTS STATE EMPLOYEES
Jonathan GruberRobin McKnight
Working Paper 20462http://www.nber.org/papers/w20462
NATIONAL BUREAU OF ECONOMIC RESEARCH1050 Massachusetts Avenue
Cambridge, MA 02138September 2014
We are extremely grateful to Dolores Mitchell, Ennio Manto, Catherine Moore, and Diane McKenzieat the GIC for their enormous assistance in providing the data for this project and to seminar participantsat Brigham Young University, UC Irvine and NBER Summer Institute for helpful comments. Thisresearch was supported by the National Institute on Aging through Grant #P30AG012810 to the NationalBureau of Economic Research. Jonathan Gruber is a member of the Commonwealth Health ConnectorBoard. The views expressed herein are those of the authors and do not necessarily reflect the viewsof the National Bureau of Economic Research.
NBER working papers are circulated for discussion and comment purposes. They have not been peer-reviewed or been subject to the review by the NBER Board of Directors that accompanies officialNBER publications.
© 2014 by Jonathan Gruber and Robin McKnight. All rights reserved. Short sections of text, not toexceed two paragraphs, may be quoted without explicit permission provided that full credit, including© notice, is given to the source.
Controlling Health Care Costs Through Limited Network Insurance Plans: Evidence fromMassachusetts State EmployeesJonathan Gruber and Robin McKnightNBER Working Paper No. 20462September 2014JEL No. I13
ABSTRACT
Recent years have seen enormous growth in limited network plans that restrict patient choice of provider,particularly through state exchanges under the ACA. Opposition to such plans is based on concernsthat restrictions on provider choice will harm patient care. We explore this issue in the context ofthe Massachusetts GIC, the insurance plan for state employees, which recently introduced a majorfinancial incentive to choose limited network plans for one group of enrollees and not another. Weuse a quasi-experimental analysis based on the universe of claims data over a three-year period forGIC enrollees. We find that enrollees are very price sensitive in their decision to enroll in limitednetwork plans, with the state’s three month “premium holiday” for limited network plans leading 10%of eligible employees to switch to such plans. We find that those who switched spent considerablyless on medical care; spending fell by almost 40% for the marginal complier. This reflects both reductionsin quantity of services used and prices paid per service. But spending on primary care actually rosefor switchers; the reduction in spending came entirely from spending on specialists and on hospitalcare, including emergency rooms. We find that distance traveled falls for primary care and rises fortertiary care, although there is no evidence of a decrease in the quality of hospitals used by patients.The basic results hold even for the sickest patients, suggesting that limited network plans are savingmoney by directing care towards primary care and away from downstream spending. We find suchsavings only for those whose primary care physicians are included in limited network plans, however,suggesting that networks that are particularly restrictive on primary care access may fare less wellthan those that impose only stronger downstream restrictions.
Jonathan GruberDepartment of Economics, E17-220MIT77 Massachusetts AvenueCambridge, MA 02139and [email protected]
Robin McKnightDepartment of EconomicsWellesley College106 Central StreetWellesley, MA 02481and [email protected]

2
As employers and governments look to control runaway health care costs, one place they are
turning is to limited network plans. Recognizing that the cost of comparable services can vary widely
across providers, insurers are offering plans that exclude the highest cost providers and thereby
significantly reduce insurance premiums. These plans often do not vary in their enrollee cost sharing or
other plan characteristics, relying only on the restriction to lower cost providers to ensure savings. As a
result, they have proven to be increasingly popular, and they appear to be a mainstay of the plan
offerings on state and federal exchanges under the Affordable Care Act (ACA). In particular, the explicit
tying of ACA insurance subsidies for low income families to the (second) lowest cost plan in the area is
likely to induce enormous movement into limited network plans, which are often the least expensive.
But these limited network plans are not without their detractors. Many are concerned that
individuals will suffer a disruption in care if they switch to a limited network plan. This could lead to
deterioration in the quality of care where the continuity of care is most valuable, such as for those with
chronic illness. Recent expansion in limited and tiered network plans (the latter include a broader
network but charge differentials for use of more expensive providers) in Massachusetts, for example,
was strongly opposed not only by higher cost providers but also by patient advocacy groups.1 Indeed,
this concern prompted tying the ACA subsidies to the second‐lowest cost plan in an area, to ensure that
patients would not be “forced” into networks which did not include their provider. Despite this, ACA
critics have recently focused on the dominance of limited network plans on the new exchanges.2
Assessing the implications for enrollees of limited network plan enrollment is therefore an
important issue for evaluating both the future of employer‐sponsored insurance (ESI) and the efficacy of
the ACA exchanges. Yet there is virtually no work on the implications of enrollment in a limited network
1 Weisman and Conaboy (2011) 2 For example, the CEO of Cedars‐Sinai Hospital, Thomas Priselac, recently told Time magazine, “We’re very concerned with the impact [that a smaller network] has on patients” (Pickert 2014). An article on CNN.com described patients who are “dismayed that their current doctors aren’t in the plans or that they can’t go to the ones they think are best for them” (Luhby (2014). Similarly, The Boston Globe quoted patient Nancy Petro, who said “Now I have to drive 50 miles for blood work when there’s a hospital three miles from my house” (Jan 2014).

3
plan for enrollee well‐being. There is an older and much larger literature on the impacts of managed
care plans, which include as one of their key aspects network limitations (e.g. Glied, 2000). But this
literature was not focused on distinguishing the impacts of network limitations from many of the other
differences involved in managing care. There is also a small recent literature on how limited networks
impact choice of providers (see Frank et al. for a review), but this literature does not address the
impacts on overall spending and utilization patterns.
To address this issue, we turn to the example of the Massachusetts Group Insurance
Commission (GIC), the health insurance provider for state employees, which introduced sizeable new
incentives for limited network plans as part of their open enrollment for fiscal year 2012. In particular,
the state offered a three‐month premium holiday for enrollment in limited network plans by state
employees. At the same time, the GIC provides insurance for a number of municipalities, to whom this
premium holiday was not extended, providing a natural control group. We have obtained from the GIC
a complete set of claims data for the 2009 through 2012 period which allow us to assess the implications
of this sizeable new incentive for enrollment in limited network plans.
We use these data to answer two sets of questions about limited network plans. First, how
responsive are individuals to financial incentives to use such plans? We have sizable variation in
financial incentives in our data, with the savings from choosing a limited network plan rising by over
$500 per year on average. This allows us to obtain projections for price sensitivity that are highly
relevant to employer plans and exchanges. We can also assess which enrollees are most price sensitive.
Do financial incentives induce only healthy enrollees to join limited network plans, leading to increasing
sorting by health across insurers?
We then estimate the implications of limited network enrollment for health care utilization,
spending and outcomes, for those enrollees who do decide to switch. We are particularly interested in
4
assessing the extent to which such switchers change their pattern of physician utilization, and whether
this impacts broader health care utilization.
Our findings suggest that switching to a limited network plan is very sensitive to financial
incentives; the three month premium holiday offered by the GIC caused 10% of enrollees to switch to
limited network plans, with an implied elasticity of switching with respect to the premium savings of 1.3.
The healthiest individuals are the likeliest to switch, although the differences by health are not large.
We find that incentives to switch to a limited network plan induced a sizeable reduction in
spending for the GIC of 4.2%, implying that the marginal person induced to switch plans by this incentive
spent 36% less. Spending falls significantly for most categories of spending and the spending decline
appears to be caused by reduction in both the quantities of care received and the prices paid for care.
Most importantly, however, there is an increase in primary care physician visits and spending that is
more than offset by a decrease in specialist visits and spending. Falls in emergency room and hospital
spending suggest that any reduction in physician access through network limitations did not cause an
increase in use of tertiary care, and there is no evidence of any deterioration along measures of hospital
quality. Distance traveled to providers falls for primary care physicians, but rises for specialists and in
particular hospitals; there is, however, no evidence that patients are using lower quality hospitals. There
is also no evidence of particularly harmful effects for chronically ill patients. But we do find that the
savings are concentrated in those individuals who can retain their primary care physician when moving
to a limited network plan, suggesting that limits on primary care access may not be as cost‐reducing as
are downstream limits on other providers. Overall, the findings suggest that the switch to limited
network plans reduced spending without harming access to primary care or inducing shifts to more
expensive tertiary care.
Our paper proceeds as follows. Section I describes the GIC policy change. Section II lays out the
detailed data made available to us by the GIC, and Section III describes our empirical strategy for using
5
these rich data to identify the impact of limited network plans. Section IV shows the results for plan
choice, and Section V presents the results for utilization responses. Section VI considers impacts on
patient access as measured by distance traveled and hospital quality, while Section VII considers
heterogeneity in our findings. Section VIII concludes.
Part I: The GIC Policy Change
The GIC provides health insurance options for all state employees as well as employees of a
number of local municipalities who have chosen to buy into the state plan. At the start of our sample
period, the GIC insured 81,420 state employees and 109,343 dependents. In addition, there were 23
municipalities purchasing their insurance through the GIC, with 14,232 employees and 19,160
dependents. Municipalities may find the broader negotiating power of the GIC a more attractive
alternative to their local purchasing options, although unions often oppose the higher employee
contributions and more limited choices associated with GIC enrollment. As a result of these conflicting
interests, about 10% of the municipalities in the state were enrolled in the GIC by 2012.
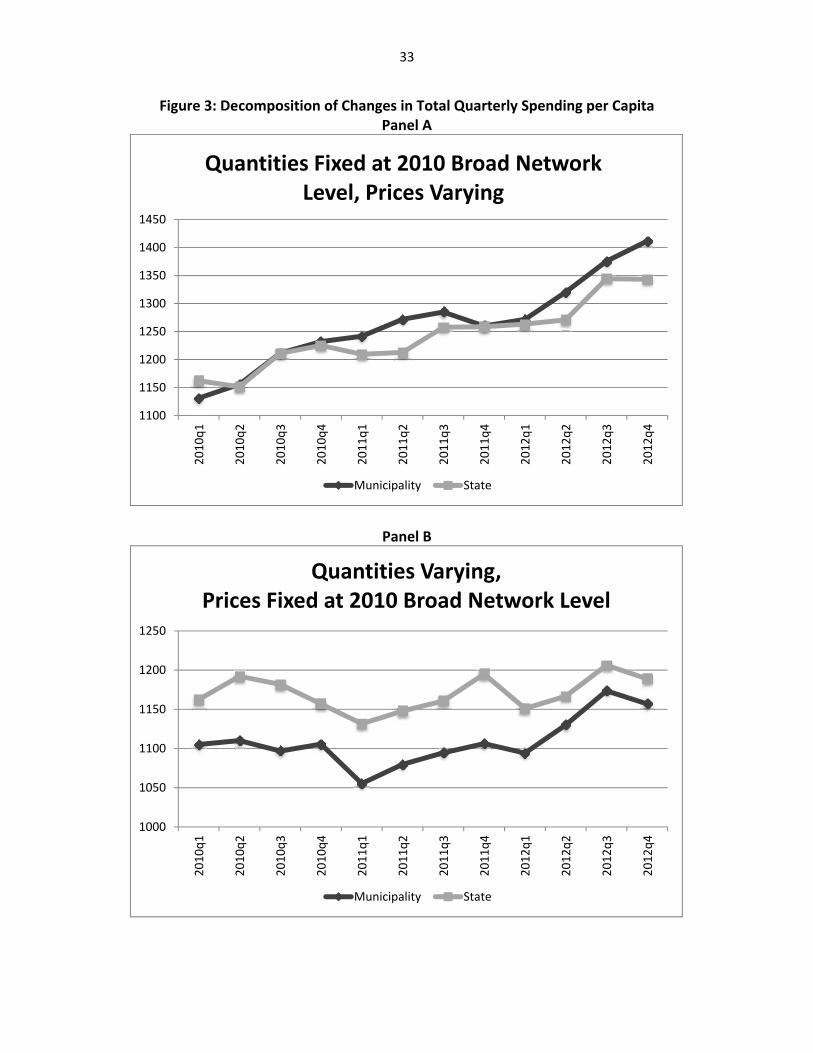
In fiscal year 2011, the year before the limited network incentive plan began, the GIC offered 11
plan options. These plan options are summarized in Table 1. Of these plans, five were classified as
broad network plans (mostly Preferred Provider Organizations (PPOs)) that allowed employees a free
choice of provider in the counties in which the plans operated. The other six were categorized as
narrow network plans with more limited choice of providers. . The cost‐sharing features of the broad
network and limited network plans are nearly identical, so the only substantive difference across the
plans is their network.3 According to information from GIC insurers, these narrow network plans are
3 There are minimal differences in cost‐sharing across plans; most of the variation is across insurers, not across plan types. For instance, Tufts plans have slightly higher hospital copayments than other plans, but these higher copayments apply to both their broad network plan (Tufts Navigator) and their limited network plan (Tufts Spirit). As a result, average hospital copayments in limited network plans are identical to average hospital copayments in broad network plans. For a specialist (in Tier 1), copays range from $20 to $25, with an average of $24.17 in

6
established to exclude the most expensive providers while still maintaining sufficient coverage of the
plan’s service area.
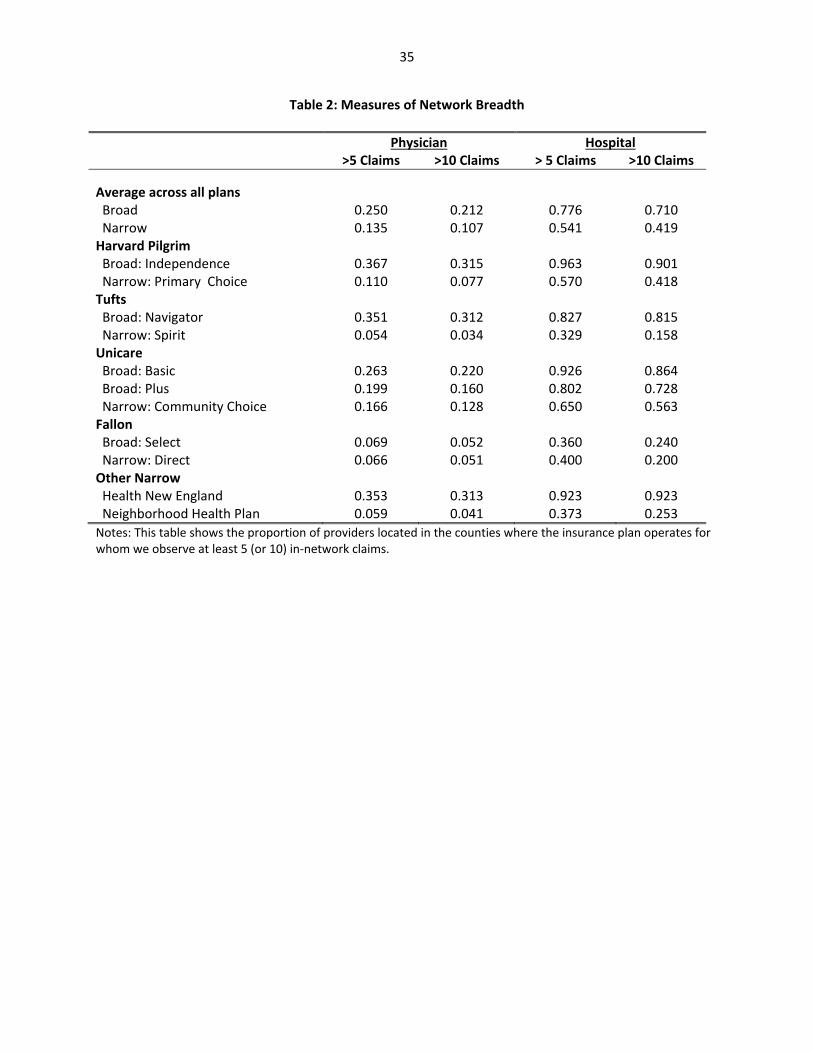
Of course, “narrow network” is a vague term that can have multiple meanings. To provide a
richer interpretation of the meaning of a narrow network in the GIC context, we consider empirical
measures of network breadth. In particular, we take our full set of data over three years (described
further below) and focus on counties in which plans operate. In those counties, we consider all
providers for which we observe at least 5 (or 10) in‐network claims over the three year period across all
insurers. We then calculate, for each insurance plan, the proportion of these providers for which we
observe at least 5 (or 10) in‐network claims for that particular plan. While this measure undoubtedly
incorporates measurement error, it nonetheless provides some relative information about the breadth
of each plan’s network within the counties in which it operates.
The results of this exercise are presented in Table 2. They suggest that limited network plans,
on average, have claims from a smaller fraction of the physicians and hospitals in a county than the
broad network plans do. Overall, our measures suggest that broad network plans cover nearly twice as
many physicians and about 50% more hospitals than are covered by narrow network plans. While one
of the limited network plans, Health New England, appears to have a relatively broad hospital network,
it is worth noting that this plan does not operate in eastern Massachusetts, so its network does exclude
many hospitals in the state.4
limited network plans and $23.00 in broad network plans. For primary care physicians, copayments range from $15 to $20, with an average of $17.50 in limited network plans and $18.00 in broad network plans. 4 We have confirmed the results in Table 2 by using data from insurers where available. We have compared the lists of in‐network hospitals for limited network plans and found that the results are similar to those that we report in Table 2. For example, Health New England includes 92.3% of hospitals in the claims‐based measure and 100% of the hospitals in the list‐based measure. Likewise, Tufts Spirit includes 32.9% of hospitals in the claims‐based measure and 25.7% in the list‐based measure. For physicians, we entered data on all in‐network physicians for two limited network plans, Harvard Primary Choice and Health New England. For both plans, we found that for 25% of physicians we did not have enough claims to classify them in our claims data; for the remaining 75% of physicians, 60% (Harvard) or 68% (Health New England) were classified as limited in both our data and the insurers lists, an “effective” match rate of 80‐90%.

7
Prior to the premium holiday, there was an existing financial benefit to choosing limited
network plans, reflecting directly the lower cost of those plans to the state. In particular, the state
contributed 20% of the cost of insurance plans for active employees hired before July 1st, 2003 (and 25%
for those hired after that date), so that a portion of the lower costs of limited network plans were
passed on to employees. In 2011, the employee share of the monthly premium for individual coverage
ranged from $81.32 for Unicare Community to Choice to $153.36 for Unicare Basic (for workers paying
20% of the premium cost). Sixteen percent of enrollees at the state level chose to enroll in limited
network plans.
The financial incentive to switch to a limited network plan varied significantly across employees,
for several reasons. First, there were different contribution rules for the local municipalities. For
example, while Saugus required that employees contribute only 10% towards most plans, Swampscott
required that employees contribute 35% towards most plans. Second, within municipalities, different
contribution rules apply to different types of employees. For instance, teachers face different rates than
other employees in some municipalities. Third, the state charges different rates to employees with
different hiring dates, as described above. Finally, some municipalities provided more generous
coverage of lower‐cost insurance options. For example, Springfield required that employees contribute
25% towards Unicare Basic, but only 15% towards other plans. These differences in contribution rules
generate meaningful differences in the incentive to switch to a limited network plan. For example, the
savings from switching from family coverage through Tufts Navigator (a broad network plan) to family
coverage through Tufts Spirit (a limited network plan) ranged from $29 per month in the three
municipalities that required a 10% employee contribution for both plans, to $160 per month in a
municipality that required a 7% higher employee contribution for Tufts Navigator than for Tufts Spirit.

8
For the fiscal year 2012 open enrollment, the GIC decided to add an extra incentive for state
employees to enroll in limited network plans.5 In particular, state employees who decided to enroll in
limited network plans were offered a three month “premium holiday”, with no employee contribution
required for the first three months of the year. For the affected plans, this premium holiday amounted
to a 25% reduction in contributions, ranging from savings of $268 per month for individual coverage
from Unicare Community Choice to $764 for family coverage from Harvard Pilgrim Primary Choice. This
incentive was not offered by localities which use the GIC system. This policy change induced a major
differential incentive for limited network plans for state versus municipal employees.
Part II: Data
Our data for this analysis include a complete set of claims and enrollment records for all GIC
enrollees for the three fiscal years, spanning the period from July 2009 through June 2012. GIC’s
insurance contracts run from July through June, so these data allow us to observe three fiscal years. The
premium holiday affects fiscal year 2012, which runs from July 2011 to June 2012.
For the purposes of our analysis, we limit the sample to active employees and their dependents
who were continuously enrolled over the three years of our sample period. The restriction to
continuously‐enrolled individuals ensures that the composition of our sample does not change over
time. However, this sample restriction precludes the inclusion of eight municipalities that joined GIC
during our sample period. Because we cannot identify which employees are teachers, we exclude data
from a municipality that has different contribution rates for teachers than for other employees. The
resulting sample includes data on 159,732 enrollees, of whom 86% obtained coverage through the state
and 14% obtained coverage through one of 21 municipalities in our sample.
5 At the same time the state imposed mandatory re‐enrollment in GIC plans, with an automatic default to limited network plans if individuals didn’t re‐enroll. But re‐enrollment rates were over 99%, so this didn’t end up having a very large impact. (Commonwealth of Massachusetts Group Insurance Commission, 2012)

9
Our (de‐identified) data include very limited demographic information such as age and gender,
information on enrollment choices, and information on health care utilization and spending over this
time period. In the claims data, we identify different types of services and construct annual measures of
utilization. Our measures include counts of medical encounters in a year (e.g. office visits, prescription
drug purchases, etc.) and total expenditures by all payers for those medical services. While it is possible
that out‐of‐network providers choose not to file claims with the limited network insurers, we do
observe claims that indicate that the provider is out‐of‐network, including some claims for which the
insurer pays nothing. While we can’t rule out the possibility that we are missing some claims from out‐
of‐network providers, any missing claims are likely to be for low‐cost events and would therefore have
minimal effect on our overall findings. With three years of claims data for each enrollee, our final data
set includes 479,196 annual observations on the 159,732 continuously enrolled individuals in our
sample.
Table 3 provides summary statistics on our sample, including information on average annual
medical expenditures and utilization. The average member incurs $4,811 in total medical expenses
during a year. About 23% of these expenses are incurred in office visits, 18% in inpatient
hospitalizations, and 30% in outpatient visits. Prescription drugs account for 19% of the costs. The
remainder of the costs includes emergency department visits, labs, and “other” costs, which include
home health care, supplies, ambulances, and a variety of other services.
Part III: Empirical Strategy
Following the discussion of the GIC policy change above, there are several sources of variation in
the cost of limited and broad network plans. At any point in time, there is significant variation across
state vs. municipal workers, as well as across state workers by date of hire. Over time, as premiums
change, these differences in policy give rise to differential changes in the out‐of‐pocket premium cost of
10
limited network plans. And the premium holiday in fiscal year 2012 created a sharp discontinuity in the
cost of limited network plans for state employees relative to local employees.
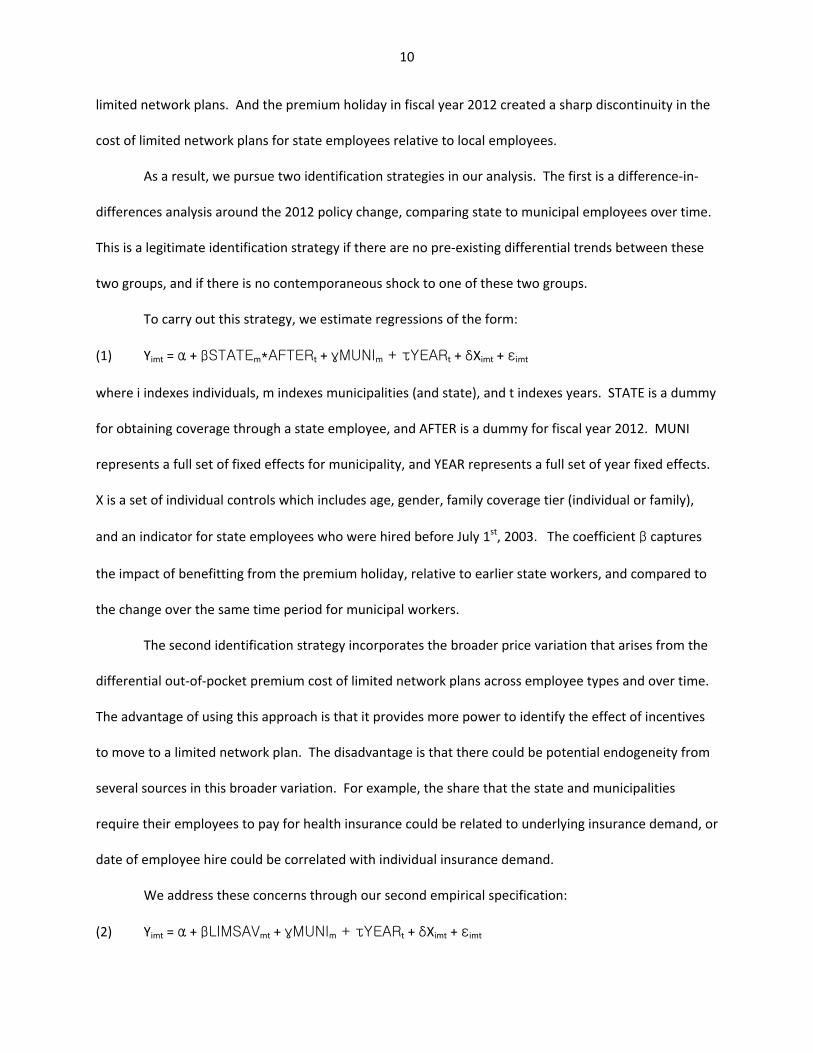
As a result, we pursue two identification strategies in our analysis. The first is a difference‐in‐
differences analysis around the 2012 policy change, comparing state to municipal employees over time.
This is a legitimate identification strategy if there are no pre‐existing differential trends between these
two groups, and if there is no contemporaneous shock to one of these two groups.
To carry out this strategy, we estimate regressions of the form:
(1) Yimt = α + βSTATEm*AFTERt + γMUNIm + τYEARt + δXimt + εimt
where i indexes individuals, m indexes municipalities (and state), and t indexes years. STATE is a dummy
for obtaining coverage through a state employee, and AFTER is a dummy for fiscal year 2012. MUNI
represents a full set of fixed effects for municipality, and YEAR represents a full set of year fixed effects.
X is a set of individual controls which includes age, gender, family coverage tier (individual or family),
and an indicator for state employees who were hired before July 1st, 2003. The coefficient β captures
the impact of benefitting from the premium holiday, relative to earlier state workers, and compared to
the change over the same time period for municipal workers.
The second identification strategy incorporates the broader price variation that arises from the
differential out‐of‐pocket premium cost of limited network plans across employee types and over time.
The advantage of using this approach is that it provides more power to identify the effect of incentives
to move to a limited network plan. The disadvantage is that there could be potential endogeneity from
several sources in this broader variation. For example, the share that the state and municipalities
require their employees to pay for health insurance could be related to underlying insurance demand, or
date of employee hire could be correlated with individual insurance demand.
We address these concerns through our second empirical specification:
(2) Yimt = α + βLIMSAVmt + γMUNIm + τYEARt + δXimt + εimt

11
where LIMSAV is the savings from switching to a limited network plan for worker i. This measure is
computed as the difference in the weighted average of employee contributions to broad network plans
and the weighted average of employee contributions to limited network plans, measured as a
percentage of the employee contributions to broad network plans. The weights represent the fraction
of enrollees in each type of plan who chose each specific plan in a base period, so that more weight is
placed on the employee contributions to the more popular plans. Because we weight the employee
contributions by baseline enrollment shares, the calculation excludes information about Harvard
Primary Choice and Tufts Spirit, which were added as new insurance plan choices in fiscal year 2011.
The use of a weighted average across all of the insurance plan options means that this measure does not
vary across individuals within a municipality‐year. Instead, this measure reflects the sources of variation
that were outlined above, including variation across the state and municipalities, across hire date groups
(i.e., groups facing the same premium‐sharing rules), and over time. The use of a percentage difference
in savings means that we are not using variation in the level of savings that arises from differences in
premiums across individual and family plans; the dollar value of savings from switching to a limited
network plan is always higher for family plans than the dollar value of savings for individual plans, but
the percentage savings is always the same.
To address the potential endogeniety of LIMSAV, we include fixed effects for each municipality
and controls for the hiring period for state employees to capture those correlates of insurance demand.
In practice, since the most significant variation in our sample comes from the premium holiday, our
results are similar using either method.
It is very important to be clear on the interpretation of the key coefficient β. Our estimates of
the implications of limited network plans for utilization and outcomes are identified solely by the
compliers that switch plans in response to financial incentives. That is, our estimates are not a
population average estimate of the impact of forcing all enrollees to enroll in a limited network plan.

12
But current policy conversations center around employee and exchange choice, which consider limited
network plans as a choice option, not the mandated default. That is, our estimates provide the relevant
estimates of the impacts of offering financial incentives of the range described above on utilization and
outcomes.
Part IV: Enrollee Plan Choice Results
We begin by examining the effects of financial incentives on the decisions of enrollees to enroll
in limited network plans. We estimate the equations above, using as a dependent variable a dummy for
enrolling in a limited network plan. We estimate all models as linear probability models, although our
results are very similar if we use Probits. Standard errors are clustered at the level of the municipality.
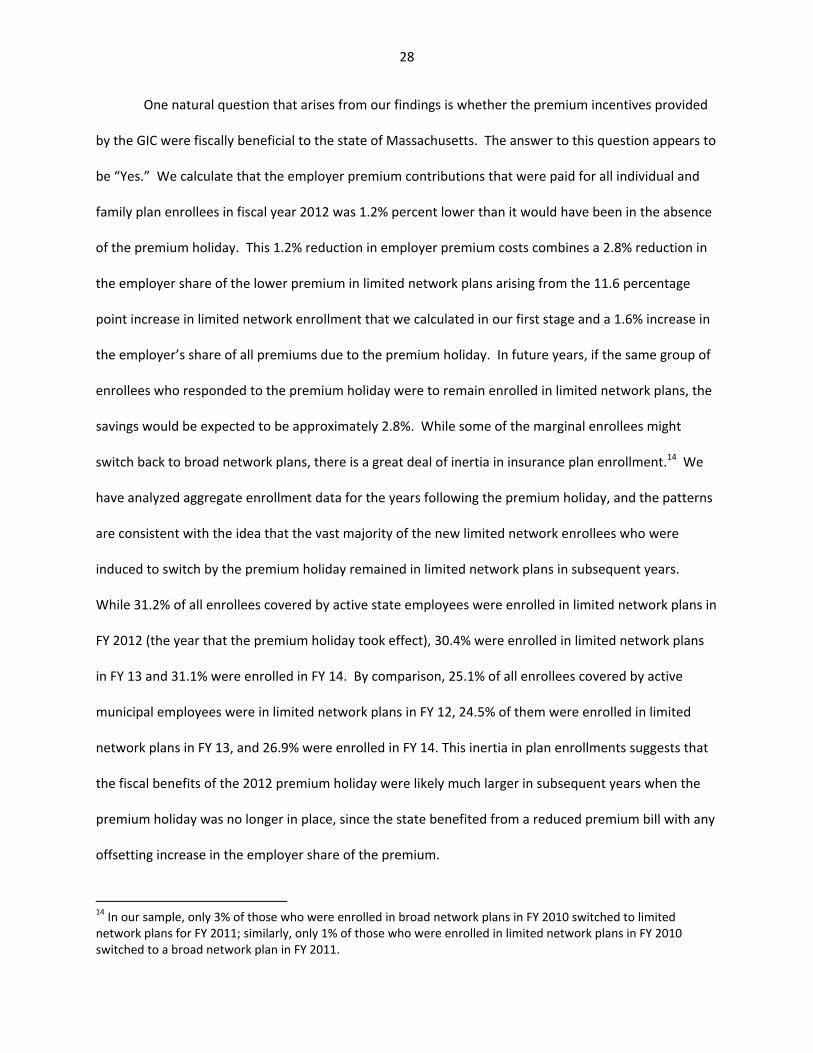
Figure 1 previews our first stage findings. Panel A graphs the savings from choosing a limited
network plan by year, separately for municipalities and the state. As the figure shows, municipal
employees in 2010 faced larger potential savings from switching to a limited network plan, because the
employee share of the premiums was typically higher for them than for state employees. Because
limited network plans have lower premiums than broad network plans, a higher employee share of
premiums generates more potential savings from choosing a limited network plan. From 2010 to 2011,
there was an increase in savings in both groups from choosing a limited network plan. This increase in
savings was partially attributable to the fact that broad network plans had relatively large increases in
premiums, whereas several of the limited network plans had premium increases that were close to zero.
In addition, increases in the employee share of premiums were implemented by the state and by several
municipalities.6 From 2011 to 2012, there was a large rise in the savings from limited network plans for
state employees, due to the premium holiday, that was not present for municipal employees.
6 Under the FY10 Appropriation Act, premium contribution rates for state employees increased by 5 percentage points. These changes were first proposed in June 2009 and implemented in August 2009 (Commonwealth of Massachusetts Group Insurance Commission, 2011). Thus, while the price change was implemented partway

13
Panel B of the figure shows enrollment rates in limited network plans over time for the state and
municipalities. The initial rate of enrollment is higher in municipalities, which is consistent with the
higher initial municipality discount for enrolling in such plans. From 2010 to 2011, enrollment in limited
network plans rises in both groups by similar magnitudes, once again consistent with the parallel rise in
financial incentives over these years. From 2011 to 2012, enrollment in limited network plans in the
municipalities is fairly constant, whereas there is an enormous jump in the state plans, mirroring the
increase in potential savings for state employees. For state employees, enrollment in limited network
plans rises by about 50% between 2011 and 2012.
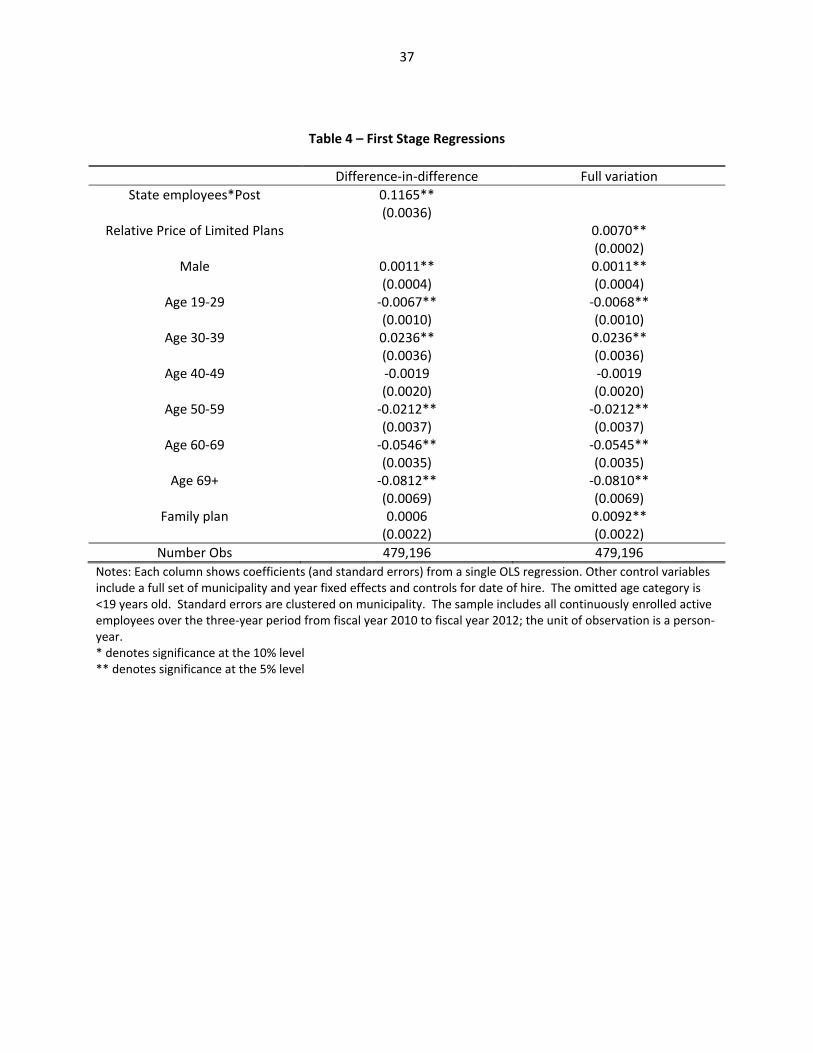
Table 4 presents these “first stage” results in regression form, confirming what is shown in the
figures. We estimate that the premium holiday raised enrollment in limited network plans in the state
by over 11 percentage points, relative to the municipalities. Our alternative regression approach, using
the full variation over this period, yields an estimate that each 1 percentage point increase in the
discount to limited network plans gives rise to a 0.7 percentage point increase in the share of enrollees
in limited network plans. The discount rose by 16 percentage points from 2011 to 2012 as a result of
the premium holiday, which would predict the same 11 percentage point rise in limited network
enrollment. The estimated elasticity of limited network enrollment with respect to its premium
discount is 1.28 (or 0.007 * (36.55 / 0.201)).
Table 4 also shows the coefficients on many of the covariates included in these first stage
regressions. The coefficients suggest that males are slightly more likely to choose limited network plans
than females are. Enrollment in limited network plans peaks between the ages of 30 and 39, and
decreases considerably as adults age.
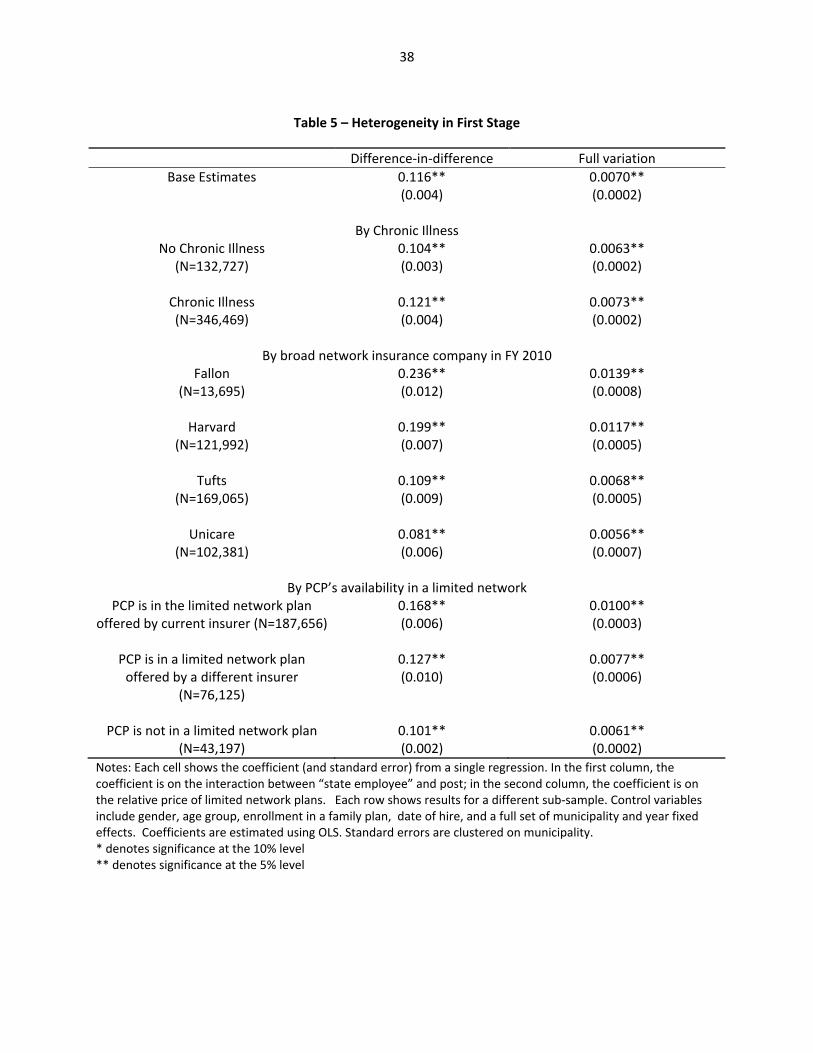
Table 5 explores heterogeneity in price sensitivity, in each case showing the key coefficients
from the same specification shown in Table 4, but estimated on only the subsample of interest. We first
through fiscal year 2010, the primary impact on enrollment choices should have occurred during open enrollment for fiscal year 2011.

14
consider heterogeneity by underlying health, dividing the population into those who are and are not
chronically ill. We identify the chronically ill as individuals with a diagnosis (in an office setting) of
hypertension, high cholesterol, diabetes, asthma, arthritis, affective disorders, and gastritis, following
Goldman et al. (2004). We find that healthier enrollees are more price sensitive: those who are not
chronically ill are about 20% more responsive than those who are chronically ill. This suggests that,
when the GIC offered financial incentives for enrollment in limited network plans, they improved the
health mix of those plans and worsened the health mix of those remaining in broad network plans,
although the differential effect is not large.
Two key determinants of switching could be whether individuals can remain with their insurer,
and whether they can keep their doctor. We explore these issues in the remainder of Table 5. We first
separate the sample by initial choice of insurer, limiting our sample to those who were enrolled in broad
network plans at the beginning of our sample period. We see that there is some heterogeneity in
switching by insurer. The first stage is largest for Fallon enrollees, and smallest for Unicare enrollees.
There does not appear to be any systematic correlation across companies with the “restrictiveness” of
the networks as illustrated earlier.
For 79% of the enrollees in our sample, we can identify their primary care physician based on
claims during the first two years of our sample. We identify the primary care physician as the physician
with a primary care specialty with whom the enrollee had the most office visits during the first two years
of our sample period. We then consider three mutually exclusive groups, among those enrollees who
were not yet enrolled in a limited network plan in fiscal year 2011: (a) those whose primary care
physician is in the limited network version of the same insurance plan in which they are now enrolled,
(b) those whose primary care physician is in a limited network plan, but not that offered by their current
insurer, (c) those whose primary care physician is not available through any limited network plan. We

15
expect enrollment in a limited network plan to be declining across these groups, and indeed that is in
the case.
Table 5 shows that that the coefficient on switching (that is identified primarily by the premium
holiday) is declining across these groups.7 The effect for those who can switch without changing insurer
or physician is about 60% larger than for those who must switch both insurer and physician. It is
interesting to note that over 90% of these enrollees have a primary care physician who participated in at
least one limited network plan. This suggests that switching to a limited network plan does not
necessarily disrupt primary care relationships for many enrollees.
Part V: Results for Utilization and Spending
Having established our “first stage” fact that financial incentives for limited network plans
strongly influence choice of such plans, we now turn to estimating the impact on patient outcomes. The
regression framework is the same as that used in the previous section, but our dependent variables now
relate to health care utilization and outcomes.
These regression coefficients can be interpreted as “reduced form” estimates of the impact of
financial incentives on patient outcomes. If we normalize by the “first stage” estimates of the impact of
financial incentives on plan choice, we can obtain an implicit instrumental variables estimate of the
effect of enrolling in a limited network plan on outcomes. As noted earlier, this IV estimate is valid only
for the marginal individuals induced to switch plans by financial incentives, and not for individuals
randomly enrolled in a limited network plan.
Since our dependent variables feature both many zeros and a large degree of skewness, we
estimate our models by a general linear model (GLM). In the absence of zeroes, we would want to use
7 Of course, these results suffer from some censoring bias – those whose physician is in a limited network plan may have been most likely to switch before the premium holiday. This would most likely lead us to understate the impact of the financial incentive differential across groups.

16
ln(spending) as our dependent variable and estimate our models using OLS. However, the presence of
observations with zero spending makes this a problematic strategy, so we follow the literature and
estimate GLM with a log‐link function (Buntin and Zaslavsky, 2004). In this approach, the conditional
mean is modeled as:
(3) Ln E(Spending|X)imt = α + βLIMSAVmt + γMUNIm + τYEARt + δXimt + εimt
This approach allows us to avoid selection on the dependent variable and also generates coefficients
that are interpretable as percentage changes.8
Total Impact on Spending
We preview the results for total spending with Figure 2, which shows the trends in total
spending for state and municipal employees. For this figure, we use quarterly data on total spending, in
order to show more precisely the timing of any changes in total spending. This figure shows that
spending trends very closely for state and municipal employees over time before the premium holiday,
with state employees having consistently higher total spending (once again consistent with higher
enrollment in limited network plans by municipal employees). There is then a very clear relative decline
in total spending for state employees, which begins in the first quarter of fiscal year 2012 and becomes
even stronger in subsequent quarters. The fact that the spending patterns for state employees, as
compared to municipal employees, mirrors the patterns of enrollment in limited network plans seen in
Figure 1 is quite suggestive of a causal link.
In Table 6, we formalize this analysis using our regression framework. There are two columns in
the table, representing our two identification strategies: the DD strategy is used in the first column,
8 In contrast to GLM, OLS models E(ln Spending|X)imt = α + βLIMSAVimt + γMUNIimt + τYEARimt + δXimt +
εimt. As a result, OLS generates coefficients that are difficult to translate into statements about E(Spending). The traditional solution has been to use a “smearing” estimator to convert predictions to the unlogged scale (Manning et al., 1987). However, these retransformations are biased in the presence of heteroskedasticity (Buntin and Zaslavsky (2004), Manning and Mullahy (2001)).

17
while the price variation strategy is used in the second column. In each cell, we present the GLM
estimate of the effect on a spending measure. If one wishes to interpret these as structural estimates
for the impact of being enrolled in a limited network plan then, as noted above the DD estimates should
be multiplied by 1/0.116 = 8.6, and the price variation estimates should be multiplied by 1/0.0070 = 143.
We begin in the first row by modeling total spending. We estimate a marginally significant 4%
decline in the level of medical spending. Normalizing by the “first stage” effect, this implies that, for the
marginal switcher, there is a 36% decline in total spending when moving to a limited network plan. This
is a very sizeable impact. On the other hand, the magnitude of the decline is quite consistent with the
difference in total premiums for the two types of plans. Indeed, the mean reduction in out‐of‐pocket
premium for an enrollee to switch from an average broad network plan to an average limited network
plan in our sample was 36.55%, as shown in Table 3. Our results suggest that the premium differential
for limited network plans is driven not merely by positive selection, but by a substantive difference in
costs per capita.9 The results using full variation, when normalized by the relevant first stage results,
generate very similar results: for the marginal switcher, there is a 41% decline in total spending. The
fact that our two identification strategies generate such similar results here, and throughout the
subsequent results, is reassuring.
We then turn to modeling spending by subcategory of medical utilization. We find a large
(albeit only marginally significant) decline in office spending, with the DD estimate implying a roughly
16% decline in office spending for the marginal switcher. We estimate a reduction in hospital spending
which is also very large, but statistically insignificant. Unfortunately, the confidence intervals for our
9 A simple regression of spending on limited network plan enrollment, ignoring the endogeneity of limited network enrollment, yields a cost savings estimate of 30%. It is surprising that the causal impact on spending is larger than the OLS effect, given that the latter includes selection effects. This partly reflects relatively limited selection: the average age of those enrolled is only 3 years younger than those not enrolled, and the odds of chronic illness is only about 10% lower. This may also partly reflect differences between the marginal complier with the policy change and the average enrollee in limited network plans, or differences in the long run effect of enrollment versus first year effects. Nevertheless, the results suggest that most of the savings from limited network plans is from reduced spending by enrollees, not just positive selection.

18
inpatient hospital spending results are fairly wide, leaving us unable to rule out a large fall or rise in
hospital spending.
We do, however, find a large and marginally significant 5% decline in outpatient hospital
spending in the DD specification, implying a 43% reduction in outpatient spending for the marginal
switcher. Results for outpatient spending are similar in magnitude, and statistically significant, in the
specification that uses the full price variation. We see an even larger reduction in lab spending of 8% in
the DD specification, implying a 71% reduction in lab spending for the marginal switcher. We have
further explored the lab results and found that lab spending associated with office visits doesn’t fall
significantly; rather, the major change is in lab spending associated with outpatient and emergency
room settings.
We find a correspondingly large reduction in emergency room spending. This is striking because
it defies the natural hypothesis that when individuals have their physician choices limited they would
tend to use more emergency room care. We have further broken emergency room visits by type of
visit, and find that about two‐thirds of the reduction is from reduced use of the emergency department
for treatment of injuries.
We find no meaningful impact on prescription drug spending, but a large impact on “other”
spending. When we break down “other” spending into its constituent components, the results imply
that there are particularly large reductions in home health care spending and ambulance spending,
although neither is significant on its own. It is worth noting that “other” spending constitutes less than
5% of total spending, so declines in this category of spending, while larger in percentage terms, are
relatively unimportant in explaining the aggregate decline in spending. Rather, if one takes the point
estimates seriously, the changes that appear to be most important in driving the 4.2% decline in total
spending include the 5.0% decline in outpatient spending and the (statistically insignificant) 5.6% decline
in inpatient spending, which together account for more than half of the overall decline in total spending.

19
Given the robustness of our findings to the two empirical strategies used in Table 6, for the
remainder of the paper we present only the more easily interpretable difference‐in‐difference results.
All results presented below are, not surprisingly, consistent using the fuller measure of incentives.
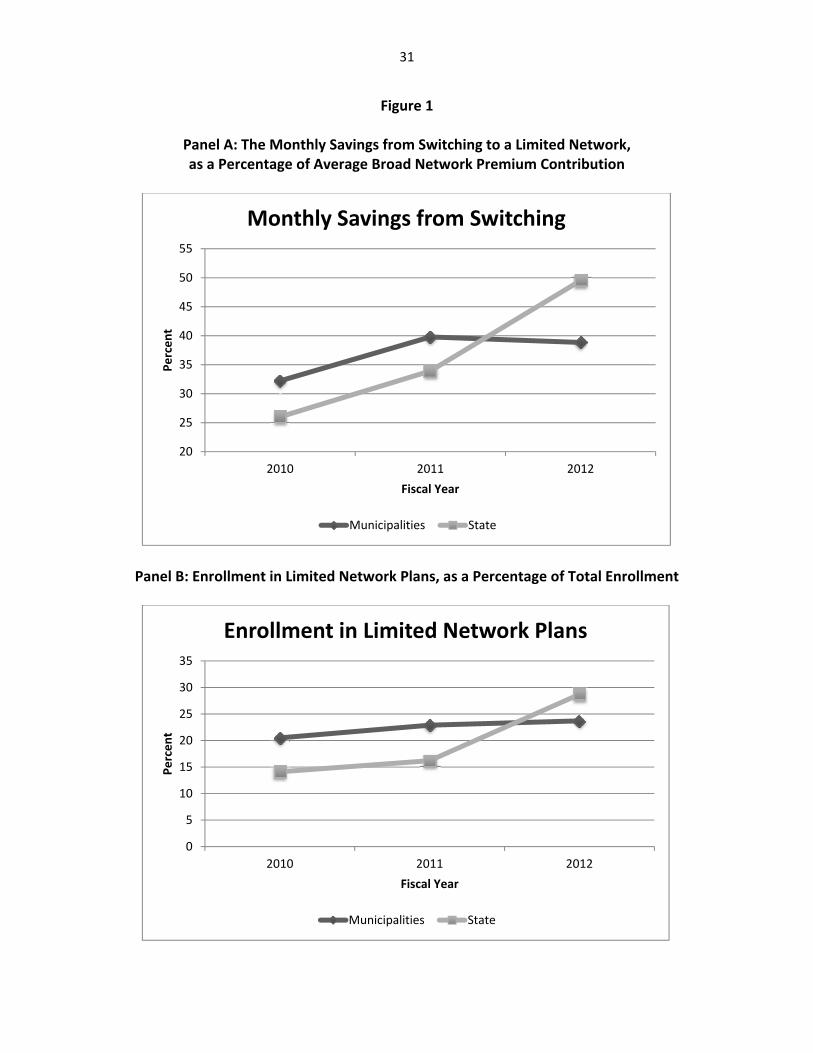
Decomposing Spending Impacts
The large impacts on total spending that are apparent in Figure 2 can be further decomposed to
assess whether the savings arise from a reduced quantity of care or lower prices paid for a fixed amount
of care. We show the results of this decomposition in Figure 3. In Panel A, we show the changes in
costs per service type, weighted by fixed quantities of care for each services. These fixed quantities are
based on average utilization for each service category (primary care office visits, specialist office visits,
other office visits, inpatient care, outpatient care, ER visits, labs, prescription drugs, and other care) for
broad network enrollees in FY 2010. Costs per service are allowed to vary, on average, over time and
across state vs. municipal enrollees. Interestingly, average costs per service are similar for state and
municipal enrollees at the beginning of the sample period, with costs for state enrollees, if anything,
lower than costs for municipal enrollees in FY 2011. But costs per service seem to decline relatively
more for state enrollees after the premium holiday, especially towards the end of FY 2012. This figure
suggests that the decline in spending among state enrollees is partially attributable to a relative decline
in per‐service costs.
Panel B of Figure 3 shows the changes in quantities of each type of service, weighted by fixed
costs of care. The fixed costs are based on average per‐service allowable costs for each type of service
for broad network enrollees in FY 2010, while quantities are allowed to vary over time and across state
vs. municipal enrollees. State enrollees were clearly using a greater amount of care than municipal
enrollees in FY 2010 and FY 2011, but the magnitude of the gap declines visibly beginning at the time of

20
the premium holiday. Based on these figures, it appears that declines in prices and quantities both play
a role in reducing spending for state enrollees after the premium holiday.
Table 7 examines this issue, in a regression framework, for different categories of service. It
extends Table 6 by presenting, in addition to our GLM spending results, results for measures of quantity
of care and for costs per visit. Specifically, it shows OLS results for a dummy variable for any utilization
of that type of service, for number of instances of utilization (visits, stays, tests, drug prescriptions, etc),
and for average cost per instance of utilization (conditional on some utilization). The results shown here
are all similar if we use Probit models for the any visits outcome, or if we use Poisson count models for
the number of visits outcome.
We find that there is no change in the odds of having an office visit, but that the number of visits
falls significantly, by ‐0.15 off a base of 7.36 visits on average. There is no effect on per‐visit cost. For
inpatient utilization, we once again do not find any results of statistical significance. The point
estimates, however, are more consistent with a decline in costs per visit than with a decline in inpatient
hospital visits. For outpatient utilization, we do find a reduction in the odds of any outpatient visit, in
the number of visits, and in the cost per visit. For emergency room utilization, there are reductions in all
measures, but the only significant change is a reduction in the number of visits. For labs, we find a
reduction in both the level of lab results and the cost per result, which produces the significant total
drop in spending. The results for prescription drug utilization are interesting. As noted earlier, there is
no net impact on prescription drug spending. But this appears to reflect a significant reduction in the
number of prescriptions (a reduction of 0.4 prescriptions on a base of 11.7 prescriptions), offset by a
large (although not significant) rise in the cost per prescription (a rise of $2.08 off a base of $77). We
also see a large and statistically significant decline in the quantity of “other” care.
Overall, the results are consistent with the visual impression from the two panels of Figure 3,
which suggested that the reduced spending is attributable to reductions in both quantity and price. The

21
results in Table 7 indicate that the premium holiday is associated with declines in the quantity of care
across all categories of service, with statistically significant effects on office visits, emergency room
visits, prescription drugs, and other visits. The results indicate that premium holiday is also associated
with declines in the per‐visit cost for every category of care, except prescription drugs, with statistically
significant results for outpatient visits.
Type of Physician
The results for physician office utilization suggest the potential value of a further decomposition
by type of physician. Table 8 follows the same format as Table 7, but further decomposes the results
for office visits by type of provider.
The first panel decomposes office visits into visits to primary care physicians, specialists, and
others, using data on provider specialty for all providers in Massachusetts. The “other provider”
category, which accounts for 7% of office visits, includes out‐of‐state providers as well as other
providers that we were unable to match to a specialty. The differences across these groups is striking.
We find that that primary care office visits increase, with a statistically significant 3% rise in spending in
the reduced form, implying a roughly 28% rise in spending on primary care for those who move into
narrow networks.10 At the same time, visits to specialists fall significantly, with a large 5% decline in
spending in the reduced form implying a roughly 45% reduction in specialist spending. For other
physicians, there is a significant decline in visits, but an offsetting significant rise in cost per visit,
resulting in an insignificant effect on spending. These results suggest that enrollment in a limited
network plan is associated with a shift towards primary care and away from specialist care.
10 In 2013, GIC introduced a “Centered Care” Integrated Risk Bearing Organization Initiative that may have affected the mix of primary and specialist care use. However, that initiative was introduced after our sample period ended, so cannot explain our finding of increased primary care and decreased specialist care use.

22
The second panel decomposes the office visits instead into visits to physicians that the patient
had seen previously, and visits to those that the patient had not seen. Of course, we can only identify
whether a patient has previously seen a physician if the encounter appears in our claims data; since we
do not observe an entire lifetime of claims data for each individual, we will overstate the number of
“new” providers. We know that the proportion of providers that we identify as “new” will be artificially
high at the beginning of our claims data, and will decrease mechanically over time. We therefore rely on
a full additional year of claims data, extending back to July 2008, to identify “new” and “old” providers,
while continuing to focus our analysis on the period beginning in July 2009. The disadvantage of this
approach is that our regressions include only individuals who were continuously enrolled for four years
(or 84% of our baseline sample). But the advantage is that we decrease the measurement error in our
classification of “new” vs. “old” providers. Importantly, there is no reason to expect differential
measurement error in our classification of new and old providers for state and municipal employees, so
we do not believe that our coefficients are biased by this issue.
There is a sizeable reduction in visits to providers whom the patient had previously seen, as well
as a reduction in cost per visit, so that total spending on such physicians falls by 3.4%. For new
providers, there is a sizeable rise in the odds of a visit, the number of visits, and cost per visit, so that
total spending on new providers rises by 5.6%. Given that the mean spending on old providers is $771,
while on new providers it is $304, this is consistent with an overall fall in physician spending. Overall,
shifting to limited network plans appears to cause a shift away from traditional providers towards newer
(lower cost) options. The new providers chosen by individuals are marginally more expensive than new
providers chosen previously, but not enough to offset the cost difference between new and old
providers.

23
Part VI: Impact on Patient Access
A full analysis of the impact of limited network plans would include effects on patient outcomes.
Unfortunately, our data do not contain health outcome measures. Typically used process measures,
such as avoidable hospitalizations, rely on inpatient data where our precision is limited. Our efforts to
investigate such variables have found no effects but very wide confidence intervals. We have also tried
to assess impacts on patient mortality, and once again our estimates were simply too imprecise. 11
There is one important outcome that is the current focus of much debate over limited network
plans, however: patient access to providers as proxied by distance traveled. A major concern raised
about limited network plans is that it will lead patients to have to travel much further to see their
providers. We can address this concern with our data by examining the distance between patients and
the providers they do see when they join limited network plans. To do so, we use the distance between
the centroid of patient and provider zip codes in our data, for every provider‐patient pair that we
observe.
The results of this analysis are shown in the top panel of Table 9. We find that overall there is
no significant impact on distance traveled for an office visit. But we find that this masks important
heterogeneity by type of office visit: distance traveled for primary care visits falls by 0.65 miles in our
reduced form estimates, or by about 5.6 miles as our implied IV coefficient; this is more than half of the
baseline distance traveled for primary care.12 On the other hand, distance traveled rises for specialists,
11 While we don’t observe mortality directly in our data, we can examine the probability of exit from the full sample and, in particular, exit from a family plan when the rest of the family remains enrolled at ages that are not associated with exits due to college graduation or Medicare enrollment. In the full sample, the premium holiday is associated with a statistically insignificant 0.014 percentage point decline in the probability of such an exit. With a standard error of 0.04 percentage points and a mean exit rate of 0.4 percent, we lack the precision to reject a meaningful increase or decrease in such exits. We also examined this exit rate for a variety of subsamples and found no statistically significant effects. 12 It is possible to observe a negative impact on primary care distance as a result of compositional change in primary care visits. We observe that limited network enrollment is correlated with an increase in primary care visits and, to the extent that those additional visits are to providers who are relatively short distances away from the patients, it is possible to find that limited network enrollment is associated with a decline in average primary care distance.

24
although not significantly. We find that those patients who continue to see their old providers are
traveling shorter distances to do so, but that those patients who see new providers are traveling farther;
the latter effect is fairly sizeable, with an implied IV coefficient of about 7 miles, or about two‐thirds of
the mean distance traveled to new providers.
We find that patients travel shorter distances for outpatient and ER visits, but that they travel
much farther to the hospital. The implied IV coefficient on travel to hospitals suggests that the marginal
patient switching to a limited network plan travels almost 40 miles further to the hospital. However,
this coefficient has a large confidence interval around it, so we cannot exclude considerably smaller
increases in the distance travelled.
A related concern is that limited network plans restrict patient access to high‐quality providers.
In particular, one might be concerned that lower costs are correlated with lower quality. To assess this
concern, we obtained eight measures of hospital quality for Massachusetts hospitals and matched them
to the hospitalizations in our sample. Our quality measures include the 30‐day mortality rates
associated with hospitalizations for heart attacks, heart failure, and pneumonia for each hospital. In
addition, our measures included the 30‐day readmission rates associated with hospitalization for heart
attack, heart failure, pneumonia, hip or knee surgery, and all causes.
In the bottom panel of Table 9, we report results from regressions that are exactly like the
regressions in the top panel of Table 9, except that they use quality measures for each enrollee
(conditional on hospitalization) as the dependent variable. The results are not suggestive of any impact
on quality. The results are uniformly statistically insignificant, and they are equally likely to be negative
(suggesting higher quality) as they are to be positive (suggesting lower quality). In addition, the point
estimates are very small relative to the means. As a result, we conclude that enrollment in limited
network plans is not associated with any change in the quality of accessible inpatient hospital care.

25
Part VII: Heterogeneity In Responses
It is possible that the impacts of limited network plans vary considerably by type of patient. We
consider in particular three types of heterogeneity in the analysis.
A particular concern is that moving to a more limited network plan may have significant
negative connotations for the most ill patients. Table 10a shows the results separately by chronic illness
status. We find that the overall effect on spending is similar for the chronically ill and non‐chronically ill,
although given the larger first stage for the latter group, this implies somewhat larger effects for the
marginal chronically ill individual who was induced to switch by the financial incentives. Most
importantly, we do not find any evidence that limited network plans caused difficulties in physician
access for the chronically ill. Indeed, we find a strong shift in spending from specialists to primary care
physicians, with spending falling considerably for the former and rising for the latter. We also find that
for the chronically ill there is a significant reduction in inpatient spending, and no statistically significant
impact on emergency room use. Taken together, these results do not indicate any particular cause for
concern for the chronically ill from switching to a limited network plan.
The next dimension of heterogeneity that we consider is by whether patients’ primary care
physicians were included in limited plan networks. As described earlier, we divide the sample into those
who could keep both their insurer and their primary care provider, those who could keep their primary
care provider but to do so would have to switch to a different insurer, and those who could not keep
their primary care provider if they switched to a limited network plan.
The results of this analysis are shown in Table 10b. We find that the largest declines in spending
are for those who are able to keep their primary care physician, either by moving to the limited network
version of the current insurer’s plan or by moving to another limited network plan. For these groups
primary care visits rise, and specialist visits fall. For those staying with the same insurer, there is a more
modest change in both measures; for those keeping their doctor but switching insurers, there is a much

26
more sizeable reduction in specialist use. This is an interesting finding which suggests that doctors
change their use of specialists depending on the network availability of those specialists.
For patients who can keep their physician, we also see no change in hospitalization rates, but a
decline in hospital spending, consistent with the idea that the limited network causes them to choose a
lower cost hospital. In addition, there are statistically significant declines in outpatient spending and
utilization for these groups.
For those whose primary care physician does not participate in a limited network, in contrast,
the impact on spending is positive and statistically insignificant, with little change of significance in most
categories of spending. This is despite the fact that there is a significant response to the financial
incentives in this group in terms of switching to a limited network plan. These findings suggest that the
power of limited network plans to lower costs depends critically on those who retain their primary care
physician through the switching process. This further implies that the ability to extrapolate our findings
depends critically on how limited network plans limit access to primary care physicians; those plans that
have very narrow networks of primary care physicians may be less successful in controlling costs.
Finally, we consider heterogeneity by type of illness: which types of illness are driving these
results? We classified all of the spending in our sample in 19 major diagnostic categories based on the
primary ICD‐9 codes.13 As shown in Table 11, there are negative impacts on spending for about two‐
thirds of our diagnosis categories. None of the categories with positive spending impacts are significant.
In contrast, we find four categories of spending for which the effects are negative and significant:
Neoplasms, Respiratory Diagnoses, Musculoskeletal Diagnoses, and Injuries and Poisonings. Thus, our
findings are not driven by just one category of spending, but appear broadly spread across the diagnosis
spectrum.
13 Spending for an encounter could be classified into more than one category if there were multiple diagnoses. This could happen if, for example, an individual was hospitalized with more than one primary diagnosis across the claims generated by the hospitalization. As a result, the sum of spending across all 19 diagnostic categories is greater than total spending.

27
Part VIII: Conclusions
The debate over the impact of the shift to narrow network plans has largely proceeded in an
evidence vacuum. This paper attempts to move forward our understanding of how individuals choose
such plans and their implication for utilization of health care.
We first find that patients are very price sensitive in their decisions to switch to limited network
plans, with a price elasticity above one. There is modest adverse selection associated with such price
incentives, as those who are most healthy are the most price sensitive.
We then show that the large premium differential between broad and limited network plans is
driven not by selection but by real reductions in spending among those induced to switch plans. This
reduction in spending comes from both reductions in prices paid and quantity of care used. The
reduction in spending does not appear to come from reduced access to primary care; indeed, use of
primary care and spending on such services rises for those switching to limited network plans. Rather,
the reduction arises from less use of specialists and hospital care. The fact that primary care use is
rising, while emergency room and hospital spending is falling, suggests that the move to limited network
plans is not adversely impacting health, although we are unable to demonstrate health effects with any
certainty. We find that distance traveled falls for primary care and rises for tertiary care, although there
is no evidence of a decrease in the quality of hospitals used by patients.
We also found that the positive effects on primary care and reductions in spending on
specialist/hospital care occur for both more and less healthy patients, and that the spending reduction
holds for a broad spectrum of illnesses. We do find, however, that the spending reduction is driven
primarily by those who are able to keep their primary care physician when moving to a limited network
plan. Taken together with our overall findings on primary care, we conclude that the real savings from
limited network plans arises from restrictions downstream from the primary care provider.
28
One natural question that arises from our findings is whether the premium incentives provided
by the GIC were fiscally beneficial to the state of Massachusetts. The answer to this question appears to
be “Yes.” We calculate that the employer premium contributions that were paid for all individual and
family plan enrollees in fiscal year 2012 was 1.2% percent lower than it would have been in the absence
of the premium holiday. This 1.2% reduction in employer premium costs combines a 2.8% reduction in
the employer share of the lower premium in limited network plans arising from the 11.6 percentage
point increase in limited network enrollment that we calculated in our first stage and a 1.6% increase in
the employer’s share of all premiums due to the premium holiday. In future years, if the same group of
enrollees who responded to the premium holiday were to remain enrolled in limited network plans, the
savings would be expected to be approximately 2.8%. While some of the marginal enrollees might
switch back to broad network plans, there is a great deal of inertia in insurance plan enrollment.14 We
have analyzed aggregate enrollment data for the years following the premium holiday, and the patterns
are consistent with the idea that the vast majority of the new limited network enrollees who were
induced to switch by the premium holiday remained in limited network plans in subsequent years.
While 31.2% of all enrollees covered by active state employees were enrolled in limited network plans in
FY 2012 (the year that the premium holiday took effect), 30.4% were enrolled in limited network plans
in FY 13 and 31.1% were enrolled in FY 14. By comparison, 25.1% of all enrollees covered by active
municipal employees were in limited network plans in FY 12, 24.5% of them were enrolled in limited
network plans in FY 13, and 26.9% were enrolled in FY 14. This inertia in plan enrollments suggests that
the fiscal benefits of the 2012 premium holiday were likely much larger in subsequent years when the
premium holiday was no longer in place, since the state benefited from a reduced premium bill with any
offsetting increase in the employer share of the premium.
14 In our sample, only 3% of those who were enrolled in broad network plans in FY 2010 switched to limited network plans for FY 2011; similarly, only 1% of those who were enrolled in limited network plans in FY 2010 switched to a broad network plan in FY 2011.

29
The most important caveat to our results is that they apply to one particular example, and that
we may not be able to extrapolate them to other limited network plans, for example those featured on
state exchanges. An important goal for future work should be to extend this analysis to those other
examples. This should be feasible given that the tax credits available under the ACA provide distinctly
non‐linear price differentials across health insurance options, allowing future researchers to assess how
those induced into limited network plans on exchanges are faring in terms of health care spending and
outcomes.

30
References
Buntin, Melinda Beeuwkes and Zaslavsky, Alan M., 2004. "Too much ado about two‐part models and transformation?: Comparing methods of modeling Medicare expenditures," Journal of Health Economics, 23(3): 525‐542.
Commonwealth of Massachusetts Group Insurance Commission (2012). “Fiscal Year 2012 Annual
Report: Leading the Way in Health Care,” December 2012. Downloaded from http://www.mass.gov/anf/docs/gic/annual‐report/arfy2012.pdf on March 5, 2014.
Commonwealth of Massachusetts Group Insurance Commission (2011). “Fiscal Year 2010 Annual
Report: Successfully Navigating Rough Fiscal and Health Care Seas,” January 2011. Downloaded from http://www.mass.gov/anf/docs/gic/annual‐report/arfy2010.pdf on March 7, 2014.
Frank, Matt, John Hsu, Mary Beth Landrum and Michael Chernew (2014). “The Effects of a Tiered
Network on Hospital choice and Utilization of Discretionary and Nondiscretionary Care,” mimeo, Harvard University.
Glied, Sherry (2000). “Managed Care,” in Culyer, Anthony J, Newhouse, Joseph P. (Eds.), Handbook of
Health Economics. Amsterdam: Elsevier North Holland: 707‐753. Goldman, Dana P., Geoffrey F. Joyce, Jose J. Escarce, Jennifer E. Pace, Matthew D. Colomom, Marianne
Laouri, Pamela B. Landsman, and Steven M. Teutsch (2004). “Pharmacy Benefits and the Use of Drugs by the Chronically Ill,” Journal of the American Medical Association 291: 2344‐2351
Jan, Tracy (2014). “With Health law, Less‐Easy Access in N.H,” The Boston Globe, January 20, 2014,
available at http://www.bostonglobe.com/news/nation/2014/01/20/narrow‐hospital‐networks‐new‐hampshire‐spark‐outrage‐political‐attacks/j2ufuNSf9J2sdEQBpgIVqL/story.html Accessed May 7, 2014
Luhby, Tami (2014). “Got Obamacare, Can’t Find Doctors,” cnn.com, March 19, 2014, Available at
http://money.cnn.com/2014/03/19/news/economy/obamacare‐doctors/ Accessed May 7, 2014.
Manning, Willard G. and John Mullahy (2001). “Estimating Log Models: To Transform or Not to
Transform?,” Journal of Health Economics 20(4): 461‐494. Manning, Willard G., Joseph P. Newhouse, Naihua Duan, Emmett B. Keeler, and Arleen Leibowitz (1987).
“Health Insurance and the Demand for Medical Care: Evidence from a Randomized Experiment,” The American Economic Review 77(3): 251‐277.
Pickert, Kate (2014). “Keeping Your Doctor Under Obamacare is No Easy Feat,” Time, January 1,
2014, available at http://swampland.time.com/2014/01/01/keeping‐your‐doctor‐under‐obamacare‐is‐no‐easy‐feat/ Accessed May 7, 2014.
Weisman, Robert and Chelsea Canaboy (2011). “Tiered Health Plans Cutting Costs, Restricting Options,”
The Boston Globe, November 28, 2011, p. A1.
31
Figure 1
Panel A: The Monthly Savings from Switching to a Limited Network, as a Percentage of Average Broad Network Premium Contribution
Panel B: Enrollment in Limited Network Plans, as a Percentage of Total Enrollment
20
25
30
35
40
45
50
55
2010 2011 2012
Percent
Fiscal Year
Monthly Savings from Switching
Municipalities State
0
5
10
15
20
25
30
35
2010 2011 2012
Percent
Fiscal Year
Enrollment in Limited Network Plans
Municipalities State

32
Figure 2: Total Quarterly Spending per Capita
900
1000
1100
1200
1300
1400
15002010q1
2010q2
2010q3
2010q4
2011q1
2011q2
2011q3
2011q4
2012q1
2012q2
2012q3
2012q4
Fiscal Year
Total Spending Per Capita
Municipality State
33
Figure 3: Decomposition of Changes in Total Quarterly Spending per Capita Panel A
Panel B
1100
1150
1200
1250
1300
1350
1400
1450
2010q1
2010q2
2010q3
2010q4
2011q1
2011q2
2011q3
2011q4
2012q1
2012q2
2012q3
2012q4
Quantities Fixed at 2010 Broad Network Level, Prices Varying
Municipality State
1000
1050
1100
1150
1200
1250
2010q1
2010q2
2010q3
2010q4
2011q1
2011q2
2011q3
2011q4
2012q1
2012q2
2012q3
2012q4
Quantities Varying, Prices Fixed at 2010 Broad Network Level
Municipality State
34
Table 1: Details of 2010 GIC Plan Options
Plan Name
Enrollment in June 2010
Type of Plan
Limited Network Plan
Fallon Community Health Plan Direct Care 1% HMO Yes Fallon Community Health Plan Select Care 3% HMO No Harvard Pilgrim Independence Plan 26% PPO No Harvard Pilgrim Primary Choice Plan 0% HMO Yes Health New England 6% HMO Yes Neighborhood Health Plan 1% HMO Yes Tufts Health Plan Navigator 31% PPO No Tufts Health Plan Spirit 0% HMO‐type Yes UniCare State Indemnity Plan Basic 17% Indemnity No Unicare State Indemnity Plan Community Choice 6% PPO‐type Yes Unicare State Indeminity Plan PLUS 9% PPO‐type No
35
Table 2: Measures of Network Breadth
Physician Hospital >5 Claims >10 Claims > 5 Claims >10 Claims
Average across all plans
Broad 0.250 0.212 0.776 0.710 Narrow 0.135 0.107 0.541 0.419 Harvard Pilgrim Broad: Independence 0.367 0.315 0.963 0.901 Narrow: Primary Choice 0.110 0.077 0.570 0.418 Tufts Broad: Navigator 0.351 0.312 0.827 0.815 Narrow: Spirit 0.054 0.034 0.329 0.158 Unicare Broad: Basic 0.263 0.220 0.926 0.864 Broad: Plus 0.199 0.160 0.802 0.728 Narrow: Community Choice 0.166 0.128 0.650 0.563 Fallon Broad: Select 0.069 0.052 0.360 0.240 Narrow: Direct 0.066 0.051 0.400 0.200 Other Narrow Health New England 0.353 0.313 0.923 0.923 Neighborhood Health Plan 0.059 0.041 0.373 0.253
Notes: This table shows the proportion of providers located in the counties where the insurance plan operates for whom we observe at least 5 (or 10) in‐network claims.

36
Table 3: Summary Statistics
Variable
Mean (Standard Deviation)
Enrolled in Limited Network Plan 0.201 (0.400)
Savings from switching to limited network plan (as a % of employee contribution to broad network plan)
36.55% (9.64)
Spending Visits
Total expenses $4,811 (15,132)
‐
Office visits $1,084 (2,155)
7.36 (9.69)
Primary Care $323 (653)
2.17 (2.92)
Specialist $676 (1799)
4.60 (8.31)
Other $85 (762)
0.55 (2.56)
Old Provider $771 (1,937)
5.64 (8.37)
New Provider $304 (546)
1.43 (1.68)
Inpatient Hospitalization
$864 (8,117)
0.053 (0.297)
Outpatient Hospital $1,443 (7,200)
3.76 (8.12)
Emergency Room $235 (995)
0.220 (0.635)
Lab & X‐rays $69 (336)
0.550 (1.463)
Drugs $900 (4,417)
11.69 (17.03)
Other $210 (3,324)
0.70 (4.38)
Number of observations 479,196
37
Table 4 – First Stage Regressions
Difference‐in‐difference Full variation
State employees*Post 0.1165** (0.0036)
Relative Price of Limited Plans 0.0070** (0.0002)
Male 0.0011** (0.0004)
0.0011** (0.0004)
Age 19‐29 ‐0.0067** (0.0010)
‐0.0068** (0.0010)
Age 30‐39 0.0236** (0.0036)
0.0236** (0.0036)
Age 40‐49 ‐0.0019 (0.0020)
‐0.0019 (0.0020)
Age 50‐59 ‐0.0212** (0.0037)
‐0.0212** (0.0037)
Age 60‐69 ‐0.0546** (0.0035)
‐0.0545** (0.0035)
Age 69+ ‐0.0812** (0.0069)
‐0.0810** (0.0069)
Family plan 0.0006 (0.0022)
0.0092** (0.0022)
Number Obs 479,196 479,196
Notes: Each column shows coefficients (and standard errors) from a single OLS regression. Other control variables include a full set of municipality and year fixed effects and controls for date of hire. The omitted age category is <19 years old. Standard errors are clustered on municipality. The sample includes all continuously enrolled active employees over the three‐year period from fiscal year 2010 to fiscal year 2012; the unit of observation is a person‐year. * denotes significance at the 10% level ** denotes significance at the 5% level
38
Table 5 – Heterogeneity in First Stage
Difference‐in‐difference Full variation
Base Estimates
0.116** (0.004)
0.0070** (0.0002)
By Chronic Illness No Chronic Illness
(N=132,727)
0.104** (0.003)
0.0063** (0.0002)
Chronic Illness (N=346,469)
0.121** (0.004)
0.0073** (0.0002)
By broad network insurance company in FY 2010 Fallon
(N=13,695)
0.236** (0.012)
0.0139** (0.0008)
Harvard (N=121,992)
0.199** (0.007)
0.0117** (0.0005)
Tufts (N=169,065)
0.109** (0.009)
0.0068** (0.0005)
Unicare (N=102,381)
0.081** (0.006)
0.0056** (0.0007)
By PCP’s availability in a limited network PCP is in the limited network plan
offered by current insurer (N=187,656)
0.168** (0.006)
0.0100** (0.0003)
PCP is in a limited network plan offered by a different insurer
(N=76,125)
0.127** (0.010)
0.0077** (0.0006)
PCP is not in a limited network plan (N=43,197)
0.101** (0.002)
0.0061** (0.0002)
Notes: Each cell shows the coefficient (and standard error) from a single regression. In the first column, the coefficient is on the interaction between “state employee” and post; in the second column, the coefficient is on the relative price of limited network plans. Each row shows results for a different sub‐sample. Control variables include gender, age group, enrollment in a family plan, date of hire, and a full set of municipality and year fixed effects. Coefficients are estimated using OLS. Standard errors are clustered on municipality. * denotes significance at the 10% level ** denotes significance at the 5% level
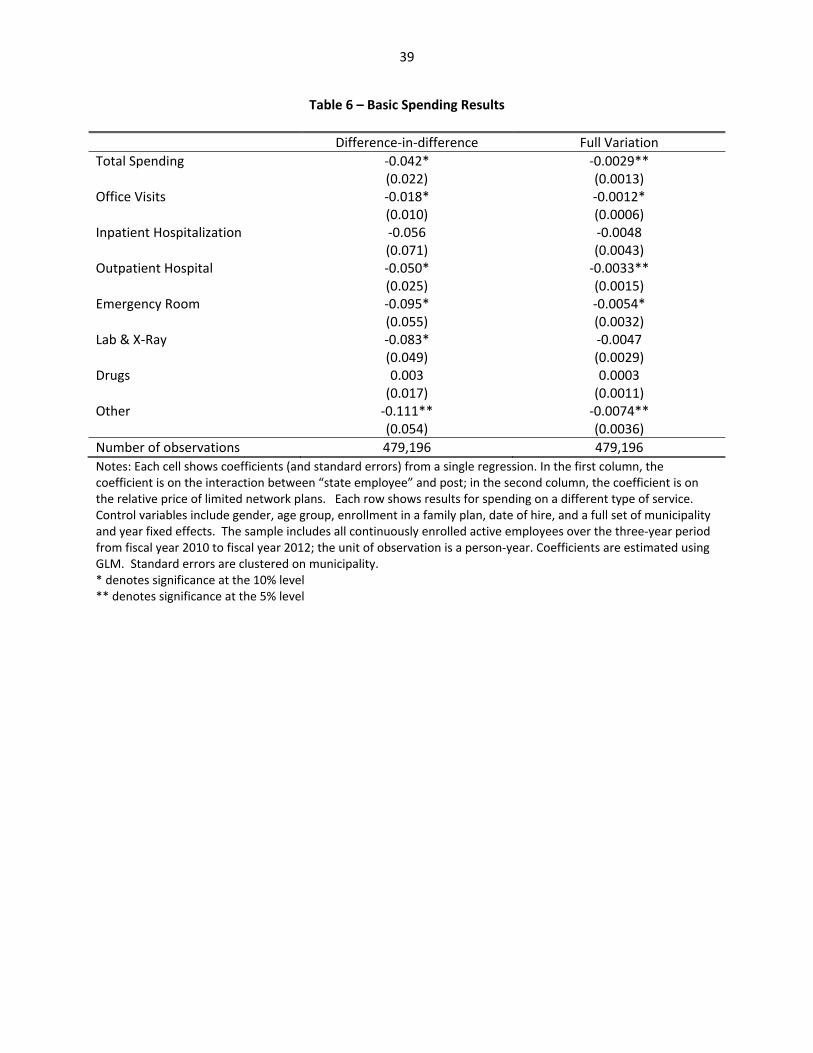
39
Table 6 – Basic Spending Results
Difference‐in‐difference Full Variation
Total Spending ‐0.042* (0.022)
‐0.0029** (0.0013)
Office Visits ‐0.018* (0.010)
‐0.0012* (0.0006)
Inpatient Hospitalization ‐0.056 (0.071)
‐0.0048 (0.0043)
Outpatient Hospital ‐0.050* (0.025)
‐0.0033** (0.0015)
Emergency Room ‐0.095* (0.055)
‐0.0054* (0.0032)
Lab & X‐Ray ‐0.083* (0.049)
‐0.0047 (0.0029)
Drugs 0.003 (0.017)
0.0003 (0.0011)
Other ‐0.111** (0.054)
‐0.0074** (0.0036)
Number of observations 479,196 479,196
Notes: Each cell shows coefficients (and standard errors) from a single regression. In the first column, the coefficient is on the interaction between “state employee” and post; in the second column, the coefficient is on the relative price of limited network plans. Each row shows results for spending on a different type of service. Control variables include gender, age group, enrollment in a family plan, date of hire, and a full set of municipality and year fixed effects. The sample includes all continuously enrolled active employees over the three‐year period from fiscal year 2010 to fiscal year 2012; the unit of observation is a person‐year. Coefficients are estimated using GLM. Standard errors are clustered on municipality. * denotes significance at the 10% level ** denotes significance at the 5% level
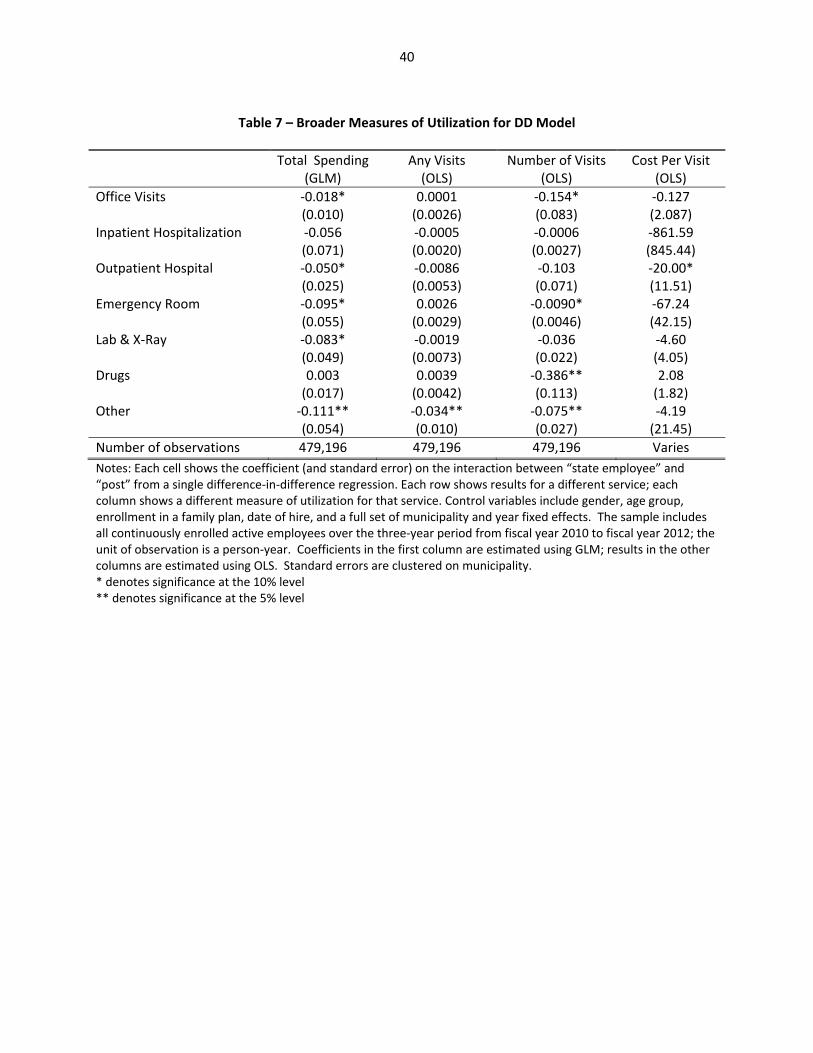
40
Table 7 – Broader Measures of Utilization for DD Model
Total Spending(GLM)
Any Visits (OLS)
Number of Visits (OLS)
Cost Per Visit (OLS)
Office Visits ‐0.018* (0.010)
0.0001 (0.0026)
‐0.154* (0.083)
‐0.127 (2.087)
Inpatient Hospitalization ‐0.056 (0.071)
‐0.0005 (0.0020)
‐0.0006 (0.0027)
‐861.59 (845.44)
Outpatient Hospital ‐0.050* (0.025)
‐0.0086 (0.0053)
‐0.103 (0.071)
‐20.00* (11.51)
Emergency Room ‐0.095* (0.055)
0.0026 (0.0029)
‐0.0090* (0.0046)
‐67.24 (42.15)
Lab & X‐Ray ‐0.083* (0.049)
‐0.0019 (0.0073)
‐0.036 (0.022)
‐4.60 (4.05)
Drugs 0.003 (0.017)
0.0039 (0.0042)
‐0.386** (0.113)
2.08 (1.82)
Other ‐0.111** (0.054)
‐0.034** (0.010)
‐0.075** (0.027)
‐4.19 (21.45)
Number of observations 479,196 479,196 479,196 Varies
Notes: Each cell shows the coefficient (and standard error) on the interaction between “state employee” and “post” from a single difference‐in‐difference regression. Each row shows results for a different service; each column shows a different measure of utilization for that service. Control variables include gender, age group, enrollment in a family plan, date of hire, and a full set of municipality and year fixed effects. The sample includes all continuously enrolled active employees over the three‐year period from fiscal year 2010 to fiscal year 2012; the unit of observation is a person‐year. Coefficients in the first column are estimated using GLM; results in the other columns are estimated using OLS. Standard errors are clustered on municipality. * denotes significance at the 10% level ** denotes significance at the 5% level
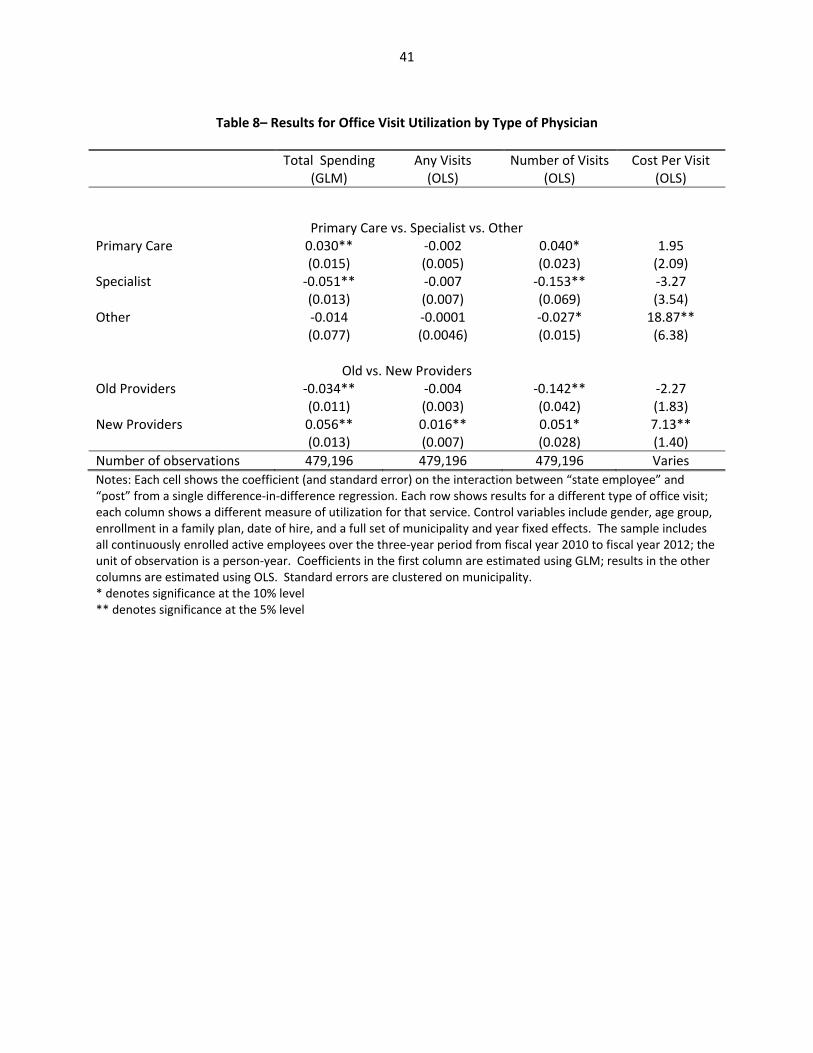
41
Table 8– Results for Office Visit Utilization by Type of Physician
Total Spending(GLM)
Any Visits (OLS)
Number of Visits (OLS)
Cost Per Visit (OLS)
Primary Care vs. Specialist vs. Other Primary Care 0.030**
(0.015) ‐0.002 (0.005)
0.040* (0.023)
1.95 (2.09)
Specialist ‐0.051** (0.013)
‐0.007 (0.007)
‐0.153** (0.069)
‐3.27 (3.54)
Other ‐0.014 (0.077)
‐0.0001 (0.0046)
‐0.027* (0.015)
18.87** (6.38)
Old vs. New Providers
Old Providers ‐0.034** (0.011)
‐0.004 (0.003)
‐0.142** (0.042)
‐2.27 (1.83)
New Providers 0.056** (0.013)
0.016** (0.007)
0.051* (0.028)
7.13** (1.40)
Number of observations 479,196 479,196 479,196 Varies
Notes: Each cell shows the coefficient (and standard error) on the interaction between “state employee” and “post” from a single difference‐in‐difference regression. Each row shows results for a different type of office visit; each column shows a different measure of utilization for that service. Control variables include gender, age group, enrollment in a family plan, date of hire, and a full set of municipality and year fixed effects. The sample includes all continuously enrolled active employees over the three‐year period from fiscal year 2010 to fiscal year 2012; the unit of observation is a person‐year. Coefficients in the first column are estimated using GLM; results in the other columns are estimated using OLS. Standard errors are clustered on municipality. * denotes significance at the 10% level ** denotes significance at the 5% level

42
Table 9: Impact on Distance Traveled and Hospital Quality
Dependent Variable Mean of Dependent Variable
DD Coefficient
Measures of Distance Travelled Distance to Office Visits 9.82
(9.45) ‐0.114 (0.131)
Distance to Primary Care Visits 8.19 (10.69)
‐0.659** (0.278)
Distance to Specialists 10.53 (10.11)
0.038 (0.183)
Distance to Other Office Visits 9.88 (15.59)
‐0.151 (0.447)
Distance to Old Providers 9.49 (10.27)
‐0.363** (0.147)
Distance to New Providers 12.59 (12.82)
0.857** (0.377)
Distance to Inpatient Hospitalization 28.10 (26.81)
4.538** (2.149)
Distance to Outpatient Hospital 14.58 (13.00)
‐1.193** (0.333)
Distance to Emergency Room 22.23 (22.43)
‐0.774 (0.485)
Measures of Hospital Quality 30‐Day Mortality Rate, AMI
13.81 (1.24)
‐0.002 (0.040)
30‐Day Mortality Rate, Heart failure
10.34 (1.28)
0.031 (0.078)
30‐Day Mortality Rate, Pneumonia
11.04 (1.50)
0.062 (0.112)
30‐Day Readmission Rate, AMI
19.07 (1.25)
‐0.054 (0.067)
30‐Day Readmission Rate, Heart Failure
23.68 (1.46)
0.016 (0.041)
30‐Day Readmission Rate, Pneumonia
18.24 (1.27)
‐0.044 (0.050)
30‐Day Readmission Rate, Hip or Knee Surgery
5.51 (0.68)
0.026 (0.018)
30‐Day Readmission Rate, All Cause
16.46 (1.05)
‐0.035 (0.039)
Notes: Each cell shows the coefficient (and standard error) on the interaction between “state employee” and “post” from a single difference‐in‐difference regression. Each row shows results for distance to a different type of provider. Control variables include gender, age group, enrollment in a family plan, date of hire, and a full set of municipality and year fixed effects. The sample includes all continuously enrolled active employees over the three‐year period from fiscal year 2010 to fiscal year 2012; the unit of observation is a person‐year. Coefficients are estimated using OLS. Standard errors are clustered on municipality. * denotes significance at the 10% level ** denotes significance at the 5% level

43
Table 10a: Heterogeneity in Results by Chronic Illness
Not Chronically Ill Chronically Ill Spending
(GLM) Visits (OLS)
Distance (OLS)
Spending (GLM)
Visits (OLS)
Distance (OLS)
Total Spend ‐0.039* (0.023)
‐0.043 (0.033)
Office Total ‐0.023** (0.011)
‐0.066 (0.092)
‐0.137 (0.183)
‐0.013 (0.016)
‐0.349** (0.168)
‐0.083 (0.103)
Primary 0.022 (0.020)
0.060** (0.026)
‐0.0851** (0.139)
0.035* (0.018)
‐0.006 (0.039)
‐0.474 (0.463)
Specialist ‐0.053** (0.015)
‐0.085 (0.071)
0.210 (0.244)
‐0.045** (0.021)
‐0.303** (0.143)
‐0.095 (0.133)
Other ‐0.032 (0.103)
‐0.031 (0.021)
‐3.314** (0.370)
0.051 (0.057)
‐0.015 (0.035)
1.733** (0.417)
Old ‐0.054** (0.021)
‐0.124 (0.130)
‐0.467** (0.178)
‐0.009 (0.024)
‐0.069 (0.182)
‐0.252 (0.163)
New 0.037 (0.024)
0.046 (0.033)
0.566* (0.329)
0.087** (0.009)
0.079** (0.033)
1.282** (0.453)
Inpatient 0.053 (0.088)
0.001 (0.002)
5.603* (2.840)
‐0.137* (0.073)
‐0.005 (0.006)
3.99* (2.117)
Outpatient ‐0.045 (0.038)
‐0.109* (0.057)
‐1.072** (0.253)
‐0.051 (0.034)
‐0.088 (0.143)
‐1.291** (0.457)
ER ‐0.139** (0.059)
‐0.007 (0.005)
‐2.432** (0.768)
‐0.016 (0.061)
‐0.012 (0.008)
1.151 (0.725)
Lab ‐0.040 (0.055)
‐0.024* (0.012)
‐0.159** (0.065)
‐0.064 (0.057)
Drugs ‐0.00003 (0.0282)
‐0.250** (0.110)
0.007 (0.029)
‐0.710** (0.242)
Other ‐0.151* (0.077)
‐0.049* (0.029)
‐0.106* (0.055)
‐0.141** (0.044)
N 346,469 346,469 Varies 132,727 132,727 Varies
Notes: Each cell shows the coefficient (and standard error) on the interaction between “state employee” and “post” from a single difference‐in‐difference regression. Each row shows results for a different service; each column shows a different measure of utilization for that service for one of the two sub‐samples. Control variables include gender, age group, enrollment in a family plan, date of hire, and a full set of municipality and year fixed effects. Coefficients in the first and fourth columns are estimated using GLM; results in the other columns are estimated using OLS. Standard errors are clustered on municipality. * denotes significance at the 10% level ** denotes significance at the 5% level
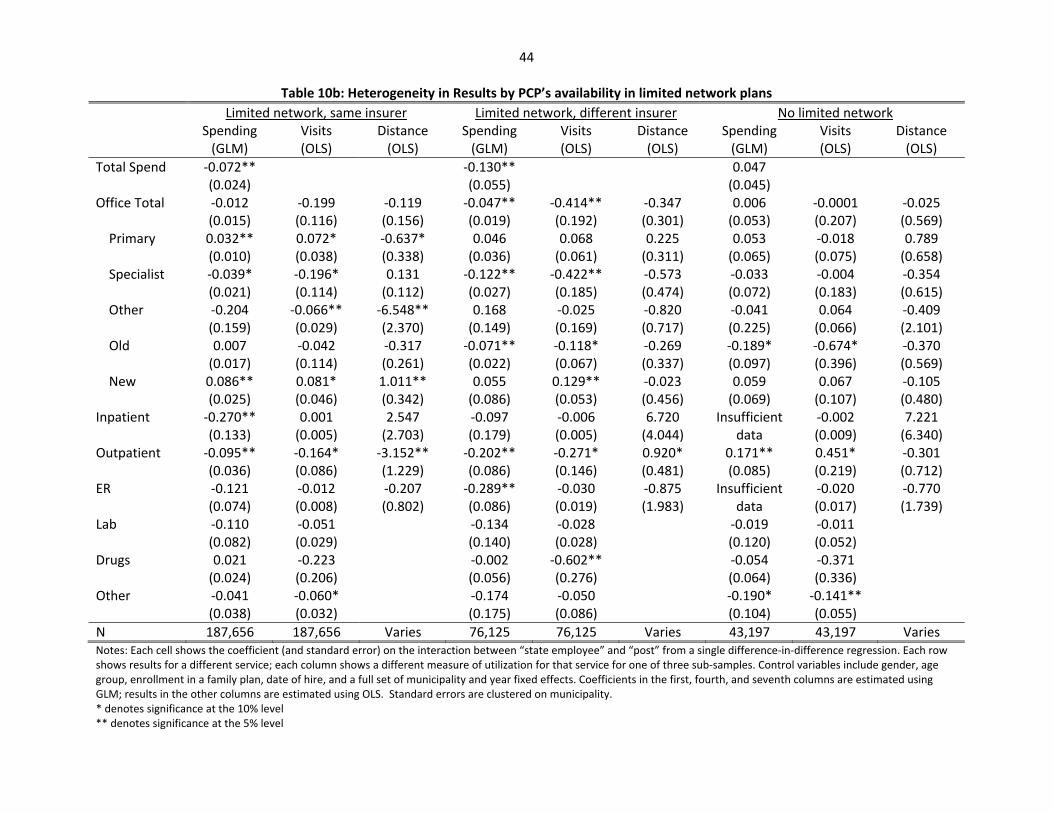
44
Table 10b: Heterogeneity in Results by PCP’s availability in limited network plans
Limited network, same insurer Limited network, different insurer No limited network Spending
(GLM) Visits (OLS)
Distance (OLS)
Spending (GLM)
Visits (OLS)
Distance (OLS)
Spending (GLM)
Visits (OLS)
Distance (OLS)
Total Spend ‐0.072** (0.024)
‐0.130** (0.055)
0.047 (0.045)
Office Total ‐0.012 (0.015)
‐0.199 (0.116)
‐0.119 (0.156)
‐0.047** (0.019)
‐0.414** (0.192)
‐0.347 (0.301)
0.006 (0.053)
‐0.0001 (0.207)
‐0.025 (0.569)
Primary 0.032** (0.010)
0.072* (0.038)
‐0.637* (0.338)
0.046 (0.036)
0.068 (0.061)
0.225 (0.311)
0.053 (0.065)
‐0.018 (0.075)
0.789 (0.658)
Specialist ‐0.039* (0.021)
‐0.196* (0.114)
0.131 (0.112)
‐0.122** (0.027)
‐0.422** (0.185)
‐0.573 (0.474)
‐0.033 (0.072)
‐0.004 (0.183)
‐0.354 (0.615)
Other ‐0.204 (0.159)
‐0.066** (0.029)
‐6.548** (2.370)
0.168 (0.149)
‐0.025 (0.169)
‐0.820 (0.717)
‐0.041 (0.225)
0.064 (0.066)
‐0.409 (2.101)
Old 0.007 (0.017)
‐0.042 (0.114)
‐0.317 (0.261)
‐0.071** (0.022)
‐0.118* (0.067)
‐0.269 (0.337)
‐0.189* (0.097)
‐0.674* (0.396)
‐0.370 (0.569)
New 0.086** (0.025)
0.081* (0.046)
1.011** (0.342)
0.055 (0.086)
0.129** (0.053)
‐0.023 (0.456)
0.059 (0.069)
0.067 (0.107)
‐0.105 (0.480)
Inpatient ‐0.270** (0.133)
0.001 (0.005)
2.547 (2.703)
‐0.097 (0.179)
‐0.006 (0.005)
6.720 (4.044)
Insufficient data
‐0.002 (0.009)
7.221 (6.340)
Outpatient ‐0.095** (0.036)
‐0.164* (0.086)
‐3.152** (1.229)
‐0.202** (0.086)
‐0.271* (0.146)
0.920* (0.481)
0.171** (0.085)
0.451* (0.219)
‐0.301 (0.712)
ER ‐0.121 (0.074)
‐0.012 (0.008)
‐0.207 (0.802)
‐0.289** (0.086)
‐0.030 (0.019)
‐0.875 (1.983)
Insufficient data
‐0.020 (0.017)
‐0.770 (1.739)
Lab ‐0.110 (0.082)
‐0.051 (0.029)
‐0.134 (0.140)
‐0.028 (0.028)
‐0.019 (0.120)
‐0.011 (0.052)
Drugs 0.021 (0.024)
‐0.223 (0.206)
‐0.002 (0.056)
‐0.602** (0.276)
‐0.054 (0.064)
‐0.371 (0.336)
Other ‐0.041 (0.038)
‐0.060* (0.032)
‐0.174 (0.175)
‐0.050 (0.086)
‐0.190* (0.104)
‐0.141** (0.055)
N 187,656 187,656 Varies 76,125 76,125 Varies 43,197 43,197 Varies Notes: Each cell shows the coefficient (and standard error) on the interaction between “state employee” and “post” from a single difference‐in‐difference regression. Each row shows results for a different service; each column shows a different measure of utilization for that service for one of three sub‐samples. Control variables include gender, age group, enrollment in a family plan, date of hire, and a full set of municipality and year fixed effects. Coefficients in the first, fourth, and seventh columns are estimated using GLM; results in the other columns are estimated using OLS. Standard errors are clustered on municipality. * denotes significance at the 10% level ** denotes significance at the 5% level
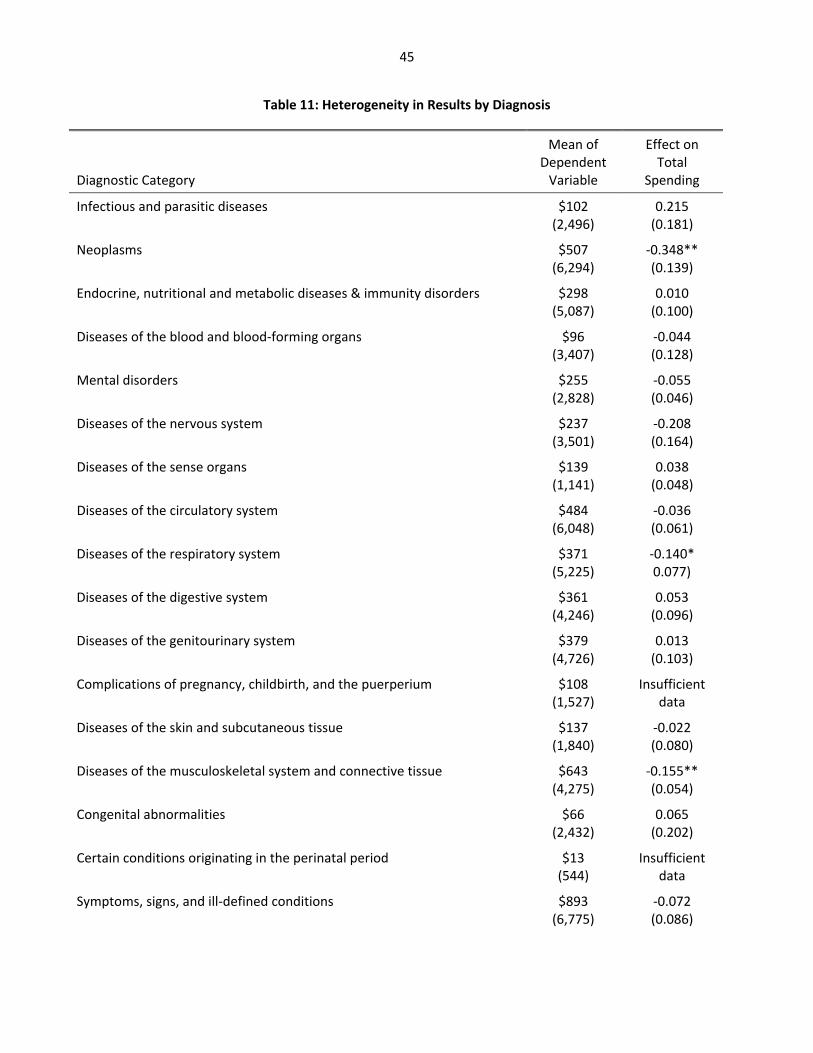
45
Table 11: Heterogeneity in Results by Diagnosis
Diagnostic Category
Mean of Dependent Variable
Effect on Total
Spending
Infectious and parasitic diseases
$102 (2,496)
0.215 (0.181)
Neoplasms
$507 (6,294)
‐0.348** (0.139)
Endocrine, nutritional and metabolic diseases & immunity disorders
$298 (5,087)
0.010 (0.100)
Diseases of the blood and blood‐forming organs
$96 (3,407)
‐0.044 (0.128)
Mental disorders
$255 (2,828)
‐0.055 (0.046)
Diseases of the nervous system
$237 (3,501)
‐0.208 (0.164)
Diseases of the sense organs
$139 (1,141)
0.038 (0.048)
Diseases of the circulatory system
$484 (6,048)
‐0.036 (0.061)
Diseases of the respiratory system
$371 (5,225)
‐0.140* 0.077)
Diseases of the digestive system
$361 (4,246)
0.053 (0.096)
Diseases of the genitourinary system
$379 (4,726)
0.013 (0.103)
Complications of pregnancy, childbirth, and the puerperium
$108 (1,527)
Insufficient data
Diseases of the skin and subcutaneous tissue
$137 (1,840)
‐0.022 (0.080)
Diseases of the musculoskeletal system and connective tissue $643 (4,275)
‐0.155** (0.054)
Congenital abnormalities $66 (2,432)
0.065 (0.202)
Certain conditions originating in the perinatal period $13 (544)
Insufficient data
Symptoms, signs, and ill‐defined conditions $893 (6,775)
‐0.072 (0.086)

46
Injury and poisoning
$393 (4,632)
‐0.090* (0.048)
External causes of injury and supplemental classification $891 (6,557)
‐0.052 (0.042)
N 479,196 479,196
Notes: Each cell in the second column shows the coefficient (and standard error) from a single regression; means of the dependent variable are reported in the first column. Each row shows results for spending on a different diagnostic category. Control variables include gender, age group, enrollment in a family plan, date of hire, and a full set of municipality and year fixed effects. The sample includes all continuously enrolled active employees over the three‐year period from fiscal year 2010 to fiscal year 2012; the unit of observation is a person‐year. Coefficients are estimated using GLM. Standard errors are clustered on municipality. * denotes significance at the 10% level ** denotes significance at the 5% level