Embed Size (px)
Citation preview
Convergence of Regulatory Schemes in the Investment Management Industry
Laurent Cretegny *
KPMG Economics, Australia KPMG Institute for Global Risk, Australia
July 2016 (revised)
Abstract
Three separate Asian based regulatory frameworks for investment funds have been created over the past two years. In essence, each of these Asian fund passport schemes aims to emulate the success of the UCITS framework in creating an EU single market as well as acceptance outside of the EU. Whilst each of the Asian passport frameworks has the ability to generate material economic benefits to stakeholders residing within the group of participating jurisdictions, the benefit generated by each framework would be greater if/as additional regions were to join over the coming years.
This paper aims to apply this idea to the largest world regions in terms of assets under management (AUM). It analyses the relative economic impacts on these regions associated with hypothetical convergence of regulatory schemes across the world, as compared to a situation with no convergence. In particular it looks at the convergence of regulatory schemes within APEC, and also between Asia and Europe, as well as at the recognition of regulatory schemes across the world. Results are developed through the application of KPMG Global – a dynamic global CGE model – and show an increase in total real GDP for the largest AUM markets between 0.09 per cent (US$76 billion) and 0.12 per cent (US$100 billion).
These gains are the result of international portfolio diversification as households are able to choose from a broader range of foreign products once investment markets are integrated. Exploited economies of scale in the investment management industry plays also a critical role as they provide efficiency gains from improved resource allocation.
* The author gratefully acknowledges internal support from the Global Audit Steering Committee, in particular
William J. O'Mara, Global Head of Audit, Roger O’Donnell, Global Head of Audit D&A, and Andries Terblanché, Global Dynamic Risk Assessment Lead.
This paper has been prepared for presentation at the 19th Annual Conference on Global Economic Analysis in June 2016, Washington DC, USA. The views expressed in this paper are the author's alone and do not necessarily reflect the views or policies of KPMG Australia.
Page | 2
1 Introduction Three separate Asian based regulatory frameworks for investment funds have been created over the last two years – the ASEAN Collective Investment Scheme (CIS), the Hong Kong and China Mutual Recognition of Funds (MRF), and the Asian Region Funds Passport (ARFP). Each initiative contains a set of common rules defined in a single regulatory framework, and agreed to by each of the participating jurisdictions. By satisfying these rules, a domestic investment fund domiciled in one jurisdiction receives an authorisation, known as a passport, enabling it efficient entry into any of the other participating jurisdictions with very limited supervisory oversight of the passport fund by the host jurisdiction.
The objective of each of these initiatives is to create a single market across the participating countries for the distribution and sale of funds, thus growing capital markets, reducing regulatory duplication, driving economies of scale in the asset management industries, fostering competition and providing investors with greater choice.
These new Asian-based regulatory frameworks have been modelled on the European fund regulations, known as Undertakings for Collective Investment in Transferrable Securities (UCITS), currently in its fourth iteration (Directive 2014/91/EU), which have created a single market within the 28 European Union (EU) Member States to facilitate harmonised fund regulation and cross-border distribution.
To an extent these Asian based fund passport initiatives are a direct response to the continuing long term success of European UCITS funds sold into the Asian region, to both retail and institutional investors alike. Investment funds domiciled in one of the EU Member States and qualifying as a UCITS can operate freely throughout the EU, sold in each Member State on the basis of a single authorisation from the domicile Member State. They are highly regulated and must satisfy strict rules on investor protection, transparency, liquidity, risk spreading and have restrictions on asset classes.
UCITS funds from Luxembourg, and to a lesser extent Ireland, have dominated global cross-border fund distribution, at the retail level, across four key regions – Europe, Asia, Latin America and the Middle East – for more than 20 years. UCITS are now considered by investors, distributors and regulatory authorities around the world as the gold standard for cross-border or international fund retail distribution.
In essence, each of these Asian fund passport schemes aims to emulate the success of the UCITS framework in creating an EU single cross-border distribution market as well as acceptance outside of the EU. For example, much of the success of cross-border UCITS stems from the comprehensive regulation aimed at protecting investors, asset diversification and operating the fund, the operator and third party service providers to the fund, all of which gives investors and distributors a high level of confidence to invest. Therefore, a significant proportion of the regulatory framework of each of the three Asian initiatives is borrowed heavily from the UCITS rules.
Nevertheless, whilst UCITS provides a template for potential future success, the key driver of potential single market fund initiatives are the expected material economic benefits to multiple
Page | 3
stakeholders that are likely to accrue over the long term. The extent of the economic benefits derived from each passport regime will ultimately depend on a range of different interconnected factors and are likely to include:
• the number of sovereign jurisdictions that decide to actively participate in each respective single market arrangement;
• the number of domestic funds within each participating country that actually utilise the respective passport regulations to distribute cross-border into one or more of the other participating countries; and
• the extent to which investors residing in the participating jurisdictions decide to invest in foreign passport funds, that is, the level of sales success of these passport funds versus purely domestic funds or funds from outside the participation jurisdictions, such as UCITS funds.
This paper aims to apply this idea to the largest world regions in terms of assets under management. It analyses the relative economic impacts on these regions associated with hypothetical convergence of regulatory schemes across the world, as compared to a situation with no convergence. In particular it looks at the convergence of regulatory schemes within APEC, and also between Asia and Europe, as well as at the recognition of regulatory schemes across the world.
Results are developed through the application of KPMG Global, which is a dynamic global CGE model based on the 2011 world economy in the GTAP 9a database. For the purpose of the study, countries are aggregated into ten regions that define the main players in terms of assets under management. The modelling separates out the financial and insurance industry that includes the standard investment management activities, with all other industries highly aggregated into a primary sector, a manufacturing sector and a services sector.
The convergence of regulatory schemes for collective investment products offered in different countries essentially involves the definition of a new industry that competes with the standard investment management industry offering funds with no transferability across borders. This industry is introduced as a very small one, an embryonic industry, in each region. Minimal values are assigned to sales and costs in the new industry so as to not damage the integrity of the model in any way. A series of shocks is applied to different variables associated with this industry to mimic the different convergence scenarios.
In addition of the introduction of a new industry into the database, KPMG Global has been extended in two ways to support the analysis of potential regulatory scheme convergence. The first addition to the model is related to economies of scale as they are highly susceptible to exist in the economic activity of managing assets via pooled products. The second extension concerns the modelling of increased substitution between passport fund management products of regions that adopt a common regulatory framework. This single market should increase the ability and willingness of households in participating countries to substitute among these types of products due to the adoption of the single regulatory scheme.
The remainder of this paper is organized as follows. Section 2 offers background information on the investment management industry worldwide. KPMG Global, the global CGE model, is outlined in the following section along with the two theoretical extensions. Section 4 focuses on the empirical implementation of the CGE model. The design of scenarios is presented in Section 5 and is followed
Page | 4
by a discussion on the results of regulatory scheme convergence. The final section summarizes and concludes.
2 Global Funds under Management The assets management industry contributes to the economy by channelling savings of households, corporations and governments to the right users. Acting as intermediaries, asset managers fuel the real economy, helping corporations, banks and government agencies to meet their short-term funding needs and long term capital requirements. Assets under management (AUM) is a financial term denoting the total market value of a class of assets being managed by a third party on behalf of their clients, investors, partners, depositors, etc. The definition of this term is specific to the industry of the corresponding class of assets. For example, AUM in the real estate investment industry is related to asset value of properties whereas in the financial services industry, AUM refers to the market value of all the funds being managed by a financial institution (a mutual fund, hedge fund, private equity firm, venture capital firm, or brokerage house) on behalf of its clients, investors, partners, depositors, etc. In the latter case, AUM are also called funds under management (FUM), as assets are related to the investment funds management industry.
For the purposes of the modelling undertaken in the study, the convergence of regulatory schemes for collective investment products offered in different countries essentially involves redefining part of the finance industry into a new industry that competes with the standard investment funds management industry offering funds with no or limited transferability across borders. Funds in the new industry are called passport funds as they refer to collective investment funds in a regime that allows them to freely circulate within a passport-defined jurisdiction. All other funds outside such a regime are termed local funds in reference to their limited transferability across borders. As such, any Luxembourg, Cayman, or AIFMD funds sold in any Asian jurisdictions would be in the local funds basket, as they do not comply with any Asian funds passport rules. In terms of passport funds, the study recognises the four following types of collective investment funds:
• EU-based UCITS vehicles (December 1985) • ASEAN-based CIS vehicles (August 2014) • China-Hong Kong-based MRF vehicles (May 2015) • APEC-based ARFP vehicles (to be launched during 2017)
2.1 Current state of global FUM in the world The analysis of the economic impacts of the convergence of the passport regimes requires the development of a global AUM database. The objective of the global AUM database is to determine the size of the fund management industry in each region. In economic terms, the size of the industry in each region is represented by its output of produced services and thus can be estimated through an average management fee rate applied to AUM that are professionally managed in exchange for management fees. Generally speaking, following are the investment vehicles included in the AUM definition:
• Open-End Mutual Funds (equity/hybrid/bond and money market funds) • Exchange-Traded Funds
Page | 5
• Other Substantively Regulated Funds (institutional, guaranteed/protected and real estate funds) • Closed-end mutual funds • Alternatives Funds (incl. hedge funds, private equity, and commodity funds) • Separate Account (providers of separate account services privately manage the money of
institutional investors or high net worth individuals)
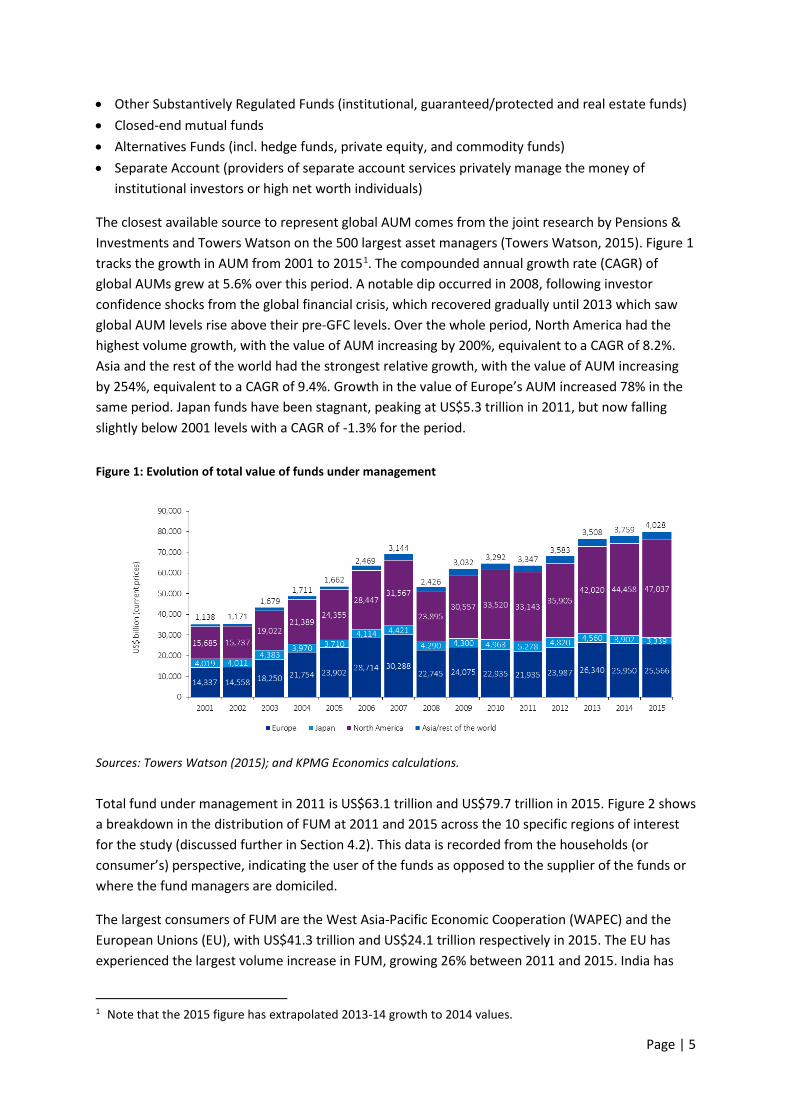
The closest available source to represent global AUM comes from the joint research by Pensions & Investments and Towers Watson on the 500 largest asset managers (Towers Watson, 2015). Figure 1 tracks the growth in AUM from 2001 to 20151. The compounded annual growth rate (CAGR) of global AUMs grew at 5.6% over this period. A notable dip occurred in 2008, following investor confidence shocks from the global financial crisis, which recovered gradually until 2013 which saw global AUM levels rise above their pre-GFC levels. Over the whole period, North America had the highest volume growth, with the value of AUM increasing by 200%, equivalent to a CAGR of 8.2%. Asia and the rest of the world had the strongest relative growth, with the value of AUM increasing by 254%, equivalent to a CAGR of 9.4%. Growth in the value of Europe’s AUM increased 78% in the same period. Japan funds have been stagnant, peaking at US$5.3 trillion in 2011, but now falling slightly below 2001 levels with a CAGR of -1.3% for the period.
Figure 1: Evolution of total value of funds under management
Sources: Towers Watson (2015); and KPMG Economics calculations.
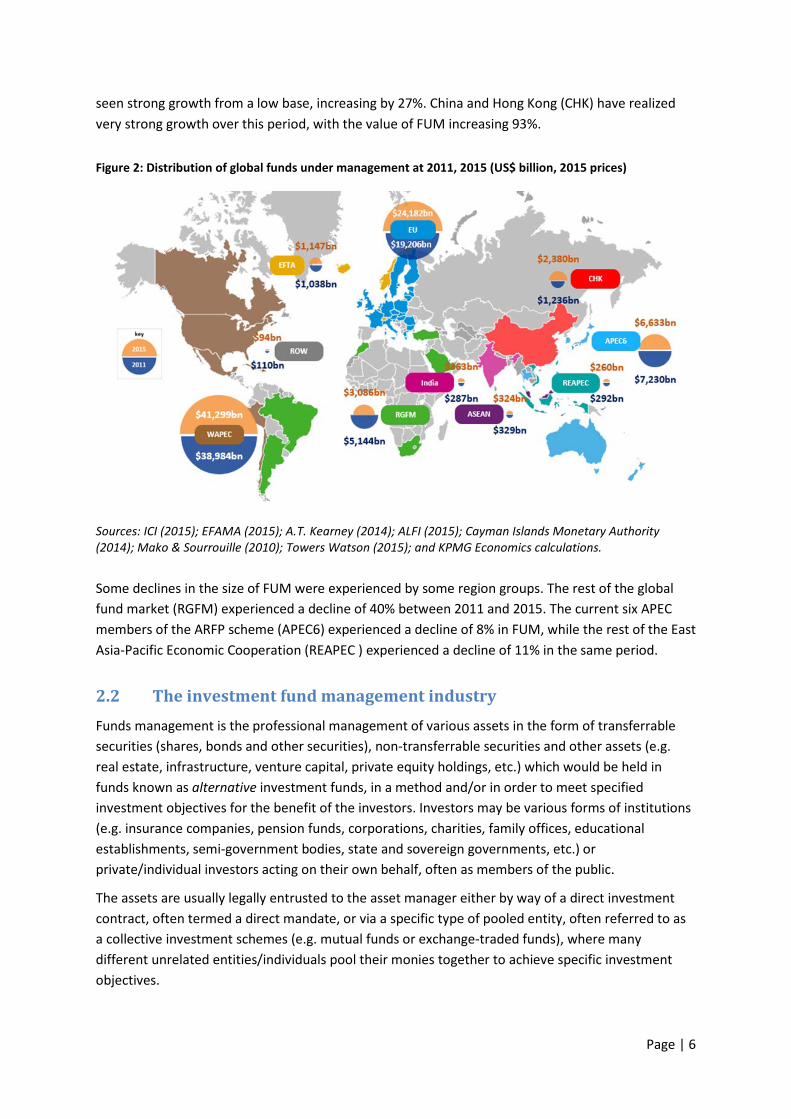
Total fund under management in 2011 is US$63.1 trillion and US$79.7 trillion in 2015. Figure 2 shows a breakdown in the distribution of FUM at 2011 and 2015 across the 10 specific regions of interest for the study (discussed further in Section 4.2). This data is recorded from the households (or consumer’s) perspective, indicating the user of the funds as opposed to the supplier of the funds or where the fund managers are domiciled.
The largest consumers of FUM are the West Asia-Pacific Economic Cooperation (WAPEC) and the European Unions (EU), with US$41.3 trillion and US$24.1 trillion respectively in 2015. The EU has experienced the largest volume increase in FUM, growing 26% between 2011 and 2015. India has
1 Note that the 2015 figure has extrapolated 2013-14 growth to 2014 values.
Page | 6
seen strong growth from a low base, increasing by 27%. China and Hong Kong (CHK) have realized very strong growth over this period, with the value of FUM increasing 93%.
Figure 2: Distribution of global funds under management at 2011, 2015 (US$ billion, 2015 prices)
Sources: ICI (2015); EFAMA (2015); A.T. Kearney (2014); ALFI (2015); Cayman Islands Monetary Authority (2014); Mako & Sourrouille (2010); Towers Watson (2015); and KPMG Economics calculations.
Some declines in the size of FUM were experienced by some region groups. The rest of the global fund market (RGFM) experienced a decline of 40% between 2011 and 2015. The current six APEC members of the ARFP scheme (APEC6) experienced a decline of 8% in FUM, while the rest of the East Asia-Pacific Economic Cooperation (REAPEC ) experienced a decline of 11% in the same period.
2.2 The investment fund management industry Funds management is the professional management of various assets in the form of transferrable securities (shares, bonds and other securities), non-transferrable securities and other assets (e.g. real estate, infrastructure, venture capital, private equity holdings, etc.) which would be held in funds known as alternative investment funds, in a method and/or in order to meet specified investment objectives for the benefit of the investors. Investors may be various forms of institutions (e.g. insurance companies, pension funds, corporations, charities, family offices, educational establishments, semi-government bodies, state and sovereign governments, etc.) or private/individual investors acting on their own behalf, often as members of the public.
The assets are usually legally entrusted to the asset manager either by way of a direct investment contract, often termed a direct mandate, or via a specific type of pooled entity, often referred to as a collective investment schemes (e.g. mutual funds or exchange-traded funds), where many different unrelated entities/individuals pool their monies together to achieve specific investment objectives.
Page | 7
The provision of investment management services includes multiple elements of financial statement analysis, asset selection, stock selection, plan implementation and ongoing monitoring of investments. Coming under the remit of financial services many of the world's largest companies are at least in part funds managers and employ millions of staff.
The term fund manager (or investment advisor in the United States) refers to both a firm that provides funds management services and an individual who directs fund management decisions. The fund manager is usually compensated, for the professional asset management services rendered, by way of a fee. The fee charged depends on several factors, including the type of management undertaken, the type of assets, the type of investor and the type of fund structure or direct mandate. The most common form of management fee is calculated as a flat percentage of the value of the assets managed, usually at the end of a specific time period (e.g. monthly, quarterly, etc.). Other fees can be based on a specific performance benchmark.
According to Mercer’s 2012 Global Asset Manager Fee Survey (Allen, 2013) and taking all asset classes into consideration (in US$), Canada remains the most inexpensive country/region in which to invest, with average median fees of around 0.3%.
The UK and Europe are also relatively low priced, with average median fees of around 0.4% and 0.5% respectively. Emerging markets remain the most expensive country/region at 0.89% on average, with Asia averaging 0.75%, a fall of 0.08% since 2010.
3 The Global Economic Model The model is formulated as a system of linearized equalities derived from a highly nonlinear system of equations representing behavioural and definitional relationships and is solved using the GEMPACK economic modelling software (Harrison & Pearson, 1996).
3.1 Core description The dynamic global CGE model used in this study, termed KPMG Global, has been developed through several stages. It was originally a comparative-static model (Cretegny, 2014) which has been then adapted into a dynamic version (Cretegny, 2015). It has been further extended to allow relevant policy simulations to be conducted in this study. It is Walrasian in spirit and along the lines of models used for applied international trade policy (Shoven & Whalley, 1984). The core theoretical specification of the static model at the regional level draws upon the long Johansen/MONASH tradition in CGE modelling (Dixon, Koopman, & Rimmer, 2013). The macroeconomic closure at the global level is based on the well-known GTAP model (Hertel & Tsigas, 1997). The particularities of the static global CGE model are twofold. The first particularity lies in the representation of the regional demand for a given commodity from a specific region that is differentiated for each of these users. The second particularity is the specification of investment at the industry level rather than at the aggregate level. This allows the determination of industry-specific rates of return and the reallocation of investment across industries to be affected by relative rates of return.
Introducing dynamics in computable general equilibrium models allows the calculation of the transition path from the initial equilibrium to the new equilibrium. In the context of our work the assumption of investors’ perfect foresight of returns to capital is not appropriate. During the Asian
Page | 8
financial crisis at the end of last century, investors massively withdrew their investment in the region following downward adjustment in the expectations. This acknowledgment of errors in their expectations suggests that they have not foreseen perfectly the returns to capital and shows the importance of modelling errors in investors’ expectations. Therefore our model assumes myopic agents and introduce adaptive expectations about rates of return on installed capital in each region equalizing across regions in the long run (Ianchovichina & McDougall, 2012).
Intra-period representation
The intra-period formulation of the model consists of a set of equations describing agents’ behaviour, markets clearance and income balance within a region.
Each region consists of industries, investors, households, foreigners and a national government. The particularity of this model lies in the representation of the regional demand for a given commodity from a specific region that is differentiated for each of these users.
For any activity of the global economy, marginal cost is assumed to equal marginal revenue which makes pure profits impossible to earn. In addition, agents are assumed to produce under constant returns to scale and face markets that are perfectly competitive with free entry and exit.
In each region, aggregate investment is endogenous to the model as well as the allocation of investment across industries. Investment in each industry is determined by expected rates of return required by investors to advance additional investment and the rate of return in that industry results from the interaction of demand for capital with given capital supply. Although capital is specific to each industry, capital formation is mobile across sectors with high-profitable industries increasing their shares of investment at the expense of low-profitable sectors. However, if an industry has already attracted considerable investment funds giving it a high rate of capital growth, then it must have a higher expected rate of return to attract the marginal investor.
Market-clearing conditions imply that, at equilibrium prices and activity levels, supply equals demand for every individual commodity represented in the model. This has to hold for both margin and non-margin domestically produced commodities, as well as for imported commodities. In the case of the former, the demand includes the model's five users (industries, investors, households, the government, and the foreigners), whereas it excludes the foreigners for the latter as exports always involve some domestic value added.
Market demand for primary factors of production also has to equal the supply of endowments. In the model, capital stock is assumed to be specific to each sector and to each region, which means that, in equilibrium, capital sustains differential returns across sectors in each region. In contrast, labour is assumed to be mobile between sectors but not across regions, which results in a single regional wage rate across industries in equilibrium.
Welfare in each region depends on private consumption, government spending and savings, which are determined as part of a single Cobb-Douglas utility maximization problem. Regional income is thus allocated in fixed shares to current consumption, government services and investment. This implies a fixed savings rate and resulting regional savings are assumed to finance domestic and/or foreign investment. Taxes accrue to the region as a whole so government revenue is currently not

Page | 9
linked to government spending. The third equilibrium condition ensures that, in each region, the value of households’ income equals the value of factor endowments.
Dynamic specification
In terms of the dynamics, the model comprises two key features, which are around stock-flow accumulation relations and investment theory.
As capital is assumed to be internationally mobile, the first key feature includes the distinction between physical capital stocks and financial assets. In the dynamic model, this results in international financial capital flows adding to capital stock available for productive use. In addition, international income receipts and payments are now part of the calculation of the current account balance.
The model assumes that time is not a discrete index but a continuous variable, allowing it to include time intervals of different lengths. As capital stock depreciates at a constant geometric rate, it means that the net increase in the stock of physical capital at any point in time equals gross investment less depreciation. As such our model does not incorporate explicit representation of gestation lags, as typically is the case in discrete-time models.
The second key feature of the dynamic model is a lagged adjustment, adaptive expectations theory of investment. This treatment of investment has two important consequences. First, it will soften investment volatility as a response to price changes due to the lack of any gestation lags or adjustment costs mechanism in the model. Second, it will allow reconciling the theory of investment with observed reality.
In many cases, the level of investment in the benchmark data (resulting from the national statistics) is inconsistent with the level calculated with the equations of the model using the rate of return. In particular, observed levels of investment in some regions may be very low, while observed rates of return may be very high in these regions. This suggests that investment does not move across regions according to the theory on capital mobility. As we acknowledge that empirical reality is more important than theory, the model incorporates errors in investors’ expectations about actual rates of return, so that observed investment levels are now consistent with theoretical predictions. Furthermore, these disparities are not eliminated instantaneously, but progressively through time, such that expected rates of return converge in the long-run toward actual rates of return.
Macroeconomic closure
Macroeconomic closure provides the linkages between regions in terms of both physical flows (e.g. goods and services) and financial flows (e.g. investment).
Comparative-static single- and multi-region models face the issue of explaining aggregate investment (Robinson, 2006). Dynamic models are no exception to the rule and the approach adopted in this model is to assume a neoclassical closure along the lines of the GTAP model (Hertel & Tsigas, 1997). In this closure, global investment is driven by savings, which means that, at the global level, investment adjusts to accommodate savings.
Page | 10
Under the disequilibrium approach for modelling international capital mobility, the allocation of investment across regions does not result in the equalisation of rates of return across regions instantaneously, but instead only in the very long run.
Another set of international equilibrium conditions in the model is related to international shipping services. As described previously, each region contributes to a global transportation sector in fixed shares. The zero-profit condition ensures that the value of inputs per unit activity is equal to the value of output in the production of each of the international margins. Aggregate demand for each international transport service is the sum of all bilateral demands for moving commodities between regions and is required to meet aggregate supply for the market-clearing condition to be satisfied.
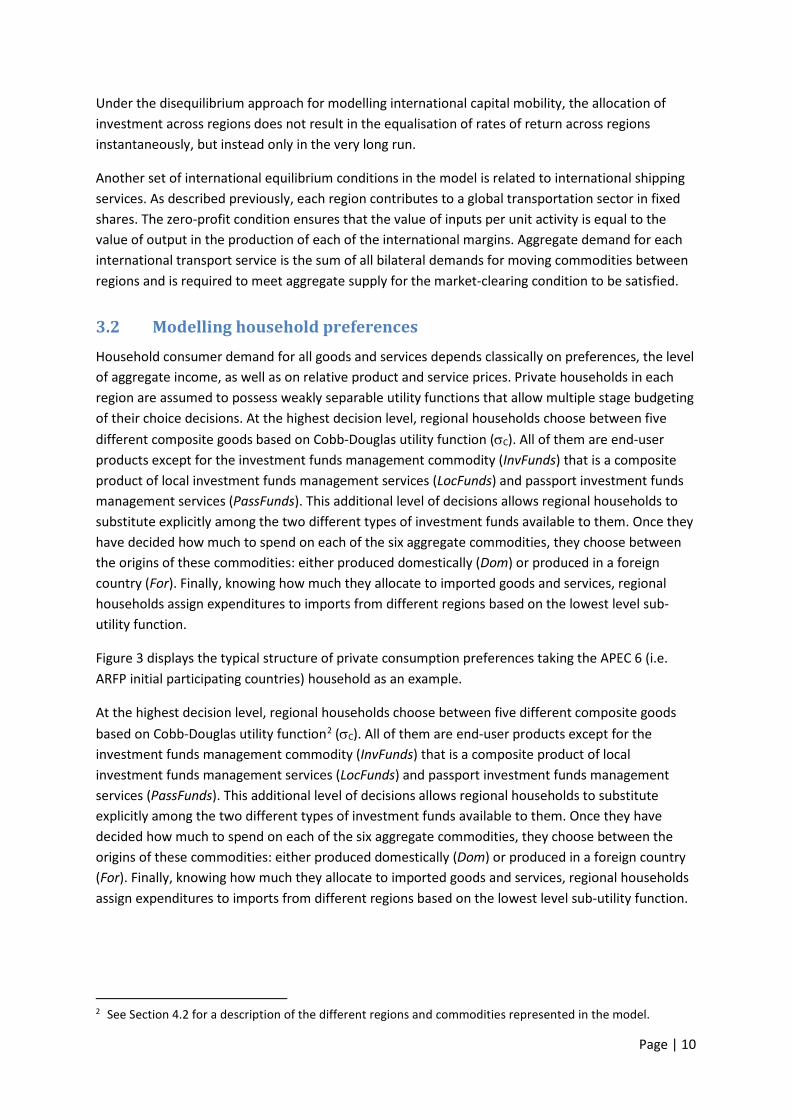
3.2 Modelling household preferences Household consumer demand for all goods and services depends classically on preferences, the level of aggregate income, as well as on relative product and service prices. Private households in each region are assumed to possess weakly separable utility functions that allow multiple stage budgeting of their choice decisions. At the highest decision level, regional households choose between five different composite goods based on Cobb-Douglas utility function (σC). All of them are end-user products except for the investment funds management commodity (InvFunds) that is a composite product of local investment funds management services (LocFunds) and passport investment funds management services (PassFunds). This additional level of decisions allows regional households to substitute explicitly among the two different types of investment funds available to them. Once they have decided how much to spend on each of the six aggregate commodities, they choose between the origins of these commodities: either produced domestically (Dom) or produced in a foreign country (For). Finally, knowing how much they allocate to imported goods and services, regional households assign expenditures to imports from different regions based on the lowest level sub-utility function.
Figure 3 displays the typical structure of private consumption preferences taking the APEC 6 (i.e. ARFP initial participating countries) household as an example.
At the highest decision level, regional households choose between five different composite goods based on Cobb-Douglas utility function2 (σC). All of them are end-user products except for the investment funds management commodity (InvFunds) that is a composite product of local investment funds management services (LocFunds) and passport investment funds management services (PassFunds). This additional level of decisions allows regional households to substitute explicitly among the two different types of investment funds available to them. Once they have decided how much to spend on each of the six aggregate commodities, they choose between the origins of these commodities: either produced domestically (Dom) or produced in a foreign country (For). Finally, knowing how much they allocate to imported goods and services, regional households assign expenditures to imports from different regions based on the lowest level sub-utility function.
2 See Section 4.2 for a description of the different regions and commodities represented in the model.
Page | 11
Figure 3: Structure of private consumption preferences in APEC6
Except for the top level decision, all other decisions are based on a Constant Elasticity of Substitution (CES) sub-utility function (σN, σDM, and σMM, respectively). CES functional forms are homothetic which means that the elasticity of demand with respect to income is unitary. A one percent change in the income level of any individual consumer has a one percent impact on his demand for any commodity. In other words, the proportion in which he consumes commodities does not change since the marginal rate of substitution is constant.
The common objective behind each regional regulatory framework for investment funds is to create a single market across the participating countries for the distribution and sale of funds. As such, consumers in each of the participating countries regards passport funds management services originating from one participating jurisdiction as perfect substitutes to passport funds management services sourcing from another participating jurisdiction. This idea similarly applies when two or more regions decide to harmonise their regulatory schemes between each of them3. The integrated market for passport investment funds should increase the ability and willingness of consumers in the participating regions to substitute among passport funds management services offered in the integrated market. As a result passport funds management services offered in the integrated market become closer substitutes and compete directly against one another.
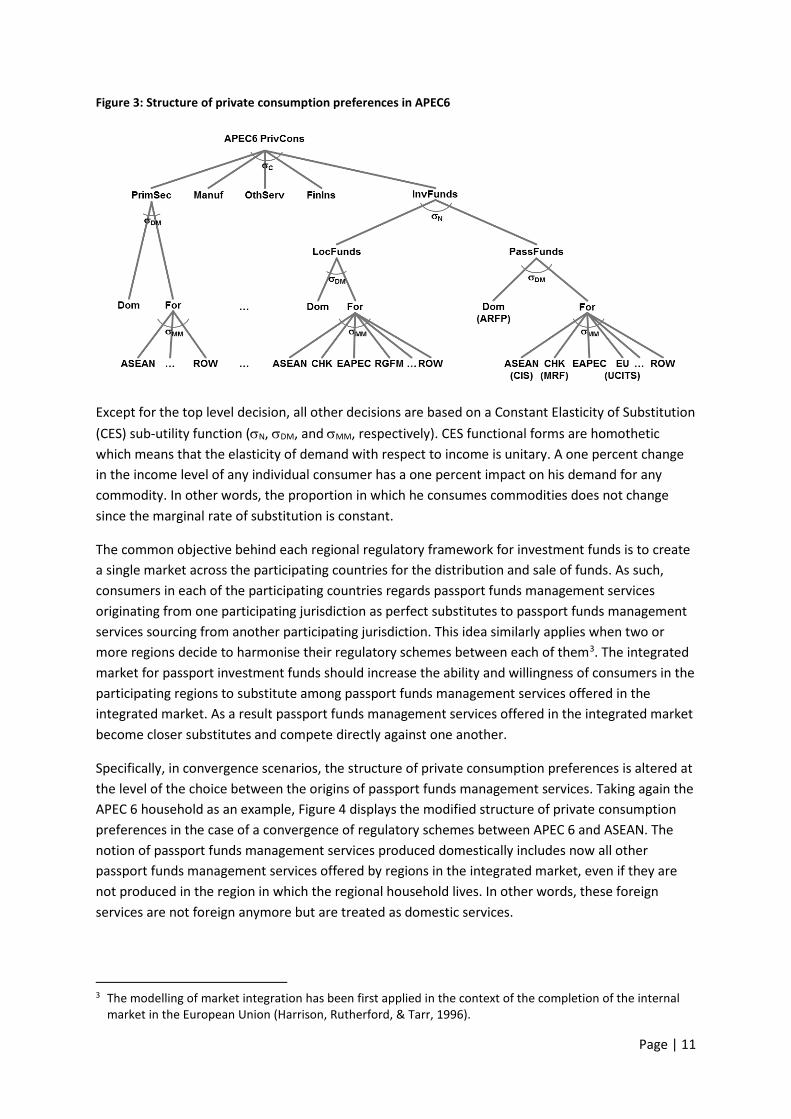
Specifically, in convergence scenarios, the structure of private consumption preferences is altered at the level of the choice between the origins of passport funds management services. Taking again the APEC 6 household as an example, Figure 4 displays the modified structure of private consumption preferences in the case of a convergence of regulatory schemes between APEC 6 and ASEAN. The notion of passport funds management services produced domestically includes now all other passport funds management services offered by regions in the integrated market, even if they are not produced in the region in which the regional household lives. In other words, these foreign services are not foreign anymore but are treated as domestic services.
3 The modelling of market integration has been first applied in the context of the completion of the internal
market in the European Union (Harrison, Rutherford, & Tarr, 1996).
Page | 12
Figure 4: Structure of preferences in APEC6 after the convergence of regulatory schemes of ARFP & UCITS
The modelling of the convergence scenarios implies the recalibration of the status quo equilibrium point to the same preference structure of the scenario so as not to introduce any issues in evaluating welfare measures such as Hicksian equivalent or compensating variation. Changes in preferences occur only in the specification of different elasticities of substitution and thus do not alter the optimality of the status quo equilibrium. In other words, as the curvature of the different utility functions doesn’t change, the point of tangency in the initial equilibrium remains unchanged.
In the convergence scenarios, a series of shocks is applied to domestic and foreign demands to simulate the effects on regional economies associated with the change in the industry of passport funds management services in each region. As such, the different elasticity structure described above impacts the results in these counterfactuals.
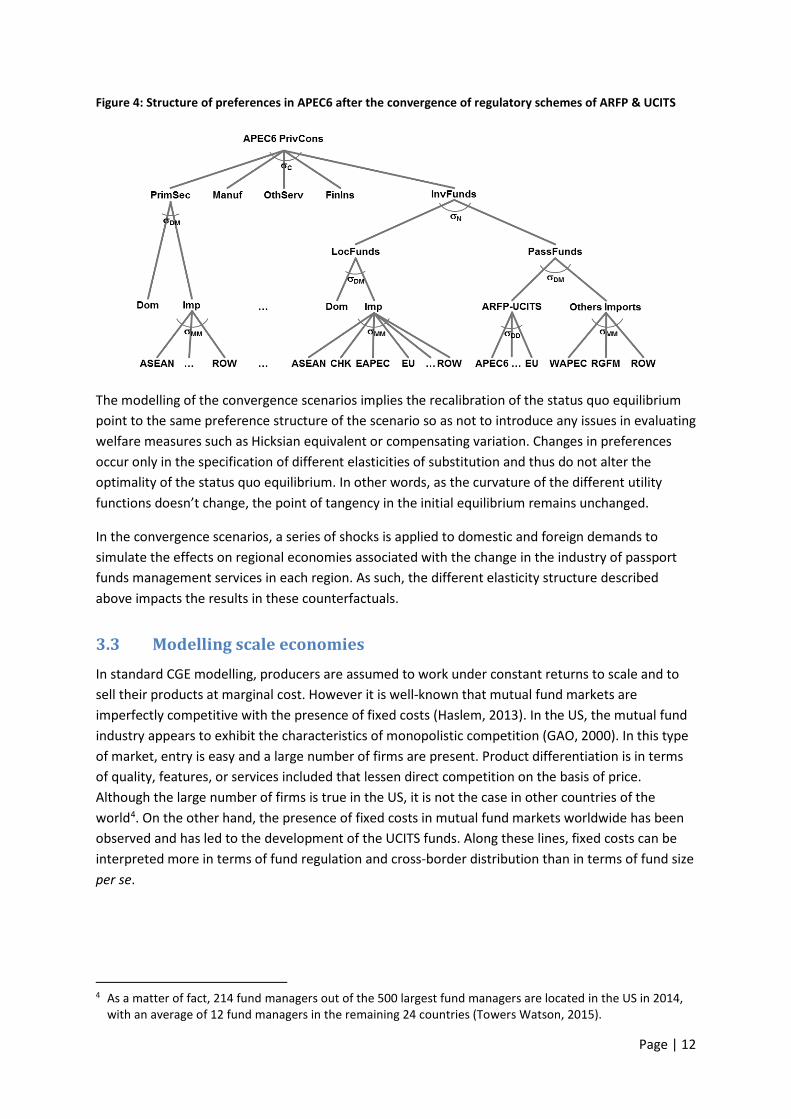
3.3 Modelling scale economies In standard CGE modelling, producers are assumed to work under constant returns to scale and to sell their products at marginal cost. However it is well-known that mutual fund markets are imperfectly competitive with the presence of fixed costs (Haslem, 2013). In the US, the mutual fund industry appears to exhibit the characteristics of monopolistic competition (GAO, 2000). In this type of market, entry is easy and a large number of firms are present. Product differentiation is in terms of quality, features, or services included that lessen direct competition on the basis of price. Although the large number of firms is true in the US, it is not the case in other countries of the world4. On the other hand, the presence of fixed costs in mutual fund markets worldwide has been observed and has led to the development of the UCITS funds. Along these lines, fixed costs can be interpreted more in terms of fund regulation and cross-border distribution than in terms of fund size per se.
4 As a matter of fact, 214 fund managers out of the 500 largest fund managers are located in the US in 2014,
with an average of 12 fund managers in the remaining 24 countries (Towers Watson, 2015).
Page | 13
In that context, this study assumes that the managed passport funds industry has the potential to exploit unrealized economies of scale5 when investment funds are approved by regulators from their countries of origin as qualifying for a common regulatory scheme. The cost function of this industry exhibits therefore increasing returns to scale due to the above-mentioned fixed costs. In this case the cost per unit of output is lower as fixed costs are spread out over more units of output since recognition of investment funds in participating countries are facilitated with the common regulatory scheme.
The presence of fixed costs, in conjunction with constant returns to scale in variable costs in the managed passport funds industry means that the elasticity of output with respect to all inputs is greater than one (Francois & Roland-Holst, 1997). So a registration of existing investment fund as passport funds induces a larger increase in passport funds services than a decrease in local funds services.
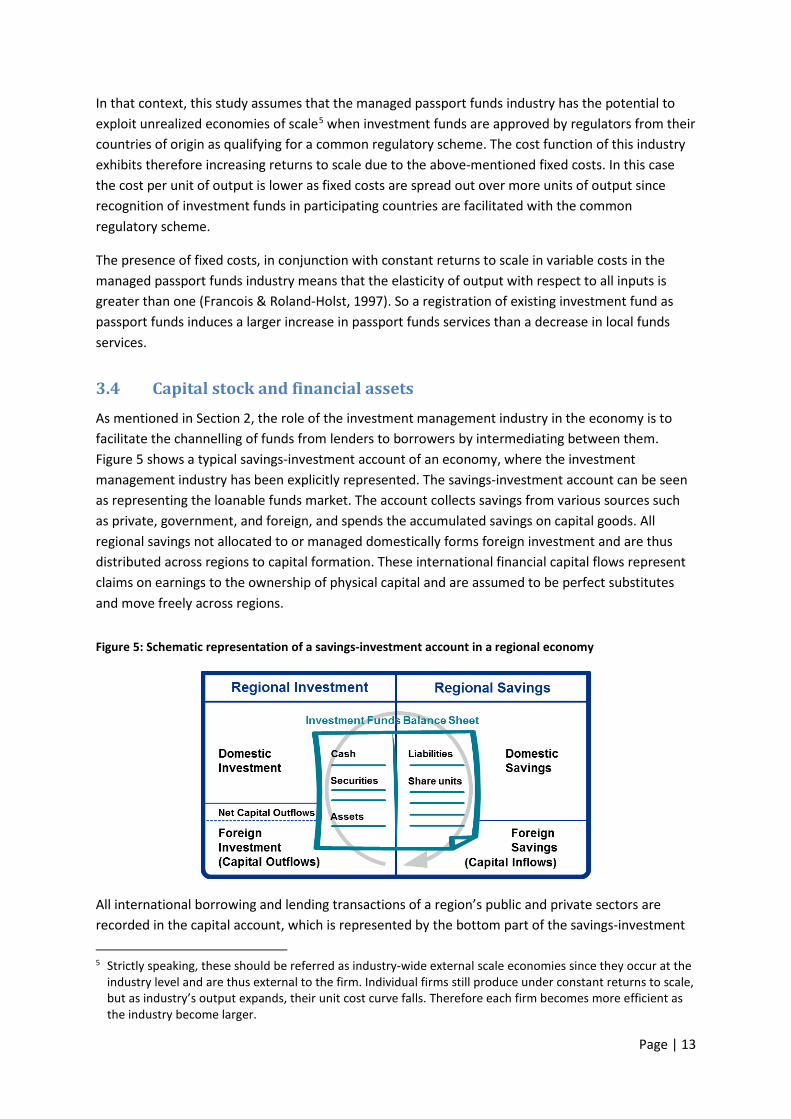
3.4 Capital stock and financial assets As mentioned in Section 2, the role of the investment management industry in the economy is to facilitate the channelling of funds from lenders to borrowers by intermediating between them. Figure 5 shows a typical savings-investment account of an economy, where the investment management industry has been explicitly represented. The savings-investment account can be seen as representing the loanable funds market. The account collects savings from various sources such as private, government, and foreign, and spends the accumulated savings on capital goods. All regional savings not allocated to or managed domestically forms foreign investment and are thus distributed across regions to capital formation. These international financial capital flows represent claims on earnings to the ownership of physical capital and are assumed to be perfect substitutes and move freely across regions.
Figure 5: Schematic representation of a savings-investment account in a regional economy
All international borrowing and lending transactions of a region’s public and private sectors are recorded in the capital account, which is represented by the bottom part of the savings-investment
5 Strictly speaking, these should be referred as industry-wide external scale economies since they occur at the
industry level and are thus external to the firm. Individual firms still produce under constant returns to scale, but as industry’s output expands, their unit cost curve falls. Therefore each firm becomes more efficient as the industry become larger.
Page | 14
account in Figure 5. Major components of the capital account are foreign direct investment (FDI) which refers to long-term capital investment6, and portfolio investment which refers to cross-border transactions and positions involving debt or equity securities. Most of the financial assets used in the investment fund management industry are thus part of the portfolio investment category.
In a global economy, regions are linked not only through trade in goods and services but also through financial capital flows, which implies that regional savings may diverge from regional investment reflected in the capital account balance. In Figure 5, the region invests outside more than the world invest in it, leading to a net capital outflows of funds. In other words, the region owns more net foreign assets as the change in domestic ownership of foreign assets is larger than the change in foreign ownership of domestic assets.
As part of the system of accounting for financial assets emerges the need to introduce to the model earnings on foreign investments and payments made to foreign investors. Income receipts are inflows while income payments are outflows. The difference between inflows and outflows represents the net income from abroad and forms the second component of the current account in addition to the balance of trade (difference between exports and imports). By the principles of double entry accounting7, the current account reflects also the net change in ownership of foreign assets. A surplus (deficit) in the current account indicates an increase (decrease) in the value of a country’s net foreign assets.
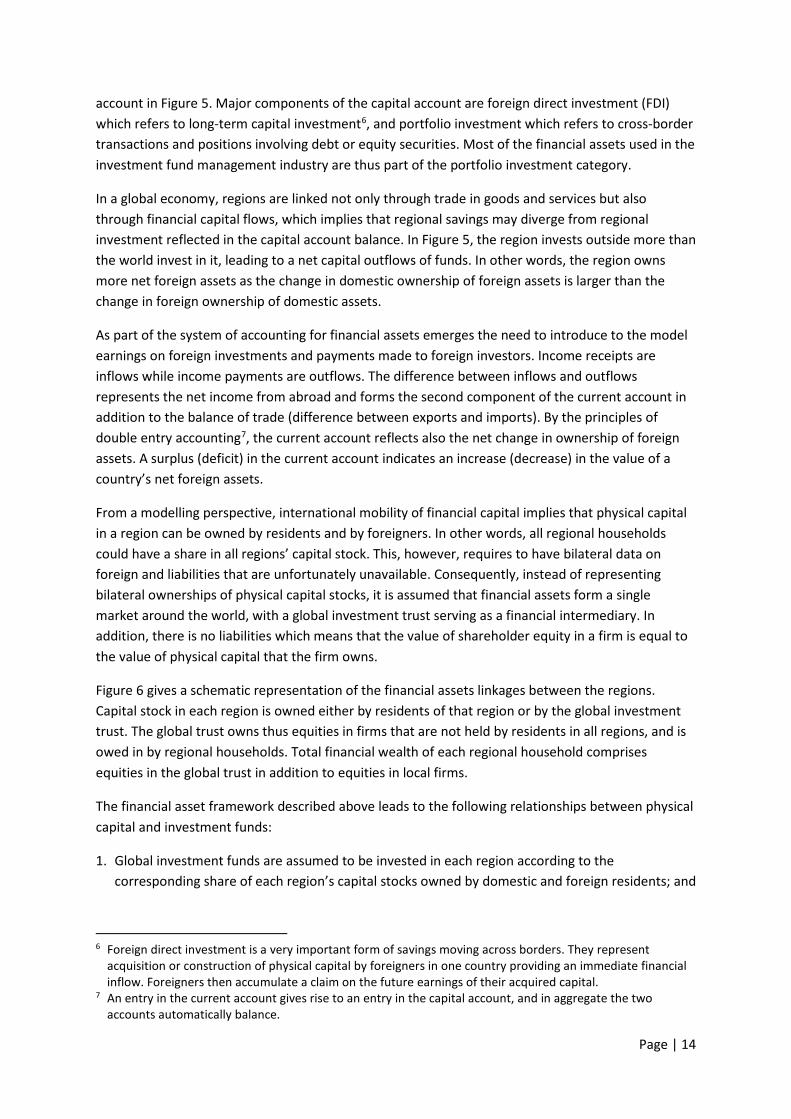
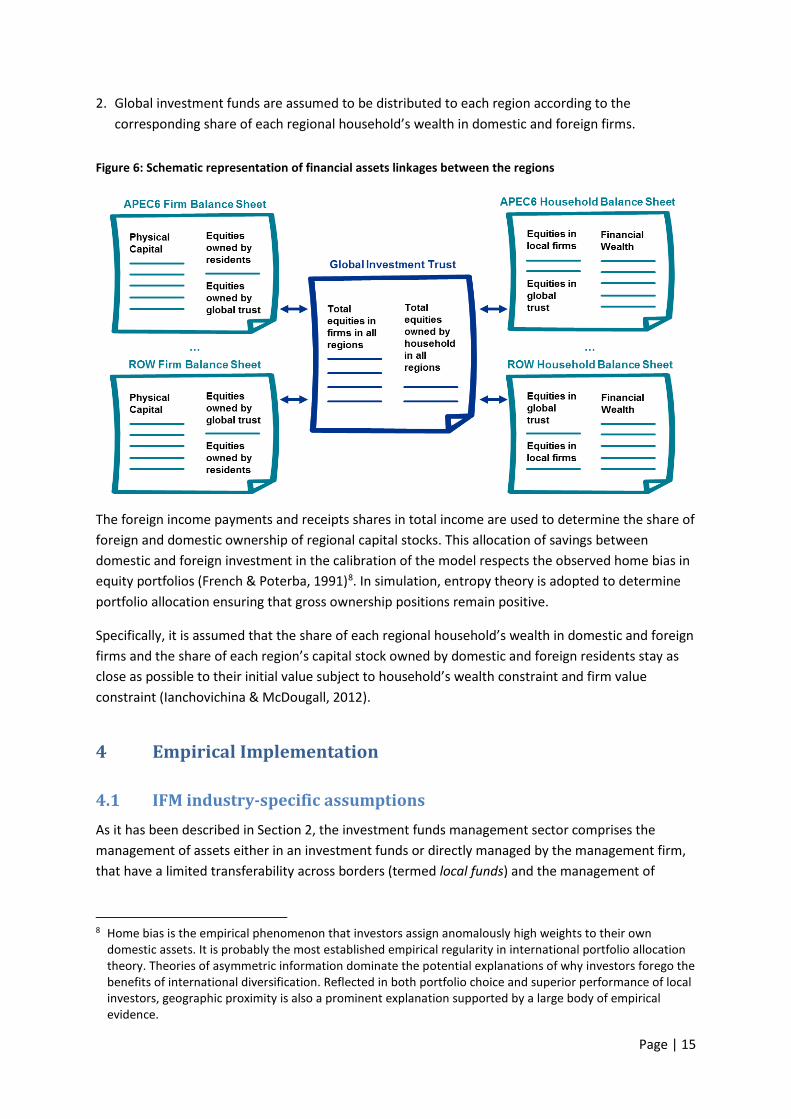
From a modelling perspective, international mobility of financial capital implies that physical capital in a region can be owned by residents and by foreigners. In other words, all regional households could have a share in all regions’ capital stock. This, however, requires to have bilateral data on foreign and liabilities that are unfortunately unavailable. Consequently, instead of representing bilateral ownerships of physical capital stocks, it is assumed that financial assets form a single market around the world, with a global investment trust serving as a financial intermediary. In addition, there is no liabilities which means that the value of shareholder equity in a firm is equal to the value of physical capital that the firm owns.
Figure 6 gives a schematic representation of the financial assets linkages between the regions. Capital stock in each region is owned either by residents of that region or by the global investment trust. The global trust owns thus equities in firms that are not held by residents in all regions, and is owed in by regional households. Total financial wealth of each regional household comprises equities in the global trust in addition to equities in local firms.
The financial asset framework described above leads to the following relationships between physical capital and investment funds:
1. Global investment funds are assumed to be invested in each region according to the corresponding share of each region’s capital stocks owned by domestic and foreign residents; and
6 Foreign direct investment is a very important form of savings moving across borders. They represent
acquisition or construction of physical capital by foreigners in one country providing an immediate financial inflow. Foreigners then accumulate a claim on the future earnings of their acquired capital.
7 An entry in the current account gives rise to an entry in the capital account, and in aggregate the two accounts automatically balance.
Page | 15
2. Global investment funds are assumed to be distributed to each region according to the corresponding share of each regional household’s wealth in domestic and foreign firms.
Figure 6: Schematic representation of financial assets linkages between the regions
The foreign income payments and receipts shares in total income are used to determine the share of foreign and domestic ownership of regional capital stocks. This allocation of savings between domestic and foreign investment in the calibration of the model respects the observed home bias in equity portfolios (French & Poterba, 1991)8. In simulation, entropy theory is adopted to determine portfolio allocation ensuring that gross ownership positions remain positive.
Specifically, it is assumed that the share of each regional household’s wealth in domestic and foreign firms and the share of each region’s capital stock owned by domestic and foreign residents stay as close as possible to their initial value subject to household’s wealth constraint and firm value constraint (Ianchovichina & McDougall, 2012).
4 Empirical Implementation
4.1 IFM industry-specific assumptions As it has been described in Section 2, the investment funds management sector comprises the management of assets either in an investment funds or directly managed by the management firm, that have a limited transferability across borders (termed local funds) and the management of
8 Home bias is the empirical phenomenon that investors assign anomalously high weights to their own
domestic assets. It is probably the most established empirical regularity in international portfolio allocation theory. Theories of asymmetric information dominate the potential explanations of why investors forego the benefits of international diversification. Reflected in both portfolio choice and superior performance of local investors, geographic proximity is also a prominent explanation supported by a large body of empirical evidence.
Page | 16
investment funds that are in a passport regime (termed passport funds). The following four passport regimes are considered in this study:
• EU-based UCITS vehicles (December 1985); • ASEAN-based CIS vehicles (August 2014); • CHK-based MRF vehicles (May 2015); and • APEC6-based ARFP vehicles (to be launched during 2017).
Apart from the European Union offering UCITS funds under a passport regime, the size of the regional industry that manages passport investment funds is assumed to be zero in 2011. As they are gradually launched into the market, their size has been estimated based on our review of the literature. The size of the regional industry managing local funds has also been based on our review of the literature. These estimates include a potential alignment of national savings share in investment funds Asian relative to the US and Europe as this industry has been operating far longer in those countries and thus is more mature.
The objective of the global FUM database is to determine the size of the investment fund management industry in each region for both local funds and passport funds (i.e. production side), as well as the distribution of these funds among regions (i.e. consumption side).
In economic terms, the size of the industry in each region is represented by its output of produced services and thus can be estimated through an average management fee rate applied to FUM that are professionally managed in exchange for management fees. This means that funds of funds are included – although there is some double counting due to cross-investment among asset managers – since they are involved also management fees.
The literature on investment funds reveals that most of the time funds are established as legal entities (corporations or trusts). As a regulatory requirement, the asset manager must be separated from the funds it manages for investor protection. Investment funds can be domiciled in the same jurisdiction (hereafter home-domiciled funds) as the fund manager or in another jurisdiction (hereafter foreign-domiciled funds). The domicile of an investment fund defines the jurisdiction in which the fund company is resident and to which jurisdiction it is subject. Most statistics about investment funds report funds under management in terms of investment fund domiciliation. As a consequence, fund managers are assumed to be located in the same jurisdiction as the domicile of investment funds they manage9. This assumption has the following consequences:
• Although share of foreign-domiciled investment funds in total FUM is relatively high in European countries, it seems that domiciliation abroad is still in Europe for most of them, which doesn’t affect the modelling since EU is treated as a single region.
• For tax haven countries like Cayman Islands, it is only a small faction that is managed in the country where they are domiciled (e.g. around 1% for the Cayman Islands), which means that the FUM database is adjusted accordingly (Cayman Islands Monetary Authority, 2014).
9 This assumption can be supported by the fact that every analyst or portfolio management position created
in the Hong Kong investment industry managing locally-domiciled funds generates 4.6 support jobs for servicing the fund structure (PWC, 2013). This estimate is also used in the derivation of the employment impact from a potential adoption of ARFP across Asia (APEC, 2014).
Page | 17
• For other countries, it is not as clear cut and data are very scarce. Nevertheless, according to the Association of the Luxembourg Fund Industry (ALFI, 2015), investment funds of EUR 760 billion are domiciled in Luxembourg and initiated by US asset managers at the end of 2015, which means that the FUM database is also adjusted to take into account this consideration.
Both local and passport investment funds in one jurisdiction may be sold cross-border into other jurisdictions. As such they represent an export of funds management services from the jurisdiction hosting the investment funds to the investor jurisdiction.
The basic idea for developing the FUM database is to start with the estimated global FUM and disaggregate it using primarily the following shares adjusted for fund domiciliation:
• Most of the regional disaggregation is based on the Worldwide Public Tables containing time series of total net assets under management (ICI, 2015).
• The distinction between local and passport funds uses the Quarterly Statistical Release for UCITS funds (EFAMA, 2015) and our own estimates for CIS funds.
• Bilateral trade of local funds is assumed to be proportional to bilateral trade flows in Finance & Insurance Services.
• Bilateral trade of UCITS funds distributed in Asia follows assumptions from the literature (A.T. Kearney, 2014).
At the end of the disaggregation procedure, estimates of FUM are available in each region by type of funds (i.e. local/passport). As mentioned above we assume that the size of the investment management industry can be related to the total funds under management calculated through an average management fee rate across all asset classes and mandate sizes. The average fee rates are based on Mercer’s Global Asset Manager Fee Survey that have been publically released. Applying these average management fee rates to FUM estimates allow determining the value of management services for both local and passport funds, which represents the output of these industries in each region. Output of passport funds management services is produced only in EFTA, EU and RGFM, which means that, to avoid numerical issues, a value equal to 0.5% of local funds management services has been assigned to other regions.
Exports and imports of local funds management services are determined using export and import shares in production of the Finance & Insurance Services industry. Since the sum of exports over the regions are not necessarily equal to the sum of imports over the regions, the average of the two need first to be computed. Regional exports and imports are then uniformly scaled so that their sum is equal to this average. The bilateral trade matrix for local funds management services is filled in according to the structure of the bilateral trade matrix for Finance & Insurance Services. Entropy optimization method is then applied to balance the matrix subject to the scaled exports and imports.
Exports and imports of passport funds management services are only related to UCITS funds. This implies that only flows from the EU to other regions are positive in the bilateral trade matrix. Estimates for Asian regions follow assumptions from the literature (A.T. Kearney, 2014). To avoid numerical issues, a value between 0.1% and 1% of passport funds management services is assigned to other regions.
Page | 18
In terms of demand for domestically-produced local and passport funds management services, it is assumed that only households purchase these two types of funds management services. In other words, there is no intermediate demand for these services by the other sectors of the economy, as well as no demand by investors and the government. In that case, domestic purchases by households are the difference between output and exports of funds management services.
Table 5 and Table 9 in Appendix A report AUM and household demand for investment management services, respectively. The first two columns show the demand for local funds management services while the demand for passport funds management services is shown in the last two columns. Each of these management services can be produced domestically (DOM) and imported from abroad (IMP). Table 7 shows average management fee rates across all asset classes and mandate sizes for both local and passport funds management services.
4.2 Calibration of the model The model is calibrated to the GTAP 9a data base (Narayanan, Aguiar, & McDougall, 2015) and uses the state of the world economy in 2011 as a starting point for our simulations.
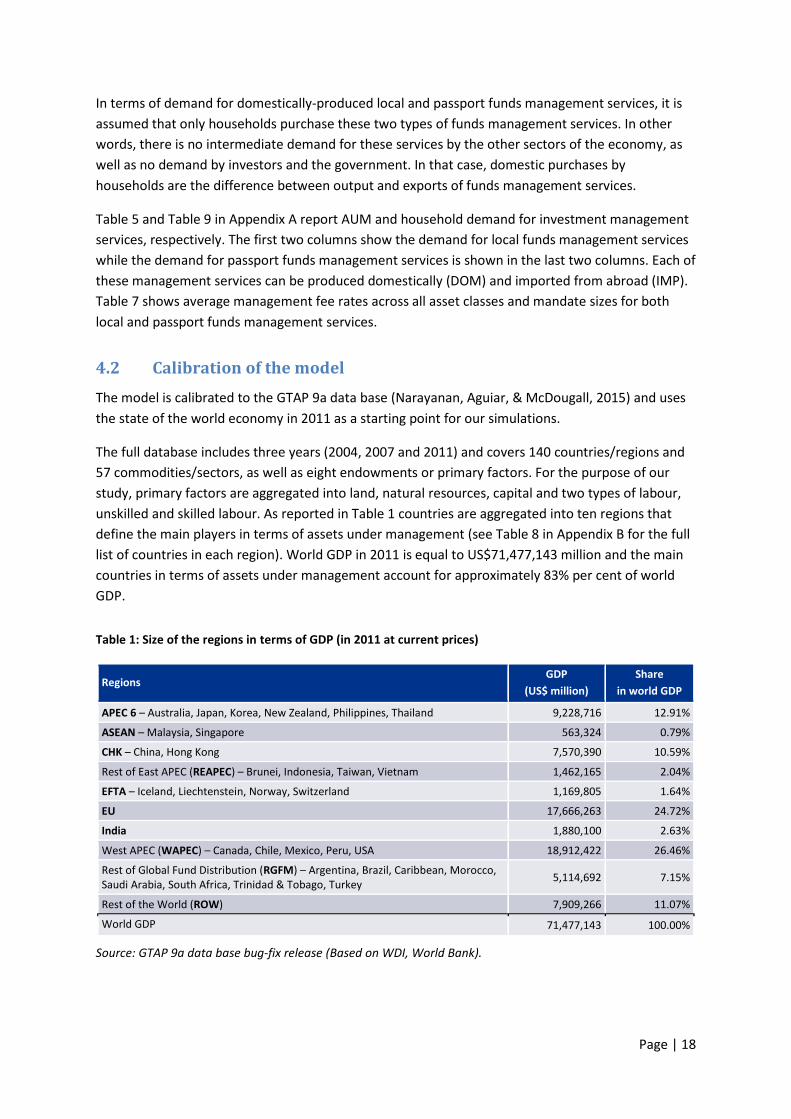
The full database includes three years (2004, 2007 and 2011) and covers 140 countries/regions and 57 commodities/sectors, as well as eight endowments or primary factors. For the purpose of our study, primary factors are aggregated into land, natural resources, capital and two types of labour, unskilled and skilled labour. As reported in Table 1 countries are aggregated into ten regions that define the main players in terms of assets under management (see Table 8 in Appendix B for the full list of countries in each region). World GDP in 2011 is equal to US$71,477,143 million and the main countries in terms of assets under management account for approximately 83% per cent of world GDP.
Table 1: Size of the regions in terms of GDP (in 2011 at current prices)
Regions GDP
(US$ million) Share
in world GDP
APEC 6 – Australia, Japan, Korea, New Zealand, Philippines, Thailand 9,228,716 12.91%
ASEAN – Malaysia, Singapore 563,324 0.79%
CHK – China, Hong Kong 7,570,390 10.59%
Rest of East APEC (REAPEC) – Brunei, Indonesia, Taiwan, Vietnam 1,462,165 2.04%
EFTA – Iceland, Liechtenstein, Norway, Switzerland 1,169,805 1.64%
EU 17,666,263 24.72%
India 1,880,100 2.63%
West APEC (WAPEC) – Canada, Chile, Mexico, Peru, USA 18,912,422 26.46%
Rest of Global Fund Distribution (RGFM) – Argentina, Brazil, Caribbean, Morocco, Saudi Arabia, South Africa, Trinidad & Tobago, Turkey 5,114,692 7.15%
Rest of the World (ROW) 7,909,266 11.07%
World GDP 71,477,143 100.00%
Source: GTAP 9a data base bug-fix release (Based on WDI, World Bank).
Page | 19
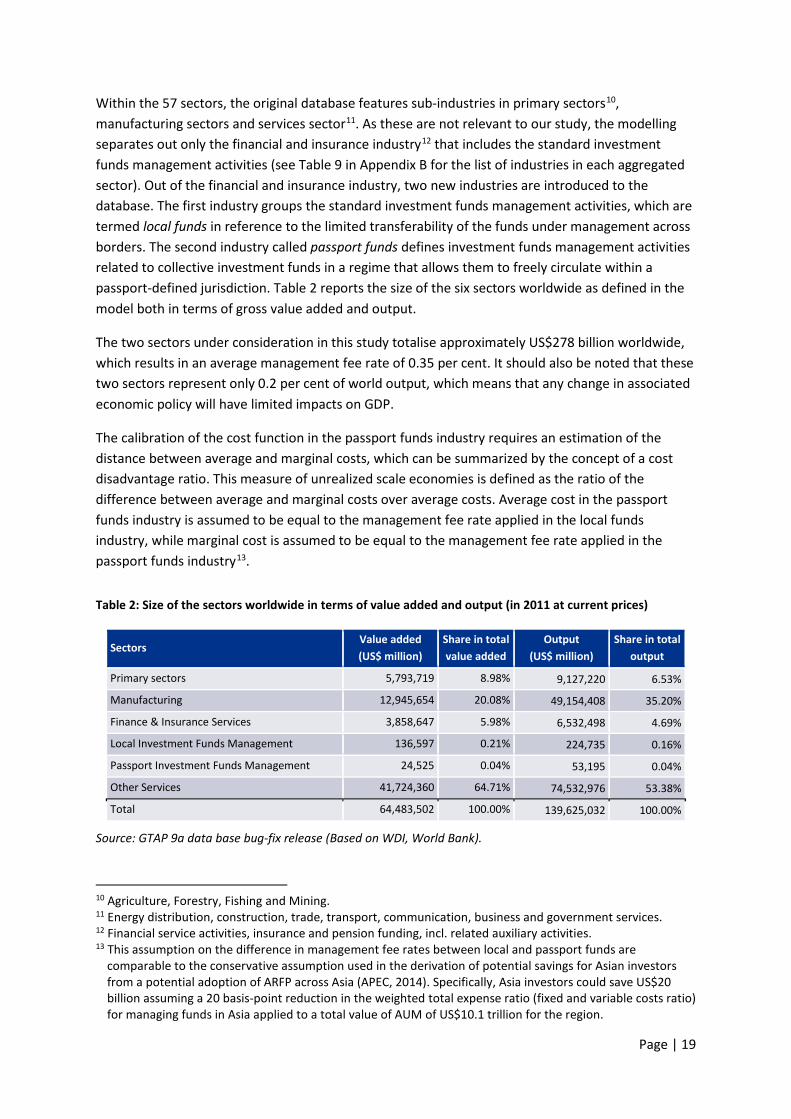
Within the 57 sectors, the original database features sub-industries in primary sectors10, manufacturing sectors and services sector11. As these are not relevant to our study, the modelling separates out only the financial and insurance industry12 that includes the standard investment funds management activities (see Table 9 in Appendix B for the list of industries in each aggregated sector). Out of the financial and insurance industry, two new industries are introduced to the database. The first industry groups the standard investment funds management activities, which are termed local funds in reference to the limited transferability of the funds under management across borders. The second industry called passport funds defines investment funds management activities related to collective investment funds in a regime that allows them to freely circulate within a passport-defined jurisdiction. Table 2 reports the size of the six sectors worldwide as defined in the model both in terms of gross value added and output.
The two sectors under consideration in this study totalise approximately US$278 billion worldwide, which results in an average management fee rate of 0.35 per cent. It should also be noted that these two sectors represent only 0.2 per cent of world output, which means that any change in associated economic policy will have limited impacts on GDP.
The calibration of the cost function in the passport funds industry requires an estimation of the distance between average and marginal costs, which can be summarized by the concept of a cost disadvantage ratio. This measure of unrealized scale economies is defined as the ratio of the difference between average and marginal costs over average costs. Average cost in the passport funds industry is assumed to be equal to the management fee rate applied in the local funds industry, while marginal cost is assumed to be equal to the management fee rate applied in the passport funds industry13.
Table 2: Size of the sectors worldwide in terms of value added and output (in 2011 at current prices)
Sectors Value added (US$ million)
Share in total value added
Output (US$ million)
Share in total output
Primary sectors 5,793,719 8.98% 9,127,220 6.53%
Manufacturing 12,945,654 20.08% 49,154,408 35.20%
Finance & Insurance Services 3,858,647 5.98% 6,532,498 4.69%
Local Investment Funds Management 136,597 0.21% 224,735 0.16%
Passport Investment Funds Management 24,525 0.04% 53,195 0.04%
Other Services 41,724,360 64.71% 74,532,976 53.38%
Total 64,483,502 100.00% 139,625,032 100.00%
Source: GTAP 9a data base bug-fix release (Based on WDI, World Bank).
10 Agriculture, Forestry, Fishing and Mining. 11 Energy distribution, construction, trade, transport, communication, business and government services. 12 Financial service activities, insurance and pension funding, incl. related auxiliary activities. 13 This assumption on the difference in management fee rates between local and passport funds are
comparable to the conservative assumption used in the derivation of potential savings for Asian investors from a potential adoption of ARFP across Asia (APEC, 2014). Specifically, Asia investors could save US$20 billion assuming a 20 basis-point reduction in the weighted total expense ratio (fixed and variable costs ratio) for managing funds in Asia applied to a total value of AUM of US$10.1 trillion for the region.
Page | 20
In terms of behavioural data, the model relies primarily on three type of substitution/transformation elasticity parameters: the elasticity of substitution between primary factors in production, the elasticity of substitution in the Armington nesting structure, and the elasticity of transformation between sectors for sluggish primary factors. Values for these parameters are also based on the GTAP 9a database.
In addition we assume a unitary elasticity for the sensitivity of regional investment allocation across sectors. Values of the remaining parameters and coefficients for the dynamic equations are derived similarly to the dynamic GTAP model (McDougall, Walmsley, Golub, Ianchovichina, & Itakura, 2012).
4.3 Closure specification Any calibration of a general equilibrium model starts with the specification of the set of naturally exogenous variables so that there are as many independent equations as endogenous variables left in the system. Naturally exogenous variables are normally not explained in a CGE model. These are usually observable variables such as tax rates and unobservable variables such as technology and preference variables.
For the purpose of this study, our global economic model is configured in a recursive-dynamic mode, which means that the model can be solved as a sequence of periodic solutions. As our interest lies only in a couple of points in time, we take advantage of the continuous time specification of the model formulation.
Our model is typically run with three different interval lengths. The first time period comprises four years and is intended to bring the 2011 base year database to the initial period of interest, which is the year 2015 in this study. The second length of time intervals involves five years and projects thus the global economy in the year 2020. The last interval length is ten years and produces simulation results for the year 2030.
In this setting the allocation of regional investment is assumed to be determined at the global level and thus the level of investment in each region can be thought of as exogenous. The supply of labour in each region is exogenous, as it is primarily determined by demographic factors and technological change, as well as the arbitrary shift variable in capital stock.
In terms of tax policy, this study assumes that there is no change in any of the tax rates included in the model. This doesn’t implies, however, that there is no change in tax revenue as prices and quantities change resulting from the hypothetical convergence of regulatory schemes.
5 Convergence of Regional Regulatory Schemes The economic impact analysis makes use of two sets of simulations from the CGE model, namely:
• Baseline – results that forecast how the world economy might be expected to change over the forecast horizon; and
• Scenario – results that forecast the economy if a particular policy and event proceeds, and are compared against the base case results to determine the incremental economic impact.
Page | 21
The main purpose of this section is to present an illustrative application of the developed FUM database as well as of the model extensions for supporting policy simulations in the assets management industry. The development of a baseline as well as the results of the baseline simulations are reported in the next section. Modelling the impacts of convergence is described in the following section. Finally, the description of the scenario design and the results of the scenario simulations are provided in the two subsequent sections.
5.1 Development of a baseline The development of a baseline builds upon the work from GTAP (Walmsley, Dimaranan , & McDougall, 2012). The macroeconomic variables in the database include projections for GDP, gross domestic investment, government and private consumption, imports and exports, skilled and unskilled labour, and population by age groups. These projected values were obtained for 226 countries starting in 2005 up to different end years depending on the type of data and on the data provider. As a starting point, only projections of GDP, labour force (skilled and unskilled labour) and population are drawn from this work to develop the base case.
Projections for capital stocks are endogenous to the model as they result from the accumulation of projected investment. Changes in endowments that don’t explain changes in real GDP are attributed to technical changes in all primary factors except capital.
The passport funds management industry in relevant regions (APEC6, ASEAN, and CHK) is initially introduced to the model as a miniature industry with a sales and cost structure similar to the financial and insurance industry. To get this nascent industry to its actual size, a series of shocks are applied to structural features of the model relating to demand for the sector’s output. These structural features are variables related to regional households preferences.
Specifically, it is assumed that regional households express their choices through a market mechanism such as a shift in tastes and preferences towards or against certain investment financial services. In the model this preference shift parameter is added to the behavioural equations of private households. Parameter values are assumed to follow changes in regional market shares and weighted according to their consumption shares in the different levels of the preferences structure. In this way, a cost-neutral twist in consuming preferences can be specified so that consumption forecasts of both local and passport investment funds management services can be targeted with residual changes attributed to demand for other financial and insurance services. This kind of endogenous changes in consumer preferences has been originally applied to the choice between domestic and imported goods in a single-country model (Dixon & Rimmer, 2002).
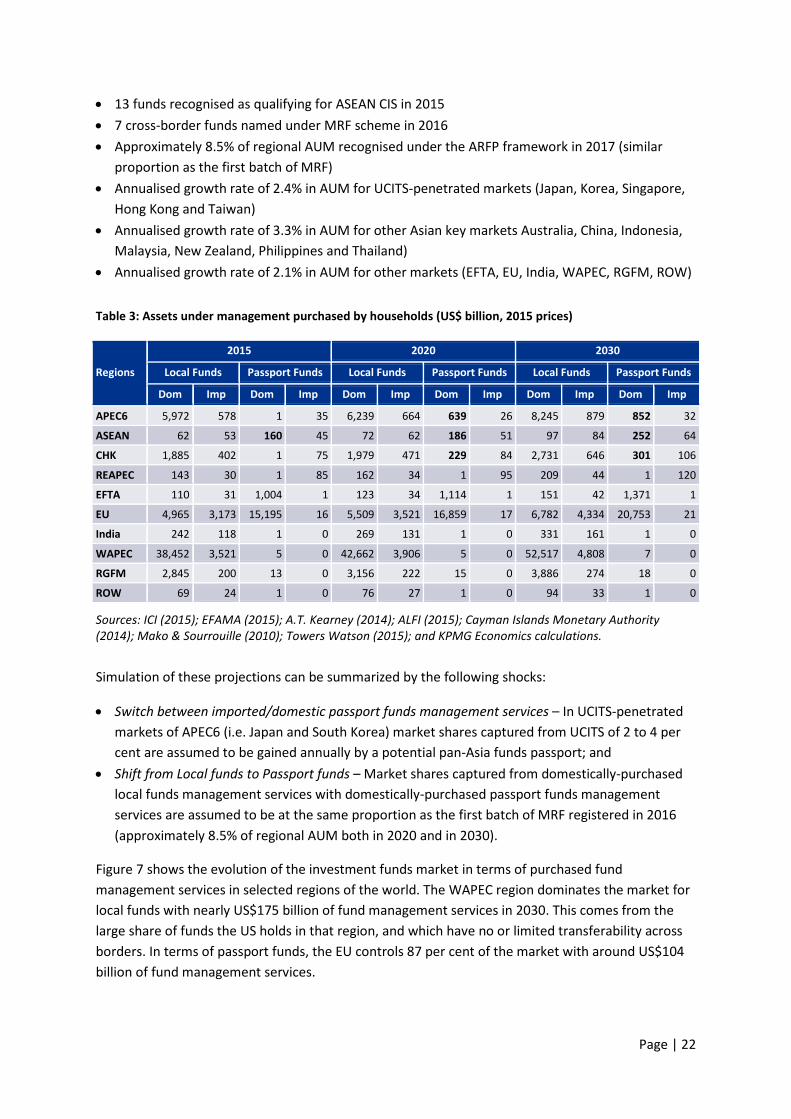
In the baseline, it is assumed that the potential situation in 2017 prevailing in the investment fund industry remains the same in the future. In other words, ARFP is launched in 2017 and EU-based UCITS, ASEAN-based CIS, and China/Hong Kong-based MRF vehicles keep penetrating markets at different growth rates. Projections for the size of the regional industry managing passport investment funds as well as locally distributed investment funds are based on our review of the literature (A.T. Kearney, 2014) and are reflected in terms of funds under management from a household perspective in Table 3. These forecasts are based in particular on the following assumptions:
Page | 22
• 13 funds recognised as qualifying for ASEAN CIS in 2015 • 7 cross-border funds named under MRF scheme in 2016 • Approximately 8.5% of regional AUM recognised under the ARFP framework in 2017 (similar
proportion as the first batch of MRF) • Annualised growth rate of 2.4% in AUM for UCITS-penetrated markets (Japan, Korea, Singapore,
Hong Kong and Taiwan) • Annualised growth rate of 3.3% in AUM for other Asian key markets Australia, China, Indonesia,
Malaysia, New Zealand, Philippines and Thailand) • Annualised growth rate of 2.1% in AUM for other markets (EFTA, EU, India, WAPEC, RGFM, ROW)
Table 3: Assets under management purchased by households (US$ billion, 2015 prices)
Regions
2015 2020 2030
Local Funds Passport Funds Local Funds Passport Funds Local Funds Passport Funds
Dom Imp Dom Imp Dom Imp Dom Imp Dom Imp Dom Imp
APEC6 5,972 578 1 35 6,239 664 639 26 8,245 879 852 32
ASEAN 62 53 160 45 72 62 186 51 97 84 252 64
CHK 1,885 402 1 75 1,979 471 229 84 2,731 646 301 106
REAPEC 143 30 1 85 162 34 1 95 209 44 1 120
EFTA 110 31 1,004 1 123 34 1,114 1 151 42 1,371 1
EU 4,965 3,173 15,195 16 5,509 3,521 16,859 17 6,782 4,334 20,753 21
India 242 118 1 0 269 131 1 0 331 161 1 0
WAPEC 38,452 3,521 5 0 42,662 3,906 5 0 52,517 4,808 7 0
RGFM 2,845 200 13 0 3,156 222 15 0 3,886 274 18 0
ROW 69 24 1 0 76 27 1 0 94 33 1 0
Sources: ICI (2015); EFAMA (2015); A.T. Kearney (2014); ALFI (2015); Cayman Islands Monetary Authority (2014); Mako & Sourrouille (2010); Towers Watson (2015); and KPMG Economics calculations.
Simulation of these projections can be summarized by the following shocks:
• Switch between imported/domestic passport funds management services – In UCITS-penetrated markets of APEC6 (i.e. Japan and South Korea) market shares captured from UCITS of 2 to 4 per cent are assumed to be gained annually by a potential pan-Asia funds passport; and
• Shift from Local funds to Passport funds – Market shares captured from domestically-purchased local funds management services with domestically-purchased passport funds management services are assumed to be at the same proportion as the first batch of MRF registered in 2016 (approximately 8.5% of regional AUM both in 2020 and in 2030).
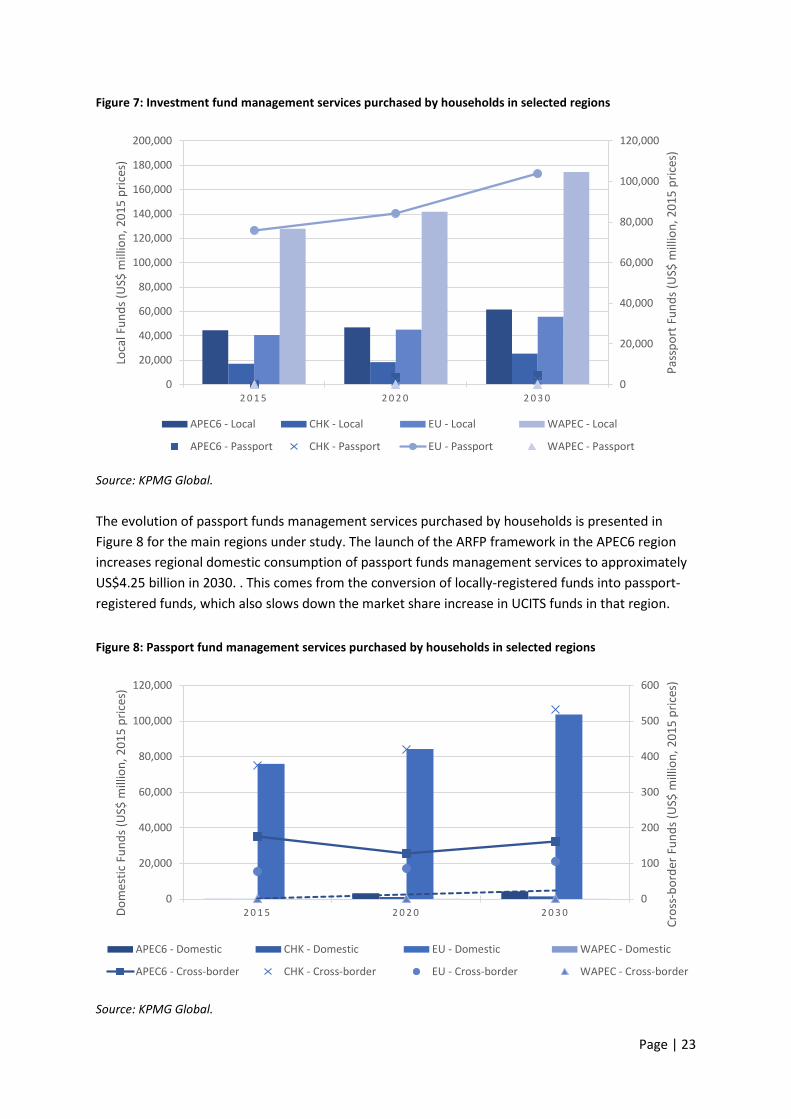
Figure 7 shows the evolution of the investment funds market in terms of purchased fund management services in selected regions of the world. The WAPEC region dominates the market for local funds with nearly US$175 billion of fund management services in 2030. This comes from the large share of funds the US holds in that region, and which have no or limited transferability across borders. In terms of passport funds, the EU controls 87 per cent of the market with around US$104 billion of fund management services.
Page | 23
Figure 7: Investment fund management services purchased by households in selected regions
Source: KPMG Global.
The evolution of passport funds management services purchased by households is presented in Figure 8 for the main regions under study. The launch of the ARFP framework in the APEC6 region increases regional domestic consumption of passport funds management services to approximately US$4.25 billion in 2030. . This comes from the conversion of locally-registered funds into passport-registered funds, which also slows down the market share increase in UCITS funds in that region.
Figure 8: Passport fund management services purchased by households in selected regions
Source: KPMG Global.
0
20,000
40,000
60,000
80,000
100,000
120,000
0
20,000
40,000
60,000
80,000
100,000
120,000
140,000
160,000
180,000
200,000
2 0 1 5 2 0 2 0 2 0 3 0
Pass
port
Fun
ds (U
S$ m
illio
n, 2
015
pric
es)
Loca
l Fun
ds (U
S$ m
illio
n, 2
015
pric
es)
APEC6 - Local CHK - Local EU - Local WAPEC - Local
APEC6 - Passport CHK - Passport EU - Passport WAPEC - Passport
0
100
200
300
400
500
600
0
20,000
40,000
60,000
80,000
100,000
120,000
2 0 1 5 2 0 2 0 2 0 3 0
Cros
s-bo
rder
Fun
ds (U
S$ m
illio
n, 2
015
pric
es)
Dom
estic
Fun
ds (U
S$ m
illio
n, 2
015
pric
es)
APEC6 - Domestic CHK - Domestic EU - Domestic WAPEC - Domestic
APEC6 - Cross-border CHK - Cross-border EU - Cross-border WAPEC - Cross-border
Page | 24
5.2 Modelling the impacts of convergence Among the major benefits of regulatory scheme convergence are economies of scale, fostering competition and portfolio diversification. With regard to economies of scale, increased size lowers the cost of managing funds and provides efficiency gains from improved resource allocation leading to welfare gains for households. Scale economies are specified in the structure of the model for the passport funds management industry and thus play an important role when local funds are recognised under a common regulatory scheme and thus become part of the managed passport fund industry.
The second essential feature of the ARFP is that it provides the incentive to domicile funds in Asia, as it allows funds domiciled in one of the participating countries to be sold into the other participating countries. Consequently, fostering competition in the local investment management industries can result in an increase in the demand for investment funds to be domiciled locally (as a passport version) rather than off-shore.
In terms of portfolio diversification, households are able to choose from a broader range of foreign products once investment markets are integrated. It thus facilitates the possibility of reducing risks, and the benefits of risk sharing through diversification can be transferred to investors in the form of higher returns per unit of risk. There is also enhanced transferability of mutual funds across borders as it strengthens capital formation and improves capital efficiency by channelling savings to more effectively finance economic activity.
This study assumes that regions take advantage of improved international portfolio diversification by allowing outflows of portfolio investment from their region in order to exploit foreign investment opportunities. Investment in a broad range of foreign products involves two components of the model. The first is associated with movements of funds from lending regions to borrowing regions. The second component is the subsequent switch from domestically-purchased local funds management services to foreign-purchased passport funds management services.
Regarding the movement of funds between countries, investors reallocate capital from regions with lower rates of return to regions with higher rates of return. This is equivalent to an outward shift of the supply curve for portfolio investment in lending regions. For borrowing regions, this increases portfolio investment and lowers rates of return in these regions. In terms of the associated funds management services, lending regions experience a reduction in their own production of local funds management services in favour of an increase in imported passport funds management services produced by the borrowing regions. The estimated impacts for these two shocks are based on the portfolio theory of investor behaviour.
International market integration usually means equalisation of price of risk since the risk on future payments is the real product traded on financial markets. A classical method for estimating the price of risk is the Sharpe ratio (Sharpe, 1994). The Sharpe measure calculates the average return over and above the risk-free rate of return per unit of portfolio risk. When analysing the Sharpe ratio, the higher the value, the more excess return investors can expect to receive as compensation for the extra volatility they are exposed to by holding a riskier asset.
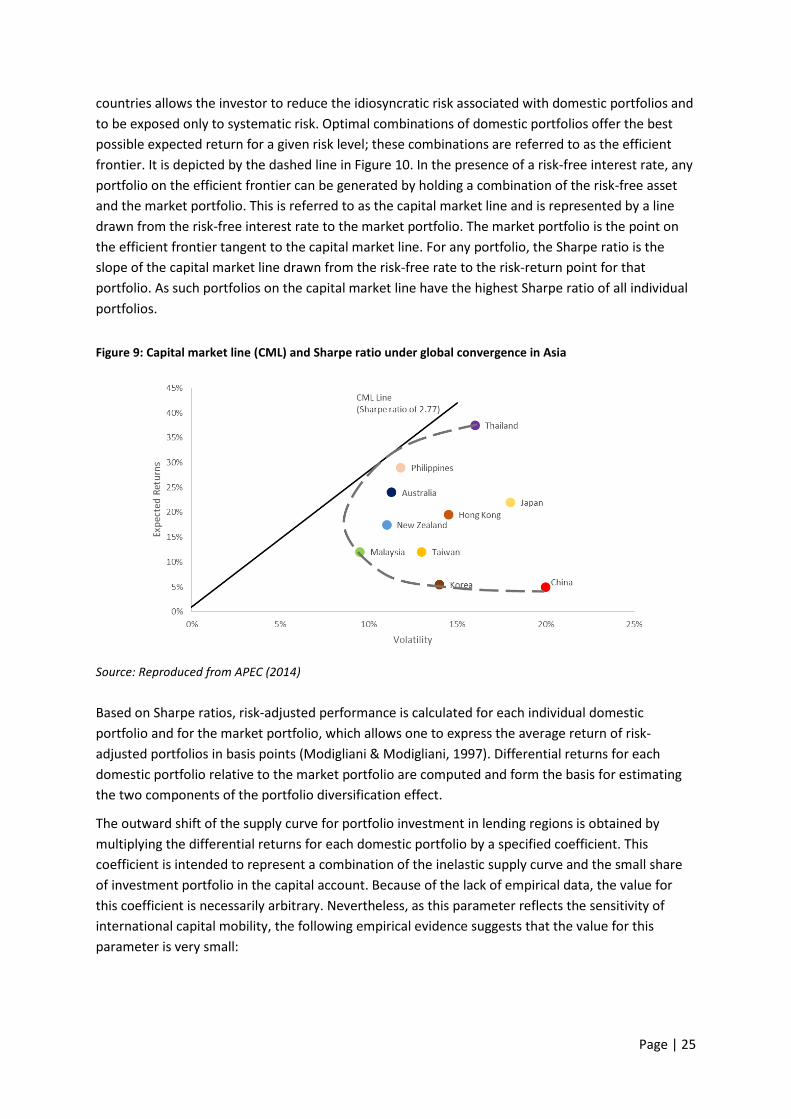
Figure 10 illustrates the concept of international portfolio diversification using domestically-diversified portfolios. The risk-expected return space shows that increasing expected returns gained on an investment come at the expense of increasing risk. Optimising investment allocations across
Page | 25
countries allows the investor to reduce the idiosyncratic risk associated with domestic portfolios and to be exposed only to systematic risk. Optimal combinations of domestic portfolios offer the best possible expected return for a given risk level; these combinations are referred to as the efficient frontier. It is depicted by the dashed line in Figure 10. In the presence of a risk-free interest rate, any portfolio on the efficient frontier can be generated by holding a combination of the risk-free asset and the market portfolio. This is referred to as the capital market line and is represented by a line drawn from the risk-free interest rate to the market portfolio. The market portfolio is the point on the efficient frontier tangent to the capital market line. For any portfolio, the Sharpe ratio is the slope of the capital market line drawn from the risk-free rate to the risk-return point for that portfolio. As such portfolios on the capital market line have the highest Sharpe ratio of all individual portfolios.
Figure 9: Capital market line (CML) and Sharpe ratio under global convergence in Asia
Source: Reproduced from APEC (2014)
Based on Sharpe ratios, risk-adjusted performance is calculated for each individual domestic portfolio and for the market portfolio, which allows one to express the average return of risk-adjusted portfolios in basis points (Modigliani & Modigliani, 1997). Differential returns for each domestic portfolio relative to the market portfolio are computed and form the basis for estimating the two components of the portfolio diversification effect.
The outward shift of the supply curve for portfolio investment in lending regions is obtained by multiplying the differential returns for each domestic portfolio by a specified coefficient. This coefficient is intended to represent a combination of the inelastic supply curve and the small share of investment portfolio in the capital account. Because of the lack of empirical data, the value for this coefficient is necessarily arbitrary. Nevertheless, as this parameter reflects the sensitivity of international capital mobility, the following empirical evidence suggests that the value for this parameter is very small:
Page | 26
• Large home bias – Investors tend to hold far lower proportions of other countries’ securities in their portfolios than they would in a well-diversified international portfolio (French & Poterba, 1991); and
• International cross-hauling of capital flows – Two-way capital flows are much higher than net capital flows (Buch & Pierdzioch, 2001).
The magnitude of the outward shift of the supply curve for portfolio investment depends on the extent of portfolio diversification in each region. As such, China/Hong-Kong has the lowest Sharpe ratio which leads to the largest outflows of capital.
The second component of the portfolio diversification effect is a consequence of the change in the portfolio investment. Regions experiencing an outflow of capital have less funds under management but import management services from abroad. It follows then a switch between domestic local funds management services and imported passport funds management services. This reduction in lending regions of a fraction of local AUM is based on the differential return and sourced from other regions inversely proportional to their differential returns.
5.3 Design of convergence scenarios Whilst each of the regional passport frameworks has the ability to generate material economic benefits to stakeholders residing within the group of participating jurisdictions, the benefit generated by each framework should be greater if/as additional regions were to join over the coming years.
This study examines the economic impacts of three hypothetical convergence scenarios of regulatory schemes across the world. Results for each of these scenarios are compared to the baseline results where there is no convergence of any current regional regulatory schemes, to indicate the incremental economic effects associated with the potential integration of investment funds markets. Simulation of these scenarios makes use of the following sets of shocks:
1. AUM projections − Switch between imported/domestic passport funds management services – In UCITS-
penetrated markets (i.e. Singapore in ASEAN, Hong Kong in CHK and Taiwan in REAPEC) market shares captured from UCITS of 2 to 4 per cent are assumed to be gained annually by a potential pan-Asia funds passport
− Shift from Local funds to Passport funds • REAPEC and India are assumed to adopt the common regulatory scheme of the ARFP in 2020
and their respective market shares captured from domestically-purchased local funds management services with domestically-purchased passport funds management services are assumed to be at the same proportion as the first batch of MRF registered in 2016
• The WAPEC region is supposed to move to a common regulatory scheme in two steps, with the first one in 2020 for one third of the EU domestic passport funds under management and in 2030 for the same proportion as the EU
2. Shift from foreign-domiciled funds to home-domiciled funds – Increased opportunities for funds to be domiciled in Asia (i.e. in ASEAN led by Singapore, in CHK led by Hong Kong, and in REAPEC led by Taiwan) takes the form of a decrease in imported local funds management services of
Page | 27
25% in 2020 and 50% in 2030 (as markets mature) and a corresponding increase in domestic passport funds management services
3. Portfolio diversification impacts − Switch between domestic local and imported passport funds management services – Imports
of passport funds management services between participating jurisdictions of the regulatory agreement are assumed to replace part of their own production of local funds management services
− Outward shift of the portfolio investment supply curve in lending regions – Outflows of portfolio investment in the capital account based on optimised-investment reallocation
The three hypothetical convergence scenarios considered in this study are the following.
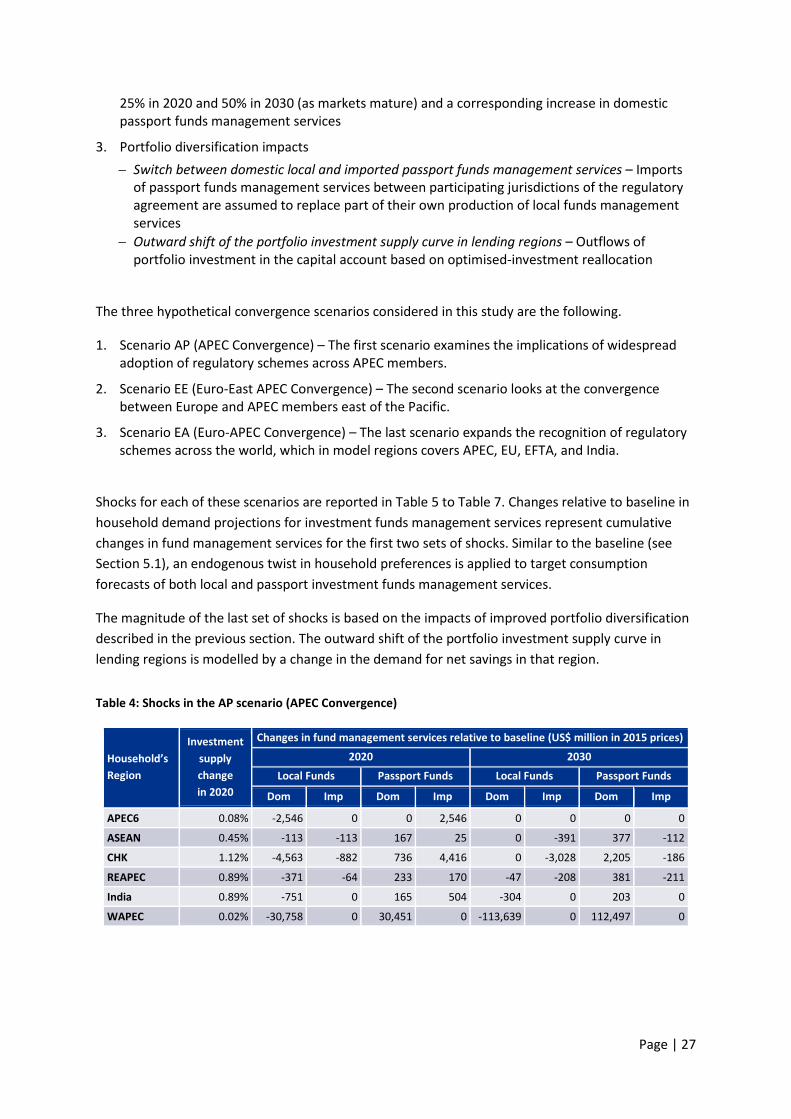
1. Scenario AP (APEC Convergence) – The first scenario examines the implications of widespread adoption of regulatory schemes across APEC members.
2. Scenario EE (Euro-East APEC Convergence) – The second scenario looks at the convergence between Europe and APEC members east of the Pacific.
3. Scenario EA (Euro-APEC Convergence) – The last scenario expands the recognition of regulatory schemes across the world, which in model regions covers APEC, EU, EFTA, and India.
Shocks for each of these scenarios are reported in Table 5 to Table 7. Changes relative to baseline in household demand projections for investment funds management services represent cumulative changes in fund management services for the first two sets of shocks. Similar to the baseline (see Section 5.1), an endogenous twist in household preferences is applied to target consumption forecasts of both local and passport investment funds management services.
The magnitude of the last set of shocks is based on the impacts of improved portfolio diversification described in the previous section. The outward shift of the portfolio investment supply curve in lending regions is modelled by a change in the demand for net savings in that region.
Table 4: Shocks in the AP scenario (APEC Convergence)
Household’s Region
Investment supply change in 2020
Changes in fund management services relative to baseline (US$ million in 2015 prices)
2020 2030
Local Funds Passport Funds Local Funds Passport Funds
Dom Imp Dom Imp Dom Imp Dom Imp
APEC6 0.08% -2,546 0 0 2,546 0 0 0 0
ASEAN 0.45% -113 -113 167 25 0 -391 377 -112
CHK 1.12% -4,563 -882 736 4,416 0 -3,028 2,205 -186
REAPEC 0.89% -371 -64 233 170 -47 -208 381 -211
India 0.89% -751 0 165 504 -304 0 203 0
WAPEC 0.02% -30,758 0 30,451 0 -113,639 0 112,497 0
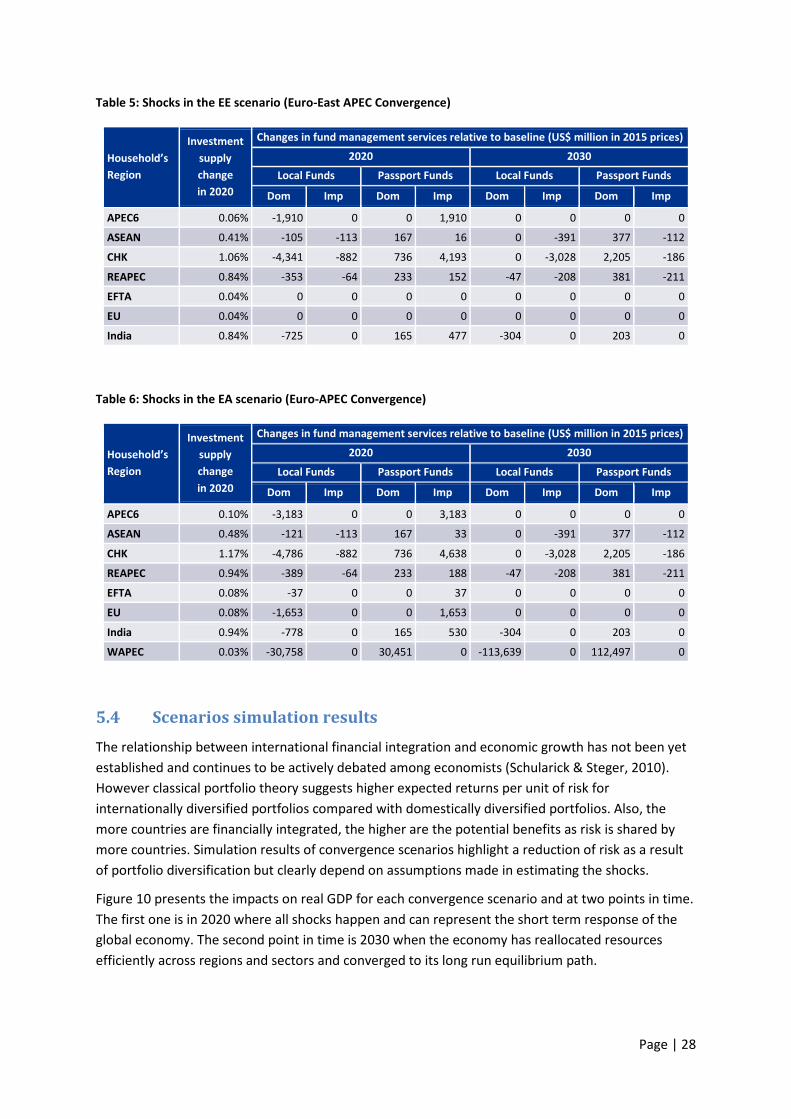
Page | 28
Table 5: Shocks in the EE scenario (Euro-East APEC Convergence)
Household’s Region
Investment supply change in 2020
Changes in fund management services relative to baseline (US$ million in 2015 prices)
2020 2030
Local Funds Passport Funds Local Funds Passport Funds
Dom Imp Dom Imp Dom Imp Dom Imp
APEC6 0.06% -1,910 0 0 1,910 0 0 0 0
ASEAN 0.41% -105 -113 167 16 0 -391 377 -112
CHK 1.06% -4,341 -882 736 4,193 0 -3,028 2,205 -186
REAPEC 0.84% -353 -64 233 152 -47 -208 381 -211
EFTA 0.04% 0 0 0 0 0 0 0 0
EU 0.04% 0 0 0 0 0 0 0 0
India 0.84% -725 0 165 477 -304 0 203 0
Table 6: Shocks in the EA scenario (Euro-APEC Convergence)
Household’s Region
Investment supply change in 2020
Changes in fund management services relative to baseline (US$ million in 2015 prices)
2020 2030
Local Funds Passport Funds Local Funds Passport Funds
Dom Imp Dom Imp Dom Imp Dom Imp
APEC6 0.10% -3,183 0 0 3,183 0 0 0 0
ASEAN 0.48% -121 -113 167 33 0 -391 377 -112
CHK 1.17% -4,786 -882 736 4,638 0 -3,028 2,205 -186
REAPEC 0.94% -389 -64 233 188 -47 -208 381 -211
EFTA 0.08% -37 0 0 37 0 0 0 0
EU 0.08% -1,653 0 0 1,653 0 0 0 0
India 0.94% -778 0 165 530 -304 0 203 0
WAPEC 0.03% -30,758 0 30,451 0 -113,639 0 112,497 0
5.4 Scenarios simulation results The relationship between international financial integration and economic growth has not been yet established and continues to be actively debated among economists (Schularick & Steger, 2010). However classical portfolio theory suggests higher expected returns per unit of risk for internationally diversified portfolios compared with domestically diversified portfolios. Also, the more countries are financially integrated, the higher are the potential benefits as risk is shared by more countries. Simulation results of convergence scenarios highlight a reduction of risk as a result of portfolio diversification but clearly depend on assumptions made in estimating the shocks.
Figure 10 presents the impacts on real GDP for each convergence scenario and at two points in time. The first one is in 2020 where all shocks happen and can represent the short term response of the global economy. The second point in time is 2030 when the economy has reallocated resources efficiently across regions and sectors and converged to its long run equilibrium path.
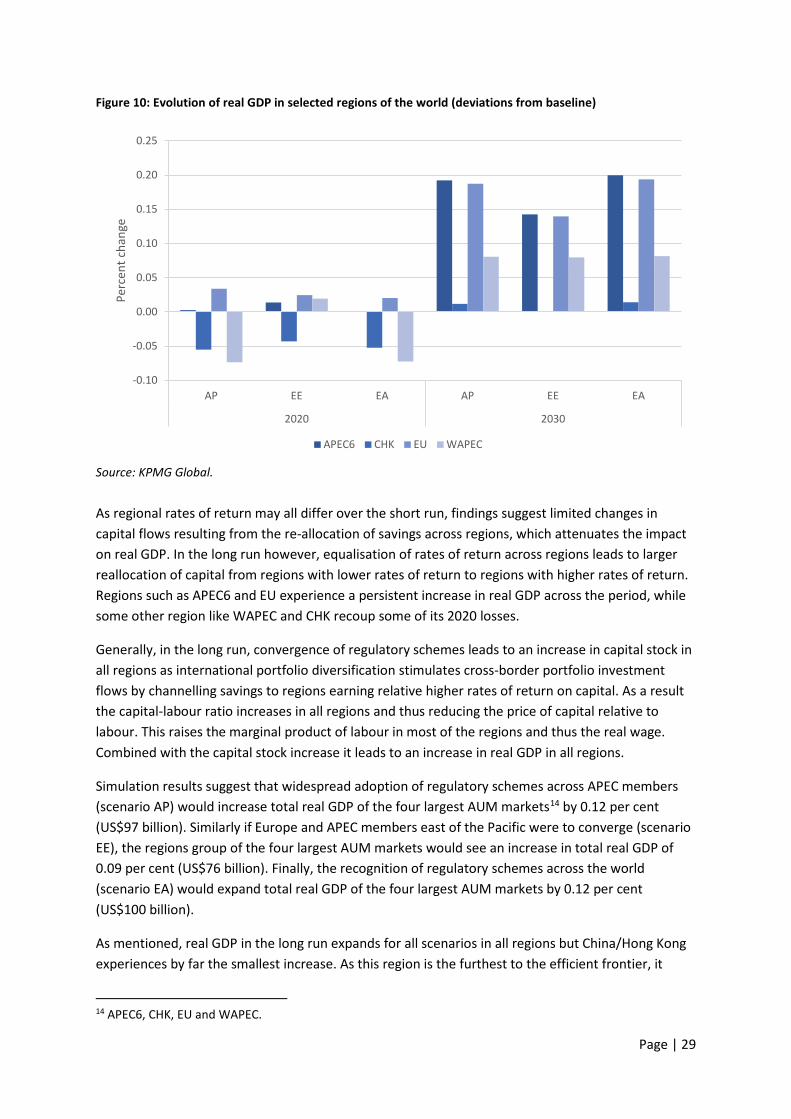
Page | 29
Figure 10: Evolution of real GDP in selected regions of the world (deviations from baseline)
Source: KPMG Global.
As regional rates of return may all differ over the short run, findings suggest limited changes in capital flows resulting from the re-allocation of savings across regions, which attenuates the impact on real GDP. In the long run however, equalisation of rates of return across regions leads to larger reallocation of capital from regions with lower rates of return to regions with higher rates of return. Regions such as APEC6 and EU experience a persistent increase in real GDP across the period, while some other region like WAPEC and CHK recoup some of its 2020 losses.
Generally, in the long run, convergence of regulatory schemes leads to an increase in capital stock in all regions as international portfolio diversification stimulates cross-border portfolio investment flows by channelling savings to regions earning relative higher rates of return on capital. As a result the capital-labour ratio increases in all regions and thus reducing the price of capital relative to labour. This raises the marginal product of labour in most of the regions and thus the real wage. Combined with the capital stock increase it leads to an increase in real GDP in all regions.
Simulation results suggest that widespread adoption of regulatory schemes across APEC members (scenario AP) would increase total real GDP of the four largest AUM markets14 by 0.12 per cent (US$97 billion). Similarly if Europe and APEC members east of the Pacific were to converge (scenario EE), the regions group of the four largest AUM markets would see an increase in total real GDP of 0.09 per cent (US$76 billion). Finally, the recognition of regulatory schemes across the world (scenario EA) would expand total real GDP of the four largest AUM markets by 0.12 per cent (US$100 billion).
As mentioned, real GDP in the long run expands for all scenarios in all regions but China/Hong Kong experiences by far the smallest increase. As this region is the furthest to the efficient frontier, it
14 APEC6, CHK, EU and WAPEC.
-0.10
-0.05
0.00
0.05
0.10
0.15
0.20
0.25
AP EE EA AP EE EA
2020 2030
Perc
ent c
hang
e
APEC6 CHK EU WAPEC
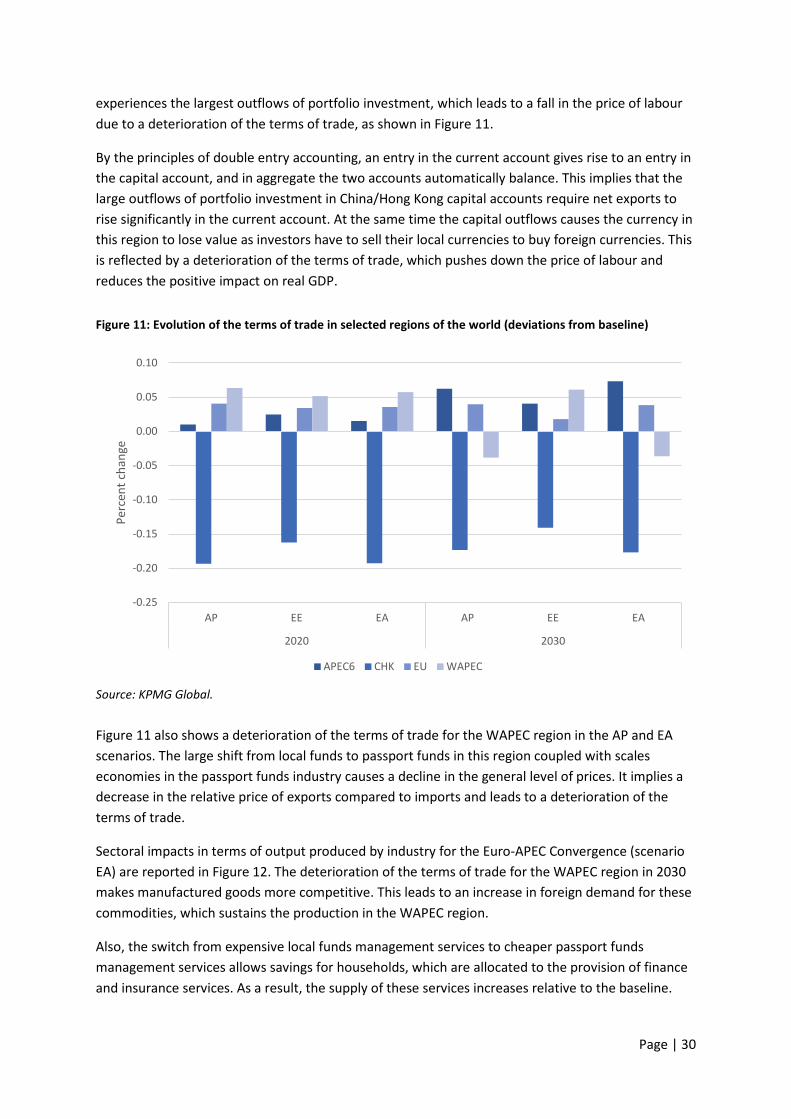
Page | 30
experiences the largest outflows of portfolio investment, which leads to a fall in the price of labour due to a deterioration of the terms of trade, as shown in Figure 11.
By the principles of double entry accounting, an entry in the current account gives rise to an entry in the capital account, and in aggregate the two accounts automatically balance. This implies that the large outflows of portfolio investment in China/Hong Kong capital accounts require net exports to rise significantly in the current account. At the same time the capital outflows causes the currency in this region to lose value as investors have to sell their local currencies to buy foreign currencies. This is reflected by a deterioration of the terms of trade, which pushes down the price of labour and reduces the positive impact on real GDP.
Figure 11: Evolution of the terms of trade in selected regions of the world (deviations from baseline)
Source: KPMG Global.
Figure 11 also shows a deterioration of the terms of trade for the WAPEC region in the AP and EA scenarios. The large shift from local funds to passport funds in this region coupled with scales economies in the passport funds industry causes a decline in the general level of prices. It implies a decrease in the relative price of exports compared to imports and leads to a deterioration of the terms of trade.
Sectoral impacts in terms of output produced by industry for the Euro-APEC Convergence (scenario EA) are reported in Figure 12. The deterioration of the terms of trade for the WAPEC region in 2030 makes manufactured goods more competitive. This leads to an increase in foreign demand for these commodities, which sustains the production in the WAPEC region.
Also, the switch from expensive local funds management services to cheaper passport funds management services allows savings for households, which are allocated to the provision of finance and insurance services. As a result, the supply of these services increases relative to the baseline.
-0.25
-0.20
-0.15
-0.10
-0.05
0.00
0.05
0.10
AP EE EA AP EE EA
2020 2030
Perc
ent c
hang
e
APEC6 CHK EU WAPEC
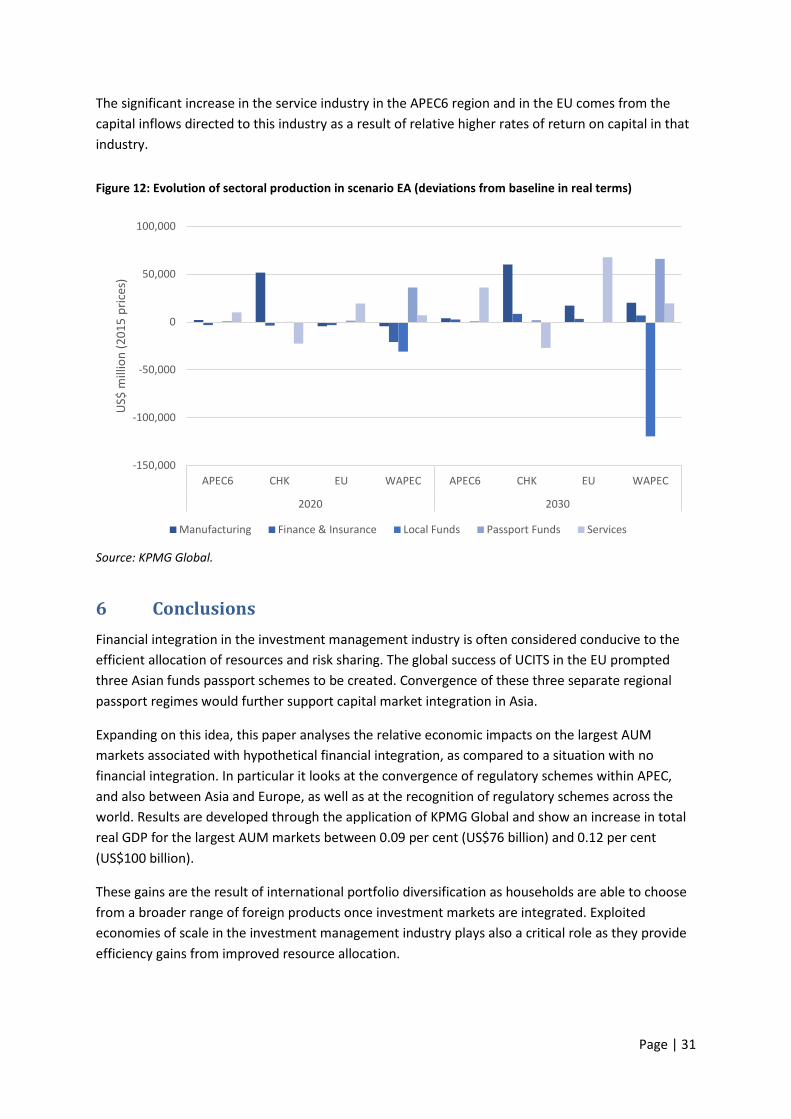
Page | 31
The significant increase in the service industry in the APEC6 region and in the EU comes from the capital inflows directed to this industry as a result of relative higher rates of return on capital in that industry.
Figure 12: Evolution of sectoral production in scenario EA (deviations from baseline in real terms)
Source: KPMG Global.
6 Conclusions Financial integration in the investment management industry is often considered conducive to the efficient allocation of resources and risk sharing. The global success of UCITS in the EU prompted three Asian funds passport schemes to be created. Convergence of these three separate regional passport regimes would further support capital market integration in Asia.
Expanding on this idea, this paper analyses the relative economic impacts on the largest AUM markets associated with hypothetical financial integration, as compared to a situation with no financial integration. In particular it looks at the convergence of regulatory schemes within APEC, and also between Asia and Europe, as well as at the recognition of regulatory schemes across the world. Results are developed through the application of KPMG Global and show an increase in total real GDP for the largest AUM markets between 0.09 per cent (US$76 billion) and 0.12 per cent (US$100 billion).
These gains are the result of international portfolio diversification as households are able to choose from a broader range of foreign products once investment markets are integrated. Exploited economies of scale in the investment management industry plays also a critical role as they provide efficiency gains from improved resource allocation.
-150,000
-100,000
-50,000
0
50,000
100,000
APEC6 CHK EU WAPEC APEC6 CHK EU WAPEC
2020 2030
US$
mill
ion
(201
5 pr
ices
)
Manufacturing Finance & Insurance Local Funds Passport Funds Services
Page | 32
Bibliography A.T. Kearney. (2014, February). Asia Region Funds Passport - The Case for Greater Integration in
Asian Funds Management. A.T. Kearney, Inc.
ALFI. (2015). Luxembourg retains position as the leading investment fund domicile in Europe. Association of the Luxembourg Fund Industry.
Allen, C. (2013). Fee pressure evident in Alternatives only – Mercer report. Retrieved from InvestmentEurope: http://www.investmenteurope.net/other/fee-pressure-evident-in-alternatives-only-mercer-report/
APEC. (2014). Asia Region Funds Passport - A Study of Potential Economic Benefits and Costs. Singapore: APEC Policy Support Unit.
Buch, C. M., & Pierdzioch, C. (2001). The Growth and the Volatility of International Capital Flows: Reconciling the Evidence. In H. Siebert, The World's New Financial Lanscape: Challenges for Economic Policy. Berlin: Springer.
Cayman Islands Monetary Authority. (2014). Investment Statistical Digest. Cayman Islands Monetary Authority.
Cretegny, L. (2014). Sector-Specific Investment in a MRIO CGE Model. 17th Annual Conference on Global Economic Analysis. Dakar, Senegal: Center for Global Trade Analysis.
Cretegny, L. (2015). A Dynamic Global CGE Model with a GVAR-based Baseline. 18th Annual Conference on Global Economic Analysis. Melbourne, Australia: Center for Global Trade Analysis.
Directive 2014/91/EU. (2014). Directive 2014/91/EU of the European Parliament and of the Council of 23 July 2014 amending Directive 2009/65/EC. Official Journal of the European Union, 257, 186-213.
Dixon, P. B., & Rimmer, M. T. (2002). Dynamic General Equilibrium Modelling for Forecasting and Policy. Amsterdam: Elsevier Science B.V.
Dixon, P. B., Koopman, R. B., & Rimmer, M. T. (2013). The MONASH Style of Computable General Equilibrium Modeling: A Framework for Practical Policy Analysis. In P. B. Dixon, & D. Jorgenson, Handbook of Computable General Equilibrium Modeling (pp. 23-103). Elsevier B.V.
EFAMA. (2015). Trends in the European Investment Fund Industry. Bruxelles: The European Fund and Asset Management Association.
Francois, J. F., & Roland-Holst, D. W. (1997). Scale economies and imperfect competition. In J. F. Francois, & K. A. Reinert, Applied Methods for Trade Policy Analysis: A Handbook. New York: Cambridge University Press.
Page | 33
French, K. R., & Poterba, J. M. (1991, May). Investor Diversification And International Equity Markets. American Economic Review, 81(2), 222-226.
GAO. (2000). Mutual Fund Fees. Washington D.C.: United States General Accounting Office.
Harrison, G. W., Rutherford, T. F., & Tarr, D. G. (1996, September). Increased Competition and Completion of the Market in the European Union: Static and Steady State Effects. Journal of Economic Integration, 11(3), 332-365.
Harrison, J. W., & Pearson, K. R. (1996). Computing solutions for large general equilibrium models using GEMPACK. Computational Economics, 9(2), 83-127.
Haslem, J. A. (2013). Mutual Fund Markets Are Imperfectly Competitive. The Journal of Index Investing, 32-44.
Hertel, T. W., & Tsigas, M. E. (1997). Structure of GTAP. In W. T. Hertel, Global Trade Analysis: Modeling and Applications. Cambridge University Press.
Huff, K., McDougall, R., & Walmsley, T. (2000). Contributing Input-Output Tables to the GTAP Data Base. Center for Global Trade Analysis, GTAP Technical Paper No. 1. Purdue University.
Ianchovichina, E. I., & McDougall, R. A. (2012). Theoretical Structure of Dynamic GTAP. In E. I. Ianchovichina, & T. L. Walmsley (Eds.), Dynamic Modeling and Applications for Global Economic Analysis (pp. 13-70). New York: Cambridge University Press.
ICI. (2015). Worldwide Public Tables, Fourth Quarter 2015. Retrieved from Investment Company Institute: https://www.ici.org/info/ww_q4_15_public_report_us.xls
McDougall, R. A., Walmsley, T. L., Golub, A., Ianchovichina, E. I., & Itakura, K. (2012). An Overview of the Dynamic GTAP Data Base: The Data Base Construction and Aggregation Programs. In E. I. Ianchovichina, & T. L. Walmsley (Eds.), Dynamic Modeling and Applications for Global Economic Analysis (pp. 120-135). New York: Cambridge University Press.
Modigliani, F., & Modigliani, L. (1997, Winter). Risk-Adjusted Performance. Journal of Portfolio Management, 45-54.
Narayanan, B. G., Aguiar, A., & McDougall, R. (2015). Global Trade, Assistance, and Production: The GTAP 9 Data Base. Purdue University. Center for Global Trade Analysis.
PWC. (2013). Transforming Hong Kong into an asset management hub. Unpublished.
Robinson, S. (2006). Macro Models and Multipliers: Leontief, Stone, Keynes, and CGE Models. In A. de Janvry, & R. Kanbur (Eds.), Poverty, Inequality and Development: Essays in Honor of Erik Thorbecke (pp. 205-232). New York: Spinger Science.
Schularick, M., & Steger, T. M. (2010, November). Financial Integration, Investment, and Economic Growth: Evidence from Two Eras of Financial Globalization. Review of Economics and Statistics, 92(4), 756-768.
Sharpe, W. F. (1994, Fall). The Sharpe Ratio. Journal of Portfolio Management, 49-58.
Page | 34
Shoven, J. B., & Whalley, J. (1984, September). Applied General Equilibrium Models of Taxation and International Trade: An Introduction. Journal of Economic Literature, XXII, 1007-51.
Towers Watson. (2015). The 500 largest asset managers - The P&I/Towers Watson global 500 research and ranking. London: Towers Watson.
Walmsley, T. L., Dimaranan , B. V., & McDougall, R. A. (2012). A Baseline Scenario for the Dynamic GTAP Model. In E. Ianchovichina, & T. L. Walmsley (Eds.), Dynamic Modeling and Applications for Global Economic Analysis (pp. 136-157). New York: Cambridge University Press.
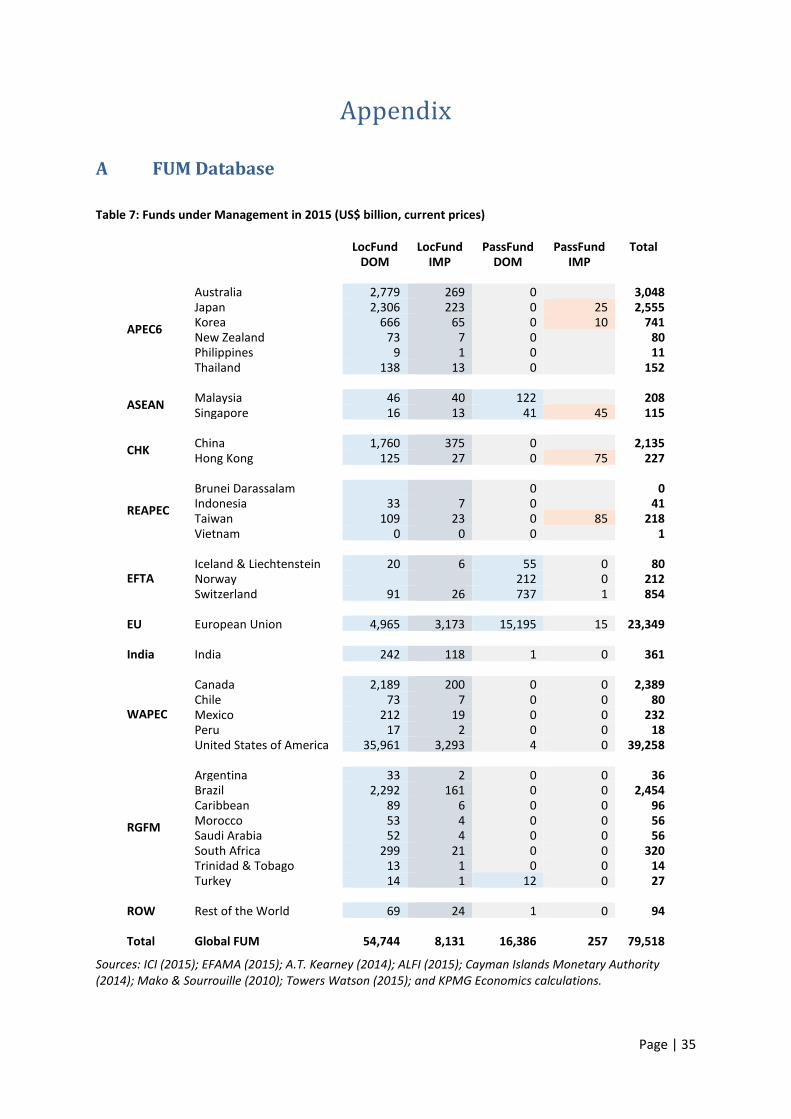
Page | 35
Appendix
A FUM Database
Table 7: Funds under Management in 2015 (US$ billion, current prices)
LocFund LocFund PassFund PassFund Total DOM IMP DOM IMP
2015 2015 2015 2015
APEC6
Australia 2,779 269 0 3,048 Japan 2,306 223 0 25 2,555 Korea 666 65 0 10 741 New Zealand 73 7 0 80 Philippines 9 1 0 11 Thailand 138 13 0 152
ASEAN Malaysia 46 40 122 208
Singapore 16 13 41 45 115
CHK China 1,760 375 0 2,135 Hong Kong 125 27 0 75 227
REAPEC
Brunei Darassalam 0 0 Indonesia 33 7 0 41 Taiwan 109 23 0 85 218 Vietnam 0 0 0 1
EFTA Iceland & Liechtenstein 20 6 55 0 80 Norway 212 0 212 Switzerland 91 26 737 1 854
EU European Union 4,965 3,173 15,195 15 23,349
India India 242 118 1 0 361
WAPEC
Canada 2,189 200 0 0 2,389 Chile 73 7 0 0 80 Mexico 212 19 0 0 232 Peru 17 2 0 0 18 United States of America 35,961 3,293 4 0 39,258
RGFM
Argentina 33 2 0 0 36 Brazil 2,292 161 0 0 2,454 Caribbean 89 6 0 0 96 Morocco 53 4 0 0 56 Saudi Arabia 52 4 0 0 56 South Africa 299 21 0 0 320 Trinidad & Tobago 13 1 0 0 14 Turkey 14 1 12 0 27
ROW Rest of the World 69 24 1 0 94
Total Global FUM 54,744 8,131 16,386 257 79,518
Sources: ICI (2015); EFAMA (2015); A.T. Kearney (2014); ALFI (2015); Cayman Islands Monetary Authority (2014); Mako & Sourrouille (2010); Towers Watson (2015); and KPMG Economics calculations.
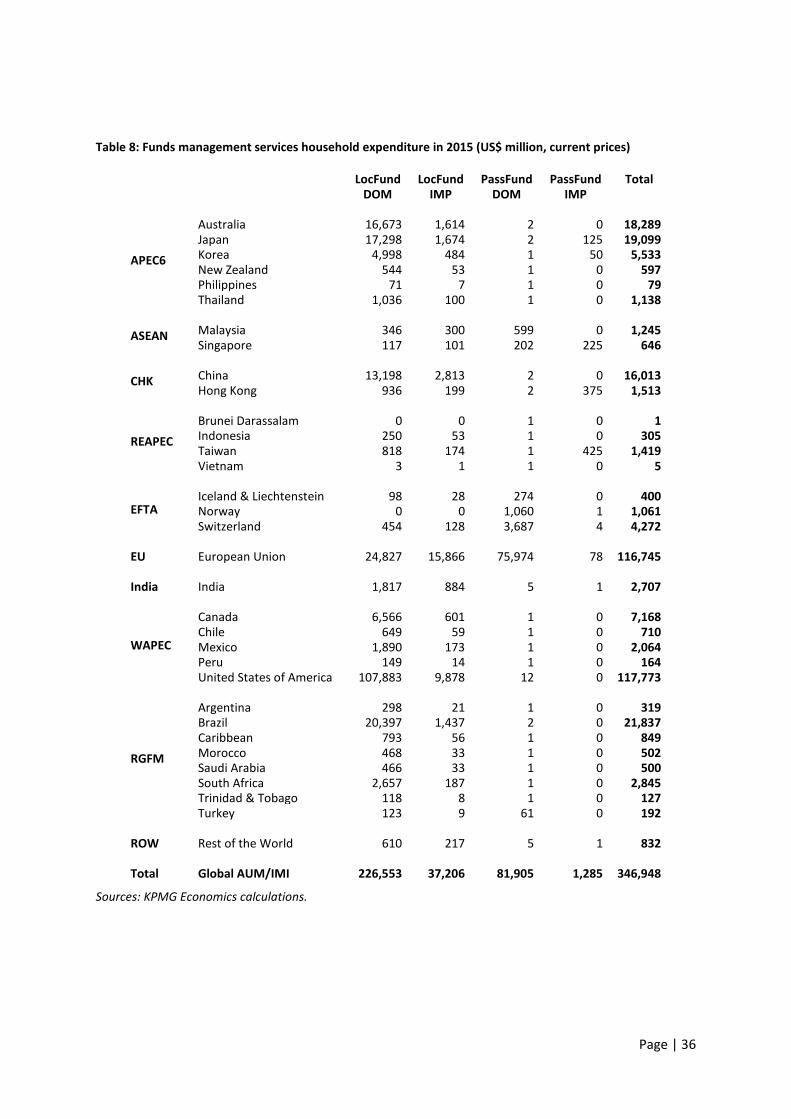
Page | 36
Table 8: Funds management services household expenditure in 2015 (US$ million, current prices)
LocFund LocFund PassFund PassFund Total DOM IMP DOM IMP
Y2015 Y2015 Y2015 Y2015
APEC6
Australia 16,673 1,614 2 0 18,289 Japan 17,298 1,674 2 125 19,099 Korea 4,998 484 1 50 5,533 New Zealand 544 53 1 0 597 Philippines 71 7 1 0 79 Thailand 1,036 100 1 0 1,138
ASEAN Malaysia 346 300 599 0 1,245
Singapore 117 101 202 225 646
CHK China 13,198 2,813 2 0 16,013 Hong Kong 936 199 2 375 1,513
REAPEC Brunei Darassalam 0 0 1 0 1 Indonesia 250 53 1 0 305 Taiwan 818 174 1 425 1,419 Vietnam 3 1 1 0 5
EFTA Iceland & Liechtenstein 98 28 274 0 400 Norway 0 0 1,060 1 1,061 Switzerland 454 128 3,687 4 4,272
EU European Union 24,827 15,866 75,974 78 116,745
India India 1,817 884 5 1 2,707
WAPEC
Canada 6,566 601 1 0 7,168 Chile 649 59 1 0 710 Mexico 1,890 173 1 0 2,064 Peru 149 14 1 0 164 United States of America 107,883 9,878 12 0 117,773
RGFM
Argentina 298 21 1 0 319 Brazil 20,397 1,437 2 0 21,837 Caribbean 793 56 1 0 849 Morocco 468 33 1 0 502 Saudi Arabia 466 33 1 0 500 South Africa 2,657 187 1 0 2,845 Trinidad & Tobago 118 8 1 0 127 Turkey 123 9 61 0 192
ROW Rest of the World 610 217 5 1 832
Total Global AUM/IMI 226,553 37,206 81,905 1,285 346,948
Sources: KPMG Economics calculations.
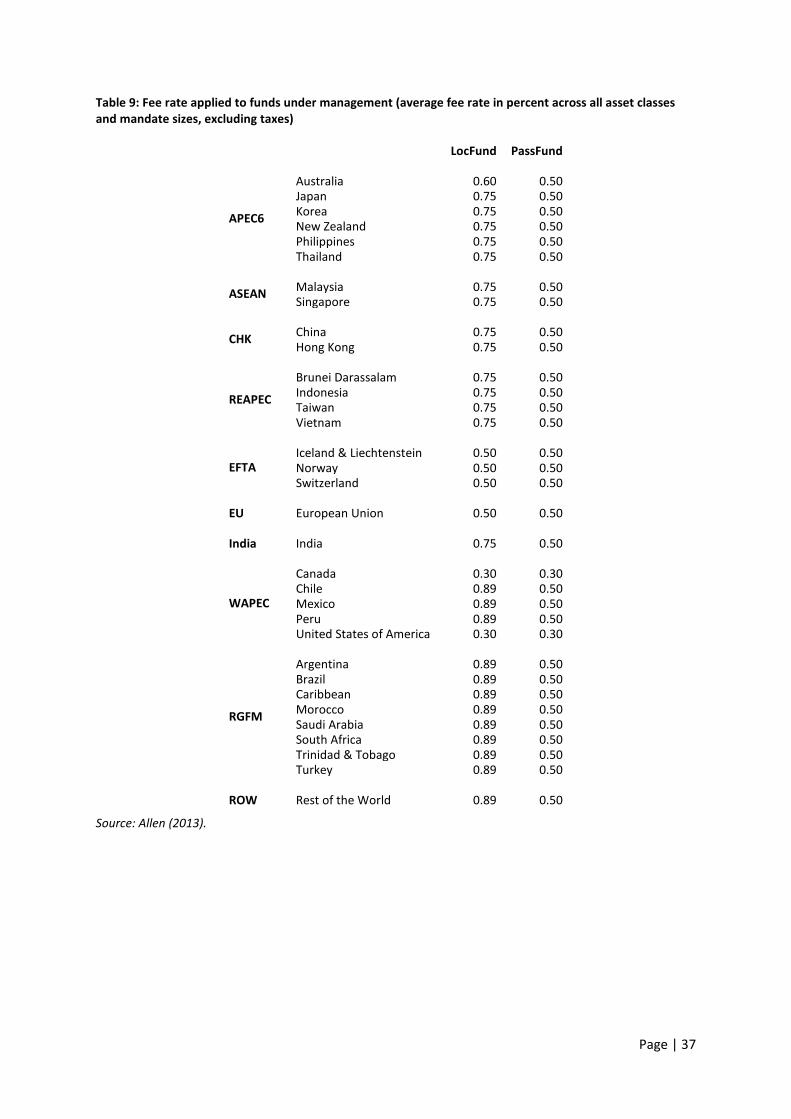
Page | 37
Table 9: Fee rate applied to funds under management (average fee rate in percent across all asset classes and mandate sizes, excluding taxes)
LocFund PassFund 2015 2015
APEC6
Australia 0.60 0.50 Japan 0.75 0.50 Korea 0.75 0.50 New Zealand 0.75 0.50 Philippines 0.75 0.50 Thailand 0.75 0.50
ASEAN Malaysia 0.75 0.50
Singapore 0.75 0.50
CHK China 0.75 0.50 Hong Kong 0.75 0.50
REAPEC
Brunei Darassalam 0.75 0.50 Indonesia 0.75 0.50 Taiwan 0.75 0.50 Vietnam 0.75 0.50
EFTA Iceland & Liechtenstein 0.50 0.50 Norway 0.50 0.50 Switzerland 0.50 0.50
EU European Union 0.50 0.50
India India 0.75 0.50
WAPEC
Canada 0.30 0.30 Chile 0.89 0.50 Mexico 0.89 0.50 Peru 0.89 0.50 United States of America 0.30 0.30
RGFM
Argentina 0.89 0.50 Brazil 0.89 0.50 Caribbean 0.89 0.50 Morocco 0.89 0.50 Saudi Arabia 0.89 0.50 South Africa 0.89 0.50 Trinidad & Tobago 0.89 0.50 Turkey 0.89 0.50
ROW Rest of the World 0.89 0.50
Source: Allen (2013).
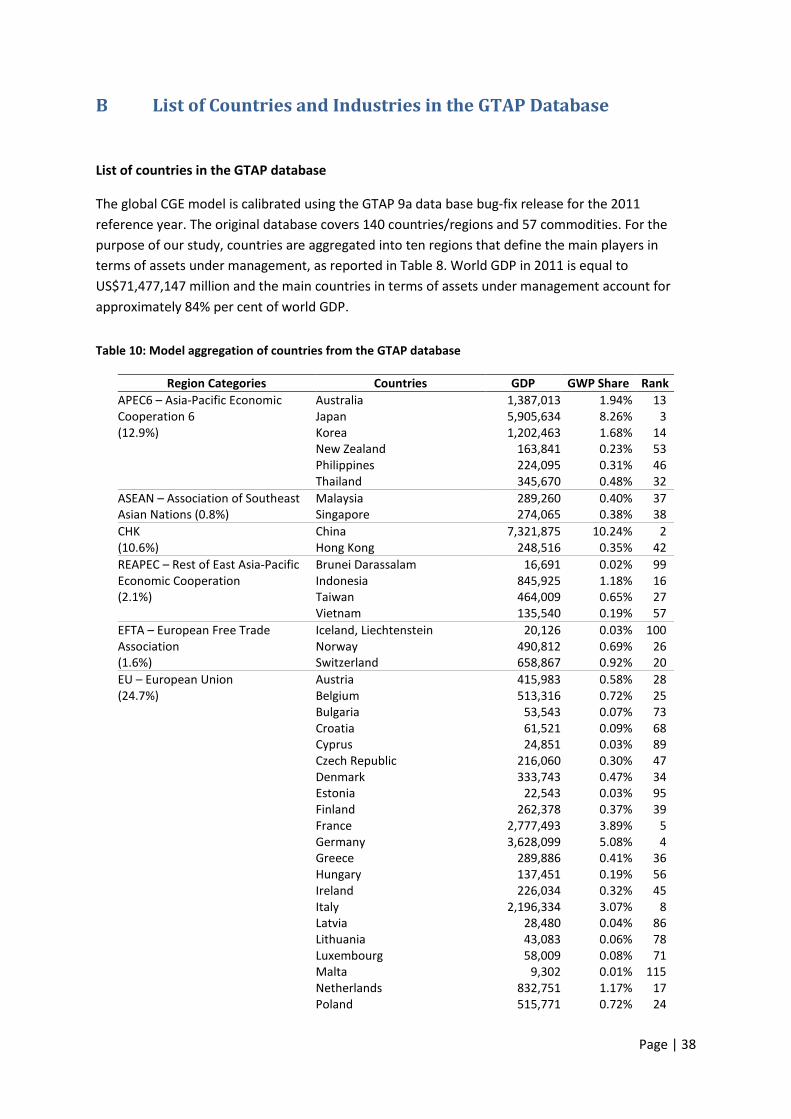
Page | 38
B List of Countries and Industries in the GTAP Database
List of countries in the GTAP database
The global CGE model is calibrated using the GTAP 9a data base bug-fix release for the 2011 reference year. The original database covers 140 countries/regions and 57 commodities. For the purpose of our study, countries are aggregated into ten regions that define the main players in terms of assets under management, as reported in Table 8. World GDP in 2011 is equal to US$71,477,147 million and the main countries in terms of assets under management account for approximately 84% per cent of world GDP.
Table 10: Model aggregation of countries from the GTAP database
Region Categories Countries GDP GWP Share Rank APEC6 – Asia-Pacific Economic Australia 1,387,013 1.94% 13 Cooperation 6 Japan 5,905,634 8.26% 3 (12.9%) Korea 1,202,463 1.68% 14 New Zealand 163,841 0.23% 53 Philippines 224,095 0.31% 46 Thailand 345,670 0.48% 32 ASEAN – Association of Southeast Malaysia 289,260 0.40% 37 Asian Nations (0.8%) Singapore 274,065 0.38% 38 CHK China 7,321,875 10.24% 2 (10.6%) Hong Kong 248,516 0.35% 42 REAPEC – Rest of East Asia-Pacific Brunei Darassalam 16,691 0.02% 99 Economic Cooperation Indonesia 845,925 1.18% 16 (2.1%) Taiwan 464,009 0.65% 27 Vietnam 135,540 0.19% 57 EFTA – European Free Trade Iceland, Liechtenstein 20,126 0.03% 100 Association Norway 490,812 0.69% 26 (1.6%) Switzerland 658,867 0.92% 20 EU – European Union Austria 415,983 0.58% 28 (24.7%) Belgium 513,316 0.72% 25 Bulgaria 53,543 0.07% 73 Croatia 61,521 0.09% 68 Cyprus 24,851 0.03% 89 Czech Republic 216,060 0.30% 47 Denmark 333,743 0.47% 34 Estonia 22,543 0.03% 95 Finland 262,378 0.37% 39 France 2,777,493 3.89% 5 Germany 3,628,099 5.08% 4 Greece 289,886 0.41% 36 Hungary 137,451 0.19% 56 Ireland 226,034 0.32% 45 Italy 2,196,334 3.07% 8 Latvia 28,480 0.04% 86 Lithuania 43,083 0.06% 78 Luxembourg 58,009 0.08% 71 Malta 9,302 0.01% 115 Netherlands 832,751 1.17% 17 Poland 515,771 0.72% 24
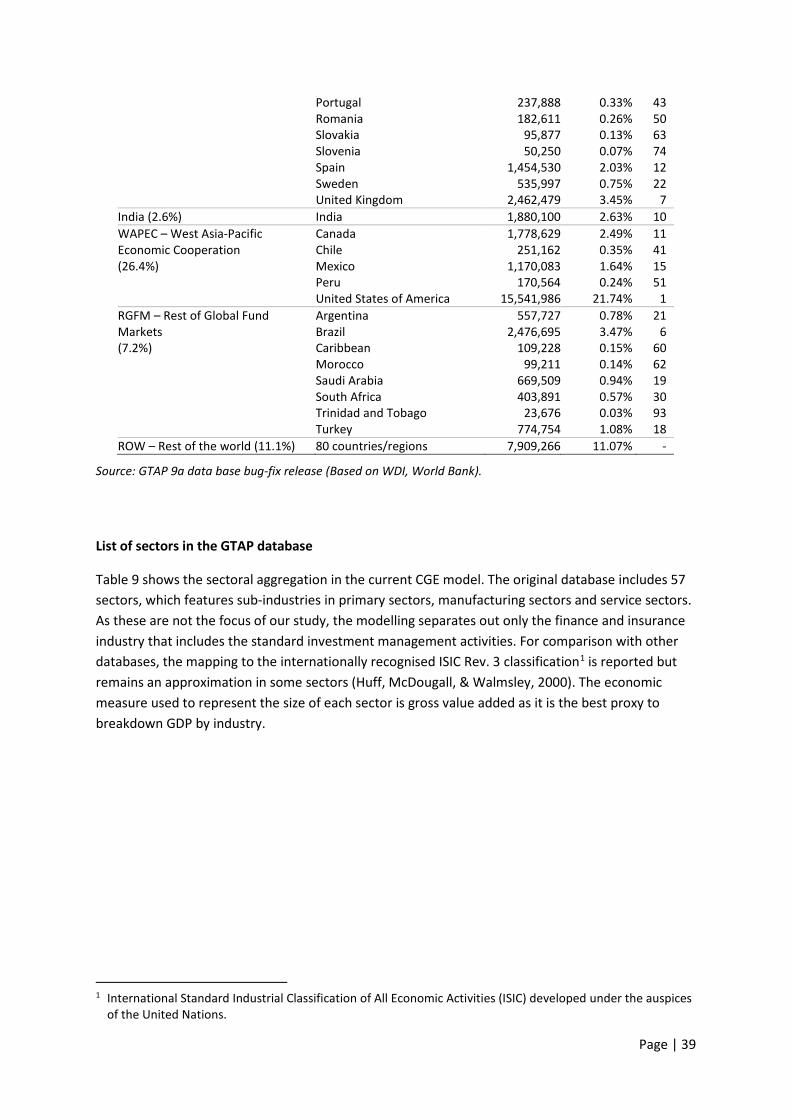
Page | 39
Portugal 237,888 0.33% 43 Romania 182,611 0.26% 50 Slovakia 95,877 0.13% 63 Slovenia 50,250 0.07% 74 Spain 1,454,530 2.03% 12 Sweden 535,997 0.75% 22 United Kingdom 2,462,479 3.45% 7 India (2.6%) India 1,880,100 2.63% 10 WAPEC – West Asia-Pacific Canada 1,778,629 2.49% 11 Economic Cooperation Chile 251,162 0.35% 41 (26.4%) Mexico 1,170,083 1.64% 15 Peru 170,564 0.24% 51 United States of America 15,541,986 21.74% 1 RGFM – Rest of Global Fund Argentina 557,727 0.78% 21 Markets Brazil 2,476,695 3.47% 6 (7.2%) Caribbean 109,228 0.15% 60 Morocco 99,211 0.14% 62 Saudi Arabia 669,509 0.94% 19 South Africa 403,891 0.57% 30 Trinidad and Tobago 23,676 0.03% 93 Turkey 774,754 1.08% 18 ROW – Rest of the world (11.1%) 80 countries/regions 7,909,266 11.07% -
Source: GTAP 9a data base bug-fix release (Based on WDI, World Bank).
List of sectors in the GTAP database
Table 9 shows the sectoral aggregation in the current CGE model. The original database includes 57 sectors, which features sub-industries in primary sectors, manufacturing sectors and service sectors. As these are not the focus of our study, the modelling separates out only the finance and insurance industry that includes the standard investment management activities. For comparison with other databases, the mapping to the internationally recognised ISIC Rev. 3 classification1 is reported but remains an approximation in some sectors (Huff, McDougall, & Walmsley, 2000). The economic measure used to represent the size of each sector is gross value added as it is the best proxy to breakdown GDP by industry.
1 International Standard Industrial Classification of All Economic Activities (ISIC) developed under the auspices
of the United Nations.
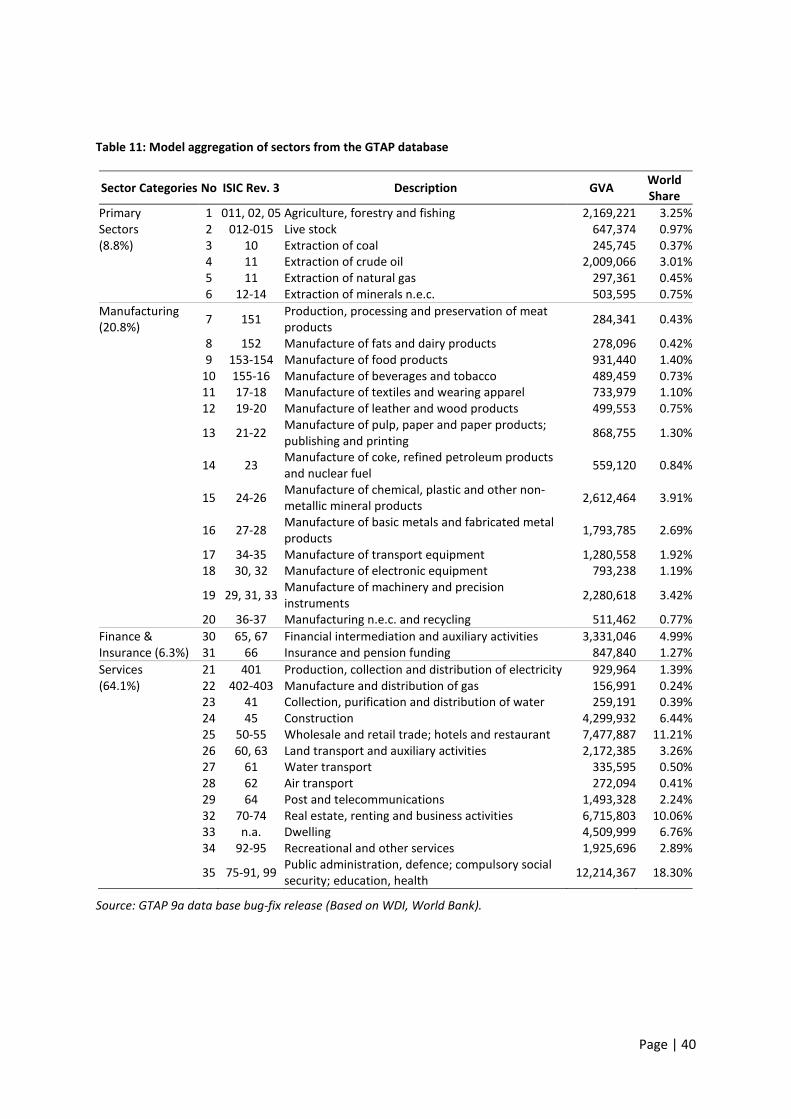
Page | 40
Table 11: Model aggregation of sectors from the GTAP database
Sector Categories No ISIC Rev. 3 Description GVA World Share
Primary 1 011, 02, 05 Agriculture, forestry and fishing 2,169,221 3.25% Sectors 2 012-015 Live stock 647,374 0.97% (8.8%) 3 10 Extraction of coal 245,745 0.37% 4 11 Extraction of crude oil 2,009,066 3.01% 5 11 Extraction of natural gas 297,361 0.45% 6 12-14 Extraction of minerals n.e.c. 503,595 0.75% Manufacturing (20.8%) 7 151 Production, processing and preservation of meat
products 284,341 0.43%
8 152 Manufacture of fats and dairy products 278,096 0.42% 9 153-154 Manufacture of food products 931,440 1.40% 10 155-16 Manufacture of beverages and tobacco 489,459 0.73% 11 17-18 Manufacture of textiles and wearing apparel 733,979 1.10% 12 19-20 Manufacture of leather and wood products 499,553 0.75%
13 21-22 Manufacture of pulp, paper and paper products; publishing and printing 868,755 1.30%
14 23 Manufacture of coke, refined petroleum products and nuclear fuel 559,120 0.84%
15 24-26 Manufacture of chemical, plastic and other non-metallic mineral products 2,612,464 3.91%
16 27-28 Manufacture of basic metals and fabricated metal products 1,793,785 2.69%
17 34-35 Manufacture of transport equipment 1,280,558 1.92% 18 30, 32 Manufacture of electronic equipment 793,238 1.19%
19 29, 31, 33 Manufacture of machinery and precision instruments 2,280,618 3.42%
20 36-37 Manufacturing n.e.c. and recycling 511,462 0.77% Finance & 30 65, 67 Financial intermediation and auxiliary activities 3,331,046 4.99% Insurance (6.3%) 31 66 Insurance and pension funding 847,840 1.27% Services 21 401 Production, collection and distribution of electricity 929,964 1.39% (64.1%) 22 402-403 Manufacture and distribution of gas 156,991 0.24% 23 41 Collection, purification and distribution of water 259,191 0.39% 24 45 Construction 4,299,932 6.44% 25 50-55 Wholesale and retail trade; hotels and restaurant 7,477,887 11.21% 26 60, 63 Land transport and auxiliary activities 2,172,385 3.26% 27 61 Water transport 335,595 0.50% 28 62 Air transport 272,094 0.41% 29 64 Post and telecommunications 1,493,328 2.24% 32 70-74 Real estate, renting and business activities 6,715,803 10.06% 33 n.a. Dwelling 4,509,999 6.76% 34 92-95 Recreational and other services 1,925,696 2.89%
35 75-91, 99 Public administration, defence; compulsory social security; education, health 12,214,367 18.30%
Source: GTAP 9a data base bug-fix release (Based on WDI, World Bank).