Embed Size (px)
Citation preview

© 2012 Coen Company, Inc. Page 1 of 28
Conversion of Tangential Fired Utility Furnaces from Oil to Gas Presented at
American Flame Research Committee Annual Meeting Officers Club
University of Utah, Salt Lake City Sept 5‐7 2012
By Steve Londerville and Mike McElroy
Coen Company, Inc.
Abstract This paper describes two utility boiler conversions adding natural gas firing capabilities to #6 oil fired boilers. Units 5 and 6 at PREPA’s South Coast Generating Station are tangentially-fired steam boilers with electrical generating capacities of 410 MW each. In 2011, both boilers were modified to fire natural gas only or combinations of natural gas and fuel oil. The boilers previously fired only fuel oil. Coen Company, Inc. (Coen) was contracted by LT Automation on behalf of Puerto Rico Electric Power Authority (PREPA) to supply necessary engineering services, equipment and commissioning for the gas conversion. Coen engineering services included CFD modeling to optimize air flow distribution and predict flame patterns in the furnace. A simulation code was written to predict fuel and air flows to all corners and elevation zones. A complete thermodynamic study was performed to evaluate the boiler heat absorption impact due to the gas conversion. Coen equipment included gas burners, local burner safety shut-off valves, boiler header skids, a main gas pressure regulating skid, and local control panels for the gas burners. The gas conversions on Units 5 and 6 were commissioned in April-May 2011. During commissioning, extensive field data was obtained and will be presented including settings for optimal emissions on both fuels. Data on the convective section of the boiler, due to predicted changes in boiler heat absorption profiles when firing gas will be presented including tube temperatures. Introduction Coen Company supplied natural gas burner equipment, boiler gas header piping modules, a main gas pressure reducing station, Burner Management System (BMS) logic, and engineering services for modifying PREPA’s South Coast Units 5 and 6 to burn natural gas. The existing oil firing capability was preserved. The new dual-fuel system allows selection of fuel (gas or oil) on a per burner basis, permitting co-firing of oil and gas in any combination between 100% gas and 100% oil.

© 2012 Coen Company, Inc. Page 2 of 28
Units 5 and 6 are similar tangential-fired (T-Fired), superheat/reheat, controlled circulation radiant boilers with balanced draft furnace operation. They are rated with a MCR (maximum continuous rating) main steam flow of 2,970,000 lb/hr at 1005ºF/2,620 psig at the superheater outlet with a corresponding reheat steam flow of 2,650,000 lb/hr at 1,005ºF. The boilers are also designed for a peak steam flow of 3,160,000 lb/hr at 1,005°F and 2,620 psig. The MCR and peak capacities correspond to approximately 410 MW electrical generation. The superheat (SH) and reheat (RH) steam temperature control point is 50% of the MCR load point. SH and RH outlet temperatures are controlled with fuel nozzle tilt, superheater and reheater attemperation, flue gas recirculation to the furnace hopper, and excess air. The burner arrangement is different for each unit. Unit 5 has six (6) burner elevations with four (4) tilting tangential burners per elevation for a total of twenty-four (24) burners. Unit 6 has four (4) burner elevations with four (4) tilting tangential burners per elevation for a total of sixteen (16) burners. Burners are ignited via sidewall horn-style igniters firing propane. The existing number of burners was maintained for the dual fuel conversion. The burners in each boiler had been previously modified to reduce particulate emissions when firing #6 oil. A significant feature of these modifications was the installation of larger flame stabilizers to promote more rapid combustion and burnout of the fuel. This characteristic was maintained in the new burner equipment. To support the design and implementation of the equipment, Coen performed several up-front engineering studies including:
A flow modeling study to evaluate the distribution of combustion air and uniformity of combustion in the boiler
A boiler impact analysis to evaluate the thermal performance of the boiler when firing natural gas
An audit of the BMS and controls to evaluate compliance with the current Boiler and Combustion Systems Hazards Code (NFPA 85)
In support of the general design and commissioning, predictive code was created to predict flows to all levels and corners. This code was also used to design the gas piping for uniform distribution of fuel as shown in Figure 1 for Unit 5.

© 2012 Coen Company, Inc. Page 3 of 28
Figure 1: PREPA Unit 5 showing new gas piping

© 2012 Coen Company, Inc. Page 4 of 28
CFD Results of the air flow Distribution A CFD study was conducted on both units predicting minimal mal-distribution of air flow to the four corners of less than 0.8%. See Figures 2 and 3. It should be noted that uniform air distribution to the corners in some installations requires modifications such as baffles or perforated plate. For the PREPA boilers, no air-side modifications were required.
Figure 2: General air ducting arrangement

© 2012 Coen Company, Inc. Page 5 of 28
Figure 3: Path lines of air flow to 2 corners Burner Modifications Modifications to Main Burners The main burners were retrofitted with the following equipment:
Gas fuel injectors (two per burner on Unit 5; four per burner on Unit 6).
Gas fuel manifold and windbox piping. Fuel to the gas injectors on Unit 5 was supplied from a manifold located inside the windbox, whereas the gas injectors on Unit 6 were supplied from a manifold external to the windbox. A 6” gas supply piping connection external to the windbox was provided for each burner on Unit 5, while 8” gas supply connections were provided for Unit 6 burners.
Tilting burner gas nozzles or “buckets” (two per burner on Unit 5; four per burner on Unit 6) were designed and installed to channel the gas fuel from the gas fuel injectors into the furnace. These nozzles included pivot pins and sockets for mounting to the windbox and new tilt arms were provided for connection to the existing burner tilt mechanisms. The gas nozzles on Unit 5, located within the existing fuel-air compartments, added twelve (12) new tilting nozzles to the existing burner column in each furnace corner. On Unit 6 there were sixteen (16) tilting gas nozzles added per corner: eight (8) new nozzle locations were added
© 2012 Coen Company, Inc. Page 6 of 28
to the fuel air compartments, and eight (8) existing auxiliary air nozzles were replaced with new gas nozzles.
Tilting oil burner nozzles with flame stabilizers were designed and installed. These components were designed to accommodate the new adjacent gas nozzles. The new flame stabilizer provided flame stabilization for both the gas and oil fuels.
ISCAN® flame scanners (one per burner) to detect the main flame when firing fuel oil or natural gas. These main flame scanners were wired to new local control panels (8 panels per boiler).
The windbox dampers that control combustion air to each of the corner compartments were converted from simple open-close operation to fully modulating operation. This required installation of new I/P transducers (positioners) for the damper drives to allow the dampers to be driven to variable positions as dictated by the DCS. This new functionality was required to allow positioning of these dampers as a function of the fuel being fired (gas or oil) in a particular burner and other parameters as determined during commissioning.
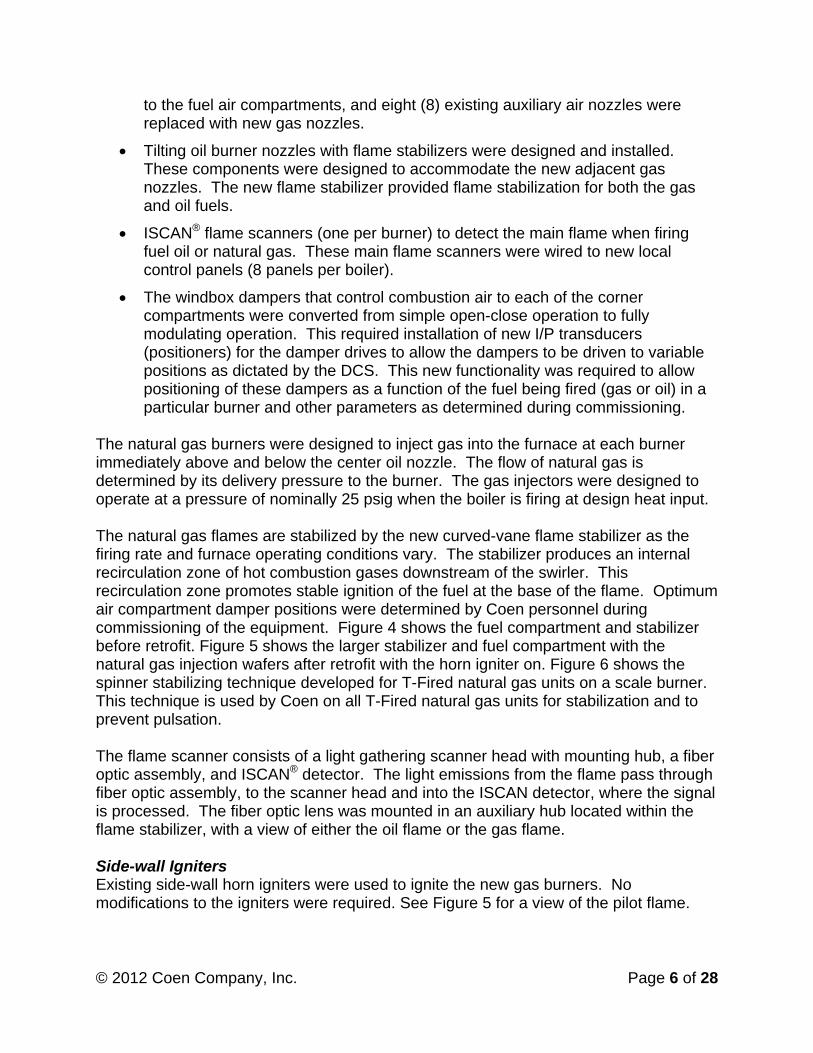
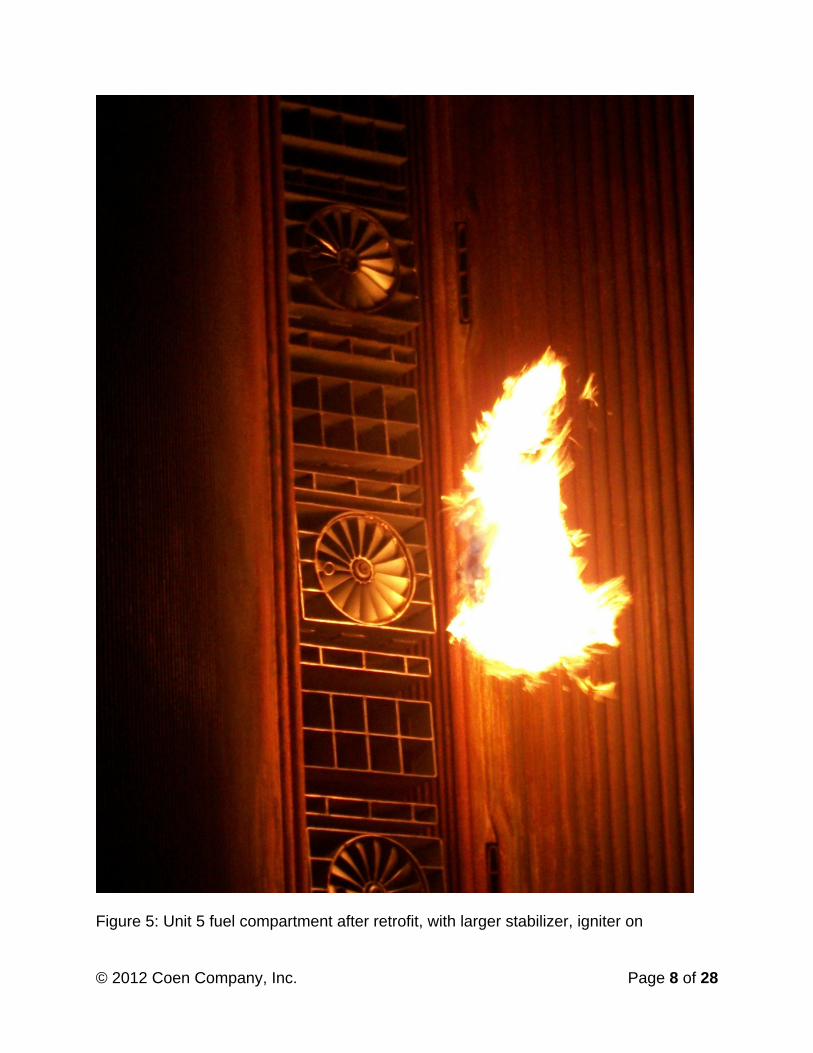
The natural gas burners were designed to inject gas into the furnace at each burner immediately above and below the center oil nozzle. The flow of natural gas is determined by its delivery pressure to the burner. The gas injectors were designed to operate at a pressure of nominally 25 psig when the boiler is firing at design heat input. The natural gas flames are stabilized by the new curved-vane flame stabilizer as the firing rate and furnace operating conditions vary. The stabilizer produces an internal recirculation zone of hot combustion gases downstream of the swirler. This recirculation zone promotes stable ignition of the fuel at the base of the flame. Optimum air compartment damper positions were determined by Coen personnel during commissioning of the equipment. Figure 4 shows the fuel compartment and stabilizer before retrofit. Figure 5 shows the larger stabilizer and fuel compartment with the natural gas injection wafers after retrofit with the horn igniter on. Figure 6 shows the spinner stabilizing technique developed for T-Fired natural gas units on a scale burner. This technique is used by Coen on all T-Fired natural gas units for stabilization and to prevent pulsation. The flame scanner consists of a light gathering scanner head with mounting hub, a fiber optic assembly, and ISCAN® detector. The light emissions from the flame pass through fiber optic assembly, to the scanner head and into the ISCAN detector, where the signal is processed. The fiber optic lens was mounted in an auxiliary hub located within the flame stabilizer, with a view of either the oil flame or the gas flame. Side-wall Igniters Existing side-wall horn igniters were used to ignite the new gas burners. No modifications to the igniters were required. See Figure 5 for a view of the pilot flame.

© 2012 Coen Company, Inc. Page 7 of 28
Figure 4: Unit 5 fuel compartment before retrofit, with smaller stabilizer
© 2012 Coen Company, Inc. Page 8 of 28
Figure 5: Unit 5 fuel compartment after retrofit, with larger stabilizer, igniter on
© 2012 Coen Company, Inc. Page 9 of 28
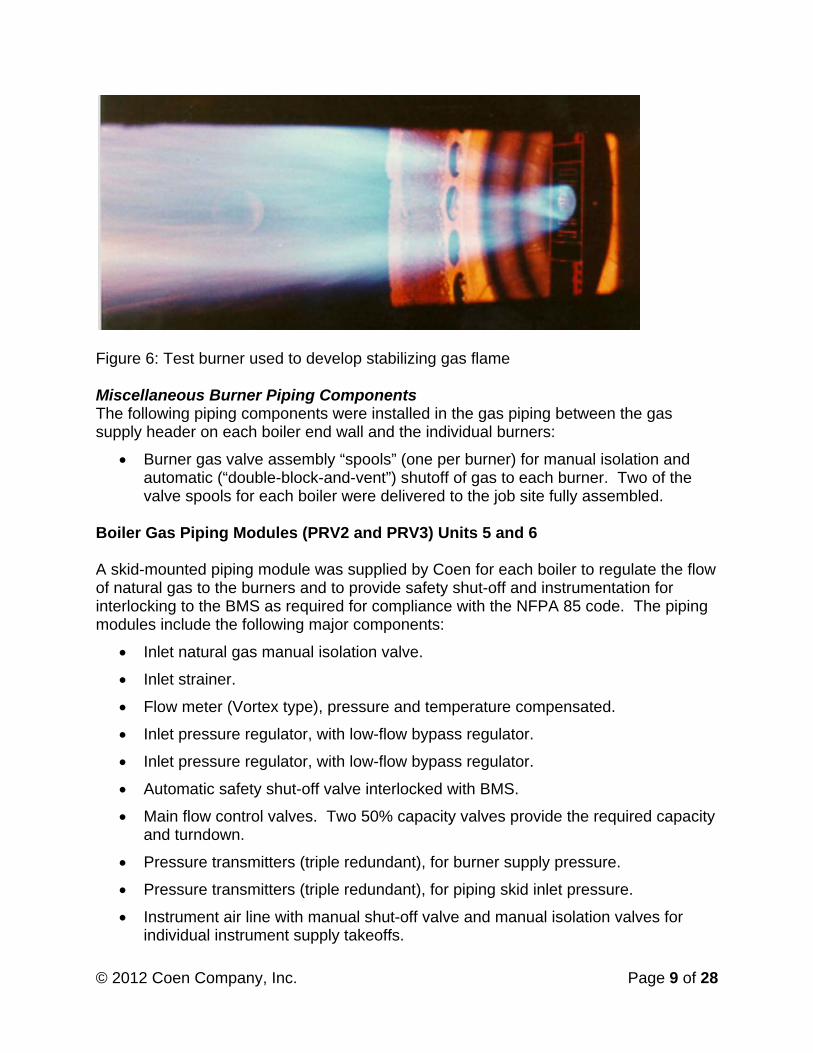
Figure 6: Test burner used to develop stabilizing gas flame Miscellaneous Burner Piping Components The following piping components were installed in the gas piping between the gas supply header on each boiler end wall and the individual burners:
Burner gas valve assembly “spools” (one per burner) for manual isolation and automatic (“double-block-and-vent”) shutoff of gas to each burner. Two of the valve spools for each boiler were delivered to the job site fully assembled.
Boiler Gas Piping Modules (PRV2 and PRV3) Units 5 and 6 A skid-mounted piping module was supplied by Coen for each boiler to regulate the flow of natural gas to the burners and to provide safety shut-off and instrumentation for interlocking to the BMS as required for compliance with the NFPA 85 code. The piping modules include the following major components:
Inlet natural gas manual isolation valve.
Inlet strainer.
Flow meter (Vortex type), pressure and temperature compensated.
Inlet pressure regulator, with low-flow bypass regulator.
Inlet pressure regulator, with low-flow bypass regulator.
Automatic safety shut-off valve interlocked with BMS.
Main flow control valves. Two 50% capacity valves provide the required capacity and turndown.
Pressure transmitters (triple redundant), for burner supply pressure.
Pressure transmitters (triple redundant), for piping skid inlet pressure.
Instrument air line with manual shut-off valve and manual isolation valves for individual instrument supply takeoffs.
© 2012 Coen Company, Inc. Page 10 of 28
Junction box for termination of electrical wiring. Devices on the piping skids were pre-wired to the junction box.
The piping module was designed to be bolted down on customer-provided foundation. Inlet and outlet flange connections were 16-inch, and 24-inch pipe sizes (150# RF flanged), respectively. Plant Gas Pressure Reducing Station (PRV1) A skid-mounted piping module was supplied to regulate the pressure of natural gas supplied to the Unit 5 and Unit 6 Boiler Gas Piping Modules. The Plant Pressure Reducing Station includes the following major components:
Multiple path pressure regulation arrangement to achieve the wide turndown in flow. Three (3) pressure regulating paths were arranged in parallel: two main pressure regulation paths and a low-flow pressure regulation path. Each path had inlet and outlet manual isolation valves.
Each pressure regulation path contained two pilot-operated pressure regulating valves operating in a “working monitor” series regulation arrangement.
Inlet and outlet pressure and temperature transmitters. Local pressure and temperature gauges were also provided.
The piping module was also designed to be bolted down on customer-provided foundation. Flange connections are 12-inch at the inlet (600# RF) and 20-inch (150# RF) at the outlet. The skid was self-contained in that pressure regulation is maintained by pressure setpoints that are set locally at the skid. No external control input signals were required. During normal operation, the two regulators in each pressure regulating flow path continuously work to take two pressure cuts. The upstream regulator is set to maintain a prescribed intermediate step-down pressure between the two regulators, while the downstream regulator is set to maintain the prescribed skid outlet pressure. The bypass pressure regulators control gas discharge pressure at low gas flow rates (such as startup of the first boiler) when the flow rate is less than the practical turndown range for the main regulators. The bypass regulators may be isolated when the flow rate increases to within the stable control range of the main regulator. The pilots on each regulator valve are set to allow one regulator on each flow path to maintain control of the outlet pressure in the event of a failure of the other regulator. In the event that the downstream regulator fails open or partially open, the associated upstream regulator will control outlet pressure at a pressure determined by the set point on its pilot. In the event that the upstream regulator fails open or partially open, the downstream regulator will maintain the outlet pressure. In the event that both regulators

© 2012 Coen Company, Inc. Page 11 of 28
fail open, safety relief valves installed in piping downstream of the skid will lift to prevent over pressurization of downstream equipment. Burner Management System (BMS) and Controls Coen supplied the following engineering services and equipment related to the BMS:
Engineering and recommendations to update the existing logic and equipment in order to add gas firing and to meet current NFPA 85 code requirements when firing gas or oil. This included an NFPA audit of the existing oil fuel supply system and BMS interlocked devices, preparation of wiring diagrams for supplied equipment, and preparation of input/output (I/O) lists for use by others.
BMS Sequence of Operation.
Panels for local burner start/stop and burner status indication (eight panels per boiler).
I/P transducers (positioners) for individual burner air compartment dampers, to allow positioning of these dampers from the DCS.
Flame scanners for proving main flames when firing oil or gas (see Burner Modifications above).
Gas Commissioning Overview
Objectives The primary objectives of the gas commissioning tests were to:
Confirm the performance of supplied equipment. Demonstrate satisfactory operation of the boilers when firing 100% gas and when
co-firing gas and fuel oil. It was intended that the boilers could be operated with any combination of fuel from 100% gas to 100% oil.
Identify any limitations to boiler operation that would result from the substitution of fuel oil with gas. One specific concern was the potential for high tube metal temperatures in the convective section of the boiler, due to predicted changes in boiler heat absorption profiles when firing gas.
Define optimum combustion system configurations that would minimize stack emissions without compromising boiler efficiency or performance. Of particular interest was minimizing NOx emissions, while maintaining low furnace excess oxygen and low emissions of CO, PM and other regulated emissions.
Develop operating curves and ranges for various combustion system parameters for use in programming boiler combustion controls.
Familiarize PREPA operating personnel with new procedures associated with gas firing.
© 2012 Coen Company, Inc. Page 12 of 28
Gas Commissioning Test Procedure Coen prepared test matrices which identified for each commissioning test the boiler load, gas and oil firing configuration, and the estimated gas consumption and duration. These test matrices served as a basis for coordinating the testing with the PREPA load dispatcher and the LNG plant supplying gas to PREPA. Due to the configuration of the LNG plant at the time of the tests, the gas flow rates supplied to PREPA during a daily period were restricted to a relatively narrow range. As a result, the commissioning tests were performed incrementally with multiple days required to evaluate specific firing configurations over the boiler load range. During the tests, control room parameters were recorded from the DCS screens and “outside” data was obtained to document burner front conditions and other parameters as needed. In parallel, stack measurements (NO/NO2, O2, CO2, CO) were made by the PREPA Environmental Department. In addition, flue gas measurements (NO, O2, CO2, CO) were obtained at the economizer outlet by the PREPA Performance Group. During the gas burner retrofit outage, PREPA installed thermocouples to monitor selected boiler convective pass tube and header metal temperatures. Thermocouple outputs were displayed in the DCS and monitored by Coen. A representative from the boiler OEM was also present during the gas commissioning to document and analyze the thermocouple data. For the most part, burner controls (fuel ratio, air dampers, windbox/furnace dP, tilts, etc.) were controlled manually during the testing when firing gas. To assist boiler operators in matching the burner heat inputs when co-firing gas and oil, Coen provided curves relating oil and gas header pressures. It is intended that the gas/oil proportions will be controlled automatically by the fuel ratio controller when the DCS is fully calibrated.
Coen Equipment Performance
Burners The modified burners performed as expected in the oil-only, gas-only and across the spectrum of dual-fuel modes. The flames were stable, well-controlled and delivered complete combustion with low excess air. The gas pressure readings at the burners were very uniform from burner to burner indicating good gas distribution from the supply headers to the burners as predicted in the Coen models. At high loads, variation in gas pressures among the burners were within +/- 2-3% on Unit 5 and +/- 1% on Unit 6, as evidenced by pressure gauge readings immediately downstream of the burner double block and vent valves. These variations correspond to differences in gas flow among the burners of 1.5% or less. Unlike oil flames that are very luminous, gas flames tend to be more transparent and are often not visible, particularly when oil flames are present in the furnace. Operating the burners in a “staged combustion” mode for stack emissions control, which diverts
© 2012 Coen Company, Inc. Page 13 of 28
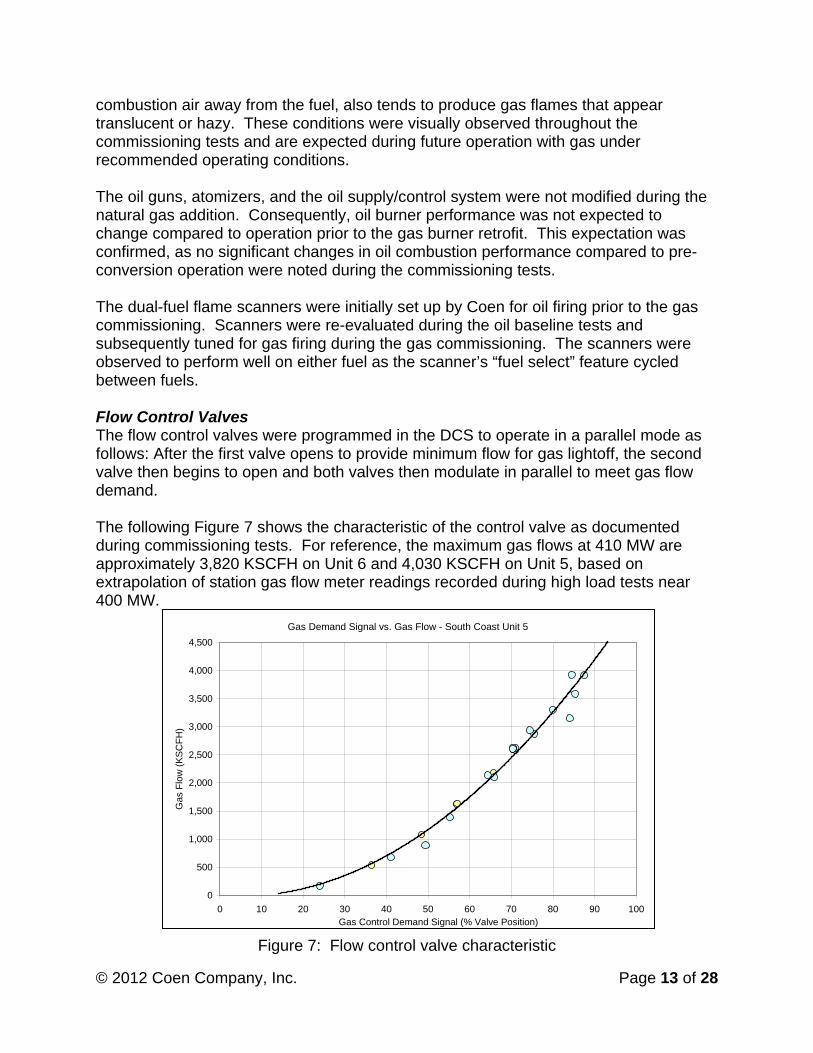
combustion air away from the fuel, also tends to produce gas flames that appear translucent or hazy. These conditions were visually observed throughout the commissioning tests and are expected during future operation with gas under recommended operating conditions. The oil guns, atomizers, and the oil supply/control system were not modified during the natural gas addition. Consequently, oil burner performance was not expected to change compared to operation prior to the gas burner retrofit. This expectation was confirmed, as no significant changes in oil combustion performance compared to pre-conversion operation were noted during the commissioning tests. The dual-fuel flame scanners were initially set up by Coen for oil firing prior to the gas commissioning. Scanners were re-evaluated during the oil baseline tests and subsequently tuned for gas firing during the gas commissioning. The scanners were observed to perform well on either fuel as the scanner’s “fuel select” feature cycled between fuels. Flow Control Valves The flow control valves were programmed in the DCS to operate in a parallel mode as follows: After the first valve opens to provide minimum flow for gas lightoff, the second valve then begins to open and both valves then modulate in parallel to meet gas flow demand. The following Figure 7 shows the characteristic of the control valve as documented during commissioning tests. For reference, the maximum gas flows at 410 MW are approximately 3,820 KSCFH on Unit 6 and 4,030 KSCFH on Unit 5, based on extrapolation of station gas flow meter readings recorded during high load tests near 400 MW.
Figure 7: Flow control valve characteristic
Gas Demand Signal vs. Gas Flow - South Coast Unit 5
0
500
1,000
1,500
2,000
2,500
3,000
3,500
4,000
4,500
0 10 20 30 40 50 60 70 80 90 100Gas Control Demand Signal (% Valve Position)
Gas
Flo
w (
KS
CF
H)
© 2012 Coen Company, Inc. Page 14 of 28
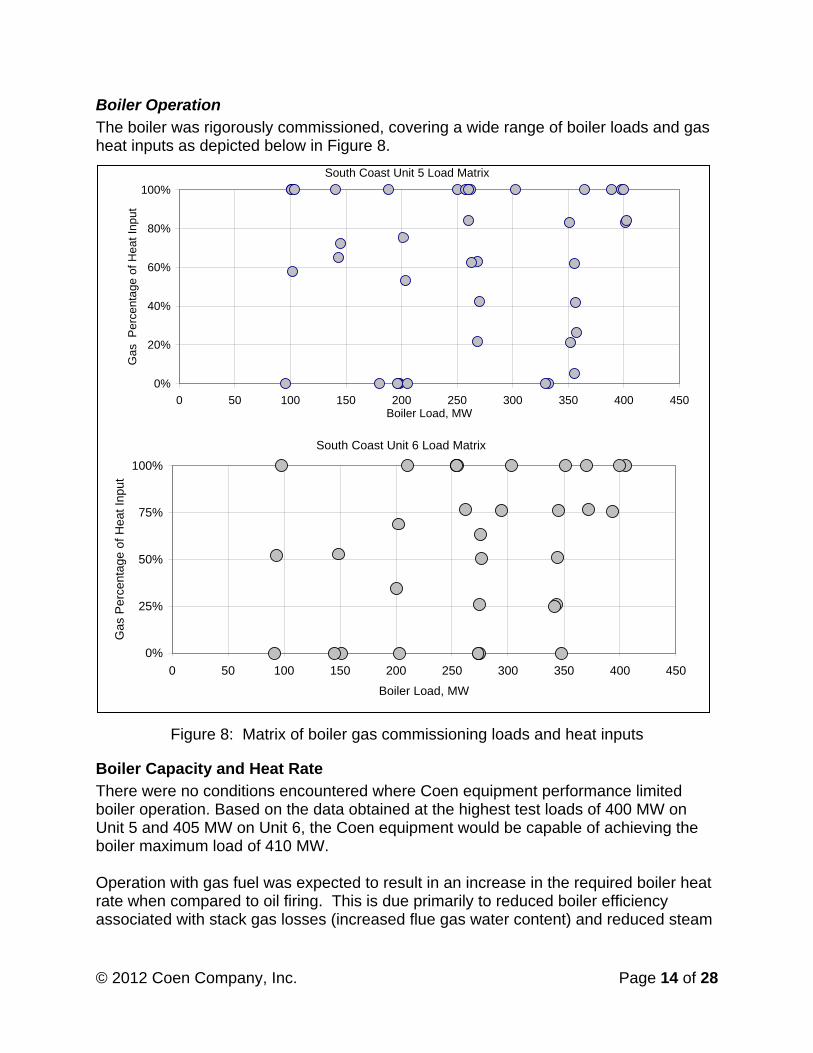
Boiler Operation The boiler was rigorously commissioned, covering a wide range of boiler loads and gas heat inputs as depicted below in Figure 8.
Figure 8: Matrix of boiler gas commissioning loads and heat inputs
Boiler Capacity and Heat Rate
There were no conditions encountered where Coen equipment performance limited boiler operation. Based on the data obtained at the highest test loads of 400 MW on Unit 5 and 405 MW on Unit 6, the Coen equipment would be capable of achieving the boiler maximum load of 410 MW. Operation with gas fuel was expected to result in an increase in the required boiler heat rate when compared to oil firing. This is due primarily to reduced boiler efficiency associated with stack gas losses (increased flue gas water content) and reduced steam
South Coast Unit 5 Load Matrix
0%
20%
40%
60%
80%
100%
0 50 100 150 200 250 300 350 400 450Boiler Load, MW
Gas
Per
cent
age
of H
eat
Inpu
t
South Coast Unit 6 Load Matrix
0%
25%
50%
75%
100%
0 50 100 150 200 250 300 350 400 450
Boiler Load, MW
Ga
s P
erc
enta
ge
of
He
at I
np
ut
© 2012 Coen Company, Inc. Page 15 of 28
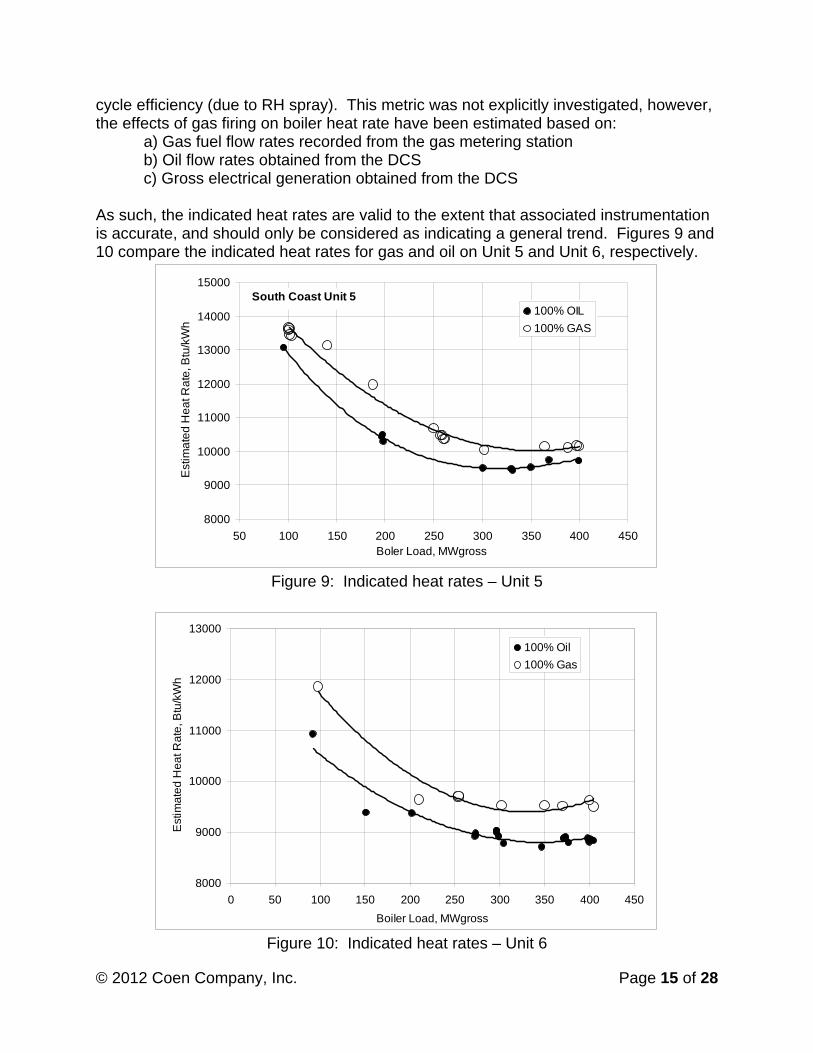
cycle efficiency (due to RH spray). This metric was not explicitly investigated, however, the effects of gas firing on boiler heat rate have been estimated based on:
a) Gas fuel flow rates recorded from the gas metering station b) Oil flow rates obtained from the DCS c) Gross electrical generation obtained from the DCS
As such, the indicated heat rates are valid to the extent that associated instrumentation is accurate, and should only be considered as indicating a general trend. Figures 9 and 10 compare the indicated heat rates for gas and oil on Unit 5 and Unit 6, respectively.
Figure 9: Indicated heat rates – Unit 5
Figure 10: Indicated heat rates – Unit 6
8000
9000
10000
11000
12000
13000
14000
15000
50 100 150 200 250 300 350 400 450Boler Load, MWgross
Est
ima
ted
He
at R
ate
, Btu
/kW
h
100% OIL
100% GAS
South Coast Unit 5
8000
9000
10000
11000
12000
13000
0 50 100 150 200 250 300 350 400 450
Boiler Load, MWgross
Est
ima
ted
He
at R
ate
, Btu
/kW
h
100% Oil
100% Gas
© 2012 Coen Company, Inc. Page 16 of 28
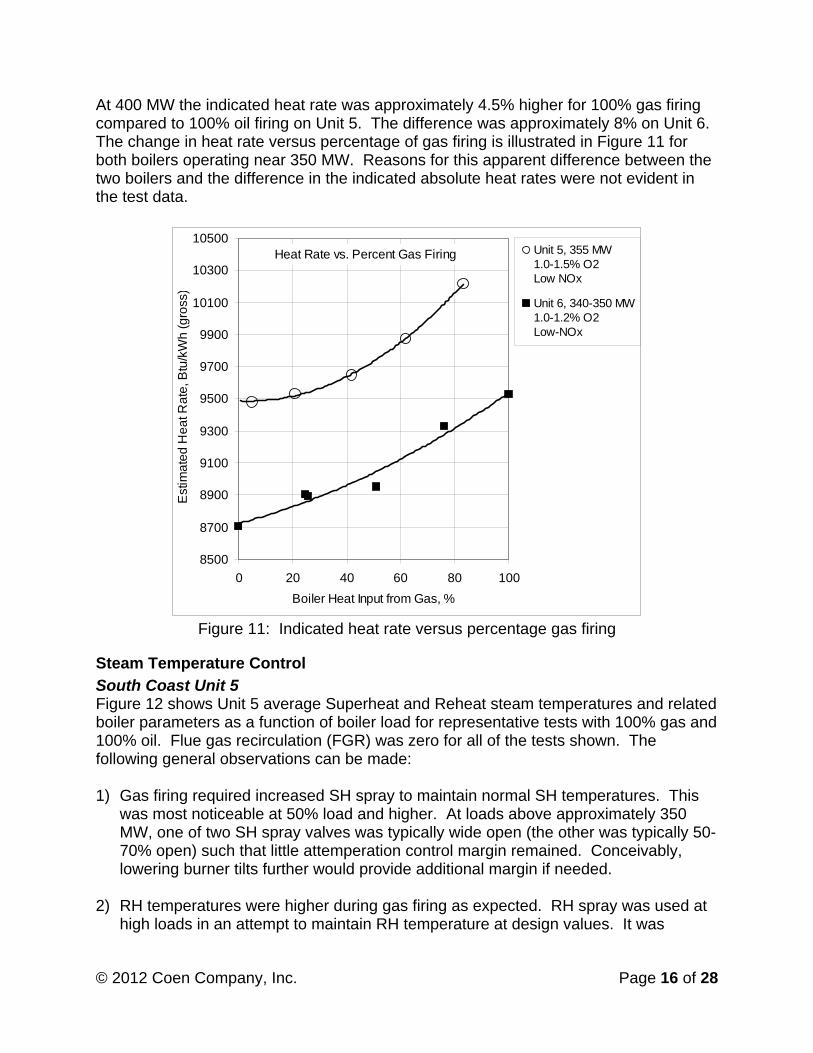
At 400 MW the indicated heat rate was approximately 4.5% higher for 100% gas firing compared to 100% oil firing on Unit 5. The difference was approximately 8% on Unit 6. The change in heat rate versus percentage of gas firing is illustrated in Figure 11 for both boilers operating near 350 MW. Reasons for this apparent difference between the two boilers and the difference in the indicated absolute heat rates were not evident in the test data.
Figure 11: Indicated heat rate versus percentage gas firing
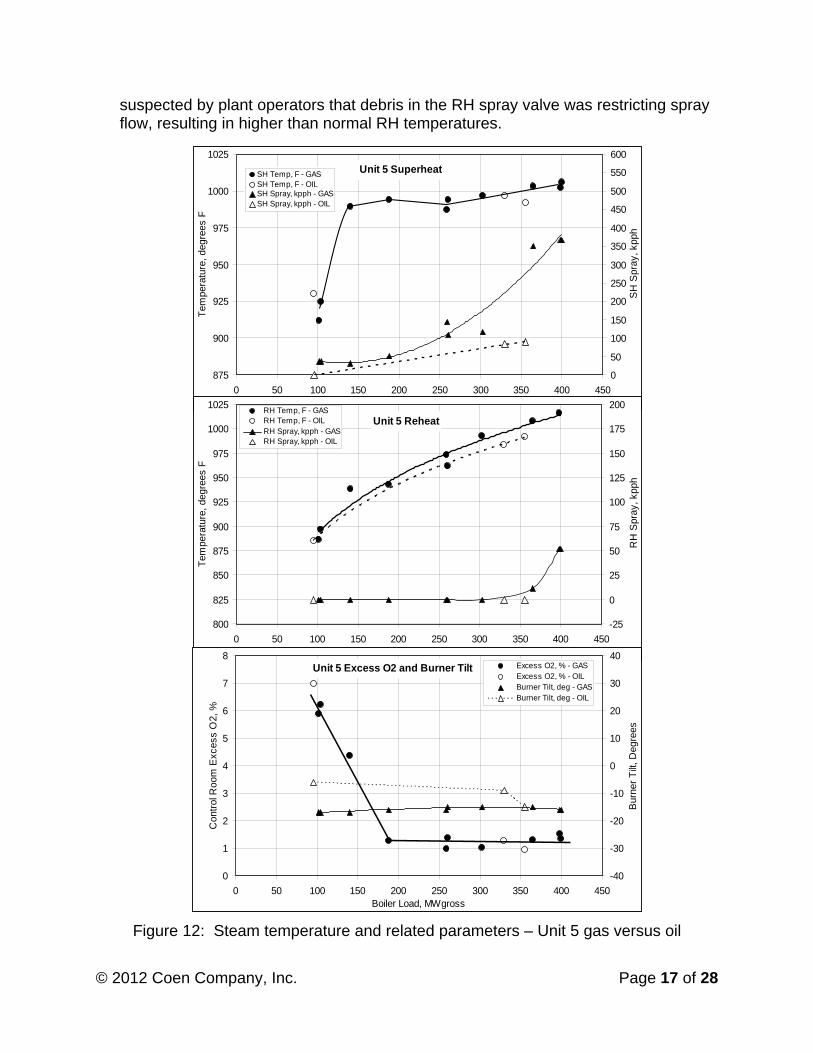
Steam Temperature Control
South Coast Unit 5 Figure 12 shows Unit 5 average Superheat and Reheat steam temperatures and related boiler parameters as a function of boiler load for representative tests with 100% gas and 100% oil. Flue gas recirculation (FGR) was zero for all of the tests shown. The following general observations can be made: 1) Gas firing required increased SH spray to maintain normal SH temperatures. This
was most noticeable at 50% load and higher. At loads above approximately 350 MW, one of two SH spray valves was typically wide open (the other was typically 50-70% open) such that little attemperation control margin remained. Conceivably, lowering burner tilts further would provide additional margin if needed.
2) RH temperatures were higher during gas firing as expected. RH spray was used at
high loads in an attempt to maintain RH temperature at design values. It was
Heat Rate vs. Percent Gas Firing
8500
8700
8900
9100
9300
9500
9700
9900
10100
10300
10500
0 20 40 60 80 100
Boiler Heat Input from Gas, %
Est
ima
ted
He
at R
ate
, Btu
/kW
h (g
ross
)
Unit 5, 355 MW1.0-1.5% O2Low NOx
Unit 6, 340-350 MW1.0-1.2% O2Low-NOx
© 2012 Coen Company, Inc. Page 17 of 28
suspected by plant operators that debris in the RH spray valve was restricting spray flow, resulting in higher than normal RH temperatures.
Figure 12: Steam temperature and related parameters – Unit 5 gas versus oil
Unit 5 Superheat
875
900
925
950
975
1000
1025
0 50 100 150 200 250 300 350 400 450Boiler Load, MWgross
Tem
pera
ture
, deg
rees
F
0
50
100
150
200
250
300
350
400
450
500
550
600
SH
Spr
ay, k
pph
SH Temp, F - GASSH Temp, F - OILSH Spray, kpph - GASSH Spray, kpph - OIL
Unit 5 Reheat
800
825
850
875
900
925
950
975
1000
1025
0 50 100 150 200 250 300 350 400 450Boiler Load, MWgross
Tem
pera
ture
, deg
rees
F
-25
0
25
50
75
100
125
150
175
200
RH
Spr
ay, k
pph
RH Temp, F - GASRH Temp, F - OILRH Spray, kpph - GASRH Spray, kpph - OIL
Unit 5 Excess O2 and Burner Tilt
0
1
2
3
4
5
6
7
8
0 50 100 150 200 250 300 350 400 450Boiler Load, MWgross
Con
trol
Roo
m E
xces
s O
2, %
-40
-30
-20
-10
0
10
20
30
40
Bur
ner
Tilt
, Deg
rees
Excess O2, % - GASExcess O2, % - OILBurner Tilt, deg - GASBurner Tilt, deg - OIL

© 2012 Coen Company, Inc. Page 18 of 28
The variation in steam temperatures and attemperation rates versus proportion of gas fuel at a fixed load of 355 MW is shown in Figure 13. The maximum thermocouple reading for the Superheater Horizontal/Inlet-Outlet Header (“SH5”) is also included in the plot.
Figure 13: Steam temps and attemperation rates versus gas fraction – Unit 5 South Coast Unit 6 The steam temperature behavior of Unit 6 is similar overall to Unit 5 as evidenced by comparing the above figures with corresponding ones for Unit 6 below.
Steam Temperature Parameters versus Gas FractionSouth Coast Unit 5
355-365 MW, 0.8-1.5% Excess O2, 0% FGR
700
720
740
760
780
800
820
840
860
880
900
920
940
960
980
1000
1020
0.0 0.2 0.4 0.6 0.8 1.0
Fraction of Boiler Heat Input from Gas
Te
mp
era
ture
, F
0
50
100
150
200
250
300
350
400
Atte
mp
era
tion
Sp
ray,
kp
ph
SH Temp
RH Temp
SH5 Metal Temp
SH Spray, kpph
RH Spray, kpph
© 2012 Coen Company, Inc. Page 19 of 28
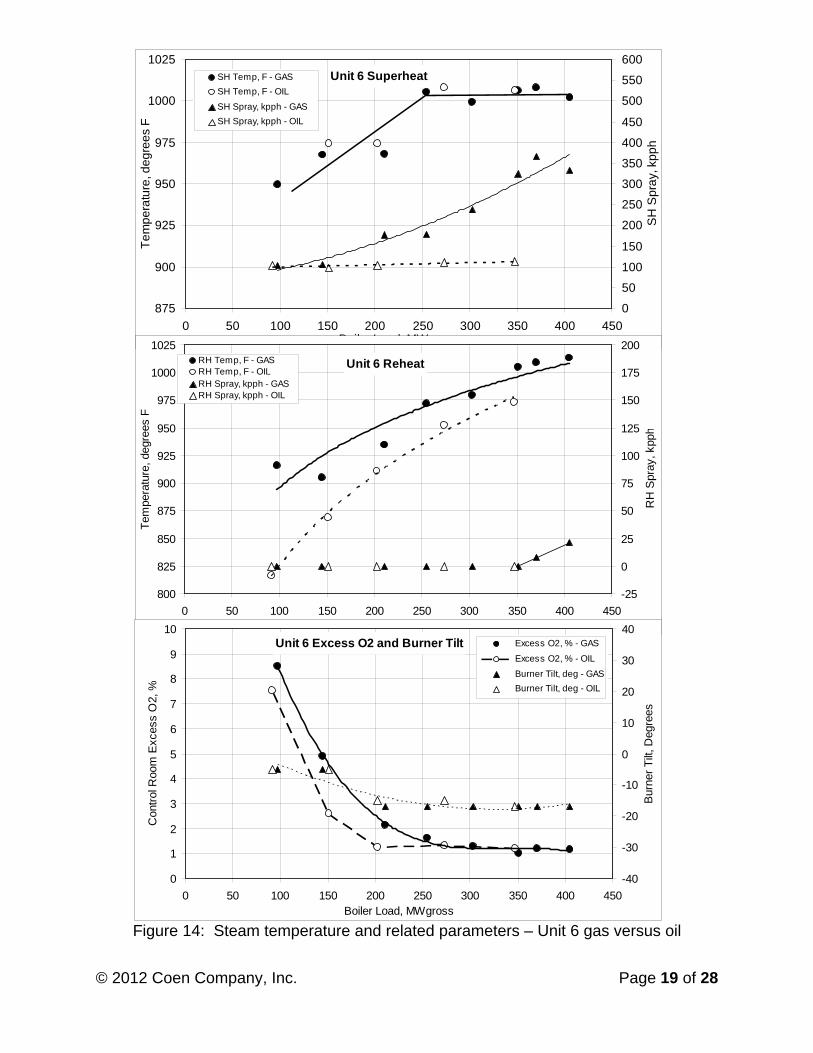
Figure 14: Steam temperature and related parameters – Unit 6 gas versus oil
Unit 6 Superheat
875
900
925
950
975
1000
1025
0 50 100 150 200 250 300 350 400 450Boiler Load, MWgross
Te
mp
era
ture
, de
gre
es
F
0
50
100
150
200
250
300
350
400
450
500
550
600
SH
Sp
ray,
kp
ph
SH Temp, F - GAS
SH Temp, F - OIL
SH Spray, kpph - GAS
SH Spray, kpph - OIL
Unit 6 Reheat
800
825
850
875
900
925
950
975
1000
1025
0 50 100 150 200 250 300 350 400 450Boiler Load, MWgross
Tem
pera
ture
, deg
rees
F
-25
0
25
50
75
100
125
150
175
200
RH
Spr
ay, k
pph
RH Temp, F - GASRH Temp, F - OILRH Spray, kpph - GASRH Spray, kpph - OIL
Unit 6 Excess O2 and Burner Tilt
0
1
2
3
4
5
6
7
8
9
10
0 50 100 150 200 250 300 350 400 450Boiler Load, MWgross
Con
trol
Roo
m E
xces
s O
2, %
-40
-30
-20
-10
0
10
20
30
40
Bur
ner
Tilt
, Deg
rees
Excess O2, % - GAS
Excess O2, % - OIL
Burner Tilt, deg - GAS
Burner Tilt, deg - OIL

© 2012 Coen Company, Inc. Page 20 of 28
Figure 15: Steam temps and attemperation rates versus gas fraction – Unit 6
Similar to Unit 5, when firing gas the SH spray on Unit 6 increased (compared to oil firing) to control final SH temperature as the boiler load increased, or as the proportion of gas firing increased at a given load. Likewise, RH temperatures were higher when firing gas and RH spray was required at high loads to control final RH temperature.
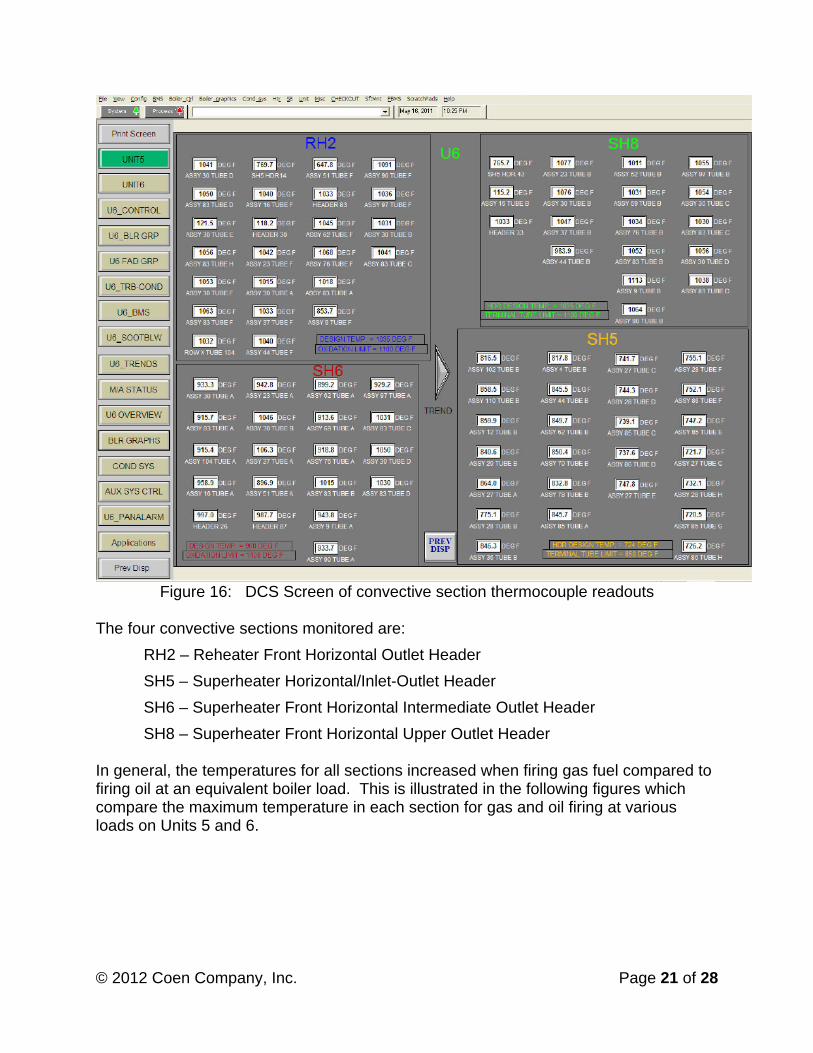
Tube Metal Temperatures Metal temperatures are displayed in the DCS based on thermocouples installed by PREPA at four convective sections as shown in the “screen shot” below, Figure 16.
Steam Temperature Parameters versus Gas FractionSouth Coast Unit 6
340-350 MW, 1.0-1.2% Excess O2, 0% FGR
700
720
740
760
780
800
820
840
860
880
900
920
940
960
980
1000
1020
0.0 0.2 0.4 0.6 0.8 1.0Fraction of Boiler Heat Input from Gas
Te
mp
era
ture
, F
0
50
100
150
200
250
300
350
Atte
mp
era
tion
Sp
ray,
kp
ph
SH Temp
RH Temp
SH5 Metal Temp
SH Spray, kpph
RH Spray, kpph
© 2012 Coen Company, Inc. Page 21 of 28
Figure 16: DCS Screen of convective section thermocouple readouts The four convective sections monitored are:
RH2 – Reheater Front Horizontal Outlet Header
SH5 – Superheater Horizontal/Inlet-Outlet Header
SH6 – Superheater Front Horizontal Intermediate Outlet Header
SH8 – Superheater Front Horizontal Upper Outlet Header In general, the temperatures for all sections increased when firing gas fuel compared to firing oil at an equivalent boiler load. This is illustrated in the following figures which compare the maximum temperature in each section for gas and oil firing at various loads on Units 5 and 6.

© 2012 Coen Company, Inc. Page 22 of 28
Figure 17: Maximum tube temperatures by section - Unit 5
Figure 18: Maximum tube temperatures by section - Unit 6
Unit 5 Tube Metal Temps
500
600
700
800
900
1000
1100
1200
356 MW95% Oil
398 MW100% Gas
197 MW100% Oil
188 MW 100% Gas
Te
mp
era
ture
, FSH5 Max
SH6 Max
SH8 Max
RH2 Max
Terminal Tube Limits:
SH5 - 850FSH6 - 1100FSH8 - 1100FRH2 - 1100F
Unit 6 Tube Metal Temps
500
600
700
800
900
1000
1100
1200
401 M
W100%
Oil
405 M
W100%
Gas
351 M
W100%
Oil
348 M
W100%
Gas
210 M
W100%
Oil
203 M
W100%
Gas
Tem
pera
ture
, F
SH5 Max
SH6 Max
SH8 Max
RH2 Max
Terminal Tube Limits:
SH5 - 850FSH6 - 1100FSH8 - 1100FRH2 - 1100F

© 2012 Coen Company, Inc. Page 23 of 28
The carbon steel SH5 header and link piping had been identified prior to the gas conversion as a section that would be particularly vulnerable to overheating when firing gas. Prior to gas commissioning, temperatures recorded in that section with 100% oil firing were already at or above the temperature limits for that section under normal operating conditions, particularly on Unit 5. During gas commissioning, many of the individually monitored SH5 tube metal locations were consistently well above the maximum design limit. The following Figures 19a and b show the maximum temperature recorded at SH5 for a range of representative test conditions.
Figure 19a: SH5 maximum temperatures – Unit 5
Figure 19b: SH5 maximum temperatures – Unit 6
Unit 5 SH5 Maximum Metal Temp
800
850
900
950
1000
0 50 100 150 200 250 300 350 400 450Boiler Load, MWgross
Te
mp
era
ture
, F
SH5 Max Metal Temp - GAS
SH5 Max Metal Temp - OIL
Unit 6 SH5 Maximum Metal Temp
700
750
800
850
900
950
1000
0 50 100 150 200 250 300 350 400 450Boiler Load, MWgross
Te
mp
era
ture
, F
SH6 Max Metal Temp - GASSH6 Max Metal Temp - OIL
© 2012 Coen Company, Inc. Page 24 of 28
It is evident from the above figures that Unit 5 metal temperatures in the SH section were higher than those on Unit 6. However, on both units the temperature limits were exceeded when firing gas. It appears that upgrading the metals in this section may be required.
Stack Emissions During gas commissioning tests on each boiler, stack emissions measurements of NOx (NO and NO2), CO2, CO, and O2 were obtained for each test condition. Measurements were made by the PREPA Environmental Department using standard equipment as employed for environmental compliance testing. The NOx data is included in this paper.
South Coast Unit 5 The following figure summarizes NOx emissions versus load for each fuel under: a) “unstaged” operation that was not optimized for low emissions, and b) low NOx firing conditions (“staged” combustion). Environmental test results from July 2010 are included for comparison, which were obtained prior to the installation of gas burners and with the oil burners operating per PREPA’s “Optimum Operating Range” adjustments to reduce NOx. Unit 5 exhibited relatively high NOx emissions on oil prior to combustion optimization. NOx was reduced to below 0.3 lb/MMBtu over the tested load range by utilizing standard means of NOx reduction in various combinations. These included biasing burner air dampers, optimum burner tilts, operating with selected burners out of service (BOOS), and low excess air. NOx emissions on oil are sensitive to the nitrogen content of the oil, and the emissions reported reflect the nitrogen content of the oil at the time. During the commissioning tests, the fuel nitrogen content varied from 0.35 to 0.42 percent by weight. For gas firing, limited data was obtained without low-NOx adjustments. This data indicated that “uncontrolled” NOx on gas was significantly lower than for oil. With burner adjustments implemented, NOx varied from 0.26-0.29 lb/MMBtu at high load to approximately 0.10 lb/MMBtu at half load.

© 2012 Coen Company, Inc. Page 25 of 28
Figure 20: NOx versus load – Unit 5
The data plotted in Figure 20 above, are for 100% gas or 100% oil firing. It was demonstrated that NOx emissions when co-firing with different proportions of gas and oil could also be controlled at or below 0.3 lb/MMBtu. This is illustrated for Unit 5 at 355 MW in the following Figure 21.
Figure 21: NOx versus fraction of gas heat input – Unit 5, 355 MW
Unit 5 NOx Trends
0
0.1
0.2
0.3
0.4
0.5
0.6
0.7
0.8
0 50 100 150 200 250 300 350 400 450Boiler Load, MWgross
NO
x, lb
/MM
Btu
2010 Environmental - Oil100% Oil - Unstaged 100% Oil - Low NOx100% Gas - Unstaged100% Gas - Low NOx
Unit 5355 MWElev. 6 BOOS0.8-1.5% O2
0.00
0.05
0.10
0.15
0.20
0.25
0.30
0.35
0.0 0.2 0.4 0.6 0.8 1.0Gas Fraction of Boiler Heat Input
NO
x, lb
/MM
Btu

© 2012 Coen Company, Inc. Page 26 of 28
It is important to note that NOx emissions for gas firing at low and intermediate loads are substantially lower than gas emissions at high load and substantially lower than emissions on oil. Thus, fuel selection and/or load dispatch may be used for meeting annual average emission limits or other emission regulations. Throughout the testing, CO emissions were generally maintained below 0.03 lb/MMBtu. It is expected that CO emissions can be maintained at low levels when the units are automated and burner dampers are calibrated to balance air flows among the burners. With few exceptions, stack opacity remained well below 5% during the tests.
South Coast Unit 6 Similar NOx emission plots are shown for Unit 6 below.
Figure 22: NOx versus load – Unit 6
In general, the NOx emissions on Unit 6 were lower than on Unit 5, requiring lesser degrees of combustion staging to achieve NOx at or below 0.3 lb/MMBtu. This advantage is offset to some extent, particularly for oil firing, by the reduced operating flexibility on Unit 6 to implement staging (due to fewer numbers of burners). The difference in oil NOx emissions between “Low NOx” and “Minimum NOx” indicates the potential for reducing NOx below 0.3 lb/MMBtu at high loads. Similarly, the difference between “Light Staging” and “Minimum NOx” for gas fuel indicates the flexibility for
Unit 6 NOx Trends
0.00
0.05
0.10
0.15
0.20
0.25
0.30
0.35
0.40
0.45
0.50
0 50 100 150 200 250 300 350 400 450Boiler Load, MWgross
NO
x, lb
/MM
Btu
2010 Environmental - Oil100% Oil - Unstaged 100% Oil - Low NOx100% Gas - Light Staging100% Gas - Minimum NOx100% Oil - Minimum NOx
© 2012 Coen Company, Inc. Page 27 of 28
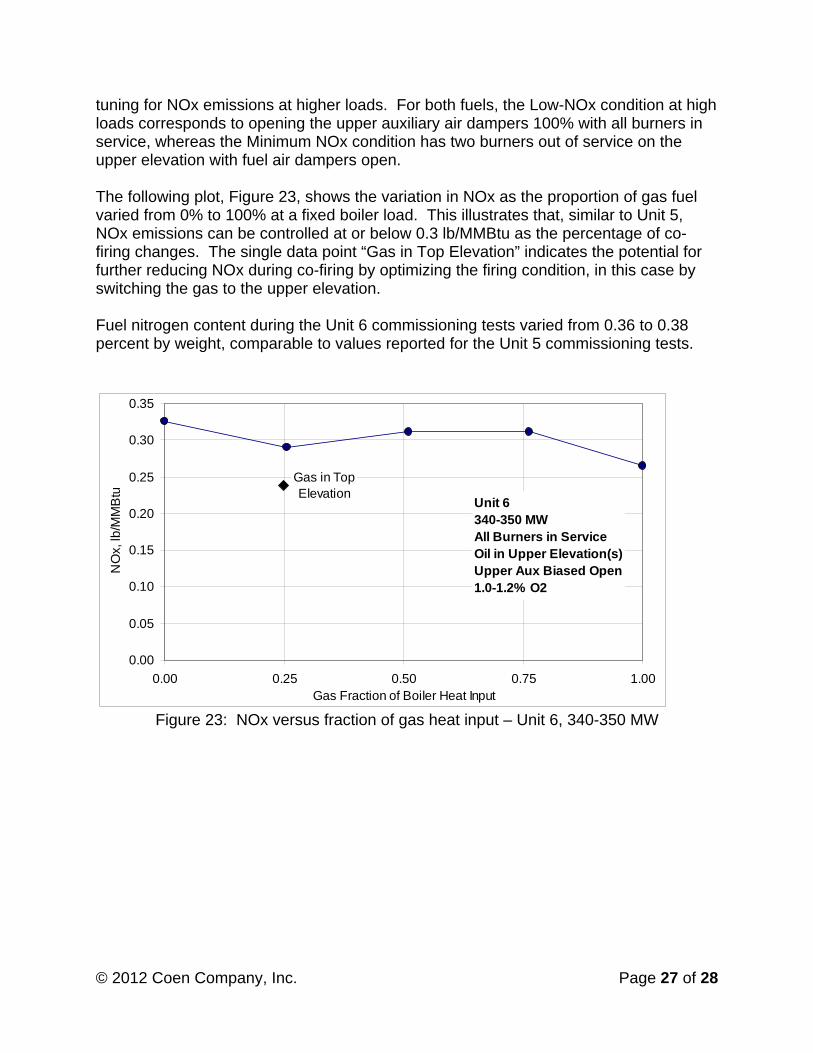
tuning for NOx emissions at higher loads. For both fuels, the Low-NOx condition at high loads corresponds to opening the upper auxiliary air dampers 100% with all burners in service, whereas the Minimum NOx condition has two burners out of service on the upper elevation with fuel air dampers open. The following plot, Figure 23, shows the variation in NOx as the proportion of gas fuel varied from 0% to 100% at a fixed boiler load. This illustrates that, similar to Unit 5, NOx emissions can be controlled at or below 0.3 lb/MMBtu as the percentage of co-firing changes. The single data point “Gas in Top Elevation” indicates the potential for further reducing NOx during co-firing by optimizing the firing condition, in this case by switching the gas to the upper elevation. Fuel nitrogen content during the Unit 6 commissioning tests varied from 0.36 to 0.38 percent by weight, comparable to values reported for the Unit 5 commissioning tests.
Figure 23: NOx versus fraction of gas heat input – Unit 6, 340-350 MW
Unit 6340-350 MWAll Burners in ServiceOil in Upper Elevation(s)Upper Aux Biased Open1.0-1.2% O2
Gas in Top Elevation
0.00
0.05
0.10
0.15
0.20
0.25
0.30
0.35
0.00 0.25 0.50 0.75 1.00Gas Fraction of Boiler Heat Input
NO
x, lb
/MM
Btu
© 2012 Coen Company, Inc. Page 28 of 28
Conclusions 1. With careful attention to the site issues and following a strict guideline of approach,
T-Fired units can be successfully converted from oil to gas or dual-fuel firing.
2. In some cases, Super heat and or Reheat heat tube materials may require replacement.
3. Attemperation flows for Super Heat and Reheat flows will likely increase. 4. For this particular case, as identified in the initial report prior to conversion, remedial
actions were recommended to address the high metal temperatures in the SH5 convective section. As recorded during the commissioning tests, the metal temperatures in this section did increase during gas firing and may pose a future boiler reliability problem.
5. Boiler operating recommendations prepared by Coen during commissioning provide
guidelines for adjusting burner parameters for various boiler loads from 100 MW to 400 MW. These may be used as a preliminary basis for setting up the combustion controls for optimum combustion and emission performance. Staging the combustion process further to reduce NOx by biasing combustion air to the upper burner elevation(s) and operating with burners out of service (“BOOS”) in the top elevation on Unit 5 are incorporated into these guidelines. These guidelines are based on testing performed with burner air compartment dampers not calibrated, which resulted in very non-uniform damper positions from corner to corner on most burner elevations. This can affect the NOx emissions achieved as well as the minimum excess O2 and CO characteristics of a specific operating scenario. Therefore, the recommended operating conditions will be confirmed after dampers have been calibrated and the combustion controls have been tuned.
6. The Coen method for converting T-Fired units has been successfully used approximately 20 times in recent years.