Embed Size (px)
Citation preview
Conversion Rate Prediction via Post-Click Behaviour ModelingHong WenAlibaba Group
Hangzhou, Zhejiang, China [email protected]
Jing ZhangThe University of Sydney
Darlington NSW 2008, [email protected]
Yuan WangAlibaba Group
Hangzhou, Zhejiang, China [email protected]
Wentian BaoAlibaba Group
Hangzhou, Zhejiang, China [email protected]
Quan LinAlibaba Group
Hangzhou, Zhejiang, China [email protected]
Keping YangAlibaba Group
Hangzhou, Zhejiang, China [email protected]
ABSTRACTEffective and efficient recommendation is crucial for modern e-commerce platforms. It consists of two indispensable componentsnamed Click-Through Rate (CTR) prediction and Conversion Rate(CVR) prediction, where the latter is an essential factor contributingto the final purchasing volume. Existingmethods specifically predictCVR using the clicked and purchased samples, which has limitedperformance affected by the well-known sample selection biasand data sparsity issues. To address these issues, we proposea novel deep CVR prediction method by considering the post-click behaviours. After grouping deterministic actions together,we construct a novel sequential path, which elaborately depictsthe post-click behaviours of users. Based on the path, we definethe CVR and several related probabilities including CTR, etc.,and devise a deep neural network with multiple targets involvedaccordingly. It takes advantage of the abundant samples withdeterministic labels derived from the post-click actions, leading to asignificant improvement of CVR prediction. Extensive experimentson both offline and online settings demonstrate its superiority overrepresentative state-of-the-art methods.
KEYWORDSRecommendation System, Entire Space, Multi-Task Learning, Post-Click Behaviour Decomposition, Conversion Rate Prediction
ACM Reference Format:Hong Wen, Jing Zhang, Yuan Wang, Wentian Bao, Quan Lin, and KepingYang. 2019. Conversion Rate Prediction via Post-Click Behaviour Modeling.In Proceedings of ACM Conference (Conference’XXXX). ACM, New York, NY,USA, 11 pages. https://doi.org/10.1145/nnnnnnn.nnnnnnn
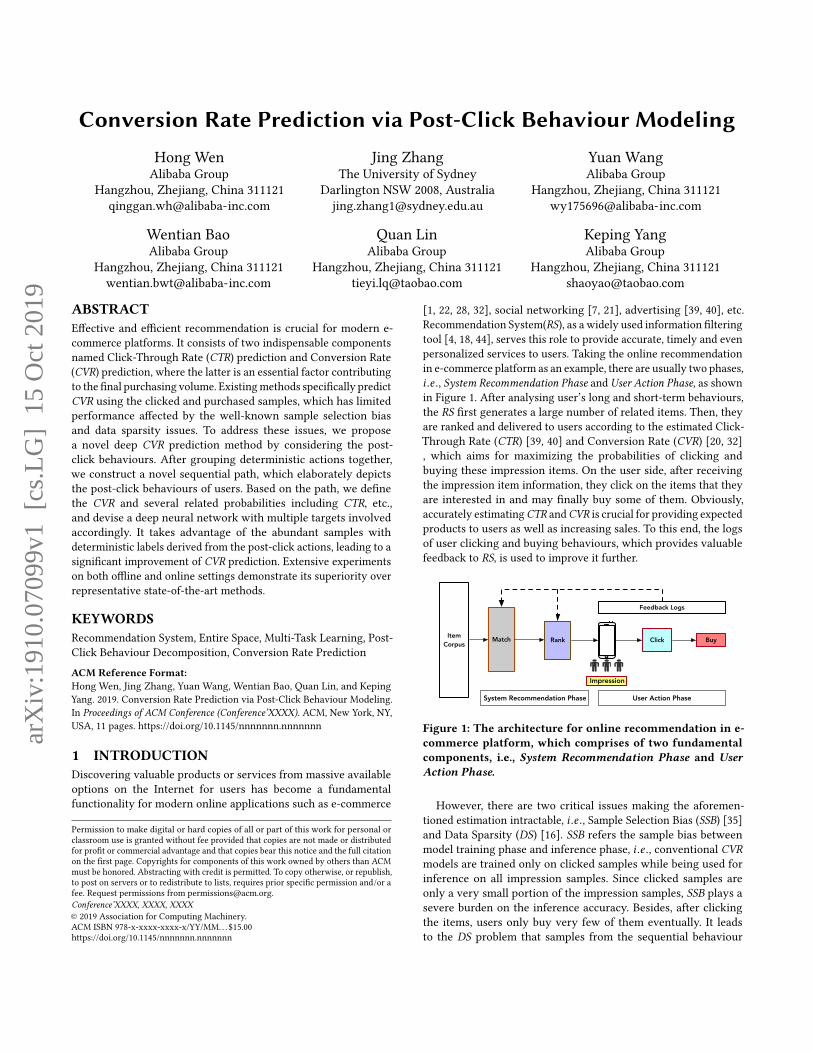
1 INTRODUCTIONDiscovering valuable products or services from massive availableoptions on the Internet for users has become a fundamentalfunctionality for modern online applications such as e-commerce
Permission to make digital or hard copies of all or part of this work for personal orclassroom use is granted without fee provided that copies are not made or distributedfor profit or commercial advantage and that copies bear this notice and the full citationon the first page. Copyrights for components of this work owned by others than ACMmust be honored. Abstracting with credit is permitted. To copy otherwise, or republish,to post on servers or to redistribute to lists, requires prior specific permission and/or afee. Request permissions from [email protected]’XXXX, XXXX, XXXX© 2019 Association for Computing Machinery.ACM ISBN 978-x-xxxx-xxxx-x/YY/MM. . . $15.00https://doi.org/10.1145/nnnnnnn.nnnnnnn
[1, 22, 28, 32], social networking [7, 21], advertising [39, 40], etc.Recommendation System(RS), as a widely used information filteringtool [4, 18, 44], serves this role to provide accurate, timely and evenpersonalized services to users. Taking the online recommendationin e-commerce platform as an example, there are usually two phases,i .e ., System Recommendation Phase and User Action Phase, as shownin Figure 1. After analysing user’s long and short-term behaviours,the RS first generates a large number of related items. Then, theyare ranked and delivered to users according to the estimated Click-Through Rate (CTR) [39, 40] and Conversion Rate (CVR) [20, 32], which aims for maximizing the probabilities of clicking andbuying these impression items. On the user side, after receivingthe impression item information, they click on the items that theyare interested in and may finally buy some of them. Obviously,accurately estimatingCTR andCVR is crucial for providing expectedproducts to users as well as increasing sales. To this end, the logsof user clicking and buying behaviours, which provides valuablefeedback to RS, is used to improve it further.
Match Rank Click Buy
Feedback Logs
ItemCorpus
Impression
System Recommendation Phase User Action Phase
Figure 1: The architecture for online recommendation in e-commerce platform, which comprises of two fundamentalcomponents, i.e., System Recommendation Phase and UserAction Phase.
However, there are two critical issues making the aforemen-tioned estimation intractable, i .e ., Sample Selection Bias (SSB) [35]and Data Sparsity (DS) [16]. SSB refers the sample bias betweenmodel training phase and inference phase, i .e ., conventional CVRmodels are trained only on clicked samples while being used forinference on all impression samples. Since clicked samples areonly a very small portion of the impression samples, SSB plays asevere burden on the inference accuracy. Besides, after clickingthe items, users only buy very few of them eventually. It leadsto the DS problem that samples from the sequential behaviour
arX
iv:1
910.
0709
9v1
[cs
.LG
] 1
5 O
ct 2
019
Conference’XXXX, XXXX, XXXX Hong Wen, Jing Zhang, Yuan Wang, Wentian Bao, Quan Lin, and Keping Yang
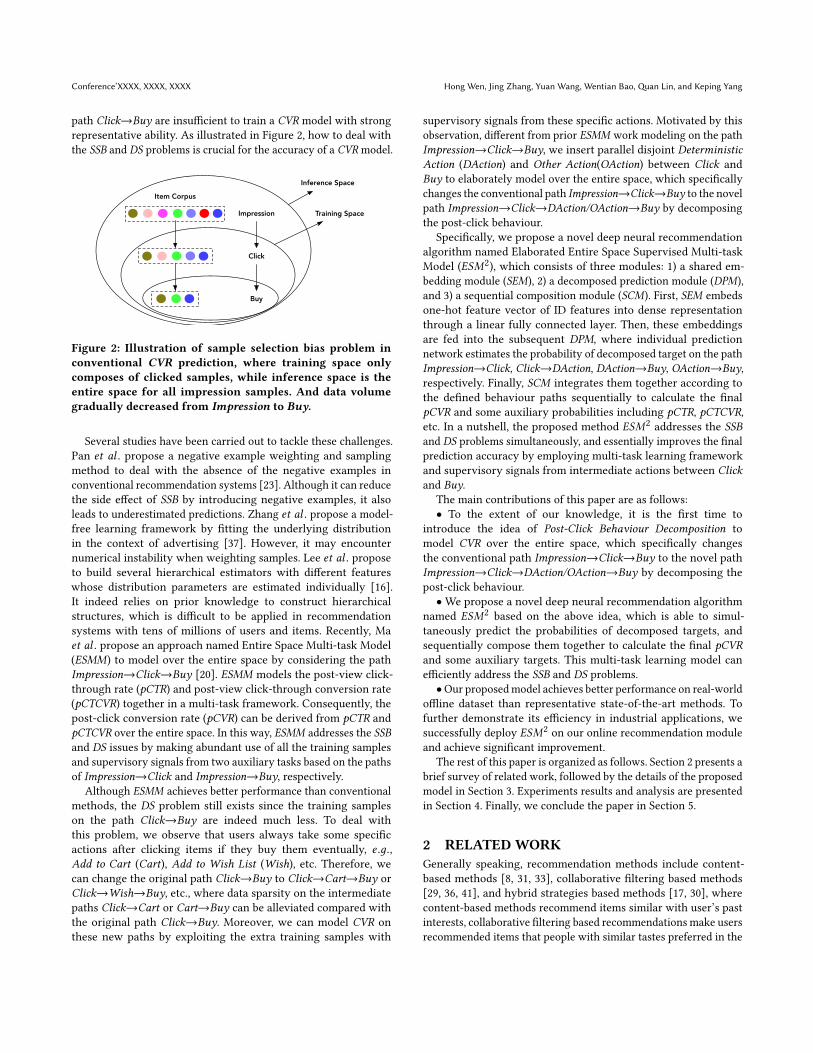
path Click→Buy are insufficient to train a CVR model with strongrepresentative ability. As illustrated in Figure 2, how to deal withthe SSB and DS problems is crucial for the accuracy of a CVR model.
Impression
Click
Buy
Training Space
Inference Space
Item Corpus
Figure 2: Illustration of sample selection bias problem inconventional CVR prediction, where training space onlycomposes of clicked samples, while inference space is theentire space for all impression samples. And data volumegradually decreased from Impression to Buy.
Several studies have been carried out to tackle these challenges.Pan et al . propose a negative example weighting and samplingmethod to deal with the absence of the negative examples inconventional recommendation systems [23]. Although it can reducethe side effect of SSB by introducing negative examples, it alsoleads to underestimated predictions. Zhang et al . propose a model-free learning framework by fitting the underlying distributionin the context of advertising [37]. However, it may encounternumerical instability when weighting samples. Lee et al . proposeto build several hierarchical estimators with different featureswhose distribution parameters are estimated individually [16].It indeed relies on prior knowledge to construct hierarchicalstructures, which is difficult to be applied in recommendationsystems with tens of millions of users and items. Recently, Maet al . propose an approach named Entire Space Multi-task Model(ESMM) to model over the entire space by considering the pathImpression→Click→Buy [20]. ESMM models the post-view click-through rate (pCTR) and post-view click-through conversion rate(pCTCVR) together in a multi-task framework. Consequently, thepost-click conversion rate (pCVR) can be derived from pCTR andpCTCVR over the entire space. In this way, ESMM addresses the SSBand DS issues by making abundant use of all the training samplesand supervisory signals from two auxiliary tasks based on the pathsof Impression→Click and Impression→Buy, respectively.
Although ESMM achieves better performance than conventionalmethods, the DS problem still exists since the training sampleson the path Click→Buy are indeed much less. To deal withthis problem, we observe that users always take some specificactions after clicking items if they buy them eventually, e .д.,Add to Cart (Cart), Add to Wish List (Wish), etc. Therefore, wecan change the original path Click→Buy to Click→Cart→Buy orClick→Wish→Buy, etc., where data sparsity on the intermediatepaths Click→Cart or Cart→Buy can be alleviated compared withthe original path Click→Buy. Moreover, we can model CVR onthese new paths by exploiting the extra training samples with
supervisory signals from these specific actions. Motivated by thisobservation, different from prior ESMM work modeling on the pathImpression→Click→Buy, we insert parallel disjoint DeterministicAction (DAction) and Other Action(OAction) between Click andBuy to elaborately model over the entire space, which specificallychanges the conventional path Impression→Click→Buy to the novelpath Impression→Click→DAction/OAction→Buy by decomposingthe post-click behaviour.
Specifically, we propose a novel deep neural recommendationalgorithm named Elaborated Entire Space Supervised Multi-taskModel (ESM2), which consists of three modules: 1) a shared em-bedding module (SEM), 2) a decomposed prediction module (DPM),and 3) a sequential composition module (SCM). First, SEM embedsone-hot feature vector of ID features into dense representationthrough a linear fully connected layer. Then, these embeddingsare fed into the subsequent DPM, where individual predictionnetwork estimates the probability of decomposed target on the pathImpression→Click, Click→DAction, DAction→Buy, OAction→Buy,respectively. Finally, SCM integrates them together according tothe defined behaviour paths sequentially to calculate the finalpCVR and some auxiliary probabilities including pCTR, pCTCVR,etc. In a nutshell, the proposed method ESM2 addresses the SSBand DS problems simultaneously, and essentially improves the finalprediction accuracy by employing multi-task learning frameworkand supervisory signals from intermediate actions between Clickand Buy.
The main contributions of this paper are as follows:• To the extent of our knowledge, it is the first time to
introduce the idea of Post-Click Behaviour Decomposition tomodel CVR over the entire space, which specifically changesthe conventional path Impression→Click→Buy to the novel pathImpression→Click→DAction/OAction→Buy by decomposing thepost-click behaviour.
•We propose a novel deep neural recommendation algorithmnamed ESM2 based on the above idea, which is able to simul-taneously predict the probabilities of decomposed targets, andsequentially compose them together to calculate the final pCVRand some auxiliary targets. This multi-task learning model canefficiently address the SSB and DS problems.
•Our proposedmodel achieves better performance on real-worldoffline dataset than representative state-of-the-art methods. Tofurther demonstrate its efficiency in industrial applications, wesuccessfully deploy ESM2 on our online recommendation moduleand achieve significant improvement.
The rest of this paper is organized as follows. Section 2 presents abrief survey of related work, followed by the details of the proposedmodel in Section 3. Experiments results and analysis are presentedin Section 4. Finally, we conclude the paper in Section 5.
2 RELATEDWORKGenerally speaking, recommendation methods include content-based methods [8, 31, 33], collaborative filtering based methods[29, 36, 41], and hybrid strategies based methods [17, 30], wherecontent-based methods recommend items similar with user’s pastinterests, collaborative filtering based recommendations make usersrecommended items that people with similar tastes preferred in the
Conversion Rate Prediction via Post-Click Behaviour Modeling Conference’XXXX, XXXX, XXXX
past, and hybrid recommendations integrate two or more types ofrecommendation strategies. Our method falls into the collaborativefiltering based category and specifically tackles the post-clickconversion rate prediction problem using multi-task learningframework via post-click behaviour decomposition. Therefore, webriefly review the most related work from the following two aspects:1) conversion rate prediction; 2) multi-task learning.
Conversion Rate Prediction: Conversion rate prediction is akey component of many online applications, such as search engines[2, 38], recommendation systems [11, 24] and online advertising[9, 13]. However, CVR is very challenging since conversions areextreme rare events that only a very small portion of impressionitems are eventually being clicked and bought. Prior work studiesboth linear models and non-linear models including logistic regres-sion [3], decision trees [32, 42], factorization machines [25, 34].Recently, deep neural network has achieved significant progress inmany areas due to its strong ability in feature representation andend-to-end modeling [4, 10, 14, 15, 18, 26]. Following these works,we also adopt the deep neural network to embed user-item featuresand predict the conversion rate.
Multi-Task Learning: Due to the temporal multi-stage natureof users’ purchasing behaviour, e .д., Impression,Click, and Buy, priorwork attempts to formulate the conversion rate prediction tasks by amulti-task learning framework. For example, Hadash et al . proposea multi-task learning based recommendation system by modelingthe ranking and rating prediction tasks simultaneously [12]. Maet al . propose multi-task learning approach named Multi-gateMixture-of-Experts to explicitly learn the task relationship fromdata [19]. Gao et al . propose a neural multi-task recommendationmodel named NMTR to learn the cascading relationship amongdifferent types of behaviours [6]. In contrast, we model the CTRand CVR tasks simultaneously by associating with users’ sequentialbehaviour paths, where the task relationship is explicitly definedby the conditional probability (See section 3). Ni et al . proposeto learn universal user representations across multiple tasks formore effective personalization [22]. We also adopt such an idea bysharing the embedded features across different tasks.
Recently, Ma et al . propose an entire space multi-task model(ESMM) for estimating post-click conversion rate [20]. ESMMuses the pCTR task and pCTCVR task as parallel auxiliary tasksof the main pCVR task. Our method follows ESMM but has thefollowing difference: we propose to decompose the post-clickbehaviour into DAction and OAction parts, and insert them into theoriginal sequential path Click→Buy. In this way, it can leveragethe supervisory signals from users’ post-click behaviours, whichconsequently alleviates the data sparsity issue.
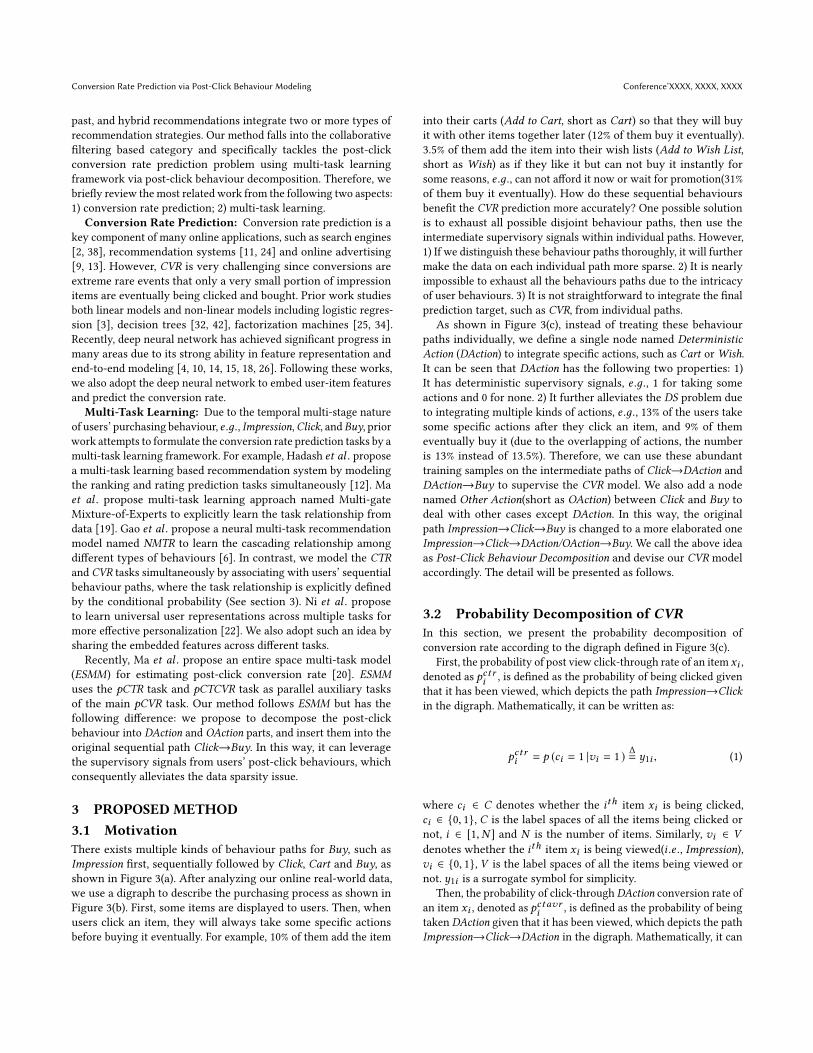
3 PROPOSED METHOD3.1 MotivationThere exists multiple kinds of behaviour paths for Buy, such asImpression first, sequentially followed by Click, Cart and Buy, asshown in Figure 3(a). After analyzing our online real-world data,we use a digraph to describe the purchasing process as shown inFigure 3(b). First, some items are displayed to users. Then, whenusers click an item, they will always take some specific actionsbefore buying it eventually. For example, 10% of them add the item
into their carts (Add to Cart, short as Cart) so that they will buyit with other items together later (12% of them buy it eventually).3.5% of them add the item into their wish lists (Add to Wish List,short as Wish) as if they like it but can not buy it instantly forsome reasons, e .д., can not afford it now or wait for promotion(31%of them buy it eventually). How do these sequential behavioursbenefit the CVR prediction more accurately? One possible solutionis to exhaust all possible disjoint behaviour paths, then use theintermediate supervisory signals within individual paths. However,1) If we distinguish these behaviour paths thoroughly, it will furthermake the data on each individual path more sparse. 2) It is nearlyimpossible to exhaust all the behaviours paths due to the intricacyof user behaviours. 3) It is not straightforward to integrate the finalprediction target, such as CVR, from individual paths.
As shown in Figure 3(c), instead of treating these behaviourpaths individually, we define a single node named DeterministicAction (DAction) to integrate specific actions, such as Cart or Wish.It can be seen that DAction has the following two properties: 1)It has deterministic supervisory signals, e .д., 1 for taking someactions and 0 for none. 2) It further alleviates the DS problem dueto integrating multiple kinds of actions, e .д., 13% of the users takesome specific actions after they click an item, and 9% of themeventually buy it (due to the overlapping of actions, the numberis 13% instead of 13.5%). Therefore, we can use these abundanttraining samples on the intermediate paths of Click→DAction andDAction→Buy to supervise the CVR model. We also add a nodenamed Other Action(short as OAction) between Click and Buy todeal with other cases except DAction. In this way, the originalpath Impression→Click→Buy is changed to a more elaborated oneImpression→Click→DAction/OAction→Buy. We call the above ideaas Post-Click Behaviour Decomposition and devise our CVR modelaccordingly. The detail will be presented as follows.
3.2 Probability Decomposition of CVRIn this section, we present the probability decomposition ofconversion rate according to the digraph defined in Figure 3(c).
First, the probability of post view click-through rate of an item xi ,denoted as pctri , is defined as the probability of being clicked giventhat it has been viewed, which depicts the path Impression→Clickin the digraph. Mathematically, it can be written as:
pctri = p (ci = 1 |vi = 1 ) ∆= y1i , (1)
where ci ∈ C denotes whether the ith item xi is being clicked,ci ∈ {0, 1}, C is the label spaces of all the items being clicked ornot, i ∈ [1,N ] and N is the number of items. Similarly, vi ∈ V
denotes whether the ith item xi is being viewed(i .e ., Impression),vi ∈ {0, 1}, V is the label spaces of all the items being viewed ornot. y1i is a surrogate symbol for simplicity.
Then, the probability of click-through DAction conversion rate ofan item xi , denoted as pctavri , is defined as the probability of beingtaken DAction given that it has been viewed, which depicts the pathImpression→Click→DAction in the digraph. Mathematically, it can
Conference’XXXX, XXXX, XXXX Hong Wen, Jing Zhang, Yuan Wang, Wentian Bao, Quan Lin, and Keping Yang
10%
3.5%
12%
31%
Impression Click Cart Buy
Impression Click Click Again Buy
Impression Click
Cart
Wish Impression Click
Deterministic Action
Other Action Other Action
87% 0.4%
13% 9%
87% 0.4%
�D� �E� �F�
1%Buy Buy
Impression Click Wish BuyCart
Impression Click BuyCart Click
Figure 3: Several kinds of supervisory signals are introduced on the path Click→Buy. (a) The multiple paths for Buy, such asImpression→Click→Cart→Buy. (b) A digraph is used to describe the purchasing process, where the numbers above the linesrepresents the sparsity of different paths, respectively. (c) These supervisory signals are integrated into a unified nodeDAction.Here, DAction represents the union of Cart andWish.
be written as:pctavri = p (ai = 1 |vi = 1 )
=∑
ci ∈{0,1}p (ai = 1 |vi = 1 , ci )p (ci |vi = 1 )
= p (ai = 1 |vi = 1 , ci = 0)p (ci = 0 |vi = 1 )+ p (ai = 1 |vi = 1 , ci = 1)p (ci = 1 |vi = 1 )= y2iy1i
, (2)
where ai ∈ A denotes whether the ith item xi is being takensome specific actions defined in Section 3.1, ai ∈ {0, 1}, Ais the label spaces of all the items being taken some specificactions or not. y2i = p (ai = 1 |vi = 1 , ci = 1), depicting the pathClick→DAction, is a surrogate symbol for simplicity as y1i . Itis trivial that y2i = p (ai = 1 |ci = 1 ) since all the samples areimpression samples (i .e ., vi = 1). It is noteworthy that Eq. (2)holds due to the fact that no action occurs without being clicked,i .e ., p (ai = 1 |vi = 1 , ci = 0)=0.
Next, the probability of conversion rate of an item xi , denoted aspcvri , is defined as the probability of being bought given that it hasbeen clicked, which depicts the pathsClick→DAction/OAction→Buyin the digraph. Mathematically, it can be written as:
pcvri = p (bi = 1 |ci = 1 )
=∑
ai ∈{0,1}p (bi = 1 |ci = 1 ,ai )p (ai |ci = 1 )
= p (bi = 1 |ci = 1 ,ai = 0)p (ai = 0 |ci = 1 )+ p (bi = 1 |ci = 1 ,ai = 1)p (ai = 1 |ci = 1 )
∆= y4i (1 − y2i ) + y2iy3i
, (3)
where bi ∈ B denotes whether the ith item xi is being bought,bi ∈ {0, 1}, B is the label spaces of all the items being bought or not.y3i = p (bi = 1 |ci = 1 ,ai = 1), y4i = p (bi = 1 |ci = 1 ,ai = 0) aresome surrogate symbols for simplicity as y1i . y3i or y4i depicts thepath DAction→Buy or OAction→Buy in the digraph, respectively.
The probability of click-through conversion rate of an itemxi , denoted as pctcvri , is defined as the probability of beingbought given that it has been viewed, which depicts the completepath Impression→Click→DAction/OAction→Buy in the digraph.
Mathematically, it can be written as:
pctcvri = p (bi = 1 |vi = 1 )
=∑ci
p (bi = 1 |vi = 1 , ci )p (ci |vi = 1 )
=∑ci
∑ai
p (bi = 1 |vi , ci ,ai )p (ai |vi , ci )p (ci |vi )
= y4i (1 − y2i )y1i + y3iy2iy1i= y1i (y4i (1 − y2i ) + y3iy2i )= pctri pcvri
. (4)
Here, we usevi to replacevi = 1 in the third equality for simplicitywithout causing any ambiguity. It is noteworthy that the fourthequality holds due to the fact that no items will be bought withoutbeing clicked, i .e .,p (bi = 1 |vi = 1 , ci = 0,ai ) equals to zero, ∀ai ∈{0, 1}. Indeed, Eq. (4) can be derived by decomposing the pathImpression→Click→DAction/OAction→Buy into Impression→Clickand Click→DAction/OAction→Buy, and integrating Eq. (1) andEq. (3) together according to the chain rule.
3.3 Elaborated Entire Space SupervisedMulti-task Model
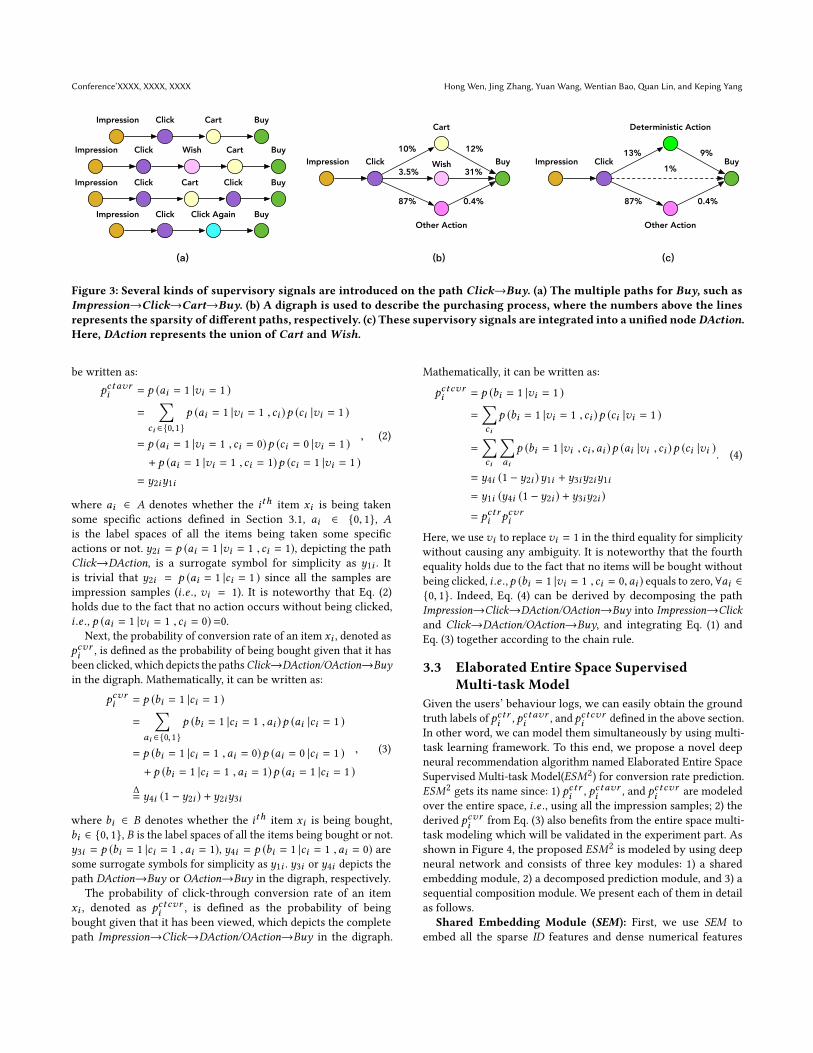
Given the users’ behaviour logs, we can easily obtain the groundtruth labels of pctri , pctavri , and pctcvri defined in the above section.In other word, we can model them simultaneously by using multi-task learning framework. To this end, we propose a novel deepneural recommendation algorithm named Elaborated Entire SpaceSupervised Multi-task Model(ESM2) for conversion rate prediction.ESM2 gets its name since: 1) pctri , pctavri , and pctcvri are modeledover the entire space, i .e ., using all the impression samples; 2) thederived pcvri from Eq. (3) also benefits from the entire space multi-task modeling which will be validated in the experiment part. Asshown in Figure 4, the proposed ESM2 is modeled by using deepneural network and consists of three key modules: 1) a sharedembedding module, 2) a decomposed prediction module, and 3) asequential composition module. We present each of them in detailas follows.
Shared Embedding Module (SEM): First, we use SEM toembed all the sparse ID features and dense numerical features
Conversion Rate Prediction via Post-Click Behaviour Modeling Conference’XXXX, XXXX, XXXX
Concatenate Concatenate Concatenate Concatenate
… … … …
Impression->Click Click->DAction DAction->Buy OAction->Buy
Input
SEM
DPM
SCM
Y1[(1-Y2)Y4+Y2Y3] (1-Y2)Y4+Y2Y3
(1-Y2)Y4Y2Y3Y1Y2
Y1 Y21-Y2 Y3 Y4Loss1
Loss3
Loss2
SharedEmbedding
SharedEmbedding
SharedEmbedding
Figure 4: The diagram of ESM2 model over the entire space, which consists of three key modules: 1) a Shared EmbeddingModule(SEM), 2) a Decomposed Prediction Module(DPM), and 3) a Sequential Composition Module(SCM). SEM embedssparse features into dense representation. DPM predicts the individual decomposed target on the path Impression→Click,Click→DAction, DAction→Buy, OAction→Buy, respectively. SCM integrates them together sequentially to calculate the finalCVR.
coming from user field, item field, and user-item cross field. The userfeatures include users’ ID, ages, genders and purchasing powers, etc.The item features include items’ ID, prices, accumulated CTR andCVR from historical logs, etc. The user-item features include users’historical preference scores on items, etc. Dense numerical featuresare first discretized based on their boundary values and thenrepresented as one-hot vectors. Here, we use fi =
{fi j,∀j ∈ Λf
}to
denote the one-hot features of the ith training sample, where Λfdenotes the index set of all kinds of features. Due to the sparsenessnature of one-hot encoding, we employ linear fully connected layersto embed them into dense representation, which can be formulatedas :
дi j = PTθ jfi j , (5)
where Pθ j denotes the embeddingmatrix for the jth kind of features,θ j represents the network parameters.
Decomposed Prediction Module (DPM): Then, once all thefeature embeddings are obtained, they are concatenated together,fed into the decomposed prediction module, shared by each ofthe subsequent networks. Each individual prediction network inDPM estimates the probability of decomposed target on the pathImpression→Click, Click→DAction, DAction→Buy, OAction→Buy,respectively. In this paper, we employMulti-Layer Perception (MLP)as the prediction network. All the non-linear activation functionis ReLU except the output layer, where we use a Sigmoid function
to map the output into a probability taking real value from 0 to 1.Mathematically, it can be formulated as:
yki = σ(φkϑk
(дi )), (6)
where σ denotes the Sigmoid function, φkϑk denotes the mapping
function learned by thekth MLP,ϑk denotes its network parameters.For example, as shown in the first MLP in Figure 4, it outputthe estimated probability Y1, which is indeed the post-view click-through rate.
Sequential Composition Module (SCM): Finally, SCM com-poses the above predicted probabilities sequentially according toEq. (1) ∼ Eq.(4) to calculate the conversion rate pcvr and someauxiliary targets including the post-view click-through rate pctr ,click-through DAction conversation rate pctavr , and click-throughconversion rate pctcvr , respectively. As shown in the top part ofFigure 4, SCM is a parameter-free feed forward neural networkwhich represents the underlying conditional probabilities definedby the purchasing decision digraph in Figure 3.
3.4 Training ObjectiveWe use S = {(ci ,ai ,bi ; fi )} |Ni=1 to denote the training set, where ci ,ai , bi , represent the ground truth label whether the ith impressionsample is being clicked, taken deterministic actions, and bought.
Conference’XXXX, XXXX, XXXX Hong Wen, Jing Zhang, Yuan Wang, Wentian Bao, Quan Lin, and Keping Yang
Then, we can define the joint post-view click-through probabilityof all training samples as follows:
pctr =∏i ∈C+
pctri
∏j ∈C−
(1 − pctrj
), (7)
where C+ and C− denote the positive and negative samples inthe label space C , respectively. After taking negative logarithmon Eq.(7), we obtain the logloss of pctr , which is widely used inrecommendation systems, i .e .,
Lctr = −∑i ∈C+
loдpctri −∑j ∈C−
loд(1 − pctrj
). (8)
Similarly, we can obtain the loss function of pctavr and pctcvr asfollows:
Lctavr = −∑i ∈A+
loдpctavri −∑j ∈A−
loд(1 − pctavrj
), (9)
and
Lctcvr = −∑i ∈B+
loдpctcvri −∑j ∈B−
loд(1 − pctcvrj
). (10)
The final training objective to be minimized is defined as:
L (Θ) = wctr × Lctr +wctavr × Lctavr +wctcvr × Lctcvr , (11)
where Θ ={θ j ,∀j ∈ Λf
}∪ {ϑi , i = 1, 2, 3, 4} denotes all the net-
work parameters in ESM2.wctr ,wctavr ,wctcvr are loss weightsof Lctr , Lctavr , Lctcvr , respectively.
4 EXPERIMENTSTo evaluate the effectiveness of the proposed ESM2 model, weconducted extensive experiments on both offline dataset collectedfrom real-world e-commerce scenarios and online deployment.ESM2 is compared with some representative state-of-the-art (SOTA)methods including GBDT [5], DNN [14], DNN using over-samplingidea [23] and ESMM [19]. First, we present the evaluation settingsincluding the dataset preparation, evaluation metrics, a briefdescription of these SOTAmethods, and the implementation details.Then, we present the comparison results and analysis. Ablationstudies are presented next, followed by the performance analysison different post-click behaviours.
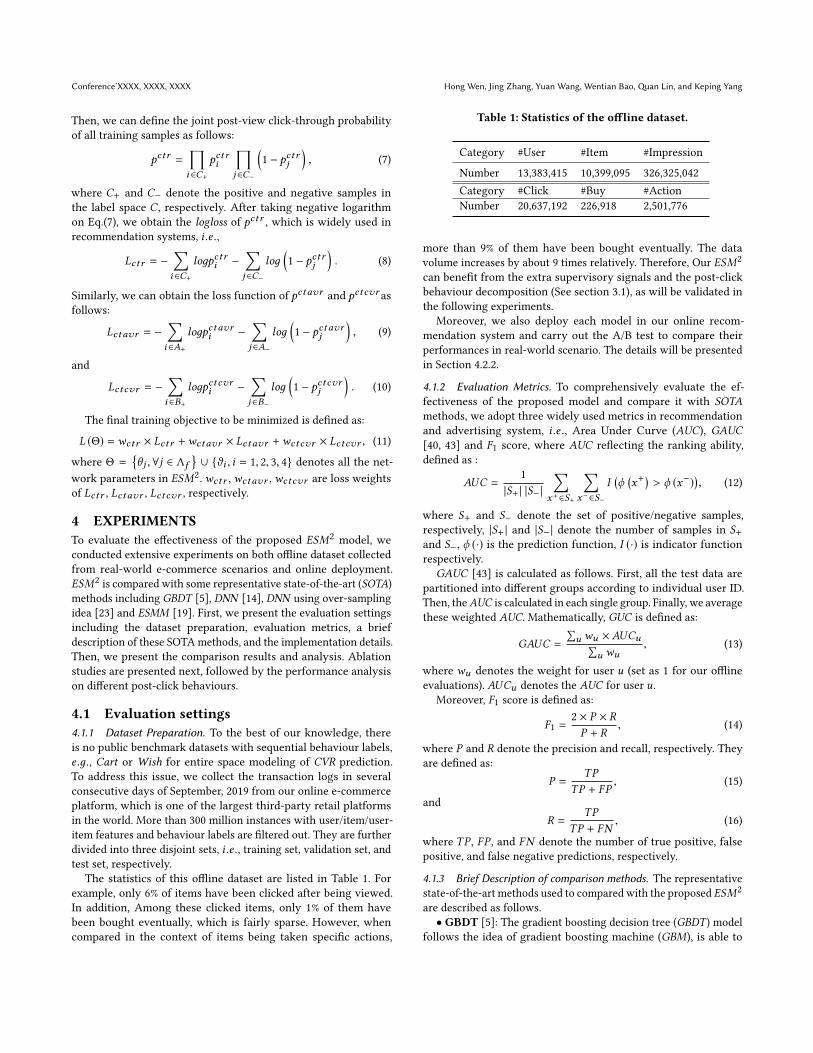
4.1 Evaluation settings4.1.1 Dataset Preparation. To the best of our knowledge, thereis no public benchmark datasets with sequential behaviour labels,e .д., Cart or Wish for entire space modeling of CVR prediction.To address this issue, we collect the transaction logs in severalconsecutive days of September, 2019 from our online e-commerceplatform, which is one of the largest third-party retail platformsin the world. More than 300 million instances with user/item/user-item features and behaviour labels are filtered out. They are furtherdivided into three disjoint sets, i .e ., training set, validation set, andtest set, respectively.
The statistics of this offline dataset are listed in Table 1. Forexample, only 6% of items have been clicked after being viewed.In addition, Among these clicked items, only 1% of them havebeen bought eventually, which is fairly sparse. However, whencompared in the context of items being taken specific actions,
Table 1: Statistics of the offline dataset.
Category #User #Item #Impression
Number 13,383,415 10,399,095 326,325,042Category #Click #Buy #ActionNumber 20,637,192 226,918 2,501,776
more than 9% of them have been bought eventually. The datavolume increases by about 9 times relatively. Therefore, Our ESM2
can benefit from the extra supervisory signals and the post-clickbehaviour decomposition (See section 3.1), as will be validated inthe following experiments.
Moreover, we also deploy each model in our online recom-mendation system and carry out the A/B test to compare theirperformances in real-world scenario. The details will be presentedin Section 4.2.2.
4.1.2 Evaluation Metrics. To comprehensively evaluate the ef-fectiveness of the proposed model and compare it with SOTAmethods, we adopt three widely used metrics in recommendationand advertising system, i .e ., Area Under Curve (AUC), GAUC[40, 43] and F1 score, where AUC reflecting the ranking ability,defined as :
AUC =1
|S+ | |S− |∑
x+∈S+
∑x−∈S−
I(ϕ
(x+
)> ϕ (x−)
), (12)
where S+ and S− denote the set of positive/negative samples,respectively, |S+ | and |S− | denote the number of samples in S+and S−, ϕ (·) is the prediction function, I (·) is indicator functionrespectively.
GAUC [43] is calculated as follows. First, all the test data arepartitioned into different groups according to individual user ID.Then, theAUC is calculated in each single group. Finally, we averagethese weighted AUC. Mathematically, GUC is defined as:
GAUC =
∑u wu ×AUCu∑
u wu, (13)
where wu denotes the weight for user u (set as 1 for our offlineevaluations). AUCu denotes the AUC for user u.
Moreover, F1 score is defined as:
F1 =2 × P × R
P + R, (14)
where P and R denote the precision and recall, respectively. Theyare defined as:
P =TP
TP + FP, (15)
andR =
TP
TP + FN, (16)
where TP , FP , and FN denote the number of true positive, falsepositive, and false negative predictions, respectively.
4.1.3 Brief Description of comparison methods. The representativestate-of-the-art methods used to compared with the proposed ESM2
are described as follows.• GBDT [5]: The gradient boosting decision tree (GBDT ) model
follows the idea of gradient boosting machine (GBM), is able to
Conversion Rate Prediction via Post-Click Behaviour Modeling Conference’XXXX, XXXX, XXXX
produce competitive, highly robust, interpretable procedures forregression or classification tasks [32]. In this paper, we use it as therepresentative of none-deep learning based method and a strongbaseline.
• DNN [14]: We also design a deep neural network baselinemodel, which has the exactly same structure and hyper-parameterswith each of the individual branches in our ESM2 model. Differentfrom our model, it is trained using samples on the path Click→Buyor Impression→Click for conversion rate pcvr or click-through ratepctr , respectively.
•DNN-OS [23]: Due to the data sparsity on the path Click→Buyor Impression→Buy, it is hard to train a deep neural network withgood generalization ability. To address this issue, one strategy is toaugment positive samples during training, called over-sampling. Inthis paper, we leverage this over-sampling strategy to train anotherdeep model named DNN-OS, which has the same structure andhyper-parameters with the aforementioned DNN model.
• ESMM [19]: For a fair comparison, we use the same backbonestructure as the above deep models. It uses multi-task learningto predict pctr and pcvr over the entire space, where featurerepresentation is shared by both tasks. However, it directly modelsthe conversion rate on the path Impression→Click→Buy withoutconsidering the post-click behaviours. Therefore, its performancemaybe degraded due to the data sparsity issue.
The first three methods learn to predict probabilities of pctr andpcvr using samples on the paths Impression→Click and Click→Buy,then multiply them together to derive the click-through conversionrate pctcvr . As for ESMM and our proposed ESM2, they directlypredict pctcvr and pcvr by modeling over the entire space.
4.1.4 Hyper-parameters Settings. For the GBDT model, the numberof trees, the tree depth, minimum instance numbers for splitting anode, sampling rate of train set for each iteration, sampling rate offeatures for each iteration, and the type of loss function, are set as150, 8, 20, 0.6, 0.6 and logistic loss, respectively, which are chosenaccording to the AUC score on the validation set. For the deepneural network based models, they are implemented in TensorFlowand trained on GPU using Adam optimizer for two epochs. Thelearning rate is set to 0.0005, and the mini-batch size is set to 1000.Logistic loss is used as the loss function of each prediction task ofall the models. There are 5 layers in the MLP, where the dimensionof each layer is set to 512, 256, 128, 32, and 2, respectively. Thesehyper-parameters are summarized in Table 2.
Table 2: Hyper-parameters of deep neural network basedmodels including DNN, DNN-OS, ESMM, and ESM2.
Hyper-parameter Choice
Loss function Logistic LossOptimizer Adam
Number of layers in MLP 5Dimensions of layers in MLP [512,256,128,32,2]
Batch size 1000Learning rate 0.0005Dropout ratio 0.5
4.2 Main Results
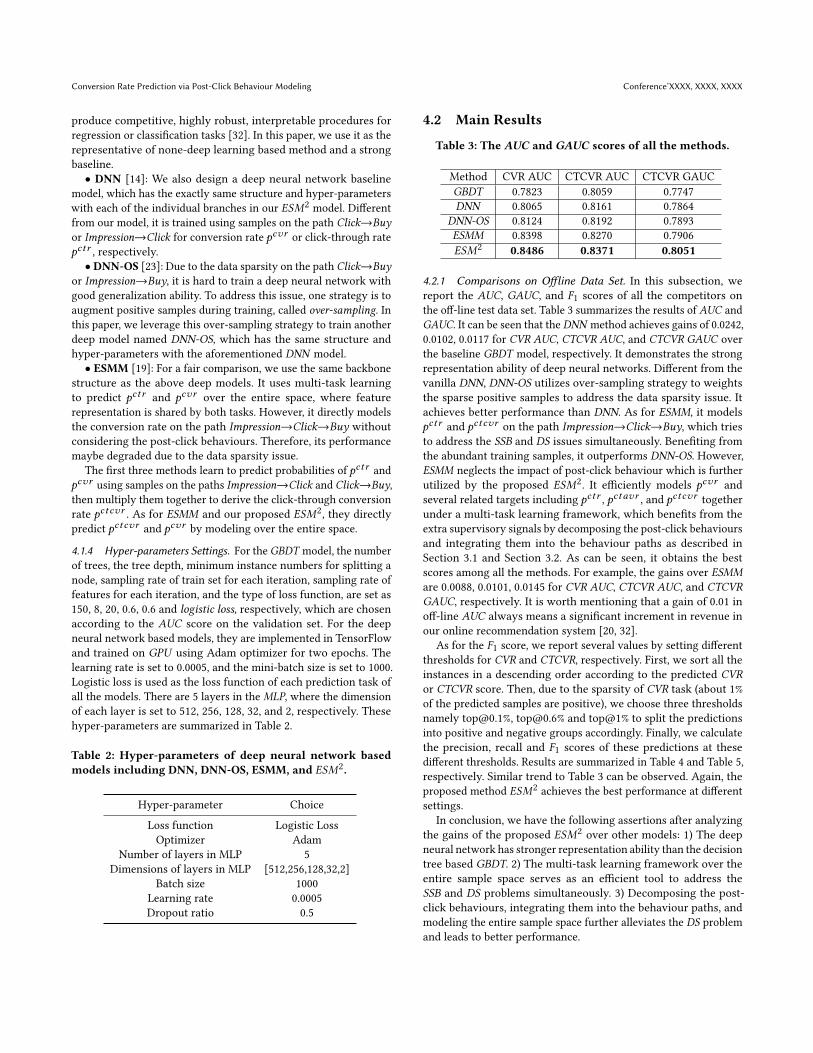
Table 3: The AUC and GAUC scores of all the methods.
Method CVR AUC CTCVR AUC CTCVR GAUCGBDT 0.7823 0.8059 0.7747DNN 0.8065 0.8161 0.7864
DNN-OS 0.8124 0.8192 0.7893ESMM 0.8398 0.8270 0.7906ESM2 0.8486 0.8371 0.8051
4.2.1 Comparisons on Offline Data Set. In this subsection, wereport the AUC, GAUC, and F1 scores of all the competitors onthe off-line test data set. Table 3 summarizes the results of AUC andGAUC. It can be seen that the DNN method achieves gains of 0.0242,0.0102, 0.0117 for CVR AUC, CTCVR AUC, and CTCVR GAUC overthe baseline GBDT model, respectively. It demonstrates the strongrepresentation ability of deep neural networks. Different from thevanilla DNN, DNN-OS utilizes over-sampling strategy to weightsthe sparse positive samples to address the data sparsity issue. Itachieves better performance than DNN. As for ESMM, it modelspctr and pctcvr on the path Impression→Click→Buy, which triesto address the SSB and DS issues simultaneously. Benefiting fromthe abundant training samples, it outperforms DNN-OS. However,ESMM neglects the impact of post-click behaviour which is furtherutilized by the proposed ESM2. It efficiently models pcvr andseveral related targets including pctr , pctavr , and pctcvr togetherunder a multi-task learning framework, which benefits from theextra supervisory signals by decomposing the post-click behavioursand integrating them into the behaviour paths as described inSection 3.1 and Section 3.2. As can be seen, it obtains the bestscores among all the methods. For example, the gains over ESMMare 0.0088, 0.0101, 0.0145 for CVR AUC, CTCVR AUC, and CTCVRGAUC, respectively. It is worth mentioning that a gain of 0.01 inoff-line AUC always means a significant increment in revenue inour online recommendation system [20, 32].
As for the F1 score, we report several values by setting differentthresholds for CVR and CTCVR, respectively. First, we sort all theinstances in a descending order according to the predicted CVRor CTCVR score. Then, due to the sparsity of CVR task (about 1%of the predicted samples are positive), we choose three thresholdsnamely [email protected]%, [email protected]% and top@1% to split the predictionsinto positive and negative groups accordingly. Finally, we calculatethe precision, recall and F1 scores of these predictions at thesedifferent thresholds. Results are summarized in Table 4 and Table 5,respectively. Similar trend to Table 3 can be observed. Again, theproposed method ESM2 achieves the best performance at differentsettings.
In conclusion, we have the following assertions after analyzingthe gains of the proposed ESM2 over other models: 1) The deepneural network has stronger representation ability than the decisiontree based GBDT. 2) The multi-task learning framework over theentire sample space serves as an efficient tool to address theSSB and DS problems simultaneously. 3) Decomposing the post-click behaviours, integrating them into the behaviour paths, andmodeling the entire sample space further alleviates the DS problemand leads to better performance.
Conference’XXXX, XXXX, XXXX Hong Wen, Jing Zhang, Yuan Wang, Wentian Bao, Quan Lin, and Keping Yang
Table 4: The Precision, Recall and F1 scores of all the methods for CVR.
[email protected]% [email protected]% CVR@top1%Method Recall Precision F1-Score Recall Precision F1-Score Recall Precision F1-ScoreGBDT 4.382% 14.348% 6.714% 16.328% 9.894% 12.322% 27.384% 7.384% 11.631%DNN 4.938% 15.117% 7.445% 17.150% 10.495% 13.021% 28.481% 8.196% 12.729%
DNN-OS 5.383% 15.837% 8.034% 17.38% 10.839% 13.353% 29.032% 8.423% 13.058%ESMM 5.813% 16.295% 8.570% 18.585% 11.577% 14.267% 29.789% 8.961% 13.777%ESM2 6.117% 17.145% 9.017% 23.492% 10.574% 14.584% 30.032% 9.034% 13.890%
Table 5: The Precision, Recall and F1 scores of all the methods for CTCVR.
[email protected]% [email protected]% CTCVR@top1%Method Recall Precision F1-Score Recall Precision F1-Score Recall Precision F1-ScoreGBDT 2.937% 0.701% 1.132% 4.870% 0.649% 1.145% 8.894% 0.531% 1.002%DNN 3.168% 0.851% 1.341% 5.269% 0.768% 1.340% 9.461% 0.643% 1.204%
DNN-OS 3.382% 0.871% 1.385% 5.369% 0.801% 1.395% 9.863% 0.673% 1.260%ESMM 3.858% 0.915% 1.479% 5.504% 0.828% 1.439% 10.088% 0.691% 1.294%ESM2 4.219% 1.001% 1.618% 5.987% 0.900% 1.566% 10.991% 0.753% 1.410%
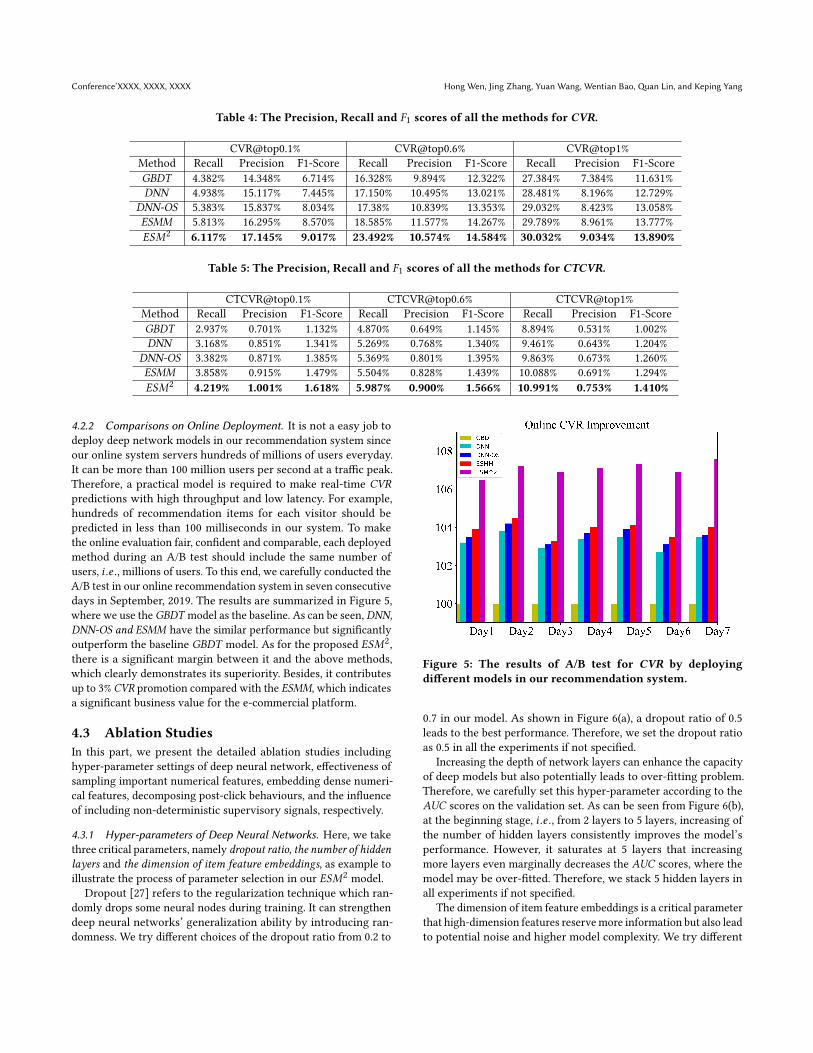
4.2.2 Comparisons on Online Deployment. It is not a easy job todeploy deep network models in our recommendation system sinceour online system servers hundreds of millions of users everyday.It can be more than 100 million users per second at a traffic peak.Therefore, a practical model is required to make real-time CVRpredictions with high throughput and low latency. For example,hundreds of recommendation items for each visitor should bepredicted in less than 100 milliseconds in our system. To makethe online evaluation fair, confident and comparable, each deployedmethod during an A/B test should include the same number ofusers, i .e ., millions of users. To this end, we carefully conducted theA/B test in our online recommendation system in seven consecutivedays in September, 2019. The results are summarized in Figure 5,where we use the GBDT model as the baseline. As can be seen, DNN,DNN-OS and ESMM have the similar performance but significantlyoutperform the baseline GBDT model. As for the proposed ESM2,there is a significant margin between it and the above methods,which clearly demonstrates its superiority. Besides, it contributesup to 3% CVR promotion compared with the ESMM, which indicatesa significant business value for the e-commercial platform.
4.3 Ablation StudiesIn this part, we present the detailed ablation studies includinghyper-parameter settings of deep neural network, effectiveness ofsampling important numerical features, embedding dense numeri-cal features, decomposing post-click behaviours, and the influenceof including non-deterministic supervisory signals, respectively.
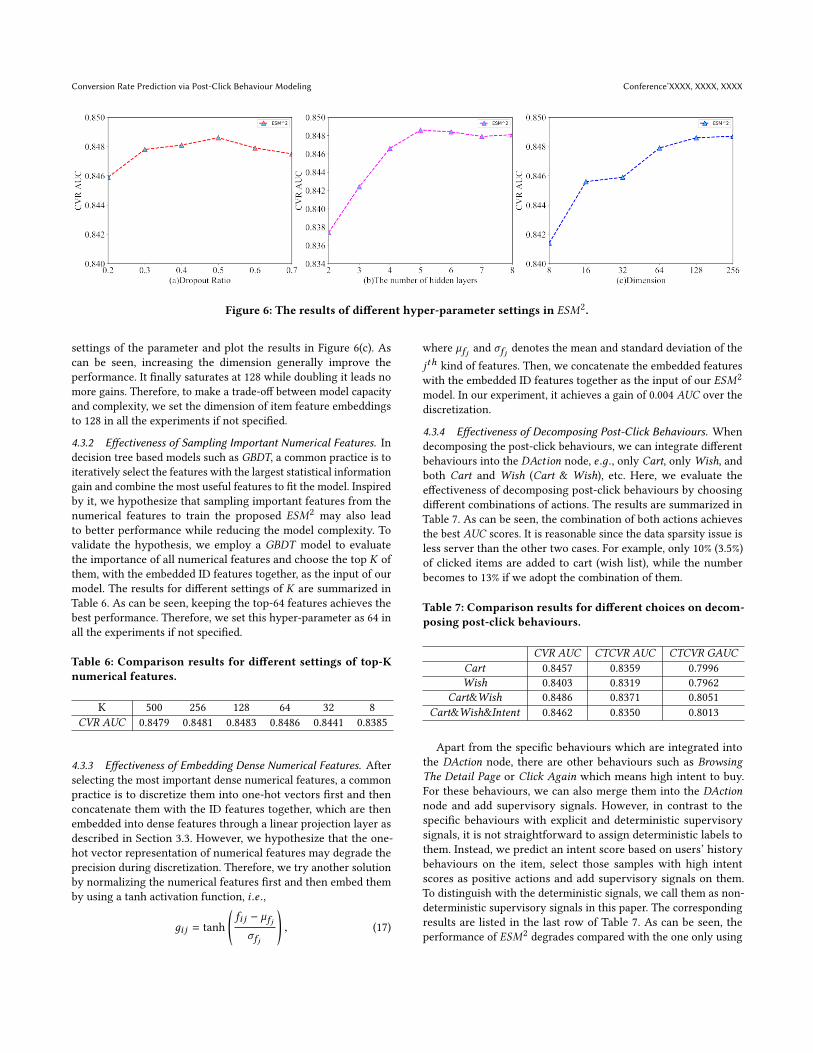
4.3.1 Hyper-parameters of Deep Neural Networks. Here, we takethree critical parameters, namely dropout ratio, the number of hiddenlayers and the dimension of item feature embeddings, as example toillustrate the process of parameter selection in our ESM2 model.
Dropout [27] refers to the regularization technique which ran-domly drops some neural nodes during training. It can strengthendeep neural networks’ generalization ability by introducing ran-domness. We try different choices of the dropout ratio from 0.2 to
Figure 5: The results of A/B test for CVR by deployingdifferent models in our recommendation system.
0.7 in our model. As shown in Figure 6(a), a dropout ratio of 0.5leads to the best performance. Therefore, we set the dropout ratioas 0.5 in all the experiments if not specified.
Increasing the depth of network layers can enhance the capacityof deep models but also potentially leads to over-fitting problem.Therefore, we carefully set this hyper-parameter according to theAUC scores on the validation set. As can be seen from Figure 6(b),at the beginning stage, i .e ., from 2 layers to 5 layers, increasing ofthe number of hidden layers consistently improves the model’sperformance. However, it saturates at 5 layers that increasingmore layers even marginally decreases the AUC scores, where themodel may be over-fitted. Therefore, we stack 5 hidden layers inall experiments if not specified.
The dimension of item feature embeddings is a critical parameterthat high-dimension features reservemore information but also leadto potential noise and higher model complexity. We try different
Conversion Rate Prediction via Post-Click Behaviour Modeling Conference’XXXX, XXXX, XXXX
Figure 6: The results of different hyper-parameter settings in ESM2.
settings of the parameter and plot the results in Figure 6(c). Ascan be seen, increasing the dimension generally improve theperformance. It finally saturates at 128 while doubling it leads nomore gains. Therefore, to make a trade-off between model capacityand complexity, we set the dimension of item feature embeddingsto 128 in all the experiments if not specified.
4.3.2 Effectiveness of Sampling Important Numerical Features. Indecision tree based models such as GBDT, a common practice is toiteratively select the features with the largest statistical informationgain and combine the most useful features to fit the model. Inspiredby it, we hypothesize that sampling important features from thenumerical features to train the proposed ESM2 may also leadto better performance while reducing the model complexity. Tovalidate the hypothesis, we employ a GBDT model to evaluatethe importance of all numerical features and choose the top K ofthem, with the embedded ID features together, as the input of ourmodel. The results for different settings of K are summarized inTable 6. As can be seen, keeping the top-64 features achieves thebest performance. Therefore, we set this hyper-parameter as 64 inall the experiments if not specified.
Table 6: Comparison results for different settings of top-Knumerical features.
K 500 256 128 64 32 8CVR AUC 0.8479 0.8481 0.8483 0.8486 0.8441 0.8385
4.3.3 Effectiveness of Embedding Dense Numerical Features. Afterselecting the most important dense numerical features, a commonpractice is to discretize them into one-hot vectors first and thenconcatenate them with the ID features together, which are thenembedded into dense features through a linear projection layer asdescribed in Section 3.3. However, we hypothesize that the one-hot vector representation of numerical features may degrade theprecision during discretization. Therefore, we try another solutionby normalizing the numerical features first and then embed themby using a tanh activation function, i .e .,
дi j = tanh
(fi j − µfj
σfj
), (17)
where µfj and σfj denotes the mean and standard deviation of thejth kind of features. Then, we concatenate the embedded featureswith the embedded ID features together as the input of our ESM2
model. In our experiment, it achieves a gain of 0.004 AUC over thediscretization.
4.3.4 Effectiveness of Decomposing Post-Click Behaviours. Whendecomposing the post-click behaviours, we can integrate differentbehaviours into the DAction node, e .д., only Cart, onlyWish, andboth Cart and Wish (Cart & Wish), etc. Here, we evaluate theeffectiveness of decomposing post-click behaviours by choosingdifferent combinations of actions. The results are summarized inTable 7. As can be seen, the combination of both actions achievesthe best AUC scores. It is reasonable since the data sparsity issue isless server than the other two cases. For example, only 10% (3.5%)of clicked items are added to cart (wish list), while the numberbecomes to 13% if we adopt the combination of them.
Table 7: Comparison results for different choices on decom-posing post-click behaviours.
CVR AUC CTCVR AUC CTCVR GAUCCart 0.8457 0.8359 0.7996Wish 0.8403 0.8319 0.7962
Cart&Wish 0.8486 0.8371 0.8051Cart&Wish&Intent 0.8462 0.8350 0.8013
Apart from the specific behaviours which are integrated intothe DAction node, there are other behaviours such as BrowsingThe Detail Page or Click Again which means high intent to buy.For these behaviours, we can also merge them into the DActionnode and add supervisory signals. However, in contrast to thespecific behaviours with explicit and deterministic supervisorysignals, it is not straightforward to assign deterministic labels tothem. Instead, we predict an intent score based on users’ historybehaviours on the item, select those samples with high intentscores as positive actions and add supervisory signals on them.To distinguish with the deterministic signals, we call them as non-deterministic supervisory signals in this paper. The correspondingresults are listed in the last row of Table 7. As can be seen, theperformance of ESM2 degrades compared with the one only using
Conference’XXXX, XXXX, XXXX Hong Wen, Jing Zhang, Yuan Wang, Wentian Bao, Quan Lin, and Keping Yang
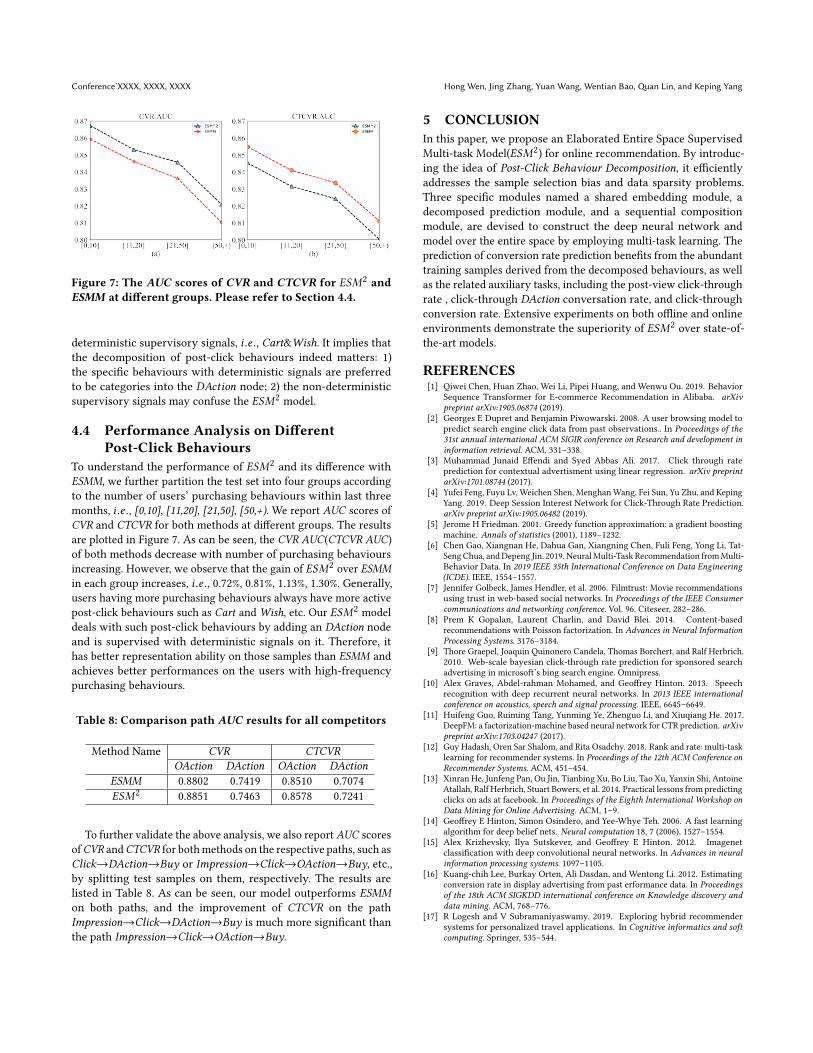
Figure 7: The AUC scores of CVR and CTCVR for ESM2 andESMM at different groups. Please refer to Section 4.4.
deterministic supervisory signals, i .e ., Cart&Wish. It implies thatthe decomposition of post-click behaviours indeed matters: 1)the specific behaviours with deterministic signals are preferredto be categories into the DAction node; 2) the non-deterministicsupervisory signals may confuse the ESM2 model.
4.4 Performance Analysis on DifferentPost-Click Behaviours
To understand the performance of ESM2 and its difference withESMM, we further partition the test set into four groups accordingto the number of users’ purchasing behaviours within last threemonths, i .e ., [0,10], [11,20], [21,50], [50,+). We report AUC scores ofCVR and CTCVR for both methods at different groups. The resultsare plotted in Figure 7. As can be seen, the CVR AUC(CTCVR AUC)of both methods decrease with number of purchasing behavioursincreasing. However, we observe that the gain of ESM2 over ESMMin each group increases, i .e ., 0.72%, 0.81%, 1.13%, 1.30%. Generally,users having more purchasing behaviours always have more activepost-click behaviours such as Cart and Wish, etc. Our ESM2 modeldeals with such post-click behaviours by adding an DAction nodeand is supervised with deterministic signals on it. Therefore, ithas better representation ability on those samples than ESMM andachieves better performances on the users with high-frequencypurchasing behaviours.
Table 8: Comparison path AUC results for all competitors
Method Name CVR CTCVROAction DAction OAction DAction
ESMM 0.8802 0.7419 0.8510 0.7074ESM2 0.8851 0.7463 0.8578 0.7241
To further validate the above analysis, we also report AUC scoresofCVR andCTCVR for bothmethods on the respective paths, such asClick→DAction→Buy or Impression→Click→OAction→Buy, etc.,by splitting test samples on them, respectively. The results arelisted in Table 8. As can be seen, our model outperforms ESMMon both paths, and the improvement of CTCVR on the pathImpression→Click→DAction→Buy is much more significant thanthe path Impression→Click→OAction→Buy.
5 CONCLUSIONIn this paper, we propose an Elaborated Entire Space SupervisedMulti-task Model(ESM2) for online recommendation. By introduc-ing the idea of Post-Click Behaviour Decomposition, it efficientlyaddresses the sample selection bias and data sparsity problems.Three specific modules named a shared embedding module, adecomposed prediction module, and a sequential compositionmodule, are devised to construct the deep neural network andmodel over the entire space by employing multi-task learning. Theprediction of conversion rate prediction benefits from the abundanttraining samples derived from the decomposed behaviours, as wellas the related auxiliary tasks, including the post-view click-throughrate , click-through DAction conversation rate, and click-throughconversion rate. Extensive experiments on both offline and onlineenvironments demonstrate the superiority of ESM2 over state-of-the-art models.
REFERENCES[1] Qiwei Chen, Huan Zhao, Wei Li, Pipei Huang, and Wenwu Ou. 2019. Behavior
Sequence Transformer for E-commerce Recommendation in Alibaba. arXivpreprint arXiv:1905.06874 (2019).
[2] Georges E Dupret and Benjamin Piwowarski. 2008. A user browsing model topredict search engine click data from past observations.. In Proceedings of the31st annual international ACM SIGIR conference on Research and development ininformation retrieval. ACM, 331–338.
[3] Muhammad Junaid Effendi and Syed Abbas Ali. 2017. Click through rateprediction for contextual advertisment using linear regression. arXiv preprintarXiv:1701.08744 (2017).
[4] Yufei Feng, Fuyu Lv, Weichen Shen, MenghanWang, Fei Sun, Yu Zhu, and KepingYang. 2019. Deep Session Interest Network for Click-Through Rate Prediction.arXiv preprint arXiv:1905.06482 (2019).
[5] Jerome H Friedman. 2001. Greedy function approximation: a gradient boostingmachine. Annals of statistics (2001), 1189–1232.
[6] Chen Gao, Xiangnan He, Dahua Gan, Xiangning Chen, Fuli Feng, Yong Li, Tat-SengChua, andDepeng Jin. 2019. NeuralMulti-Task Recommendation fromMulti-Behavior Data. In 2019 IEEE 35th International Conference on Data Engineering(ICDE). IEEE, 1554–1557.
[7] Jennifer Golbeck, James Hendler, et al. 2006. Filmtrust: Movie recommendationsusing trust in web-based social networks. In Proceedings of the IEEE Consumercommunications and networking conference, Vol. 96. Citeseer, 282–286.
[8] Prem K Gopalan, Laurent Charlin, and David Blei. 2014. Content-basedrecommendations with Poisson factorization. In Advances in Neural InformationProcessing Systems. 3176–3184.
[9] Thore Graepel, Joaquin Quinonero Candela, Thomas Borchert, and Ralf Herbrich.2010. Web-scale bayesian click-through rate prediction for sponsored searchadvertising in microsoft’s bing search engine. Omnipress.
[10] Alex Graves, Abdel-rahman Mohamed, and Geoffrey Hinton. 2013. Speechrecognition with deep recurrent neural networks. In 2013 IEEE internationalconference on acoustics, speech and signal processing. IEEE, 6645–6649.
[11] Huifeng Guo, Ruiming Tang, Yunming Ye, Zhenguo Li, and Xiuqiang He. 2017.DeepFM: a factorization-machine based neural network for CTR prediction. arXivpreprint arXiv:1703.04247 (2017).
[12] Guy Hadash, Oren Sar Shalom, and Rita Osadchy. 2018. Rank and rate: multi-tasklearning for recommender systems. In Proceedings of the 12th ACM Conference onRecommender Systems. ACM, 451–454.
[13] Xinran He, Junfeng Pan, Ou Jin, Tianbing Xu, Bo Liu, Tao Xu, Yanxin Shi, AntoineAtallah, Ralf Herbrich, Stuart Bowers, et al. 2014. Practical lessons from predictingclicks on ads at facebook. In Proceedings of the Eighth International Workshop onData Mining for Online Advertising. ACM, 1–9.
[14] Geoffrey E Hinton, Simon Osindero, and Yee-Whye Teh. 2006. A fast learningalgorithm for deep belief nets. Neural computation 18, 7 (2006), 1527–1554.
[15] Alex Krizhevsky, Ilya Sutskever, and Geoffrey E Hinton. 2012. Imagenetclassification with deep convolutional neural networks. In Advances in neuralinformation processing systems. 1097–1105.
[16] Kuang-chih Lee, Burkay Orten, Ali Dasdan, and Wentong Li. 2012. Estimatingconversion rate in display advertising from past erformance data. In Proceedingsof the 18th ACM SIGKDD international conference on Knowledge discovery anddata mining. ACM, 768–776.
[17] R Logesh and V Subramaniyaswamy. 2019. Exploring hybrid recommendersystems for personalized travel applications. In Cognitive informatics and softcomputing. Springer, 535–544.
Conversion Rate Prediction via Post-Click Behaviour Modeling Conference’XXXX, XXXX, XXXX
[18] Fuyu Lv, Taiwei Jin, Changlong Yu, Fei Sun, Quan Lin, Keping Yang, andWilfred Ng. 2019. SDM: Sequential Deep Matching Model for Online Large-scale Recommender System. arXiv preprint arXiv:1909.00385 (2019).
[19] Jiaqi Ma, Zhe Zhao, Xinyang Yi, Jilin Chen, Lichan Hong, and Ed H Chi. 2018.Modeling task relationships in multi-task learning with multi-gate mixture-of-experts. In Proceedings of the 24th ACM SIGKDD International Conference onKnowledge Discovery & Data Mining. ACM, 1930–1939.
[20] Xiao Ma, Liqin Zhao, Guan Huang, Zhi Wang, Zelin Hu, Xiaoqiang Zhu, and KunGai. 2018. Entire space multi-task model: An effective approach for estimatingpost-click conversion rate. In The 41st International ACM SIGIR Conference onResearch & Development in Information Retrieval. ACM, 1137–1140.
[21] Jeff Naruchitparames, Mehmet Hadi Güneş, and Sushil J Louis. 2011. Friendrecommendations in social networks using genetic algorithms and networktopology. In 2011 IEEE Congress of Evolutionary Computation (CEC). IEEE, 2207–2214.
[22] Yabo Ni, Dan Ou, Shichen Liu, Xiang Li, Wenwu Ou, Anxiang Zeng, and Luo Si.2018. Perceive your users in depth: Learning universal user representations frommultiple e-commerce tasks. In Proceedings of the 24th ACM SIGKDD InternationalConference on Knowledge Discovery & Data Mining. ACM, 596–605.
[23] Rong Pan, Yunhong Zhou, Bin Cao, Nathan N Liu, Rajan Lukose, Martin Scholz,and Qiang Yang. 2008. One-class collaborative filtering. In 2008 Eighth IEEEInternational Conference on Data Mining. IEEE, 502–511.
[24] Yanru Qu, Han Cai, Kan Ren, Weinan Zhang, Yong Yu, Ying Wen, and Jun Wang.2016. Product-based neural networks for user response prediction. In 2016 IEEE16th International Conference on Data Mining (ICDM). IEEE, 1149–1154.
[25] Steffen Rendle. 2010. Factorization machines. In 2010 IEEE InternationalConference on Data Mining. IEEE, 995–1000.
[26] Yelong Shen, Xiaodong He, Jianfeng Gao, Li Deng, and Grégoire Mesnil. 2014.A latent semantic model with convolutional-pooling structure for informationretrieval. In Proceedings of the 23rd ACM international conference on conference oninformation and knowledge management. ACM, 101–110.
[27] Nitish Srivastava, Geoffrey Hinton, Alex Krizhevsky, Ilya Sutskever, and RuslanSalakhutdinov. 2014. Dropout: a simple way to prevent neural networks fromoverfitting. The journal of machine learning research 15, 1 (2014), 1929–1958.
[28] Fei Sun, Jun Liu, Jian Wu, Changhua Pei, Xiao Lin, Wenwu Ou, and PengJiang. 2019. BERT4Rec: Sequential Recommendation with Bidirectional EncoderRepresentations from Transformer. arXiv preprint arXiv:1904.06690 (2019).
[29] Priyank Thakkar, Krunal Varma, Vijay Ukani, SapanMankad, and Sudeep Tanwar.2019. Combining User-Based and Item-Based Collaborative Filtering UsingMachine Learning. In Information and Communication Technology for IntelligentSystems. Springer, 173–180.
[30] Chun-Hua Tsai, Peter Brusilovsky, and Behnam Rahdari. 2019. Exploring User-Controlled Hybrid Recommendation in a Conference Context.. In IUI Workshops.
[31] Aaron Van den Oord, Sander Dieleman, and Benjamin Schrauwen. 2013. Deepcontent-based music recommendation. In Advances in neural information process-ing systems. 2643–2651.
[32] Hong Wen, Jing Zhang, Quan Lin, Keping Yang, and Pipei Huang. 2019. Multi-Level Deep Cascade Trees for Conversion Rate Prediction in RecommendationSystem. In Proceedings of the AAAI Conference on Artificial Intelligence, Vol. 33.338–345.
[33] Nathan R Wilson, Emily A Hueske, Thomas C Copeman, Evan Favermann Eisert,Jana B EGGERS, Raymond J PLANTE, and Michael D Houle. 2019. Systemsand methods for providing recommendations based on collaborative and/orcontent-based nodal interrelationships. US Patent App. 14/687,742.
[34] Jun Xiao, Hao Ye, Xiangnan He, Hanwang Zhang, Fei Wu, and Tat-Seng Chua.2017. Attentional factorization machines: Learning the weight of featureinteractions via attention networks. arXiv preprint arXiv:1708.04617 (2017).
[35] Bianca Zadrozny. 2004. Learning and evaluating classifiers under sample selectionbias. In Proceedings of the twenty-first international conference on Machine learning.ACM, 114.
[36] Feng Zhang, Victor E Lee, Ruoming Jin, Saurabh Garg, Kim-Kwang RaymondChoo, Michele Maasberg, Lijun Dong, and Chi Cheng. 2019. Privacy-aware smartcity: A case study in collaborative filtering recommender systems. J. Parallel andDistrib. Comput. 127 (2019), 145–159.
[37] Weinan Zhang, Tianxiong Zhou, JunWang, and Jian Xu. 2016. Bid-aware gradientdescent for unbiased learning with censored data in display advertising. InProceedings of the 22nd ACM SIGKDD international conference on Knowledgediscovery and data mining. ACM, 665–674.
[38] Yuyu Zhang, Hanjun Dai, Chang Xu, Jun Feng, Taifeng Wang, Jiang Bian, BinWang, and Tie-Yan Liu. 2014. Sequential click prediction for sponsored searchwith recurrent neural networks. In Twenty-Eighth AAAI Conference on ArtificialIntelligence.
[39] Guorui Zhou, Na Mou, Ying Fan, Qi Pi, Weijie Bian, Chang Zhou, XiaoqiangZhu, and Kun Gai. 2019. Deep interest evolution network for click-through rateprediction. In Proceedings of the AAAI Conference on Artificial Intelligence, Vol. 33.5941–5948.
[40] Guorui Zhou, Xiaoqiang Zhu, Chenru Song, Ying Fan, Han Zhu, XiaoMa, YanghuiYan, Junqi Jin, Han Li, and Kun Gai. 2018. Deep interest network for click-through
rate prediction. In Proceedings of the 24th ACM SIGKDD International Conferenceon Knowledge Discovery & Data Mining. ACM, 1059–1068.
[41] Wang Zhou, Jianping Li, Yongluan Zhou, and Muhammad Hammad Memon.2019. Bayesian pairwise learning to rank via one-class collaborative filtering.Neurocomputing (2019).
[42] ZH Zhou and J Feng. [n.d.]. Deep forest: Towards an alternative to deep neuralnetworks. arXiv 2017. arXiv preprint arXiv:1702.08835 ([n. d.]).
[43] Han Zhu, Junqi Jin, Chang Tan, Fei Pan, Yifan Zeng, Han Li, and Kun Gai. 2017.Optimized cost per click in taobao display advertising. In Proceedings of the 23rdACM SIGKDD International Conference on Knowledge Discovery and Data Mining.ACM, 2191–2200.
[44] Han Zhu, Xiang Li, Pengye Zhang, Guozheng Li, Jie He, Han Li, and Kun Gai.2018. Learning Tree-based Deep Model for Recommender Systems. In Proceedingsof the 24th ACM SIGKDD International Conference on Knowledge Discovery & DataMining. ACM, 1079–1088.
![XXXX XXXX XXXX XXXX XXXX XXXX 「ShAirDisk2 … XXXX XXXX XXXX XXXX XXXX XXXX XXXX XXXX XXXX XXXX A.「 ShAirDisk2 APP」を起動して[ファイルを開く]をタップすると接続されてい](https://img.pdfslide.net/doc/110x75/5b0631887f8b9a93418c6d6a/xxxx-xxxx-xxxx-xxxx-xxxx-xxxx-shairdisk2-xxxx-xxxx-xxxx-xxxx-xxxx-xxxx-xxxx-xxxx.jpg)