Embed Size (px)
Citation preview
1
FOR IMMEDIATE RELEASE: July 31, 2019
James Scalzitti
312.603.0991
Cook County TIFs to bring in nearly $1.2 Billion Chicago TIF revenue up more than 27%
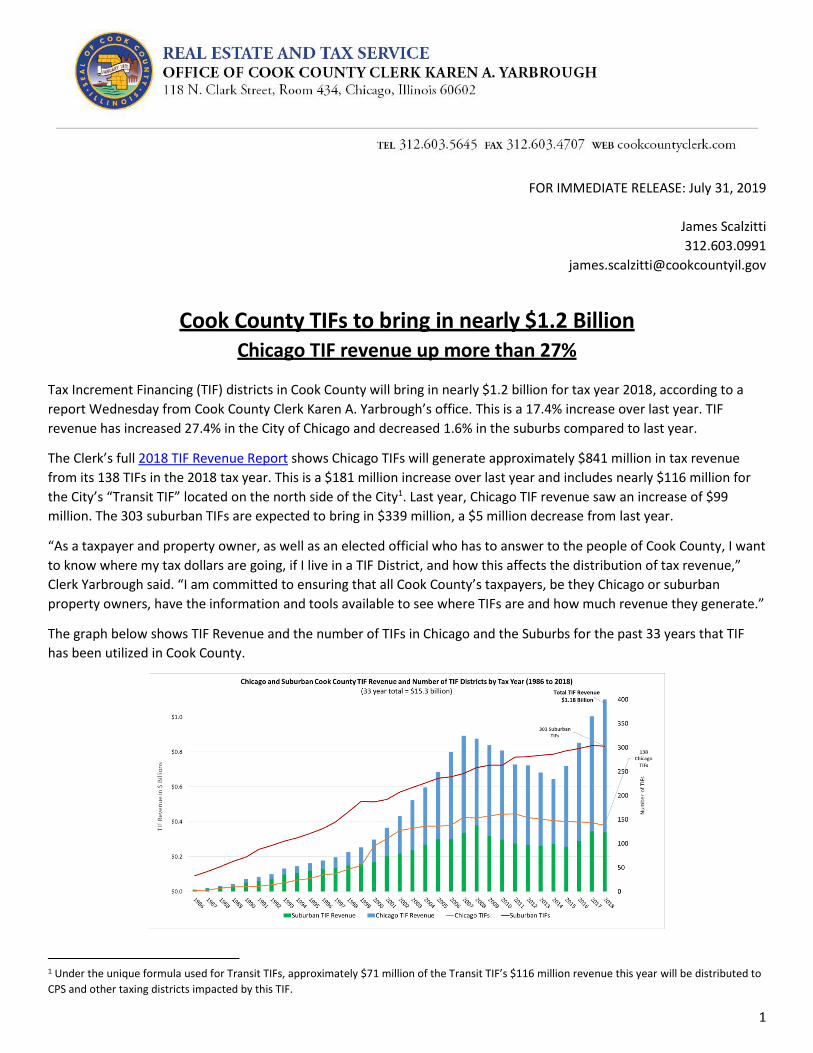
Tax Increment Financing (TIF) districts in Cook County will bring in nearly $1.2 billion for tax year 2018, according to a
report Wednesday from Cook County Clerk Karen A. Yarbrough’s office. This is a 17.4% increase over last year. TIF
revenue has increased 27.4% in the City of Chicago and decreased 1.6% in the suburbs compared to last year.
The Clerk’s full 2018 TIF Revenue Report shows Chicago TIFs will generate approximately $841 million in tax revenue
from its 138 TIFs in the 2018 tax year. This is a $181 million increase over last year and includes nearly $116 million for
the City’s “Transit TIF” located on the north side of the City1. Last year, Chicago TIF revenue saw an increase of $99
million. The 303 suburban TIFs are expected to bring in $339 million, a $5 million decrease from last year.
“As a taxpayer and property owner, as well as an elected official who has to answer to the people of Cook County, I want
to know where my tax dollars are going, if I live in a TIF District, and how this affects the distribution of tax revenue,”
Clerk Yarbrough said. “I am committed to ensuring that all Cook County’s taxpayers, be they Chicago or suburban
property owners, have the information and tools available to see where TIFs are and how much revenue they generate.”
The graph below shows TIF Revenue and the number of TIFs in Chicago and the Suburbs for the past 33 years that TIF
has been utilized in Cook County.
1 Under the unique formula used for Transit TIFs, approximately $71 million of the Transit TIF’s $116 million revenue this year will be distributed to
CPS and other taxing districts impacted by this TIF.

2
TIFs account for 8% of property taxes billed in Cook County The $1.2 billion derived from TIFs in Cook County amounts to 8% of the total property tax ($14.9 billion) billed to Cook
County taxpayers this year. Last year, $1 billion in TIF revenue accounted for 7% of the $14.4 billion property tax total.
TIFs account for 13% of the total tax billed for all taxing districts in the City of Chicago and 4% of the total tax billed for
all taxing districts in the suburbs this year. These distributions are displayed on the pie charts below.
The Clerk’s role in TIF tabulation The process of calculating property taxes begins every year with municipalities and other taxing districts approving their
annual property tax levies and submitting them to the County Clerk. The Clerk’s office calculates a tax rate for each
district by dividing the levy (the amount of property tax revenue requested by the taxing district) by the total taxable
value or equalized assessed value (EAV) of that district. That rate is applied to all properties within that district to
generate the respective tax bills.
However, TIFs work differently and the requested TIF revenue is not required to be included in a municipality’s annual
property tax levy. Pursuant to statute, TIFs follow their own approval process. Once a TIF is approved and an ordinance
is passed, the municipality submits that documentation to the County Clerk’s office. The Clerk determines the initial EAV
within the TIF as of the date the TIF was adopted. This initial EAV is then “frozen” for the life of the TIF (typically 23
years). Each subsequent year, the growth in property values reflected in EAV is measured. This value growth, known as
the Incremental EAV, is then multiplied by the composite tax rate of the properties inside the TIF to calculate the TIF
incremental revenue. The property taxes generated by this increase in property values within the TIF boundaries is
distributed to the TIF. Property tax generated by the value of the Frozen EAV in the TIF goes to the other taxing districts.
See the chart below for an illustration of this process.

3
Pursuant to statute and ordinance, TIF revenue is not requested through a tax levy and therefore is not included in a
municipality’s yearly tax levy process. Thus, once a TIF ordinance is submitted to the Clerk’s Office for the initial creation
of the TIF district, the TIF district will continue to receive TIF revenue for the duration of the TIF without requiring a
yearly levy or further documentaion. A TIF district’s revenue will continue by operation of law to be calculated in the
manner shown above, unless the Clerk’s Office is provided with writtten direction from a municipality to terminate the
TIF or alter the boundary of a TIF.
Breakdown of taxes billed by TIF revenue and Tax Levy revenue As illustrated by the pie charts below, Chicago TIF revenue, when added to the property tax generated by the City’s 2018
property tax levy, is 35% of the total tax that may be distributed to the City of Chicago. The combined total of all
suburban TIF revenue accounts for 20% of the property tax revenue to be collected by suburban municipalities2.
Factors that impact TIF revenue As shown above, TIF revenue is a combination of the composite tax rate of the taxing districts within the TIF and the
increase in EAV that has occurred since the TIF’s inception at the Frozen EAV. Of these two factors, increases in EAV
have the larger impact upon TIF revenue. This is due to the nature of the TIF and the benchmark of the Frozen EAV. If
EAVs within a TIF go up, the entirety of the revenue generated by that EAV growth is allocated to the TIF rather than to
other taxing districts.
The example below shows how a 10% increase in the total EAV of a taxing district from Year A to Year B could have a
larger impact on TIF. In the example, the 10% increase of total EAV resulted in a 13.6% increase in the TIF’s revenue
share, as opposed to 5% the year before.
2 Suburban TIF total as compared to total property tax extension for all suburban cities, towns, and villages, with or without TIF.

4
City of Chicago TIFs The City of Chicago was reassessed for tax year 2018, resulting in a 12.5% increase in total EAV. This EAV increase
contributed to the 27.4% increase in the City’s TIF revenues.
The highest performing TIFs in the City of Chicago this year are located primarily in or around the downtown area.
However, the Pilsen TIF on the south side of the City increased 26% and has the 10th highest revenue this year. TIF
revenue also increased for the Red Purple Modernization Phase 1 (RPM1) Transit TIF in the north side neighborhood of
Lakeview, making it the largest TIF both geographically and financially this year. For more specific information on transit
TIFs, see Transit TIF Fact Sheet, Chicago TIF Overview & Chicago TIF Summary
The following chart shows the 10 highest revenue TIFs in the City of Chicago this year. Each TIF will bring in more than
$20 million this year.
TIF First Year 2018 Revenue Total Revenue
Chicago - Transit RPM1 2016 $115,735,214.75 $174,105,069.79
Chicago - LaSalle Central 2006 $100,926,569.59 $361,771,088.82
Chicago - Kinzie Conservation (Industrial Area) 1998 $49,229,212.64 $367,926,939.81
Chicago - Near North 1997 $35,716,959.86 $330,800,054.76
Chicago - River South 1998 $34,448,113.13 $273,240,094.76
Chicago - Chicago / Kingsbury 2000 $33,177,660.74 $270,644,567.14
Chicago - Canal / Congress 1998 $31,399,421.84 $335,286,098.90
Chicago - Central West 2000 $30,425,107.45 $248,283,003.88
Chicago - River West 2001 $25,761,204.13 $211,968,592.60
Chicago - Pilsen 1998 $20,643,537.57 $184,639,325.34
5
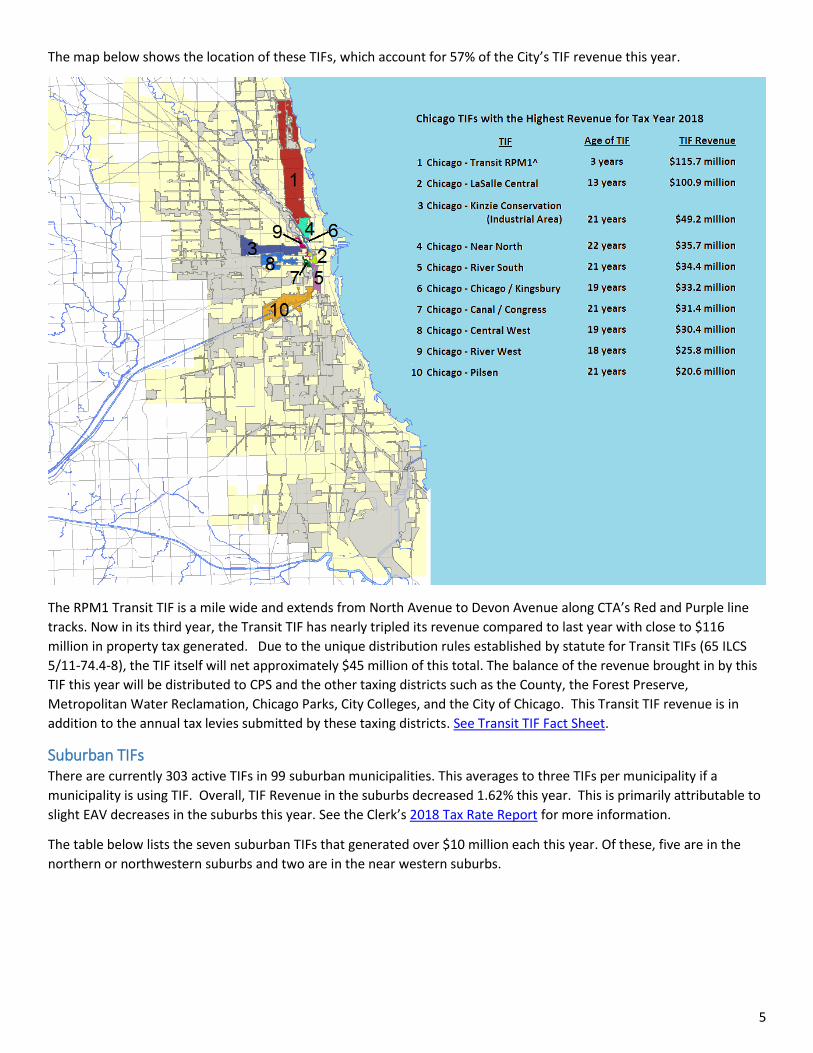
The map below shows the location of these TIFs, which account for 57% of the City’s TIF revenue this year.
The RPM1 Transit TIF is a mile wide and extends from North Avenue to Devon Avenue along CTA’s Red and Purple line
tracks. Now in its third year, the Transit TIF has nearly tripled its revenue compared to last year with close to $116
million in property tax generated. Due to the unique distribution rules established by statute for Transit TIFs (65 ILCS
5/11-74.4-8), the TIF itself will net approximately $45 million of this total. The balance of the revenue brought in by this
TIF this year will be distributed to CPS and the other taxing districts such as the County, the Forest Preserve,
Metropolitan Water Reclamation, Chicago Parks, City Colleges, and the City of Chicago. This Transit TIF revenue is in
addition to the annual tax levies submitted by these taxing districts. See Transit TIF Fact Sheet.
Suburban TIFs There are currently 303 active TIFs in 99 suburban municipalities. This averages to three TIFs per municipality if a
municipality is using TIF. Overall, TIF Revenue in the suburbs decreased 1.62% this year. This is primarily attributable to
slight EAV decreases in the suburbs this year. See the Clerk’s 2018 Tax Rate Report for more information.
The table below lists the seven suburban TIFs that generated over $10 million each this year. Of these, five are in the
northern or northwestern suburbs and two are in the near western suburbs.

6
TIF First Year 2018 Revenue Total Revenue
Glenview - Naval Air Station 1999 $36,677,410.89 $453,178,785.73
Hoffman Estates - Sears 1989 $23,205,954.92 $609,432,152.19
Rosemont - River Road 1984 $17,079,928.10 $341,087,750.15
Town of Cicero 1987 $12,908,052.48 $231,092,515.05
Schaumburg - North Schaumburg 2014 $12,453,521.65 $27,817,794.21
Rosemont - South River Road (4) 1998 $12,351,020.44 $66,154,876.87
Oak Park - Greater Mall Area 1983 $11,756,171.44 $193,354,621.55
The map below shows the locations of these TIFs.
The northern and northwestern suburbs are currently being reassessed for tax year 2019. Increases or decreases in
taxable values (EAVs) will likely have an impact on the TIFs in those areas.
See the 2018 Suburban TIF Overview and 2018 Suburban TIF Summary.
Additional TIF Information
To view data on each TIF district, see these PDF sections of the TIF Report: Countywide summary, Chicago summary,
Suburban summary, Tax Increment Agency Report, Chicago Overview, Suburban Overview, Transit TIF Fact Sheet, & TIF
FAQs.

7
Visit TIF Viewer, a mapping application, to see TIF data at the map level and search by municipality, ward, address or
PIN.
For a brief overview and refresher regarding 2018 TIFs, view our 2018 TIF Quick Fact Sheet.
Previous TIF reports, the TIF property search tool, and TIF maps can be found at cookcountyclerk.com/tifs.

Tax Year 2018 Tax Year 2017 Difference
Cook County TIF Revenue $1,179,496,839 $1,004,310,680 17.44%
City of Chicago TIF Revenue $840,821,021 $660,045,711 27.39%
Suburban Cook County TIF Revenue $338,675,818 $344,264,969 -1.62%
Percentage of Cook County TIF Revenue in City of Chicago: 71.29% 65.72%
North Suburban TIF Revenue $195,284,193 $195,781,870 -0.25%
South Suburban TIF Revenue $143,391,625 $148,483,099 -3.43%
Number of TIFs in Cook County 441 447 -6
Number of TIFs in Chicago 138 143 -5
Percentage of Cook County TIFs in Chicago 31.29% 31.99%
Total Parcels in Cook County: 1,864,590 1,864,621 -31
Total TIF Parcels in Cook County: 272,554 275,345 -2,791
Percentage of Cook County Parcels in TIF: 14.62% 14.77%
Fraction of Cook County Parcels in TIF: 1/7 1/7
Percentage of Residential1
Parcels in TIF 10.57% 10.72%
Fraction of Residential1 Parcels in TIF: 1/11
Percentage of Cook County TIF Parcels that are Residential161.30% 61.59%
Total Parcels in City of Chicago: 882,702 882,897 -195
Total TIF Parcels in City of Chicago: 228,538 231,132 -2,594
Percentage of Chicago Parcels in TIF: 25.89% 26.18%
Fraction of Chicago Parcels in TIF: 1/4 1/4
Percentage of Chicago Residential1 Parcels in TIF 20.07% 20.27%
Fraction of Chicago Residential1 Parcels in TIF: 1/5 1/5
Percentage of Chicago TIF Parcels that are Residential163.90% 63.95%
Total Parcels in Suburbs: 981,888 981,724 164
Total TIF Parcels in Suburbs: 44,016 44,213 -197
Percentage of Suburban Parcels in TIF: 4.48% 4.50%
Fraction of Suburban Parcels in TIF: 1/22 1/22
Total Parcels in North Suburbs: 454,299 454,006 293
Total TIF Parcels in North Suburbs: 13,911 13,948 -37
Percentage of North Suburban Parcels in TIF: 3.06% 3.07%
Fraction of North Suburban Parcels in TIF: 1/33 1/33
Total Parcels in South Suburbs: 527,589 527,718 -129
Total TIF Parcels in South Suburbs: 30,105 30,265 -160
Percentage of South Suburban Parcels in TIF: 5.71% 5.74%
Fraction of South Suburban Parcels in TIF: 1/18 1/181Class 2 Residential Parcels
Cook County TIF Quick Facts 2018

1
TIF FAQs
What is a TIF? "TIF" stands for Tax Increment Financing, a statutory financing tool that municipalities can use to generate funds for economic development in a specific geographic area. TIFs allow municipalities to re-invest all tax dollars generated by value growth within the TIF district for typically a 23-year period.
A TIF district generates revenue when a new development takes place in the TIF district, or if the value of existing properties rise due to the increased market value of the properties in the TIF. These funds can be spent on public works projects or given as subsidies to encourage private development. TIF revenue can also be used by a municipality to acquire private property and demolish buildings to make way for new construction.
How is TIF revenue determined? When a TIF is established, the County Clerk certifies the initial taxable value (also known as equalized assessed value or EAV) within the TIF area. This initial or base value is then “frozen” for the life of the TIF. Taxing districts within the TIF have access to only the “frozen” value when their tax rates are calculated. If there is any increase in EAV within the TIF, the Clerk will then calculate that value growth, or “increment”, that occurs in a TIF each year. That increment is multiplied by the composite tax rate of all the taxing districts in the TIF to establish the amount of incremental revenue to be directed to the TIF.
Why is Cook County TIF revenue is up 17% this year? As shown above, TIF revenue is driven by tax rates and the growth in taxable value (EAV) that occurs within the TIF area. Of these two factors, growth within the TIF has a larger impact on TIF revenue.
Taxable values in Cook County are up 5% overall this year. More specifically, EAVs have increased 12.5% within the City of Chicago and decreased 2.4% in the suburbs. These increases and decreases have contributed to the 17.4% increase in Cook County TIF revenue, with a 27.4% increase in TIF revenue within the City of Chicago and a 1.6% decrease in TIF revenue in the suburbs.
Below is an example of how increasing EAVs impact the revenue generated within a TIF:
For instance, if the total taxable value (EAV) in a TIF were to increase 10% (from 100,000 to 110,000), the frozen value would remain the same (95,000) while the incremental value would see a larger percentage increase (5% of total EAV of the district to 13.6%):

2
Sample TIF Prior Year Value Current Year Value Increase
Total Taxable Value 100,000 110,000 10%
Frozen Value 95,000 95,000 0%
Incremental Value 5,000 15,000 200%
Portion of Revenue to TIF 5% 13.6% 172%
As the example above illustrates, when taxable value increases combined with increases in tax rates, TIF revenues increase more rapidly than would traditional property taxes.
What happens to TIF funds? The statutory intent of TIF is to revitalize economically blighted areas or older structures in need of renovation and rehabilitation. With active community participation, TIFs can be a useful tool for implementing community-based revitalization plans through encouraging affordable housing development, improving parks and schools, fixing basic infrastructure, putting vacant land to productive use, creating well-paying jobs, and meeting other local needs.
TIF revenue is administered by the municipality, which has wide discretion over how TIF revenue is spent as defined in the approving ordinance of each TIF. Additionally, municipalities are able to enter into Intergovernmental Agreements with schools and other taxing districts to utilize TIF funds for capital improvement projects within those districts.
What is porting? Statute allows a municipality to transfer TIF revenue generated in one TIF district to adjoining TIF districts to fund regional projects (65 ILCS 5/11-74.4-4(q)). This transfer of funds from one TIF to another is known as “porting”.
What happens when a TIF retires? The typical lifespan of a TIF is 23 years, though TIFs may be extended through legislation or terminated early by the municipality. There are two ways other taxing districts may benefit when a TIF retires: TIF Surplus and recovered TIF value.

3
• TIF Surplus may be declared by the municipality at any time during the life of a TIF, but normally it is declared after the TIF retires. The surplus is surrendered to the Cook County Treasurer, who distributes it proportionally to all of the taxing districts affected by the TIF.
• After a TIF has been retired, taxing districts, who were formerly only able to tax at the frozen value, are able to recover all of the “new” value (previously the increment value) within their boundaries which was going to the TIF. In the year the TIF retires, districts may increase their levies to receive a one-time revenue increase because of the addition of the increment value, without a corresponding increase in the tax rate applied to their taxpayers.
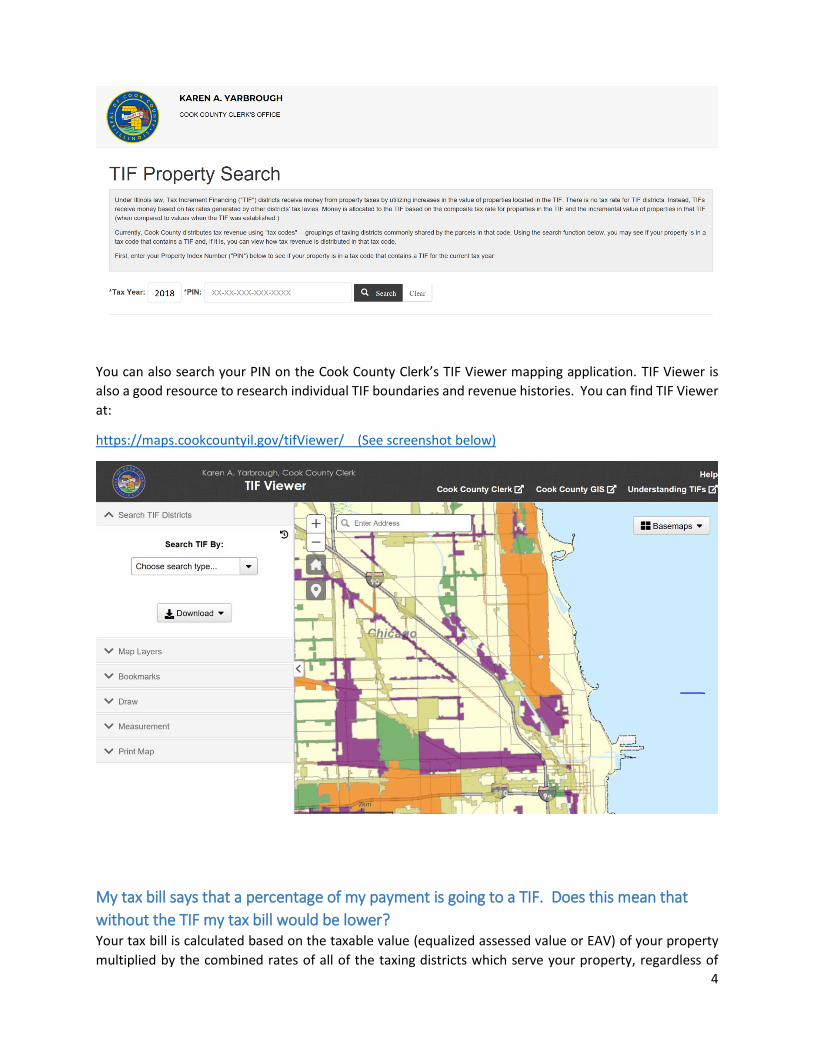
Is my property in a TIF? If your property is in a TIF district, it will be listed in the Municipality/Township Taxes section of your tax
bill.
You may also search your PIN on the Cook County Clerk’s TIF Property Search portal at:
https://tif.cookcountyclerk.com (See screenshot below)
4
You can also search your PIN on the Cook County Clerk’s TIF Viewer mapping application. TIF Viewer is
also a good resource to research individual TIF boundaries and revenue histories. You can find TIF Viewer
at:
https://maps.cookcountyil.gov/tifViewer/ (See screenshot below)
My tax bill says that a percentage of my payment is going to a TIF. Does this mean that
without the TIF my tax bill would be lower? Your tax bill is calculated based on the taxable value (equalized assessed value or EAV) of your property
multiplied by the combined rates of all of the taxing districts which serve your property, regardless of

5
whether your property is in a TIF district or not. The difference the TIF makes is where your tax dollars
are going.
As illustrated below, if a property is not located within a TIF, all of its tax bill goes to the taxing districts
(municipality, school, park, etc). If a property is in a TIF, part of the tax bill goes to the TIF and the rest
goes to the taxing districts. Thus, although each taxpayer is paying the same amount in taxes, the taxes
are distributed differently.
Furthermore, a TIF will affect all those taxpayers within a taxing district that are subject to the TIF. Because a TIF captures the incremental value, which is no longer available to the other taxing districts, the tax levies of the other districts are now distributed upon a smaller amount of EAV which results in the tax rates of those districts being higher. Consequently, tax bills are higher for all properties in taxing districts affected by TIF.
As shown in the example below, where Taxing District X and Y request the same amount for their levy ($100,000) but District X has no TIF, the levy for District X will be divided by the full taxable value or EAV (1,000,000). However, for District Y, its levy ($100,000) is divided by the remainder of EAV, after the incremental value is given to the TIF, or the 800,000. Hence, the tax rate for District X without the TIF is 10% (1,000,000 / 100,000), where the tax rate for District Y with the TIF is 12.5%(800,000 / 100,000). Also note, the 12.5% tax rate is applied to all properties in District Y, regardless of the property being within the TIF boundaries or not.

6
*The above examples are purely hypothetical and do not represent actual properties or TIFs
What is a “Transit TIF” and what does it mean to my taxes? Generally, Tax Increment Financing (TIF) is a statutory financing tool that municipalities may use to
generate funds for economic development in a specific geographic area. In a typical TIF, properties within
the TIF area must meet certain criteria, such as blight, or other indicators of economic hardship in order
for a TIF to be established. As stated previously, the other taxing districts, such as Schools, Park Districts,
and Libraries, only have access to the frozen base taxable value within the TIF district at the time the TIF
is created for the duration of the TIF (typically 23 years). And, any tax revenue generated from the value
growth within the TIF is directed to the TIF itself.
However, Transit TIFs differ from traditional TIFs in that there is no hardship requirement and they may
last for 35 years. Another major distinction of a Transit TIF is that part of the tax revenue generated from
the value growth within the Transit TIF is distributed to the other taxing districts. (See 65 ILCS 5/11-74.4-
8) The first Transit TIF in the City of Chicago is intended to modernize the north side CTA Red and Purple
train lines with the assistance of revenue from Federal and State grants.
My property is in the Chicago RPM1 Transit TIF. If your property is in Chicago’s Transit TIF on the North Side, you will see two line items on your bill related
to this TIF. Due to the statutory rules regarding the distribution of Transit TIF funds, part of the Transit
TIF revenue generated each year goes to the other taxing districts. CPS receives its statutory share of the
TIF revenue, while 80% of the remainder goes to the TIF and the other 20% is distributed proportionally
to the other taxing districts. The two line items regarding the Transit TIF shows the amount of the taxes
distributed to CPS and the amount which went to the Transit TIF. The other 20% is not delineated per
district but included in the total amounts shown of the other taxing districts. Accordingly, tax bills for the
properties that fall within the Chicago RPM1 Transit TIF will appear as shown below.

7
The amount of TIF revenue directed to CPS is displayed on Transit TIF tax bills as “Board of
Education – TIF RPM1” in the School Taxes section of the bill.
The amount going to the TIF itself is displayed as “TIF Transit City of Chicago-Rpm1” in the
Muncipality/Township Taxes section of the bill.
For more information on the City’s Transit TIF, see the Transit TIF Fact Sheet.
What resources does the Clerk have available to research TIFs? In addition to the TIF Property Search and TIF Viewer application, the Cook County Clerk also provides TIF
Reports, TIF Maps, and a short, informative video “Understanding TIFs” on our website:
https://www.cookcountyclerk.com/agency/tifs-tax-increment-financing (See screenshot below)
What other resources are available to research TIFs? Municipalities are required to file annual reports with the Illinois Comptroller’s office. Those reports are
available online at: http://warehouse.illinoiscomptroller.com/

8
The following organizations also provide information regarding TIFs:
Illinois Tax Increment Association: http://www.illinois-tif.com/
The Civic Federation: https://www.civicfed.org/
The TIF Illumination Project: http://www.tifreports.com/
City of Chicago TIF Data Portal: https://www.chicago.gov/city/en/depts/dcd/provdrs/tif.html

1
City of Chicago Transit TIF – Red Purple Modernization Phase 1 (RPM1) Fact Sheet
Overview of RPM1 Transit TIF • Intended to fund transit improvements along CTA rail lines on the north side of Chicago and repay federal loans
• First Transit TIF in Illinois – adopted by City Council November 30, 2016
• Located along CTA Red and Purple line tracks on north side from North Ave to Devon Ave
• Approximately 5 square miles

Transit TIF Revenue in 2018 TIF Revenue is calculated by multiplying the Incremental value in the TIF (the current taxable value of the TIF minus
the base or “frozen” value of the TIF at the time of its inception) by the composite tax rate of the properties within
the TIF.
The graph below shows an estimate of value growth which could occur within the RPM1 Transit TIF over its 35-year lifespan.
$0
$2
$4
$6
$8
$10
$12
$14
$16
EAV
in B
illio
ns
Estimated TIF Increment Growth of Transit TIF*
Base Value (2015) Estimated Increment*
*Years 2019+ are based on estimated 2% EAV growth per year

3
Unique Statutory Rules for Transit TIFs • May run for 35 years (rather than 23 years for traditional TIFs)
• No “blight” requirement (65 ILCS 5/11-74.4-8)
• A portion of Transit TIF revenues are distributed to other Taxing Districts in addition to annual tax levies:
1. CPS receives their proportionate share of TIF revenue1
2. 80% of non-CPS portion is distributed to Transit TIF
3. 20% of non-CPS portion is distributed proportionally to other taxing districts
1 CPS proportionate share of Transit TIF revenue is based on the annual tax rate for CPS compared to the total composite tax rate of all taxing districts servicing Transit TIF properties. (Example: 2018 CPS rate = 3.552% and Chicago General Composite Rate = 6.786% making CPS 52.34% of the overall tax rate.)
$0
$100
$200
$300
$400
$500
$600
$700
Tran
sit
TIF
Rev
enu
e in
Mill
ion
s
Estimated Annual Transit TIF Revenue*
Chicago Public Schools52.34%
Transit TIF38.13%
Other Districts9.53%
Distribution of TIF funds for Typical Transit TIF PIN in Tax Year 2018
*Years 2019+ are based on estimated 2% value increase per year and estimated 7% annual tax rate Total Incremental revenue – includes portion to be distributed to other tax districts

4
Transit TIF Tax Bills A typical second installment property tax bill shows the breakdown of where your taxes go, including the
portion, if any, going to TIF.
The statute authorizing Transit TIFs stipulates that part of the incremental revenue generated by the
Transit TIF should go to other taxing districts. The amount directed to CPS is displayed on Transit TIF tax
bills as “Board of Education – TIF RPM1” in the School Taxes section of the bill.
The amount going to the TIF itself is displayed as “TIF Transit City of Chicago-Rpm1” in the
Muncipality/Township Taxes section of the bill.

5
2018 Distribution of Transit TIF Revenue by Taxing District
District Name Revenue from Transit TIF
Tax Year 2017 Revenue from Transit TIF
Tax Year 2018
Cook County $543,445.08 $1,652,554.30
Forest Preserve District $67,930.63 $202,767.40
City of Chicago $2,075,171.32 $6,123,575.44
Chicago Special Service Area 8-2011 $31,718.70 $57,096.17
Chicago Special Service Area 9 (no levy in tax years 2017 & 2018) $0.00 $0.00
Chicago Special Service Area 17-2011 $27,784.90 $70,811.71
Chicago Special Service Area 18 $10,590.38 $30,234.15
Chicago Special Service Area 22 $765.54 $2,071.66
Chicago Special Service Area 23 $2,260.20 $4,419.54
Chicago Special Service Area 26 $4,211.59 $7,012.46
Chicago Special Service Area 27-2011 $4,207.54 $8,505.93
Chicago Special Service Area 31 $62.68 $110.04
Chicago Special Service Area 34 $10,160.19 $23,539.09
Chicago Special Service Area 35-2011 $1,971.03 $10,249.37
Chicago City Colleges $179,687.49 $496,780.14
Chicago Board of Education $21,310,497.49 $60,019,150.06
Chicago Park District $392,244.63 $1,115,220.69
Metropolitan Water Reclamation District $440,971.35 $1,338,264.83
Transit TIF - Red Purple Modernization Phase 1 $15,170,661.53 $44,572,851.75
Total Incremental Revenue Generated by Transit TIF $40,274,342.28 $115,735,214.73

1
City of Chicago Tax Year 2018 TIF Overview
Chicago TIFs
• There are 138 active TIFs in the City of Chicago, five fewer than last year. • More than 1 in 4 properties in City of Chicago lie within TIF districts.

2
Chicago cancelled seven TIFs in 2018. Four TIFs expired while three TIFs were terminated early.
Terminated Chicago TIFs for Tax Year 2018
TIF Name Parcels Ward(s) Total TIF Revenue
(All Years) 2017 TIF Revenue
(Final Year)
TIF City of Chicago - 41st St/King Dr Expired 69 3 $3,354,541.97 $21,673.10
TIF City of Chicago - Calumet Ave/Cermak Rd Expired 15 3 $161,008,789.39 $13,035,217.01
TIF City of Chicago - Lincoln/Belmont/Ashland Expired 160 44&47 $22,993,439.90 $1,440,372.53
TIF City of Chicago - Read Dunning Expired 671 38 $54,715,092.69 $ 2,958,826.01
TIF City of Chicago - Drexel Blvd Dissolved Early (after 16 years) 278 3&4 $4,133,549.73 $408,004.72
TIF City of Chicago - Ravenswood Dissolved Early (after 13 years) 596 47 $12,137,609.07 $ 1,956,108.26
TIF City of Chicago Weed/Freemont Dissolved Early (after 10 years) 2 2 $4,513,437.12 $ 855,342.62
Chicago created two new TIFs in 2018.
New Chicago TIFs for Tax Year 2018
TIF Name
Parcels Ward(s) 2018 TIF Revenue
(First Year)
Chicago - 116th/Avenue O New TIF 62 10 $15,987.59
Chicago - Foster/Edens New TIF 180 39 $423,922.72
TIF Revenue in the City of Chicago:
• Chicago TIFs will generate a record $841 million for tax year 2018, over 13% of total property tax billed in the City of Chicago. • Chicago TIF revenue increased $181 million (27.4%) over tax year 2017 • Last year, Chicago TIF revenue increased $99 million (17.4%) over tax year 2016 • Approximately $79.1 million of the $115.7 million generated by Chicago’s RPM1 Transit TIF will be directed to other taxing districts this year (See Transit
TIF fact sheet) • Of the Chicago TIFs that did generate revenue this year, the lowest was the new “116th/Avenue O” TIF with approximately $16,000 in its first year.

3
Ten Chicago TIFs generated over $20 million each in 2018.
Seven Chicago TIFs generated no revenue this year due to having no overall incremental value growth.
TIFs with no Revenue for Tax Year 2018
TIF Name First Year Ward(s) Total TIF Revenue
(All Years) Most Recent Revenue
Chicago - 67th / Wentworth 2011 6, 16, 17 & 20 $0.00 No Revenue generated
Chicago - Harlem Industrial Park 2007 13 & 23 $940,208.06 2010: $126,890.90
Chicago - Irving Park / Elston 2009 35, 39 & 45 $817,802.91 2010: $291,373.05
Chicago - Little Village East 2009 12, 22 & 24 $476,381.79 2011: $14,571.92
Chicago - Little Village Industrial 2007 22 $1,995,151.53 2010: $141,485.87
Chicago - South Works 2000 10 $1,595,477.96 2016: $58,239.81
Chicago - West Woodlawn 2010 20 $111,003.91 2010: $111,003.91

4
Chicago TIF Revenue compared to Property Tax Levy The total property tax revenue generated by the City of Chicago’s annual property tax levy for tax year 2018 is $1.56 billion. Property tax revenue generated by Chicago TIFs this year is $841 million, over 35% of the total property tax revenue generated for the City of Chicago. The charts below illustrate the comparison between the City of Chicago’s property tax levy and Chicago TIF revenue.
Overall TIF Revenue increased 27.4% in the City of Chicago but individual TIFs vary. For more information about the revenue generated by individual TIFs in The City of Chicago see the 2018 Chicago TIF Summary Report.

1
Suburban Cook County Tax Year 2018 TIF Overview
Suburban TIFs
• There are 303 active TIFs in Suburban Cook County. There are TIFs in 74% of suburban Cook County municipalities. • Approximately 1 in 22 properties in Suburban Cook County lie within TIF districts. Countywide, 1 in 7 properties are in TIF districts.

2
Fourteen new TIFs were created in the Suburbs, and one suburban TIF was expanded.
New Suburban TIFs for Tax Year 2018
TIF Name Parcels 2018 Revenue
Calumet City - River Oaks Mall TIF New TIF 53 $0.00
Chicago Heights - East Industrial TIF New TIF 499 $363,536.07
Cicero - 1400 S. Laramie TIF Previously part of 54th Ave TIF 1 $0.00
Elmwood Park - Grand Ave Corridor II TIF Previously part of Grand Ave Corridor TIF 172 $73,945.33
Lemont - Transit TOD TIF Previously part of Downtown Canal 1 TIF 123 $24,240.96
Niles - Milwaukee/Harlem TIF New TIF 135 $0.00
Niles - Oakton/Waukegan TIF New TIF 15 $20,858.76
Niles - Milwaukee/Oakton TIF New TIF 130 $1,722.09
Niles - Milwaukee/Dempster TIF New TIF 77 $0.00
River Forest - North Ave TIF New TIF 366 $0.00
Tinley Park - New Bremen TIF Previously part of Main Street South TIF 274 $162,143.86
Expanded Suburban TIFs for Tax Year 2018
TIF Name
Added Parcels
2018 Revenue (Whole TIF)
2017 Revenue (Whole TIF)
Rosemont - Balmoral/Pearl 8 TIF Previously part of River Road TIF 2 $3,007,172.57 $141,826.17

3
Twelve suburban TIFs were terminated, including four TIFs which were dissolved ahead of schedule, and six suburban TIFs were reduced in size.
Terminated Suburban TIFs for Tax Year 2018
TIF Name
Parcels Total TIF Revenue
(All Years)
Tax Year 2017 Revenue
(Final Year)
Bellwood - C&NW Project 2 TIF TIF Expired 2 $1,058,023.68 $42,430.28
Blue Island - 3 TIF TIF Expired 377 $12,176,042.74 $638,813.52
Chicago Heights - 4 TIF TIF Expired 1 $1,003,897.43 $0.00
Dixmoor TIF TIF Expired 269 $5,146,108.13 $324,766.08
Evanston-Washington National TIF TIF Expired 384 $66,126,424.99 $5,849,892.74
Northlake - North Ave/Wolf Rd SW Comm TIF TIF Expired 81 $23,555,718.28 $971,999.96
Thornton - Downtown TIF TIF Expired 44 $5,495,646.21 $191,470.34
Burbank - 79th/Lavergne TIF TIF cancelled after 1 year 11 $0.00 $0.00
Chicago Heights - 8 TIF TIF cancelled after 12 years 11 $76,751.19 $4,970.15
River Grove - 3 TIF TIF cancelled after 7 years 14 $0.00 $0.00
Tinley Park (aka Oak Park Ave) TIF TIF cancelled after 15 years 365 $65,527,524.01 $5,036,814.52
Tinley Park - Main Street South TIF TIF Expired - land now part of New Bremen TIF 211 $5,925,811.56 $164,028.54
Reduced Suburban TIFs for Tax Year 2018
TIF Name
Removed Parcels
2018 Revenue (Whole TIF)
2017 Revenue (Whole TIF)
Bellwood - Central Metro 2014 TIF Land removed from TIF 2 $1,104,466.76 $242,465.60
Burbank - Downtown TIF Land removed from TIF 23 $368,822.03 $83,440.10
Cicero - 54th Ave TIF Removed land now in 1400 S. Laramie TIF 1 $517,452.31 $0.00
Elmwood Park - Grand Ave Corridor TIF Removed land now in Grand Ave Corridor II TIF 172 $0.00 $189,680.90
Lemont - Downtown Canal 1 TIF Removed land now in Transit TOD TIF 9 $253,262.27 $271,588.52
Rosemont - River Road TIF Removed land now in Balmoral/Pearl 8 TIF 2 $17,079,928.10 $17,428,933.90

4
TIF Revenue in Suburban Cook County Revenue from suburban TIF districts decreased from $344 million last year to $339 million this year. This 1.6% decrease is driven primarily by decreased taxable values (equalized assessed values or EAVs) due to a 2 percent decrease in the state equalizer.
Seven Suburban TIFs generated over $10 million each

5
In the suburbs, 18 TIFs, including five new TIFs, have generated no revenue over their lifetimes.
Suburban TIFs with no lifetime revenue
TIF NAME First Year Total TIF Revenue (All Years)
Bridgeview - 78th Ave TIF 2016 $0.00
Brookfield - Congress Park TIF 2011 $0.00
East Hazel Crest - Halsted St TIF 2016 $0.00
Franklin Park - Centrella / Seymour TIF 2011 $0.00
Glenwood - Town Center TIF 2011 $0.00
Harvey - Dixie Hwy Corridor TIF 2013 $0.00
Hodgkins - East Avenue TIF 2011 $0.00
Homewood - East CBD TIF 2011 $0.00
Lincolnwood - Lincoln / Touhy TIF 2011 $0.00
Olympia Fields - Lincoln Hwy / Western Ave TIF 2010 $0.00
Phoenix - 151st St/Wallace St TIF 2013 $0.00
Phoenix - Northern Phoenix TIF 2014 $0.00
Calumet City - River Oaks Mall TIF New 2018 2018 $0.00
Cicero - 1400 S. Laramie TIF New 2018 2018 $0.00
Niles - Milwaukee/Dempster TIF New 2018 2018 $0.00
Niles - Milwaukee/Harlem TIF New 2018 2018 $0.00
River Forest - North Ave TIF New 2018 2018 $0.00
Suburban TIFs experienced fluctuations this year, primarily due to increases or decreases in taxable value (equalized assessed value or EAV) growth or declines within their boundaries. For more information about individual suburban TIF revenue, see: 2018 Suburban TIF Summary.

6
Suburban Cook County TIFs compared to the City of Chicago TIFs in the City of Chicago generated the most revenue this year, but suburban TIFs account for three of the top 15 grossing TIFs for tax year 2018.

7
TIFs with the greatest lifetime revenue Of the active TIFs in Cook County with the highest lifetime revenue, three of the five are in suburban Cook County. Hoffman Estates Sears TIF has generated the most revenue over its life, followed by Glenview Naval Air Station. The Rosemont – River Road is number five, after two Chicago TIFs: Kinzie Conservation and LaSalle Central.

TIF CITY OFCHICAGO
LAKE CALUMET
TIF CITY OF CHICAGOMIDWEST
TIFTOWN
OFCICERO
TIF VIL OF GLENVIEWNAVAL AIR STATION
TIF CITY OF CHICAGOPILSEN AREA
TIF CITY OFCHICAGOGREATER SW WEST
TIF VIL OFHOFFMANESTATES
SEARS
TIF CITY OF CHICAGO - KINZIE CONSERVATION
TIF CITY OFCHICAGOWESTERN/
OGDEN AVE
TIF CITY OFCHICAGO71ST ST/
STONY ISLAND
TIF CITY OF CHICAGOBRONZEVILLE
TIF CITY OFCHICAGO
NEAR NORTH
TIF CITY OF CHICAGOGALEWOOD/ARMITAGE
TIF VIL OF LANSING
TIF CITY OFCHICAGO
WOODLAWN
TIF CITY OFCOUNTRYSIDE
COUNTRYSIDE COMMERCIAL
TIF VIL OFALSIP
123RD PL /CICERO
TIF CITY OFCHICAGO
MIDWAY INDCORRIDOR
TIF VIL OFMATTESONCOMMONS
TIF VIL OFNILES - 4
TIF CITY OFCHICAGOMADISON/
AUSTIN
TIF CITY OFCHICAGO
NW INDUSTRIALCORRIDOR
TIF VIL OFSAUK VILLAGE - 2
TIF VIL OFLANSING
BERNICE RD
TIF CITY OFCHICAGO
SOUTHCHICAGO
TIF CITY OFCALUMET CITY - 2
TIF CITY OF CHICAGOROOSEVELT RD/CICERO AVE
TIF CITY OF CHICAGO CENTRAL WEST
TIF CITY OF CHICAGOROOSEVELT RD/UNION
TIF CITY OF CHICAGO43RD ST/COTTAGE GROVE
TIF VIL OF SUMMIT63RD ST & ARCHER AVE
TIF VIL OFDIXMOOR - 2
TIF VIL OF GLENWOODINDUSTRIAL PARK
TIF VIL OF PALATINEDOWNTOWN
TIF CITY OFCHICAGO
63RD/PULASKI
TIF VIL OFPALATINE
TIF CITY OF CHICAGORANDOLPH/WELLS
TIF CITY OFOAK FORESTCICERO AVE
TIF CITY OFCHICAGO
51ST / LAKE PARK
TIF VIL OFMATTESON - 7
NORTH CICERO
TIF VIL OFALSIP
NW CICERO/ I 294
TIF VIL OFBRIDGEVIEWGOLF DOME
TIF VIL OFMOUNT PROSPECT
PROSPECT AND MAIN
TIF CITY OF CHICAGOROOSEVELT RD/CANAL ST
TIF VIL OFMcCOOK
FIRST AVE
TIF CITY OFCHICAGO47TH ST/
ASHLAND
TIF VIL OFCHICAGO RIDGE - 3
TIF VIL OF LEMONTDOWNTOWN
CANAL - 1
TIF CITY OFHARVEY - 1
TIF CITY OF CHICAGOJEFFERSON/ROOSEVELT
TIF CITY OF CHICAGOGOOSE ISLAND
TIF VIL OFSAUK VILLAGE - 3
TIF VIL OFWHEELING
MILWAUKEE AVECORRIDOR
TIF VIL OF JUSTICE - 4
TIF CITY OFPROSPECT HEIGHTS
TIF CITY OF CHICAGOPETERSON & PULASKI
TIF VIL OF RICHTON PARKSAUK TRAIL/I 57
TIF CITY OFCHICAGO
STOCKYARDS/SE QUAD
INDUS
TIF VIL OF LINCOLNWOODNORTHEAST INDUSTRIAL
TIF CITY OF CHICAGOSTOCKYARDS ANNEX
TIF CITY OF DES PLAINESDOWNTOWN
TIF VIL OFLYNWOOD
GLENWOOD LANSING/TORRENCE
TIF CITY OF CHICAGOSTONY ISLAND/BURNSIDE
TIF CITY OFMARKHAM
DIXIEHIGHWAY
TIF CITY OF CHICAGOCICERO/ARCHER
TIF CITY OFOAK FOREST
TIF CITY OFCHICAGOADDISON
SOUTH
TIF VIL OF LINCOLNWOODLINCOLN / TOUHY
TIF VIL OFPHOENIX
151ST/WALLACE ST
TIF CITY OFHARVEY
DIXIE HIGHWAYCORRIDOR
TIF CITY OF HARVEYACRO/147TH ST
TIF VIL OFMIDLOTHIAN
147TH/CICERO(2013)
TIF CITY OFCHICAGO
WASHINGTONPARK
TIF CITY OFCHICAGO
CALIFORNIA /FOSTER
TIF VIL OF BERKELEY
McDERMOTT/ St CHARLES 2
TIF VIL OFELK GROVE
VILLAGEHIGGINS RDCORRIDOR
TIF CITY OFCHICAGO
87TH/COTTAGE
TIF VIL OFPOSEN
SIBLEY BLVD
TIF VIL OFPARK FOREST
DOWNTOWN
TIF CITY OFDES PLAINES - 3
TIF CITY OF CHICAGO111TH ST/KEDZIE AVE
TIF VIL OFEVERGREEN PARK
95TH ST
TIF VIL OF BEDFORD PARK
TIF VIL OFMORTON GROVE
FERRIS/LEIGH
TIF CITY OFMARKHAM
TIF VIL OF OAK PARKMADISON ST
BUSINESS CORD
TIF VIL OFRICHTON PARK
RICHTONLAKEWOOD - 5
TIF CITY OFCHICAGO
JEFFERSONPARK
TIF CITY OFCHICAGOARCHER/CENTRAL
TIF VIL OFCALUMET PARK - 2
TIF CITY OFCHICAGO
LAWRENCE/KEDZIE
TIF CITY OF CHICAGOHOMAN AVE/
ARTHINGTON ST
TIF CITY OF CHICAGORIVER WEST
TIF CITY OFCHICAGO47TH ST/HALSTED
TIF VIL OFPOSEN - 2
TIF CITY OFMARKHAM - 2
TIF CITY OFCHICAGOCLARK/
MONTROSE
TIF CITY OFCHICAGODEVON &WESTERN
TIF VIL OFSKOKIE
DOWNTOWNSCIENCE &
TECH
TIF VIL OFMORTONGROVE
TIF CITY OF CHICAGORIVER SOUTH
TIF VIL OFHAZELCREST - 2
TIF VIL OF LANSINGWEST
LANSING
TIF CITY OFCHICAGOARCHER /WESTERN
TIF CITY OFCHICAGO
LITTLE VILLAGE EAST
TIF VIL OF LEMONTGATEWAY
TIF VIL OFBROADVIEW 17TH AVE
TIF VIL OF SCHAUMBURGNORTH SCHAUMBURG
TIF CITY OFOAK FOREST
BUSINESS PARK EAST
TIF CITY OFCHICAGO107TH ST/HALSTED
TIF VIL OFHODGKINSEAST AVE
TIF VIL OF BEDFORD PARKINDUSTRIAL
TIF VIL OFBELLWOOD
ADDISONCREEK "A"
2014
TIF CITY OFCHICAGO HEIGHTS
CUB FOODS
TIF CITY OF CHICAGO24TH ST/MICHIGAN AVE
TIF CITY OFHARVEY
RPM BUSINESS PK
TIF CITY OF BERWYNSOUTH BERWYN CORRIDOR
TIF CITY OFCHICAGOCANAL ST/CONGRESS
TIF CITY OFMARKHAM
JEVICBUSINESS PK
TIF VIL OFFRANKLIN PARK
O'HARE EAST
TIF VIL OF ROSEMONT - 5
TIF VIL OF ROBBINS
TIF CITY OF CHICAGO79TH ST CORRIDOR
TIF VIL OF OAK PARKGREATER MALL AREA
TIF CITY OF CHICAGOTOUHY/WESTERN
TIF VIL OFMELROSE PARK
MID METROIND AREA
TIF CITY OF CHICAGOCHICAGO / KINGSBURY
TIF VIL OFBROADVIEWROOSEVELT
TIF VIL OF BERKELEY
ST CHARLES RD
TIF VIL OF WILLOW SPRINGSVILLAGE CENTER
TIF CITY OF BERWYNROOSEVELT RD
TIF VIL OF ROSEMONTRIVER RD
TIF CITY OFCHICAGO
CLARK/RIDGE
TIF CITY OF BERWYNHARLEM
TIF VIL OF SCHILLER PARKWEST GATEWAY
TIF VIL OFSKOKIE
WEST DEMPSTER
TIF CITY OF CHICAGO63RD/ASHLAND
TIF CITY OFPALOS HEIGHTS127TH / HARLEM
TIF CITY OFEVANSTONCHICAGO/
MAIN
TIF VIL OFCHICAGO RIDGE
103RD /HARLEM
TIF VIL OFCRESTWOOD
ROUTE 83
TIF VIL OFELK GROVE VILLAGE
BUSSE /ELMHURST
TIF VIL OFELMWOOD PARK
GRAND AVECORRIDOR
TIF CITY OFCHICAGOMICHIGAN/
CERMAK AVE
TIF VIL OFBEDFORD PARK
ARCHER AVE
TIF VIL OFTHORNTON
BLACKSTONE
TIF VIL OFLA GRANGE
31ST/BARNSDALE
TIF TOWNOF CICERO
1400 S. LARAMIE
TIF VIL OFELMWOOD PARK
GRAND AVECORRIDOR II
TIF VIL OF BELLWOODADDISON CREEK "D"2014
TIF VIL OFBELLWOOD
ADDISONCREEK "B"
2014 TIF VIL BELLWOODADDISON CREEK "C"
2014
TIF CITY OFCHICAGO47TH ST/STATE
TIF CITY OF CHICAGOENGLEWOOD
NEIGHBORHOOD
TIF VIL OFSOUTH HOLLAND
DOWNTOWN
TIF VIL OF LYONS - 1
TIF CITY OFCHICAGO
SOUTHWORKS
TIF VIL OFHAZELCREST
183RD ST/KEDZIE AVE
TIF VIL OF SOUTHHOLLAND
INTERSTATE 80
TIF CITY OFHARVEY
CENTER ST
TIF VIL OF FRANKLIN PARK - 5
TIF CITY OF DES PLAINESMANNHEIM/HIGGINS
TIF VIL OF WHEELINGMILWAUKEE/
MANCHESTER
TIF VIL OF ROSEMONTSOUTH RIVER RD
TIF VIL OFHOFFMAN ESTATES
BARRINGTON/HIGGIN
TIF VIL OFRICHTON PARKTOWN CENTER
TIF VIL OF FOREST PKBROWN STAT/HARLEM AVE
TIF VIL OFELK GROVE VILLAGE
GROVE MALL
TIF VIL OF OAK LAWN111ST ST/CICERO AVE
TIF CITY OFOAK FOREST - 2
TIF VIL OFRIVERDALE - 3
TIF VIL OFSO CHICAGO HTS
CHI RD/SAUK TRAIL
TIF VIL OFRIVER GROVEBELMONT AVE/
THATCHERTIF VIL OF FRANKLIN PARKWEST MANNHEIM RESD
TIF VIL OF BARRINGTONVILLAGE CENTER
TIF VIL OFOAK LAWNTRIANGLE
TIF VIL OF PALATINERAND/DUNDEE CENTER
TIF CITY OF CHICAGO60TH ST/ WESTERN AVE
TIF CITY OF CHICAGO
NORTH BRANCH/NORTH
TIF CITY OFCHICAGO
MONTCLARE
TIF CITY OFCHICAGO
IRVING PARK/CICERO AVE
TIF VIL OFLYONS - 2
TIF VIL OFPHOENIX
TIF CITY OFBLUE
ISLAND - 2
TIF VIL OFJUSTICE - 5
TIF VIL OFGLENVIEW
WAUKEGAN/GOLF RD
TIF VIL OFHILLSIDE
ROOSEVELT RD
TIF VIL OFHAZEL CRESTHALSTED ST
TIF VIL OFSOUTH HOLLANDGATEWAY WEST
TIF VIL OFLA GRANGE
VILLAGE MARKET
TIF CITY OFHARVEYCRESCO
BUSINESS PARK
TIF CITYOF BLUE
ISLAND - 5
TIF CITY OF CHICAGOROOSEVELT RD/RACINE AVE
TIF CITY OFEVANSTON
AREA - 5
TIF CITY OFEVANSTON
AREA - 6
TIF VIL OF MAYWOODMADISON ST/ FIFTH AVE
TIF VIL OFHOMEWOODSOUTHWEST
TIF VIL OFSTONE PARKNORTH AVE/
31ST AVE
TIF CITY OF HARVEYSIBLEY/DIXIE HWY
TIF CITY OFCHICAGOWESTERN
AVENORTH
TIF CITY OF PARK RIDGE
DEMPSTER AVE/WESTERN
TIF VIL OFSOUTH
HOLLANDGATEWAY EAST
TIF VIL OFSOUTH HOLLAND
ROUTE 6/SOUTH PARK
TIF CITY OFPROSPECT HEIGHTS
PALATINE RD
TIF VIL OFFRANKLIN PARK
MANNHEIM/GRAND
TIF VIL OFMELROSE PARK
NORTH AVE/25TH
TIF CITY OFCHICAGO HEIGHTSBLOOM TWP PLAZA
TIF CITY OF CHICAGOBRYN MAWR/
BROADWAY AVE
TIF CITY OFCHICAGO
NORTH AVE/CICERO AVE
TIF VIL OFDOLTON - 2
TIF VIL OFBROADVIEW
27TH AVE
TIF CITY OFCHICAGO
WOODLAWN
TIF VIL OFMATTESON - 6
LINCOLN / GOVERNORS
TIF VIL OFHANOVERPARK - 5
TIF VIL OFROSEMONT
HIGGINS/RIVER RD 6
TIF VIL OF LANSINGTORRANCE AVE
CORRIDOR
TIF TRANSITCITY OF
CHICAGORPM 1
TIF VIL OFCALUMETPARK - 6
TRAINSTATION
TIF CITY OFCHICAGO
SANITARY DRAIN&SHIP CANAL
TIF VIL OFSCHILLER PARK
IRVING PARK/KOLZE
TIF CITY OF CHICAGOPETERSON & CICERO
TIF VIL OF WORTH111TH ST/ TOLL RD
TIF CITY OFCHICAGO
ENGLEWOODMALL
TIF VIL OFHOMEWOOD
187TH ST/DIXIE HWY
TIF CITY OFPALOS HEIGHTS
TIF CITY OFCHICAGO
NORTHBRANCHSOUTH
TIF CITY OFDES PLAINES - 5
TIF VIL OFMATTESON
LINCOLN MALL
TIF CITY OFCHICAGO
LINCOLN AVE
TIF CITY OF CHICAGOOHIO / WABASH
TIF CITY OFCHICAGO95TH ST/
WESTERN
TIF CITY OFCHICAGO35TH ST/
HALSTED ST
TIF CITY OFCHICAGOPULASKI
CORRIDOR
TIF CITY OFCHICAGO
PORTAGE PARK
TIF CITY OF CHICAGO49TH ST/ST LAWRENCE AVE
TIF CITY OFCHICAGO
FULLERTON&MILWAUKEE
TIF CITY OF CHICAGOHOLLYWOOD/SHERIDAN
TIF VIL OFBRIDGEVIEWBRIDGEVIEW
COURT
TIF VIL OFBROADVIEW19TH STREET
TIF CITY OF CHICAGO
MONTROSE/CLARENDON
TIF VIL OFMcCOOK
RIVERSIDE AVE
TIF VIL OF LINCOLNWOODDEVON / LINCOLN
TIF VIL OFBROOKFILEDOGDEN AVE
TIF CITY OFCHICAGO
SW INDUSTCORRIDOR EAST
TIF CITY OFCHICAGO
51ST/ARCHER
TIF CITY OFCHICAGOBELMONT/
CICERO
TIF CITY OF CHICAGO35TH ST/WALLACE AVE
TIF VIL OFFRANKLIN PARK
DOWNTOWNFRANKLIN AVE
TIF VIL OF HODGKINS67TH/LAGRANGE RD
TIF VIL OFLYONS - 3
TIF VIL OFOAK LAWNCOMMUTER
PARKING LOT
TIF CITY OFELGIN
BLUFF CITYQUARRY
TIF VIL OFARLINGTON
HEIGHTSHICKORY /
KENSINGTON
TIF VIL OFOAK LAWN
CICEROGATEWAY
TIF VIL OFOLYMPIA FIELDS
LINCOLN /WESTERN 2
TIF VIL OFNILES - 6
GROSS POINT TOUHY
TIF VIL OFGLENWOOD
STATE ST
TIF CITY OF CHICAGO26TH ST/KING DR
TIF VIL OFNORTHBROOK
DUNDEE RD/SKOKIE BLVD
TIF CITY OF CHICAGOLAWRENCE/BROADWAY
TIF VIL OFCRESTWOOD
135TH ST/CICERO AVE
TIF VIL OFOAK LAWN
TRAIN STATION
TIF CITY OF CHICAGOAVALON PK/SOUTH SHORE
TIF VIL OFSCHILLER PARK
WEST GATEWAY 2
TIF VIL OFWHEELING
TOWN CENTER II
TIF VIL OFWHEELING
SOUTHEAST II
TIF VIL OFROSEMONT
HIGGINS /MANNHEIM #7
TIF CITY OF DES PLAINESHIGGINS / PRATT
TIF VIL OFROSEMONTBALMORAL
/PEARL 8
TIF CITY OFBURBANK
DOWNTOWNBURBANK
TIF VIL OFOAK LAWN
PATRIOT STATION
TIF CITY OFCHICAGOHARLEM
INDUSTRIALPARK
TIF CITY OF CHICAGOPERSHING/KING DR
TIF CITY OF CHICAGOLASALLE CENTRAL
TIF CITY OFCHICAGOARCHERCOURTS
TIF VIL OFPALATINE
2002 RAND RD
TIF CITY OFCHICAGO
DEVON/SHERIDAN
TIF VIL OFOAK LAWN
CICERO AVE
TIF CITY OFROLLING MEADOWSKIRCHOFF/OWL DR
TIF VIL OFWHEELING
MILWAUKEE/LAKE-COOK
TIF VIL OFARLINGTONHEIGHTS - 5
TIF VIL OFBARTLETTQUARRY
TIF VIL OFBARTLETTROUTE 59/LAKE ST
TIF VIL OFSTREAMWOODBUTTITTA DR/FRANCIS AVE
TIF VIL OFHANOVER PARK
VILLAGE CENTER - 3
TIF VIL OFHOFFMAN ESTATES
GOLF/HIGGINS/ROSELLE
TIF CITY OFCHICAGO
EWING AVE
TIF VIL OFEAST DUNDEE
TIF VIL OFPHOENIX
NORTHERNPHOENIX
TIF VIL OFFRANKLIN PARK
CENTRELLASEYMOUR
TIF VIL OFFOREST PARKROOSEVELT
RD CORRIDOR
TIF VIL OFARLINGTON HTS
GOLF RD/ARLINGTON HTS RD
TIF CITY OFCHICAGO
KENNEDY /KIMBALL
TIF VIL OFMcCOOK
JOLIET RD
TIF VIL OFELK GROVE VILLAGE
DEVON/ROHLWING
TIF VIL OFPARK RIDGE
UPTOWN
TIF VIL OFFRANKLIN PARKRESURRECTION
TIF CITY OFCHICAGODIVERSEY/
NARRAGANSETT
TIF CITY OFCHICAGOWESTERN/
ROCKISLAND
TIF VIL OFMELROSE PARK
BUSINESSDEV PARK
TIF VIL OFRIVER GROVE
GRAND/THATCHER
TIF VIL OFSCHILLER PARK
LAWRENCE/25TH AVE
TIF CITY OFCHICAGO
WESTIRVING PK
TIF CITY OFCHICAGOBELMONT/CENTRAL
TIF CITY OFCHICAGO
WESTERN AVESOUTH
TIF CITY OFCHICAGO
LAWRENCE/PULASKI
TIF CITY OF CHICAGOWILSON YARD
TIF CITY OFCHICAGO
EDGEWATER/ASHLAND
TIF VIL OFBELLWOOD
CENTRALMETRO
2014
TIF VIL OF MELROSE PKLAKE ST CORRIDOR
TIF VIL OF BELLWOODNORTH 2014
TIF VIL OFHILLSIDE
MANNHEIM
TIF CITY OFCHICAGOCHICAGO/
CENTRAL PARK
TIF CITY OFCHICAGODIVISION/HOMAN
TIF VIL OFFORD HEIGHTS
COTTAGE GROVE/ RTE 30
TIF VIL OFRICHTON PARK
SAUK WEST CORRIDOR
TIF CITY OFCHICAGODIVERSEY/
CHICAGO RIVER
TIF VIL OF NILES OAKTON/WAUKEGAN
TIF CITY OFCHICAGO
ARMITAGE/PULASKI
TIF CITY OFCHICAGO
OGDEN AVE /PULASKI RD
TIF TOWNOF CICERO
TOWN SQUARE
TIF VIL OF MAYWOODROOSEVELT ROADTIF VIL OF
BELLWOODSOUTH 2014
TIF VIL OF BELLWOODNATIONAL TERMINALS
TIF VIL OFBELLWOOD
PARK PLACE
TIF VIL OFFOREST PARKROOSEVELT/HANNAH AVE
TIF VIL OFMELROSE PARKSENIORS FIRST
TIF CITY OFCHICAGO
HARRISON/CENTRAL
TIF TOWNOF CICERO54TH AVE
TIF TOWNOF CICEROLARAMIE/25TH ST
TIF CITY OF CHICAGOHUMBOLDT PK COMMERCIAL
TIF CITY OF CHICAGO35TH ST/STATE ST
TIF VIL OFBRIDGEVIEW
HARLEM AVE 2
TIF VIL OFOLYMPIA FIELDS
LINCOLN/WESTERN
TIF VIL OFSO CHICAGO HTS - 4
TIF VIL OFSOUTH HOLLAND
I - 94 SOUTH
TIF VIL OFSOUTH
HOLLANDIZD ZONE A
TIF VIL OFSOUTH HOLLANDGATEWAY EAST
TIF CITY OFROLLING MEADOWS
GOLF RDCONSERVATION
TIF VIL OFMELROSE PARK
RUBY ST
TIF VIL OFGLENWOOD
SOUTHHALSTED
TIF VIL OF LEMONTMAIN ST/ARCHER AVE
TIF CITY OFCHICAGOFOSTER/EDENS
TIF VIL OF NILESMILWAUKEE/
HARLEM
TIF VIL OFBRIDGEVIEWHARLEM AVE
TIF VIL OF JUSTICE - 2
TIF CITY OFCHICAGO67TH ST/
CICERO AVE
TIF CITY OFCHICAGO79TH ST/SW HWY
TIF CITY OFCHICAGO79TH ST/CICERO
TIF CITY OFCHICAGO83RD ST/
STEWART
TIF CITY OFCHICAGO73RD ST/
UNIVERSITY
TIF CITY OFHICKORY HILLS
95TH ST
TIF VIL OF BRIDGEVIEW103RD/76TH AVE
TIF CITY OFCHICAGO105TH ST/
VINCENNES
TIF CITY OFCHICAGO
119TH / I-57
TIF CITY OFCHICAGO119TH ST/HALSTED
TIF VIL OFCALUMETPARK - 5
TIF VIL OFCALUMETPARK - 3
TIF CITY OFCHICAGO
ROSELAND/MICHIGAN
TIF VIL OFCALUMETPARK - 4
TIF VIL OFMATTESON
LINCOLN HWY/CICERO
TIF VIL OFPARK FOREST
NORWOODSQUARE
TIF VIL OF ROSELLENORTH ROSELLE RD CORRIDOR
TIF VIL OFWESTERN SPRINGSDOWNTOWN SOUTH
TIF VIL OFELMWOOD PARK
NORTH /HARLEM
TIF CITY OFBLUE ISLAND - 7
TIF CITY OFMARKHAM
INTERSTATECROSSING
TIF VIL OFRICHTON PARK
SAUK TR/GOV HWY - 4
TIF VIL OFORLAND PARK
MAIN ST/TRIANGLE
TIF VIL OFTINLEY PARKNEW BREMEN
TIF VIL OFTINLEY PARK
MAIN ST NORTH
TIF CITY OFOAK FOREST
AREA - 3
TIF VIL OF HAZEL CREST167TH ST CORRIDOR
TIF VIL OFDIXMOOR
144TH/WOOD
TIF VIL OF DOLTON - 3
TIF VIL OFHAZEL CRESTHAZEL CREST
PROPER
TIF CITY OFCHICAGO
STONY ISLAND/BURNSIDE
TIF VIL OFHAZEL CREST
TOLLWAY
TIF VIL OFGLENWOOD
HALSTED/HOLBROOK
TIF VIL OFGLENWOOD
MAIN ST
TIF CITY OFCHICAGO HEIGHTSEAST INDUSTRIAL
TIF VIL OFSTEGER30TH ST/
LOVEROCKTIF VIL OFSTEGER
TIF VIL OFSAUK VILLAGE - 4
TIF VIL OFBRIDGEVIEW
78TH AVE
TIF VIL OFRIVER FOREST
NORTH AVE
TIF CITYOF BLUE
ISLAND - 4
TIF CITY OFCHICAGO79TH ST/
VINCENNES
TIF CITY OFCHICAGO
AUSTINCOMMERCIAL
TIF CITY OFCHICAGOELSTON/
ARMSTRONG
TIF CITY OFCHICAGO
LITTLE VILLAGEINDUSTRIAL
TIF CITY OF CHICAGOPRATT/RIDGE
INDUSTRIAL PARK
TIF CITY OF CHICAGOSTEVENSON/BRIGHTON
TIF VIL OFHANOVERPARK - 4
TIF VIL OFLYONS
QUARRY
TIF CITY OFCALUMET
CITY
TIF CITY OFCHICAGO
LAKEFRONT
TIF CITY OFCOUNTRY
CLUB HILLS175TH ST /
CICERO AVE
TIF CITY OFCHICAGO
AVONDALE
TIF CITY OFCHICAGO
IRVING PK /ELSTON
TIF VIL OF SUMMIT63RD PL
TIF VIL OFMATTESON - 5
TIF CITY OFCHICAGO HEIGHTS
DOWNTOWN
TIF VIL OFSO CHICAGO HTS - 2
TIF CITY OFCHICAGO HEIGHTS
300 S STATE ST
TIF CITY OFCHICAGO
NORTH PULLMAN
TIF VIL OFHOFFMAN ESTATESHIGGINS/HASSELL
TIF CITY OFOAK FOREST - 7
TIF VIL OFTINLEY PARK
LEGACY
TIF VIL OFTINLEY PARK
MENTAL HEALTHCENTER
TIF VIL OFRIVER FOREST
MADISON ST
TIF VIL OF MELROSE PKCHICAGO/SUPERIOR
TIF VIL OF ALSIPPULASKI ROAD CORRIDOR
TIF VIL OF FRANKLIN PARKDHL - SEYMOUR
TIF VIL OF FRANKLIN PARKMILWAUKEE AREA 2 - 1
TIF VIL OF FRANKLIN PARKSEYMOUR / WAVELAND
TIF VIL OFHODGKINS
EAST AVE # 4
TIF VIL OFSUMMIT59TH ST
TIF VIL OF BEDFORD PARK - 6TIF CITY OF CHICAGO67TH & WENTWORTH
TIF VIL OFBROOKFILED
CONGRESS PARK
TIF VIL OFHOMEWOOD
EAST CBD
TIF VIL OFGLENWOOD
TOWN CENTERTIF VIL OFGLENWOODINDUSTRIAL
NORTH
TIF VIL OFGLENWOOD
NORTHHALSTED
TIF VIL OFHOMEWOODNORTHEAST
TIF CITYOF BLUE
ISLAND - 6
TIF CITY OFCHICAGO
COMMERCIAL AVE
TIF CITY OF CHICAGOMADDEN / WELLS
TIF CITY OFCHICAGO47TH ST/KING DR
TIF CITY OFCHICAGO
53RD
TIF VIL OF PALATINERAND/LAKE COOK
TIF VIL OFBROOKFILED8 CORNERS
TIF VIL OF STEGERCHICAGO ROAD
TIF VIL OFHOMEWOOD
TOD
TIF VIL OF LEMONTTRANSIT TOD
TIF VIL OFMORTON GROVE
DEMPSTER/WAUKEGAN
TIF CITY OFEVANSTONDEMPSTER/
DODGE
TIF CITY OFOAK FOREST - 4
TIF VIL OFTHORNTON
DOWNTOWN 3
TIF CITY OFCALUMET CITY
RIVER OAKS MALL
TIF CITY OFCHICAGO
116TH/AVENUE O
TIF VIL OF NILESMILWAUKEE/
OAKTON
TIF VIL OF NILES MILWAUKEE/DEMPSTER
Cook County Tax Increment Financing Districts for Tax Year 2018
Karen A. YarbroughCook County Clerk
"
This Map represents tax year 2018 TIFs. Former and futureTIFs are not shown.This map was created by the Cook County Clerk Map Dept4th Floor 118 N Clark St. Chicago, IL 60602www.cookcountyclerk.com©2019 Cook County, IllinoisAll Rights Reserved
0 42
Miles
Office of the Cook County ClerkTIF District Summary
2018 to 2017 Revenue Comparison
July 31, 2019
TIF NameFirst Tax
Year *Agency
2018TIF
Revenue
2018 to 2017Percent
Difference
2017TIF
Revenue
TotalTIF
Revenue
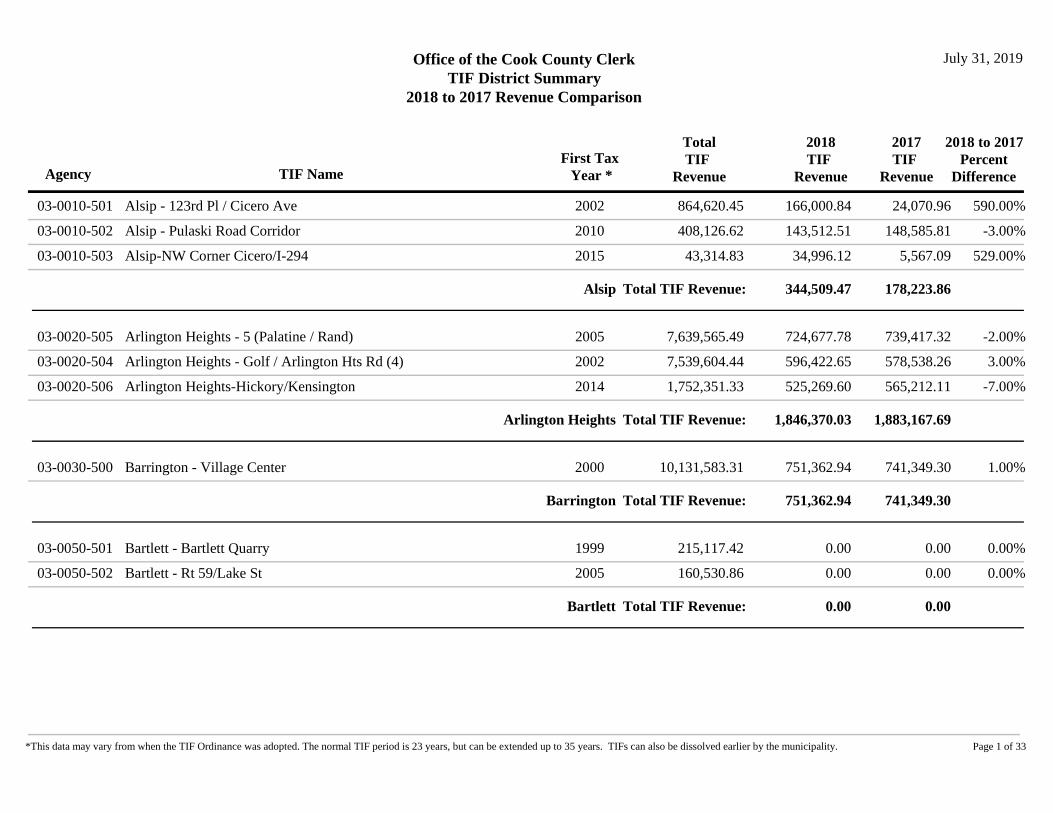
Alsip - 123rd Pl / Cicero Ave 200203-0010-501 166,000.84 24,070.96 590.00%864,620.45
Alsip - Pulaski Road Corridor 201003-0010-502 143,512.51 148,585.81 -3.00%408,126.62
Alsip-NW Corner Cicero/I-294 201503-0010-503 34,996.12 5,567.09 529.00%43,314.83
Alsip Total TIF Revenue: 344,509.47 178,223.86
Arlington Heights - 5 (Palatine / Rand) 200503-0020-505 724,677.78 739,417.32 -2.00%7,639,565.49
Arlington Heights - Golf / Arlington Hts Rd (4) 200203-0020-504 596,422.65 578,538.26 3.00%7,539,604.44
Arlington Heights-Hickory/Kensington 201403-0020-506 525,269.60 565,212.11 -7.00%1,752,351.33
Arlington Heights Total TIF Revenue: 1,846,370.03 1,883,167.69
Barrington - Village Center 200003-0030-500 751,362.94 741,349.30 1.00%10,131,583.31
Barrington Total TIF Revenue: 751,362.94 741,349.30
Bartlett - Bartlett Quarry 199903-0050-501 0.00 0.00 0.00%215,117.42
Bartlett - Rt 59/Lake St 200503-0050-502 0.00 0.00 0.00%160,530.86
Bartlett Total TIF Revenue: 0.00 0.00
Page 1 of 33*This data may vary from when the TIF Ordinance was adopted. The normal TIF period is 23 years, but can be extended up to 35 years. TIFs can also be dissolved earlier by the municipality.

TIF NameFirst Tax
Year *Agency
2018TIF
Revenue
2018 to 2017Percent
Difference
2017TIF
Revenue
TotalTIF
Revenue
Bedford Park 198703-0060-500 6,385,288.29 6,163,468.18 4.00%82,149,458.10
Bedford Park - 65th Street 201103-0060-506 101,292.65 100,353.65 1.00%456,574.07
Bedford Park - Archer Ave 201503-0060-507 898,926.09 606,776.32 48.00%1,720,226.23
Bedford Park - Industrial 200803-0060-505 0.00 0.00 0.00%312,749.47
Bedford Park Total TIF Revenue: 7,385,507.03 6,870,598.15
Bellwood - Addison Creek 'A' 2014 201403-0070-514 255,927.28 140,615.48 82.00%502,352.70
Bellwood - Addison Creek 'B' 2014 201403-0070-515 292,649.28 251,775.88 16.00%607,565.33
Bellwood - Addison Creek 'C' 2014 201403-0070-516 273,137.39 98,666.63 177.00%455,104.89
Bellwood - Addison Creek 'D' 2014 201403-0070-517 19,233.71 6,380.66 201.00%25,614.37
Bellwood - C. & NW. Project Area 2 199503-0070-501 0.00 42,430.28 -100.00%Cancelled 2018 1,058,023.68
Bellwood - Central Metro 2014 201403-0070-511 1,104,466.76 242,465.60 356.00%1,346,932.36
Bellwood - National Terminals 199703-0070-502 49,480.31 51,133.53 -3.00%2,066,445.90
Bellwood - North 2014 201403-0070-513 666,321.48 665,930.47 0.00%2,009,609.40
Bellwood - Park Place 200503-0070-503 212,473.58 196,709.71 8.00%1,239,604.57
Bellwood - South 2014 201403-0070-512 668,395.28 351,531.87 90.00%1,320,222.55
Bellwood Total TIF Revenue: 3,542,085.07 2,047,640.11
Berkeley - McDermott/St Charles 2 201503-0090-501 284,438.86 366,588.06 -22.00%651,026.92
Berkeley - St. Charles Road 200003-0090-500 0.00 0.00 0.00%4,017,862.09
Berkeley Total TIF Revenue: 284,438.86 366,588.06
Page 2 of 33*This data may vary from when the TIF Ordinance was adopted. The normal TIF period is 23 years, but can be extended up to 35 years. TIFs can also be dissolved earlier by the municipality.

TIF NameFirst Tax
Year *Agency
2018TIF
Revenue
2018 to 2017Percent
Difference
2017TIF
Revenue
TotalTIF
Revenue
Berwyn - Harlem Avenue 201103-0100-504 696,921.30 1,003,996.16 -31.00%4,549,995.16
Berwyn - Roosevelt Road 199603-0100-502 641,971.25 652,730.40 -2.00%8,894,213.00
Berwyn - South Berwyn Corridor 199603-0100-503 995,541.92 1,152,161.30 -14.00%17,528,102.44
Berwyn Total TIF Revenue: 2,334,434.47 2,808,887.86
Blue Island - 2 (South Industrial Area) 199303-0110-501 1,078,685.38 1,490,581.51 -28.00%22,526,403.88
Blue Island - 3 (Southwest Residential Area) 199303-0110-502 0.00 638,813.52 -100.00%Cancelled 2018 12,176,042.74
Blue Island - 4 200703-0110-503 41,410.11 43,891.16 -6.00%511,035.95
Blue Island - 5 200803-0110-504 1,356,979.69 1,360,273.74 0.00%11,029,242.85
Blue Island - 6 201103-0110-505 136,756.89 140,521.68 -3.00%491,484.76
Blue Island - 7 201703-0110-506 26,339.46 152,638.11 -83.00%178,977.57
Blue Island Total TIF Revenue: 2,640,171.53 3,826,719.72
Bridgeview - 103rd / 76th Ave 200403-0120-504 1,209,538.74 1,193,600.92 1.00%13,707,302.51
Bridgeview - 78th Ave 201603-0120-509 0.00 0.00 0.00%0.00
Bridgeview - Bridgeview Court 201503-0120-508 896,448.27 863,200.87 4.00%2,710,796.62
Bridgeview - Golf Dome 201503-0120-507 1,748.89 1,777.39 -2.00%3,726.94
Bridgeview - Harlem Ave 1 200103-0120-501 360,170.77 335,413.54 7.00%3,972,759.23
Bridgeview - Harlem Ave 2 201503-0120-506 613,293.09 299,409.23 105.00%1,138,419.02
Bridgeview Total TIF Revenue: 3,081,199.76 2,693,401.95
Page 3 of 33*This data may vary from when the TIF Ordinance was adopted. The normal TIF period is 23 years, but can be extended up to 35 years. TIFs can also be dissolved earlier by the municipality.

TIF NameFirst Tax
Year *Agency
2018TIF
Revenue
2018 to 2017Percent
Difference
2017TIF
Revenue
TotalTIF
Revenue
Broadview - 17th Ave 200903-0130-504 0.00 0.00 0.00%66,865.90
Broadview - 19th St 200803-0130-503 124,224.85 124,890.54 -1.00%477,494.83
Broadview - 27th Avenue 199703-0130-502 108,007.48 107,455.34 1.00%2,865,574.54
Broadview - Roosevelt Road 199903-0130-501 652,322.79 606,427.50 8.00%9,183,159.60
Broadview Total TIF Revenue: 884,555.12 838,773.38
Brookfield - 8 Corners 201603-0140-502 190,809.71 205,715.91 -7.00%423,082.87
Brookfield - Congress Park 201103-0140-501 0.00 0.00 0.00%0.00
Brookfield - Ogden Ave 200803-0140-500 362,427.79 49,395.25 634.00%987,417.76
Brookfield Total TIF Revenue: 553,237.50 255,111.16
Burbank - 79th/Lavergne 201703-0160-502 0.00 0.00 0.00%Cancelled 2018 0.00
Burbank - Downtown Burbank 201703-0160-501 368,822.03 83,440.10 342.00%452,262.13
Burbank Total TIF Revenue: 368,822.03 83,440.10
Calumet City 199503-0190-500 1,163,684.73 1,122,159.51 4.00%12,799,000.11
Calumet City - 2 (Industrial Area) 199603-0190-501 462,289.20 495,776.67 -7.00%6,284,128.62
Calumet City - River Oaks Mall 201803-0190-506 0.00 0.00%New 2018 0.00
Calumet City Total TIF Revenue: 1,625,973.93 1,617,936.18
Page 4 of 33*This data may vary from when the TIF Ordinance was adopted. The normal TIF period is 23 years, but can be extended up to 35 years. TIFs can also be dissolved earlier by the municipality.

TIF NameFirst Tax
Year *Agency
2018TIF
Revenue
2018 to 2017Percent
Difference
2017TIF
Revenue
TotalTIF
Revenue
Calumet Park - 2 Vermont / Ashland 199503-0200-501 1,153,800.84 1,493,365.50 -23.00%24,333,010.43
Calumet Park - 3 (Ashland) 200503-0200-502 298,260.31 264,596.64 13.00%2,462,409.63
Calumet Park - 4 (Vermont / Throop) 200503-0200-503 110,182.23 100,168.32 10.00%1,028,555.35
Calumet Park - 5 200503-0200-504 0.00 0.00 0.00%1,118,852.70
Calumet Park - 6 Train Station 201603-0200-505 1,740.30 1,816.27 -4.00%3,556.57
Calumet Park Total TIF Revenue: 1,563,983.68 1,859,946.73
Page 5 of 33*This data may vary from when the TIF Ordinance was adopted. The normal TIF period is 23 years, but can be extended up to 35 years. TIFs can also be dissolved earlier by the municipality.

TIF NameFirst Tax
Year *Agency
2018TIF
Revenue
2018 to 2017Percent
Difference
2017TIF
Revenue
TotalTIF
Revenue
Chicago - 105th / Vincennes 200203-0210-622 978,876.96 1,122,577.67 -13.00%7,091,364.19
Chicago - 107th / Halsted 201403-0210-681 374,794.22 685,548.34 -45.00%2,320,540.09
Chicago - 111th St / Kedzie Avenue 199903-0210-500 831,984.92 835,612.59 0.00%9,727,654.29
Chicago - 116th/Avenue O 201803-0210-684 15,987.59 100.00%New 2018 15,987.59
Chicago - 119th / Halsted 200203-0210-620 1,008,202.07 1,429,638.60 -29.00%12,952,631.70
Chicago - 119th / I-57 200203-0210-625 2,821,252.33 4,170,500.73 -32.00%32,630,591.91
Chicago - 24th / Michigan 199903-0210-502 4,245,970.47 3,156,828.14 35.00%22,360,790.02
Chicago - 26th / King 200703-0210-644 955,956.17 859,923.11 11.00%8,239,609.76
Chicago - 35th / Halsted 199603-0210-504 10,700,534.09 8,261,547.96 30.00%81,998,788.90
Chicago - 35th / State St 200303-0210-631 2,404,410.84 3,020,261.05 -20.00%21,974,321.00
Chicago - 35th / Wallace 199903-0210-505 1,561,213.55 1,158,449.99 35.00%11,079,652.92
Chicago - 41st St / King Drive 199503-0210-506 0.00 216,730.10 -100.00%Cancelled 2018 3,354,541.97
Chicago - 43rd St / Cottage Grove 199803-0210-507 3,785,061.74 3,513,907.47 8.00%41,280,687.04
Chicago - 47th / Ashland 200203-0210-624 2,830,083.77 2,816,645.69 0.00%38,928,941.56
Chicago - 47th / Halsted 200203-0210-626 4,044,440.75 4,012,904.11 1.00%48,158,129.51
Chicago - 47th / King Drive 200203-0210-617 9,683,327.49 8,165,125.78 19.00%107,383,795.45
Chicago - 47th / State 200403-0210-636 2,231,136.79 1,776,547.54 26.00%22,270,395.93
Chicago - 49th / St. Lawrence Ave. 199503-0210-509 597,667.45 478,560.93 25.00%7,400,372.91
Chicago - 51st / Archer 200003-0210-510 1,833,847.04 1,633,762.71 12.00%13,150,346.05
Chicago - 51st / Lake Park 201403-0210-678 1,240,363.95 1,205,733.12 3.00%2,640,246.87
Chicago - 53rd St (Industrial) 200103-0210-511 5,408,126.38 5,104,895.35 6.00%30,426,650.34
Chicago - 60th St / Western Ave. 199803-0210-512 208,970.77 196,821.13 6.00%6,019,284.39
Chicago - 63rd / Ashland 201003-0210-674 1,107,083.99 1,444,847.22 -23.00%11,283,586.13
Chicago - 63rd / Pulaski 200003-0210-513 2,269,540.83 2,108,098.41 8.00%32,121,879.32
Page 6 of 33*This data may vary from when the TIF Ordinance was adopted. The normal TIF period is 23 years, but can be extended up to 35 years. TIFs can also be dissolved earlier by the municipality.

TIF NameFirst Tax
Year *Agency
2018TIF
Revenue
2018 to 2017Percent
Difference
2017TIF
Revenue
TotalTIF
Revenue
Chicago - 67th / Cicero 200203-0210-623 283,597.05 282,468.66 0.00%4,190,416.36
Chicago - 67th / Wentworth 201103-0210-677 0.00 0.00 0.00%0.00
Chicago - 71st / Stony Island 199903-0210-514 3,620,179.06 3,459,011.37 5.00%52,348,041.60
Chicago - 73rd / University 200703-0210-643 580,789.38 451,279.42 29.00%6,117,365.36
Chicago - 79th / Cicero 200703-0210-648 609,236.15 591,956.88 3.00%5,821,230.37
Chicago - 79th / SW HWY 200203-0210-627 1,751,100.01 1,622,172.31 8.00%20,486,465.57
Chicago - 79th / Vincennes 200703-0210-650 378,133.97 204,016.64 85.00%3,551,491.25
Chicago - 79th St. Corridor 199803-0210-517 1,242,927.92 1,082,546.33 15.00%15,121,269.93
Chicago - 83rd / Stewart 200403-0210-635 1,183,367.92 1,189,799.14 -1.00%9,216,218.81
Chicago - 87th / Cottage Grove 200303-0210-633 2,433,421.63 2,007,067.54 21.00%30,496,534.34
Chicago - 95th / Western 199403-0210-521 1,314,369.65 1,109,147.41 19.00%16,038,648.57
Chicago - Addison South 200703-0210-655 5,632,140.46 4,180,881.97 35.00%34,150,330.97
Chicago - Archer / Central 200103-0210-525 583,400.33 503,527.44 16.00%10,272,857.15
Chicago - Archer / Western 200903-0210-669 959,434.68 28,319.30 3288.00%2,035,759.49
Chicago - Archer Courts 199903-0210-524 448,680.13 463,147.19 -3.00%5,597,369.20
Chicago - Armitage / Pulaski 200703-0210-649 168,123.73 179,608.27 -6.00%2,146,880.15
Chicago - Austin Commercial 200703-0210-651 1,525,661.51 1,198,762.68 27.00%12,470,759.90
Chicago - Avalon Park / South Shore 200203-0210-613 688,282.62 523,764.12 31.00%9,405,902.63
Chicago - Avondale 200903-0210-667 172,173.59 60,490.98 185.00%790,982.48
Chicago - Belmont / Central 200103-0210-526 5,482,781.76 5,162,345.04 6.00%50,751,522.09
Chicago - Belmont / Cicero 200003-0210-527 1,430,151.32 1,223,544.58 17.00%18,685,850.00
Chicago - Bronzeville 199903-0210-529 5,380,276.43 4,120,986.58 31.00%64,647,996.39
Chicago - Bryn Mawr / Broadway 199603-0210-530 2,786,737.85 2,338,080.72 19.00%30,700,205.17
Chicago - California / Foster 201403-0210-680 392,660.56 314,408.03 25.00%730,037.05
Page 7 of 33*This data may vary from when the TIF Ordinance was adopted. The normal TIF period is 23 years, but can be extended up to 35 years. TIFs can also be dissolved earlier by the municipality.

TIF NameFirst Tax
Year *Agency
2018TIF
Revenue
2018 to 2017Percent
Difference
2017TIF
Revenue
TotalTIF
Revenue
Chicago - Calumet Avenue / Cermak Road 199803-0210-531 0.00 13,035,217.01 -100.00%Cancelled 2018 161,008,789.36
Chicago - Canal / Congress 199803-0210-532 31,399,421.84 30,579,139.10 3.00%335,286,098.90
Chicago - Central West 200003-0210-534 30,425,107.45 23,277,171.89 31.00%248,283,003.88
Chicago - Chicago / Central Park 200203-0210-630 6,229,438.63 7,162,413.15 -13.00%88,585,155.63
Chicago - Chicago / Kingsbury 200003-0210-536 33,177,660.74 28,398,542.01 17.00%270,644,567.14
Chicago - Cicero / Archer 200003-0210-538 872,003.31 774,992.79 13.00%12,230,015.87
Chicago - Clark / Montrose 199903-0210-539 4,310,802.49 3,739,659.44 15.00%39,932,715.53
Chicago - Clark / Ridge 199903-0210-540 2,908,618.45 2,475,115.96 18.00%32,191,709.38
Chicago - Commercial Ave 200203-0210-618 1,663,717.17 1,509,189.59 10.00%23,219,626.91
Chicago - Devon / Sheridan 200403-0210-638 1,716,835.69 1,573,223.61 9.00%8,246,623.92
Chicago - Devon / Western 200003-0210-541 3,378,229.81 2,994,850.24 13.00%40,902,360.83
Chicago - Diversey / Narragansett 200303-0210-634 2,694,477.93 2,439,479.86 10.00%29,993,293.99
Chicago - Diversey/Chicago River 201603-0210-682 99,167.28 0.00 100.00%99,167.28
Chicago - Division / Homan 200103-0210-543 1,925,478.44 1,407,977.36 37.00%19,154,500.48
Chicago - Drexel Blvd 200203-0210-614 0.00 408,004.72 -100.00%Cancelled 2018 4,133,549.73
Chicago - Edgewater / Ashland 200303-0210-632 860,302.95 811,914.32 6.00%22,567,393.79
Chicago - Elston / Armstrong 200703-0210-654 794,321.55 531,201.11 50.00%4,487,755.92
Chicago - Englewood Mall 198903-0210-547 778,294.29 869,688.54 -11.00%11,981,286.75
Chicago - Englewood Neighborhood 200103-0210-548 3,477,902.02 6,578,017.77 -47.00%81,312,487.20
Chicago - Ewing 201003-0210-673 226,127.37 328,457.30 -31.00%2,054,402.60
Chicago - Foster/Edens 201803-0210-683 423,922.72 100.00%New 2018 423,922.72
Chicago - Fullerton / Milwaukee 200003-0210-549 11,600,569.07 9,307,109.16 25.00%105,724,623.64
Chicago - Galewood / Armitage 199903-0210-551 4,783,589.60 4,617,030.64 4.00%50,284,804.70
Chicago - Goose Island 199603-0210-552 7,270,832.49 5,650,214.09 29.00%71,973,516.38
Page 8 of 33*This data may vary from when the TIF Ordinance was adopted. The normal TIF period is 23 years, but can be extended up to 35 years. TIFs can also be dissolved earlier by the municipality.

TIF NameFirst Tax
Year *Agency
2018TIF
Revenue
2018 to 2017Percent
Difference
2017TIF
Revenue
TotalTIF
Revenue
Chicago - Greater SW West (Industrial) 200003-0210-553 847,577.10 365,564.98 132.00%13,695,053.80
Chicago - Harlem Industrial Park 200703-0210-656 0.00 0.00 0.00%940,208.06
Chicago - Harrison / Central 200703-0210-642 125,937.85 267,807.76 -53.00%5,043,771.59
Chicago - Hollywood / Sheridan 200703-0210-659 751,275.68 58,011.11 1195.00%3,509,885.46
Chicago - Homan / Arthington 199803-0210-554 634,991.69 823,173.08 -23.00%11,432,749.51
Chicago - Humboldt Park Commercial 200103-0210-557 4,512,515.26 4,044,684.69 12.00%46,477,541.49
Chicago - Irving Park / Cicero 199603-0210-558 903,317.97 896,190.51 1.00%13,031,569.35
Chicago - Irving Park / Elston 200903-0210-668 0.00 0.00 0.00%817,802.91
Chicago - Jefferson / Roosevelt 200003-0210-560 9,121,222.55 7,600,337.94 20.00%77,500,695.93
Chicago - Jefferson Park 199903-0210-559 1,284,130.27 1,262,914.18 2.00%14,410,332.16
Chicago - Kennedy Exp / Kimball 200803-0210-660 878,159.57 275,422.09 219.00%1,950,150.36
Chicago - Kinzie Conservation (Industrial Area) 199803-0210-561 49,229,212.64 38,125,533.27 29.00%367,926,939.81
Chicago - Lake Calumet 200103-0210-562 5,268,081.76 3,998,108.55 32.00%56,932,802.64
Chicago - Lakefront 200203-0210-615 502,929.19 398,724.73 26.00%4,010,939.09
Chicago - LaSalle Central 200603-0210-641 100,926,569.59 57,679,189.37 75.00%361,771,088.82
Chicago - Lawrence / Broadway 200103-0210-563 5,067,041.29 4,448,441.28 14.00%53,715,937.89
Chicago - Lawrence / Kedzie 200003-0210-564 8,549,183.58 7,473,084.34 14.00%107,807,427.27
Chicago - Lawrence / Pulaski 200203-0210-619 1,839,521.80 1,586,800.62 16.00%20,675,604.50
Chicago - Lincoln / Belmont / Ashland 199403-0210-566 0.00 1,440,372.53 -100.00%Cancelled 2018 22,993,439.90
Chicago - Lincoln Ave. 199903-0210-565 3,694,014.90 3,523,943.82 5.00%46,235,425.10
Chicago - Little Village East 200903-0210-666 0.00 0.00 0.00%476,381.79
Chicago - Little Village Industrial 200703-0210-653 0.00 0.00 0.00%1,995,151.53
Chicago - Madden / Wells 200203-0210-616 1,603,446.91 1,484,092.78 8.00%14,255,021.61
Chicago - Madison / Austin 199903-0210-567 2,783,856.57 2,584,112.02 8.00%32,904,344.97
Page 9 of 33*This data may vary from when the TIF Ordinance was adopted. The normal TIF period is 23 years, but can be extended up to 35 years. TIFs can also be dissolved earlier by the municipality.

TIF NameFirst Tax
Year *Agency
2018TIF
Revenue
2018 to 2017Percent
Difference
2017TIF
Revenue
TotalTIF
Revenue
Chicago - Michigan / Cermak 198903-0210-568 2,630,844.39 1,820,158.07 45.00%19,993,614.47
Chicago - Midway Ind. Corridor 200003-0210-569 3,761,242.20 3,954,963.46 -5.00%32,958,013.93
Chicago - Midwest 200003-0210-570 16,706,970.04 19,181,579.10 -13.00%228,936,187.09
Chicago - Montclare 200003-0210-571 335,104.15 340,497.40 -2.00%5,281,255.75
Chicago - Montrose / Clarendon 201003-0210-671 209,922.14 268,902.97 -22.00%1,098,301.06
Chicago - Near North 199703-0210-572 35,716,959.86 32,941,535.12 8.00%330,800,054.76
Chicago - North / Cicero 199703-0210-575 1,800,132.06 1,673,955.83 8.00%21,205,670.74
Chicago - North Branch / North 199803-0210-576 8,478,999.65 5,950,678.89 42.00%78,742,551.58
Chicago - North Branch / South 199803-0210-577 12,492,858.68 10,996,487.91 14.00%113,259,921.43
Chicago - North Pullman 200903-0210-665 1,917,357.21 1,309,881.94 46.00%7,489,813.32
Chicago - NW Industrial Corridor 199903-0210-578 9,528,207.27 8,595,992.19 11.00%107,227,639.80
Chicago - Ogden / Pulaski 200803-0210-663 52,179.16 21,893.34 138.00%8,762,112.44
Chicago - Ohio / Wabash 200003-0210-579 2,012,532.02 1,988,062.40 1.00%24,651,299.21
Chicago - Pershing / King 200703-0210-658 112,267.92 0.00 100.00%531,206.85
Chicago - Peterson / Cicero 200003-0210-580 576,046.67 508,702.25 13.00%5,798,544.73
Chicago - Peterson / Pulaski 200003-0210-581 1,196,812.97 1,472,374.49 -19.00%15,078,935.94
Chicago - Pilsen 199803-0210-582 20,643,537.57 16,323,238.00 26.00%184,639,325.34
Chicago - Portage Park 199803-0210-583 3,415,765.72 2,851,463.43 20.00%41,413,427.71
Chicago - Pratt / Ridge Industrial Park 200703-0210-657 441,043.52 444,321.93 -1.00%3,208,542.71
Chicago - Pulaski Corridor 199903-0210-584 4,697,226.25 4,196,564.10 12.00%52,001,802.63
Chicago - Randolph / Wells 201003-0210-675 6,442,421.90 382,001.74 1586.00%8,572,475.15
Chicago - Ravenswood Corridor 200603-0210-640 0.00 1,956,108.26 -100.00%Cancelled 2018 12,137,609.07
Chicago - Read Dunning 199203-0210-585 0.00 2,958,826.01 -100.00%Cancelled 2018 54,715,092.69
Chicago - River South 199803-0210-586 34,448,113.13 29,782,511.71 16.00%273,240,094.76
Page 10 of 33*This data may vary from when the TIF Ordinance was adopted. The normal TIF period is 23 years, but can be extended up to 35 years. TIFs can also be dissolved earlier by the municipality.

TIF NameFirst Tax
Year *Agency
2018TIF
Revenue
2018 to 2017Percent
Difference
2017TIF
Revenue
TotalTIF
Revenue
Chicago - River West 200103-0210-587 25,761,204.13 21,587,049.85 19.00%211,968,592.60
Chicago - Roosevelt / Cicero 199803-0210-589 4,091,682.99 3,398,886.04 20.00%41,390,325.57
Chicago - Roosevelt / Racine 200003-0210-591 2,181,377.15 2,180,124.63 0.00%23,802,923.73
Chicago - Roosevelt / Union 200003-0210-592 6,784,701.39 6,307,443.88 8.00%70,624,231.10
Chicago - Roseland / Michigan 200203-0210-612 678,052.74 669,446.99 1.00%9,000,083.19
Chicago - Sanitary Drain & Ship 199203-0210-595 986,799.90 715,061.82 38.00%18,248,061.82
Chicago - South Chicago 200003-0210-596 1,467,628.37 1,593,028.60 -8.00%20,615,944.81
Chicago - South Works 200003-0210-597 0.00 0.00 0.00%1,595,477.96
Chicago - Stevenson / Brighton 200703-0210-652 4,867,721.27 3,816,958.50 28.00%17,158,309.50
Chicago - Stockyard Annex 199603-0210-598 2,179,848.31 1,828,058.03 19.00%29,294,684.77
Chicago - Stockyards S.E.Quadrant Industrial Area 199203-0210-600 1,947,302.04 1,736,101.20 12.00%44,363,002.46
Chicago - Stony Island/Burnside 199803-0210-601 4,398,628.98 3,993,299.57 10.00%48,558,531.48
Chicago - SW Industrial Corridor (East) 199803-0210-602 1,353,422.86 1,199,660.21 13.00%13,822,565.78
Chicago - Touhy / Western 200703-0210-647 655,146.84 350,660.50 87.00%5,393,798.07
Chicago - Transit RPM1^ 201603-0210-900 115,735,214.75 40,273,824.40 187.00%174,105,069.79
Chicago - Washington Park 201403-0210-679 1,408,420.32 916,724.04 54.00%2,875,958.18
Chicago - Weed / Fremont 200803-0210-662 0.00 855,342.62 -100.00%Cancelled 2018 4,513,437.12
Chicago - West Irving Park 200103-0210-604 1,381,479.96 1,243,135.35 11.00%16,134,423.83
Chicago - West Woodlawn 201003-0210-676 0.00 0.00 0.00%111,003.91
Chicago - Western / Ogden 199803-0210-609 11,633,864.66 10,172,943.11 14.00%117,378,914.96
Chicago - Western / Rock Island 200703-0210-645 1,348,205.56 1,117,857.20 21.00%14,710,269.35
Chicago - Western Ave / North Ave 200003-0210-608 9,661,504.80 8,352,179.69 16.00%88,044,148.59
Chicago - Western Ave South 200103-0210-607 10,785,832.66 8,863,243.14 22.00%102,252,154.90
Chicago - Wilson Yard 200103-0210-610 9,902,851.34 8,894,649.25 11.00%108,362,796.70
Page 11 of 33*This data may vary from when the TIF Ordinance was adopted. The normal TIF period is 23 years, but can be extended up to 35 years. TIFs can also be dissolved earlier by the municipality.

TIF NameFirst Tax
Year *Agency
2018TIF
Revenue
2018 to 2017Percent
Difference
2017TIF
Revenue
TotalTIF
Revenue
Chicago - Woodlawn 200003-0210-611 4,267,316.52 3,581,412.64 19.00%47,438,086.62
Chicago Total TIF Revenue: 840,821,021.35 660,045,711.45
Chicago Heights - 300 State St 200903-0220-508 116,722.19 116,057.27 1.00%1,626,344.10
Chicago Heights - 4 199503-0220-503 0.00 0.00 0.00%Cancelled 2018 1,003,897.43
Chicago Heights - 8 (Calumet Steel) 200603-0220-507 0.00 4,970.15 -100.00%Cancelled 2018 76,751.19
Chicago Heights - Bloom TWP Plaza 200503-0220-504 52,851.03 647,059.83 -92.00%2,088,376.90
Chicago Heights - Cub Foods 198903-0220-500 900,362.75 1,179,604.40 -24.00%22,630,472.43
Chicago Heights - Downtown 200903-0220-509 0.00 0.00 0.00%514,425.15
Chicago Heights - East Industrial 201803-0220-510 363,536.07 100.00%New 2018 363,536.07
Chicago Heights Total TIF Revenue: 1,433,472.04 1,947,691.65
Chicago Ridge - 103rd / Harlem 201403-0230-503 1,081,800.34 408,813.45 165.00%1,780,471.11
Chicago Ridge - 3 (Ridgeland Avenue) 200603-0230-502 87,352.32 123,002.46 -29.00%1,119,466.65
Chicago Ridge Total TIF Revenue: 1,169,152.66 531,815.91
Cicero - 1400 S. Laramie 201802-0060-504 0.00 0.00%New 2018 0.00
Ciceo Total TIF Revenue: 0.00
Page 12 of 33*This data may vary from when the TIF Ordinance was adopted. The normal TIF period is 23 years, but can be extended up to 35 years. TIFs can also be dissolved earlier by the municipality.

TIF NameFirst Tax
Year *Agency
2018TIF
Revenue
2018 to 2017Percent
Difference
2017TIF
Revenue
TotalTIF
Revenue
Town of Cicero 198702-0060-500 12,908,052.48 12,507,246.05 3.00%231,092,515.05
Town of Cicero - 54th Ave 200402-0060-502 517,452.31 0.00 100.00%10,949,267.80
Town of Cicero - Laramie / 25th St 200302-0060-501 87,929.82 193,719.06 -55.00%4,544,170.92
Town of Cicero - Town Square 200802-0060-503 2,683,052.61 2,622,200.27 2.00%15,520,317.61
Cicero Total TIF Revenue: 16,196,487.22 15,323,165.38
Country Club Hills - 175th / Cicero 200803-0240-501 0.00 0.00 0.00%74.50
Country Club Hills Total TIF Revenue: 0.00 0.00
Countryside - Commercial 201003-0250-500 557,057.19 298,266.27 87.00%1,381,044.31
Countryside Total TIF Revenue: 557,057.19 298,266.27
Crestwood - 135th / Cicero 200203-0260-501 1,639,597.83 1,704,473.98 -4.00%17,477,013.09
Crestwood - Route 83 201403-0260-502 11,967.72 1,257.52 852.00%26,138.80
Crestwood Total TIF Revenue: 1,651,565.55 1,705,731.50
Des Plaines - 3 200003-0290-502 1,776,896.15 1,641,893.15 8.00%10,965,937.79
Des Plaines - 5 (Lee St / Perry) 200003-0290-504 157,981.35 156,591.09 1.00%1,894,675.22
Des Plaines - Downtown 198503-0290-500 5,034,702.09 5,416,628.98 -7.00%99,156,668.16
Des Plaines - Higgins / Pratt 201403-0290-506 100,507.77 98,763.02 2.00%200,419.47
Des Plaines - Mannheim/Higgins 200103-0290-501 95,601.99 97,536.06 -2.00%1,630,793.37
Des Plaines Total TIF Revenue: 7,165,689.35 7,411,412.30
Page 13 of 33*This data may vary from when the TIF Ordinance was adopted. The normal TIF period is 23 years, but can be extended up to 35 years. TIFs can also be dissolved earlier by the municipality.
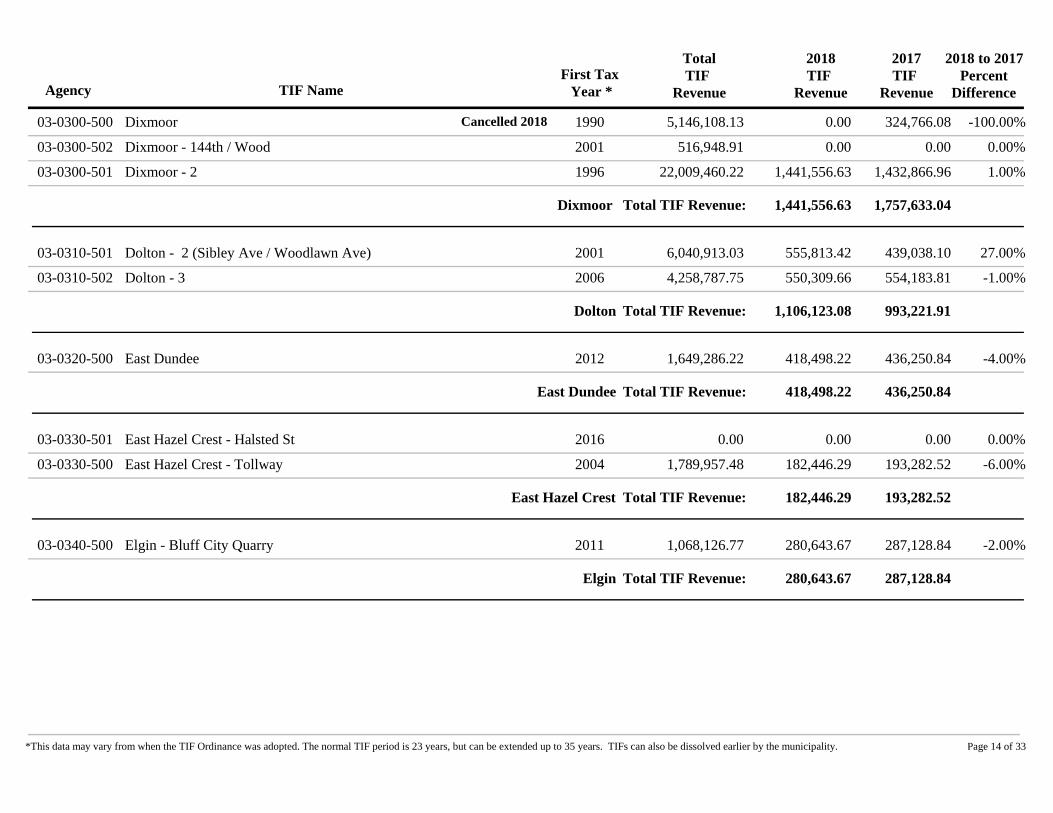
TIF NameFirst Tax
Year *Agency
2018TIF
Revenue
2018 to 2017Percent
Difference
2017TIF
Revenue
TotalTIF
Revenue
Dixmoor 199003-0300-500 0.00 324,766.08 -100.00%Cancelled 2018 5,146,108.13
Dixmoor - 144th / Wood 200103-0300-502 0.00 0.00 0.00%516,948.91
Dixmoor - 2 199603-0300-501 1,441,556.63 1,432,866.96 1.00%22,009,460.22
Dixmoor Total TIF Revenue: 1,441,556.63 1,757,633.04
Dolton - 2 (Sibley Ave / Woodlawn Ave) 200103-0310-501 555,813.42 439,038.10 27.00%6,040,913.03
Dolton - 3 200603-0310-502 550,309.66 554,183.81 -1.00%4,258,787.75
Dolton Total TIF Revenue: 1,106,123.08 993,221.91
East Dundee 201203-0320-500 418,498.22 436,250.84 -4.00%1,649,286.22
East Dundee Total TIF Revenue: 418,498.22 436,250.84
East Hazel Crest - Halsted St 201603-0330-501 0.00 0.00 0.00%0.00
East Hazel Crest - Tollway 200403-0330-500 182,446.29 193,282.52 -6.00%1,789,957.48
East Hazel Crest Total TIF Revenue: 182,446.29 193,282.52
Elgin - Bluff City Quarry 201103-0340-500 280,643.67 287,128.84 -2.00%1,068,126.77
Elgin Total TIF Revenue: 280,643.67 287,128.84
Page 14 of 33*This data may vary from when the TIF Ordinance was adopted. The normal TIF period is 23 years, but can be extended up to 35 years. TIFs can also be dissolved earlier by the municipality.

TIF NameFirst Tax
Year *Agency
2018TIF
Revenue
2018 to 2017Percent
Difference
2017TIF
Revenue
TotalTIF
Revenue
Elk Grove Village - Busse / Elmhurst 201403-0350-501 9,395,679.32 9,695,225.67 -3.00%23,444,677.44
Elk Grove Village - Devon/Rohlwing 200103-0360-501 612,386.68 633,147.37 -3.00%9,139,698.42
Elk Grove Village - Grove Mall 199903-0350-500 978,204.41 986,617.49 -1.00%20,337,992.05
Elk Grove Village - Higgins Rd Corridor 201703-0350-502 182,104.78 180,592.92 1.00%362,697.70
Elk Grove Village Total TIF Revenue: 11,168,375.19 11,495,583.45
Elmwood Park - Grand Ave Corridor 201403-0370-501 0.00 189,680.90 -100.00%298,281.55
Elmwood Park - Grand Ave Corridor II 201803-0370-503 73,945.33 100.00%New 2018 73,945.33
Elmwood Park - North/Harlem 201503-0370-502 0.00 37,878.37 -100.00%42,717.28
Elmwood Park Total TIF Revenue: 73,945.33 227,559.27
Evanston - Area 5 (Howard / Ridge) 200303-0380-504 695,537.79 641,372.52 8.00%6,941,452.80
Evanston - Area 6 (Dodge Rd / Church Ave) 200503-0380-505 722,135.53 221,153.50 227.00%3,175,049.38
Evanston - Chicago/Main 201303-0380-507 607,043.24 226,508.65 168.00%911,977.56
Evanston - Dempster / Dodge 201203-0380-506 122,797.23 136,926.59 -10.00%307,725.15
Evanston - Washington National 199403-0380-503 0.00 5,849,892.74 -100.00%Cancelled 2018 66,126,424.99
Evanston Total TIF Revenue: 2,147,513.79 7,075,854.00
Evergreen Park - 95th Street 200003-0390-502 1,299,336.49 1,258,687.06 3.00%17,846,577.21
Evergreen Park Total TIF Revenue: 1,299,336.49 1,258,687.06
Page 15 of 33*This data may vary from when the TIF Ordinance was adopted. The normal TIF period is 23 years, but can be extended up to 35 years. TIFs can also be dissolved earlier by the municipality.

TIF NameFirst Tax
Year *Agency
2018TIF
Revenue
2018 to 2017Percent
Difference
2017TIF
Revenue
TotalTIF
Revenue
Ford Heights - Cottage Grove/Rte 20 201503-0410-500 196,898.89 231,029.37 -15.00%480,724.99
Ford Heights Total TIF Revenue: 196,898.89 231,029.37
Forest Park - Brown St. Station / Harlem Ave. 200003-0420-501 545,111.75 555,355.01 -2.00%7,713,226.36
Forest Park - Roosevelt / Hannah 200203-0420-503 1,058,271.30 865,150.87 22.00%12,686,628.67
Forest Park - Roosevelt Rd Corridor 201503-0420-504 620,338.30 424,084.63 46.00%1,236,711.04
Forest Park Total TIF Revenue: 2,223,721.35 1,844,590.51
Franklin Park - 5 (Belmont / Williams) 199503-0450-504 807,637.81 806,301.48 0.00%12,393,776.24
Franklin Park - Centrella / Seymour 201103-0450-511 0.00 0.00 0.00%0.00
Franklin Park - DHL Seymour 201103-0450-510 0.00 0.00 0.00%4,158.64
Franklin Park - Downtown Franklin Avenue 200003-0450-505 230,053.89 177,730.99 29.00%3,636,470.24
Franklin Park - Mannheim / Grand 199903-0450-502 124,332.66 127,789.28 -3.00%2,600,160.49
Franklin Park - Milwaukee Area 2-1 201103-0450-509 31,668.77 42,116.68 -25.00%193,142.88
Franklin Park - O'Hare East (Industrial Complex) 200003-0450-506 397,078.42 398,810.01 0.00%5,548,587.17
Franklin Park - Resurrection 200703-0450-508 6,976.42 7,179.63 -3.00%810,300.05
Franklin Park - Seymour/Waveland 201503-0450-512 889,355.65 667,541.82 33.00%1,556,897.47
Franklin Park - West Mannheim Residential 198603-0450-500 1,004,754.01 1,030,869.03 -3.00%17,854,569.69
Franklin Park Total TIF Revenue: 3,491,857.63 3,258,338.92
Page 16 of 33*This data may vary from when the TIF Ordinance was adopted. The normal TIF period is 23 years, but can be extended up to 35 years. TIFs can also be dissolved earlier by the municipality.

TIF NameFirst Tax
Year *Agency
2018TIF
Revenue
2018 to 2017Percent
Difference
2017TIF
Revenue
TotalTIF
Revenue
Glenview - Naval Air Station 199903-0470-500 36,677,410.89 36,026,795.39 2.00%453,178,785.73
Glenview - Waukegan Rd/Golf Rd 201303-0470-501 1,556,942.24 1,525,617.32 2.00%5,197,436.48
Glenview Total TIF Revenue: 38,234,353.13 37,552,412.71
Glenwood - Halsted / Holbrook 200303-0480-503 377,563.57 437,779.00 -14.00%16,066,716.16
Glenwood - Industrial North 201103-0480-505 107,969.61 109,539.34 -1.00%597,244.19
Glenwood - Industrial Park 199103-0480-500 728,896.51 883,548.82 -18.00%19,622,174.52
Glenwood - Main Street 200203-0480-502 152,593.56 178,480.43 -15.00%3,861,635.37
Glenwood - North Halsted 201703-0480-509 102,899.91 89,144.47 15.00%192,044.38
Glenwood - South Halsted 201703-0480-510 203,490.68 128,272.17 59.00%331,762.85
Glenwood - State Street 201603-0480-508 98,289.53 110,664.98 -11.00%251,308.96
Glenwood - Town Center 201103-0480-506 0.00 0.00 0.00%0.00
Glenwood Total TIF Revenue: 1,771,703.37 1,937,429.21
Hanover Park - 4 200703-0500-503 25,705.33 41,709.26 -38.00%1,266,572.87
Hanover Park - 5 201303-0500-504 10,393.07 11,615.81 -11.00%52,899.92
Hanover Park - Village Center 3 200203-0500-502 1,974,646.82 2,033,146.14 -3.00%17,348,594.32
Hanover Park Total TIF Revenue: 2,010,745.22 2,086,471.21
Page 17 of 33*This data may vary from when the TIF Ordinance was adopted. The normal TIF period is 23 years, but can be extended up to 35 years. TIFs can also be dissolved earlier by the municipality.

TIF NameFirst Tax
Year *Agency
2018TIF
Revenue
2018 to 2017Percent
Difference
2017TIF
Revenue
TotalTIF
Revenue
Harvey - 1 198303-0510-500 484,454.50 472,840.26 2.00%11,513,583.10
Harvey - Arco/147th St 201303-0510-506 664,976.90 546,594.59 22.00%1,370,885.66
Harvey - Center Street 199603-0510-501 3,008,129.06 2,965,724.87 1.00%30,109,779.44
Harvey - Cresco Business Park 199703-0510-502 182,568.33 178,767.72 2.00%3,168,819.79
Harvey - Dixie Hwy Corridor 201303-0510-505 0.00 0.00 0.00%0.00
Harvey - RPM Business Park 200003-0510-503 190,588.79 37,121.93 413.00%735,305.18
Harvey - Sibley / Dixie HWY 199903-0510-504 280,183.95 275,930.35 2.00%3,463,500.73
Harvey Total TIF Revenue: 4,810,901.53 4,476,979.72
Hazel Crest - 167th Street / Corridor 200203-0530-504 22,584.90 54,487.44 -59.00%963,892.53
Hazel Crest - 183rd / Kedzie 199903-0530-502 0.00 15,761.11 -100.00%2,411,345.64
Hazel Crest - 2 (Cherry Creek) 199603-0530-501 102,874.23 101,254.50 2.00%1,050,527.55
Hazel Crest - Hazel Crest Proper 200103-0530-503 0.00 340,729.66 -100.00%2,922,931.97
Hazel Crest Total TIF Revenue: 125,459.13 512,232.71
Hickory Hills - 95th St 200503-0540-500 290,522.67 255,847.60 14.00%2,013,733.21
Hickory Hills Total TIF Revenue: 290,522.67 255,847.60
Hillside - Mannheim 200503-0550-502 2,737,395.81 2,609,518.73 5.00%24,712,316.58
Hillside - Rossevelt Road 201403-0550-503 288,968.23 0.00 100.00%288,968.23
Hillside Total TIF Revenue: 3,026,364.04 2,609,518.73
Page 18 of 33*This data may vary from when the TIF Ordinance was adopted. The normal TIF period is 23 years, but can be extended up to 35 years. TIFs can also be dissolved earlier by the municipality.

TIF NameFirst Tax
Year *Agency
2018TIF
Revenue
2018 to 2017Percent
Difference
2017TIF
Revenue
TotalTIF
Revenue
Hodgkins - 67th / LaGrange Rd 200703-0570-501 605,397.08 574,325.32 5.00%4,717,588.75
Hodgkins - East Ave #4 201503-0570-503 443,226.79 356,114.53 24.00%894,124.48
Hodgkins - East Avenue 201103-0570-502 0.00 0.00 0.00%0.00
Hodgkins Total TIF Revenue: 1,048,623.87 930,439.85
Hoffman Estates - Barrington / Higgins 198603-0580-501 642,420.14 639,321.34 0.00%13,827,354.47
Hoffman Estates - Golf / Higgins / Roselle 200303-0580-502 341,232.08 466,968.11 -27.00%7,047,393.46
Hoffman Estates - Higgins / Hassell 201203-0580-503 368,800.09 369,641.68 0.00%1,032,229.95
Hoffman Estates - Sears 198903-0580-500 23,205,954.92 23,889,118.80 -3.00%609,432,152.19
Hoffman Estates Total TIF Revenue: 24,558,407.23 25,365,049.93
Homewood - 187th St / Dixie Hwy 200003-0600-502 131,921.03 93,803.28 41.00%1,197,687.17
Homewood - Downtown TOD 201703-0600-507 94,669.33 68,100.84 39.00%162,770.17
Homewood - East CBD 201103-0600-505 0.00 0.00 0.00%0.00
Homewood - Northeast 201503-0600-506 502,905.15 301,770.71 67.00%982,999.21
Homewood - Southwest 199803-0600-503 18,674.15 26,358.71 -29.00%1,441,547.04
Homewood Total TIF Revenue: 748,169.66 490,033.54
Justice - 2 200203-0640-501 831,654.93 819,363.50 2.00%13,639,986.88
Justice - 4 201003-0640-503 4,207.64 0.00 100.00%4,418.27
Justice - 5 201603-0640-504 37,566.15 28,689.17 31.00%195,917.02
Justice Total TIF Revenue: 873,428.72 848,052.67
Page 19 of 33*This data may vary from when the TIF Ordinance was adopted. The normal TIF period is 23 years, but can be extended up to 35 years. TIFs can also be dissolved earlier by the municipality.

TIF NameFirst Tax
Year *Agency
2018TIF
Revenue
2018 to 2017Percent
Difference
2017TIF
Revenue
TotalTIF
Revenue
LaGrange Park - 31st/Barnsdale 201703-0670-501 223,401.12 313,095.47 -29.00%536,496.59
LaGrange Park - Village Market 201703-0670-500 214,755.42 220,064.82 -2.00%434,820.24
LaGrange Park Total TIF Revenue: 438,156.54 533,160.29
Lansing - (Ridge Road) 198803-0680-500 1,669,889.79 1,776,159.99 -6.00%46,227,297.15
Lansing - Bernice Road 200903-0680-503 2,019,889.70 1,929,533.32 5.00%5,955,011.05
Lansing - Torrence Ave Corridor 201403-0680-504 295,739.38 275,428.28 7.00%787,101.06
Lansing - West Lansing 199103-0680-502 1,776,811.55 1,902,468.01 -7.00%29,158,782.77
Lansing Total TIF Revenue: 5,762,330.42 5,883,589.60
Lemont - Downtown Canal 1 200503-0690-501 253,262.27 271,588.52 -7.00%2,995,537.17
Lemont - Gateway 200903-0690-502 122,692.22 78,934.27 55.00%458,471.15
Lemont - Main/Archer 201703-0690-503 0.00 1,928.06 -100.00%1,928.06
Lemont - Transit TOD 201803-0690-504 24,240.96 100.00%New 2018 24,240.96
Lemont Total TIF Revenue: 400,195.45 352,450.85
Lincolnwood - Devon / Lincoln 201403-0700-503 315,752.17 424,899.84 -26.00%1,040,345.88
Lincolnwood - Lincoln / Touhy 201103-0700-502 0.00 0.00 0.00%0.00
Lincolnwood - Northeast Industrial 199603-0700-500 1,620,109.16 1,249,277.99 30.00%26,684,014.29
Lincolnwood Total TIF Revenue: 1,935,861.33 1,674,177.83
Page 20 of 33*This data may vary from when the TIF Ordinance was adopted. The normal TIF period is 23 years, but can be extended up to 35 years. TIFs can also be dissolved earlier by the municipality.

TIF NameFirst Tax
Year *Agency
2018TIF
Revenue
2018 to 2017Percent
Difference
2017TIF
Revenue
TotalTIF
Revenue
Lynwood - Glenwood/Lansing/Torrence Ave. 200103-0710-501 281,738.97 284,741.16 -1.00%2,993,532.39
Lynwood Total TIF Revenue: 281,738.97 284,741.16
Lyons - 1 200003-0720-500 317,501.01 291,142.85 9.00%4,373,478.02
Lyons - 2 (South / Ogden / Joliet) 200003-0720-501 191,186.34 185,475.29 3.00%2,357,302.46
Lyons - 3 (1st Ave / Plainfield) 200303-0720-502 686,180.23 661,045.93 4.00%6,747,796.07
Lyons - Quarry 200703-0720-503 90,724.09 120,446.79 -25.00%318,467.44
Lyons Total TIF Revenue: 1,285,591.67 1,258,110.86
Markham - 1 199003-0730-500 1,127,926.62 1,177,707.45 -4.00%21,702,153.31
Markham - 2 199203-0730-501 211,140.49 202,999.61 4.00%3,802,734.40
Markham - Dixie Highway 199403-0730-503 3,012,072.92 3,156,136.81 -5.00%34,584,810.11
Markham - Interstate Crossings 201703-0730-504 177,512.05 140,040.84 27.00%317,552.89
Markham - Jevic Business Park 199703-0730-502 428,821.70 448,605.70 -4.00%7,676,514.88
Markham Total TIF Revenue: 4,957,473.78 5,125,490.41
Page 21 of 33*This data may vary from when the TIF Ordinance was adopted. The normal TIF period is 23 years, but can be extended up to 35 years. TIFs can also be dissolved earlier by the municipality.

TIF NameFirst Tax
Year *Agency
2018TIF
Revenue
2018 to 2017Percent
Difference
2017TIF
Revenue
TotalTIF
Revenue
Matteson - 5 200903-0740-504 249,528.60 249,523.36 0.00%841,559.40
Matteson - 7 North Cicero 201503-0740-506 2,349,533.89 1,466,671.79 60.00%4,021,967.50
Matteson - Commons 199503-0740-501 450,490.00 453,905.43 -1.00%8,498,800.40
Matteson - Lincoln Hwy / Cicero Ave 200403-0740-503 855,538.66 1,465,584.99 -42.00%10,766,576.88
Matteson - Lincoln Hwy / Gov 6 201103-0740-505 365,310.46 354,283.38 3.00%1,845,130.80
Matteson - Lincoln Mall 199503-0740-502 0.00 0.00 0.00%10,427,118.40
Matteson Total TIF Revenue: 4,270,401.61 3,989,968.95
Maywood - Madison Street / Fifth Avenue 199803-0750-501 3,613,232.24 3,603,352.04 0.00%36,751,589.53
Maywood - Roosevelt Road 199703-0750-502 819,133.56 810,881.40 1.00%8,451,282.47
Maywood Total TIF Revenue: 4,432,365.80 4,414,233.44
McCook - First Avenue 200303-0760-500 4,238,009.73 4,571,160.51 -7.00%37,187,145.94
McCook - Joliet Rd 200803-0760-501 319,928.54 315,196.76 2.00%2,480,807.97
McCook - Riverside Ave 201303-0760-502 1,411,788.62 1,373,587.96 3.00%5,800,889.45
McCook Total TIF Revenue: 5,969,726.89 6,259,945.23
Page 22 of 33*This data may vary from when the TIF Ordinance was adopted. The normal TIF period is 23 years, but can be extended up to 35 years. TIFs can also be dissolved earlier by the municipality.

TIF NameFirst Tax
Year *Agency
2018TIF
Revenue
2018 to 2017Percent
Difference
2017TIF
Revenue
TotalTIF
Revenue
Melrose Park - Business Dev Park 200103-0770-503 641,524.84 640,576.39 0.00%5,891,676.31
Melrose Park - Chicago / Superior 201003-0770-510 1,446,657.64 1,415,800.78 2.00%10,062,611.66
Melrose Park - Lake Street Corridor 200703-0770-509 340,968.65 353,253.22 -3.00%2,128,631.53
Melrose Park - Mid Metro Industrial Area 198903-0770-500 1,923,822.34 1,996,276.53 -4.00%32,038,298.31
Melrose Park - North Avenue / 25th Avenue 199803-0770-502 1,410,444.76 1,347,198.33 5.00%16,658,486.48
Melrose Park - Ruby Street 201503-0770-511 285,491.75 468,192.58 -39.00%1,132,601.93
Melrose Park - Seniors First 200103-0770-506 1,302,002.45 1,374,770.79 -5.00%19,736,643.12
Melrose Park Total TIF Revenue: 7,350,912.43 7,596,068.62
Midlothian - 147th/Cicero-2013 201303-0800-501 612,964.04 305,124.54 101.00%1,100,100.26
Midlothian Total TIF Revenue: 612,964.04 305,124.54
Morton Grove 199503-0810-500 661,498.78 571,193.02 16.00%10,283,271.23
Morton Grove - Dempster / Waukegan 201203-0810-502 219,155.44 58,230.54 276.00%301,099.41
Morton Grove - Ferris / Leigh 200003-0810-501 2,664,666.91 2,672,329.04 0.00%36,372,232.43
Morton Grove Total TIF Revenue: 3,545,321.13 3,301,752.60
Mount Prospect - Prospect & Main 201703-0820-501 427,223.37 473,687.82 -10.00%900,911.19
Mount Prospect Total TIF Revenue: 427,223.37 473,687.82
Page 23 of 33*This data may vary from when the TIF Ordinance was adopted. The normal TIF period is 23 years, but can be extended up to 35 years. TIFs can also be dissolved earlier by the municipality.
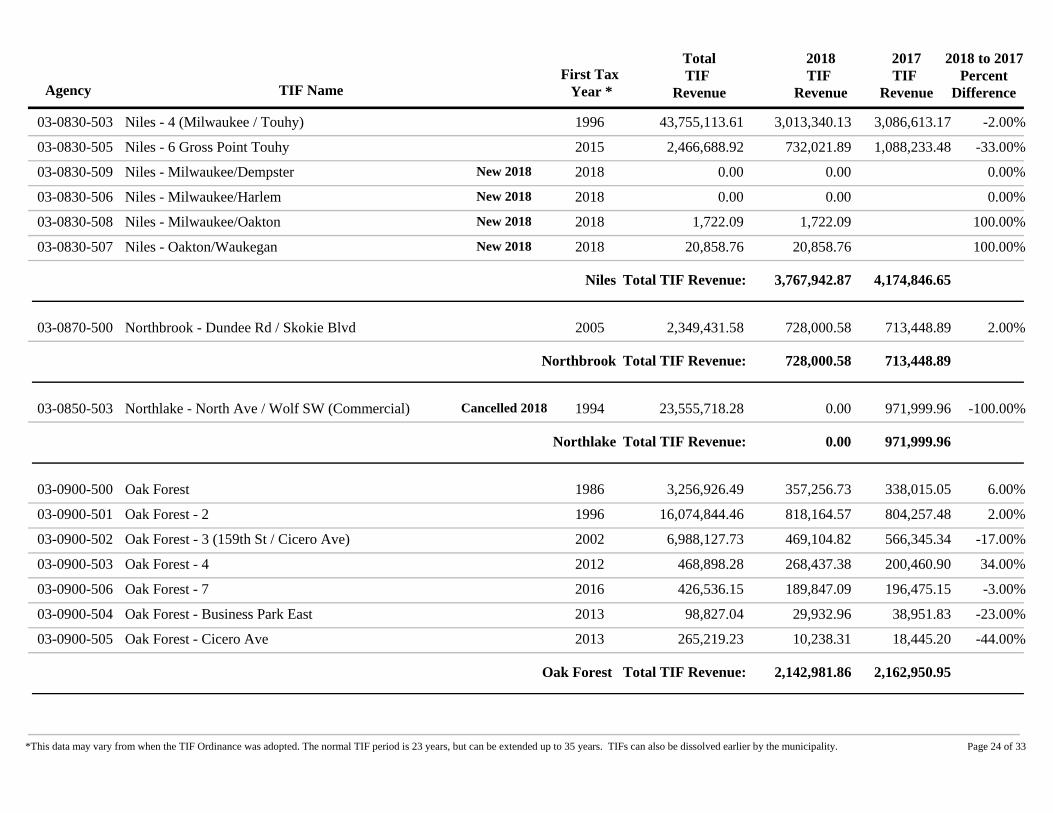
TIF NameFirst Tax
Year *Agency
2018TIF
Revenue
2018 to 2017Percent
Difference
2017TIF
Revenue
TotalTIF
Revenue
Niles - 4 (Milwaukee / Touhy) 199603-0830-503 3,013,340.13 3,086,613.17 -2.00%43,755,113.61
Niles - 6 Gross Point Touhy 201503-0830-505 732,021.89 1,088,233.48 -33.00%2,466,688.92
Niles - Milwaukee/Dempster 201803-0830-509 0.00 0.00%New 2018 0.00
Niles - Milwaukee/Harlem 201803-0830-506 0.00 0.00%New 2018 0.00
Niles - Milwaukee/Oakton 201803-0830-508 1,722.09 100.00%New 2018 1,722.09
Niles - Oakton/Waukegan 201803-0830-507 20,858.76 100.00%New 2018 20,858.76
Niles Total TIF Revenue: 3,767,942.87 4,174,846.65
Northbrook - Dundee Rd / Skokie Blvd 200503-0870-500 728,000.58 713,448.89 2.00%2,349,431.58
Northbrook Total TIF Revenue: 728,000.58 713,448.89
Northlake - North Ave / Wolf SW (Commercial) 199403-0850-503 0.00 971,999.96 -100.00%Cancelled 2018 23,555,718.28
Northlake Total TIF Revenue: 0.00 971,999.96
Oak Forest 198603-0900-500 357,256.73 338,015.05 6.00%3,256,926.49
Oak Forest - 2 199603-0900-501 818,164.57 804,257.48 2.00%16,074,844.46
Oak Forest - 3 (159th St / Cicero Ave) 200203-0900-502 469,104.82 566,345.34 -17.00%6,988,127.73
Oak Forest - 4 201203-0900-503 268,437.38 200,460.90 34.00%468,898.28
Oak Forest - 7 201603-0900-506 189,847.09 196,475.15 -3.00%426,536.15
Oak Forest - Business Park East 201303-0900-504 29,932.96 38,951.83 -23.00%98,827.04
Oak Forest - Cicero Ave 201303-0900-505 10,238.31 18,445.20 -44.00%265,219.23
Oak Forest Total TIF Revenue: 2,142,981.86 2,162,950.95
Page 24 of 33*This data may vary from when the TIF Ordinance was adopted. The normal TIF period is 23 years, but can be extended up to 35 years. TIFs can also be dissolved earlier by the municipality.

TIF NameFirst Tax
Year *Agency
2018TIF
Revenue
2018 to 2017Percent
Difference
2017TIF
Revenue
TotalTIF
Revenue
Oak Lawn - 111th / Cicero 200603-0910-506 0.00 0.00 0.00%1,317,263.94
Oak Lawn - Cicero Avenue 200203-0910-502 116,236.28 101,568.99 14.00%3,436,590.51
Oak Lawn - Cicero Gateway 201403-0910-507 1,013,183.43 1,098,193.20 -8.00%3,091,309.45
Oak Lawn - Commuter Parking Lot / Station 200303-0910-504 487,212.66 473,359.56 3.00%6,501,908.92
Oak Lawn - Patriot Station 201703-0910-508 3,492.31 98,591.56 -96.00%102,083.87
Oak Lawn - Train Station 200303-0910-503 407,850.75 395,210.00 3.00%4,629,307.83
Oak Lawn - Triangle 199503-0910-501 886,064.71 893,615.18 -1.00%8,109,021.71
Oak Lawn Total TIF Revenue: 2,914,040.14 3,060,538.49
Oak Park - Greater Mall Area 198303-0920-500 11,756,171.44 11,620,281.77 1.00%193,354,621.55
Oak Park - Madison St. Business Corridor 199503-0920-502 2,739,586.74 2,958,616.11 -7.00%40,315,476.98
Oak Park Total TIF Revenue: 14,495,758.18 14,578,897.88
Olympia Fields - Lincoln Hwy / Western Ave 201003-0930-500 0.00 0.00 0.00%0.00
Olympia Fields - Lincoln Hwy / Western Ave #2 201403-0930-501 1,331,442.61 1,275,798.40 4.00%3,911,881.27
Olympia Fields Total TIF Revenue: 1,331,442.61 1,275,798.40
Orland Park - Main St Triangle 200403-0950-501 1,168,079.73 1,142,148.30 2.00%4,973,794.75
Orland Park Total TIF Revenue: 1,168,079.73 1,142,148.30
Page 25 of 33*This data may vary from when the TIF Ordinance was adopted. The normal TIF period is 23 years, but can be extended up to 35 years. TIFs can also be dissolved earlier by the municipality.

TIF NameFirst Tax
Year *Agency
2018TIF
Revenue
2018 to 2017Percent
Difference
2017TIF
Revenue
TotalTIF
Revenue
Palatine 199603-0960-500 3,319,687.25 3,133,155.46 6.00%57,776,579.84
Palatine - Downtown 199903-0960-501 6,344,173.29 6,197,893.16 2.00%84,280,380.58
Palatine - Rand / Dundee Center 199703-0960-502 312,834.34 315,404.95 -1.00%6,742,463.13
Palatine - Rand / Lake Cook 201203-0960-504 452,745.89 210,330.44 115.00%819,124.68
Palatine - Rand Rd 200203-0960-503 3,075,842.60 3,069,997.31 0.00%40,395,425.87
Palatine Total TIF Revenue: 13,505,283.37 12,926,781.32
Palos Heights - 127th / Harlem 201103-0970-503 367,956.12 281,095.44 31.00%1,572,851.83
Palos Heights - Gateway 200503-0970-502 27,651.21 26,977.65 2.00%300,862.75
Palos Heights Total TIF Revenue: 395,607.33 308,073.09
Park Forest - Downtown 199703-1000-500 1,404,394.99 1,140,099.65 23.00%19,099,164.31
Park Forest - Norwood Square 200503-1000-502 0.00 0.00 0.00%6,727,340.26
Park Forest Total TIF Revenue: 1,404,394.99 1,140,099.65
Park Ridge - Dempster & Western 199903-1010-500 186,753.96 189,449.23 -1.00%3,019,979.70
Park Ridge - Uptown 200303-1010-501 3,328,313.36 3,173,836.03 5.00%31,972,638.70
Park Ridge Total TIF Revenue: 3,515,067.32 3,363,285.26
Page 26 of 33*This data may vary from when the TIF Ordinance was adopted. The normal TIF period is 23 years, but can be extended up to 35 years. TIFs can also be dissolved earlier by the municipality.
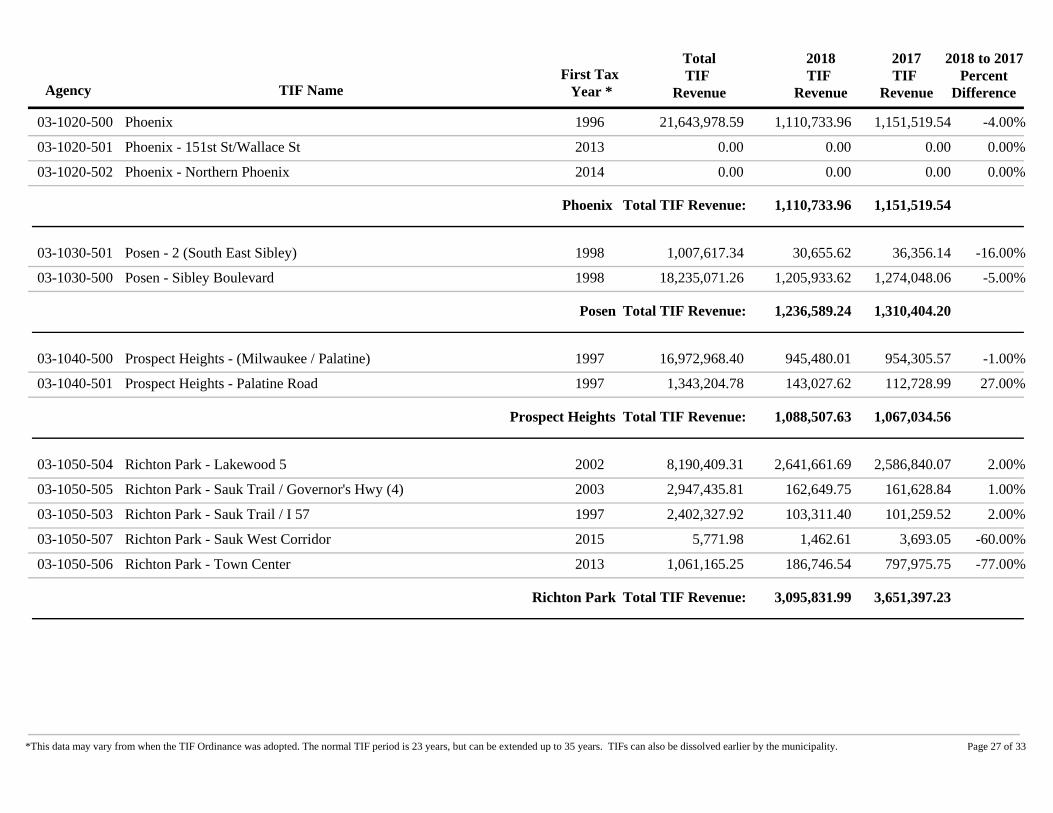
TIF NameFirst Tax
Year *Agency
2018TIF
Revenue
2018 to 2017Percent
Difference
2017TIF
Revenue
TotalTIF
Revenue
Phoenix 199603-1020-500 1,110,733.96 1,151,519.54 -4.00%21,643,978.59
Phoenix - 151st St/Wallace St 201303-1020-501 0.00 0.00 0.00%0.00
Phoenix - Northern Phoenix 201403-1020-502 0.00 0.00 0.00%0.00
Phoenix Total TIF Revenue: 1,110,733.96 1,151,519.54
Posen - 2 (South East Sibley) 199803-1030-501 30,655.62 36,356.14 -16.00%1,007,617.34
Posen - Sibley Boulevard 199803-1030-500 1,205,933.62 1,274,048.06 -5.00%18,235,071.26
Posen Total TIF Revenue: 1,236,589.24 1,310,404.20
Prospect Heights - (Milwaukee / Palatine) 199703-1040-500 945,480.01 954,305.57 -1.00%16,972,968.40
Prospect Heights - Palatine Road 199703-1040-501 143,027.62 112,728.99 27.00%1,343,204.78
Prospect Heights Total TIF Revenue: 1,088,507.63 1,067,034.56
Richton Park - Lakewood 5 200203-1050-504 2,641,661.69 2,586,840.07 2.00%8,190,409.31
Richton Park - Sauk Trail / Governor's Hwy (4) 200303-1050-505 162,649.75 161,628.84 1.00%2,947,435.81
Richton Park - Sauk Trail / I 57 199703-1050-503 103,311.40 101,259.52 2.00%2,402,327.92
Richton Park - Sauk West Corridor 201503-1050-507 1,462.61 3,693.05 -60.00%5,771.98
Richton Park - Town Center 201303-1050-506 186,746.54 797,975.75 -77.00%1,061,165.25
Richton Park Total TIF Revenue: 3,095,831.99 3,651,397.23
Page 27 of 33*This data may vary from when the TIF Ordinance was adopted. The normal TIF period is 23 years, but can be extended up to 35 years. TIFs can also be dissolved earlier by the municipality.

TIF NameFirst Tax
Year *Agency
2018TIF
Revenue
2018 to 2017Percent
Difference
2017TIF
Revenue
TotalTIF
Revenue
River Forest - Madison Street 201603-1060-501 148,113.37 56,835.97 161.00%204,949.34
River Forest - North Ave 201803-1060-502 0.00 0.00%New 2018 0.00
River Forest Total TIF Revenue: 148,113.37 56,835.97
River Grove - 3 201103-1070-502 0.00 0.00 0.00%Cancelled 2018 0.00
River Grove - Belmont / Thatcher 199803-1070-500 787,582.06 779,447.10 1.00%11,278,783.81
River Grove - Grand/Thatcher 201603-1070-503 331,708.07 271,192.56 22.00%796,193.97
River Grove Total TIF Revenue: 1,119,290.13 1,050,639.66
Riverdale - 3 (144th / Indiana Ave) 199703-1080-502 1,054,494.01 946,969.58 11.00%10,720,285.49
Riverdale Total TIF Revenue: 1,054,494.01 946,969.58
Robbins - (Kirchoff / Meadow) 199403-1100-500 352,590.02 335,460.44 5.00%6,623,819.33
Robbins Total TIF Revenue: 352,590.02 335,460.44
Rolling Meadows - Golf Rd Conserv 201503-1110-503 3,325,192.42 3,282,330.85 1.00%7,831,520.70
Rolling Meadows - Kirchoff RD/Owl DR 200203-1110-501 258,364.38 266,860.75 -3.00%4,922,928.21
Rolling Meadows Total TIF Revenue: 3,583,556.80 3,549,191.60
Roselle - North Roselle Rd Corridor 201503-1120-500 152,989.22 108,721.41 41.00%336,994.30
Roselle Total TIF Revenue: 152,989.22 108,721.41
Page 28 of 33*This data may vary from when the TIF Ordinance was adopted. The normal TIF period is 23 years, but can be extended up to 35 years. TIFs can also be dissolved earlier by the municipality.

TIF NameFirst Tax
Year *Agency
2018TIF
Revenue
2018 to 2017Percent
Difference
2017TIF
Revenue
TotalTIF
Revenue
Rosemont - 5 (Touhy / Mannheim) 199903-1130-504 1,178,339.15 1,173,659.52 0.00%18,929,809.75
Rosemont - Balmoral/Pearl 8 201603-1130-507 3,007,172.57 141,826.17 2020.00%3,166,060.67
Rosemont - Higgins / Mannheim #7 201403-1130-506 573,656.89 556,449.44 3.00%1,435,067.34
Rosemont - Higgins/River Rd 6 201303-1130-505 4,008,064.02 2,768,302.88 45.00%10,575,455.60
Rosemont - River Road 198403-1130-502 17,079,928.10 17,428,933.90 -2.00%341,087,750.15
Rosemont - South River Road (4) 199803-1130-503 12,351,020.44 12,555,394.72 -2.00%66,154,876.87
Rosemont Total TIF Revenue: 38,198,181.17 34,624,566.63
Sauk Village - 2 (Sauk Industrial Park) 198803-1140-501 1,070,842.68 1,130,035.40 -5.00%24,105,833.56
Sauk Village - 3 199403-1140-502 3,882,383.95 4,176,429.57 -7.00%37,214,456.98
Sauk Village - 4 200503-1140-503 109,265.57 148,025.67 -26.00%2,119,896.04
Sauk Village Total TIF Revenue: 5,062,492.20 5,454,490.64
Schaumburg - North Schaumburg 201403-1150-502 12,453,521.65 12,870,091.22 -3.00%27,817,794.21
Schaumburg Total TIF Revenue: 12,453,521.65 12,870,091.22
Schiller Park - Irving / Kolze 199903-1160-501 131,323.44 143,080.07 -8.00%2,879,802.19
Schiller Park - Lawrence / 25th Ave 200603-1160-502 149,649.19 195,843.42 -24.00%1,114,039.35
Schiller Park - West Gateway 199703-1160-500 69,310.74 80,714.18 -14.00%1,126,749.20
Schiller Park - West Gateway 2 201103-1160-503 943,880.18 941,486.57 0.00%4,127,227.80
Schiller Park Total TIF Revenue: 1,294,163.55 1,361,124.24
Page 29 of 33*This data may vary from when the TIF Ordinance was adopted. The normal TIF period is 23 years, but can be extended up to 35 years. TIFs can also be dissolved earlier by the municipality.

TIF NameFirst Tax
Year *Agency
2018TIF
Revenue
2018 to 2017Percent
Difference
2017TIF
Revenue
TotalTIF
Revenue
Skokie - Downtown Science & Technology 200503-1170-503 3,504,026.55 3,344,373.07 5.00%27,812,973.50
Skokie - West Dempter 201003-1170-504 195,037.05 3,940.29 4850.00%241,252.68
Skokie Total TIF Revenue: 3,699,063.60 3,348,313.36
South Chicago Heights - 2 200903-1190-501 52,519.68 59,739.42 -12.00%112,935.47
South Chicago Heights - 4 201503-1190-503 120,084.78 98,525.78 22.00%243,206.72
South Chicago Heights - Chicago Rd / Sauk Trail 200003-1190-500 409,934.79 534,075.47 -23.00%5,650,699.94
outh Chicago Heights Total TIF Revenue: 582,539.25 692,340.67
South Holland - Downtown 200303-1200-504 165,015.18 248,619.27 -34.00%1,552,934.70
South Holland - Gateway East 200703-1200-505 67,568.81 66,522.44 2.00%1,160,482.01
South Holland - Gateway West 201603-1200-508 304,982.09 461,599.02 -34.00%843,253.17
South Holland - I-94 South 201503-1200-506 122,775.76 136,363.30 -10.00%394,184.65
South Holland - Interstate 80 198903-1200-500 784,063.23 1,467,470.05 -47.00%18,945,697.28
South Holland - IZD Zone A 201503-1200-507 0.00 0.00 0.00%1,719.07
South Holland - Route 6 / South Park 199003-1200-501 828,878.14 819,220.15 1.00%16,662,589.27
South Holland Total TIF Revenue: 2,273,283.21 3,199,794.23
Steger 200503-1210-500 15,586.64 28,111.58 -45.00%297,771.13
Steger - 30th / Loverock Ave 200603-1210-501 83,546.44 84,887.87 -2.00%892,791.98
Steger - Chicago Road 201603-1210-502 78,502.01 50,614.52 55.00%129,116.53
Steger Total TIF Revenue: 177,635.09 163,613.97
Page 30 of 33*This data may vary from when the TIF Ordinance was adopted. The normal TIF period is 23 years, but can be extended up to 35 years. TIFs can also be dissolved earlier by the municipality.

TIF NameFirst Tax
Year *Agency
2018TIF
Revenue
2018 to 2017Percent
Difference
2017TIF
Revenue
TotalTIF
Revenue
Stone Park - North Ave / 31st Ave 200003-1230-500 142,594.67 145,237.27 -2.00%1,139,438.26
Stone Park Total TIF Revenue: 142,594.67 145,237.27
Streamwood - Buttitta Dr / Francis Ave 200103-1240-500 456,960.69 451,170.05 1.00%6,481,543.13
Streamwood Total TIF Revenue: 456,960.69 451,170.05
Summit - 59th St 201103-1250-503 184,683.95 133,928.38 38.00%822,041.34
Summit - 63rd Place 200903-1250-502 0.00 0.00 0.00%1,237,878.37
Summit - 63rd St / Archer Ave 200303-1250-501 1,163,391.41 1,085,963.04 7.00%11,602,747.37
Summit Total TIF Revenue: 1,348,075.36 1,219,891.42
Thornton - Blackstone 201603-1260-502 30,746.27 27,322.15 13.00%812,300.34
Thornton - Downtown 199403-1260-501 0.00 191,470.34 -100.00%Cancelled 2018 5,495,646.21
Thornton - Downtown #3 201703-1260-503 38,180.43 60,476.77 -37.00%98,657.20
Thornton Total TIF Revenue: 68,926.70 279,269.26
Page 31 of 33*This data may vary from when the TIF Ordinance was adopted. The normal TIF period is 23 years, but can be extended up to 35 years. TIFs can also be dissolved earlier by the municipality.

TIF NameFirst Tax
Year *Agency
2018TIF
Revenue
2018 to 2017Percent
Difference
2017TIF
Revenue
TotalTIF
Revenue
Tinley Park - Legacy 201603-1270-504 494,518.40 644,304.82 -23.00%1,295,467.24
Tinley Park - Main Street North 200203-1270-501 475,710.64 530,569.14 -10.00%7,017,662.03
Tinley Park - Main Street South 200303-1270-502 0.00 164,028.54 -100.00%Cancelled 2018 5,925,811.56
Tinley Park - Mental Health Center 201503-1270-503 172,524.88 295,012.17 -42.00%774,059.83
Tinley Park - New Bremen 201803-1270-505 162,143.86 100.00%New 2018 162,143.86
Tinley Park - Oak Park Avenue 199503-1270-500 0.00 5,036,814.52 -100.00%Cancelled 2018 65,527,524.01
Tinley Park Total TIF Revenue: 1,304,897.78 6,670,729.19
Western Springs - Downtown South 201503-1300-500 60,704.22 59,921.86 1.00%122,755.33
Western Springs Total TIF Revenue: 60,704.22 59,921.86
Wheeling - Milwaukee / Lake-Cook (North) 200203-1310-502 5,290,163.67 5,193,807.91 2.00%53,522,987.36
Wheeling - Milwaukee Avenue Corridor 198503-1310-500 2,869,888.55 2,847,717.76 1.00%58,247,950.74
Wheeling - Milwaukee/Manchester (South) 200003-1310-501 1,635,616.01 1,584,497.01 3.00%22,668,547.66
Wheeling - Southeast II 201403-1310-505 943,521.49 857,183.84 10.00%2,801,647.28
Wheeling - Town Center II 201403-1310-506 1,999,290.81 1,310,482.96 53.00%4,203,048.00
Wheeling Total TIF Revenue: 12,738,480.53 11,793,689.48
Willow Springs - Village Center 199803-1320-500 1,884,288.12 1,981,054.66 -5.00%24,696,146.04
Willow Springs Total TIF Revenue: 1,884,288.12 1,981,054.66
Page 32 of 33*This data may vary from when the TIF Ordinance was adopted. The normal TIF period is 23 years, but can be extended up to 35 years. TIFs can also be dissolved earlier by the municipality.

TIF NameFirst Tax
Year *Agency
2018TIF
Revenue
2018 to 2017Percent
Difference
2017TIF
Revenue
TotalTIF
Revenue
Worth - 111th St / Toll Rd 200603-1350-501 38,780.79 36,630.53 6.00%635,244.62
Worth Total TIF Revenue: 38,780.79 36,630.53
Total:
2018 2017
1,179,496,839.27 1,004,310,680.23 17.44%
2018 to 2017% Difference
Suburban:
City of Chicago^:
338,675,817.92 344,264,968.78 -1.62%
840,821,021.35 660,045,711.45 27.39%
^Chicago Transit TIF RPM1 revenue and Chicago Total TIF revenue include portion of icremental Transit TIF revenue to be distributed to CPS and other taxing districts.
Page 33 of 33*This data may vary from when the TIF Ordinance was adopted. The normal TIF period is 23 years, but can be extended up to 35 years. TIFs can also be dissolved earlier by the municipality.