Embed Size (px)
Citation preview

FY2013 Financial ResultsJun, 2014
COOKPAD Inc.
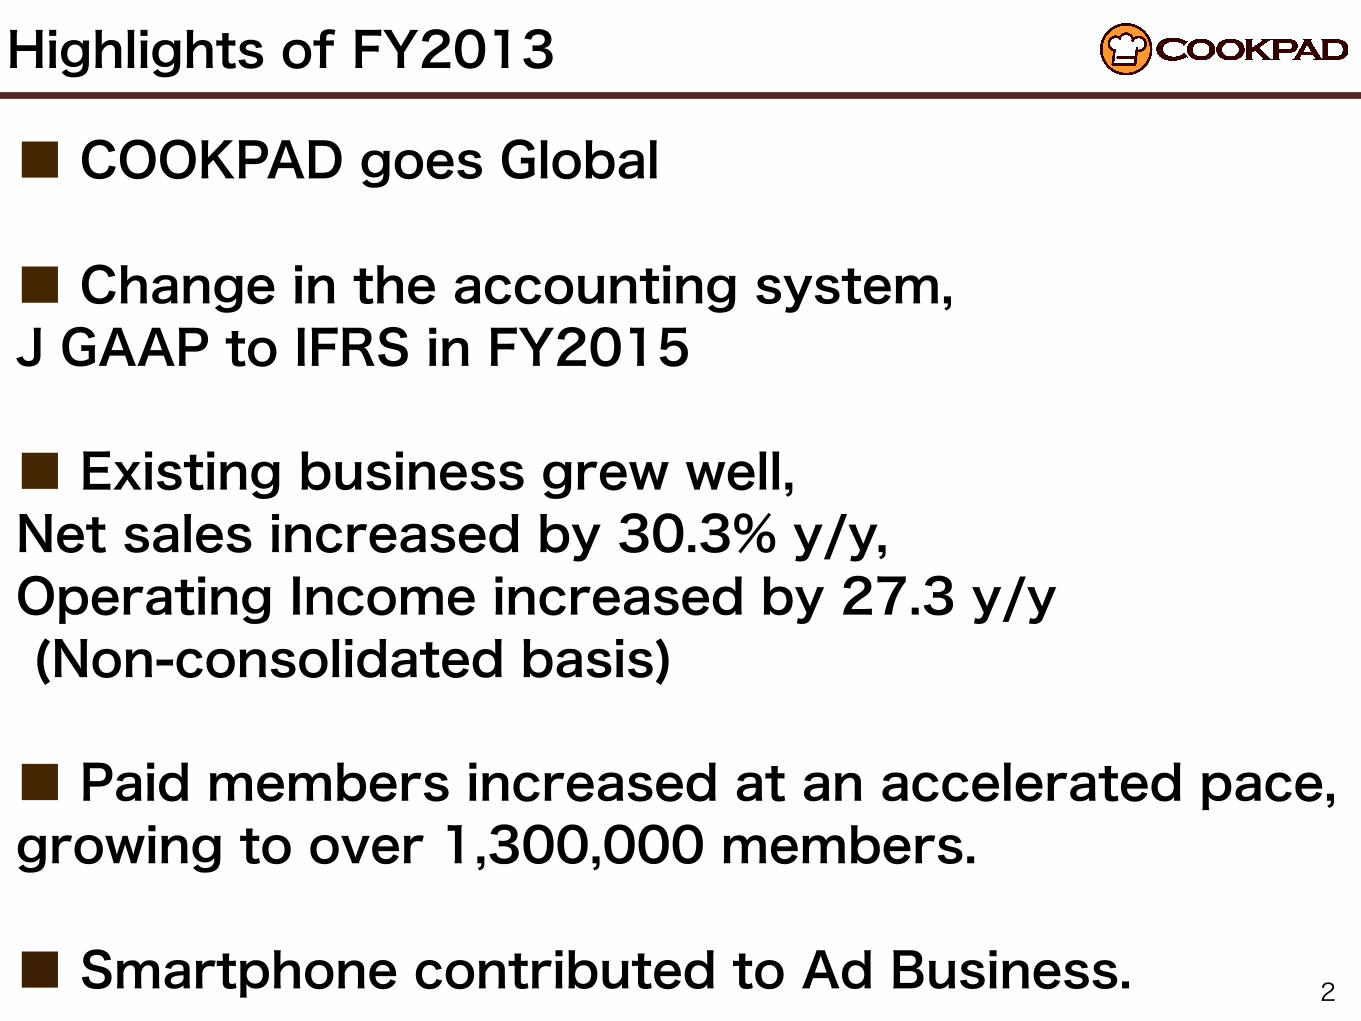
Highlights of FY2013
■ COOKPAD goes Global
■ Change in the accounting system, J GAAP to IFRS in FY2015
■ Existing business grew well, Net sales increased by 30.3% y/y, Operating Income increased by 27.3 y/y (Non-consolidated basis)
■ Paid members increased at an accelerated pace, growing to over 1,300,000 members.
■ Smartphone contributed to Ad Business. 2

COOKPAD goes Global
3
40 million users
1million users
6 million users
0.5 million users
The largest “user-generated” recipe service in Spain
Indonesian recipe service acquired in 4th quoter
No.1 recipe app on Google Play USA
※1
※1 “Cooking and Recipes”category ranking in Spain by SimilarWeb(http://www.similarweb.com/)※2 Recipe apps ranking on Google Play USA by App Annie(www.appannie.com/jp/)※3 Number of users are monthly unique users at Dec. 2013 (allthecooks and mis recetas) and Apr. 2014 (Dapur Masak)
※2

From J GAAP to IFRS
4
■ Change the accounting period from April to December in FY2014.
■ Change in the accounting system, J GAAP to IFRS from FY2015. ※ This change requires the amendment of the articles of incorporation. It will be approved on the annual meeting of stockholders on 24 July, 2014.
※

Consolidated Business Results
May1,2013~April30,2014

Major consolidated companies
6
Company Description of business Timing of acquisition
ALLTHECOOKS, LLCRecipe apps in English 3rd quarter
COOKPAD SPAIN, S.L.Recipe service in Spanish 3rd quarter
DAPUR MASAK PTE. LTD.Recipe service in Indnesian 4rd quarter
Company Description of business Timing of acquisition
Coach United Inc.Market place of private lessons 2nd quarter
International
Japan

Differences between consolidation/non-consolidation
7
Non-consolidatedoperating income
3,375million yen
Goodwill amortization
144 million yen Other99 million yen
3,132million yen
Consolidatedoperating income

FY2012Full year
(Non-consolidated)
FY2013Full year
(Non-consolidated)
y/y
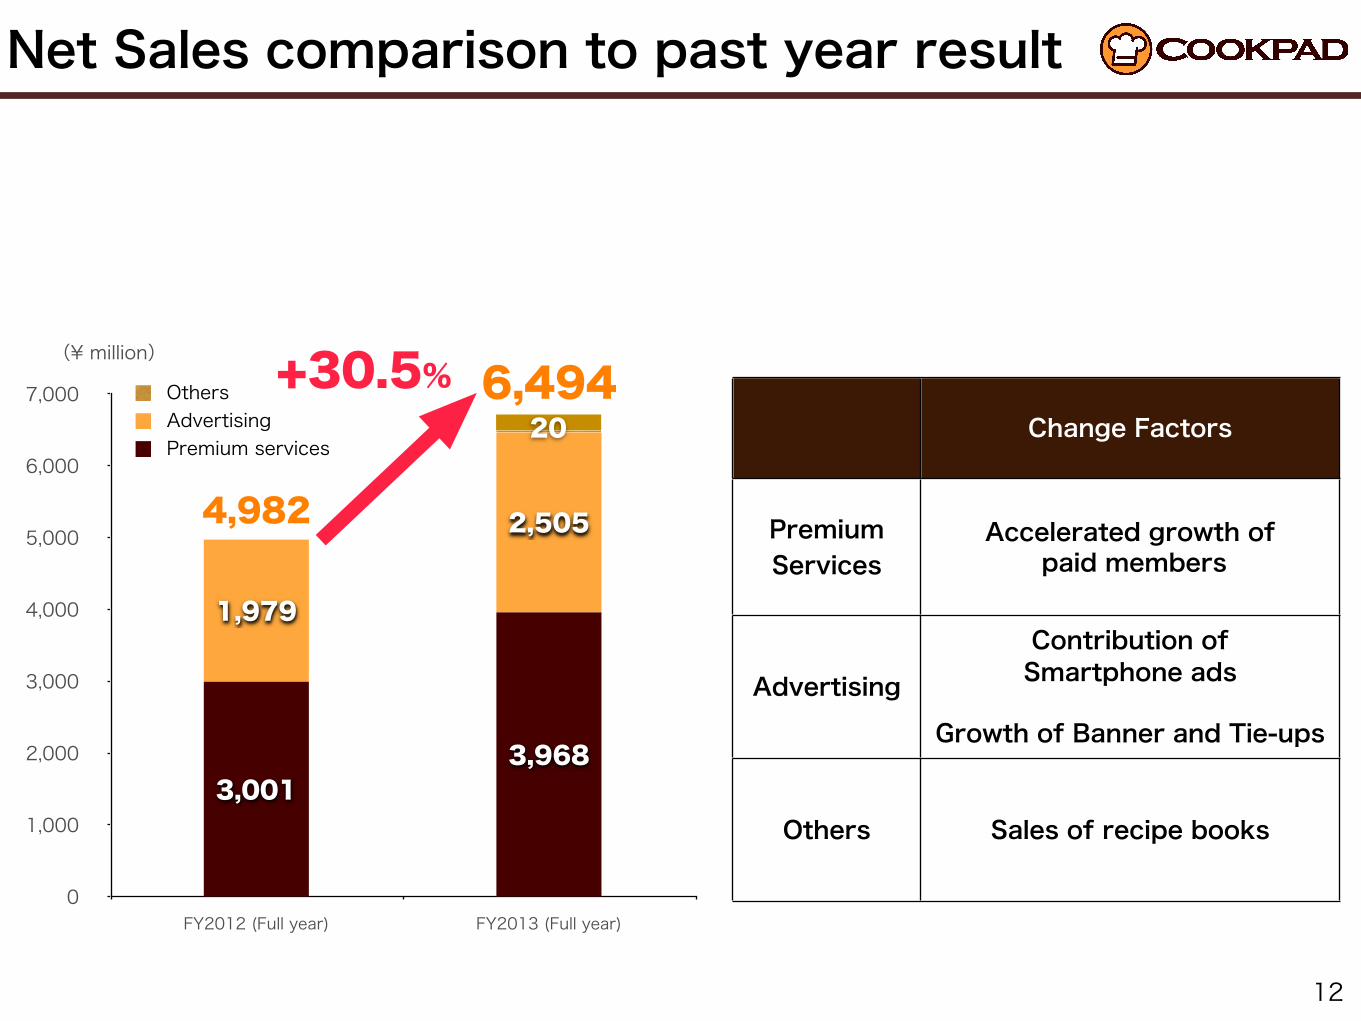
Net sales 4,982 6,494 +30.3%
OperatingIncome 2,644 3,375 +27.6%
OrdinaryIncome 2,701 3,275 +21.2%
Net income 1,616 2,046 +26.6%
(¥ million)
FY2013Full year
(Consolidated)
6,572
3,132
3,147
1,866
Summary of income statement
8
※1 Started consolidated balance sheet from FY2013 Q2 and started consolidated income statement from FY2013 Q3.※2 Differences between operating income and ordinary income are mainly from allowance for investment loss.
※2
※1
Operating income before goodwill amortization
2,644 3,375 +27.6% 3,277
※1

Cash Flows
9
(¥ million yen)
※ Breakdown of cash flow from investing activities FY2012:Expenditure due to the fixed deposit 1,500million yen FY2013:Expenditure due to the acquisition of stock and business 2,631 million yen Refund from the fixed deposit 1,500 million yen
FY2012 (Non-consolidated)
FY2013(Consolidated)
Cash flow from operating activities 1,874 1,924
Cash flow from investing activities -1,683 -1,320
Cash flow from financing activities -9 -123
Cash and cash equivalents at the end of
FY20134,167 4,691
※ ※

Dividend
10
■ Considering share splitting on 1 May, 2013, dividend per share increased from 5yen to 12yen.
FY2012 FY2013Dividend per Share(Before share splitting) 10yen ーDividend per Share(After share splitting) 5yen 12yen
Consolidated dividend ratio 10.1% 21.2%

Non-consolidated Business Results
May1,2013~April30,2014
0
1,000
2,000
3,000
4,000
5,000
6,000
7,000
FY2012 (Full year) FY2013 (Full year)
2,505
1,979
3,9683,001
(¥ million)
6,494+30.5%20
Net Sales comparison to past year result
Premium servicesAdvertisingOthers
Change Factors
PremiumServices
Accelerated growth of paid members
AdvertisingContribution of Smartphone ads
Growth of Banner and Tie-ups
Others Sales of recipe books
12
4,982

Net Sales trend by Business
13
(¥ million yen)
0
200
400
600
800
1,000
1,200
1,400
1,600
1,800
2,000
Q1 Q2 Q3 Q4 Q1 Q2 Q3 Q4 Q1 Q2 Q3 Q4 Q1 Q2 Q3 Q4 Q1 Q2 Q3 Q4
705
564574660
620485
452420480
390413302354414410
373410362
294287
1,1141,019956877816775727681638582558542497451402358305237179129
Premium servicesAdvertisingOthers
732
865813 851 844
FY2011
972 9731,103
FY2012
1,119
1,259
1,4371,539
FY2010 FY2013
1,5332
21
1,180
1,587
FY2009
716599
473417
1,83413

0
500
1,000
1,500
2,000
2,500
3,000
3,500
FY2012 (Full year) FY2013 (Full year)
728
557208
53
155
110449
335
1,5151,225
SG&A comparison to past quarter result
14
(¥ million yen)
主な増減要因
Personnel costs
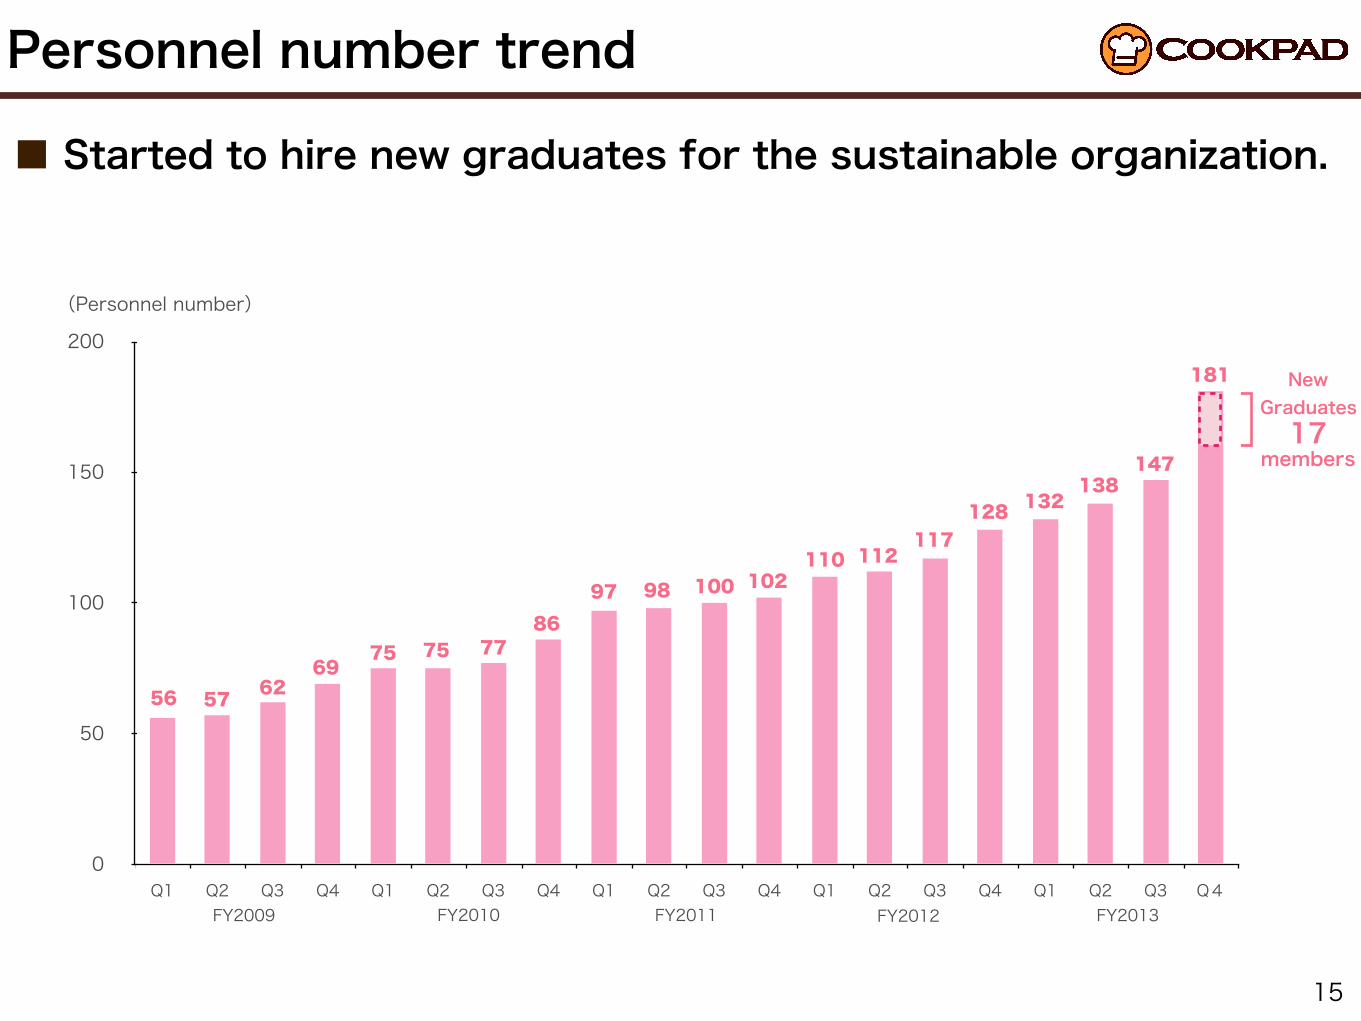
Growing number of employees(128 in Apr. 2013 to 181in Apr. 2014
including 17 of new graduates)
Paid-chargecommissions Increase in paid members
Cloud-serviceusage fees
Stable afterAWS migration in FY2011
Promotion fees Shop affiliates increased
Others Increase various costs due to service expansion
3,055
2,282Personnel costsPaid-charge commissionsCloud-service usage feesPromotion feesOthers
Personnel number trend
15
FY2013
(Personnel number)
0
50
100
150
200
Q1 Q2 Q3 Q4 Q1 Q2 Q3 Q4 Q1 Q2 Q3 Q4 Q1 Q2 Q3 Q4 Q1 Q2 Q3 Q4FY2010 FY2011 FY2012
New Graduates 17
members
FY2009
56
7575
5769
62
9786
77
11211010210098
138132128
117
181
147
■ Started to hire new graduates for the sustainable organization.

SG&A trend
16
(¥ million yen)
0
100
200
300
400
500
600
700
800
900
Q1 Q2 Q3 Q4 Q1 Q2 Q3 Q4 Q1 Q2 Q3 Q4 Q1 Q2 Q3 Q4 Q1 Q2 Q3 Q4
192
179182
169150
132138135133129105116
220
937189
86
745582
65
70462613
20172
47
38363231
2625283428503130
27272731
292719
127
11210710395
8780726757515250
44403530
231713
449364359341365
292281285300265259251262203191174222
135128113
Personnel costsPaid-charge commissionsCloud-service usage feesPromotion feesOthers
327 330370
565
451 466482
535 522
FY2010 FY2011 FY2012
■ Increase in personnel costs & promotion fees
544 559
656 673
FY2013
733765
FY2009
882
370
263230228

Operating income trend
17
(¥ million)
FY2010 FY2011 FY2012
0
100
200
300
400
500
600
700
800
900
1,000
Q1 Q2 Q3 Q4 Q1 Q2 Q3 Q4 Q1 Q2 Q3 Q4 Q1 Q2 Q3 Q4 Q1 Q2 Q3 Q4
FY2013FY2009
178231
322 330
394
470 486
275
386
491 481
569 563
769
691
620
843
787810
935

Business Details - Users
18
The number of monthly users
0
5
10
15
20
25
30
35
40
45
Jul Oct Jan Apr Jul Oct Jan Apr
1.071.17
1.43
1.482.19
2.553.45
4.28
9.018.14
7.54
6.676.53
5.764.97
3.83
17.7616.5614.2911.09.888.76.8
5.31
15.7315.0215.9514.8114.0613.8814.1712.69
FY2012
(million)
※ The number of monthly users in counted on either a browser basis or device basis.
PCSmartphone browsersSmartphone appsFeature phonesOthers
29.4130.90
32.77 34.29
Smartphone users
26.78M
39.59
FY2013
41.340.430.36
0.100.31
44.04 million0.44
26.13
y/y+34.4%

More than 1.7 million recipes
19
(million)
1.00
1.10
1.20
1.30
1.40
1.50
1.60
1.70
1.80
Jul Oct Jan Apr Jul Oct Jan Apr
1.271.33
1.381.45
1.511.57
1.631.71
FY2012
Registerd recipes
FY2013
No.1 recipe site in Japan
20
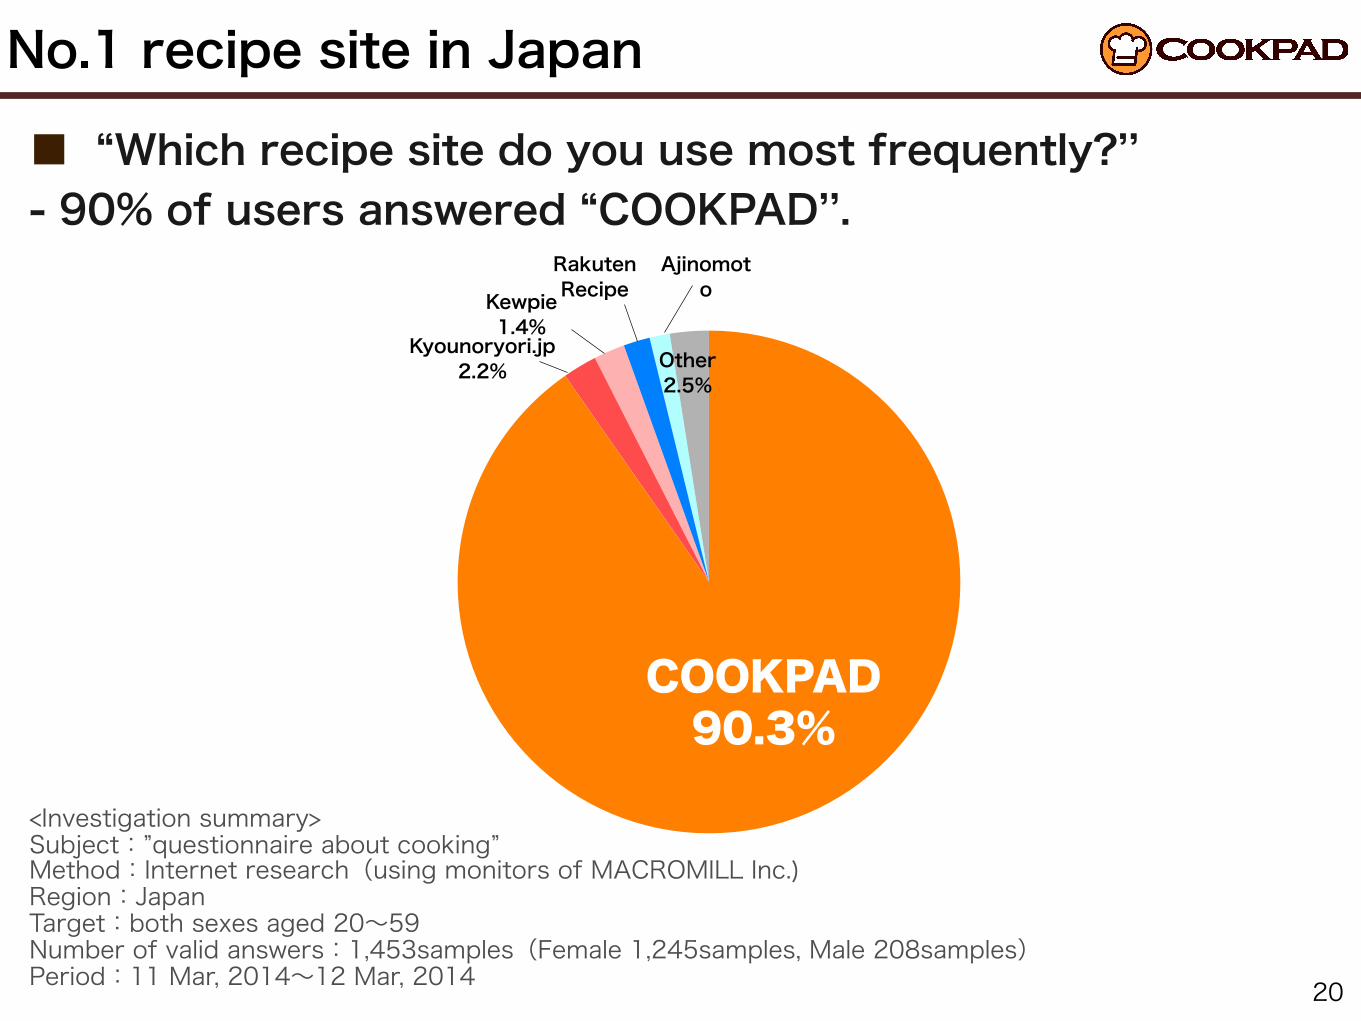
■ “Which recipe site do you use most frequently?’’- 90% of users answered “COOKPAD’’.
COOKPAD90.3%
Kewpie1.4%
Ajinomoto
Kyounoryori.jp2.2%
Rakuten Recipe
Other2.5%
<Investigation summary>Subject:”questionnaire about cooking”Method:Internet research(using monitors of MACROMILL Inc.)Region:JapanTarget:both sexes aged 20~59Number of valid answers:1,453samples(Female 1,245samples, Male 208samples)Period:11 Mar, 2014~12 Mar, 2014

Demographics of COOKPAD users
21
Male13.6%
Female86.4%
Gender Age groups (Female)
20-2932.7%
-209.1%
50-6.1%
30-3933.1%
40-4919.0%
※ The attribute data of registered users on COOKPAD for May. 2014
■ Used by the most of Japanese women in 20-40s
Premium Services Business
22
0
200
400
600
800
1,000
1,200
Q1 Q2 Q3 Q4 Q1 Q2 Q3 Q4 Q1 Q2 Q3 Q4 Q1 Q2 Q3 Q4 Q1 Q2 Q3 Q4
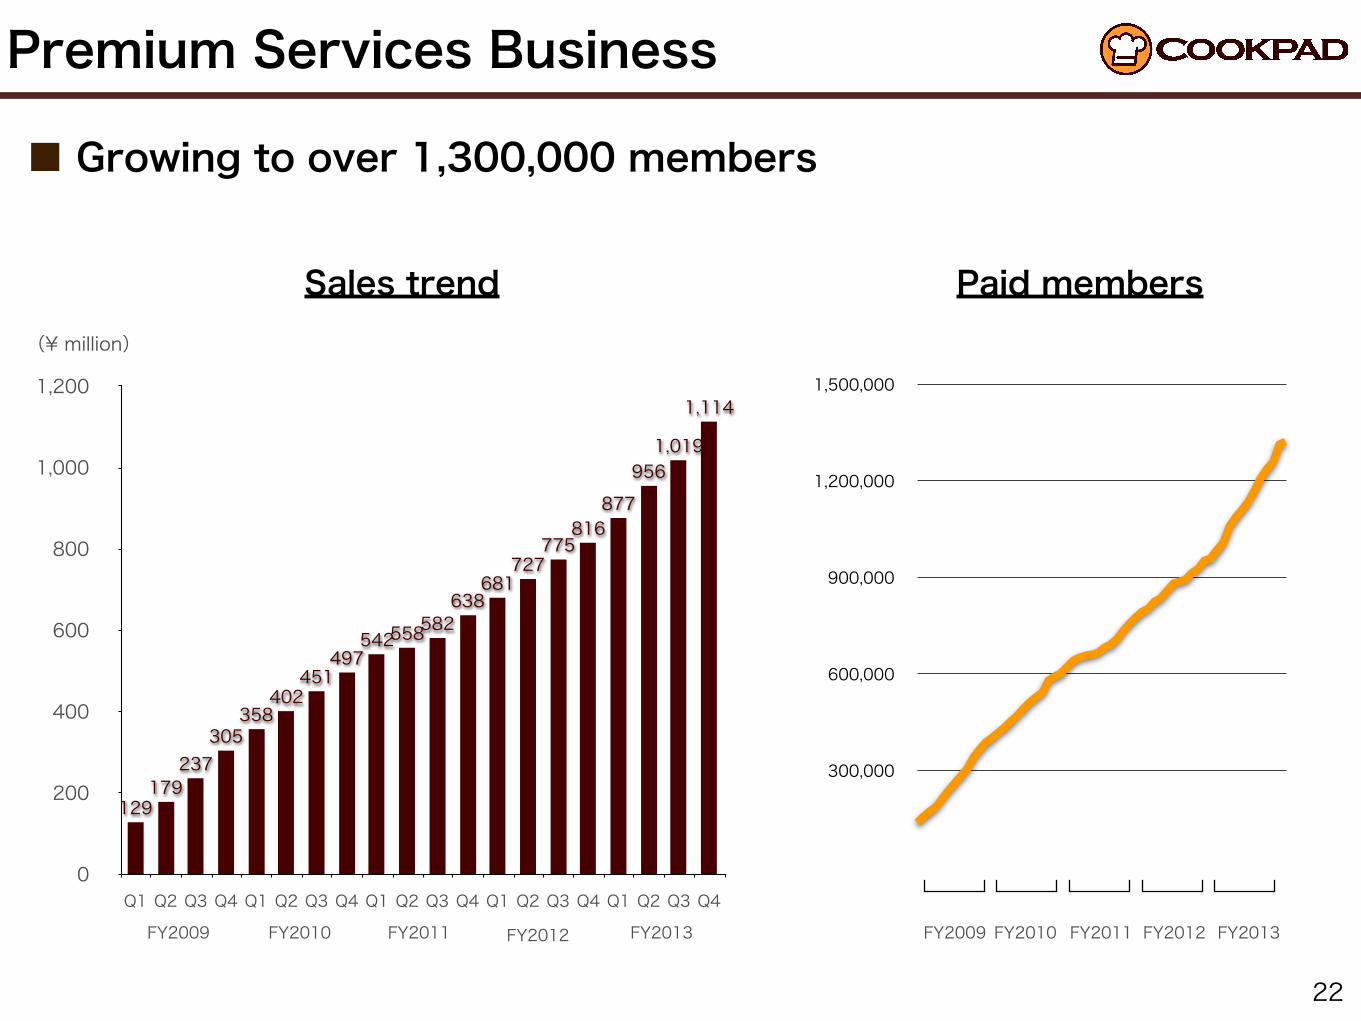
1,114
1,019956
877816
775727
681638
582558542497
451402
358305
237179
129
FY2011FY2010
Sales trend(¥ million)
Paid members
300,000
600,000
900,000
1,200,000
1,500,000
FY2012 FY2010 FY2011 FY2012
■ Growing to over 1,300,000 members
FY2013 FY2013FY2009 FY2009

0
30,000
60,000
90,000
120,000
150,000
Q1 Q2 Q3 Q4 Q1 Q2 Q3 Q4 Q1 Q2 Q3 Q4FY2011 FY2013
363thousand
200%
181thousand
Comparison of the net increase
FY2013FY2012
Increase in consumption tax
One time effect
Number of paid members
23
Incremental increase in number of paid members
FY2012
One time effect
Temporary decreased due to the shift to smartphones
■ Net increase of paid members has doubled compared to the previous year.■ The accelerated growth of paid members by improving subscription process and shop affiliates.

Advertising
24
420480
390413
302
452485
620
Sales trend(¥ million)
0
100
200
300
400
500
600
700
800
Q1 Q2 Q3 Q4 Q1 Q2 Q3 Q4 Q1 Q2 Q3 Q4
705
564574
660620
485452
420
480
390413
302
FY2011 FY2012 FY2013 FY2011 FY2012 FY2013
Breakdown by product(¥ million)
0
100
200
300
400
500
600
700
800
Q1 Q2 Q3 Q4 Q1 Q2 Q3 Q4 Q1 Q2 Q3 Q4
184
143131
109152
121117102
12672
18
19
266192
163
209
181
1451057687
88
81
61
254228279341
286218229242265228
311222
Tie-upsBannersNetwork Ads
574564
660620
485
420452
480
390413
302
705

64million yen
174million yen
Q3 Q4
FY2013
Focus on Smartphone ads
25
Gain customers other than Food and Beverage
Q1 Q2
Sales of smartphone ads
■ Smartphone contributed to Ad revenue from second half year

Future Strategy

By Apr. 2017
Ordinary income 10billion yen

Make cooking fun around the world

COOKPAD goes Global
“100 million users” is the next target in fast-paced.29
6 million users
1million users
40 million users
0.5million users

Reach to one billion people
English 330
Spanish 400
Indonesian 140
Japanese 120
1billionSource: http://www.ethnologue.com/
Population by mother tongue(millions)
Total
(English version)
30

Major recipe services around the world
31
Country Recipe service No. of unique users Summary
Japan 44million Founded in 1997, “user generated” service. Listed on Tokyo Stock Exchange in Jul. 2009
U.S. Allrecipes.com 30million Founded in 1997, “user generated” services. Meredith acquired in 2012 for $175 million.
Germany Chefkoch.de 15million Founded in 1998, “user generated” services. Gruner+Jahr acquired in 2007.
France marmiton.org 8.4million Founded in 1998, “user generated” services. aufeminin.com acquired in 2006.
U.K. Bbcgoodfood.com 8.0million BBC publish recipes which are introduced on TV programs on their own site.
Spain 6.0million Founded in 2006, “user generated” services. From 2014, one of COOKPAD group companies.
Italia Giallozafferano.it 4.3million Founded in 2006, “user generated” services. Banzai Media acquired in 2009.
※1
※2
※1 From No.1 recipe services by country on SimilarWeb(http://www.similarweb.com/)※2 Reference to each web-sites
No.1 recipe services in Japan, U.S., and Europe

Next challenge

“Infrastructure” for all food-related things
33
“Infrastructure” for all food-related things
Shopping
Healthcare
Education/Entertainment
Household budget
Beauty
More than 1.7 million recipes
Over 40 million users
Everyday Cooking
“Infrastructure”

Enhance users’ Eating and Living Habits
34
“COOKPAD News”~Over 1,000 news~
“Cooking BBS”~1.6 million users in Apr. 2014~
■ Invest on owned media to increase the reach

Supermarket Special Offers
35
.5
1.0
1.5
2.0
2.5
May Jun Jul Aug Sep Oct Nov Dec Jan Feb Mar Apr
Registered users
Apr. 2014
Over 2million
FY2013
■ Deliver special offers from your nearby supermarkets
(million)
Number of registered supermarkets
36
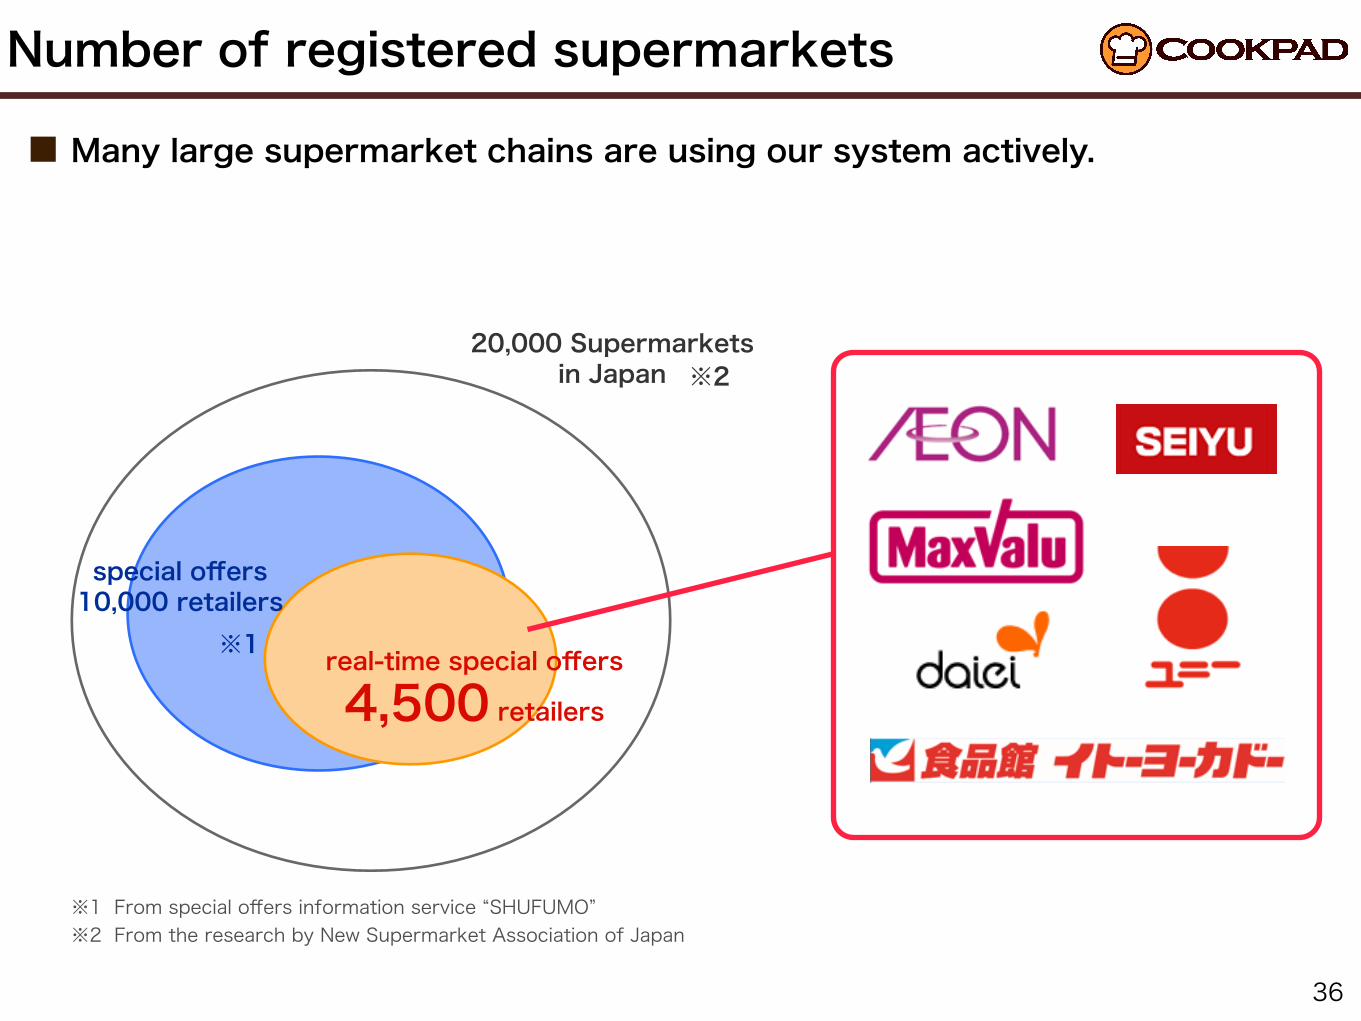
■ Many large supermarket chains are using our system actively.
※2
※1
20,000 Supermarkets in Japan
special offers10,000 retailers
real-time special offers
4,500 retailers
※1 From special offers information service “SHUFUMO”※2 From the research by New Supermarket Association of Japan

Promotion using special offers and recipes
37(“Shukan Toyo Keizai”26 Apr, 2014)(Leaflet with special offers and recipes)

“Healthy recipes”
38
■ Supporting prevention of adult diseases by healthy recipes and the meal planning
■ Over 3,000 recipes edited by managerial dietician
■ “Meal planning tool” to support healthier eating
(Meal planning tool)

“COOKPAD cooking school”
39
■ COOKPAD branded cooking school by the certified teachers
■ Various lessons by the different types of cuisines and teachers

FY2014 Forecast
40
■ Change the accounting period from April to December
■ Both sales and operating income will increase y/y (compared to 8 months from 1 May, 2013 to 31 Dec, 2013)
■ Consolidated dividend ratio 20%

Make everyday cooking fun

- This document includes some forecasts, which are based on currently available information. It may contain an element of uncertainty. Actual performance data and similar information may differ due to diverse factors.
- We appreciate your understanding. When producing this document, we were careful not to include errors or omissions, but the authenticity and integrity of the information are not guaranteed.