Embed Size (px)
Citation preview

Cool Off With Premium Video Content:How Viewers are Beating The Heat
During Summer Months

Contents
Summer Video Viewing 4
Reach 5-7
Days tuned-in 8
Summer Streaming 9-11
Summer Binging 12
Time spent by month 13
Put levels by month 14
Viewership by day 15
Timeshifted TV viewing 16-17
Time spent by ethnicity by season 18
Summer’s Biggest Screen 19
Box Office Sales 20
Cinema Reach 21
Composition 22-23
Hot Summer Programming on Second Screen 24
Summer programming slate 26-28
TV content online 29-30

Overview
The summer television doldrums vanished when Ad-Supported TV turned up the
heat on originals in the warm-weather months. Summer is now filled with a wealth
of premium, original television content.
With over 23 hours of television watched a week, summer TV usage remains on par
with the rest of the year. Although streaming usage peaks in the summer, linear TV
remains viewers primary video source drawing over 10 million viewers a night.
An early look at Summer 2017 programming reveals a strong slate of original, buzz
worthy programs. As in past seasons, we expect all this hype to extend to the
second screen with Ad-Supported TV brands dominating top online genres.
Not only are viewers catching up with their favorite TV programs but they are
cooling off in their local movie theater. Movie attendance peaks in the summer as
everyone (especially Millennials) wants to see the next blockbuster on the big
screen.
Summer Video ViewingConsumption Trends

TV Delivers Over 280 Million Viewers in the Summer –
Far More Than Any Other Viewing Platform
88,452
92,816
108,061
117,010
165,502
175,762
203,319
263,836
286,783
Game Console
Multimedia Devices
DVD/Blue-Ray
Video on PC
Video Smartphone
Internet on PC
App/web Smartphone
Radio
TV
Total Day Reach (OOO) Among A2+: 3Q16
Source: Nielsen Comparable Metrics, 3Q16

95.995.6
93.393.8
97.3
98.7
96.8
95.6
94.294.6
97.5
99.0
P 2 - 11 P 12 - 17 P 18 - 24 P 25 - 34 P 35 - 49 P 50 - 99
Total Day Reach % Summer’16 v. Winter’17
Winter Summer
As Temperatures Rise, TV’s Reach Increases
Source: Nielsen Npower; reach%, 6/6-9/11/16 (Summer) & 1/2/17-4/2/17 (Winter)

91.3 92.0
87.4
90.3
95.6
97.9
92.7 93.6
89.8 90.9
95.8
98.2
P 2 - 11 P 12 - 17 P 18 - 24 P 25 - 34 P 35 - 49 P 50 - 99
Primetime Reach% Summer’16 v. Winter’17
Winter Summer
…Especially in Primetime
Source: Nielsen Npower; reach%, 6/6-9/11/16 (Summer) & 1/2/17-4/2/17 (Winter)

Viewers Tuned-In To TV More Often This Past Summer
Source: Nielsen Npower timeperiod; average days tuned;6/16-9/11/16 v YAG
54
45
38
55
65
75
56
48
43
57
67
79
P 2 - 11 P 12 - 17 P 18 - 24 P 25 - 34 P 35 - 49 P 50 - 99
Average Days Tuned In to TV During Summer’16 v. YAG
Summer'15 Summer'16

…and Part of TV’s Summertime Strength Can Be
Attributed to Streaming
61% have more shows/series on
their ‘Summer Streaming List’ than
previous summers
56% say they are MORE excited
about the shows/series they’re
streaming on vacation this summer
than previous summers
85% have some sort of ‘Summer
Streaming List’ with the
shows/series they want to watch
this summer
67% agree with statement “because
I’ve been streaming shows/series,
I’m reading fewer books than
previous summers”
Source: Miner & Co. Studio “Summer Streaming”

Summer Is a Popular Time For Viewers To Catch Up On
Broadcast & Cable Content Through Their SVOD Service
Source: SNL Kagan January 2017. U.S. Netflix subscribers – 1,283; U.S. Hulu subscribers – 421; U.S. Amazon Prime subscribers – 835.
Question: Which following types of video content do you most enjoy viewing from the service. Select only one. (millennials)
Network TV Shows
45%
Original TV Series
25%
Movies16%
No Specific Set / Other
14%
NETFLIX
Network TV Shows
22%
Original TV Series17%Movies
41%
No Specific Set / Other
20%
AMAZON
Network TV Shows
68%
Original TV Series12%
Movies10%
No Specific Set / Other
10%
HULU
“Online Video Content Enjoyed Most” By SVOD Service
*Netflix has approximately 70 series that they consider original programming, as well as more than 50 other titles that include films, documentaries,
specials and stand-up specials. Amazon has not been as aggressive in producing original content but it does have approximately 20 series.
Broadcast & Cable TV shows ‘are the
most enjoyed’ by SVOD watchers

As a Result, Some Networks are Changing The Way They Develop &
Release New Shows & Commercials to Adapt To New TV Viewing Habits
Turner added original, serialized shows
like The Alienist & Good Behavior
Source: fortune.com/3.11.16/How Network TV Figured Out Binge-Watching

Summer Binging Leads To Viewers Craving
Even More TV Content
87% are watching or plan to watch 3 or more episodes of
show/series in one viewing this summer.
Binge-viewers crave MORE TV content…
2X Frequent binge-viewers are MORE likely than infrequent binge-viewers
to let commercials play
43% Of frequent binge-viewers now watch MORE TV because of binge-viewing
4XFrequent binge-viewers are MORE likely than infrequent viewers to say they
will upgrade their cable/satellite/telco subscription in next few years
Source: Miner & Co. Studio “Binge Watching is our new favorite addiction”
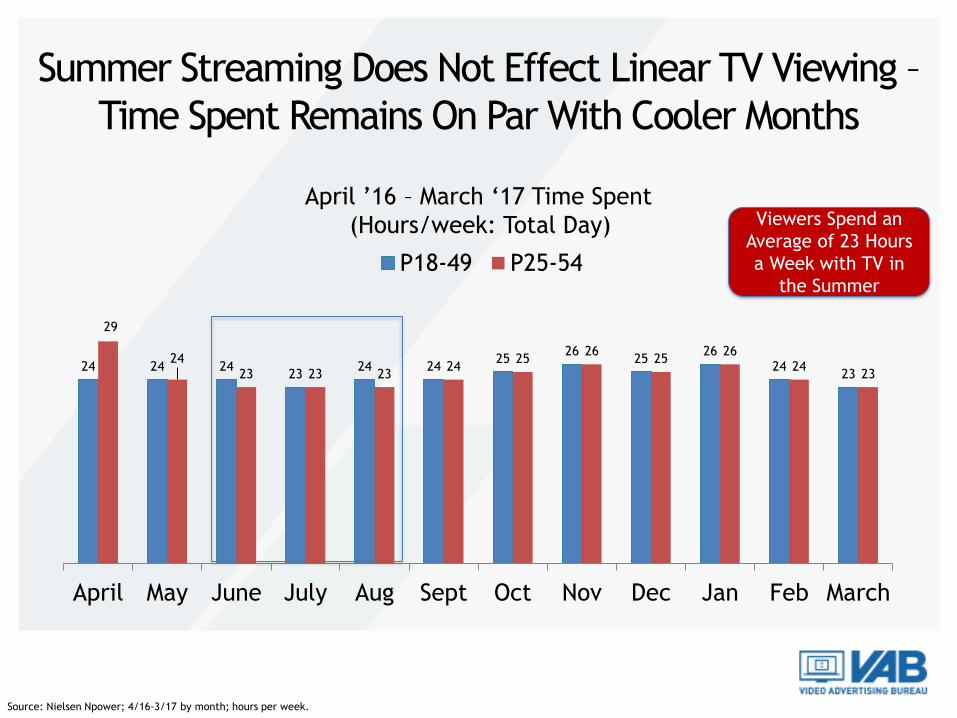
Summer Streaming Does Not Effect Linear TV Viewing –
Time Spent Remains On Par With Cooler Months
Source: Nielsen Npower; 4/16-3/17 by month; hours per week.
April ’16 – March ‘17 Time Spent
(Hours/week: Total Day)
24 24 2423
24 2425
2625
2624
23
29
24
23 23 2324
2526
2526
2423
April May June July Aug Sept Oct Nov Dec Jan Feb March
P18-49 P25-54
Viewers Spend an
Average of 23 Hours
a Week with TV in
the Summer

Summer Ratings Remain Strong – Especially
Among Young Adults
Source: Nielsen Npower; Put; 4/16-3/17 by month; total day.
April ’16 – March ‘17 Total Day Put Levels
0.0
2.0
4.0
6.0
8.0
10.0
12.0
14.0
16.0
18.0
20.0
April May June July Aug Sept Oct Nov Dec Jan Feb March
P18-49 P25-54 P18-24

Night After Night, TV Delivers Over 10 Million Viewers
Primetime Viewership (OOO) By Day
Key Days For Retail & Movie advertisers
Source: Nielsen Npower time period Live+7 data; ad-supported cable v. English broadcast= 11 nets impressions; 06/06/2016 - 09/11/2016 v. year ago.
Sun Mon Tues Wed Thurs Fri Sat
P18-49 18,278 20,111 18,976 18,628 16,904 14,707 15,590
P25-54 20,223 21,973 20,859 20,667 18,703 16,492 17,552

There is No Vacation For TV As The Vast Majority of
Viewers Are Watching Their Summer Programming Live
Source: Nielsen Npower; base=DVR HH; 05/31/2016 - 09/06/2016
% Live v. Timeshifted TV Viewing
(Summer’ 16)
82% 82% 84%
18% 18% 16%
P18-49 P25-54 P18-24
Total Day
Live Timeshifted
79% 79% 82%
21% 21% 18%
P18-49 P25-54 P18-24
Primetime
Live Timeshifted

With Slightly More ‘Live’ Viewing Occurring During the
Summer Season
Source: Nielsen Npower; base=DVR HHs; 05/31/2016 - 09/06/2016 v. 01/02/2017 - 04/02/2017
% Live v. Timeshifted TV Viewing: P18-49
(Summer’ 16 v. Winter ‘17)
77%
23%
79%
21%
Live Timeshifted
Primetime
Winter' 17 Summer'16

Summer’s Biggest Screen

Not Only Are Viewers Catching Up With Their
Favorite TV Programming, Blockbuster Movies
Are Driving Consumers To The Theaters
Box Office Sales
$4,058,023,698
$4,451,927,467
Summer 2014 Summer 2016
Source: Box Office Mojo

During the Summer Season Cinema’s Reach Increases
Cinema Unique Reach By DemoAugust 2016 v. February 2016
Source: Nielsen Media Impact, 2/16 vs. 8/16 for cinema unique reach.
A18-34 A18-49 A25-54
Feb’16 24,670 39,325 32,788
Aug’16 26,065 42,152 36,547
YoY % Change +6% +7% +11%

P 2 - 119%
P 12 - 175%
P 18-3450%
P 35-6436%
August 2016 Impressions
During Summer’s Peak Month, Cinema Delivers over 128
Million P2+ Impressions – Of Which 50% Are Millennials
Source: Nielsen Cinema Audience Report, August 2016; out of base of P2-64

…and Millennials Watch a Wide Variety of Movies: Accounting For Nearly Two-
Thirds of “R”, Almost Half of “PG-13” Rated Audience and Over One-Third of “PG”
3.5%
5.8%
48.1%
37.5%
PG-13
P2-11 P12-17
P18-34 P35-64
24.2%
5.3%
36.0%
29.6%
PG
P2-11 P12-17
P18-34 P35-64
4.7%2.7%
59.8%
31.5%
R
P2-11 P12-17
P18-34 P35-64
Source: Nielsen Cinema Audience Report, August 2016; out of base of P2-64
Cinema Audience Comp By Rating

Hot Summer Programming on the Second Screen

A Wealth of Quality, Premium TV Content Is Driving
Viewing Throughout the Year – Including Summer
Source: Miner & Co. Studio “Summer of Peak TV: The Viewers Perspective; Online survey fielded July 1st- July 6th, 2016 among 801 TV viewers
between ages of 18-59.
76% Believe There Are More
Good TV Series Now Than There
Were Before Streaming
86% say Broadcast Networks are “very” or
“somewhat reliable” as sources for finding great
TV shows
87% say Cable Networks are “very” or
“somewhat reliable” as sources for finding great
TV shows
86% say Streaming Services are “very” or
“somewhat reliable” as sources for finding great
TV shows
TV has Made Summer More
Enjoyable…Most Stating “I’m bored
less often” and “my friends and I
always have TV shows to talk
about”

Source:https://editorial.rottentomatoes.com/article/2017-spring-summer-tv-premiere-dates/
Preview of Summer ‘17 Schedule
As of 4/21/17…More to be Announced
Although Official Summer Programming Slates Have
Yet To Be Released, 2017 Summer Is Looking Strong

…and New Summer Programs Are Generating A Lot of Buzz
Source:https://editorial.rottentomatoes.com/article/2017-spring-summer-tv-premiere-dates/

The Breadth of Ad-Supported TV Content is Unprecedented
Cable and Broadcast: Summer 2017
SVOD:
Summer 2017
Source:https://editorial.rottentomatoes.com/article/2017-spring-summer-tv-premiere-dates/
Ad-Supported TV
Content Exceeds
SVOD’s by Far

P2+
Not Wanting to Miss Out On Quality Programming, Viewing
on Mobile Devices Increases During the Summer
Source: VAB analysis of comScore total unduplicated data (mediametrix, multiplatform). Ad-Supported Television Brands represents all measured Ad-Supported Cable nets, MVPDs and
Broadcast Television FOX, CBS, NBC, ABC, iON and CW. Mobile platform= internet on computer, tablet, smartphone.
1,721,533
min
Time Spent With ‘Ad-Supported TV’ On Computer/Mobile Platforms ( Total Minutes)( June ’16 v. Feb’ 16)
P18-49
1,749,217
min
Feb’16 June ’16
1,005,573
min
1,151,033
min
+27,684
min
Absolute Diff
+145,460
min
Absolute Diff

Sports
NBCSN
ESPN
Bleacher Report
CBS Sports
Resignation Media
Cracked
Ebaums World
Comedy Central
NBCU
Xfinity
CBS
A&E
GSN
ABC News
CNN
CBS News
Buzzfeed
FOX News
Hearst
HGTV
Houzz
Hobby Lobby
Internet Brands Home
& Garden
The Weather Channel
Accuweather
Weatherbug
Yahoo Weather
Pelmorex Media Inc.
Weather
GSN
NBCU
ABC
CBS
Xfinity
Bon Appetit
AllRecipes
Food Network
MSN Food & Drink
BlogHer Food
Disney Entertainment
Roblox.com
PBS Kids
Nickelodeon
Sports Comedy TV Entertainment - Black General News
Home Weather TV Entertainment KidsFood
Political News
CNN Politics
Politico
Top 5 Rank by Internet Genre: August 2016
A18-49
MLB
Cartoon Network
Electus Digital
MSNBC
FOX News Politics
Voice of America
SOURCE: VAB ANALYSIS OF MULTI-PLATFORM COMSCORE DATA, AUGUST 2016 (RANKING BASED ON
“TOTAL MINUTES VIEWED”)SOURCE: VAB ANALYSIS OF MULTI-PLATFORM COMSCORE DATA, AUGUST 2016 (RANKING BASED ON “TOTAL MINUTES VIEWED”)
In Fact, TV Brands Dominate The Top Online Genres in the Summer