Embed Size (px)
Citation preview
1
Cool roof technology in London: an experimental and modelling
study
M. Kolokotronia , B.L. Gowreesunker
a , R. Giridharan
b
aHowell Building, Mechanical Engineering, School of Engineering and Design, Brunel University,
Uxbridge, Middlesex, UB8 3PH, UK
bCivil and Building Engineering, Loughborough University, Leicester, LE11 3TU, UK
ABSTRACT
One of the primary reasons for the application of cool materials is their energy and associated
environmental impact on the built environment. Cool materials are usually applied on the
roof of buildings to reduce cooling energy demand. The relative benefits of this reduction
depend on the construction of the building, external weather conditions and use of the
building. This paper examines the impact from the application of a reflective paint on a flat
roof in a naturally ventilated office building in the area of London, UK where the climate is
moderate with high heating demand by buildings. The environmental conditions
(internal/external air and surface temperatures) of the building were monitored before and
after the application of the cool roof during the summer. It was found that internal
temperatures were reduced after the application of the cool roof. The building was modelled
using TRNSYS and the model was calibrated successfully using the measurements. A
parametric analysis was carried out by varying the reflectivity and insulation of the roof and
ventilation rate; the heating and cooling demand for a year was calculated using the Summer
Design Year for London as the weather file. It was found that cooling demand is
significantly reduced, heating demand is increased and the total energy savings vary between
1 and 8.5% relative to an albedo of 0.1 for the same conditions. In free floating (naturally
ventilated) buildings summer comfort is improved but there is a penalty of increased heating
energy during the winter. Thermal comfort can be improved by an average of 2.5 oC
(operative temperature difference for a change of 0.5 in albedo) but heating demand could be
increased by 10% for a ventilation rate of 2 air changes per hour. The results indicate that in
the case of temperate climates the type, operation and thermal characteristics of the building
should be considered carefully to determine potential benefits of the application of cool roof
technology. For the examined case-study, it was found that a roof reflecticity of 0.6-0.7 is the
2
optimum value to achieve energy savings in a cooled office, improve summer internal
thermal conditions in a non-cooled office (albeit with some heating energy penalty). It
indicates that it is a suitable strategy for refurbishment of existing offices to improve energy
efficiency or internal environmental conditions in the summer and should be considered in
the design of new offices together with other passive energy efficient strategies.
1. INTRODUCTION
Rejection of solar gains is the aim of passive cooling strategies in any type of building and
any climatic region. This needs to be balanced with admission of solar heat gains which is
beneficial for all building types and climatic conditions; the extent of usefulness is dependent
on severity of external conditions and internal heat gains.
Cool materials work by reflecting solar radiation and therefore rejecting solar heat gains at
the opaque external surfaces of the building. Heat transfer to the internal space by
conduction is therefore reduced; the magnitude of the reduction will be determined by:
The magnitude of solar radiation
The different of air and surface temperature between outside and inside of the
building
The construction of the opaque building element, namely its resistance to heat
transfer.
A number of experimental and computational studies have been carried out to demonstrate
the energy benefits of cool roofs in reducing energy demand in buildings in cooling
dominated climates. A number of papers have been published for residential buildings [1, 2,
3, 4, 5, 6], retail stores [7], and other commercial buildings [8,9]. Work has also been carried
out outside the US. A modelling study [10] has shown the benefits in retail store at different
climates. Cool Roofs have also been studied in experimental facilities; [11, 12].
Experimental and computational studies are less numerous for buildings located in climates
with moderate cooling demand because in many cases the heating penalties can out-weight
cooling benefits. However, there are net energy benefits to be obtained; in particular cool

3
roofs can improve internal thermal comfort in buildings without air-conditioning. Therefore,
they could be considered despite heating energy penalties as they can help avoidance of air-
conditioning installation.
Akbari and Konopacki [13] have presented an excellent summary of results to 2004 in the
US for both hot and cold regions. Computational studies were carried out to estimate the net
direct energy savings (cooling-energy savings minus heat-energy penalties) from reflective
roofs on residential and commercial buildings in 11 US metropolitan statistical areas (MSAs).
Metropolitan-wide savings were as much as $37 M for Phoenix and $35 M in Los Angeles
and as low as $3 M in the heating-dominated climate of Philadelphia.
The same paper [13] presented results for Toronto, Canada. It showed that by increasing the
albedo of houses by 0.2 (from moderate-dark to medium-light colour), the cooling-energy
use can be reduced by about 30–40%. However, they also found that reflective roofs and
shade trees reduce summer cooling-energy use and also potentially increase winter heating-
energy use.
A numerical study performed by Shariah et al [14] for the moderate climate of Amman and
the hot climate of Aqaba, in Jordan, showed that by increasing the external reflectance of the
roof from 0 to 1, the energy load reduces by 32% for a non-insulated building and 26% for an
insulated building in Amann. Higher energy savings are obtained for Aqaba. Synnefa et al [1]
numerically found for various climatic conditions around the world that by increasing the
roof albedo by 0.65, cooling reductions of 9-48 kWh/m2 were obtained, with heating
penalties in the range of 0.2-17 kWh/m2. Furthermore, they concluded that the two most
influential factors for the performance of roof reflective coatings are the U-value of the roof
and the climatic conditions. Akbari et al [8] conducted experimental and numerical studies
for 16 Californian climate zones, and reported energy savings of about 4.5-7.4 kWh/m2 of
conditioned roof area per year. They also differentiated between the investigated buildings,
signifying the importance of building operation on the performance of roof reflective
coatings.
There is recent interest in the UK's moderate climate on the benefits of Cool Roofs and an
Information Paper was published recently on this [15] arguing that net savings are also
4
obtainable in the UK climatic conditions, with the benefits decreasing with enhanced
insulation, lower operating temperatures or increase in internal gains.
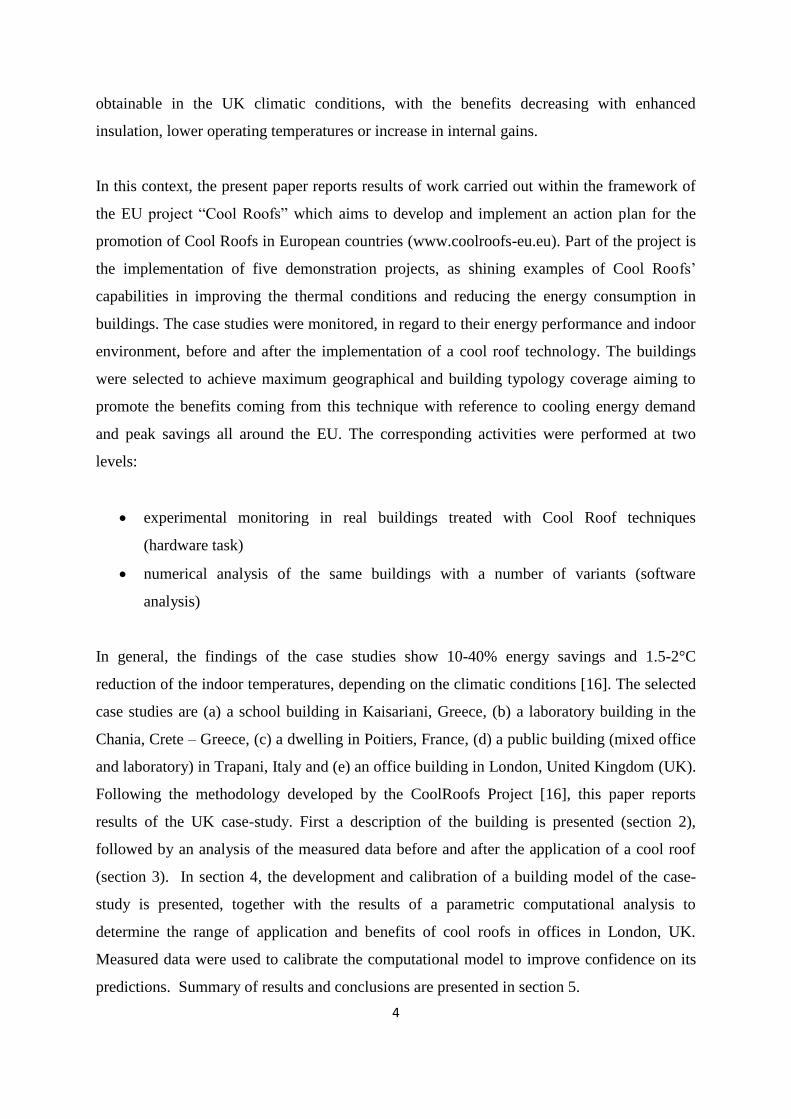
In this context, the present paper reports results of work carried out within the framework of
the EU project “Cool Roofs” which aims to develop and implement an action plan for the
promotion of Cool Roofs in European countries (www.coolroofs-eu.eu). Part of the project is
the implementation of five demonstration projects, as shining examples of Cool Roofs’
capabilities in improving the thermal conditions and reducing the energy consumption in
buildings. The case studies were monitored, in regard to their energy performance and indoor
environment, before and after the implementation of a cool roof technology. The buildings
were selected to achieve maximum geographical and building typology coverage aiming to
promote the benefits coming from this technique with reference to cooling energy demand
and peak savings all around the EU. The corresponding activities were performed at two
levels:
experimental monitoring in real buildings treated with Cool Roof techniques
(hardware task)
numerical analysis of the same buildings with a number of variants (software
analysis)
In general, the findings of the case studies show 10-40% energy savings and 1.5-2°C
reduction of the indoor temperatures, depending on the climatic conditions [16]. The selected
case studies are (a) a school building in Kaisariani, Greece, (b) a laboratory building in the
Chania, Crete – Greece, (c) a dwelling in Poitiers, France, (d) a public building (mixed office
and laboratory) in Trapani, Italy and (e) an office building in London, United Kingdom (UK).
Following the methodology developed by the CoolRoofs Project [16], this paper reports
results of the UK case-study. First a description of the building is presented (section 2),
followed by an analysis of the measured data before and after the application of a cool roof
(section 3). In section 4, the development and calibration of a building model of the case-
study is presented, together with the results of a parametric computational analysis to
determine the range of application and benefits of cool roofs in offices in London, UK.
Measured data were used to calibrate the computational model to improve confidence on its
predictions. Summary of results and conclusions are presented in section 5.
5
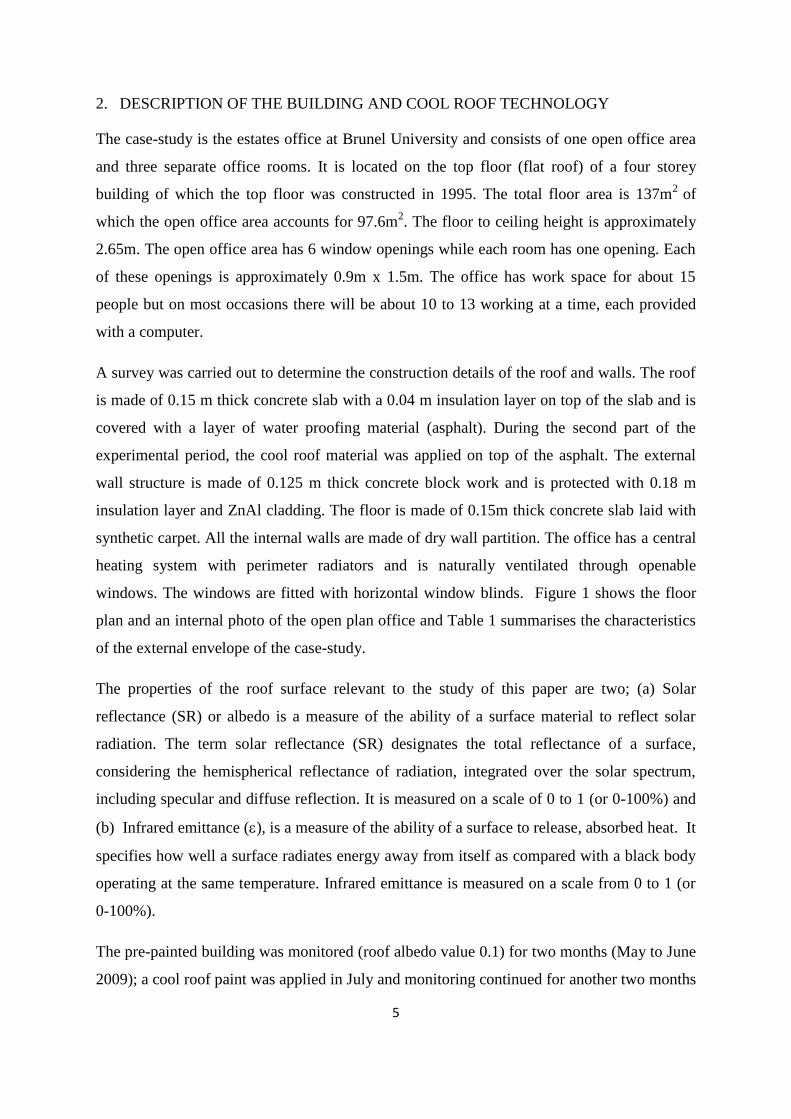
2. DESCRIPTION OF THE BUILDING AND COOL ROOF TECHNOLOGY
The case-study is the estates office at Brunel University and consists of one open office area
and three separate office rooms. It is located on the top floor (flat roof) of a four storey
building of which the top floor was constructed in 1995. The total floor area is 137m2
of
which the open office area accounts for 97.6m2. The floor to ceiling height is approximately
2.65m. The open office area has 6 window openings while each room has one opening. Each
of these openings is approximately 0.9m x 1.5m. The office has work space for about 15
people but on most occasions there will be about 10 to 13 working at a time, each provided
with a computer.
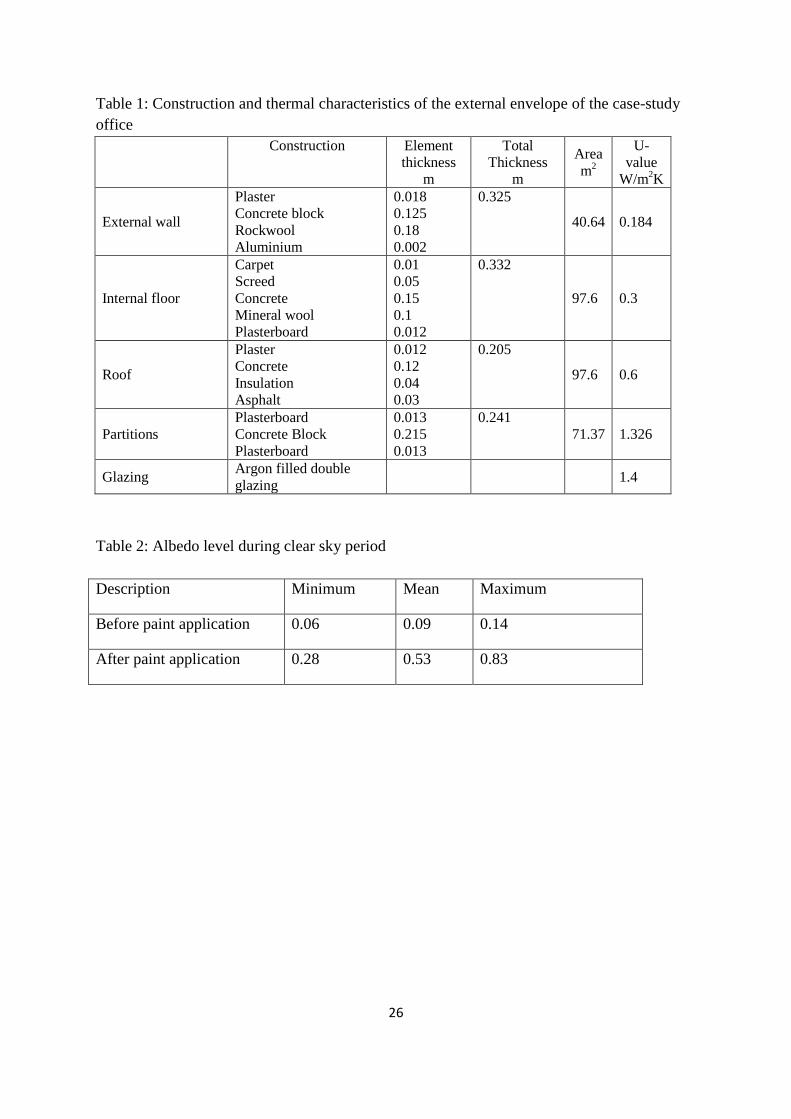
A survey was carried out to determine the construction details of the roof and walls. The roof
is made of 0.15 m thick concrete slab with a 0.04 m insulation layer on top of the slab and is
covered with a layer of water proofing material (asphalt). During the second part of the
experimental period, the cool roof material was applied on top of the asphalt. The external
wall structure is made of 0.125 m thick concrete block work and is protected with 0.18 m
insulation layer and ZnAl cladding. The floor is made of 0.15m thick concrete slab laid with
synthetic carpet. All the internal walls are made of dry wall partition. The office has a central
heating system with perimeter radiators and is naturally ventilated through openable
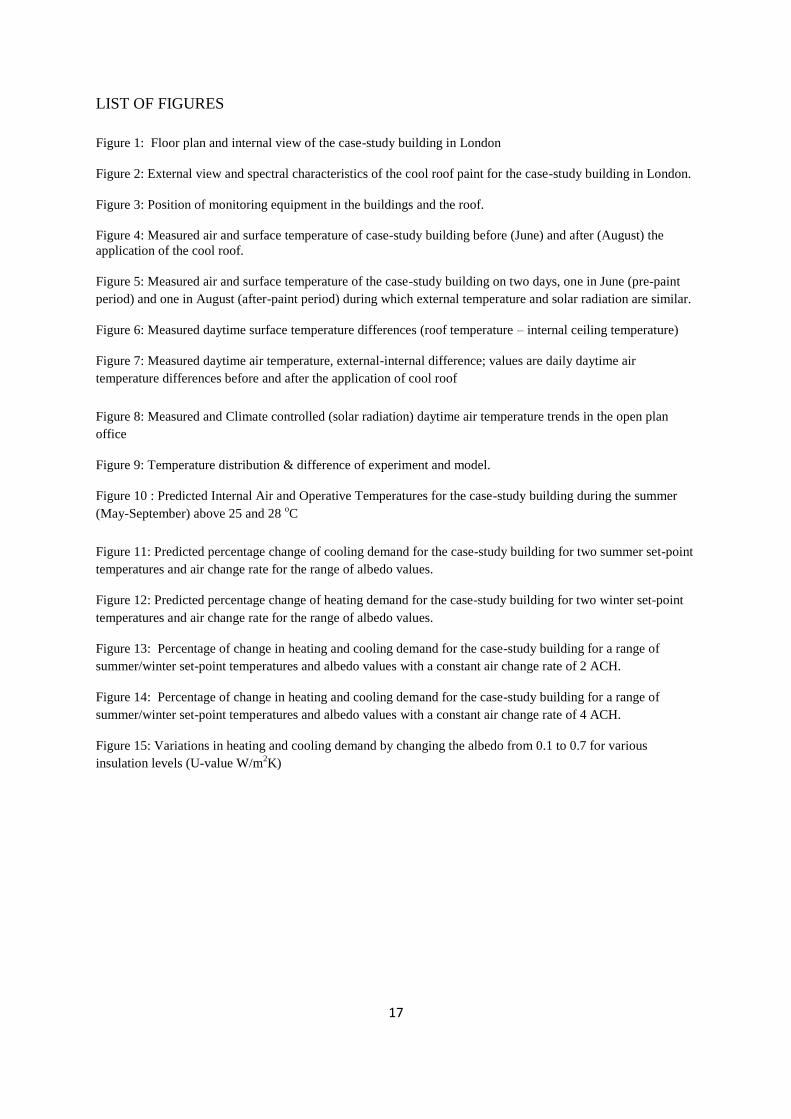
windows. The windows are fitted with horizontal window blinds. Figure 1 shows the floor
plan and an internal photo of the open plan office and Table 1 summarises the characteristics
of the external envelope of the case-study.
The properties of the roof surface relevant to the study of this paper are two; (a) Solar
reflectance (SR) or albedo is a measure of the ability of a surface material to reflect solar
radiation. The term solar reflectance (SR) designates the total reflectance of a surface,
considering the hemispherical reflectance of radiation, integrated over the solar spectrum,
including specular and diffuse reflection. It is measured on a scale of 0 to 1 (or 0-100%) and
(b) Infrared emittance (), is a measure of the ability of a surface to release, absorbed heat. It
specifies how well a surface radiates energy away from itself as compared with a black body
operating at the same temperature. Infrared emittance is measured on a scale from 0 to 1 (or
0-100%).
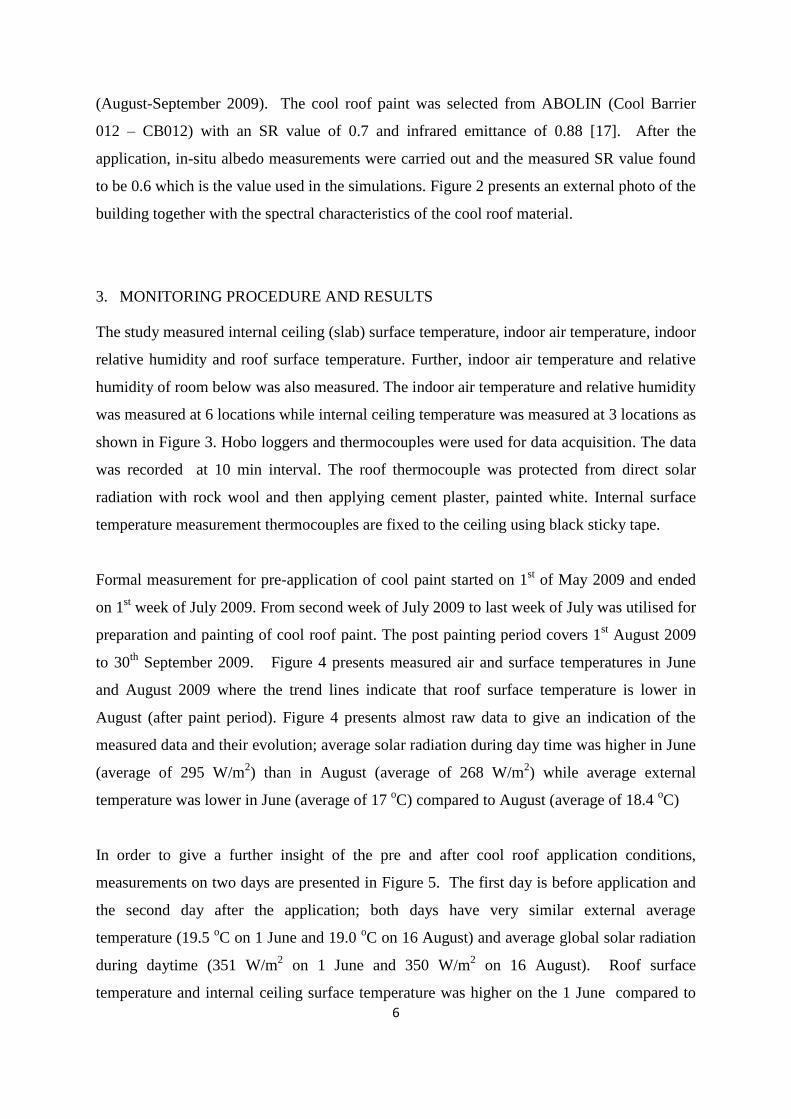
The pre-painted building was monitored (roof albedo value 0.1) for two months (May to June
2009); a cool roof paint was applied in July and monitoring continued for another two months
6
(August-September 2009). The cool roof paint was selected from ABOLIN (Cool Barrier
012 – CB012) with an SR value of 0.7 and infrared emittance of 0.88 [17]. After the
application, in-situ albedo measurements were carried out and the measured SR value found
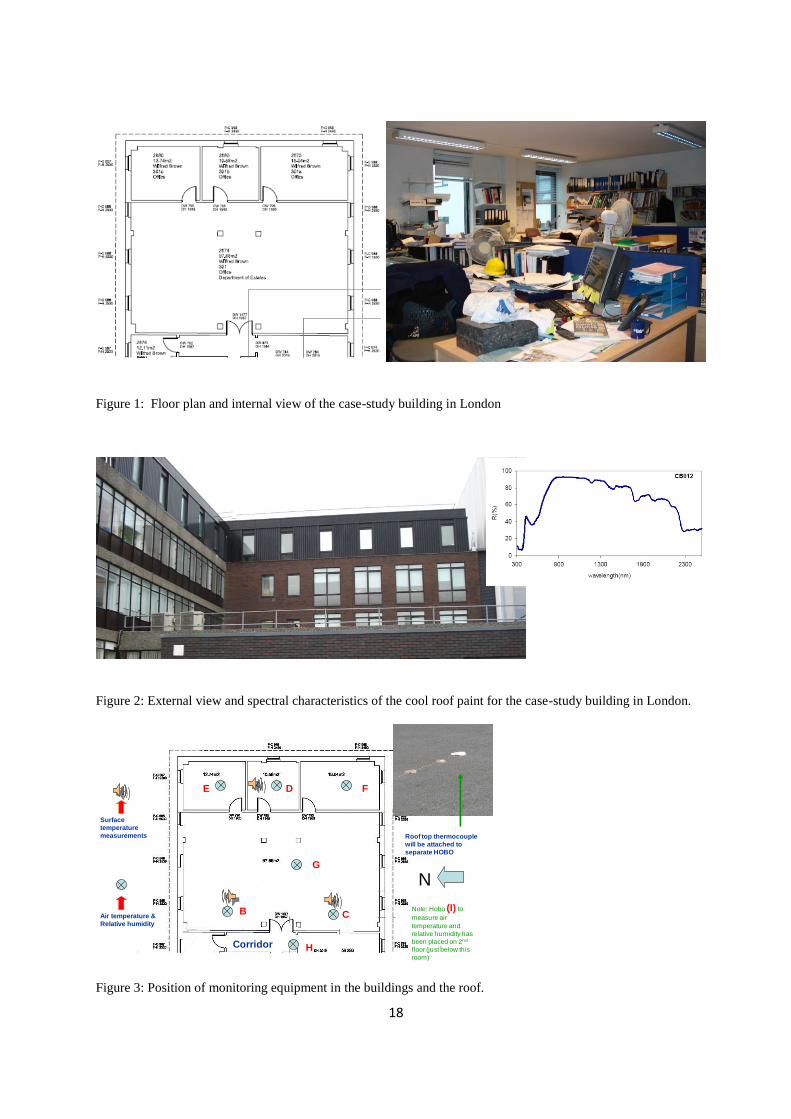
to be 0.6 which is the value used in the simulations. Figure 2 presents an external photo of the
building together with the spectral characteristics of the cool roof material.
3. MONITORING PROCEDURE AND RESULTS
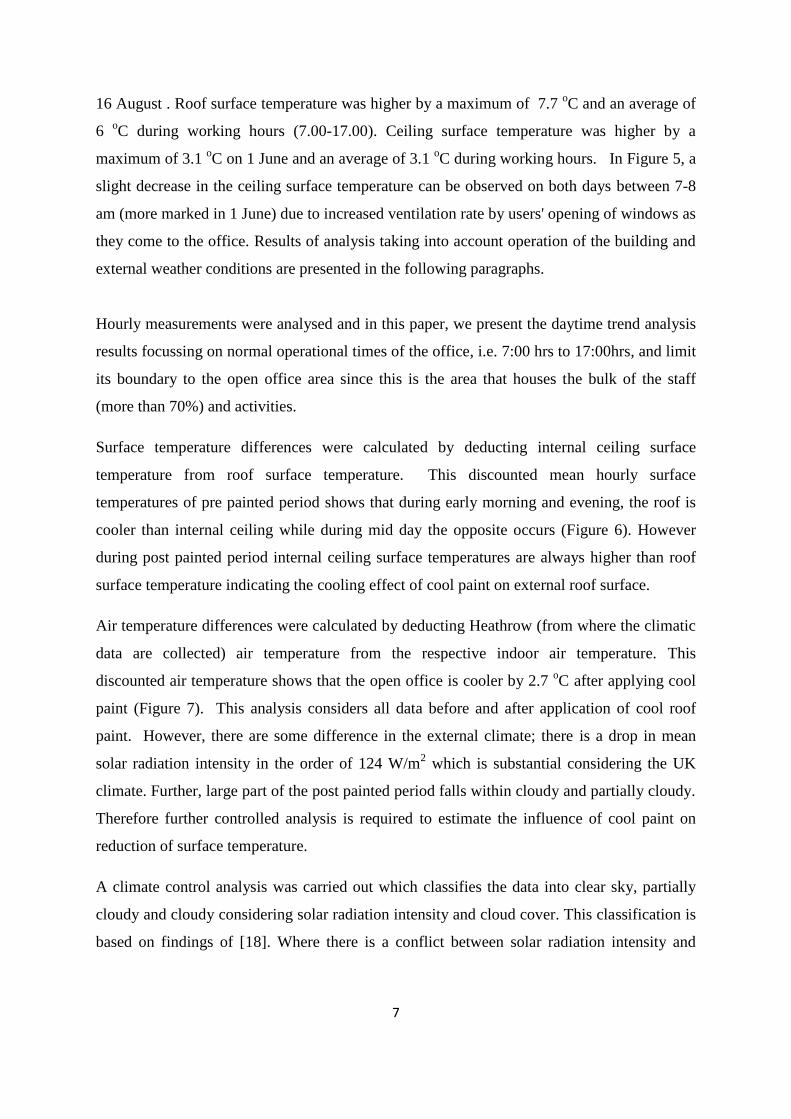
The study measured internal ceiling (slab) surface temperature, indoor air temperature, indoor
relative humidity and roof surface temperature. Further, indoor air temperature and relative
humidity of room below was also measured. The indoor air temperature and relative humidity
was measured at 6 locations while internal ceiling temperature was measured at 3 locations as
shown in Figure 3. Hobo loggers and thermocouples were used for data acquisition. The data
was recorded at 10 min interval. The roof thermocouple was protected from direct solar
radiation with rock wool and then applying cement plaster, painted white. Internal surface
temperature measurement thermocouples are fixed to the ceiling using black sticky tape.
Formal measurement for pre-application of cool paint started on 1st of May 2009 and ended
on 1st week of July 2009. From second week of July 2009 to last week of July was utilised for
preparation and painting of cool roof paint. The post painting period covers 1st August 2009
to 30th
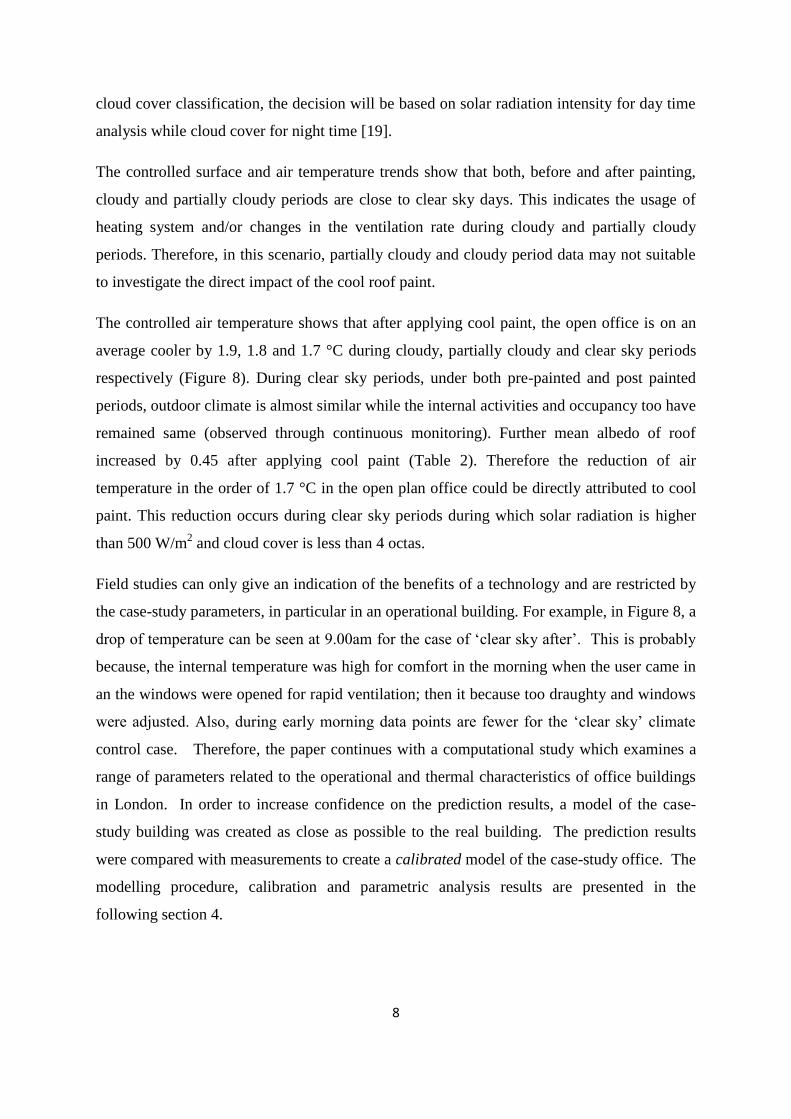
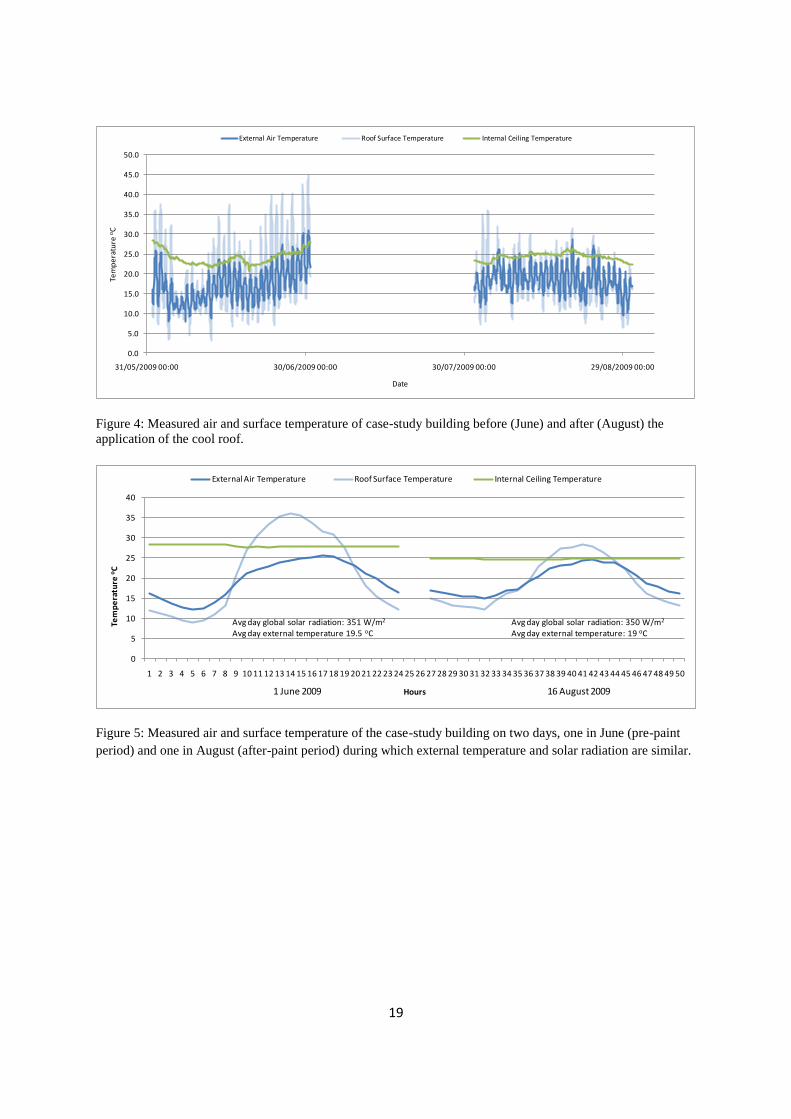
September 2009. Figure 4 presents measured air and surface temperatures in June
and August 2009 where the trend lines indicate that roof surface temperature is lower in
August (after paint period). Figure 4 presents almost raw data to give an indication of the
measured data and their evolution; average solar radiation during day time was higher in June
(average of 295 W/m2) than in August (average of 268 W/m
2) while average external
temperature was lower in June (average of 17 oC) compared to August (average of 18.4
oC)
In order to give a further insight of the pre and after cool roof application conditions,
measurements on two days are presented in Figure 5. The first day is before application and
the second day after the application; both days have very similar external average
temperature (19.5 oC on 1 June and 19.0
oC on 16 August) and average global solar radiation
during daytime (351 W/m2 on 1 June and 350 W/m
2 on 16 August). Roof surface
temperature and internal ceiling surface temperature was higher on the 1 June compared to
7
16 August . Roof surface temperature was higher by a maximum of 7.7 oC and an average of
6 oC during working hours (7.00-17.00). Ceiling surface temperature was higher by a
maximum of 3.1 oC on 1 June and an average of 3.1
oC during working hours. In Figure 5, a
slight decrease in the ceiling surface temperature can be observed on both days between 7-8
am (more marked in 1 June) due to increased ventilation rate by users' opening of windows as
they come to the office. Results of analysis taking into account operation of the building and
external weather conditions are presented in the following paragraphs.
Hourly measurements were analysed and in this paper, we present the daytime trend analysis
results focussing on normal operational times of the office, i.e. 7:00 hrs to 17:00hrs, and limit
its boundary to the open office area since this is the area that houses the bulk of the staff
(more than 70%) and activities.
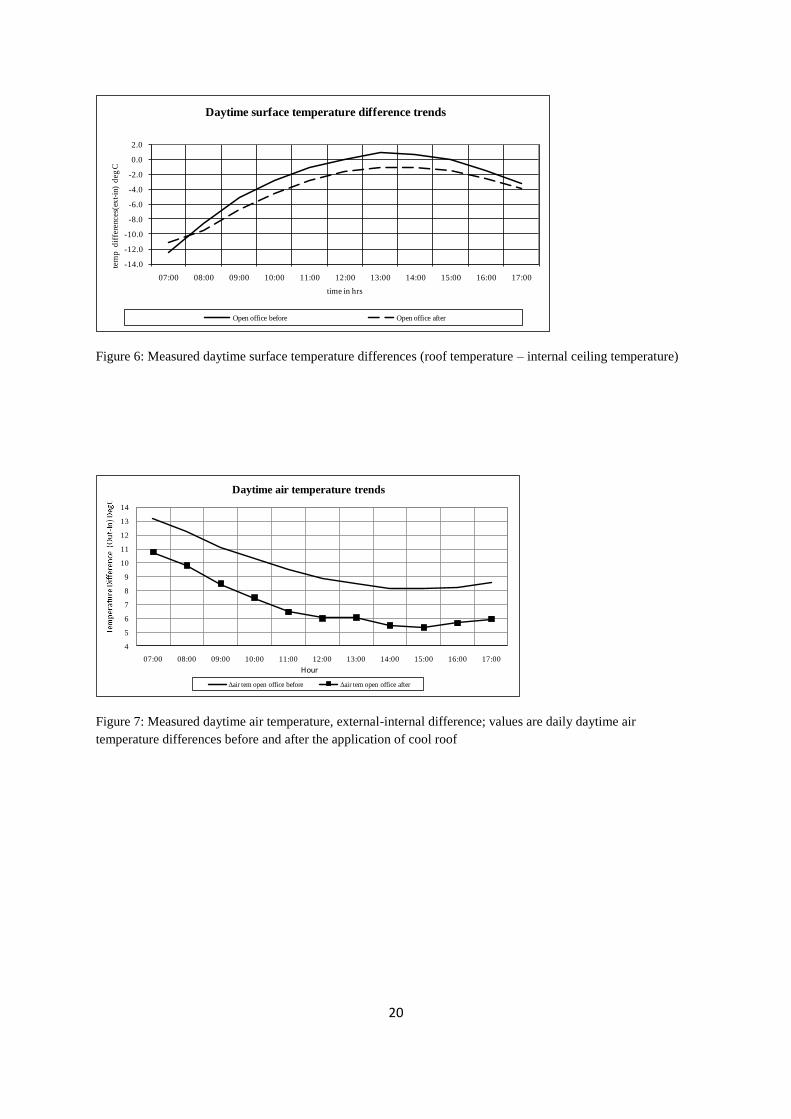
Surface temperature differences were calculated by deducting internal ceiling surface
temperature from roof surface temperature. This discounted mean hourly surface
temperatures of pre painted period shows that during early morning and evening, the roof is
cooler than internal ceiling while during mid day the opposite occurs (Figure 6). However
during post painted period internal ceiling surface temperatures are always higher than roof
surface temperature indicating the cooling effect of cool paint on external roof surface.
Air temperature differences were calculated by deducting Heathrow (from where the climatic
data are collected) air temperature from the respective indoor air temperature. This
discounted air temperature shows that the open office is cooler by 2.7 oC after applying cool
paint (Figure 7). This analysis considers all data before and after application of cool roof
paint. However, there are some difference in the external climate; there is a drop in mean
solar radiation intensity in the order of 124 W/m2 which is substantial considering the UK
climate. Further, large part of the post painted period falls within cloudy and partially cloudy.
Therefore further controlled analysis is required to estimate the influence of cool paint on
reduction of surface temperature.
A climate control analysis was carried out which classifies the data into clear sky, partially
cloudy and cloudy considering solar radiation intensity and cloud cover. This classification is
based on findings of [18]. Where there is a conflict between solar radiation intensity and
8
cloud cover classification, the decision will be based on solar radiation intensity for day time
analysis while cloud cover for night time [19].
The controlled surface and air temperature trends show that both, before and after painting,
cloudy and partially cloudy periods are close to clear sky days. This indicates the usage of
heating system and/or changes in the ventilation rate during cloudy and partially cloudy
periods. Therefore, in this scenario, partially cloudy and cloudy period data may not suitable
to investigate the direct impact of the cool roof paint.
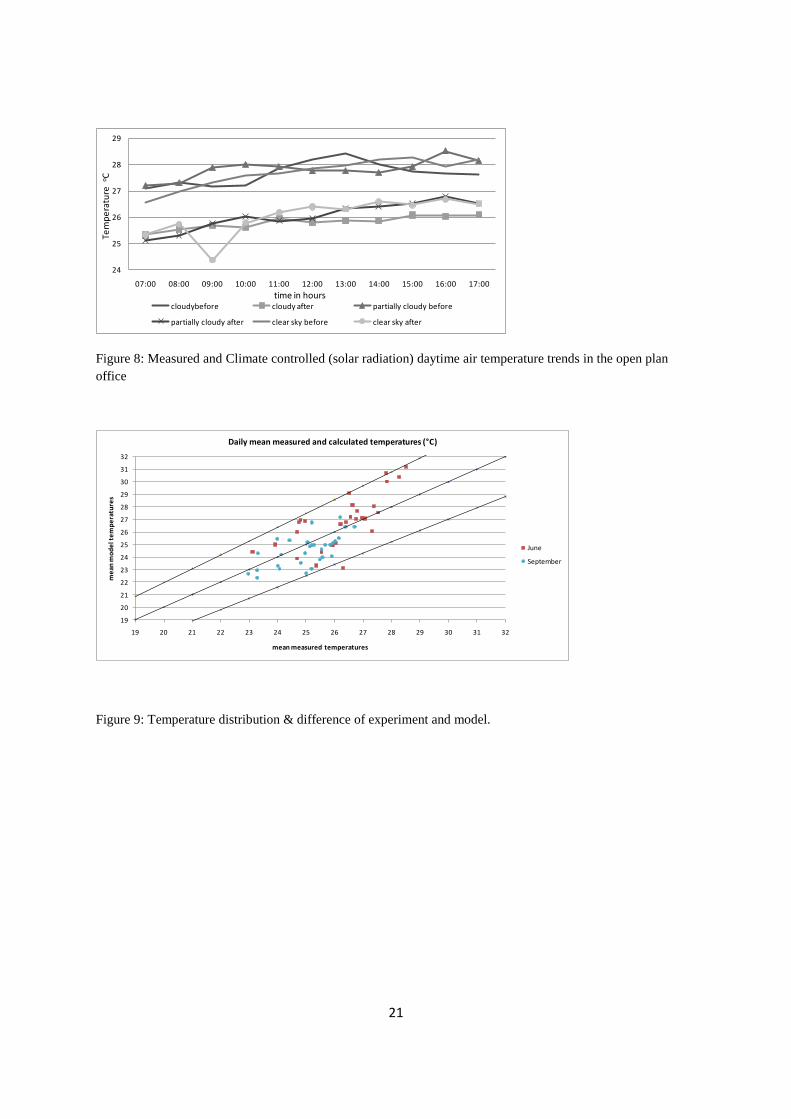
The controlled air temperature shows that after applying cool paint, the open office is on an
average cooler by 1.9, 1.8 and 1.7 °C during cloudy, partially cloudy and clear sky periods
respectively (Figure 8). During clear sky periods, under both pre-painted and post painted
periods, outdoor climate is almost similar while the internal activities and occupancy too have
remained same (observed through continuous monitoring). Further mean albedo of roof
increased by 0.45 after applying cool paint (Table 2). Therefore the reduction of air
temperature in the order of 1.7 °C in the open plan office could be directly attributed to cool
paint. This reduction occurs during clear sky periods during which solar radiation is higher
than 500 W/m2 and cloud cover is less than 4 octas.
Field studies can only give an indication of the benefits of a technology and are restricted by
the case-study parameters, in particular in an operational building. For example, in Figure 8, a
drop of temperature can be seen at 9.00am for the case of ‘clear sky after’. This is probably
because, the internal temperature was high for comfort in the morning when the user came in
an the windows were opened for rapid ventilation; then it because too draughty and windows
were adjusted. Also, during early morning data points are fewer for the ‘clear sky’ climate
control case. Therefore, the paper continues with a computational study which examines a
range of parameters related to the operational and thermal characteristics of office buildings
in London. In order to increase confidence on the prediction results, a model of the case-
study building was created as close as possible to the real building. The prediction results
were compared with measurements to create a calibrated model of the case-study office. The
modelling procedure, calibration and parametric analysis results are presented in the
following section 4.
9
4. MODELLING PROCEDURE, CALIBRATION AND RESULTS
Thermal modelling was carried out using TRNSYS [20]. Firstly, the model was built in terms
of construction, internal heat gains and ventilation/infiltration as close to the observed reality
as possible. The building is a naturally ventilated building controlled by the occupants;
therefore reasonable assumptions were made for ventilation and infiltration as well as internal
heat gains. These were verified with observations during the monitoring period. Weather
data for the simulation was sourced from Heathrow meteorological station which is in the
proximity of Brunel University.
The building was modelled as one zone (the open plan office). Simulations were run and
operational details of the model were changed until the minimum (or optimal) accepted error
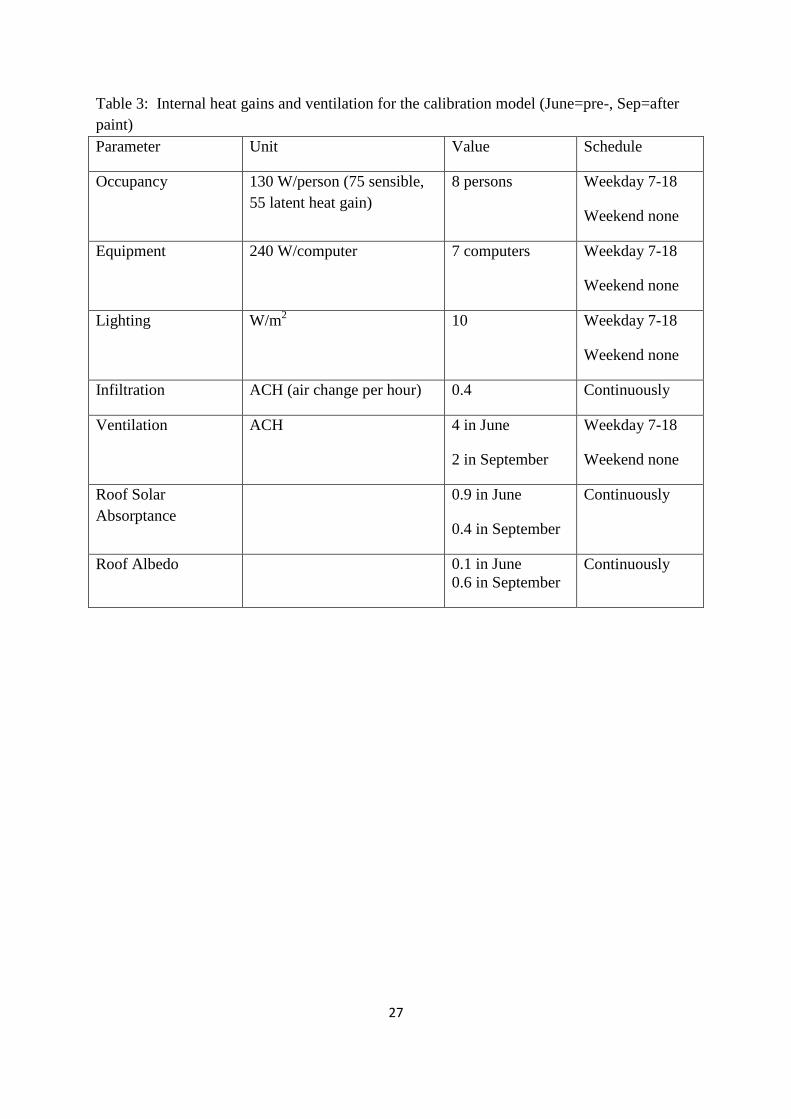
for a building of this nature was achieved. Calibration concentrated on two months, June and
September. June was the month before the application of the paints and thus the solar
absorptance of the roof was set to 0.9; September was the month after the application of the
paint and the solar absorptivity of the roof was set to 0.4. (consistent with the average value
from albedo measurements-Table 2). September was chosen for the calibration study
because ooperation of the office was nearer to normal as August is the traditional holiday
month in the UK; therefore occupancy and other internal heat gains linked to occupancy
patterns are more consistent in September and more comparable to June.
The operational and internal heat gains details as specified for the final calibration are as
shown in Table 3. The only difference of the June and September models are in the roof’s
solar absorptance and also the ventilation rate. External air temperature in June was higher
than September and this has led to variations in opening/closing windows which has affected
the ventilation rate; in addition driving forces for infiltration were lower and therefore this
had an impact on the infiltration rate.
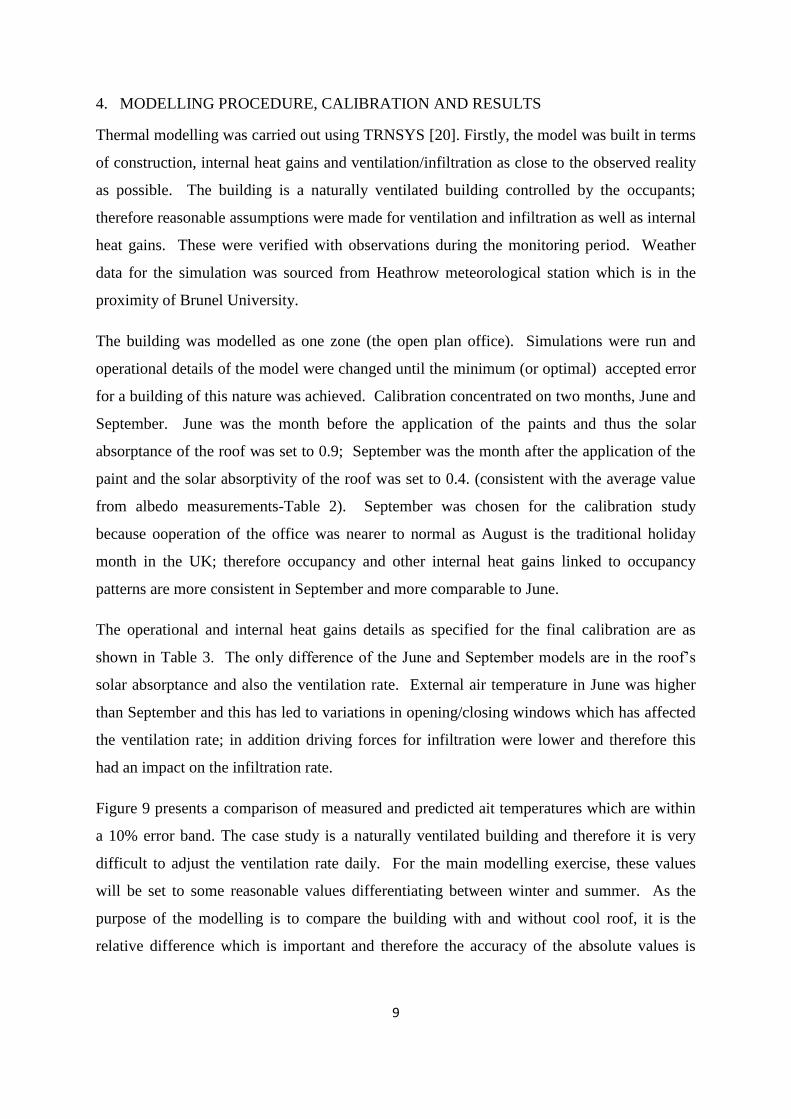
Figure 9 presents a comparison of measured and predicted ait temperatures which are within
a 10% error band. The case study is a naturally ventilated building and therefore it is very
difficult to adjust the ventilation rate daily. For the main modelling exercise, these values
will be set to some reasonable values differentiating between winter and summer. As the
purpose of the modelling is to compare the building with and without cool roof, it is the
relative difference which is important and therefore the accuracy of the absolute values is
10
secondary as long as sensible parameters are specified derived from the results of this
calibration.
After the calibration of the model was satisfactory, further simulations were carried out using
the DSY (Design Summer Year) Heathrow weather file for external conditions. For this
analysis, the June model was used for the comparison of modelling results. The difference of
the two models (without cool roof and with cool roof) is in the solar reflectance value of the
external layer of the roof construction. Absorbtivity is taken as 0.9 (albedo 0.1) for without
cool roof and 0.4 (albedo 0.6) for with cool roof, which implies a difference of 0.5 in the
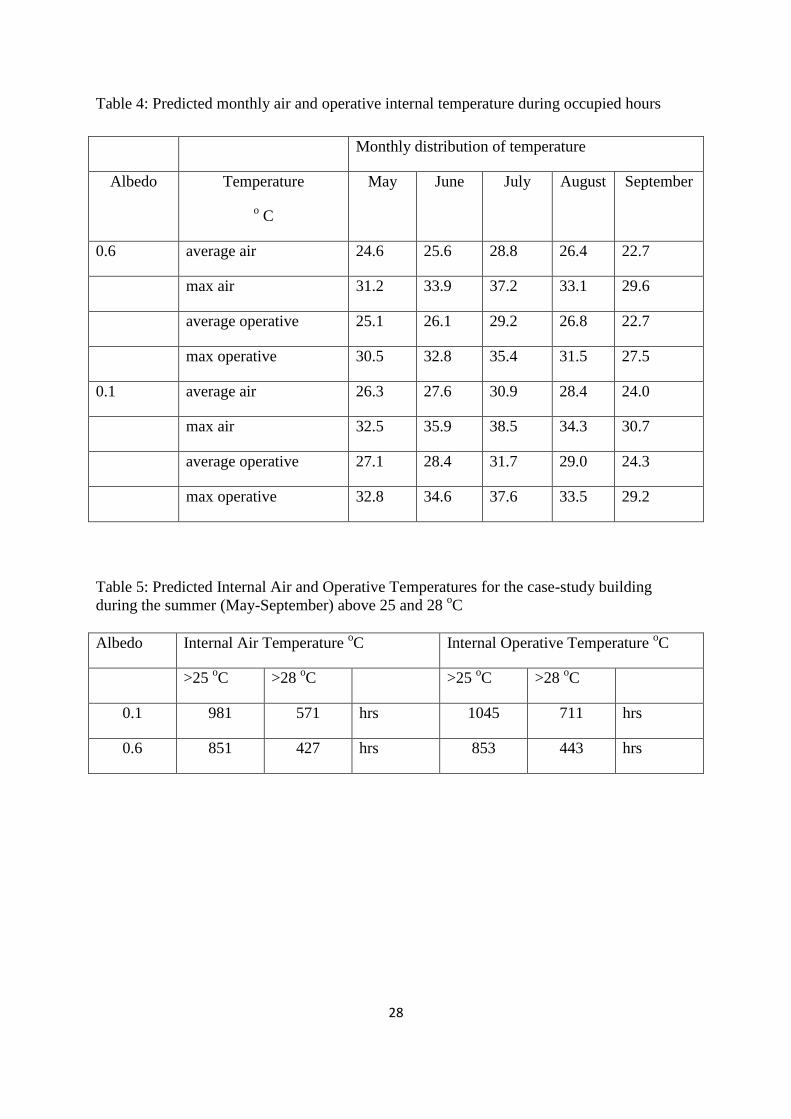
reflectivity value. Summer simulations were run (summer is taken as the five months of May
to September) and the air and operative temperature during working hours (7.00-18.00) are
shown in Table 4.
It can be seen that in all cases air temperature during the summer months is reduced by the
application of the cool roof. Taking the month of July as an example max internal air
temperature is reduced by 1.3 oC and average air temperature by 2.1
oC; this compares
favourably with monitoring results analysis which shows a drop in air temperature of about
1.7 oC (section 3). In terms of thermal comfort, max operative temperature is reduced by 2.2
oC and average operative temperature by 2.5
oC improving significantly thermal comfort.
The predicted hours of internal air and operative temperature above 25 oC and 28
oC are
presented in Table 5; it can be seen that these are reduced significantly with increased albedo.
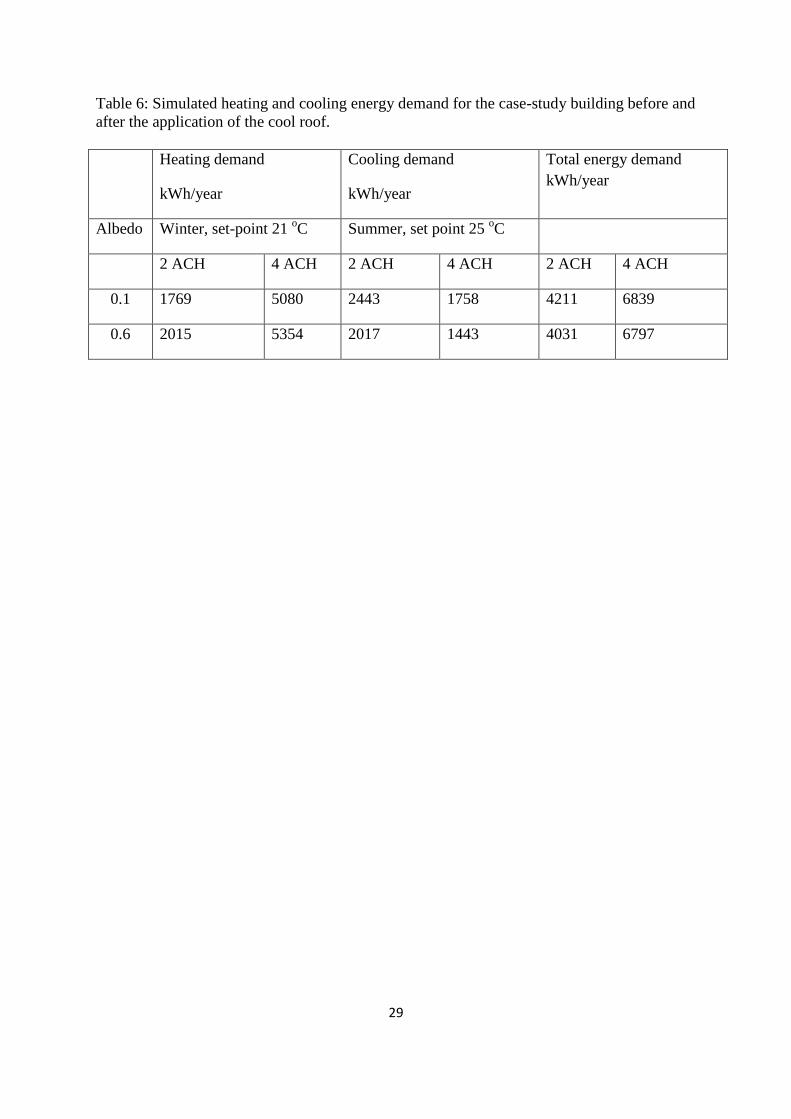
The heating and cooling loads for maintaining the building at 21oC in winter and 25
oC in the
summer for two rates of ventilation rate were simulated for the building before and after the
application of the cool roof. The results are presented in Table 6 in kWh/year for the whole
case study space which has a floor area of 97.6m2.
As expected heating demand has increased and cooling demand has decreased with the cool
roof. Overall, a slight decrease in energy demand is predicted. However, it also indicates a
higher heating demand for the building which is naturally ventilated (no cooling) but with
improved comfort during the summer.
11
5. PARAMETRIC ANALYSIS
A parametric analysis was carried out using the case study as the reference building. The
following parameters were considered:
1. Albedo was changed in the range of 0.1-1.0 and the overheating hours during the
summer (May to September) were calculated.
2. Set-point temperature was varied for winter and summer and the heating and cooling
demand was calculated for albedo values in the range of 0.1-1.0 for ventilation rate of
2 and 4 ACH. The set point temperatures considered are 21 and 23 oC in winter and
23 and 25 oC in the summer.
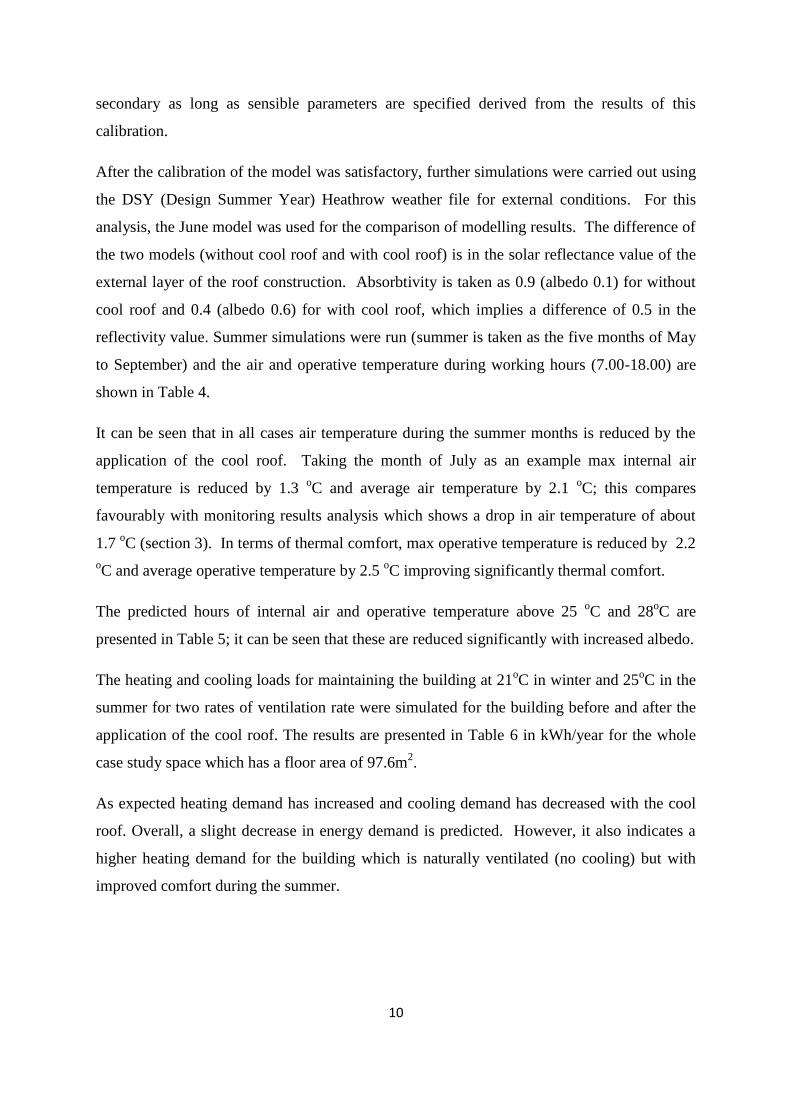
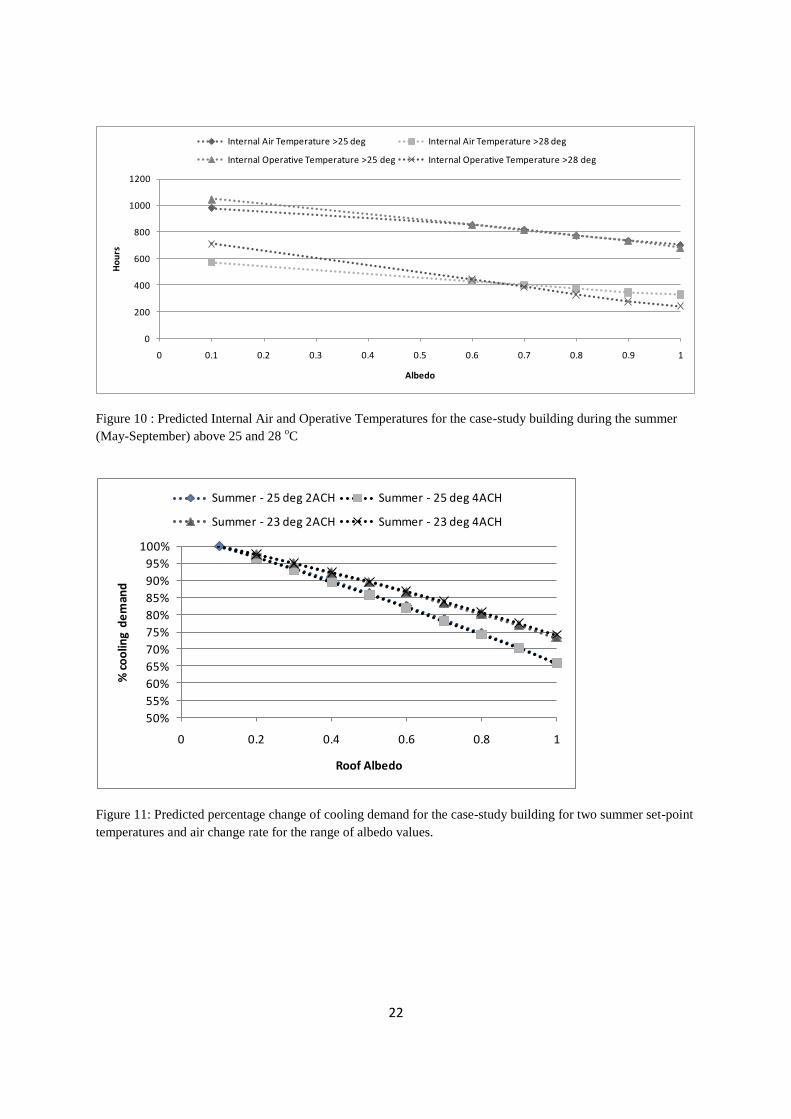
The results of the calculated overheating hours during summer for albedo range 0.1-1.0 are
presented in Figure 10. Internal air and operative temperatures are presented above 25 and 28
oC. The internal comfort is improved with higher albedo values. Comfort (temperatures
above 25 oC) is improved for 25% hours in terms of internal air temperature by changing the
albedo from 0.1 to 0.9 while operative temperature is improved for 30% of the hours.
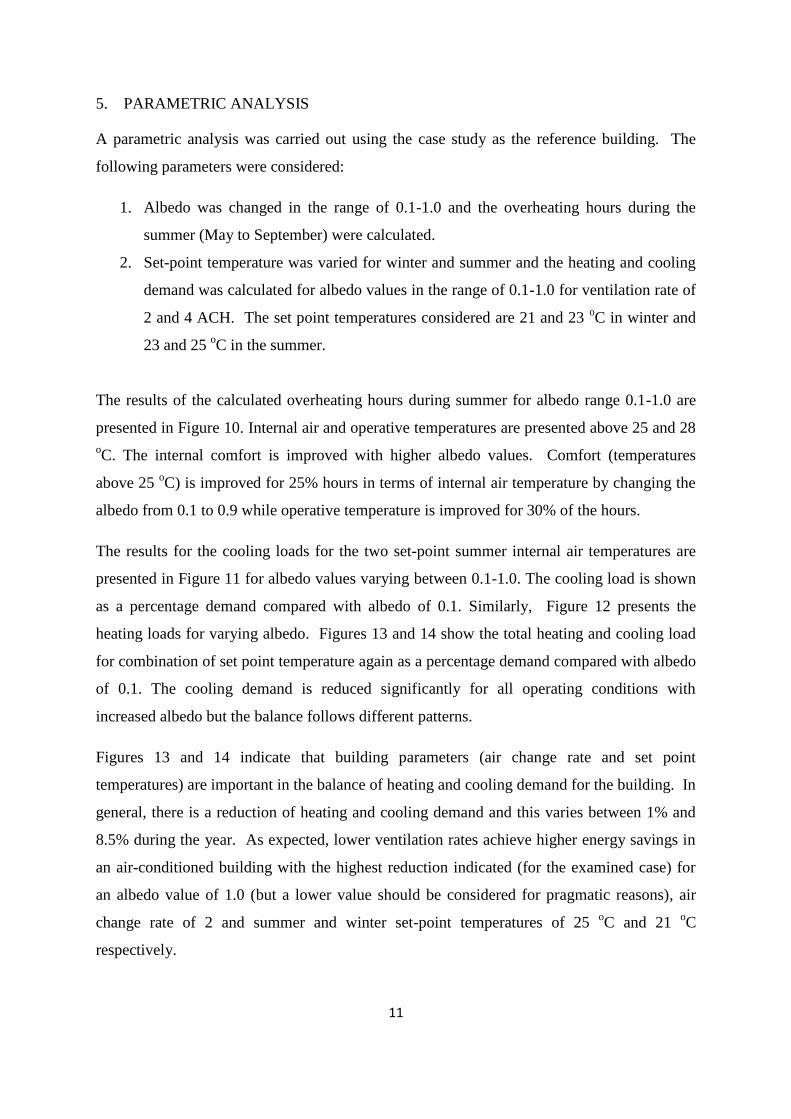
The results for the cooling loads for the two set-point summer internal air temperatures are
presented in Figure 11 for albedo values varying between 0.1-1.0. The cooling load is shown
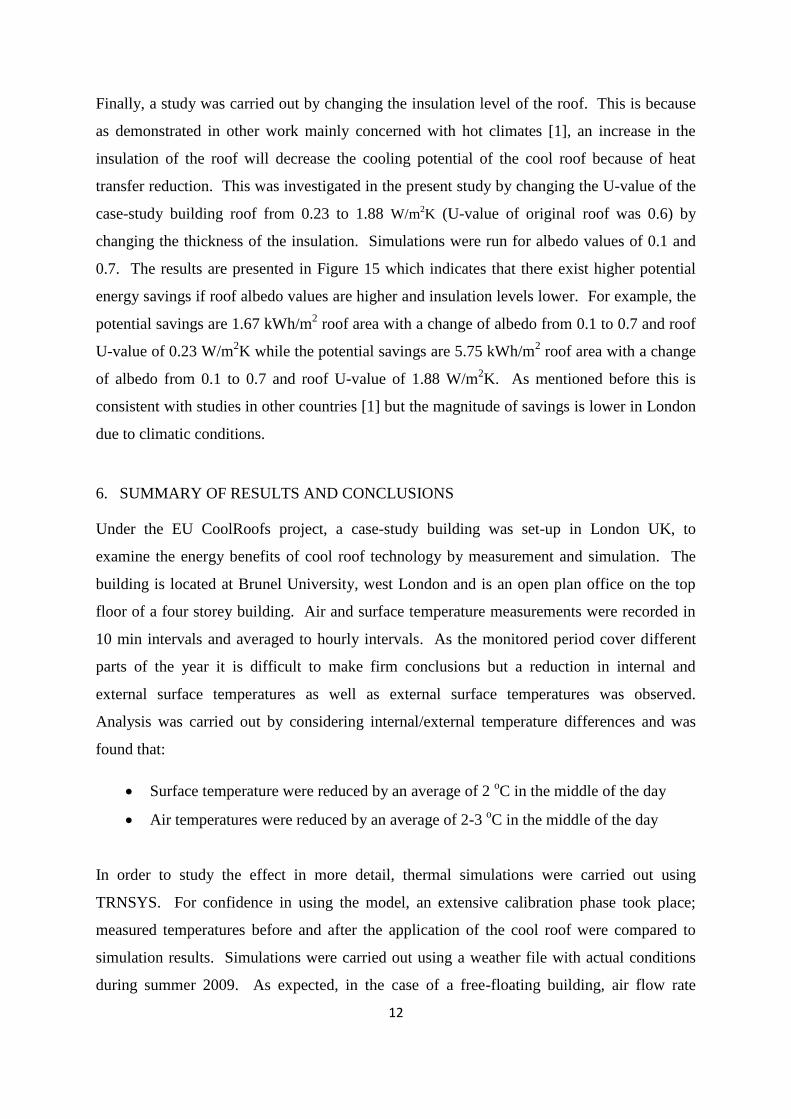
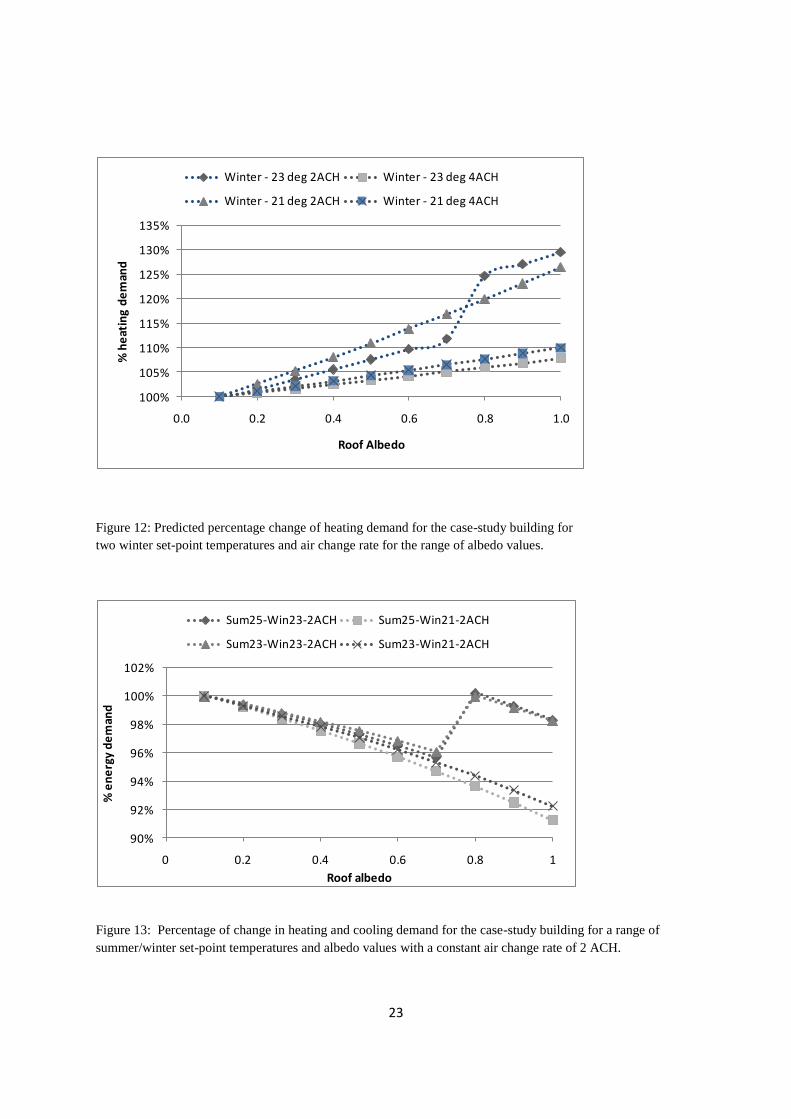
as a percentage demand compared with albedo of 0.1. Similarly, Figure 12 presents the
heating loads for varying albedo. Figures 13 and 14 show the total heating and cooling load
for combination of set point temperature again as a percentage demand compared with albedo
of 0.1. The cooling demand is reduced significantly for all operating conditions with
increased albedo but the balance follows different patterns.
Figures 13 and 14 indicate that building parameters (air change rate and set point
temperatures) are important in the balance of heating and cooling demand for the building. In
general, there is a reduction of heating and cooling demand and this varies between 1% and
8.5% during the year. As expected, lower ventilation rates achieve higher energy savings in
an air-conditioned building with the highest reduction indicated (for the examined case) for
an albedo value of 1.0 (but a lower value should be considered for pragmatic reasons), air
change rate of 2 and summer and winter set-point temperatures of 25 oC and 21
oC
respectively.
12
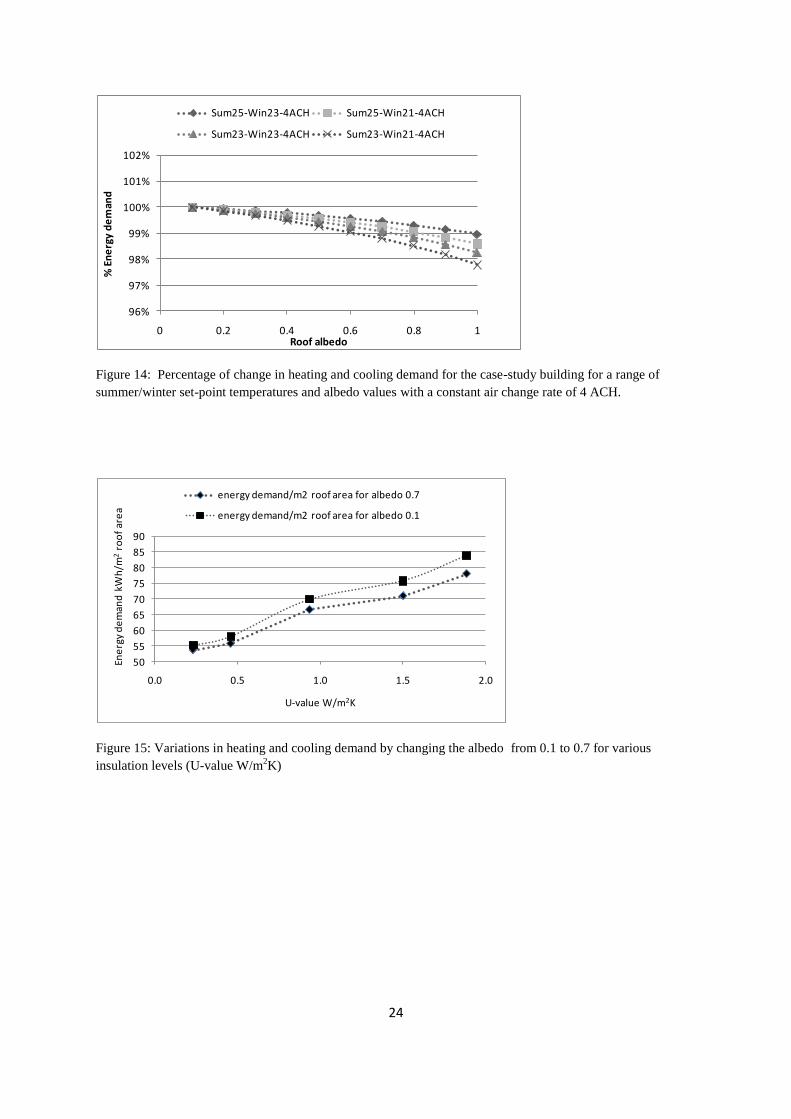
Finally, a study was carried out by changing the insulation level of the roof. This is because
as demonstrated in other work mainly concerned with hot climates [1], an increase in the
insulation of the roof will decrease the cooling potential of the cool roof because of heat
transfer reduction. This was investigated in the present study by changing the U-value of the
case-study building roof from 0.23 to 1.88 W/m2K (U-value of original roof was 0.6) by
changing the thickness of the insulation. Simulations were run for albedo values of 0.1 and
0.7. The results are presented in Figure 15 which indicates that there exist higher potential
energy savings if roof albedo values are higher and insulation levels lower. For example, the
potential savings are 1.67 kWh/m2 roof area with a change of albedo from 0.1 to 0.7 and roof
U-value of 0.23 W/m2K while the potential savings are 5.75 kWh/m
2 roof area with a change
of albedo from 0.1 to 0.7 and roof U-value of 1.88 W/m2K. As mentioned before this is
consistent with studies in other countries [1] but the magnitude of savings is lower in London
due to climatic conditions.
6. SUMMARY OF RESULTS AND CONCLUSIONS
Under the EU CoolRoofs project, a case-study building was set-up in London UK, to
examine the energy benefits of cool roof technology by measurement and simulation. The
building is located at Brunel University, west London and is an open plan office on the top
floor of a four storey building. Air and surface temperature measurements were recorded in
10 min intervals and averaged to hourly intervals. As the monitored period cover different
parts of the year it is difficult to make firm conclusions but a reduction in internal and
external surface temperatures as well as external surface temperatures was observed.
Analysis was carried out by considering internal/external temperature differences and was
found that:
Surface temperature were reduced by an average of 2 oC in the middle of the day
Air temperatures were reduced by an average of 2-3 oC in the middle of the day
In order to study the effect in more detail, thermal simulations were carried out using
TRNSYS. For confidence in using the model, an extensive calibration phase took place;
measured temperatures before and after the application of the cool roof were compared to
simulation results. Simulations were carried out using a weather file with actual conditions
during summer 2009. As expected, in the case of a free-floating building, air flow rate
13
through open windows was the most difficult parameter to estimate; internal gains through
people and equipment was found easier to estimate. Despite the difficulties, a model was
arrived at which includes realistic estimates of the building operational schedule and
compares reasonably well with the measurements; agreement is taken as satisfactory when
average daily (working hours) temperature is predicted within 10% of measured temperature.
This has been achieved over the summer season; more close agreement would have been
possible if variable air flow rate was applied.
TRNSYS simulations have indicated the following:
1. There is reduction on maximum and average internal air and operative temperatures
during the summer months. For the month of July, maximum internal air temperature
is reduced by 1.3 oC and average air temperature by 2.1
oC. In terms of thermal
comfort, max operative temperature is reduced by 2.2 oC and average operative
temperature by 2.5 oC improving significantly thermal comfort. Albedo values were
taken as 0.1 (before cool roof ) and 0.6 (after cool roof).
2. Overheating hours during the summer have been reduced significantly with higher
albedo values. Comfort (temperatures above 25 oC) is improved for 25% of hours in
terms of internal air temperature by changing the albedo from 0.1 to 0.9 while
operative temperature is improved for 30% of the hours.
3. Heating load was increased and cooling load was decreased with an overall reduction.
The overall energy demand reduction is between 1 and 8.5% relative to an albedo of
0.1 for the same conditions. As expected, lower ventilation rates achieved higher
energy savings in an air-conditioned building with the highest reduction indicated (for
the examined case) for an albedo value of 1.0, air change rate of 2 and summer and
winter set-point temperatures of 25 oC and 21
oC respectively.
4. Considering realistic values for albedo, the optimum albedo is indicated as 0.6 to 0.7
with air change rate of 2ACH which achieved an overall heating and cooling load
reduction of 3-6% depending on the set-point temperature.
5. Increasing insulation levels would decrease potential energy benefits in heating and
cooling demand. For a U-value of 1.88 W/m2K a change of albedo from 0.1 to 0.7
would reduced the heating and cooling demand by 7% while for a U-value of 0.23
W/m2K, the same change of albedo will reduce the load by only 2%.
14
In conclusion this case-study analysis for the moderate climate of South East England
(suburban London) indicates that applying cool roof technology could be beneficial in terms
of increased thermal comfort in the summer and could decrease overall energy use for heating
and cooling. However, energy savings are dependent on building related construction and
operation. In general:
In free floating (naturally ventilated) buildings summer comfort is improved but
there is a penalty of increased heating energy during the winter. Thermal comfort
can be improved by as much as 2.5 oC (operative temperature difference for a
change of 0.5 in albedo) but heating demand could be increased by 10%.
In air conditioned buildings, set-point temperature plays an important role in the
comparative energy demand for the range of albedo values. In general, there is a
reduction of heating and cooling demand and this varies between 1% and 8.5%
during the year. As expected, lower ventilation rates achieve higher energy savings
in an air-conditioned building with the highest reduction indicated (for the examined
case) for an albedo value of 1.0, air change rate of 2 and summer and winter set-
point temperatures of 25 oC and 21
oC respectively.
Insulation level of the roof will affect the reduction in heating and cooling energy
demand with decreasing benefits for higher insulation values.
Considering realistic values for albedo, the optimum albedo is indicated as 0.6 to 0.7 with air
change rate of 2ACH which achieved an overall heating and cooling load reduction of 3-6%
depending on the set-point temperature. Energy benefits are higher for lower insulation of the
roof.
ACKNOWLEDGMENTS
This work was carried out as part of the project CoolRoofs Contract N°:
EIE/07/475/SI2.499428 funded by the Intelligent Energy Europe (IEE) program SAVE 2007.
15
LIST OF REFERENCES
1. Synnefa A, Santamouris M, Akbari H, (2007). Estimating the effect of using cool
coatings on energy loads and thermal comfort in residential buildings in various climatic
conditions, Energy and Buildings 39, 1167–1174.
2. Levinson R, Akbari H, Reilly JC. (2007). Cooler tile-roofed buildings with near-infrared-
reflective non-white coatings, Building and Environment 42, 2591–2605
3. Zinzi M, Fasano G. (2009). Properties and performance of advanced reflective paints to
reduce the cooling loads in buildings and mitigate the heat island effect in urban areas.
International Journal of Sustainable Energy. Vol. 28, Nos. 1–3, 123–139
4. Suehrcke H, Peterson EL, Selby N. (2008). Effect of roof solar reflectance on the
building heat gain in a hot climate. Energy and Buildings 40, 2224–2235
5. Akbari H, Bretz S, Kurn D, Hanford J. (1997). Peak power and cooling energy savings of
high-albedo roofs. Energy and Buildings; 25, 117–26.
6. Parker D, Huang J, Konopacki S, Gartland L, Sherwin J, Gu L. (1998). Measured and
simulated performance of reflective roofing systems in residential buildings. ASHRAE
Trans;104(1), 963–75.
7. Konopacki S, Akbari H. (2001). Measured energy savings and demand reduction from a
reflective roof membrane on a large retail store in Austin. Report LBNL-47149.
Berkeley, CA: Lawrence Berkeley National Laboratory.
8. Akbari H, Levinson R, Rainer L. (2005), Monitoring the energy-use effects of cool roofs
on California commercial buildings, Energy and Buildings, 37. 1007–1016
9. Jo JH, Carlson JD, Golden JS, Bryan H, (2010). An integrated empirical and modeling
methodology for analyzing solar reflective roof technologies on commercial buildings,
Building and Environment, 45, 453–460
10. Wang X, Kendrick C, Ogden R, Maxted J. (2008). Dynamic thermal simulation of a
retail shed with solar reflective coatings. Applied Thermal Engineering 28, 1066–1073
11. Cheng V, Ng E, Givoni B. (2005). Effect of envelope colour and thermal mass on indoor
temperatures in hot humid climate Solar Energy 78, 528–534
12. Yu B, Chen Z, Shang P, Yang J, (2008). Study on the influence of albedo on building
heat environment in a year-round, Energy and Buildings 40, 945–951
13. Akbari H, Konopacki S, (2004). Energy effects of heat-island reduction strategies in
Toronto, Canada. Energy 29, 191–210
16
14. Shariah A, Shalabi B, Rousan A, Tashtoush B (1998), Effects of Absorptance of external
surfaces on heating and cooling loads of residential buildings in Jordan, Energy
Conversion and Management 39(3/4): 273-284.
15. Halewood J, De Wilde P (2010), Cool Roofs and their applications in the UK, IP 13/10,
BRE, Garston.
16. Zinzi M (ed), (2010). Report on the five case studies and analysis of the results, Cool
Roofs EU project, available from www.coolroofs-eu.eu
17. Abolin technical report, (2008) (http://www.abolincoolpaints.com/node/63
18. Kolokotroni, M., Giridharan, R., (2008). Urban heat island intensity in London: an
investigation of the impact of physical characteristics on changes in outdoor air
temperature during summer. Solar Energy 82, 986–998.
19. Giridharan, R., Lau, S.S.Y., Ganesan, S., Givoni, B., (2007). Urban design factors
influencing urban heat island intensity in high rise high density environments of Hong
Kong. Building and Environment 42 (10), 3669–3684.
20. TRNSYS, (2010), The Transient Energy System Simulation Tool,
http://www.trnsys.com/about.htm
17
LIST OF FIGURES
Figure 1: Floor plan and internal view of the case-study building in London
Figure 2: External view and spectral characteristics of the cool roof paint for the case-study building in London.
Figure 3: Position of monitoring equipment in the buildings and the roof.
Figure 4: Measured air and surface temperature of case-study building before (June) and after (August) the
application of the cool roof.
Figure 5: Measured air and surface temperature of the case-study building on two days, one in June (pre-paint
period) and one in August (after-paint period) during which external temperature and solar radiation are similar.
Figure 6: Measured daytime surface temperature differences (roof temperature – internal ceiling temperature)
Figure 7: Measured daytime air temperature, external-internal difference; values are daily daytime air
temperature differences before and after the application of cool roof
Figure 8: Measured and Climate controlled (solar radiation) daytime air temperature trends in the open plan
office
Figure 9: Temperature distribution & difference of experiment and model.
Figure 10 : Predicted Internal Air and Operative Temperatures for the case-study building during the summer
(May-September) above 25 and 28 oC
Figure 11: Predicted percentage change of cooling demand for the case-study building for two summer set-point
temperatures and air change rate for the range of albedo values.
Figure 12: Predicted percentage change of heating demand for the case-study building for two winter set-point
temperatures and air change rate for the range of albedo values.
Figure 13: Percentage of change in heating and cooling demand for the case-study building for a range of
summer/winter set-point temperatures and albedo values with a constant air change rate of 2 ACH.
Figure 14: Percentage of change in heating and cooling demand for the case-study building for a range of
summer/winter set-point temperatures and albedo values with a constant air change rate of 4 ACH.
Figure 15: Variations in heating and cooling demand by changing the albedo from 0.1 to 0.7 for various
insulation levels (U-value W/m2K)
18
Figure 1: Floor plan and internal view of the case-study building in London
Figure 2: External view and spectral characteristics of the cool roof paint for the case-study building in London.
Surface
temperature
measurements
Air temperature &
Relative humidity
Roof top thermocouple
will be attached to
separate HOBO
Corridor
Note: Hobo (I) to
measure air
temperature and
relative humidity has
been placed on 2nd
floor (just below this
room)
A
B C
G
E FD
H
N
Figure 3: Position of monitoring equipment in the buildings and the roof.
19
0.0
5.0
10.0
15.0
20.0
25.0
30.0
35.0
40.0
45.0
50.0
31/05/2009 00:00 30/06/2009 00:00 30/07/2009 00:00 29/08/2009 00:00
Tem
pe
ratu
re o
C
Date
External Air Temperature Roof Surface Temperature Internal Ceiling Temperature
Figure 4: Measured air and surface temperature of case-study building before (June) and after (August) the
application of the cool roof.
0
5
10
15
20
25
30
35
40
1 2 3 4 5 6 7 8 9 10 11 12 13 14 15 16 17 18 19 20 21 22 23 24 25 26 27 28 29 30 31 32 33 34 35 36 37 38 39 40 41 42 43 44 45 46 47 48 49 50
Tem
pe
ratu
re o
C
Hours
External Air Temperature Roof Surface Temperature Internal Ceiling Temperature
1 June 2009 16 August 2009
Avg day global solar radiation: 351 W/m2
Avg day external temperature 19.5 oCAvg day global solar radiation: 350 W/m2
Avg day external temperature: 19 oC
Figure 5: Measured air and surface temperature of the case-study building on two days, one in June (pre-paint
period) and one in August (after-paint period) during which external temperature and solar radiation are similar.
20
-14.0
-12.0
-10.0
-8.0
-6.0
-4.0
-2.0
0.0
2.0
07:00 08:00 09:00 10:00 11:00 12:00 13:00 14:00 15:00 16:00 17:00
tem
p d
iffe
rences(
ext-
in)
deg C
time in hrs
Daytime surface temperature difference trends
Open office before Open office after
Figure 6: Measured daytime surface temperature differences (roof temperature – internal ceiling temperature)
4
5
6
7
8
9
10
11
12
13
14
07:00 08:00 09:00 10:00 11:00 12:00 13:00 14:00 15:00 16:00 17:00
Daytime air temperature trends
Δair tem open office before Δair tem open office after
Hour
Figure 7: Measured daytime air temperature, external-internal difference; values are daily daytime air
temperature differences before and after the application of cool roof
21
24
25
26
27
28
29
07:00 08:00 09:00 10:00 11:00 12:00 13:00 14:00 15:00 16:00 17:00
cloudybefore cloudy after partially cloudy before
partially cloudy after clear sky before clear sky after
time in hours
Tem
pe
ratu
re o
C
Figure 8: Measured and Climate controlled (solar radiation) daytime air temperature trends in the open plan
office
19
20
21
22
23
24
25
26
27
28
29
30
31
32
19 20 21 22 23 24 25 26 27 28 29 30 31 32
me
an m
od
el t
em
pe
ratu
res
mean measured temperatures
Daily mean measured and calculated temperatures (°C)
June
September
Figure 9: Temperature distribution & difference of experiment and model.
22
0
200
400
600
800
1000
1200
0 0.1 0.2 0.3 0.4 0.5 0.6 0.7 0.8 0.9 1
Ho
urs
Albedo
Internal Air Temperature >25 deg Internal Air Temperature >28 deg
Internal Operative Temperature >25 deg Internal Operative Temperature >28 deg
Figure 10 : Predicted Internal Air and Operative Temperatures for the case-study building during the summer
(May-September) above 25 and 28 oC
50%
55%
60%
65%
70%
75%
80%
85%
90%
95%
100%
0 0.2 0.4 0.6 0.8 1
% c
oo
ling
de
man
d
Roof Albedo
Summer - 25 deg 2ACH Summer - 25 deg 4ACH
Summer - 23 deg 2ACH Summer - 23 deg 4ACH
Figure 11: Predicted percentage change of cooling demand for the case-study building for two summer set-point
temperatures and air change rate for the range of albedo values.
23
100%
105%
110%
115%
120%
125%
130%
135%
0.0 0.2 0.4 0.6 0.8 1.0
% h
eat
ing
de
man
d
Roof Albedo
Winter - 23 deg 2ACH Winter - 23 deg 4ACH
Winter - 21 deg 2ACH Winter - 21 deg 4ACH
Figure 12: Predicted percentage change of heating demand for the case-study building for
two winter set-point temperatures and air change rate for the range of albedo values.
90%
92%
94%
96%
98%
100%
102%
0 0.2 0.4 0.6 0.8 1
% e
ne
rgy
de
man
d
Roof albedo
Sum25-Win23-2ACH Sum25-Win21-2ACH
Sum23-Win23-2ACH Sum23-Win21-2ACH
Figure 13: Percentage of change in heating and cooling demand for the case-study building for a range of
summer/winter set-point temperatures and albedo values with a constant air change rate of 2 ACH.
24
96%
97%
98%
99%
100%
101%
102%
0 0.2 0.4 0.6 0.8 1
% E
ne
rgy
de
man
d
Roof albedo
Sum25-Win23-4ACH Sum25-Win21-4ACH
Sum23-Win23-4ACH Sum23-Win21-4ACH
Figure 14: Percentage of change in heating and cooling demand for the case-study building for a range of
summer/winter set-point temperatures and albedo values with a constant air change rate of 4 ACH.
50
55
60
65
70
75
80
85
90
0.0 0.5 1.0 1.5 2.0
Ene
rgy
de
man
d k
Wh
/m2
roo
f ar
ea
U-value W/m2K
energy demand/m2 roof area for albedo 0.7
energy demand/m2 roof area for albedo 0.1
Figure 15: Variations in heating and cooling demand by changing the albedo from 0.1 to 0.7 for various
insulation levels (U-value W/m2K)
25
LIST OF TABLES
Table 1: Construction and thermal characteristics of the external envelope of the case-study
office
Table 2: Albedo level during clear sky period
Table 3: Internal heat gains and ventilation for the calibration model (June=pre-, Sep=after
paint)
Table 4: Predicted monthly air and operative internal temperature during occupied hours
Table 5: Predicted Internal Air and Operative Temperatures for the case-study building
during the summer (May-September) above 25 and 28 oC
Table 6: Simulated heating and cooling energy demand for the case-study building before and
after the application of the cool roof.
26
Table 1: Construction and thermal characteristics of the external envelope of the case-study
office
Construction Element
thickness
m
Total
Thickness
m
Area
m2
U-
value
W/m2K
External wall
Plaster
Concrete block
Rockwool
Aluminium
0.018
0.125
0.18
0.002
0.325
40.64 0.184
Internal floor
Carpet
Screed
Concrete
Mineral wool
Plasterboard
0.01
0.05
0.15
0.1
0.012
0.332
97.6 0.3
Roof
Plaster
Concrete
Insulation
Asphalt
0.012
0.12
0.04
0.03
0.205
97.6 0.6
Partitions
Plasterboard
Concrete Block
Plasterboard
0.013
0.215
0.013
0.241
71.37 1.326
Glazing Argon filled double
glazing
1.4
Table 2: Albedo level during clear sky period
Description Minimum Mean Maximum
Before paint application 0.06 0.09 0.14
After paint application 0.28 0.53 0.83
27
Table 3: Internal heat gains and ventilation for the calibration model (June=pre-, Sep=after
paint)
Parameter Unit Value Schedule
Occupancy 130 W/person (75 sensible,
55 latent heat gain)
8 persons Weekday 7-18
Weekend none
Equipment 240 W/computer 7 computers Weekday 7-18
Weekend none
Lighting W/m2 10 Weekday 7-18
Weekend none
Infiltration ACH (air change per hour) 0.4 Continuously
Ventilation ACH 4 in June
2 in September
Weekday 7-18
Weekend none
Roof Solar
Absorptance
0.9 in June
0.4 in September
Continuously
Roof Albedo 0.1 in June
0.6 in September
Continuously
28
Table 4: Predicted monthly air and operative internal temperature during occupied hours
Monthly distribution of temperature
Albedo Temperature
o C
May June July August September
0.6 average air 24.6 25.6 28.8 26.4 22.7
max air 31.2 33.9 37.2 33.1 29.6
average operative 25.1 26.1 29.2 26.8 22.7
max operative 30.5 32.8 35.4 31.5 27.5
0.1 average air 26.3 27.6 30.9 28.4 24.0
max air 32.5 35.9 38.5 34.3 30.7
average operative 27.1 28.4 31.7 29.0 24.3
max operative 32.8 34.6 37.6 33.5 29.2
Table 5: Predicted Internal Air and Operative Temperatures for the case-study building
during the summer (May-September) above 25 and 28 oC
Albedo Internal Air Temperature oC Internal Operative Temperature
oC
>25 oC >28
oC >25
oC >28
oC
0.1 981 571 hrs 1045 711 hrs
0.6 851 427 hrs 853 443 hrs
29
Table 6: Simulated heating and cooling energy demand for the case-study building before and
after the application of the cool roof.
Heating demand
kWh/year
Cooling demand
kWh/year
Total energy demand
kWh/year
Albedo Winter, set-point 21 oC Summer, set point 25
oC
2 ACH 4 ACH 2 ACH 4 ACH 2 ACH 4 ACH
0.1 1769 5080 2443 1758 4211 6839
0.6 2015 5354 2017 1443 4031 6797