Embed Size (px)
Citation preview
Cooperation among liquefied natural gas suppliers:
Is rationalization the sole objective?
Olivier MASSOL a,b,* a Center for Economics and Management, IFP School, 228-232 av. Napoléon Bonaparte,
F-92852 Rueil-Malmaison, France b Department of Economics, City University, Northampton Square, London EC1V 0HB, UK
Stéphane TCHUNG-MING c,d c Economic Studies Division, IFP, 1-4 av. de Bois-Préau, F-92852 Rueil Malmaison, France.
d CREDEN, Université Montpellier I, Av. de la mer, BP 9606, F-34054 Montpellier, France
December 22, 2009
Acknowledgement
Many people have provided helpful comments and suggestions on the analysis, and we are pleased to take this opportunity to thank them. We are especially grateful to Albert Banal-Estanol, Aymeric Lardon, Jacques Percebois and one anonymous referee. The first author is also heavily indebted to Michel Le Breton for his brilliant presentation of cooperative game theory. Thanks are also due to Gaelle Barrot, Laurent David, Joanne Evans, Axel Pierru, Philippe Solal, seminar participants at City University and participants at the EURO 2009 conference in Bonn for useful discussions. All remaining errors are ours. The views expressed herein are strictly those of the authors and are not to be construed as representing those of the IFP.
JEL Classification codes: L71, C71
Keywords: Liquefied Natural gas; Cooperative game theory; Linear programming problem. * Corresponding author. Tel.: +33 1 47 52 68 26; fax: +33 1 47 52 70 66. E-mail address: [email protected]
- 2 / 34 -
Abstract
This paper examines the development of cooperative strategies between countries exporting Liquefied
Natural Gas (LNG) and members of the Gas Exporting Countries Forum (GECF). This economic
study focuses specifically on an often-raised scenario: the emergence of a cooperative approach
designed with the sole aim of logistic rationalization, and which would not have any effect on LNG
prices. We first assess the annual gains that may result from this market-power-free cooperative
approach using a simple static transportation model. The numerical results obtained suggest that, in the
absence of a gain redistribution policy, this cooperative strategy will probably not be adopted because
cooperation would not be a rational move for some exporters. The problem of gain sharing is then
formulated using cooperative game theory concepts. Several gain-sharing methods have been studied,
including the Shapley value and various nucleolus-inspired concepts. Our results suggest that the
choice of a redistribution policy appears relatively restricted. Out of the methods studied, only one –
per capita nucleolus – satisfies two key requirements: core belonging and monotonicity (in the
aggregate). Lastly, we look at how cooperation may give rise to a coordination cost and try to
determine the maximum amount of this cost. In view of the low level of this amount and the relative
complexity of the sharing method implemented, we consider that the credibility of a logistic
cooperation scenario exempt from market power should be reappraised.
- 3 / 34 -
Introduction
In the gas industry, the establishment of the Gas Exporting Countries Forum (GECF), founded in 2001
in Tehran, is undoubtedly one of the key events of the last few years. For the first time in history, the
main gas exporting states, existing or emerging, got over the first steps to implement a cooperative
approach. All the meetings of this informal inter-ministerial assembly (Hallouche, 2006) have given
rise to plenty of comments. Indeed, the concentration of reserves1, the precedent constituted by the
OPEC (to which several GECF member states also belong) and the similarities between oil and natural
gas (comparable technologies used in the exploration and production phases, analogies in terms of
concentration of reserves) are all familiar topics when examining the long-term future of this industry.
Concerning the GECF, one of the major questions is how this group of exporters might behave.
According to the dichotomy proposed by C. Mandil2, two possibilities can be envisaged, depending on
whether the GECF will seek to exercise market power or not. In the first case, the GECF would
behave like a cartel, while in the second, it would concentrate on promoting regional cooperation as "a
think tank for gas exporting countries, enabling them to consider the best possible conditions for the
exercise of their mission" (Mandil, 2008). In the first scenario, economic theory provides models for
analyzing the GECF profitability. For example, Jaffe and Soligo (2006) model the gas-OPEC as a
dominant firm facing a competitive fringe to illustrate the collective market power that could be
exerted by that organization3. However, as yet, there has been no examination of the other alternative:
a cooperation that would be conducted without exerting any collective market power, i.e. without any
effect on the prices paid by importing countries. This is the aim of this paper.
It is no surprise to note a revival of an early literature dedicated to international trade in natural gas
and more specifically the theme of cooperation between exporters (Percebois, 1989 pp. 559-582).
Some recent publications (e.g.: Hallouche, 2006; Finon, 2007; Wagbara, 2007; Tönjes and de Jong,
2007, Percebois, 2008) offer an in-depth description of the GECF and provide the basics required for
more detailed analyses, such as those concerning (i) the attitude of each of the GECF member
countries in relation to cooperation or (ii) the effect that cartelization would have on the importing
countries. These contributions examine the subject in the broad perspective of geopolitics.
Besides, it can be judicious to implement an analytical approach grounded in economic theory.
Obviously, the natural gas industry exhibits a real complexity and for that reason, any modeling
attempt requires some simplifications. Nevertheless, the literature dedicated to the gas industry
provides numerous examples of insightful contributions obtained thanks to comprehensive models.
1 Three countries – Russia, Iran and Qatar – alone hold 55% of the planet’s proven reserves of natural gas (BP, 2008). According to Hallouche (2006), the countries represented at the 2004 GECF assembly collectively held 87% of global gas reserves. 2 Former Executive Director of the International Energy Agency. 3 Following Cremer and Weitzman (1976), that "dominant firm" approach has been used in many models of OPEC.
- 4 / 34 -
Examples include: (i) the numerical market equilibrium models inspired by Mathiesen et al. (1987)
either in a competitive perspective (Hartley and Medlock, 2006) or in a Cournot oligopoly one
(Golombek et al., 1995; Boots et al., 2004; Holz et al., 2008; Egging et al., 2008): (ii) the analytical
models prepared for the 23rd edition of the Energy Modeling Forum4. Occasionally, these model-based
contributions have proven to be helpful in dismissing conventional wisdom expectations5. This article
aims at building on that analytical literature.
We focus on Liquefied Natural Gas (LNG), since GECF countries hold a privileged position in this
respect: they collectively hold almost 90% of the world’s liquefaction capacities (Hallouche, 2006, p.
25), an impressive figure that has raised concerns about the possible emergence of "an association of
some kind among LNG exporters" (Yergin and Stoppard, 2003). During the last 10-15 years, LNG
trade has undergone an average growth of +7.44% a year since 2000 and represents almost 30% of
today's international trade in gas (BP, 2008). Simultaneously, significant cost reductions – including
economies of scale in the design of liquefaction plants (Jensen, 2003), an increased competition
among liquefaction technology suppliers (Greaker and Sagen, 2008) and a drop in the unit cost of
LNG shipping (Brito and Hartley, 2007; Rosendahl and Sagen, 2009) – have been experienced in that
industry. These trends have resulted in the development of remote, and previously unexploited,
resources and the expansion of transoceanic exchanges between previously isolated markets (Jensen,
2003).
However, the current organization of the LNG industry remains largely shaped by its history. Heavy
investments are required to cover the financial needs of LNG projects. Because of the conditions
imposed by fund lenders, most of the existing liquefaction terminals have been designed as part of
integrated supply projects that also included cryogenic vessels and regasification facilities. The
commercial arrangements attached to these projects usually involve complex long-term (typically 20
years) sale and purchase agreements that commonly link specific buyers’ and sellers’ facilities in a
bidding inflexible pairing. According to these contracts, LNG tankers are usually committed to shuttle
between a specific liquefaction plant and a specific destination (Jensen, 2004). As a result, current
LNG flows are clearly dependent on past contractual decisions. On a global level, the aggregation of
these contractual flows offers many opportunities for cross-shipping savings (Jensen, 2003). For
example (GIIGNL, 2008), Trinidad and Tobago has a contract to supply 1.19 million tons of LNG per
year (mt/y) to Cartagena (Spain). Simultaneously, Algeria is committed to shipping 3.2 mt/y of LNG
to Lake Charles (USA). In both cases, under the provisions of the Delivered Ex Ship (DES) contract,
4 See: EMF (2007) and the individual papers collected and edited by Huntington in a special issue of the Energy Journal (Huntington, 2009). 5 A recent example is given by Rosendahl and Sagen (2009) who show how, in a competitive environment, a reduced gas transportation cost does not necessarily lead to lower prices in the importing regions.
- 5 / 34 -
the supplier is responsible for transportation6. In view of the respective geographical positions, these
two LNG exporters could consider a profitable shipping coordination.
Recently, flexible destination cargo trading has emerged and has induced new market opportunities
(cf. Yepes Rodríguez (2008) for an appropriate valuation of destination flexibility). In that vein, recent
empirical evidence suggests that these arbitrages could prop up a regional price convergence across
the Atlantic basin (Neumann, 2009). But, Brown and Yücel (2009) also note that variations in crude
oil prices could also explain those apparent coordinated movements in natural gas prices. Further
empirical analysis would certainly benefit from reliable and detailed information on cargo redirections
and contractual structures. Unfortunately, the current opacity of the LNG industry tends to impede
those further investigations. Concerning the rest of the world, it must be reaffirmed that there are
either no spot markets or they are illiquid for natural gas in most importing countries. In those
countries, LNG redirections remain mostly motivated by importers balancing needs. Hence, price
differences are not necessarily predominant in redirection decisions.
Moreover, even if the market creates the conditions for cargo diversion, it can not be effective unless
contractual clauses allow it. In many cases, the persistence of binding contractual limitations (either
DES arrangements or rigid destination clauses in FOB arrangements) makes arbitrage almost
impossible, with only rare exceptions (outages or other exceptional cases). For the future, we could
envisage that future renegotiation of existing long-term contracts will somehow phase out these
restrictions (Zhuravleva, 2009). But this is obviously a long-run process that can not be reasonably
taken into consideration in a study focusing on the current LNG industry. As a result, the
contemporary LNG industry still departs substantially from ideal competitive conditions for
commodity trading7. Overall, it seems reasonable to assume that there are still considerable contractual
rigidities in the LNG industry8, and hence some opportunities for substantial shipping cost savings.
In this context, some observers have suggested that the GECF could play an intermediation role by
identifying opportunities for logistic rationalization between GECF members (Wagbara, 2007). Taking
that perspective, we aim at providing an ex-post evaluation of the gains that could have been obtained
if such an optimization had been implemented during a given year, for example: 2006, 2007 or 2008.
Because of the lack of publicly available contractual information, we have to rely on the LNG trade
flows reported by the BP Statistical Review. Obviously, these annual flows provide an aggregated
perspective. Again, as detailed information on effective LNG shipments is hardly available on an
infra-annual basis, we have to assume that the transportation patterns exhibited by these annual flows
remain constant throughout the year. Moreover, we assume that all the feasible profitable redirections
6 These Delivered Ex Ship (DES) provisions stipulates that the buyer agrees to purchase, receive and pay the Seller for LNG at a unique and predefined delivery point. 7 Zhuravleva (2009) enumerates several barriers that hamper the commoditization of LNG markets, including: inappropriate market regulations, technical and market restrictions, the high transaction costs imposed by an illiquid and opaque market... 8 This point is consistent with several discussions we had with market players.
- 6 / 34 -
allowed by flexible destination arrangements have been undertaken. As a result, residual
rationalization opportunities, if any, are supposed to have been impeded by binding contractual
rigidities. In other words, any evaluation of the shipping cost gains that could possibly have been
earned from these reported flows provides an upper bound of the gains derived from a logistic
coordination between LNG exporters.
In terms of the GECF countries as a group, determining an optimal shipping rationalization is similar
to resolving a standard transportation problem. This transportation problem has fuelled a rich literature
in both economic theory (Koopmans, 1949; Kantorovich, 1960) and operations research with a famous
formulation proposed by Dantzig (1951). Note that this logistic optimization has no impact on the
price paid by the importing countries9.
Several questions now arise. Firstly, what collective gain is likely to be achieved by such a
coordination of exports within the GECF? Can we expect the spontaneous adoption of a coordinated
policy without implementing a redistribution mechanism designed to create an incentive compatible
cooperation? In other words, is such a collective gain attainable without worsening any member's
profit? If no, the coordination wouldn’t be possible unless a money transfer among participants could
be implemented. But in that case, is it possible to identify a redistribution policy likely to encourage
all the stakeholders to cooperate within the GECF? Is the current composition of the GECF the best
suited to this coordination, or would it be in the interest of certain participants to cooperate within the
framework of a restricted coalition? All these questions refer to the concepts of cooperative game
theory, which analyzes the distribution of gains resulting from cooperation between economic players.
This theory has been used in a wide variety of contexts. Applications linked to energy include such
diverse examples as the regional cooperation in planning an electricity supply system between three
states in India (Gately, 1974); the measurement of market power in the Western American coal
industry (Wolak and Kolstad, 1988); the sharing of joint costs in a distribution planning situation at
Norsk Hydro (Engevall et al., 1998); the allocation of electricity transmission cost (Kattuman et al.,
2004) and the allocation of a refinery’s CO2 emissions (Pierru, 2007)… In this paper, we analyze the
credibility of the so-called "rationalization" argument by studying the feasibility of a cooperation
which focuses solely on the logistic optimization of LNG supply chains, without trying to exert any
upward pressure on prices. Finally, we aim to discuss the credibility of such a "market-power-neutral"
cooperation.
The next section details and discusses the assumptions used in this study. Section 3 justifies the
formulation of the GECF's problem in the form of a linear program. It also provides an evaluation of
the transportation gains that could have been earned either in 2006, 2007 or 2008, if such a logistic
cooperation had been implemented. According to these results, such a cooperation would be
- 7 / 34 -
collectively profitable. However, some countries would not spontaneously adhere to this collectively
optimal export policy. As a gain-sharing rule is needed, section 4 discusses this issue with the help of
cooperative game theory concepts. It sets achievable gain-sharing schemes using basic solutions as
well as more advanced ones such as the Shapley value, the nucleolus and some of its derivatives. The
last section concludes the paper.
1. Assumptions
This first section presents the notations and discusses the assumptions used in this article.
1.1 Notations
� t , a given year, either 2006, 2007 or 2008;
� tN , the set of GECF members that exported LNG in year t ;
� i , an LNG exporting country;
� j , an LNG importing country;
� tn , the number of GECF countries that exported LNG in year t ;
� td , the number of destinations that received some LNG from GECF countries in year t ;
� tijq , the (non-negative) annual quantity of LNG shipped from i to j during year t ;
� tijQ , the annual quantity of LNG that has been effectively shipped from i to j in year t ;
� tjP , the annual average import price of LNG in j during year t . It gives the value of LNG at
the gate of j 's regasification plants;
� iC , the unit cost of natural gas extracted and liquefied in i ;
� ijT , the unit cost of transporting a given quantity of LNG from i to j .
For the sake of clarity, it must be underlined that the approach considered here is static and relates
only to an annual time horizon. Each year t is considered as a different instance and is thus modeled
independently. As no ambiguity arises, the subscript t has thus been dropped to simplify the
notations. For the same reason, we also define ( ) { }1,...,i ij j dq q
∈= , the vector of i 's annual deliveries to
the different destinations during a given year and ( ) { }1,...,i ij j dQ Q
∈= those effectively observed.
9 This is compatible with the medium-term price rigidity resulting from long-term contracts. In these contracts, prices and indexing formulas are negotiated and fixed for periods of approximately 3 years.
- 8 / 34 -
1.2 The framework
LNG exporting countries
In this study, the list of countries likely to adopt coordination includes all the non-OECD exporting
countries10 that have participated in a GECF meeting (Hallouche, 2006): Algeria, Brunei, Egypt,
Equatorial Guinea (only after the opening of its first liquefaction plant in 2007), Indonesia, Libya,
Malaysia, Nigeria, Oman, Qatar, Trinidad & Tobago and the United Arab Emirates. Hence, n is equal
to 11 in 2006 and to 12 in 2007 and 2008.
LNG importing countries
The following list of importing countries has been considered: Belgium, China (only after the start of
its imports from GECF countries in 2007), Dominican Republic, France, Greece, India, Italy, Japan,
Mexico, Portugal, Puerto Rico, South Korea, Spain, Taiwan, Turkey, the UK and the USA.
1.3 Numerical assumptions
Production and liquefaction costs
The unit costs iC are displayed in Table 9 in Appendix A. These costs include two components:
extraction and liquefaction. A common technology has been assumed for all the liquefaction plants
resulting in a uniform cost of $1.00 per MMBtu these operations (DTI, 2005). Extraction costs11
exhibit some variations due to differences in geological endowments.
LNG ships transport costs
For each ij route, the unit cost values ijT are presented in Table 9 in Appendix A. Obviously, ijT is
monotonically increasing with the maritime distance. Theses values have been calculated in
accordance with a usual methodology (Flood, 1954), assuming a fleet of standardized cryogenic
vessels committed to shuttle on a given route ij and include the main LNG specificities like
evaporation losses during transport.
LNG prices in importing regions
The annual average LNG import prices jP have been obtained by subtracting a regasification service
fee12 to the local gas prices. A standardized fee of $0.50 per MMBtu has been uniformly assumed for
10 Australia, Norway (which holds an observer status at the GECF) and the United States (Alaska) also export LNG. However, it is very unlikely that these countries would agree to join the GECF (Tönjes and de Jong, 2007). Similarly, the modest Belgian re-exportations observed in 2008 have also been neglected. 11 These extraction costs correspond solely to technical operations and include neither the effects of oil and gas taxation nor the opportunity cost related to the exhaustible nature of gas resources. 12 Such a uniform rate insures that this cost element plays no role in the transportation model’s outcome.
- 9 / 34 -
all the importing countries (DTI, 2005). Concerning the natural gas prices observed in importing
regions, we follow Mazighi (2003, p. 319) and assume that three macro regions can be distinguished –
Asia, Europe and America – and that those prices are uniform within each area. This assumption is
consistent with industrial reality as spatial price variations observed within these macro-zones are
usually limited compared to those observed when considering these macro-zones. The gas price data
used in this study are those labeled “Japan CIF”, “European Union CIF” and “US Henry Hub” in
the BP Statistical Review (see Table 1).
Table 1: key figures on LNG trade from GECF members Final Destination 2006 2007 2008
Volumes shipped from GECF members (Bcm) 115.44 126.56 134.34
Asia Reference Price (Japan CIF) ($/MMBtu) 7.14 7.73 12.55 Volumes shipped from GECF members
(Bcm) 57.42 53.20 54.08 Europe
Reference Price (EU CIF) ($/MMBtu) 8.69 8.93 12.61 Volumes shipped from GECF members
(Bcm) 18.47 25.09 14.27 North America
Reference Price (US Henry Hub) ($/MMBtu) 6.76 6.95 8.85 Total Volumes shipped from GECF countries (Bcm) 191.33 204.85 202.69
Reported trade flows
The annual flows ijQ are those reported by the consecutive editions of the BP Statistical Review.
1.4 Preliminary remarks
These assumptions prompt some remarks. Firstly, these assumptions allow us to present an aggregated
vision of LNG trade originating from non-OECD exporters. Taking year 2007 as an example, Table 2
provides an overall vision of the LNG value chain. That year, LNG trade generated a $57 billion
revenue and the total costs amounted to $21 billion (enabling a nearly $35 billion rent). Shipping alone
accounted for nearly one-third of these annual costs. Such a significant share justifies the attention
paid to transportation issues in that industry.
Table 2: The LNG value chain for GECF exporting countries (year 2007) $ billion %
E&P costs Production 3.588 16.6% Liquefaction 7.234 33.4%
Shipping 8.167 33.3% LNG costs Re-gas 3.617 16.7%
Total costs 21.638 100.0% Rent 34.870
TOTAL revenue 57.476
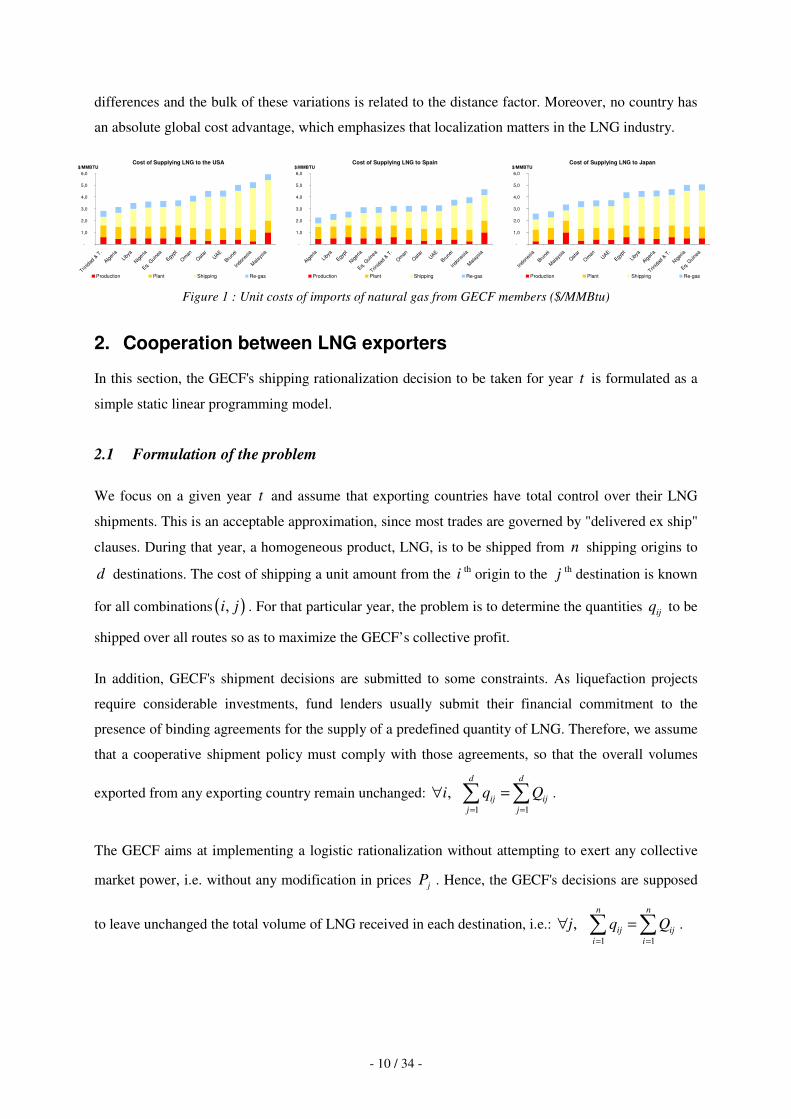
Secondly, only two factors motivate the differences in the unit costs of supplying LNG to a given
destination: extraction cost variations and differences in the localizations. Because of the uniform rates
used for both liquefaction and regasification, these activities do not in any way contribute to these unit
cost differences and are thus assumed to play no direct role in the exporting decisions. An illustration
of these points is given by Figure 1 that presents a least-cost merit order for each of the main
importing countries in North America, Europe and Asia. As expected, there are significant cost
- 10 / 34 -
differences and the bulk of these variations is related to the distance factor. Moreover, no country has
an absolute global cost advantage, which emphasizes that localization matters in the LNG industry.
Cost of Supplying LNG to the USA
-
1,0
2,0
3,0
4,0
5,0
6,0
Trini
dad &
T.
Algeria
Libya
Nigeria
Eq. Guin
eaEgy
pt
OmanQata
rUAE
Brune
i
Indon
esia
Malays
ia
$/MMBTU
Production Plant Shipping Re-gas �
Cost of Supplying LNG to Spain
-
1,0
2,0
3,0
4,0
5,0
6,0
Algeria
Libya
Egypt
Nigeria
Eq. Guin
ea
Trinida
d & T
.
OmanQata
rUAE
Brune
i
Indon
esia
Malays
ia
$/MMBTU
Production Plant Shipping Re-gas �
Cost of Supplying LNG to Japan
-
1,0
2,0
3,0
4,0
5,0
6,0
Indon
esia
Brune
i
Malays
iaQata
r
OmanUAE
Egypt
Libya
Algeria
Trinida
d & T
.
Nigeria
Eq. Guin
ea
$/MMBTU
Production Plant Shipping Re-gas �
Figure 1 : Unit costs of imports of natural gas from GECF members ($/MMBtu)
2. Cooperation between LNG exporters
In this section, the GECF's shipping rationalization decision to be taken for year t is formulated as a
simple static linear programming model.
2.1 Formulation of the problem
We focus on a given year t and assume that exporting countries have total control over their LNG
shipments. This is an acceptable approximation, since most trades are governed by "delivered ex ship"
clauses. During that year, a homogeneous product, LNG, is to be shipped from n shipping origins to
d destinations. The cost of shipping a unit amount from the i th origin to the j th destination is known
for all combinations ( ),i j . For that particular year, the problem is to determine the quantities ijq to be
shipped over all routes so as to maximize the GECF’s collective profit.
In addition, GECF's shipment decisions are submitted to some constraints. As liquefaction projects
require considerable investments, fund lenders usually submit their financial commitment to the
presence of binding agreements for the supply of a predefined quantity of LNG. Therefore, we assume
that a cooperative shipment policy must comply with those agreements, so that the overall volumes
exported from any exporting country remain unchanged: ,i∀ 1 1
d d
ij ijj j
q Q= =
=� � .
The GECF aims at implementing a logistic rationalization without attempting to exert any collective
market power, i.e. without any modification in prices jP . Hence, the GECF's decisions are supposed
to leave unchanged the total volume of LNG received in each destination, i.e.: ,j∀ 1 1
n n
ij iji i
q Q= =
=� � .
- 11 / 34 -
So, the annual profit obtained by i is a linear function of iq : ( ) ( )1
d
i i j i ij ijj
q P C T qπ=
= − −� . For
that particular year t , the GECF’s problem turns out to be a familiar transportation problem (Dantzig,
1951) whose solution is denoted *q :
Program 1:
( )
( ) ( )
( ) ( )
1
1 1
1 1
s.t. 1,2,..., 1
1, 2,..., 2
0
ij
n
i iq i
d d
ij ijj j
n n
ij iji i
ij
Max q
q Q i n
q Q j d
q
π=
= =
= =
= =
= =
≥
�
� �
� �
This program corresponds to a shipping cost minimization problem. It contains nd non-negative
variables ijq and n d+ equality constraints of type (1) and (2). This problem is obviously feasible as,
for any given year, the observed LNG flows ijQ satisfy all the constraints. Moreover, the optimal
solution requires at most 1n d+ − routes with positive shipments (Dantzig, 1951). Whatever the year,
a simple enumeration of the positive flows reported by the BP Statistical Review indicates a number of
used routes always larger than 1n d+ − . Therefore, these ijQ LNG flows
were not optimal, and there
might be some room for a logistic optimization.
2.2 Results
General comments
Three optimal policies *q have been independently computed for the years 2006, 2007 and 2008.
According to the results displayed in Table 3, significant shipping cost savings could have been
achieved thanks to a logistic cooperation.
Table 3: Collective gain resulting from an annual shipping coordination (in M$) 2006 2007 2008
Annual collective profit obtained with past flows (a) 30 676.45 34 869.82 65 170.67 Annual collective profit attained with an optimal shipping policy (b) 31 422.65 35 838.12 66 157.88
Shipping gains obtained from cooperation (b)-(a) 746.20 968.31 987.21 (as a % reduction in that year's shipping costs) 10.5% 11.9% 12.9%
At the GECF level, this cooperation seems profitable. But, at an individual level, the annual gains
( ) ( )*i i i iq Qπ π− displayed in Table 4 clearly show that cooperation could lead to a lowered
- 12 / 34 -
profitability for Brunei, Indonesia, Qatar and Trinidad & Tobago. It will be shown below that
implementing *q induces significant variations in the individual's costs and revenues.
Table 4: Impact of the optimal GECF shipping policies on the individual annual profits (in M$) 2006 2007 2008
Trinidad & Tobago -182.29 -110.94 -539.85 Oman 118.74 120.70 139.07 Qatar -587.25 -624.88 -317.30 UAE 319.28 341.05 337.98
Algeria 273.71 511.31 226.87 Egypt 743.44 704.03 320.21
Equatorial Guinea - 138.98 317.10 Libya 0.71 0.75 0.53
Nigeria 64.77 -115.04 477.26 Brunei -3.86 -2.60 -3.26
Indonesia -38.25 -37.88 -32.64 Malaysia 37.20 42.82 61.24 TOTAL 746.20 968.31 987.21
Detailed comments
A detailed analysis of the results obtained for a specific year also gives an interesting perspective. For
the sake of brevity, that discussion is exclusively focused on 2007 but similar observations could also
be presented for the other years.
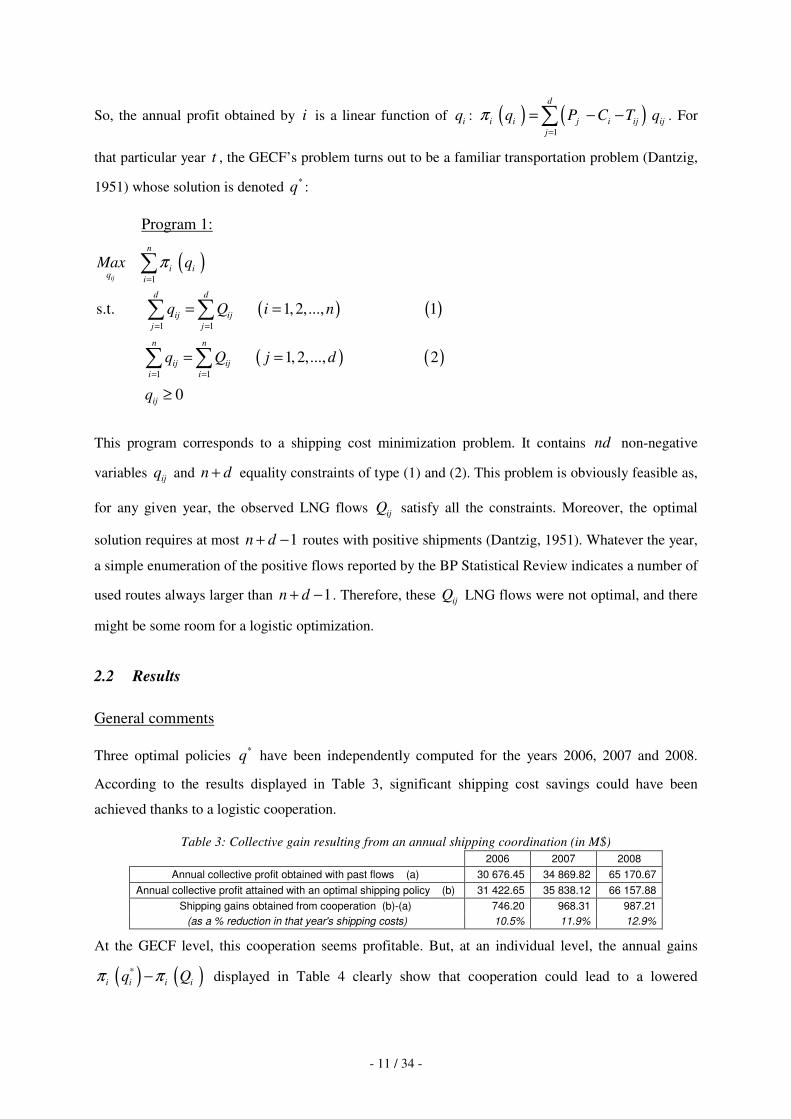
An optimal shipping policy for 2007 is displayed in Table 10 (See Appendix B). It comprises only
2007 2007 1n d+ − =28 positive flows (compared to 77 in the observed flows 2007ijQ ). Figure 2 illustrates
the shipment reallocations associated with that optimal policy: Mediterranean exporters reallocate
most of their LNG to Europe, and Trinidad & Tobago readjusts its exports to neighboring North
American markets, and the volumes liquefied in South East Asia remain dedicated to Asian
destinations. For Asian exporters, the GECF’s optimization only fine-tunes exports at an intra-regional
level.
-10
-8
-6
-4
-2
-
2
4
6
8
10
Trinida
d & Tob
ago
OmanQata
rUAE
Algeria
Egypt
Equato
ral G
uinea
Libya
Nigeria
Brune
i
Indon
esia
Malays
ia
Incr
ease
in s
hipm
ents
(Bcm
)
North America Europe Asia Pacific �-400
-300
-200
-100
-
100
200
300
400
Trinida
d & Tob
ago
OmanQata
rUAE
Algeria
Egypt
Equator
ial G
uinea
Libya
Nigeria
Brune
i
Indon
esia
Malays
ia
M$
variation in revenues variation in shipping costs �
Figure 2: Variations in the LNG destinations induced by the adoption of the GECF’s optimal policy for the year
2007 (a positive value signals a shipment increase)
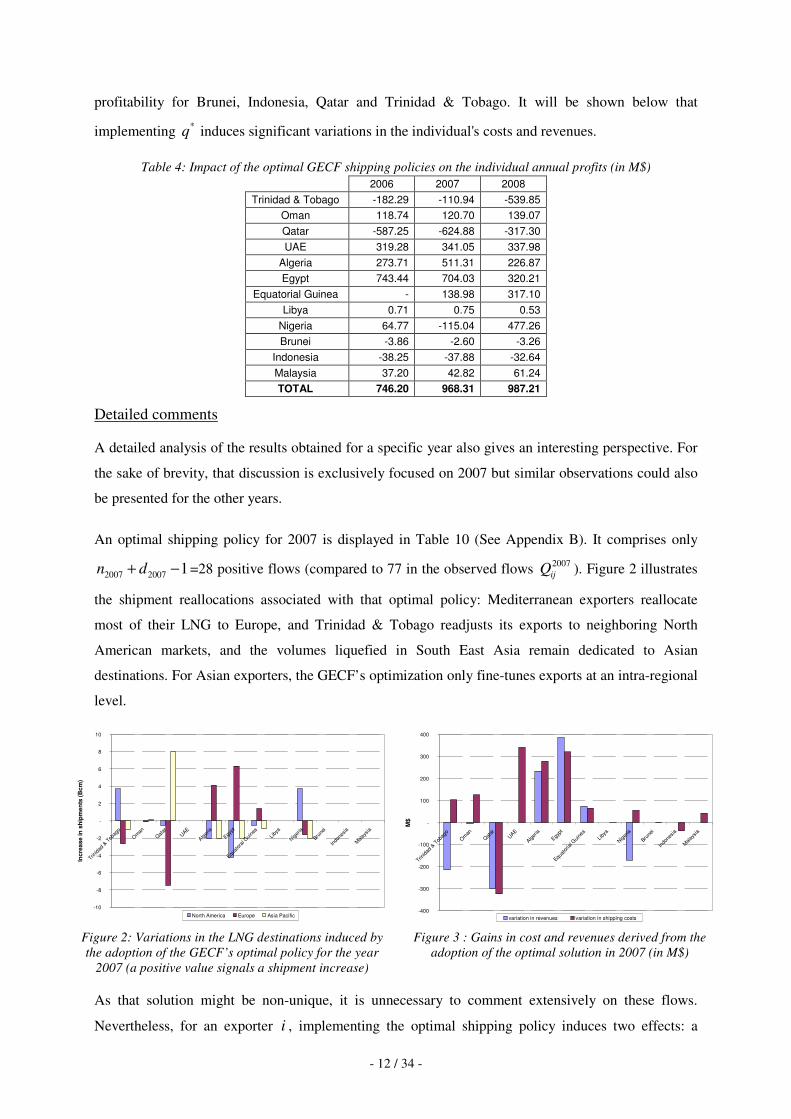
Figure 3 : Gains in cost and revenues derived from the adoption of the optimal solution in 2007 (in M$)
�As that solution might be non-unique, it is unnecessary to comment extensively on these flows.
Nevertheless, for an exporter i , implementing the optimal shipping policy induces two effects: a
- 13 / 34 -
variation in its revenues and a variation in its shipping costs. For 2007, that point is illustrated in
Figure 3. For example, the shipping cost gains obtained by Trinidad & Tobago with *q would not
cover the associated revenue losses. For other countries (Qatar, Brunei and Indonesia), the situation
would be even worse: with adverse variations in both costs and revenues. For these last three
countries, participation in the GECF would not be rationale even if that organization was to be
organized so as to (1) keep individual revenues unchanged and (2) minimize the shipping costs13...
A first conclusion emerges from these results: a shipping rationalization may look desirable at a
collective level but not at an individual one. This feature could seriously impede the spontaneous
implementation of an optimized shipment policy as participation would not constitute a rational move
for some countries. As it seems that substantial collective gains might be obtained from cooperation,
cooperative game theory concepts could possibly pave the way to an incentive-compatible
participation. This issue is studied in the next section.
3. An ‘incentive compatible’ gain sharing
Supposing that the exporters agree to work together, we assume that the annual gain earned through
the cooperation can be divided among the members of the coalition. To implement this reallocation of
the benefits, we have to suppose that money has the properties of a "transferable utility” so that the
problem at hand can be analyzed as a transferable utility game. This is a strong hypothesis, but looking
at the industrial reality suggests the existence of side-payments among participants in a logistic
cooperation14.
3.1 A game theory background
Context
It is now time to introduce some notations. A cooperative game with transferable utility (TU-game) is
a pair ( ),N v , where { }: 1,...,N n= is a finite set of players and : 2Nv →� is a function assigning
to each coalition S N⊆ , its worth ( )v S . By convention, ( ) 0v ∅ = . Let S be the number of
elements of coalition S . To simplify the notations, when no ambiguity arises, we use i to denote { }i
a particular element in N .
In our particular case, we are considering the implementation of a logistic cooperation among GECF
members during a given year: either 2006, 2007 or 2008. Here, three different (and independent) TU-
13 In that case, *q would still correspond to an optimal policy. Hence, these countries would still face adverse shipping cost
variations...
- 14 / 34 -
games are going to be successively studied: ( ),t tN v , where tN is the group of tn potential
participants in the GECF and the worth function tv gives the maximum gain in annual profits that can
collectively be attained by any coalition in year t . As these three TU-games are going to be studied
independently, the subscript t has been dropped to simplify the notations.
For each coalition S , the gains ( )v S to be apportioned among its members are measured by the
difference between the maximum annual profits of its members when they all cooperate and when
they don’t. Such a coordination policy is strictly limited to S and thus has no impact on the shipments
decided by the others \N S countries. In other words, ( )v S is simply the gain obtained from the
creation of a smaller GECF-like organization that implements an optimal shipment policy specifically
computed for coalition S . A simple adaptation of the previous linear programming model is sufficient
to compute the value ( )v S of each of the 2n coalitions that can be formed in N . If we denote
( )i Sδ , the function whose value is equal to 1 if i S∈ and to 0 otherwise, these values ( )v S can be
obtained by solving the following problem:
Program 2
( ) ( ) ( ) ( )
( )
( )
( )( ) ( )
1
1 1
1 1
.
s.t. 1,2,...,
1, 2,...,
1- ,
ij
n
i i i i iq i
d d
ij ijj j
n n
ij iji i
i ij ij
v S Max S q Q
q Q i n
q Q j d
S q Q i j
δ π π
δ
=
= =
= =
� �= −� �
= =
= =
= ∈
�
� �
� �
{ } { }( )1,2,..., 1, 2,...,
0 ij
n d
q
×
≥
Obviously, the gains from cooperation are always positive. Moreover, this function is 0-normalized:
( ) 0v i = , i∀ . On top of that, v has a nice property: by construction, v is super-additive since for all
coalitions A , B with A B∩ = ∅ , we clearly have ( ) ( ) ( )v A B v A v B∪ ≥ + . This feature suggests
that countries have real incentives to cooperate since the union of any two disjoint groups of players
can only improve their total gains. Thus, it should pay to cooperate in the largest coalition, and the
problem may turn out to be the sharing of the overall annual gain among the n countries.
14 In the 1990s, the Italian ENEL and the French GDF signed a swap deal under which Nigerian LNG is delivered in France and GDF diverts an equivalent volume of its imports to Italy. In fact, this swap agreement generated a logistic optimization and transfer prices were used as side-payments to create an incentive-compatible gain allocation.
- 15 / 34 -
Formulation of a gain-sharing problem
In this TU-game ( ),N v , the redistribution problem faced by the GECF can be formulated as finding a
vector x ∈ n� where the i th coordinate named ix is simply equal to the benefit allocated to country
i . Here again, to simplify the notations, when no ambiguity arises, we use x to denote ( )x v . It seems
natural to expect that x allows a full distribution of the gains created by the GECF. Equivalently, x is
expected to be efficient, that is to satisfy ( )1
n
ii
x v N=
=� .
For the GECF, the goal of a redistribution policy is to encourage the cooperation of the twelve
countries. Thus a reasonable test of the method is to check whether the participants agree in principle
to the proposed allocation of benefits. A natural requirement for x is to be individually rational; that
is, for each i N∈ , ( )ix v i≥ . This individual rationality condition basically states that no country
should receive less in the joint operation proposed by the GECF than it would receive on its own.
Finding an allocation which satisfies this property is fundamental since it constitutes the minimum
incentive for an individual country to join the GECF. The set of all efficient and individually rational
allocations is named the imputation set ( )I v . Choosing an allocation in ( )I v can be viewed as a
minimal requirement for the GECF.
A similar analysis can be extended to coalitions of countries as well as to individual exporters. The
condition that no group receives less than the value it could generate on its own is the principle of
group rationality. An allocation x satisfies group rationality if there is no coalition S N⊆ such that
( )ii S
x v S∈
<� . Group rationality obviously implies individual rationality. Now, the notion of the core
(Gillies, 1953) can be introduced. Denote ( )C v the core of a game ( ),N v ; it is defined as the set of
all efficient and group rational allocations, i.e.,
( ) ( ) ( )1
: : and, for each ,n
ni i
i i S
C v x x v N S N x v S= ∈
� �= ∈ = ⊂ ≥� �
� �� . In this GECF case, selecting
an allocation within the core constitutes an appealing requirement since it ensures that no participant,
or subgroup of participants, can complain about the proposed distribution. In fact, each coalition
prefers to cooperate within the grand coalition N – and earns its share of the total gain – rather than
choosing a ‘stand alone’ attitude that yields a lower gain.
However, there is always the adverse possibility that there may be no core imputations: that is, no gain
allocations that are group rational. Thus, we have to check whether the core of this gain-sharing game
is void or not. In some cases, it can be relatively easy to show that the core is non-void. For example,
- 16 / 34 -
in a convex game15, the core is always non-void. Unfortunately, the gain-sharing games that are under
consideration here are generally not convex. An illustration of that non-convexity is given in Table 5.
Table 5: An illustration of the non-convexity of the game ( ),N v for the year 2007 (in M$)
S ( )v S
A := {Brunei, Indonesia} 9.445
B := {Oman, UAE, Equatorial Guinea, Indonesia} 50.100
A B∪ := {Oman, UAE, Equatorial Guinea, Brunei, Indonesia} 50.366
A B∩ := {Indonesia} 0
Thus:
( )v A - ( )v A B∩ > ( )v A B∪ - ( )v B
9.445 > 0.266
However, the super-additive nature of v suggests that a large cooperation can be appealing. Thus, the
existence of a non-void core has to be checked using a linear program as follows:
Program 3
( ) ( )
( ) ( ) ( )
( )
,
1
s.t. 3
, , 4
0 1, 2,...,
ix
n
ii
ii S
i
Max
x v N
x v S S N S N
x i n
εε
ε=
∈
=
− ≥ ∀ ⊂ ≠ ∅
≥ =
�
�
0 ε ≥
A non-empty solution to this problem basically shows that a non-empty core exists since a positive
value for ε guarantees that it is possible to find at least one allocation nx ∈� that satisfies all the
constraints attached to the definition of the core. Fortunately for the GECF, we found ε equal to
$536,082, $360,469 and $452,994 for the year 2006, 2007 and 2008 respectively). Moreover, the core
is not reduced to a unique vector since we found that several nx ∈� provide this value for ε .
The core provides a preliminary criterion of a satisfactory allocation. Given that it is neither void nor
reduced to a singleton, the core offers an attractive guideline for choosing an allocation since it
narrows down the set of acceptable imputations. So, it is now time to verify whether some classic
gain-sharing rules verify this requirement.
15 A TU-game ( ),N v is convex if for all coalitions A and B in N : ( ) ( ) ( ) ( )v A B v B v A v A B∪ − ≥ − ∩ .
Roughly speaking, a game is convex if we have increasing returns to cooperation. In the TU-game framework this means that "the larger the coalition that an individual agent joins, the larger his marginal contribution." (Moulin, 1991, p. 112).
- 17 / 34 -
3.2 Presentation of some gain-sharing methods
Many gain-sharing methods can be envisaged for the GECF. In this article, we limit ourselves to a
limited sample that includes most of the most popular ones. The first three rules propose to share the
collective gain in proportion to the total of a given quantitative criteria. Those naïve rules could
typically be inspired by some accounting considerations. A second type of rule is then presented; those
two methods explicitly take into account the marginal contribution of each participant. Last but not
least, four methods developed in game theory are presented.
Method 1: Equal repartition of the total gain
The annual shipping gain is basically divided into n equal shares: ( )
, i
v Nx i N
N= ∀ ∈ .
Method 2: Proportional to non-cooperative profits
Here, the total annual gain ( )v N is shared in proportion to the profits observed for that year:
( )( )
( )
1
, i ii n
i ii
Qx v N i N
Q
π
π=
= ∀ ∈�
.
Method 3: Proportional to shipments
Information on LNG shipped quantities is presented in numerous publicly available sources. In this
third proportional rule, the total gain ( )v N is simply shared in proportion to the total quantities
shipped by each exporter during the year: ( )1
1 1
,
d
ijj
i n d
iji j
Qx v N i N
Q
=
= =
= ∀ ∈�
��.
Method 4: A marginal contribution scheme
By definition, the marginal contribution im of a participant i is the gain created by i when joining
the coalition of the ( )1n − other participants, ( ) ( )\v N v N i− . It will be shown below that this
method is not necessarily efficient (and thus does not belong to ( )I v ). In the present case, it clearly
overestimates the total gain to be shared ( )1
n
ii
m v N=
>� .
- 18 / 34 -
Method 5: A scheme inspired by the Alternative Cost Avoided method (ACA-method)
This method is inspired by a technique developed during the 1930s to allocate the joint costs of
multipurpose water development projects (Tijs and Driessen, 1986). In this adaptation to a gain-
sharing problem, it can simply be viewed as a two-step procedure. In the first step, each player i
receives a payment based on its marginal contribution im . But, for many value functions, the sum of
these marginal contributions is greater than the total value created by the grand coalition. Therefore, a
second step is needed to readjust the difference ( )1
n
ii
m v N=
−� . In the ACA-method, this surplus is
simply subtracted in proportion to ( )( )im v i− , the differences between the i 's marginal value and its
value in a stand alone case:
( ) ( )( )( )1
1
, n
ii i i n
il
l
m v ix m m v N i N
m v l=
=
−� = − − ∀ ∈� �� � −�
�.
As v is a 0-normalized function, the surplus ( )1
n
ii
m v N=
−� is simply shared in proportion to the
marginal values.
Method 6: The Shapley value
The Shapley value is a well-known game theoretic allocation that has been defined as the unique
allocation that satisfies a consistent set of three axioms (Shapley, 1953). An intuitive interpretation of
the Shapley value can be presented as follows: as the grand coalition is formed by the sequential
addition of exporters, each participant i receives a benefit equal to the entire value ( ) ( )( )\v S v S i−
he offers to the coalition \S i formed just before him. But the order in which the various exporters
will join the grand coalition can be uncertain. The Shapley value is i 's expected benefit if all orders of
formation of N – the permutations of the grand coalition – are considered and intervene with the
same probability 1/ !N in the computation. It is defined as:
( ) ( )( )\ ! \ !\ ,
!iS Ni S
S i N Sx v S v S i i N
N⊆∈
×= − ∀ ∈� .
The Shapley value has an attractive property since this allocation always belongs to the core of a
convex game. Unfortunately, the results are not so clear-cut for super-additive games. For our
particular instances of our GECF game, we will thus have to test if it belongs to the core.
- 19 / 34 -
Method 7: The nucleolus
Another game theoretical concept is the nucleolus proposed by Schmeidler (1969). He defined the
unhappiness of a coalition S with respect to a proposed allocation x and proposed to measure it with
( ) ( ), ii S
e S x v S x∈
= −� , the excess of the non-trivial coalitions ( ) ,S N S N⊂ ≠ ∅ with respect to
an allocation x . This excess can simply be viewed as an index of that coalition's objections to the
payoffs its members are receiving in the grand coalition. The coalition which objects most strongly to
the proposed allocation x is the one with the greatest excess. If this excess is positive, the proposed
allocation is outside the core; if it is negative, the allocation is acceptable, but the coalition
nevertheless has an interest in obtaining the smallest possible excess. Thus, it is appealing to look for
an allocation that minimizes the maximum unhappiness. Schmeidler (1969) went one step ahead and
proposed a new solution concept: the nucleolus of the game.
Let ( ) ( ) ( ){ }1 2 2,..., ne x e x e x
−= be a vector in 2 2n −
� the components of which are the excess listed
in a decreasing order, where S runs over the subset of N ( ),S N≠ ∅ . Thus, ( )1e x is the maximum
unhappiness created by the proposed allocation x . Thanks to these vectors, two allocations
, ( )x y I v∈ can be compared: x is preferred to y if ( )e x is lexicographically smaller16 than ( )e y ,
this is noted ( ) ( )Le x e y≤ . Schmeidler (1969) named the nucleolus of the game the set
( ) ( ) ( ) ( ) ( ){ }: ; for all LNu v x I v e x e y y I v= ∈ ≤ ∈ and he proved that the nucleolus is a unique
allocation. By construction, the nucleolus satisfies an appealing property: it always belongs to the core
when it is non-empty. From a computational perspective, Kopelowitz (1967) proposed an algorithm
for calculating the nucleolus by means of a sequence of linear programs. The computational procedure
used here relies on Granot et al. (1998) and Boyer et al. (2006).
Method 8: The "per capita" nucleolus
The nucleolus is entirely based on a measure of the unhappiness of a coalition with respect to a
proposed allocation. But there is some arbitrariness in the definition of the metric. This led Grotte
(1970) to define a variant, named the per capita nucleolus (also named normalized nucleolus), which is
based on a per capita measure of the excesses. In this allocation, the unhappiness of a coalition S with
respect to a proposed allocation x is simply measured with ( )( )
,i
i S
v S xe S x
S∈
−=
�.
16 It means that there are no index { }1,..., 2 2nu ∈ − so that ( ) ( )u ue x e y≥ and ( ) ( )t te x e y= for all t u< .
- 20 / 34 -
Method 9: The disruption nucleolus
This other variant of the nucleolus is due to Gately (1974) who, in a 3-person game, proposed an
additional concept named "propensity to disrupt" a given allocation that was later extended to n-person
games by Littlechild and Vaidya (1976). For a given allocation vector x , the propensity to disrupt,
denoted ( ),PD x S , of any coalition ( ) ,S N S N⊂ ≠ ∅ , is defined as the ratio of the total amount
which the complementary coalition \N S would lose if the grand coalition broke up, to the loss
incurred by the coalition S itself if that coalition refused to cooperate, i.e.:
( )( )
( )\
\,
ll N S
ii S
x v N SPD x S
x v S
∈
∈
−=
−
�
�
Suppose that only strict core17 allocations are proposed to the members of the grand coalition N . It is
clear that the propensity of a given subgroup S to disrupt this grand coalition becomes larger when its
payment becomes smaller (in such a case, the payment received by \N S increases). It can even rise
to infinity, reflecting an aspiration to quit the agreement, as the gain share of S approaches its
minimum ( )v S . Littlechild and Vaidya (1976) proposed using this ratio as a dissatisfaction measure
to be minimized in a lexicographic sense. The resulting unique allocation is named disruption
nucleolus. By construction, it also belongs to the strict core if it is non-empty. To compute that
allocation, we rely on the computational procedure described in Littlechild and Vaidya (1976).
4. Results
In this section, we comment on the results obtained with these gain-sharing methods on three different
TU-games: ( )2006 2006,N v , ( )2007 2007,N v and ( )2008 2008,N v for which the collective annual gain to be
shared is equal to $746.20 million, $968.31 million and $987.21 million respectively.
4.1 Preliminary comments
The results obtained with these nine allocation methods are reported in Table 11 in Appendix C. To
begin with, the marginal contribution scheme cannot be considered as a workable allocation
mechanism as it is not an efficient rule for the GECF. Yet, this method provides an indication of the
relative importance of the different actors. And there are large differences among them. Taking year
2007 as an example, these marginal contributions vary from a limited $0.7 million for Brunei to $459
17 The strict core is defined as ( ) ( ) ( ): , , and i i
i S i N
x C v x v S S N S x v N∈ ∈
� �∈ > ⊂ ≠ ∅ =� �
� � .
- 21 / 34 -
million for Qatar – more than 47% of the total annual gains. Those differences obviously depend on
factors such as pre-cooperation export policies or costs differences. Anyway, these results suggest that
Qatar’s participation is very important for the whole cooperation and should thus be appropriately
rewarded.
Whatever the year considered, proportional methods differ significantly from the others. These
differences are noteworthy for Qatar and South East Asian exporters (Brunei, Indonesia and
Malaysia). With proportional methods, Qatar’s share is not that different from those received by other
exporters, which is somehow astonishing given the presupposed importance of Qatar for the grand
coalition (because of its marginal contributions). By contrast, these allocations provide large gains to
South East Asian exporters. The three "lexicography inspired" methods all provide equivalent rankings
of the shares to be earned in a given year. In the 2007 example, Qatar would have received the largest
share, followed by Egypt, Algeria, Nigeria, Trinidad & Tobago, Indonesia, Malaysia, Oman, UAE,
Equatorial Guinea, Libya and Brunei. Moreover, the nucleolus and the per capita nucleolus schemes
provide similar numerical results.
4.2 Checking the method’s properties
Group rationality
Excepted for the marginal contribution, all these allocation methods are elements of the imputation set
( )I v and individual exporters thus have an incentive to join the cooperation. But do those allocations
provide an incentive to cooperate for each of the other ( )2 2n n− − non-trivial and non individual
subgroups that could be formed in N ? By construction, this verification is obviously not required for
the nucleolus-inspired allocations since the cores of these three games are non-empty.
For some other methods, a simple observation of the allocation results listed in Table 11 can be
sufficient to prove that some methods do not belong to the core. With proportional schemes, the share
allocated to some individual participants i like Oman, Libya, Brunei, Indonesia and Malaysia would
be too large since it would exceed i 's marginal contributions im . Reframed in a cross-subsidy's
context (Faulhaber, 1975), it simply means that those allocations would "unduly" favor these
individual exporters i at the expense of those involved in the complementary coalitions \N i . Each
of those complementary coalitions \N i could thus rightly prefer to stay away from any GECF
agreement based on these proportional schemes.
According to the results of a complete enumeration presented in Table 6, a similar line of arguments
could also be proposed for numerous non-trivial coalitions. Compared to the proportional methods, both
the Shapley value and the ACA method appear somewhat more appropriate since the number of
- 22 / 34 -
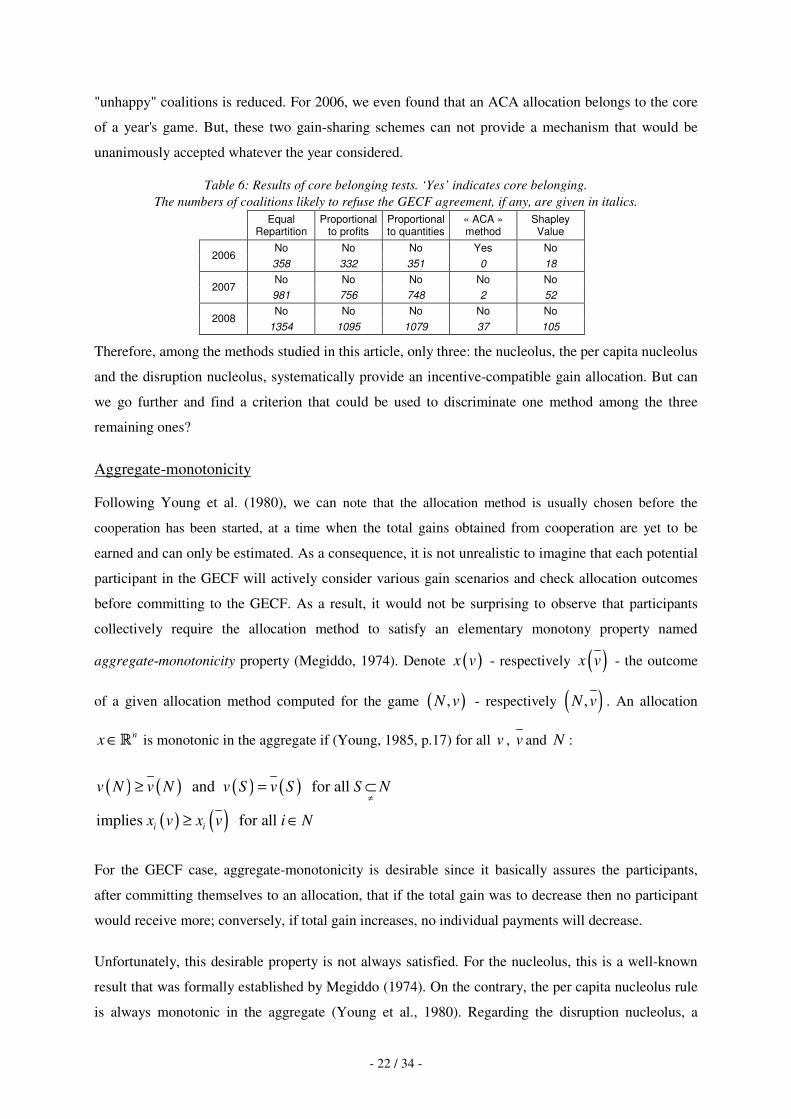
"unhappy" coalitions is reduced. For 2006, we even found that an ACA allocation belongs to the core
of a year's game. But, these two gain-sharing schemes can not provide a mechanism that would be
unanimously accepted whatever the year considered.
Table 6: Results of core belonging tests. ‘Yes’ indicates core belonging. The numbers of coalitions likely to refuse the GECF agreement, if any, are given in italics.
Equal
Repartition Proportional
to profits Proportional to quantities
« ACA » method
Shapley Value
No No No Yes No 2006
358 332 351 0 18 No No No No No
2007 981 756 748 2 52 No No No No No
2008 1354 1095 1079 37 105
Therefore, among the methods studied in this article, only three: the nucleolus, the per capita nucleolus
and the disruption nucleolus, systematically provide an incentive-compatible gain allocation. But can
we go further and find a criterion that could be used to discriminate one method among the three
remaining ones?
Aggregate-monotonicity
Following Young et al. (1980), we can note that the allocation method is usually chosen before the
cooperation has been started, at a time when the total gains obtained from cooperation are yet to be
earned and can only be estimated. As a consequence, it is not unrealistic to imagine that each potential
participant in the GECF will actively consider various gain scenarios and check allocation outcomes
before committing to the GECF. As a result, it would not be surprising to observe that participants
collectively require the allocation method to satisfy an elementary monotony property named
aggregate-monotonicity property (Megiddo, 1974). Denote ( )x v - respectively ( )x v - the outcome
of a given allocation method computed for the game ( ),N v - respectively ( ),N v . An allocation
nx ∈� is monotonic in the aggregate if (Young, 1985, p.17) for all v , v and N :
( ) ( ) ( ) ( )( ) ( )
and for all
implies for all i i
v N v N v S v S S N
x v x v i N
≠≥ = ⊂
≥ ∈
For the GECF case, aggregate-monotonicity is desirable since it basically assures the participants,
after committing themselves to an allocation, that if the total gain was to decrease then no participant
would receive more; conversely, if total gain increases, no individual payments will decrease.
Unfortunately, this desirable property is not always satisfied. For the nucleolus, this is a well-known
result that was formally established by Megiddo (1974). On the contrary, the per capita nucleolus rule
is always monotonic in the aggregate (Young et al., 1980). Regarding the disruption nucleolus, a
- 23 / 34 -
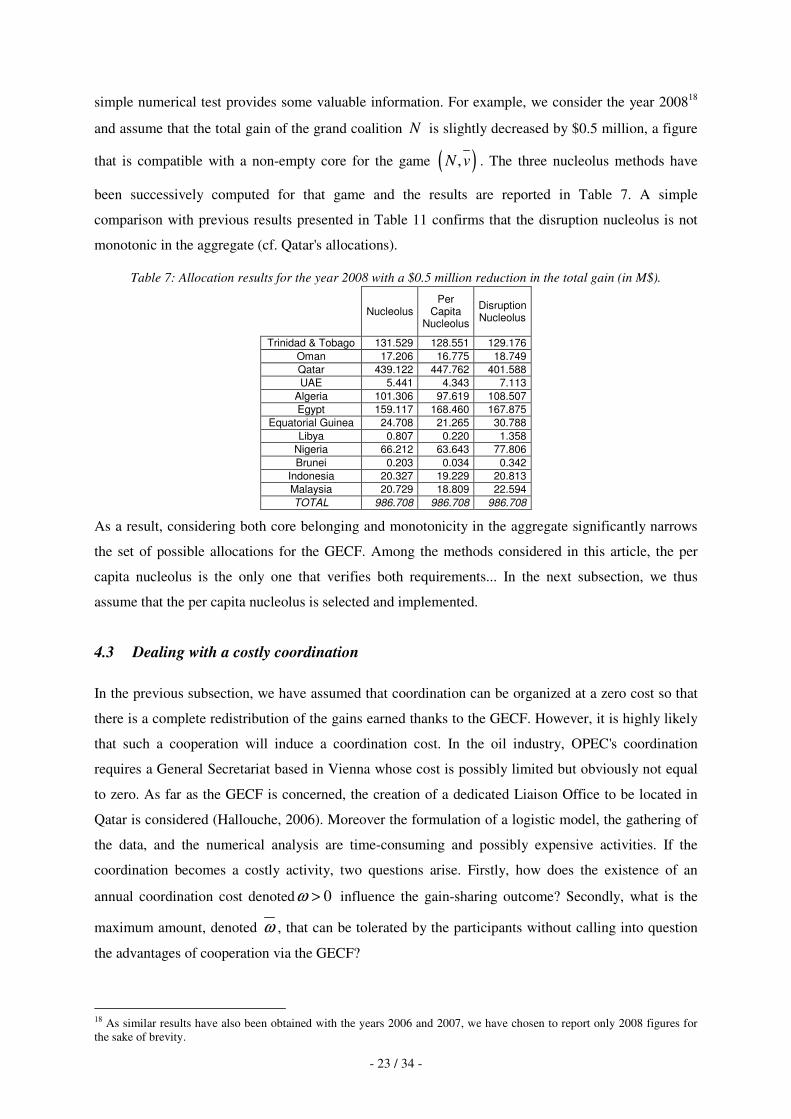
simple numerical test provides some valuable information. For example, we consider the year 200818
and assume that the total gain of the grand coalition N is slightly decreased by $0.5 million, a figure
that is compatible with a non-empty core for the game ( ),N v . The three nucleolus methods have
been successively computed for that game and the results are reported in Table 7. A simple
comparison with previous results presented in Table 11 confirms that the disruption nucleolus is not
monotonic in the aggregate (cf. Qatar's allocations).
Table 7: Allocation results for the year 2008 with a $0.5 million reduction in the total gain (in M$).
Nucleolus Per
Capita Nucleolus
Disruption Nucleolus
Trinidad & Tobago 131.529 128.551 129.176 Oman 17.206 16.775 18.749 Qatar 439.122 447.762 401.588 UAE 5.441 4.343 7.113
Algeria 101.306 97.619 108.507 Egypt 159.117 168.460 167.875
Equatorial Guinea 24.708 21.265 30.788 Libya 0.807 0.220 1.358
Nigeria 66.212 63.643 77.806 Brunei 0.203 0.034 0.342
Indonesia 20.327 19.229 20.813 Malaysia 20.729 18.809 22.594 TOTAL 986.708 986.708 986.708
As a result, considering both core belonging and monotonicity in the aggregate significantly narrows
the set of possible allocations for the GECF. Among the methods considered in this article, the per
capita nucleolus is the only one that verifies both requirements... In the next subsection, we thus
assume that the per capita nucleolus is selected and implemented.
4.3 Dealing with a costly coordination
In the previous subsection, we have assumed that coordination can be organized at a zero cost so that
there is a complete redistribution of the gains earned thanks to the GECF. However, it is highly likely
that such a cooperation will induce a coordination cost. In the oil industry, OPEC's coordination
requires a General Secretariat based in Vienna whose cost is possibly limited but obviously not equal
to zero. As far as the GECF is concerned, the creation of a dedicated Liaison Office to be located in
Qatar is considered (Hallouche, 2006). Moreover the formulation of a logistic model, the gathering of
the data, and the numerical analysis are time-consuming and possibly expensive activities. If the
coordination becomes a costly activity, two questions arise. Firstly, how does the existence of an
annual coordination cost denoted 0ω > influence the gain-sharing outcome? Secondly, what is the
maximum amount, denoted ω , that can be tolerated by the participants without calling into question
the advantages of cooperation via the GECF?
18 As similar results have also been obtained with the years 2006 and 2007, we have chosen to report only 2008 figures for the sake of brevity.
- 24 / 34 -
Incidence on the gain-sharing outcome
Regarding the impact on the per capita nucleolus outcome, the demonstration in Young et al. (1980)
provides a nice answer. If we assume that a costly GECF can be described by the game ( ),N v with a
reference to the zero-cost case ( ),N v so that v is defined as: ( ) ( )v N v N ω= − and
( ) ( )v S v S= for all S N≠⊂ , the per capita nucleolus ( )x v of the game ( ),N v can also be described
from those of game ( ),N v . In the costly case, each country i receives ( ) ( )i ix v x vnω= − , which
corresponds to an equal repartition of the coordination costs. In passing, we can note that applying an
OPEC-inspired institutional organization to the GECF is an issue frequently raised by GECF observers
and it is interesting to see that this coordination cost sharing rule is precisely the one used by the
OPEC (OPEC Statute, 2008, art. 37, p.21).
The maximum coordination cost
The second question can be reframed as finding the maximum ω compatible with a non-empty core
for the game ( ),N v . Again, solving a simple linear programing problem provides the answer:
Program n°4
( )
( ) ( )
( )
,
1
s.t.
,
0 , 0 , 1,2,...,
ix
n
ii
ii S
i
Max
x v N
x v S S N S N
x i n
ωω ω
ω
ω
=
∈
=
+ =
≥ ⊂ ≠
≥ ≥ =
�
�
With previous assumptions, we found some particularly low values for ω : $1.072 million for the year
2006, $0.721 million for the year 2007 and $0.905 million for 2008. Any greater amount can be
considered as unsustainable because it corresponds to an empty core situation.
By construction, with ω ω= , there is at least one coalition 'S N⊂ for which any allocation x in the
core of ( ),N v satisfies ( )'
'ii S
x v S∈
=� . Such a coalition 'S has thus an infinite propensity to disrupt
and is perfectly indifferent between (1) cooperating within the GECF (and hence contributing to ω ) or
(2) staying on its own. Obviously, this remark suggests that a zero coordination cost has been
implicitly assumed for any subgroup ,S N S N⊂ ≠ . Hence, we are supposing that 'S is able to earn
( )'v S without incurring any coordination costs even if the cardinality 'S is large. It means that the
- 25 / 34 -
coordination cost ( )Cc S of a given subgroup S N⊆ is equal to ω if S N= and to zero when
( ) ,S N S N⊂ ≠ ∅ . An assumption of the amount of coordination costs incurred by S as a function
of S could certainly be needed to get a more realistic representation. As a result, we have tested
various functional forms for these coordination costs but our results remain consistent with the
conclusion that the GECF cannot afford large coordination costs19.
Obviously, the coordination of these exportation policies can be a complex task. Given the very low
figures found for ω , it is clear that even a limited coordination cost can be enough to lead to an empty
core situation. In this unfortunate situation, whatever the proposed gain-sharing method, there is
always at least one coalition that can rightly protest against the allocation outcome.
4.4 Further discussion: a cooperation without money transfers?
Given that a gain redistribution policy may be difficult to agree upon, it may be worthwhile to
consider a case where players cannot transfer these gains amongst themselves20. That subsection offers
some preliminary insights in that direction.
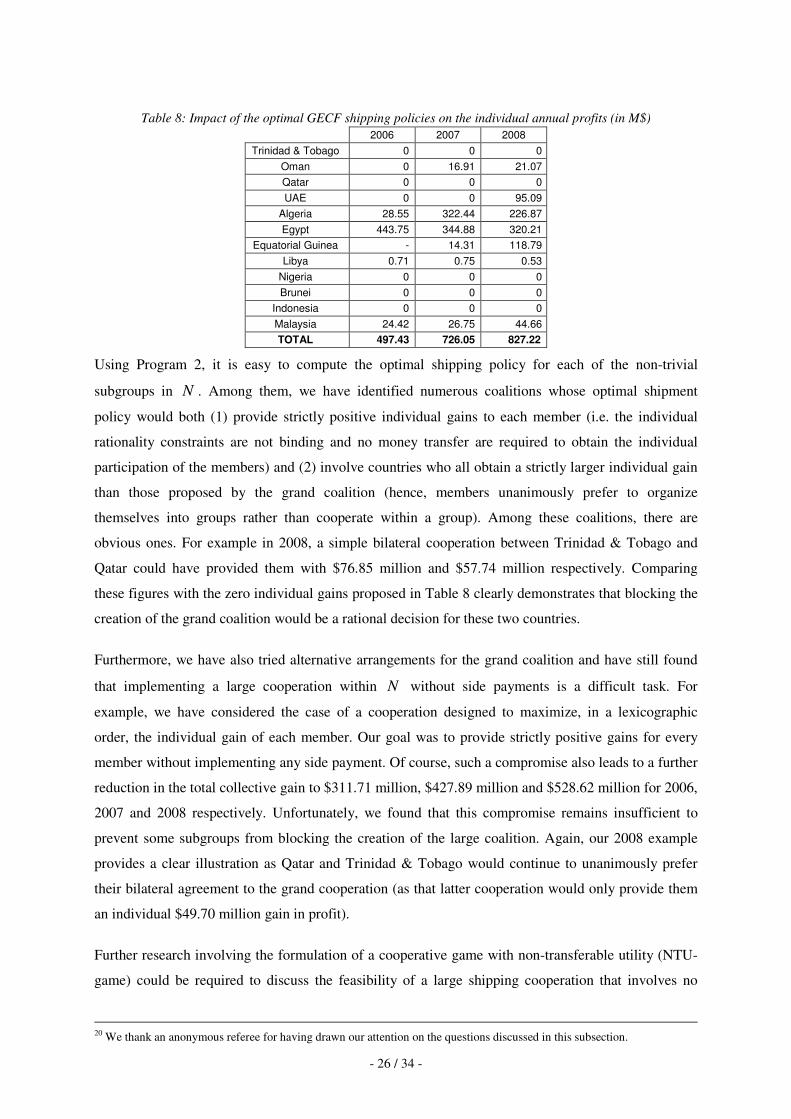
In fact, a simple adaptation of the previous framework is sufficient to assess the maximum collective
gain that could be achieved by an incentive-compatible cooperation without any money transfers. That
assessment has been obtained by adding n participation constraints to “Program 1”:
( ) ( )i i i iq Qπ π≥ , i∀ . As expected, the inclusion of these additional constraints further reduces the
annual collective gain: -33% in 2006, -25% in 2007 and -16% in 2008 (cf. Table 8). Moreover, some
countries (e.g.: Trinidad & Tobago, Qatar, Nigeria...) derive no individual gain from their participation
to N and thus remain indifferent between a stand alone attitude and a cooperation within the grand
coalition.
At this stage, it may be worthwhile analyzing whether some exporters may be willing to block, or not,
the creation of that large cooperation. For a given coalition S N⊂ , comparing the individual gain
improvements proposed by S with those proposed in Table 8 provides a useful indication on the
attitude of S toward the grand cooperation. Any coalition S able to provide individual gains ( )iv S
to its members i that are all strictly larger than their counterpart ( )iv N proposed by the grand
coalition is said to block N . Evidently, all the exporters involved in such a coalition S would
unanimously prefer to cooperate within S than within N .
19 For example, in the 2007 game, the maximum cost ω remains as low as $4.153 million with a quadratic cost like
( ) ( )2. 1Cc S Sρ= − where ( )2
1nρ ω= − for ( ) S N S⊆ ≠ ∅ .
- 26 / 34 -
Table 8: Impact of the optimal GECF shipping policies on the individual annual profits (in M$)
2006 2007 2008 Trinidad & Tobago 0 0 0
Oman 0 16.91 21.07 Qatar 0 0 0 UAE 0 0 95.09
Algeria 28.55 322.44 226.87 Egypt 443.75 344.88 320.21
Equatorial Guinea - 14.31 118.79 Libya 0.71 0.75 0.53
Nigeria 0 0 0 Brunei 0 0 0
Indonesia 0 0 0 Malaysia 24.42 26.75 44.66 TOTAL 497.43 726.05 827.22
Using Program 2, it is easy to compute the optimal shipping policy for each of the non-trivial
subgroups in N . Among them, we have identified numerous coalitions whose optimal shipment
policy would both (1) provide strictly positive individual gains to each member (i.e. the individual
rationality constraints are not binding and no money transfer are required to obtain the individual
participation of the members) and (2) involve countries who all obtain a strictly larger individual gain
than those proposed by the grand coalition (hence, members unanimously prefer to organize
themselves into groups rather than cooperate within a group). Among these coalitions, there are
obvious ones. For example in 2008, a simple bilateral cooperation between Trinidad & Tobago and
Qatar could have provided them with $76.85 million and $57.74 million respectively. Comparing
these figures with the zero individual gains proposed in Table 8 clearly demonstrates that blocking the
creation of the grand coalition would be a rational decision for these two countries.
Furthermore, we have also tried alternative arrangements for the grand coalition and have still found
that implementing a large cooperation within N without side payments is a difficult task. For
example, we have considered the case of a cooperation designed to maximize, in a lexicographic
order, the individual gain of each member. Our goal was to provide strictly positive gains for every
member without implementing any side payment. Of course, such a compromise also leads to a further
reduction in the total collective gain to $311.71 million, $427.89 million and $528.62 million for 2006,
2007 and 2008 respectively. Unfortunately, we found that this compromise remains insufficient to
prevent some subgroups from blocking the creation of the large coalition. Again, our 2008 example
provides a clear illustration as Qatar and Trinidad & Tobago would continue to unanimously prefer
their bilateral agreement to the grand cooperation (as that latter cooperation would only provide them
an individual $49.70 million gain in profit).
Further research involving the formulation of a cooperative game with non-transferable utility (NTU-
game) could be required to discuss the feasibility of a large shipping cooperation that involves no
20 We thank an anonymous referee for having drawn our attention on the questions discussed in this subsection.
- 27 / 34 -
money transfers. This is beyond the scope of this article. Nevertheless, these preliminary insights
suggest that the creation of such an organization would face large complexities.
Conclusions
Since the mid-2000s we are seeing heightened concern about the future of the GECF and the possible
emergence of a cartel in the gas industry. These debates have received considerable publicity
especially for the LNG trade. As a consequence, many authors have proposed a detailed description of
the GECF. Apart from rare exceptions, most of those contributions present a strict geopolitical
approach and lack a clear economic analysis. This paper attempts to illustrate how some quantitative
techniques can be used to address an important issue: What behavior will the GECF adopt in the
future?
Many industrial observers share an idealized view of how cooperation among LNG exporters could be
entirely devoted to the promotion of a purely logistic cooperation. In most cases, there is no room for
market power issues in those mental constructions. We thus adopted this strong behavioral assumption
and supposed that the GECF’s objective can be reframed as the identification of optimum routes and
schedules for a fleet of vessels carrying participants’ LNG throughout the world. This paper
investigates the rationale of such an association of LNG exporters by means of a simple transportation
model. In this particular instance of a transportation problem, cooperation is found to be collectively
profitable since there is a potential for a reduction of the lengths of actual supply chains. But, results
also indicate that some countries could rationally prefer to stay away from the GECF unless a
redistribution mechanism was implemented. Thanks to a cooperative game theory framework, we
show that the logistic cooperation at hand corresponds to a super-additive TU-game whose core is
non-empty. Several classic allocation concepts (basic sharing methods, the Shapley value and
nucleolus-inspired methods) have been implemented and analyzed in the light of two desirable
axiomatic properties. Firstly, core belonging is considered as an imperative prerequisite since it
eliminates possible contestation to the proposed redistribution scheme. Then, aggregate-monotonicity
is checked in order to promote the methods that are able to adapt to changing conditions of the total
value to be shared. Out of the methods studied, only one - the per capita nucleolus – satisfies both
criterions. Thus, the range of conceivable methods appears significantly narrower than expected.
Moreover, this nucleolus-inspired method is somewhat complicated and requires detailed information
on costs, distances... From a strict practical perspective, some doubts can be raised on the capability of
the GECF to implement such a non-trivial allocation. Lastly, coordination costs were considered. Our
results indicate that a limited amount of coordination costs could be sufficient to deny the possibility
of finding a core-belonging allocation of the gains, thus creating some incentive for a split up of the
grand coalition.
- 28 / 34 -
Of course, there are several improvements that could be included in this simple model, notably the
existence of potentially large LNG exporters such as Russia, Iran and Venezuela. All these countries
do not yet export any volume of LNG but are expected to do so and are already involved in GECF
meetings. Compared to the simple static model presented in this paper, the number of participants
would climb to at least 15 players and a dynamic framework would have to be implemented so as to
capture the essence of the potentially complex interactions among those players. Moreover, such a
dynamic approach would enable us to see how the existence of heterogeneous reserve endowments
could affect cooperation outcomes. Of course, it would result in an increased complexity that would
also be reflected in the gain-sharing issue.
As a consequence, it seems clear that a pure logistic cooperation in the LNG industry faces a complex
gain-sharing problem that can hardly be tackled by trivial methods. This conclusion provides an
argument in the sense that this strong behavioral assumption is not so realistic for the GECF and thus
has to be reconsidered. As an alternative, the ability to exert some market power, so as to raise prices
in consuming regions, can be posited. Such a behavior would obviously enlarge the collective gains of
"the conspirators" but there is no free lunch since well-known cartel problems would emerge as well:
1) predicting and, if possible, discouraging production by non-members; 2) finding a unanimously
accepted contract to share the gains; 3) detecting and deterring cheating. Further research is thus
needed to analyze the GECF's possible behavior patterns in an imperfect competition framework.
References
Boots, M.G., Rijkers, F.A.M., Hobbs, B.F., 2004. Trading in the downstream European gas market: a
successive oligopoly approach. The Energy Journal 25(3), 73–102.
BP, 2008. BP Statistical Review of World Energy. BP, London.
Boyer, M., Moreaux, M., Truchon, M., Partage des coûts et tarification des infrastructures,
Monographie CIRANO 2006MO-01, Mars 2006, CIRANO, Montréal.
Brito D.L, Hartley P.R., 2007. Expectations and the Evolving World Gas Market, The Energy Journal
28 (1), 1–24.
Brown S., Yücel M., 2009. Market Arbitrage: European and North American Natural Gas Prices. The
Energy Journal Special issue: World Natural Gas Markets and Trade: A Multi-Modelling Perspective,
167-185.
Cremer J., Weitzman M., 1976. OPEC and the Monopoly Price of World Oil. European Economic
Review 8, 155-164.
- 29 / 34 -
Dantzig, G. B. 1951. Application of the simplex method to a transportation problem. In Koopmans, T.
C. (ed.), Activity Analysis of Production and Allocation, John Wiley& Sons:NY; 1951. 359-373.
DTI, 2005. UK Capability in the LNG Global Market. Department of Trade and Industry, Energy
Technologies and Industries Unit. London.
Egging R., Gabriel S.A., Holz F., Zhuang J., 2008. A complementarity model for the European natural
gas market. Energy Policy 36(7), 2385-2414.
EMF (Energy Modeling Forum), 2007. Prices and Trade in a Globalizing Natural Gas Market, EMF
Report 23, July 2007. Stanford University. Stanford.
Engevall S., Göthe-Lundgren M., Värbrand P., 1998. The traveling salesman game: An application of
cost allocation in a gas and oil company. Annals of Operations Research 82(1), 453-472.
Faulhaber G.R., 1975. Cross-subsidization: pricing in public enterprises. American Economic Review
65(5), 966-977.
Finon D., 2007. Russia and the "Gas-OPEC". Real or Perceived Threat? IFRI Russia/NIS Center,
Paris.
Flood M. M., 1954. Application of Transportation Theory to Scheduling a Military Tanker Fleet.
Journal of the Operations Research Society of America 2(2), 150-162.
Gately D., 1974. Sharing the games from regional cooperation: a game theoretic application to
planning investment in electric power. International Economic Review 15, 195-208.
GIIGNL, 2008. The LNG Industry. GIIGNL, Paris.
Gillies, D.B. (1953) "Some theorems on n-Person games". Ph.D. Thesis, Princeton.
Golombek R., Gjelsvik E., Rosendahl K.E., 1995. Effects of liberalizing the natural gas markets in
Western Europe. The Energy Journal 16, 85–111.
Granot, D., F. Granot, Zhu W.R., 1998. On Characterization Sets for the Nucleolus, International
Journal of Game Theory 27, 359-374.
Greaker M, Sagen E., 2008. Explaining experience curves for new energy technologies: A case study
of liquefied natural gas. Energy Economics 30, 2899–2911
Grotte, J.H., 1970. Computation of and Observations on the Nucleolus, and the Central Games. M.Sc.
Thesis, Cornell University.
- 30 / 34 -
Hallouche H., 2006. The Gas Exporting Countries Forum: Is it really a Gas OPEC in the Making,
Oxford Institute for Energy Studies, NG 13, Oxford.
Hartley P., Medlock. K.B., 2006. Political and economic influences on the future world market for
natural gas. In Victor, D.G., Jaffe, A.M., Hayes, M. H. (Eds), Natural Gas and Geopolitics: From 1970
to 2040, chapter 12, Cambridge University Press; 2006.
Holz F., Hirschhausen C.v., Kemfert C., 2008. A Strategic Model of European Gas Supply
(GASMOD), Energy Economics 30(3), 766–788.
Huntington H. G. (ed.), 2009. World Natural Gas Markets and Trade: A Multi-Modelling Perspective,
The Energy Journal, Special issue.
Jaffe A.M., Soligo R. 2006. Market Structure in the New Gas Economy: Is Cartelization Possible? In
Victor, D.G., Jaffe, A.M., Hayes, M. H. (Eds), Natural Gas and Geopolitics: From 1970 to 2040,
chapter 11, Cambridge University Press; 2006.
Jensen J.T., 2003. The LNG revolution. The Energy Journal 24 (2), 14-58.
Jensen, J.T. The Development of a Global LNG Market. Is it Likely? If so When?, Oxford Institute for
Energy Studies, London; 2004.
Kantorovich L. V., 1960. Mathematical Methods of Organizing and Planning Production.
Management Science 6(4), 366-422.
Kattuman P.A., Green R.J., Bialek J.W., 2004. Allocating electricity transmission costs through
tracing: a game-theoretic rationale. Operations Research Letters 32 (2), 114-120.
Koopmans T., 1949. Optimum Utilization of the Transportation System. Econometrica 17, 136-145.
Kopelowitz A., 1967. Computation of the kernels of simple games and the nucleolus of n-person
games. RM-131, Mathematics Department, The Hebrew University of Jerusalem, Israel.
Littlechild S.C., Vaidya K.G., 1976. The propensity to disrupt and the disruption nucleolus of a
characteristic function game. International Journal of Game Theory 5, pp. 151–161.
Mandil C., 2008. "Bientôt une OPEP du gaz" Interview by Challenges magazine 22nd September 2008;
http://www.challenges.fr/actualites/finance_et_marches/20080922.CHA6616/bientot_une_opep_du_g
az_.html
- 31 / 34 -
Mathiesen L., Roland K., Thonstad K., 1987. The European Natural Gas Market. Degrees of Market
Power on the Selling Side. In Golombek and Hoel (eds.), Natural Gas Markets and Contracts, North
Holland Publ. Co., Amsterdam, 1987.
Mazighi A. E. H., 2003. An examination of the international natural gas trade, OPEC Review 27 (4),
313-329.
Moulin H. Axioms of Cooperative Decision Making: Monograph of the Econometric Society,
Cambridge University Press: Cambridge; 1991.
Megiddo N., 1974. On the nonmonotonicity of the bargaining set, the kernel, and the nucleolus of a
game. SIAM Journal of Applied Mathematics 27, 355-358.
Neumann A., 2009. Linking Natural Gas Markets – Is LNG Doing its Job? The Energy Journal
Special issue: World Natural Gas Markets and Trade: A Multi-Modelling Perspective, 187-199.
OME. Assessment of Internal and External Gas Supply Options for the EU - Evaluation of the Supply
Costs of New Natural Gas Supply Projects to the EU and an Investigation of Related Financial
Requirements and Tools. Observatoire Méditerranéen de l'Energie: Sophia-Antipolis; 2001.
OPEC (Organization of Petroleum Exporting Countries). OPEC Statute 2008, OPEC Secretariat:
Vienna; 2008.
Percebois J. L'économie de l'énergie, Editions Economica: Paris; 1989.
Percebois J., 2008. The supply of natural gas in the European Union—strategic issues, OPEC Energy
Review 32 (1), 33-53
Pierru A., 2007. Allocating the CO2 emissions of an oil refinery with Aumann–Shapley prices. Energy
Economics 29(3), 563-577.
Rosendahl K.E.and E. L. Sagen, 2009. The Global Natural Gas Market: Will Transport Cost
Reductions Lead to Lower Prices? The Energy Journal 30(2), 17-40.
Schmeidler D., 1969. The nucleolus of a characteristic function game. SIAM Journal on applied
mathematics 17, 1163-1170.
Shapley, L.S., 1953. A Value for n-Person Games. In Kuhn, H.W. and Tucker, A.W. (eds.)
Contributions to the Theory of Games, n. II, Annals of Math. Studies, 28. Princeton University Press;
1953. pp. 307-317.
- 32 / 34 -
Tijs S. H., Driessen T. S. H., 1986. Game Theory and Cost Allocation Problems, Management Science
32(8), 1015-1028.
Tönjes C., de Jong J. Perspectives on security of supply in European natural gas markets, CIEP,
Clingendael Institute:The Hague; 2007.
Wagbara O.N., 2007. How would the gas exporting countries forum influence gas trade? Energy
Policy 35(2), 1224-1237.
Wolak F.A., Kolstad C.D., 1988. Measuring Relative Market Power in the Western US Coal Market
Using Shapley Values. Resources and Energy 10, 293-314.
Yepes Rodríguez R., 2008. Real option valuation of free destination in long-term liquefied natural gas
supplies. Energy Economics 30(4), 1909-1932.
Yergin D., Stoppard M., 2003. The next prize. Foreign Affairs 82(6), 103-114.
Young H.P., Okada N., Hashimoto T., 1980. Cost Allocation in Water Resources Development. A
Case Study of Sweden. IIASA Research report, Laxenburg.
Young H.P., 1985. Methods and principles of cost allocation. In. H. Young. (Ed.) Cost Allocation:
Method, principles, applications. North-Holland: Amsterdam; 1985.
Zhuravleva P., 2009. The Nature of LNG Arbitrage: an Analysis of the Main Barriers to the Growth of
the Global LNG Arbitrage Market, Oxford Institute for Energy Studies, NG 31, Oxford.
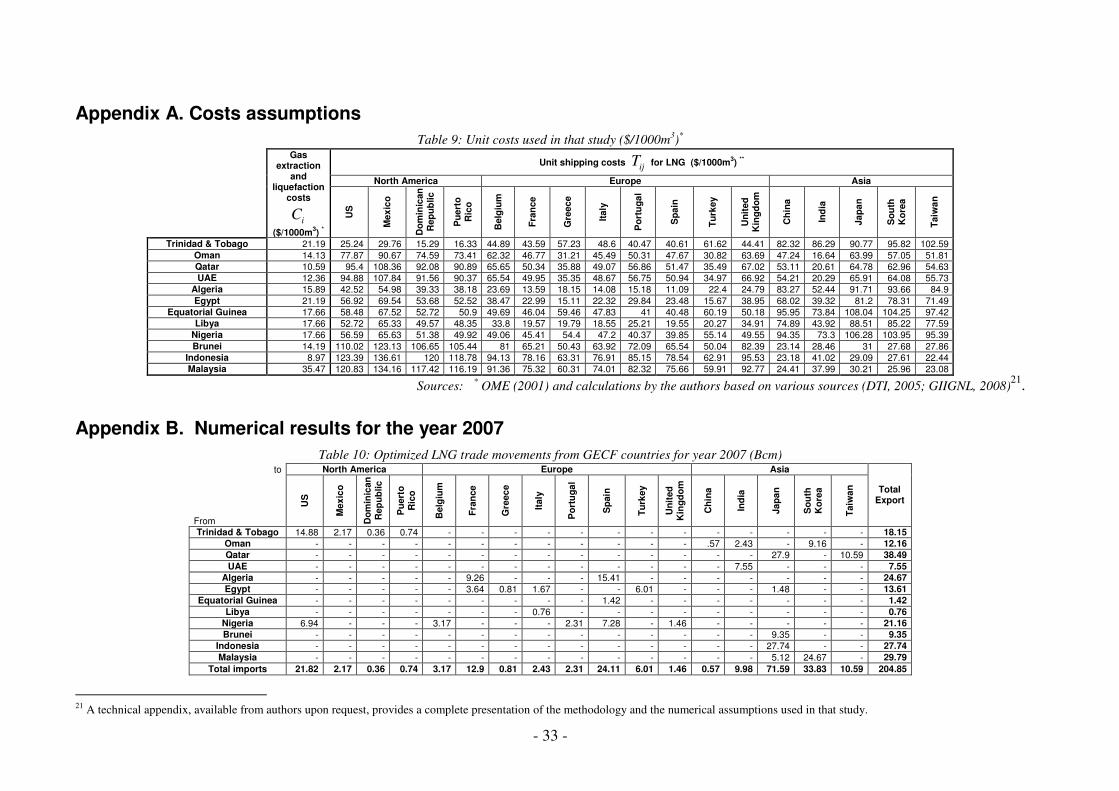
- 33 -
Appendix A. Costs assumptions Table 9: Unit costs used in that study ($/1000m3)*
Unit shipping costs ijT for LNG ($/1000m3) **
North America Europe Asia
Gas extraction
and liquefaction
costs
iC ($/1000m3) *
US
Mex
ico
Dom
inic
an
Rep
ublic
Pue
rto
Ric
o
Bel
gium
Fran
ce
Gre
ece
Italy
Por
tuga
l
Spa
in
Turk
ey
Uni
ted
Kin
gdom
Chi
na
Indi
a
Japa
n
Sou
th
Kor
ea
Taiw
an
Trinidad & Tobago 21.19 25.24 29.76 15.29 16.33 44.89 43.59 57.23 48.6 40.47 40.61 61.62 44.41 82.32 86.29 90.77 95.82 102.59 Oman 14.13 77.87 90.67 74.59 73.41 62.32 46.77 31.21 45.49 50.31 47.67 30.82 63.69 47.24 16.64 63.99 57.05 51.81 Qatar 10.59 95.4 108.36 92.08 90.89 65.65 50.34 35.88 49.07 56.86 51.47 35.49 67.02 53.11 20.61 64.78 62.96 54.63 UAE 12.36 94.88 107.84 91.56 90.37 65.54 49.95 35.35 48.67 56.75 50.94 34.97 66.92 54.21 20.29 65.91 64.08 55.73
Algeria 15.89 42.52 54.98 39.33 38.18 23.69 13.59 18.15 14.08 15.18 11.09 22.4 24.79 83.27 52.44 91.71 93.66 84.9 Egypt 21.19 56.92 69.54 53.68 52.52 38.47 22.99 15.11 22.32 29.84 23.48 15.67 38.95 68.02 39.32 81.2 78.31 71.49
Equatorial Guinea 17.66 58.48 67.52 52.72 50.9 49.69 46.04 59.46 47.83 41 40.48 60.19 50.18 95.95 73.84 108.04 104.25 97.42 Libya 17.66 52.72 65.33 49.57 48.35 33.8 19.57 19.79 18.55 25.21 19.55 20.27 34.91 74.89 43.92 88.51 85.22 77.59
Nigeria 17.66 56.59 65.63 51.38 49.92 49.06 45.41 54.4 47.2 40.37 39.85 55.14 49.55 94.35 73.3 106.28 103.95 95.39 Brunei 14.19 110.02 123.13 106.65 105.44 81 65.21 50.43 63.92 72.09 65.54 50.04 82.39 23.14 28.46 31 27.68 27.86
Indonesia 8.97 123.39 136.61 120 118.78 94.13 78.16 63.31 76.91 85.15 78.54 62.91 95.53 23.18 41.02 29.09 27.61 22.44 Malaysia 35.47 120.83 134.16 117.42 116.19 91.36 75.32 60.31 74.01 82.32 75.66 59.91 92.77 24.41 37.99 30.21 25.96 23.08
Sources: * OME (2001) and calculations by the authors based on various sources (DTI, 2005; GIIGNL, 2008)21.
Appendix B. Numerical results for the year 2007 Table 10: Optimized LNG trade movements from GECF countries for year 2007 (Bcm)
to North America Europe Asia
From
US
Mex
ico
Dom
inic
an
Rep
ublic
Pue
rto
Ric
o
Bel
gium
Fran
ce
Gre
ece
Italy
Por
tuga
l
Spa
in
Turk
ey
Uni
ted
Kin
gdom
Chi
na
Indi
a
Japa
n
Sou
th
Kor
ea
Taiw
an
Total Export
Trinidad & Tobago 14.88 2.17 0.36 0.74 - - - - - - - - - - - - - 18.15 Oman - - - - - - - - - - - - .57 2.43 - 9.16 - 12.16 Qatar - - - - - - - - - - - - - - 27.9 - 10.59 38.49 UAE - - - - - - - - - - - - - 7.55 - - - 7.55
Algeria - - - - - 9.26 - - - 15.41 - - - - - - - 24.67 Egypt - - - - - 3.64 0.81 1.67 - - 6.01 - - - 1.48 - - 13.61
Equatorial Guinea - - - - - - - - - 1.42 - - - - - - - 1.42 Libya - - - - - - - 0.76 - - - - - - - - - 0.76
Nigeria 6.94 - - - 3.17 - - - 2.31 7.28 - 1.46 - - - - - 21.16 Brunei - - - - - - - - - - - - - - 9.35 - - 9.35
Indonesia - - - - - - - - - - - - - - 27.74 - - 27.74 Malaysia - - - - - - - - - - - - - - 5.12 24.67 - 29.79
Total imports 21.82 2.17 0.36 0.74 3.17 12.9 0.81 2.43 2.31 24.11 6.01 1.46 0.57 9.98 71.59 33.83 10.59 204.85
21 A technical appendix, available from authors upon request, provides a complete presentation of the methodology and the numerical assumptions used in that study.
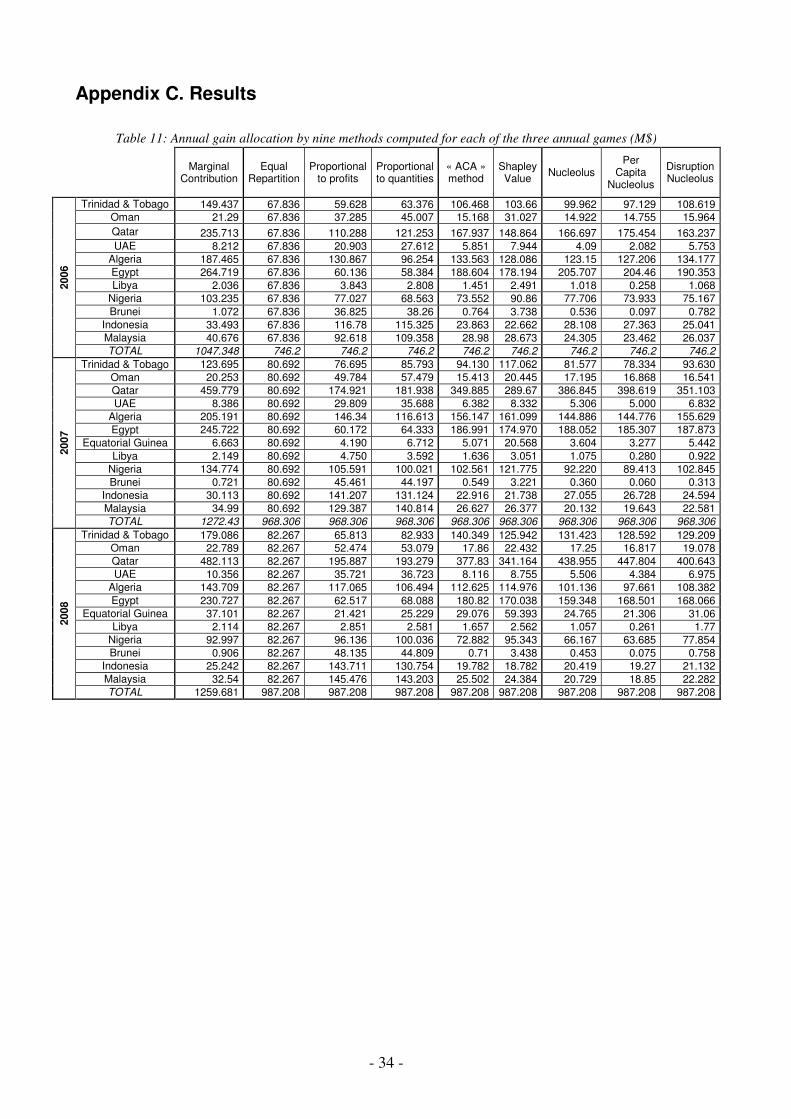
- 34 -
Appendix C. Results
Table 11: Annual gain allocation by nine methods computed for each of the three annual games (M$)
Marginal Contribution
Equal Repartition
Proportional to profits
Proportional to quantities
« ACA » method
Shapley Value Nucleolus
Per Capita
Nucleolus
Disruption Nucleolus
Trinidad & Tobago 149.437 67.836 59.628 63.376 106.468 103.66 99.962 97.129 108.619 Oman 21.29 67.836 37.285 45.007 15.168 31.027 14.922 14.755 15.964 Qatar 235.713 67.836 110.288 121.253 167.937 148.864 166.697 175.454 163.237 UAE 8.212 67.836 20.903 27.612 5.851 7.944 4.09 2.082 5.753
Algeria 187.465 67.836 130.867 96.254 133.563 128.086 123.15 127.206 134.177 Egypt 264.719 67.836 60.136 58.384 188.604 178.194 205.707 204.46 190.353 Libya 2.036 67.836 3.843 2.808 1.451 2.491 1.018 0.258 1.068
Nigeria 103.235 67.836 77.027 68.563 73.552 90.86 77.706 73.933 75.167 Brunei 1.072 67.836 36.825 38.26 0.764 3.738 0.536 0.097 0.782
Indonesia 33.493 67.836 116.78 115.325 23.863 22.662 28.108 27.363 25.041 Malaysia 40.676 67.836 92.618 109.358 28.98 28.673 24.305 23.462 26.037
2006
TOTAL 1047.348 746.2 746.2 746.2 746.2 746.2 746.2 746.2 746.2 Trinidad & Tobago 123.695 80.692 76.695 85.793 94.130 117.062 81.577 78.334 93.630
Oman 20.253 80.692 49.784 57.479 15.413 20.445 17.195 16.868 16.541 Qatar 459.779 80.692 174.921 181.938 349.885 289.67 386.845 398.619 351.103 UAE 8.386 80.692 29.809 35.688 6.382 8.332 5.306 5.000 6.832
Algeria 205.191 80.692 146.34 116.613 156.147 161.099 144.886 144.776 155.629 Egypt 245.722 80.692 60.172 64.333 186.991 174.970 188.052 185.307 187.873
Equatorial Guinea 6.663 80.692 4.190 6.712 5.071 20.568 3.604 3.277 5.442 Libya 2.149 80.692 4.750 3.592 1.636 3.051 1.075 0.280 0.922
Nigeria 134.774 80.692 105.591 100.021 102.561 121.775 92.220 89.413 102.845 Brunei 0.721 80.692 45.461 44.197 0.549 3.221 0.360 0.060 0.313
Indonesia 30.113 80.692 141.207 131.124 22.916 21.738 27.055 26.728 24.594 Malaysia 34.99 80.692 129.387 140.814 26.627 26.377 20.132 19.643 22.581
2007
TOTAL 1272.43 968.306 968.306 968.306 968.306 968.306 968.306 968.306 968.306 Trinidad & Tobago 179.086 82.267 65.813 82.933 140.349 125.942 131.423 128.592 129.209
Oman 22.789 82.267 52.474 53.079 17.86 22.432 17.25 16.817 19.078 Qatar 482.113 82.267 195.887 193.279 377.83 341.164 438.955 447.804 400.643 UAE 10.356 82.267 35.721 36.723 8.116 8.755 5.506 4.384 6.975
Algeria 143.709 82.267 117.065 106.494 112.625 114.976 101.136 97.661 108.382 Egypt 230.727 82.267 62.517 68.088 180.82 170.038 159.348 168.501 168.066
Equatorial Guinea 37.101 82.267 21.421 25.229 29.076 59.393 24.765 21.306 31.06 Libya 2.114 82.267 2.851 2.581 1.657 2.562 1.057 0.261 1.77
Nigeria 92.997 82.267 96.136 100.036 72.882 95.343 66.167 63.685 77.854 Brunei 0.906 82.267 48.135 44.809 0.71 3.438 0.453 0.075 0.758
Indonesia 25.242 82.267 143.711 130.754 19.782 18.782 20.419 19.27 21.132 Malaysia 32.54 82.267 145.476 143.203 25.502 24.384 20.729 18.85 22.282
2008
TOTAL 1259.681 987.208 987.208 987.208 987.208 987.208 987.208 987.208 987.208