Embed Size (px)
Citation preview

Cootamundra Shire Council
Harden Shire Council
Merged Council Business Plan
Contents
Document Control ............................................................................................................. 2
Acronyms .......................................................................................................................... 3
Executive Summary ........................................................................................................... 4
The New Council ................................................................................................................ 5
The Local Government Area .............................................................................................. 5
Social and community context .......................................................................................... 6
Population and age structure ............................................................................................ 7
Regional Partnerships........................................................................................................ 8
Joint Organisation ........................................................................................................... 10
NSW Government Partnerships and State Planning Boundaries.................................... 12
Proposed JO boundaries within State Regional boundaries ................................. 12
Organisational Structure ................................................................................................. 14
New Council Organisation Chart ............................................................................ 15
Service Delivery Areas & Incorporated Functions ................................................. 15
Plant and depot ............................................................................................................... 16
Water and Sewer ............................................................................................................. 16
Offices .............................................................................................................................. 16
Corporate software systems ........................................................................................... 16
Political and managerial leadership ................................................................................ 17
Leadership .............................................................................................................. 17
Representation ...................................................................................................... 17
The Future ....................................................................................................................... 18
Vision statement ............................................................................................................. 18
Mission statement ........................................................................................................... 18
Strategic Priorities ........................................................................................................... 19
The Community ............................................................................................................... 22
Fit for the future .............................................................................................................. 22
Community engagement strategy................................................................................... 22
Public Exhibition Period ......................................................................................... 23
Community Response ..................................................................................................... 24
Staff consultation ............................................................................................................ 27
S.W.O.T. analysis (Strengths, Weaknesses, Opportunities and Threats) ........................ 28
The Merger Action Plan ................................................................................................... 30
Goals and objectives ....................................................................................................... 30
Merger strategies ............................................................................................................ 30
Productivity gains ............................................................................................................ 35
Human Resource Management ...................................................................................... 39
Workplace Governance and Culture...................................................................... 39
Employee Support and Development.................................................................... 39
Organisational Training Priorities .......................................................................... 40
Skill Retention Strategies ....................................................................................... 40
Workplace Equity & Diversity ................................................................................ 41
Page 1
Asset management .......................................................................................................... 42
Asset Management Capacity and Maturity ........................................................... 42
Financial Sustainability .................................................................................................... 45
Current financial position ................................................................................................ 45
Financial objectives ......................................................................................................... 46
Financial strategies .......................................................................................................... 47
Cash Reserves ........................................................................................................ 47
Borrowings ............................................................................................................. 47
Revenue policy ....................................................................................................... 48
Financial indicators .......................................................................................................... 49
Sustainability .......................................................................................................... 49
Infrastructure and Service Management ............................................................... 50
Efficiency ................................................................................................................ 50
Financial Statements ....................................................................................................... 51
Financial planning assumptions ...................................................................................... 52
Additional Funding .......................................................................................................... 53
Appendices...................................................................................................................... 54
Document Control
Date Status Version Resolution Description
14 Apr 15 Draft 0.1 - Information provided to Council Workshop
6 May 15 Draft 0.2 01/E05/15 Unanimously adopted for public exhibition by Cootamundra Shire Council.1
6 May 15 Draft 0.2 62/05/15 Unanimously adopted for public exhibition by Harden Shire Council.2
9 June 15 Draft 0.3 - Discussion and feedback at joint council workshop
15 June 15 Final 1.0 08/06/15 Cootamundra Shire Council resolved to submit the proposal.
17 June 15 Final 1.0 107/06/15 Harden Shire Council resolved to submit the proposal.
1 Minutes of the Extra-Ordinary Meeting of Cootamundra Shire Council held on 6th May 2015, page 8. 2 Minutes of the Extra-Ordinary Meeting of Harden Shire Council held on 6th May 2015 found at page 14 of 284 of the Reports for the Ordinary Meeting of Council held on 20th May 2015 http://www.harden.nsw.gov.au/f.ashx/20-5-2015-business-paper-public.pdf
Page 2
Acronyms
ABS Australian Bureau of Statistics ITC Information, technology and communications ACT Australian Capital Territory JO Joint organisation AMP Asset management plan LEP Local environmental plan CBRJO Canberra Region Joint Organisation LGA Local government area CENTROC Central NSW Councils LG NSW Local Government NSW CSP Community strategic plan LLS NSW Local Land Services DLG Division of Local Government OLG Office of Local Government FAGs Financial assistance grants RDA Regional Development Australia FTE Full time equivalent REROC Riverina Eastern Regional Organisation of
Councils GIS Geographic information system RMS NSW Roads and Maritime Services GM General Manager ROC Regional Organisation of Councils HR Human resources SEROC South East Regional Organisation of Councils ILGRP NSW Independent Local Government Review
Panel TCorp NSW Treasury Corporation
IPR Integrated Planning & Reporting WHS Work Health and Safety
Page 3
Executive Summary
The NSW Government is undertaking a significant local government reform agenda, and the Office of Local Government has advised that the Government’s objective is to:
Create strategic and Fit for the Future councils – councils that are financially sustainable; efficient; with the capacity to effectively manage infrastructure and deliver services; the scale, resources and strategic capacity to govern effectively and partner with the State; and has the capacity to reduce red tape and bureaucracy for business and of a scale and structure that is broadly in line with the Panel’s recommendations.3
Cootamundra and Harden Shire Councils have been working together to respond to the Government’s Fit for the Future local government reform agenda, and have identified that there is a significant opportunity to work better together, and create an even stronger new Council for the benefit of our communities.
The elected members, management and staff and communities of Harden and Cootamundra councils have worked together to develop this business plan. It represents the ideals of the unified leadership, the organisational approach of the management and staff, and the feedback and comments of the community.
Whilst this business plan presents the basis for a way forward, all decisions relating to the strategies and structure of the new Council will be made by the leadership and management of the new Council, once it is in place.
3 IPART Review of criteria for fit for the future, page 8.
Page 4
The New Council
The Local Government Area
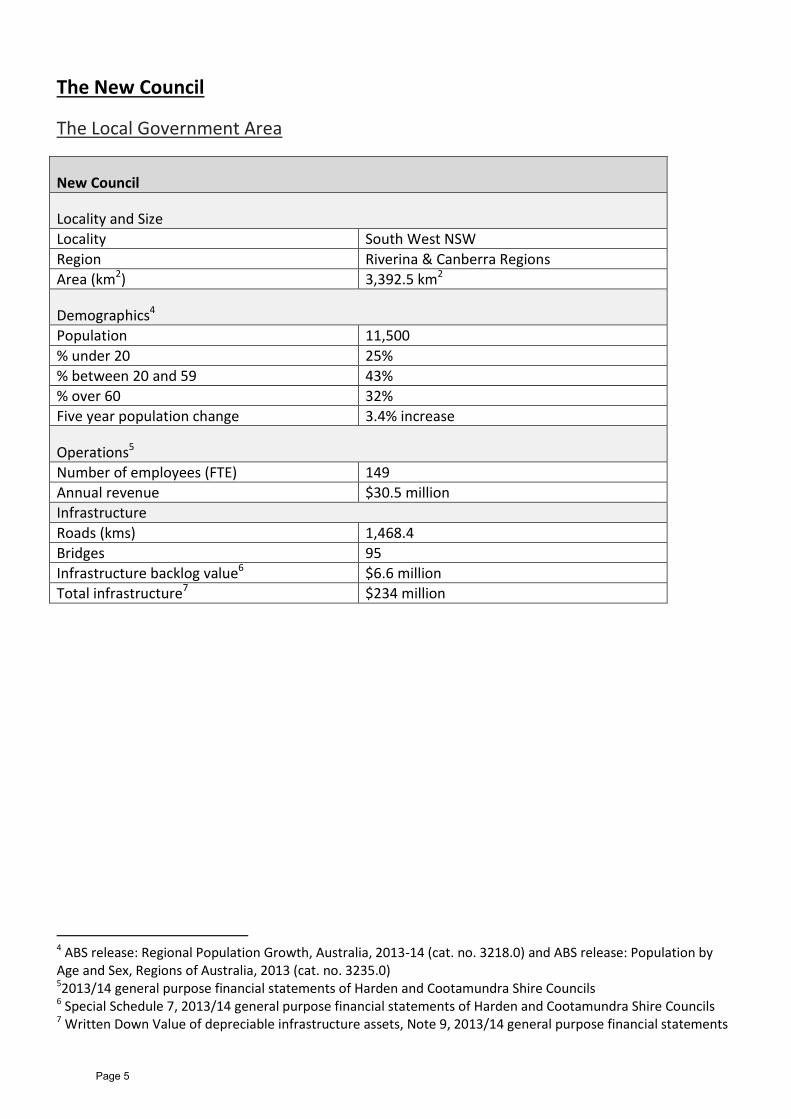
New Council
Locality and Size
Locality South West NSW
Region Riverina & Canberra Regions
Area (km2) 3,392.5 km2
Demographics4
Population 11,500
% under 20 25%
% between 20 and 59 43%
% over 60 32%
Five year population change 3.4% increase
Operations5
Number of employees (FTE) 149
Annual revenue $30.5 million
Infrastructure
Roads (kms) 1,468.4
Bridges 95
Infrastructure backlog value6 $6.6 million
Total infrastructure7 $234 million
4 ABS release: Regional Population Growth, Australia, 2013-14 (cat. no. 3218.0) and ABS release: Population by Age and Sex, Regions of Australia, 2013 (cat. no. 3235.0) 52013/14 general purpose financial statements of Harden and Cootamundra Shire Councils 6 Special Schedule 7, 2013/14 general purpose financial statements of Harden and Cootamundra Shire Councils 7 Written Down Value of depreciable infrastructure assets, Note 9, 2013/14 general purpose financial statements
Page 5
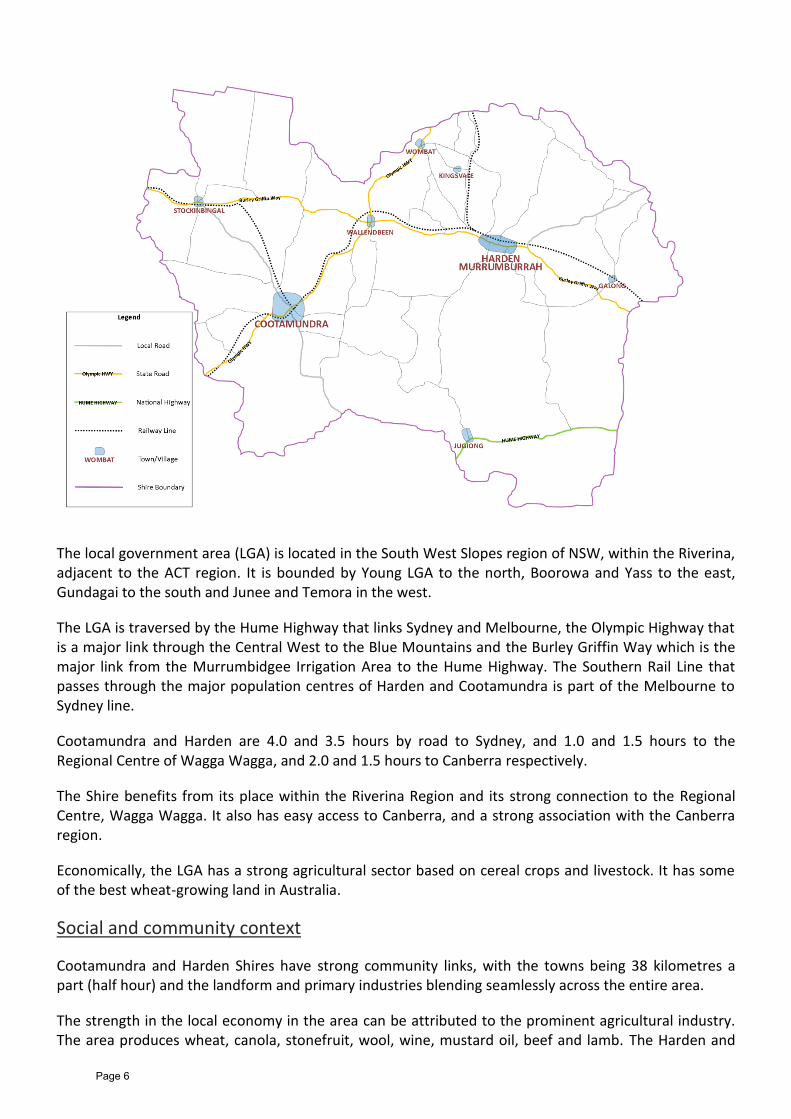
The local government area (LGA) is located in the South West Slopes region of NSW, within the Riverina, adjacent to the ACT region. It is bounded by Young LGA to the north, Boorowa and Yass to the east, Gundagai to the south and Junee and Temora in the west.
The LGA is traversed by the Hume Highway that links Sydney and Melbourne, the Olympic Highway that is a major link through the Central West to the Blue Mountains and the Burley Griffin Way which is the major link from the Murrumbidgee Irrigation Area to the Hume Highway. The Southern Rail Line that passes through the major population centres of Harden and Cootamundra is part of the Melbourne to Sydney line.
Cootamundra and Harden are 4.0 and 3.5 hours by road to Sydney, and 1.0 and 1.5 hours to the Regional Centre of Wagga Wagga, and 2.0 and 1.5 hours to Canberra respectively.
The Shire benefits from its place within the Riverina Region and its strong connection to the Regional Centre, Wagga Wagga. It also has easy access to Canberra, and a strong association with the Canberra region.
Economically, the LGA has a strong agricultural sector based on cereal crops and livestock. It has some of the best wheat-growing land in Australia.
Social and community context
Cootamundra and Harden Shires have strong community links, with the towns being 38 kilometres a part (half hour) and the landform and primary industries blending seamlessly across the entire area.
The strength in the local economy in the area can be attributed to the prominent agricultural industry. The area produces wheat, canola, stonefruit, wool, wine, mustard oil, beef and lamb. The Harden and
Page 6
Cootamundra communities have connected through agriculture, with local farmers sharing the same interests and dealing with the same agricultural issues; weather patterns, weeds, markets and transport.
The region is fortunate to have a very passionate community with a strong community spirit. In the 2011 census, 26.2% and 27.8% of the Cootamundra and Harden populations aged 15 years and over reported undertaking voluntary work for a community organisation or group. There are hundreds of local clubs operating across the total area that share sporting, cultural, social, environmental, creative, recreation and other common interests and activities.
Both areas having a strong sporting history, and large regular sporting activities involving the residents of both councils and the region beyond are regular occurrences. Both towns are regular destinations for the staging of local and regional sports and carnivals.
Cultural activities are regularly shared throughout the area and, similar to most rural areas, people accept that travelling from one town to another is a necessary part of the cultural landscape.
Local businesses operate branches in both towns and a number of residents travel from one town to the other for work. With common industry and business interests, there is regular interaction amongst the farmers and service industries; such as agronomists, rural suppliers, accountants, lawyers and agricultural contractors. Similarly, the rail and transport industries cover both areas and school bus routes cross the council boundaries at many points.
Local residents share regional facilities that are provided by both Cootamundra and Harden Councils, including the saleyards and airport, indoor pool, Kruger Medical Centre, Health One Medical Centre, the Art Centre / Tin Shed Theatre, and Sports Stadium.
Population and age structure
Between 2011 and 2026, the age structure forecasts for Cootamundra LGA indicate a 6.7% increase in population under working age, a 32.1% increase in population of retirement age, and a 4.8% decrease in population of working age.8 Harden LGA is expected to have a similarly ageing population structure.
Cootamundra and Harden Councils continue to respond to the age structure projections in their planning for age-based facilities and services, such as health, recreation, community services and pedestrian mobility. The following significant initiatives and projects completed recently by the two Councils are examples of this planning.
Partnering with the Kruger Trust to build the Kruger Medical Centre and hydrotherapy pool, now owned by Council and managed via contract with a medical provider.
Construction of 25 metre indoor heated pool.
Completion of the Creative Arts and Cultural Centre, incorporating theatre and visual arts studio and workshop.
Contribution to community fundraising for the nursing home, with Council contributing $160,000 toward the cost of the fire safety sprinkler system.
Working with volunteers to operate Council’s museums, visitors information centre, village progress associations and other committees.
8 Forecast id population projections. http://forecast.id.com.au/riverina-cities/population-age-structure?WebID=170
Page 7

Pedestrian Access Mobility Plans, and footpath and pram ramp construction.
Infrastructure development at the Caravan Park.
Numerous community events and activities involving older participants. These are often provided in partnership with other levels of government as funding providers, for example the Creative Ageing Grant, Seniors Week, International Women’s Day, IPad training, and Library activities.
Regional Partnerships
Cootamundra and Harden councils currently participate in a number of partnerships that allow the councils to extend their capacity for service provision. Whilst the new council will need to determine which of the overlapping groups it wishes to primarily align with, it is anticipated that, whichever group is chosen for each function, the association with the other group would continue, at least at a minimum associate membership level. The new Council would have the benefit of all of the previous associations to draw on, as it determines its strategic direction during its first term as a new Council.
Continued involvement in the numerous regional partnerships that have been developed by the existing councils is a major strength for the new Council, which is ideally located between two major regional centres of Canberra and Wagga Wagga. Given that at present the direction is towards both the Riverina and the Canberra regions it would be expected that this dual focus would continue wherever the most advantageous association could be found.
Service Cootamundra Harden
Regional advocacy, resource sharing and collaboration with 12 councils in the Riverina.
REROC is a well established, strong ROC with a proven track record for achieving regional project delivery and procurement savings. It is currently involved in the Joint Organisation (JO) pilot process.
Riverina Eastern Regional Organisation of Councils (REROC)
Regional advocacy, resource sharing and collaboration with 12 councils in the South East of NSW, and the ACT Government.
CBRJO has recently launched the Canberra Region Brand for the promotion of the region to visitors, investors, students, residents and businesses.
Canberra Region Joint Organisation (CBRJO)
Noxious weeds regional services Southern Slopes County Council
Internal audit services Internal audit partnership (Cowra, Boorowa, Young)
Regional water supply and infrastructure, based in the Riverina Region, for 8 LGAs. Supply to the Cootamundra Town area and the Harden Shire is provided in bulk and reticulation and is handled by the councils.
Goldenfields Water County Council
Goldenfields Water County Council
Page 8
Service Cootamundra Harden
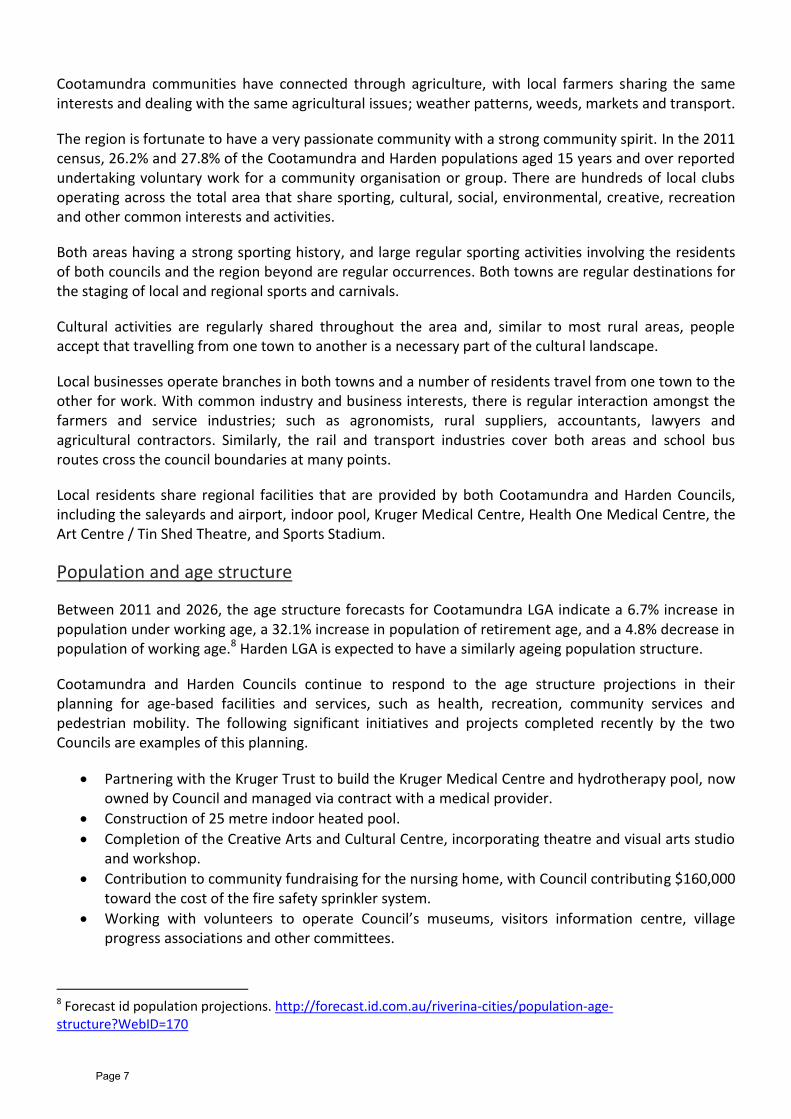
Library services to 130,103 constituents of 12 local government areas. The service consists of 18 branches and 2 mobile libraries serving a total of 60 communities.
RRL has for some years been considered a leader amoungst regional libraries. It has participated in a number of statewide projects, been represented on various State Library of NSW committees, contributed to the development of policy and other documentation at the State level, and introduced a range of service and technology innovations.
Riverina Regional Library (RRL)
Library services for Boorowa, Harden and Young. South West Regional Library
Collaborative community and economic regional planning.
Riverina Economic Development Forum
Regional food organisation for the promotion of regional products and services and agri-tourism.
Southern NSW Harvest
Branding and promotion for the Hilltops region. Hilltops
Sister City Council relationships including sharing of resources, knowledge and skill sharing, staff mentoring and development programs, and co-funding of projects.
The Hills Shire Sutherland Shire Council
8 Councils working together to manage waste services, under the auspice of Harden Shire Council.
South West Regional Waste Management Group
South West Regional Waste Management Group
Waste processing contract Elouera Elouera
Contaminated soil (hydrocarbons) rehabilitation and reuse partnership.
Waste Science Pty Ltd
11 councils working together to regulate heavy vehicle road usage, including fines and enforcement.
South East Weight of Loads Group
South East Weight of Loads Group
Cultural planning, policy development, artistic and cultural projects and community consultation for 11 member councils.
Eastern Riverina Arts Eastern Riverina Arts
Regional tourism marketing and promotion. Riverina Regional Tourism
Regional tourism marketing and promotion. Goldfields Way Tourism
Tourism marketing and promotion, specifically based around the goldfields heritage of regional NSW.
Gold Trails Promotion Gold Trails Promotion
Visitors information centre Cootamundra Arts Centre
Road safety program, RMS and three partner councils. RMS Road Safety Officer Program
Information sharing and technical assistance for the member councils who use the Civica corporate software system.
Civica User Group Civica User Group
Page 9
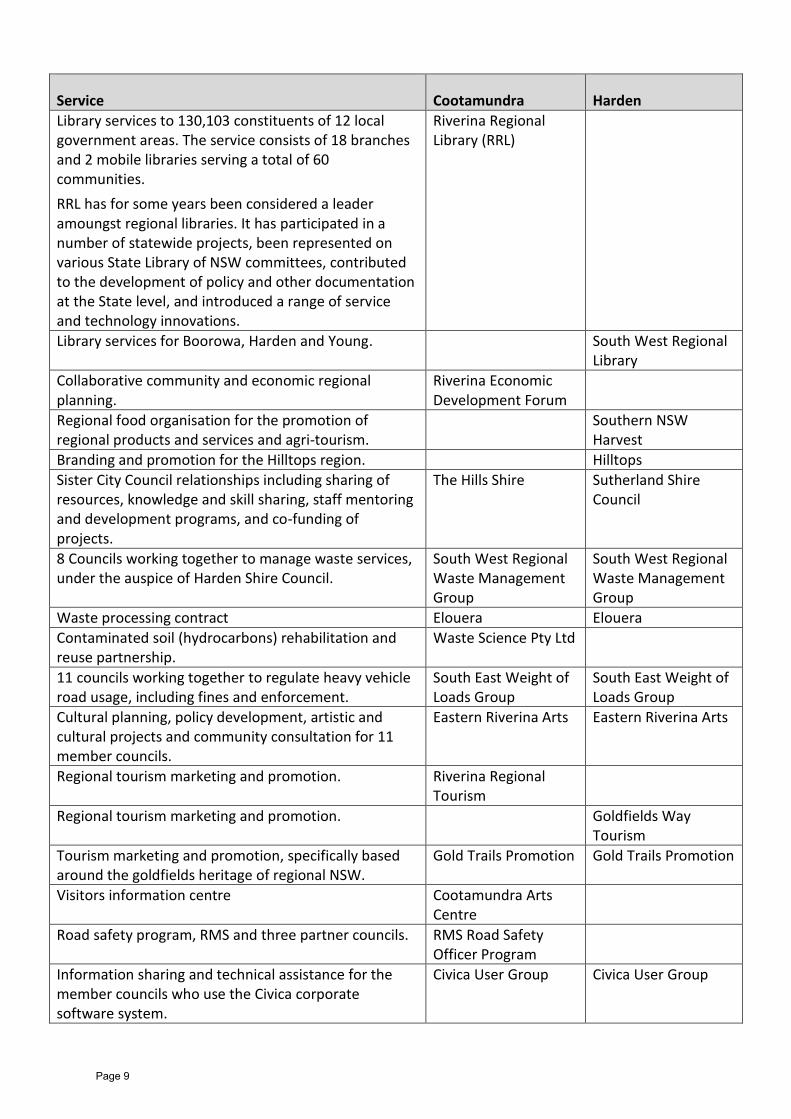
Service Cootamundra Harden
Business advise and assistance, economic development activities and business promotion.
Cootamundra Development Corporation
Business advise and assistance, economic development activities and business promotion.
Harden Murrumburrah Chamber of Commerce
Professional staff share knowledge, skills, and ideas through their participation in numerous professional networking groups.
Professional associations and memberships
Professional associations and memberships
Partnering with volunteer committees to provide a strong voice and practical support for prioritising service delivery in the villages.
Various LG Act Section 355 Committees
Village Progress Associations
Joint Organisation
Harden Council is a member of the Canberra Region Joint Organisation (CBRJO), previously known as South East Regional Organisation of Councils (SEROC), and Cootamundra is a member of the Riverina Eastern Region of Councils (REROC).
CBRJO membership comprises the Australian Capital Territory (ACT) and the 12 councils of Bombala, Boorowa, Cooma-Monaro, Eurobodalla, Goulburn Mulwaree, Harden, Palerang, Queanbeyan, Snowy River, Upper Lachlan, Yass Valley and Young. It incorporates the ACT and the surrounding region and stretches from the South-Western Slopes, through the Sydney-Canberra Corridor across to the Eurobodalla Coast, down to the Snowy Mountains and Alpine country to the Victorian border.
REROC membership comprises the councils of Bland, Coolamon, Cootamundra, Greater Hume, Gundagai, Junee, Lockhart, Temora, Tumbarumba, Tumut, Urana, Wagga Wagga, and county councils of Goldenfields Water and Riverina Water. It is based on the group of councils in the eastern Riverina region who relate to and whose NSW Government services are primarily delivered from the regional centre of Wagga Wagga.
Harden is a foundation member of SEROC / CBRJO, which is a reasonably new ROC, founded in May 2010. In May 2012 the importance of the regional collaboration was recognised by ACT Chief Minister, Katy Gallagher, who established the ACT Government as a full member. As such it has great potential for regional and intergovernmental collaboration, despite not having a long and proven track record of major projects and/or savings produced for its member councils. Harden was previously a member the Central NSW Councils (CENTROC); however, whilst being of benefit over a long period Harden was a fringe Council in the total area covered by CENTROC and saw the ACT region as more relevant to their community.
Cootamundra has been an active member of REROC since its inception in 1994. Over that time Cootamundra has benefited by well over $2,000,000 in savings from participation in a large number of joint projects; from electricity supply to bitumen emulsion to waste management. REROC has demonstrated a strong history of effective collaboration and has been willing to partner with both State and Federal Government to undertake major projects such as the $1.6 million Strengthening Basin
Page 10
Communities project, ‘A World with Less Water: Climate Change Impacts on Councils in the South Eastern Riverina’.9
On the basis of past record it is likely that the new Council will opt for full membership of REROC and associate membership of CBRJO in order to gain the maximum benefit available from both council’s ties with both organisations. Similarly this would imply full membership of the Riverina Joint Organisation (JO) and associate membership of the Tablelands JO. However, these will be decisions for the new council once it is in place and able to assess the evidence available through both council’s records.
9 REROC Report - Achieving Strategic Capacity through Regional Collaboration http://www.cootamundra.nsw.gov.au/f.ashx/6.-REROC-Report-Achieving-Strategic-Capacity-through-Regional-Collaboration.pdf
Page 11
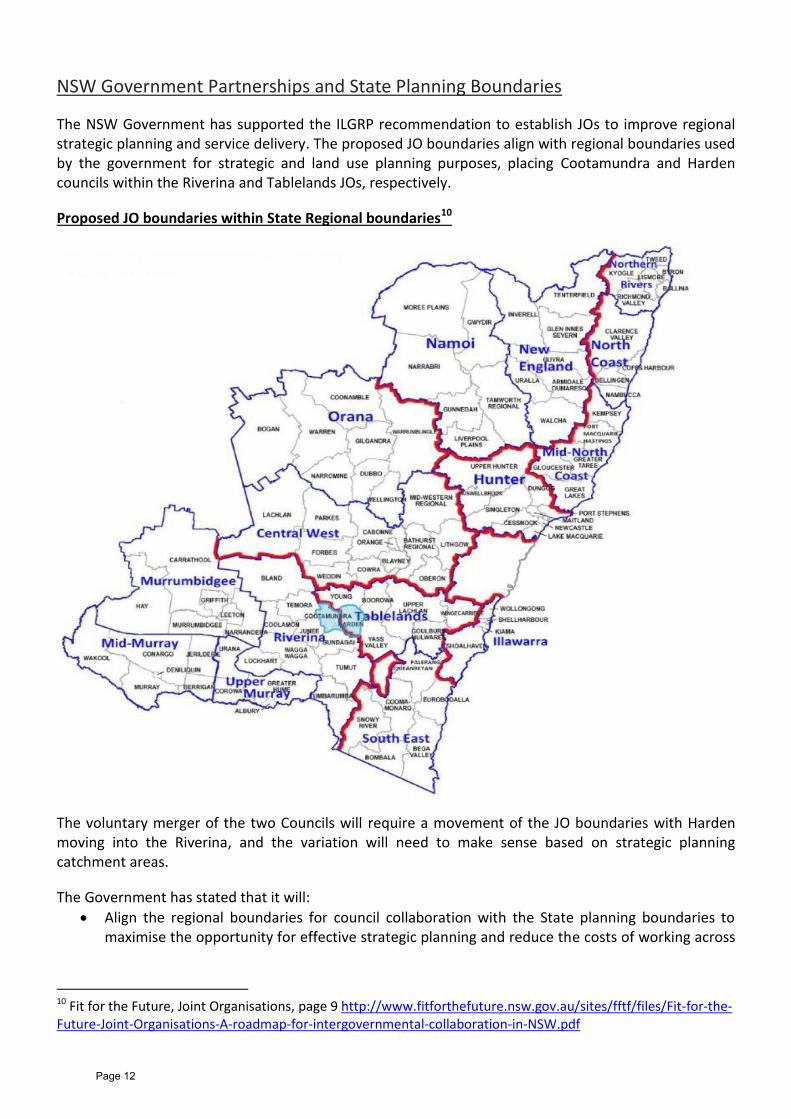
NSW Government Partnerships and State Planning Boundaries
The NSW Government has supported the ILGRP recommendation to establish JOs to improve regional strategic planning and service delivery. The proposed JO boundaries align with regional boundaries used by the government for strategic and land use planning purposes, placing Cootamundra and Harden councils within the Riverina and Tablelands JOs, respectively.
Proposed JO boundaries within State Regional boundaries10
The voluntary merger of the two Councils will require a movement of the JO boundaries with Harden moving into the Riverina, and the variation will need to make sense based on strategic planning catchment areas.
The Government has stated that it will:
Align the regional boundaries for council collaboration with the State planning boundaries to maximise the opportunity for effective strategic planning and reduce the costs of working across
10 Fit for the Future, Joint Organisations, page 9 http://www.fitforthefuture.nsw.gov.au/sites/fftf/files/Fit-for-the-Future-Joint-Organisations-A-roadmap-for-intergovernmental-collaboration-in-NSW.pdf
Page 12
different boundaries, while exploring options to provide flexibility for councils to collaborate and share services across different boundaries.
Examine ways to ensure State agencies collaborate with councils in strategic planning.
Consider the relationship between existing county councils, water utilities and JOs, with the aim of maximising the benefits of the new collaborative model while minimising the disruption to existing collaborative arrangements.11
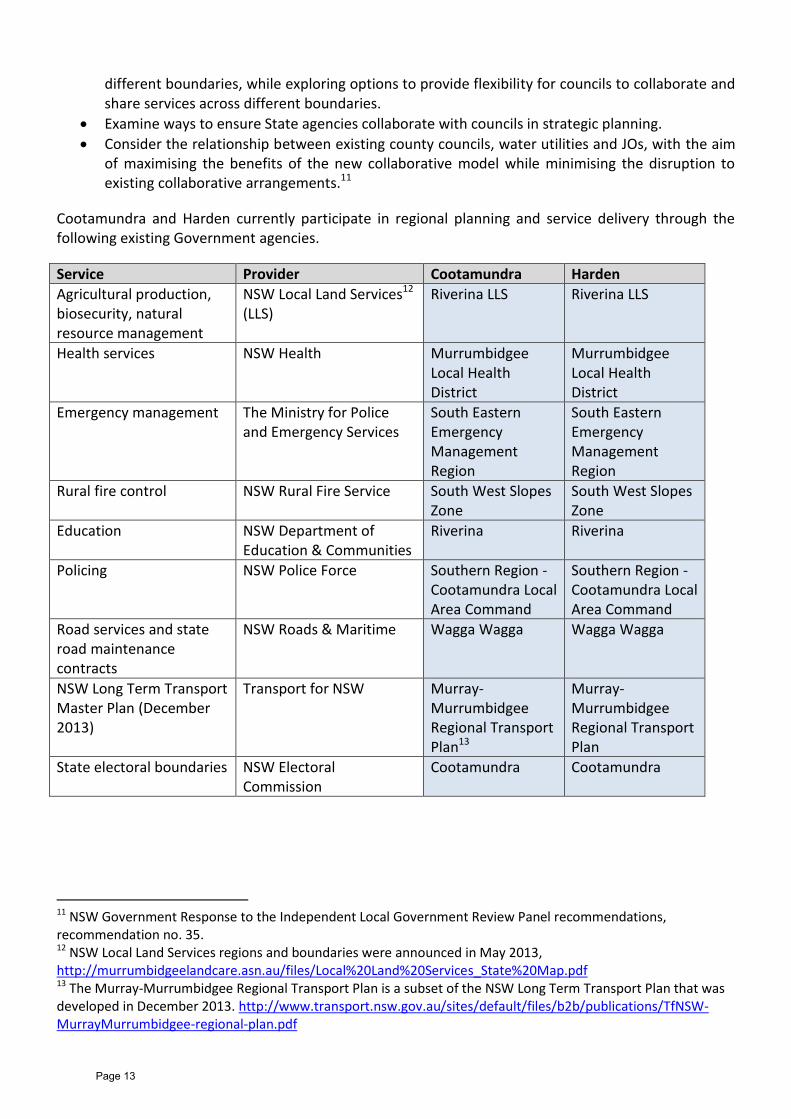
Cootamundra and Harden currently participate in regional planning and service delivery through the following existing Government agencies.
Service Provider Cootamundra Harden
Agricultural production, biosecurity, natural resource management
NSW Local Land Services12 (LLS)
Riverina LLS Riverina LLS
Health services NSW Health Murrumbidgee Local Health District
Murrumbidgee Local Health District
Emergency management The Ministry for Police and Emergency Services
South Eastern Emergency Management Region
South Eastern Emergency Management Region
Rural fire control NSW Rural Fire Service South West Slopes Zone
South West Slopes Zone
Education NSW Department of Education & Communities
Riverina Riverina
Policing NSW Police Force Southern Region - Cootamundra Local Area Command
Southern Region - Cootamundra Local Area Command
Road services and state road maintenance contracts
NSW Roads & Maritime Wagga Wagga Wagga Wagga
NSW Long Term Transport Master Plan (December 2013)
Transport for NSW Murray-Murrumbidgee Regional Transport Plan13
Murray-Murrumbidgee Regional Transport Plan
State electoral boundaries NSW Electoral Commission
Cootamundra Cootamundra
11 NSW Government Response to the Independent Local Government Review Panel recommendations, recommendation no. 35. 12 NSW Local Land Services regions and boundaries were announced in May 2013, http://murrumbidgeelandcare.asn.au/files/Local%20Land%20Services_State%20Map.pdf 13 The Murray-Murrumbidgee Regional Transport Plan is a subset of the NSW Long Term Transport Plan that was developed in December 2013. http://www.transport.nsw.gov.au/sites/default/files/b2b/publications/TfNSW-MurrayMurrumbidgee-regional-plan.pdf
Page 13
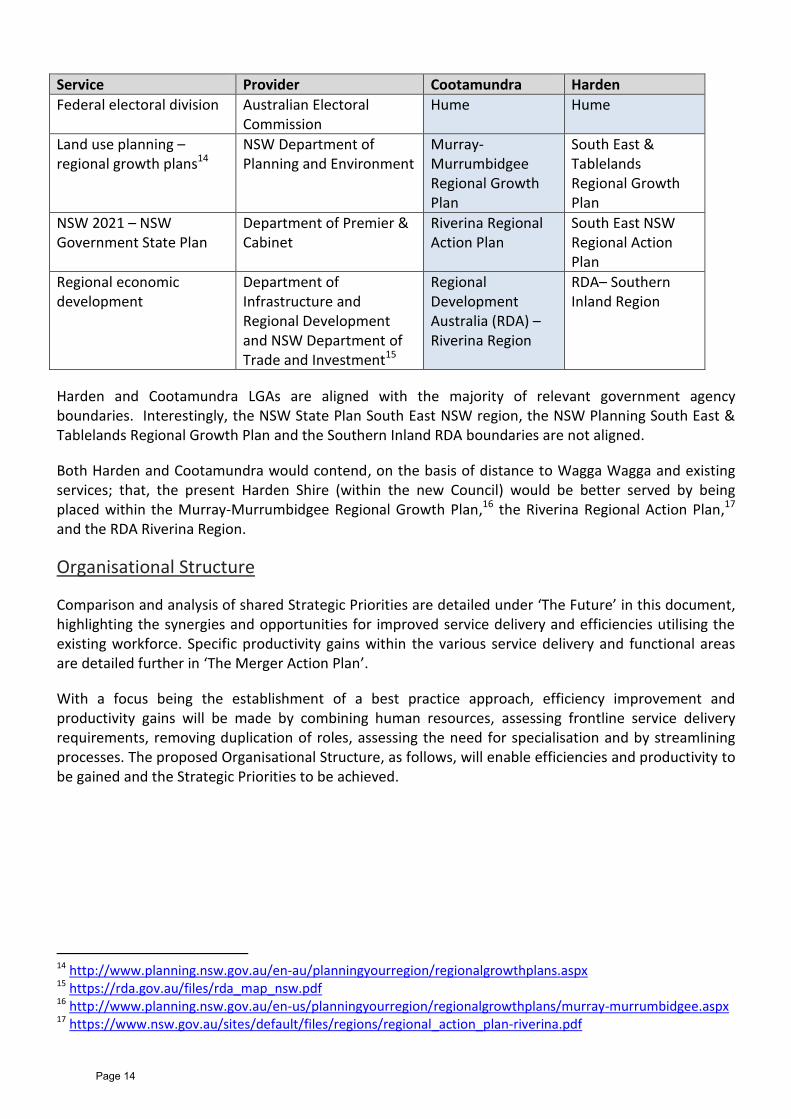
Service Provider Cootamundra Harden
Federal electoral division Australian Electoral Commission
Hume Hume
Land use planning – regional growth plans14
NSW Department of Planning and Environment
Murray-Murrumbidgee Regional Growth Plan
South East & Tablelands Regional Growth Plan
NSW 2021 – NSW Government State Plan
Department of Premier & Cabinet
Riverina Regional Action Plan
South East NSW Regional Action Plan
Regional economic development
Department of Infrastructure and Regional Development and NSW Department of Trade and Investment15
Regional Development Australia (RDA) – Riverina Region
RDA– Southern Inland Region
Harden and Cootamundra LGAs are aligned with the majority of relevant government agency boundaries. Interestingly, the NSW State Plan South East NSW region, the NSW Planning South East & Tablelands Regional Growth Plan and the Southern Inland RDA boundaries are not aligned.
Both Harden and Cootamundra would contend, on the basis of distance to Wagga Wagga and existing services; that, the present Harden Shire (within the new Council) would be better served by being placed within the Murray-Murrumbidgee Regional Growth Plan,16 the Riverina Regional Action Plan,17 and the RDA Riverina Region.
Organisational Structure
Comparison and analysis of shared Strategic Priorities are detailed under ‘The Future’ in this document, highlighting the synergies and opportunities for improved service delivery and efficiencies utilising the existing workforce. Specific productivity gains within the various service delivery and functional areas are detailed further in ‘The Merger Action Plan’.
With a focus being the establishment of a best practice approach, efficiency improvement and productivity gains will be made by combining human resources, assessing frontline service delivery requirements, removing duplication of roles, assessing the need for specialisation and by streamlining processes. The proposed Organisational Structure, as follows, will enable efficiencies and productivity to be gained and the Strategic Priorities to be achieved.
14 http://www.planning.nsw.gov.au/en-au/planningyourregion/regionalgrowthplans.aspx 15 https://rda.gov.au/files/rda_map_nsw.pdf 16 http://www.planning.nsw.gov.au/en-us/planningyourregion/regionalgrowthplans/murray-murrumbidgee.aspx 17 https://www.nsw.gov.au/sites/default/files/regions/regional_action_plan-riverina.pdf
Page 14
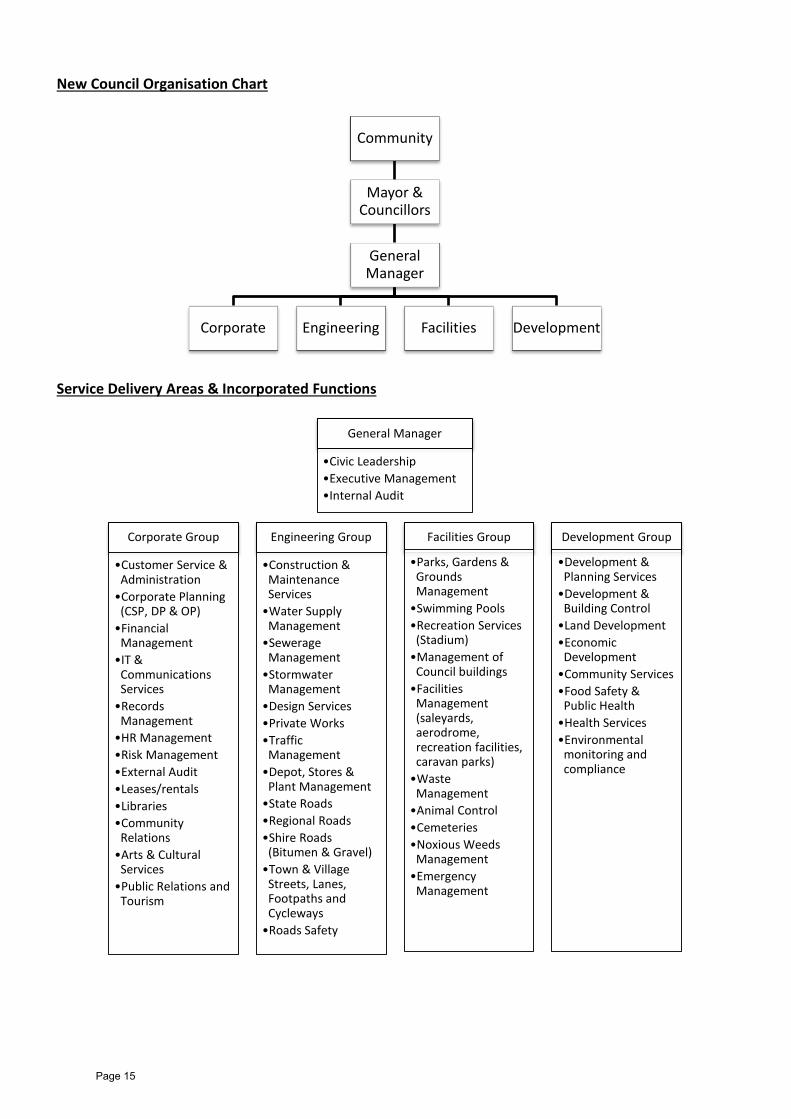
New Council Organisation Chart
Service Delivery Areas & Incorporated Functions
Community
Mayor & Councillors
General Manager
Corporate Engineering Facilities Development
General Manager
•Civic Leadership
•Executive Management
•Internal Audit
Corporate Group
•Customer Service & Administration
•Corporate Planning (CSP, DP & OP)
•Financial Management
•IT & Communications Services
•Records Management
•HR Management
•Risk Management
•External Audit
•Leases/rentals
•Libraries
•Community Relations
•Arts & Cultural Services
•Public Relations and Tourism
Engineering Group
•Construction & Maintenance Services
•Water Supply Management
•Sewerage Management
•Stormwater Management
•Design Services
•Private Works
•Traffic Management
•Depot, Stores & Plant Management
•State Roads
•Regional Roads
•Shire Roads (Bitumen & Gravel)
•Town & Village Streets, Lanes, Footpaths and Cycleways
•Roads Safety
Facilities Group
•Parks, Gardens & Grounds Management
•Swimming Pools
•Recreation Services (Stadium)
•Management of Council buildings
•Facilities Management (saleyards, aerodrome, recreation facilities, caravan parks)
•Waste Management
•Animal Control
•Cemeteries
•Noxious Weeds Management
•Emergency Management
Development Group
•Development & Planning Services
•Development & Building Control
•Land Development
•Economic Development
•Community Services
•Food Safety & Public Health
•Health Services
•Environmental monitoring and compliance
Page 15
Plant and depot
The new Council will have depots located in Harden and Cootamundra. Each depot is old and just adequate for current usage. Cootamundra Shire Council has budgeted $1,000,000 in its 2015/2016 Operational Plan for a depot upgrade involving the consolidation of its current two separated depot facilities and the modernisation of work spaces including the mechanical workshop and depot store, or alternatively the purchase of a recently refurbished ex Public Works depot.
A plan to reorganise and renew the depot infrastructure in Harden and Cootamundra will be developed to support and improve the efficiency of new Council’s works services.
Water and Sewer
Both councils’ currently provide water and sewer services. The sewer system servicing the town of Cootamundra is managed to a high standard with a modern treatment plant. The sewer system servicing the town of Harden is managed to a high standard but uses an old style trickle filter treatment system located within a potential flood prone valley. Whilst this system has capacity for a larger town and continues to operate within NSW Office of Water standards it will need to be replaced in the next decade.
Both Harden and Cootamundra are supplied with bulk water by Goldenfields Water County Council, with Harden being the water authority for the whole shire and Cootamundra for the town of Cootamundra only. Both councils have well operated and well maintained reticulation systems.
Offices
The new Council will have two offices, located in Harden and Cootamundra. Each office is adequate for the number of office staff currently working in each location, but with limited additional capacity. The two offices will continue to provide customer service facilities in each location, and the office staff will work as one team, in two locations.
Corporate software systems
The corporate software systems of the existing councils have commonalities that will assist with the transition of data and set-up of one system for the new Council. Each council has purchased and implemented the Civica Authority corporate software system within the last three years. It is a focused local government solution and will adequately meet the requirements of the new Council. In addition, each Council operates Intramaps for GIS. The records management systems are different, and the new Council will make an assessment of the two existing systems, Trim and InfoXpert, before choosing the best system for implementation.
The new Council will continue to out-source IT support, as has been the practice of each of the existing councils. The benefits to this approach for the new Council are:
Documented and transferable corporate ITC knowledge.
Rapid access to a number of technicians with specialist ITC skills.
Standardised systems operated by the managed service contractor on behalf of a large number of clients, allowing them to achieve value for money through economies of scale.
Allows for flexibility if Council’s organisational needs change.
Page 16
Political and managerial leadership
Leadership
Harden and Cootamundra Councils are active participants in the local government arena and regularly advocate for the local communities they serve. Over a number of years, both councils have been active in making their views known in an effort to improve the local government sector overall and to improve relationships with other levels of government. Both councils’ actively advocate community needs to other levels of government and regularly make submissions to and become involved in all issues effecting local government.
Both councils’ believe that whilst their primary current responsibility is the good of their citizens, there is a wider responsibility towards the future, which requires each Council to be involved in and extend influence in areas that may impinge on its long term ability to care for and service its community.
Councillors from both councils’ also actively participate through holding leadership and decision making positions in many State and Regional organisations. An example of this during 2014/15 was Councillors from both Cootamundra and Harden holding executive roles on the governing body of Local Government NSW, and Councillors holding leadership positions in organisations such as Local Government Procurement, StateCover, Murrumbidgee Local Health Board, Museums and Galleries NSW, REROC, CBRJO and Goldenfields Water County Council.
Representation
Whilst both councils are aware of the present legislative restrictions on elected member representation, the councils have agreed to propose a different structure for a transitional period, subject to Ministerial approval.
The proposed interim arrangement is as follows:
At commencement, 1st election (Sept 2016): Five councillors from each previous LGA
2nd election (Sept 2020): Three councillors from each previous LGA plus three across the new Council
3rd election (Sept 2024): All nine councillors elected across the new Council
This proposed arrangement is designed primarily to deal with the perception that the smaller population of Harden would be swamped by the larger population of Cootamundra in a purely numbers based election. Whilst it is acknowledged that this may not be the case it is a real concern throughout the villages of both councils and for the people of Harden that the possibility of a large centre based council could result in reduced attention being paid to the remainder of the new Council.
Cootamundra is aware of this concern and is therefore willing to effectively reduce its proportionate representation for a transitional period to alleviate this concern. Both councils believe that good representation is not based on geography, but rather on the calibre of the elected members, and that after the eight years of the interim arrangement this will be evident to all of the residents of the new Council and the system will revert to a single electorate without issue.
Page 17

The Future
Vision statement
The vision for the future of the New Council begins with the separate visions of the two existing Councils. Each Council has prepared Community Strategic Plans, Delivery Programs and Operational Plans, supported by extensive community consultation and input.
The Councils have determined that the existing priorities for each separate community are complementary, that the strategies to achieve those priorities can be integrated, and that better outcomes can be achieved by working together.
Cootamundra
It is 2023 … Cootamundra is a thriving, lively Shire of around 8,000 set within a picturesque rural environment. Its people have chosen to live here because of the community spirit, the prosperous economy, the affordable lifestyle, the rural setting, the different choices of lifestyle, the health, education, cultural and retail services, and the easy access to Canberra, Sydney, Melbourne, the mountains, the outback and the coast.18
Harden
Harden Shire will remain a great place to live, with caring, safe and secure communities supported by a vibrant economy, where residents continue to experience a satisfying quality of life in an attractive and sustainable environment.19
Mission statement
Cootamundra
To work with today’s community to leave a more cohesive civil society, an improved environment, a stronger local economy and a well governed Council to the future generations of this community.20
Harden
To enhance and promote our communities lifestyle and environment through:
Leadership
Open communication
Community partnership
Sustainable services.21
18 Community Strategic Plan adopted June 2013 http://www.cootamundra.nsw.gov.au/council/integrated-planning-and-reporting/community-strategic-plan.aspx 19 Community Strategic Plan adopted May 2012 http://www.harden.nsw.gov.au/council/integrated-planning-and-reporting.aspx 20 Community Strategic Plan adopted June 2013 21 Operational & Delivery Plan adopted June 2014. http://www.harden.nsw.gov.au/council/integrated-planning-and-reporting.aspx
Page 18
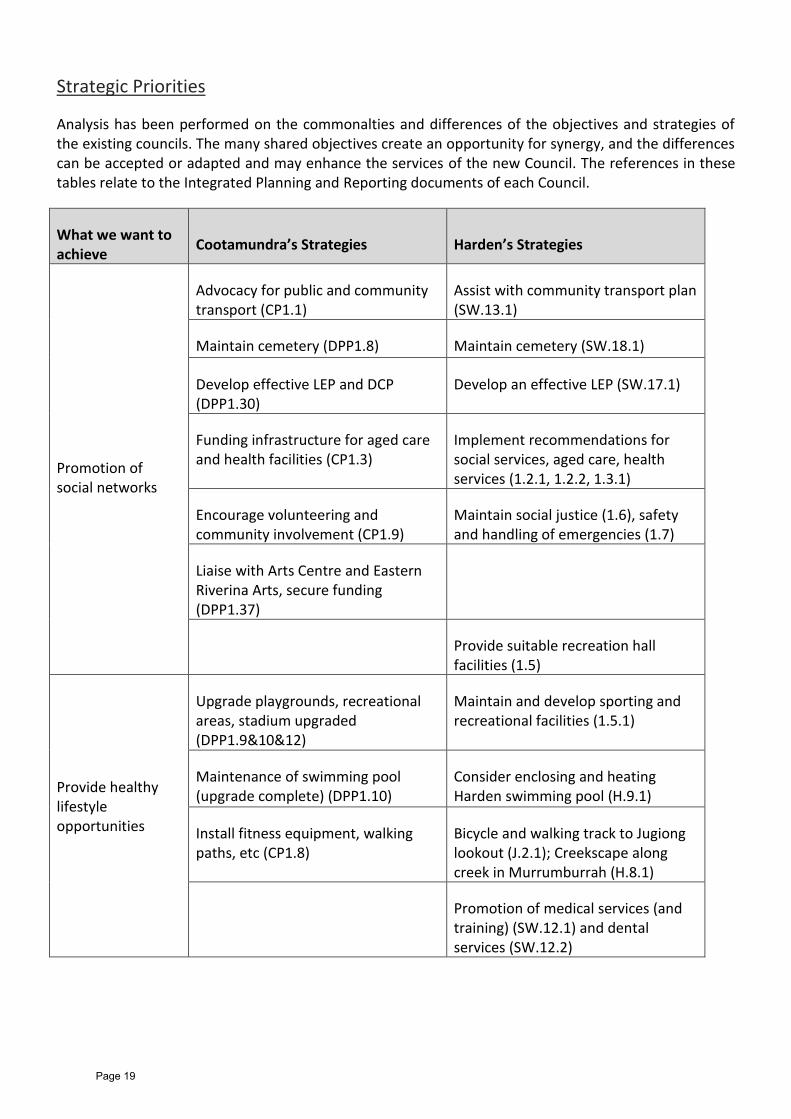
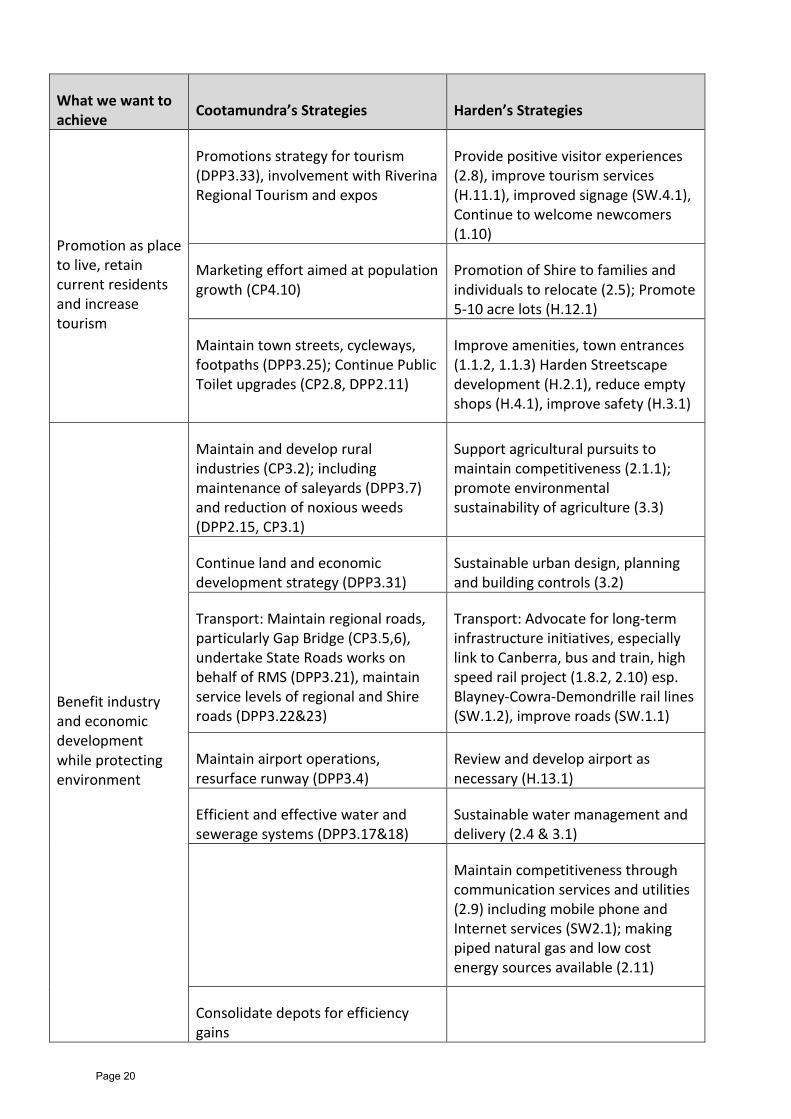
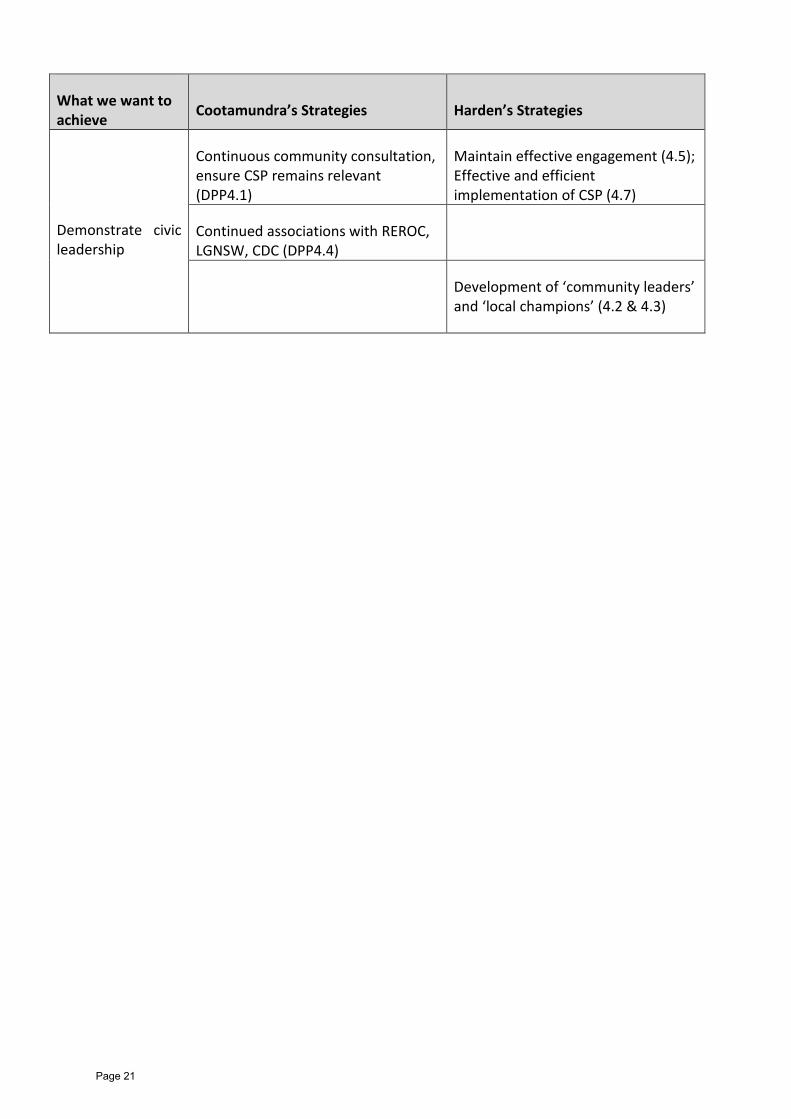
Strategic Priorities
Analysis has been performed on the commonalties and differences of the objectives and strategies of the existing councils. The many shared objectives create an opportunity for synergy, and the differences can be accepted or adapted and may enhance the services of the new Council. The references in these tables relate to the Integrated Planning and Reporting documents of each Council.
What we want to achieve
Cootamundra’s Strategies Harden’s Strategies
Promotion of social networks
Advocacy for public and community transport (CP1.1)
Assist with community transport plan (SW.13.1)
Maintain cemetery (DPP1.8) Maintain cemetery (SW.18.1)
Develop effective LEP and DCP (DPP1.30)
Develop an effective LEP (SW.17.1)
Funding infrastructure for aged care and health facilities (CP1.3)
Implement recommendations for social services, aged care, health services (1.2.1, 1.2.2, 1.3.1)
Encourage volunteering and community involvement (CP1.9)
Maintain social justice (1.6), safety and handling of emergencies (1.7)
Liaise with Arts Centre and Eastern Riverina Arts, secure funding (DPP1.37)
Provide suitable recreation hall facilities (1.5)
Provide healthy lifestyle opportunities
Upgrade playgrounds, recreational areas, stadium upgraded (DPP1.9&10&12)
Maintain and develop sporting and recreational facilities (1.5.1)
Maintenance of swimming pool (upgrade complete) (DPP1.10)
Consider enclosing and heating Harden swimming pool (H.9.1)
Install fitness equipment, walking paths, etc (CP1.8)
Bicycle and walking track to Jugiong lookout (J.2.1); Creekscape along creek in Murrumburrah (H.8.1)
Promotion of medical services (and training) (SW.12.1) and dental services (SW.12.2)
Page 19
What we want to achieve
Cootamundra’s Strategies Harden’s Strategies
Promotion as place to live, retain current residents and increase tourism
Promotions strategy for tourism (DPP3.33), involvement with Riverina Regional Tourism and expos
Provide positive visitor experiences (2.8), improve tourism services (H.11.1), improved signage (SW.4.1), Continue to welcome newcomers (1.10)
Marketing effort aimed at population growth (CP4.10)
Promotion of Shire to families and individuals to relocate (2.5); Promote 5-10 acre lots (H.12.1)
Maintain town streets, cycleways, footpaths (DPP3.25); Continue Public Toilet upgrades (CP2.8, DPP2.11)
Improve amenities, town entrances (1.1.2, 1.1.3) Harden Streetscape development (H.2.1), reduce empty shops (H.4.1), improve safety (H.3.1)
Benefit industry and economic development while protecting environment
Maintain and develop rural industries (CP3.2); including maintenance of saleyards (DPP3.7) and reduction of noxious weeds (DPP2.15, CP3.1)
Support agricultural pursuits to maintain competitiveness (2.1.1); promote environmental sustainability of agriculture (3.3)
Continue land and economic development strategy (DPP3.31)
Sustainable urban design, planning and building controls (3.2)
Transport: Maintain regional roads, particularly Gap Bridge (CP3.5,6), undertake State Roads works on behalf of RMS (DPP3.21), maintain service levels of regional and Shire roads (DPP3.22&23)
Transport: Advocate for long-term infrastructure initiatives, especially link to Canberra, bus and train, high speed rail project (1.8.2, 2.10) esp. Blayney-Cowra-Demondrille rail lines (SW.1.2), improve roads (SW.1.1)
Maintain airport operations, resurface runway (DPP3.4)
Review and develop airport as necessary (H.13.1)
Efficient and effective water and sewerage systems (DPP3.17&18)
Sustainable water management and delivery (2.4 & 3.1)
Maintain competitiveness through communication services and utilities (2.9) including mobile phone and Internet services (SW2.1); making piped natural gas and low cost energy sources available (2.11)
Consolidate depots for efficiency gains
Page 20
What we want to achieve
Cootamundra’s Strategies Harden’s Strategies
Demonstrate civic leadership
Continuous community consultation, ensure CSP remains relevant (DPP4.1)
Maintain effective engagement (4.5); Effective and efficient implementation of CSP (4.7)
Continued associations with REROC, LGNSW, CDC (DPP4.4)
Development of ‘community leaders’ and ‘local champions’ (4.2 & 4.3)
Page 21
The Community
Fit for the future
The NSW Government has committed to building a stronger system of local government in NSW, with councils that are sustainable, well-managed and ready to play an active role in helping communities grow. They have developed a package of local government reform, branded Fit for the Future22. The Fit for the Future package, announced in September 2014, is the government’s response to the recommendations of the Independent Local Government Review Panel23 which presented its report in late 2013. The package is designed to encourage councils to consider their long term sustainability and explore reform options including mergers, through provision of financial incentives and other support.
The NSW Government wants communities to have confidence that their Council is financially sound, operating efficiently and in a strong position to guide community growth and deliver quality services. Regional communities play a major role in supporting the State’s economy. They sustain food production and export industries, as well as education, retail, resources, manufacturing and defence facilities.
The Government is providing generous support to councils in regional areas that are ready to join forces with their neighbours to help their communities grow. This includes access to cheaper finance to build and maintain important infrastructure such as roads and bridges. In addition, direct funding of $5 million will be provided to two councils who merge into one. This will help to provide important community facilities, such as roads and bridges.
Community engagement strategy
Cootamundra and Harden councils consider that community engagement and involvement in the decision making process is vital. We aim to involve the community in an informed discussion about the merger proposal and to identify the benefits and concerns as they are highlighted in the community’s response.
The strategy that has been adopted seeks to:
Keep the community informed of decisions and actions through local news, council websites and an information package that has been delivered to every resident and ratepayer in both Shires.
Provide transparent and reliable information about all aspects of the merger proposal, including the benefits and costs.
Receive community feedback through mail, website forms, posted survey and through discussion.
Lead local discussions at community meetings and workshops.
Continue to provide updated information to the community throughout the planning and implementation process, through Council newsletters and media releases.
22 http://www.fitforthefuture.nsw.gov.au/strengthening-local-government 23 http://www.localgovernmentreview.nsw.gov.au/
Page 22
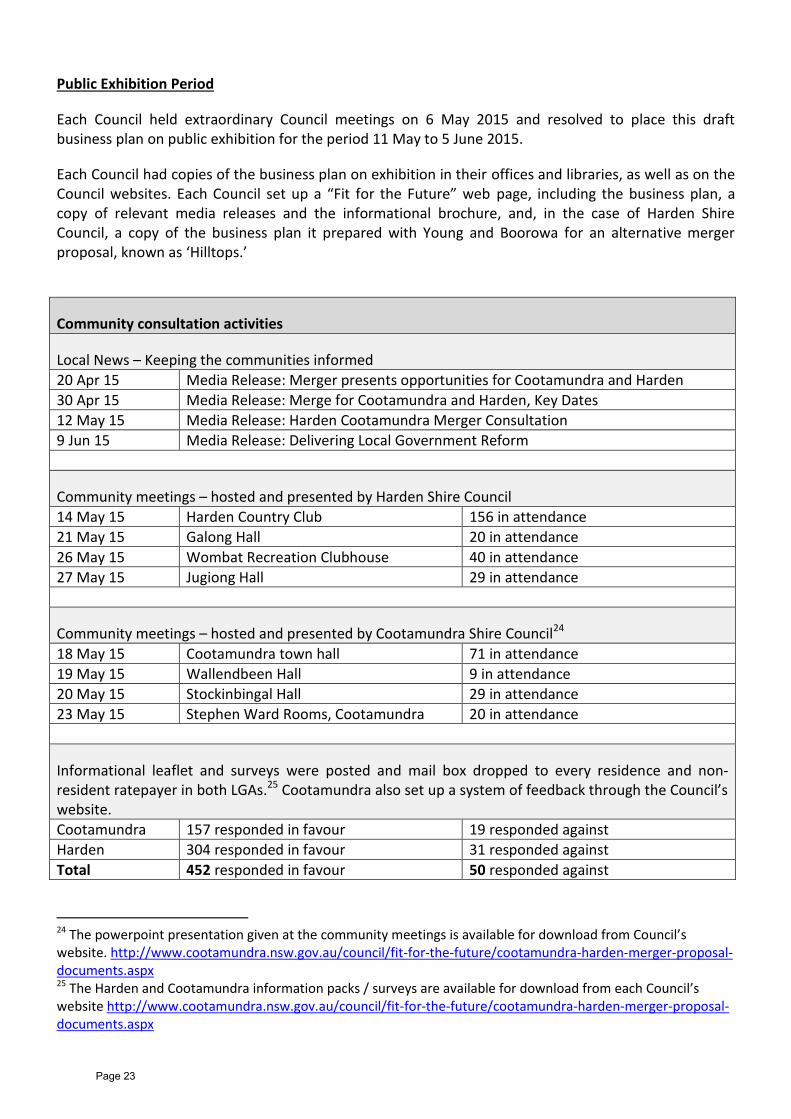
Public Exhibition Period
Each Council held extraordinary Council meetings on 6 May 2015 and resolved to place this draft business plan on public exhibition for the period 11 May to 5 June 2015.
Each Council had copies of the business plan on exhibition in their offices and libraries, as well as on the Council websites. Each Council set up a “Fit for the Future” web page, including the business plan, a copy of relevant media releases and the informational brochure, and, in the case of Harden Shire Council, a copy of the business plan it prepared with Young and Boorowa for an alternative merger proposal, known as ‘Hilltops.’
Community consultation activities
Local News – Keeping the communities informed
20 Apr 15 Media Release: Merger presents opportunities for Cootamundra and Harden
30 Apr 15 Media Release: Merge for Cootamundra and Harden, Key Dates
12 May 15 Media Release: Harden Cootamundra Merger Consultation
9 Jun 15 Media Release: Delivering Local Government Reform
Community meetings – hosted and presented by Harden Shire Council
14 May 15 Harden Country Club 156 in attendance
21 May 15 Galong Hall 20 in attendance
26 May 15 Wombat Recreation Clubhouse 40 in attendance
27 May 15 Jugiong Hall 29 in attendance
Community meetings – hosted and presented by Cootamundra Shire Council24
18 May 15 Cootamundra town hall 71 in attendance
19 May 15 Wallendbeen Hall 9 in attendance
20 May 15 Stockinbingal Hall 29 in attendance
23 May 15 Stephen Ward Rooms, Cootamundra 20 in attendance
Informational leaflet and surveys were posted and mail box dropped to every residence and non-resident ratepayer in both LGAs.25 Cootamundra also set up a system of feedback through the Council’s website.
Cootamundra 157 responded in favour 19 responded against
Harden 304 responded in favour 31 responded against
Total 452 responded in favour 50 responded against
24 The powerpoint presentation given at the community meetings is available for download from Council’s website. http://www.cootamundra.nsw.gov.au/council/fit-for-the-future/cootamundra-harden-merger-proposal-documents.aspx 25 The Harden and Cootamundra information packs / surveys are available for download from each Council’s website http://www.cootamundra.nsw.gov.au/council/fit-for-the-future/cootamundra-harden-merger-proposal-documents.aspx
Page 23
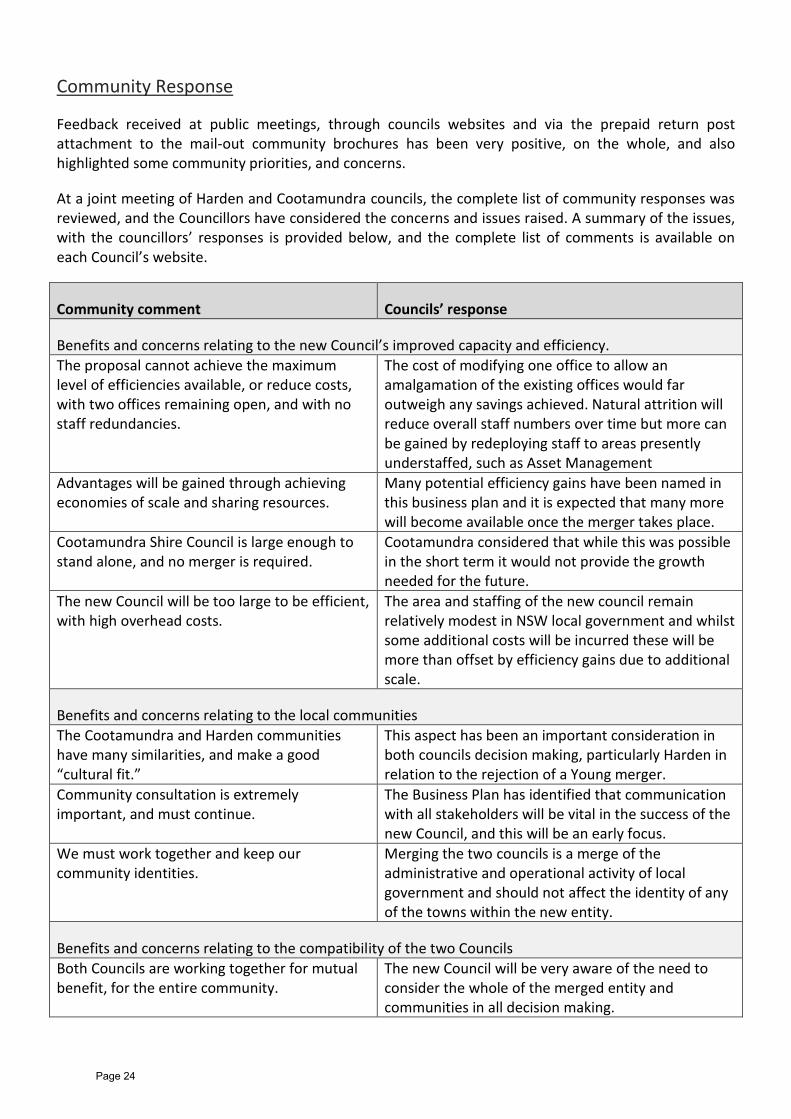
Community Response
Feedback received at public meetings, through councils websites and via the prepaid return post attachment to the mail-out community brochures has been very positive, on the whole, and also highlighted some community priorities, and concerns.
At a joint meeting of Harden and Cootamundra councils, the complete list of community responses was reviewed, and the Councillors have considered the concerns and issues raised. A summary of the issues, with the councillors’ responses is provided below, and the complete list of comments is available on each Council’s website.
Community comment Councils’ response
Benefits and concerns relating to the new Council’s improved capacity and efficiency.
The proposal cannot achieve the maximum level of efficiencies available, or reduce costs, with two offices remaining open, and with no staff redundancies.
The cost of modifying one office to allow an amalgamation of the existing offices would far outweigh any savings achieved. Natural attrition will reduce overall staff numbers over time but more can be gained by redeploying staff to areas presently understaffed, such as Asset Management
Advantages will be gained through achieving economies of scale and sharing resources.
Many potential efficiency gains have been named in this business plan and it is expected that many more will become available once the merger takes place.
Cootamundra Shire Council is large enough to stand alone, and no merger is required.
Cootamundra considered that while this was possible in the short term it would not provide the growth needed for the future.
The new Council will be too large to be efficient, with high overhead costs.
The area and staffing of the new council remain relatively modest in NSW local government and whilst some additional costs will be incurred these will be more than offset by efficiency gains due to additional scale.
Benefits and concerns relating to the local communities
The Cootamundra and Harden communities have many similarities, and make a good “cultural fit.”
This aspect has been an important consideration in both councils decision making, particularly Harden in relation to the rejection of a Young merger.
Community consultation is extremely important, and must continue.
The Business Plan has identified that communication with all stakeholders will be vital in the success of the new Council, and this will be an early focus.
We must work together and keep our community identities.
Merging the two councils is a merge of the administrative and operational activity of local government and should not affect the identity of any of the towns within the new entity.
Benefits and concerns relating to the compatibility of the two Councils
Both Councils are working together for mutual benefit, for the entire community.
The new Council will be very aware of the need to consider the whole of the merged entity and communities in all decision making.
Page 24
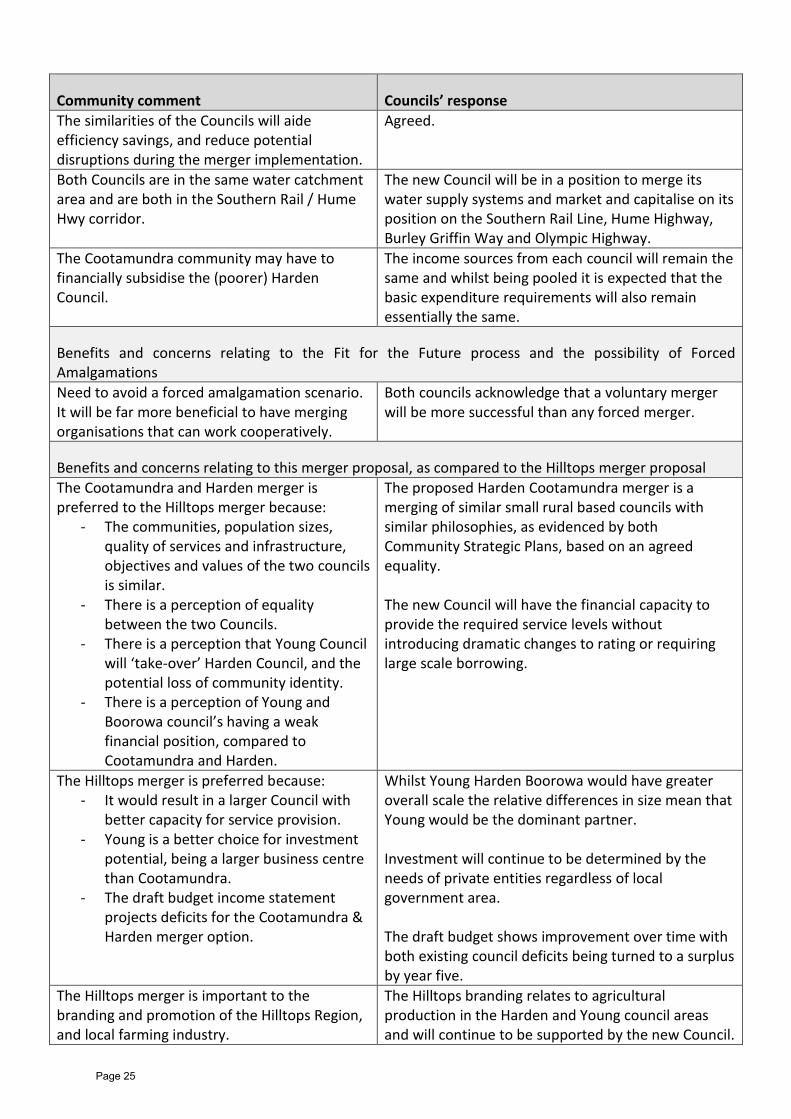
Community comment Councils’ response
The similarities of the Councils will aide efficiency savings, and reduce potential disruptions during the merger implementation.
Agreed.
Both Councils are in the same water catchment area and are both in the Southern Rail / Hume Hwy corridor.
The new Council will be in a position to merge its water supply systems and market and capitalise on its position on the Southern Rail Line, Hume Highway, Burley Griffin Way and Olympic Highway.
The Cootamundra community may have to financially subsidise the (poorer) Harden Council.
The income sources from each council will remain the same and whilst being pooled it is expected that the basic expenditure requirements will also remain essentially the same.
Benefits and concerns relating to the Fit for the Future process and the possibility of Forced Amalgamations
Need to avoid a forced amalgamation scenario. It will be far more beneficial to have merging organisations that can work cooperatively.
Both councils acknowledge that a voluntary merger will be more successful than any forced merger.
Benefits and concerns relating to this merger proposal, as compared to the Hilltops merger proposal
The Cootamundra and Harden merger is preferred to the Hilltops merger because:
- The communities, population sizes, quality of services and infrastructure, objectives and values of the two councils is similar.
- There is a perception of equality between the two Councils.
- There is a perception that Young Council will ‘take-over’ Harden Council, and the potential loss of community identity.
- There is a perception of Young and Boorowa council’s having a weak financial position, compared to Cootamundra and Harden.
The proposed Harden Cootamundra merger is a merging of similar small rural based councils with similar philosophies, as evidenced by both Community Strategic Plans, based on an agreed equality. The new Council will have the financial capacity to provide the required service levels without introducing dramatic changes to rating or requiring large scale borrowing.
The Hilltops merger is preferred because: - It would result in a larger Council with
better capacity for service provision. - Young is a better choice for investment
potential, being a larger business centre than Cootamundra.
- The draft budget income statement projects deficits for the Cootamundra & Harden merger option.
Whilst Young Harden Boorowa would have greater overall scale the relative differences in size mean that Young would be the dominant partner. Investment will continue to be determined by the needs of private entities regardless of local government area. The draft budget shows improvement over time with both existing council deficits being turned to a surplus by year five.
The Hilltops merger is important to the branding and promotion of the Hilltops Region, and local farming industry.
The Hilltops branding relates to agricultural production in the Harden and Young council areas and will continue to be supported by the new Council.
Page 25
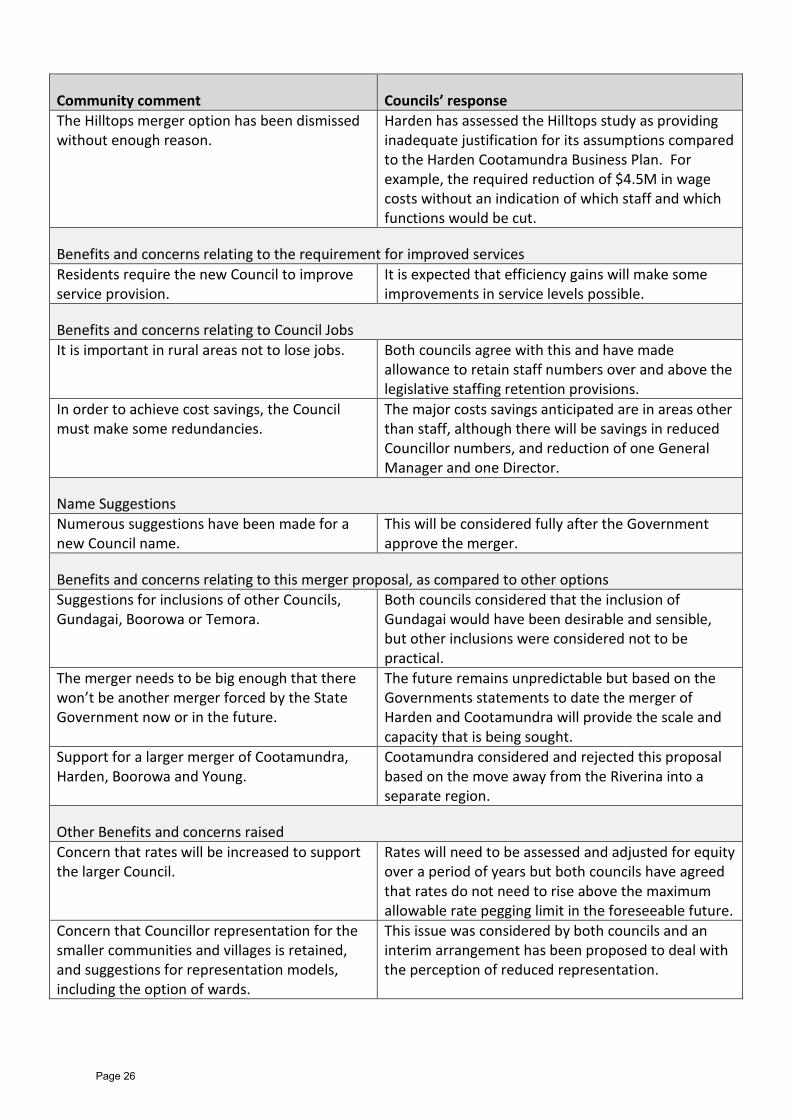
Community comment Councils’ response
The Hilltops merger option has been dismissed without enough reason.
Harden has assessed the Hilltops study as providing inadequate justification for its assumptions compared to the Harden Cootamundra Business Plan. For example, the required reduction of $4.5M in wage costs without an indication of which staff and which functions would be cut.
Benefits and concerns relating to the requirement for improved services
Residents require the new Council to improve service provision.
It is expected that efficiency gains will make some improvements in service levels possible.
Benefits and concerns relating to Council Jobs
It is important in rural areas not to lose jobs. Both councils agree with this and have made allowance to retain staff numbers over and above the legislative staffing retention provisions.
In order to achieve cost savings, the Council must make some redundancies.
The major costs savings anticipated are in areas other than staff, although there will be savings in reduced Councillor numbers, and reduction of one General Manager and one Director.
Name Suggestions
Numerous suggestions have been made for a new Council name.
This will be considered fully after the Government approve the merger.
Benefits and concerns relating to this merger proposal, as compared to other options
Suggestions for inclusions of other Councils, Gundagai, Boorowa or Temora.
Both councils considered that the inclusion of Gundagai would have been desirable and sensible, but other inclusions were considered not to be practical.
The merger needs to be big enough that there won’t be another merger forced by the State Government now or in the future.
The future remains unpredictable but based on the Governments statements to date the merger of Harden and Cootamundra will provide the scale and capacity that is being sought.
Support for a larger merger of Cootamundra, Harden, Boorowa and Young.
Cootamundra considered and rejected this proposal based on the move away from the Riverina into a separate region.
Other Benefits and concerns raised
Concern that rates will be increased to support the larger Council.
Rates will need to be assessed and adjusted for equity over a period of years but both councils have agreed that rates do not need to rise above the maximum allowable rate pegging limit in the foreseeable future.
Concern that Councillor representation for the smaller communities and villages is retained, and suggestions for representation models, including the option of wards.
This issue was considered by both councils and an interim arrangement has been proposed to deal with the perception of reduced representation.
Page 26
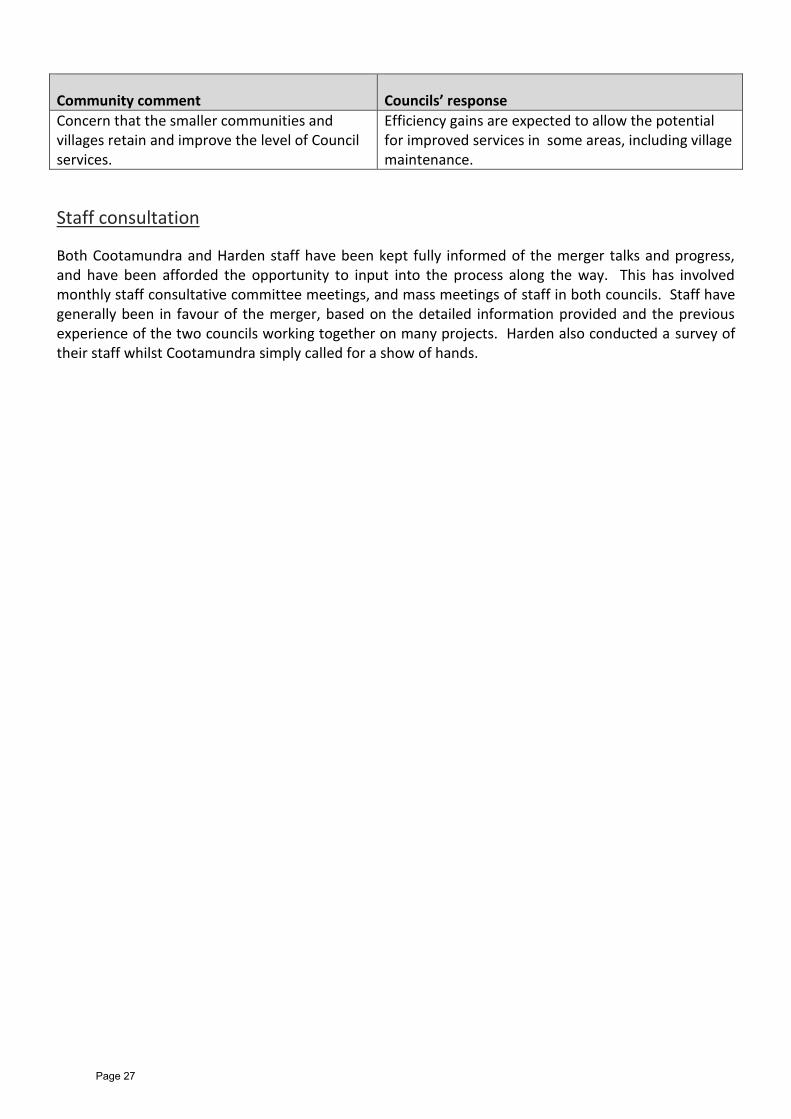
Community comment Councils’ response
Concern that the smaller communities and villages retain and improve the level of Council services.
Efficiency gains are expected to allow the potential for improved services in some areas, including village maintenance.
Staff consultation
Both Cootamundra and Harden staff have been kept fully informed of the merger talks and progress, and have been afforded the opportunity to input into the process along the way. This has involved monthly staff consultative committee meetings, and mass meetings of staff in both councils. Staff have generally been in favour of the merger, based on the detailed information provided and the previous experience of the two councils working together on many projects. Harden also conducted a survey of their staff whilst Cootamundra simply called for a show of hands.
Page 27
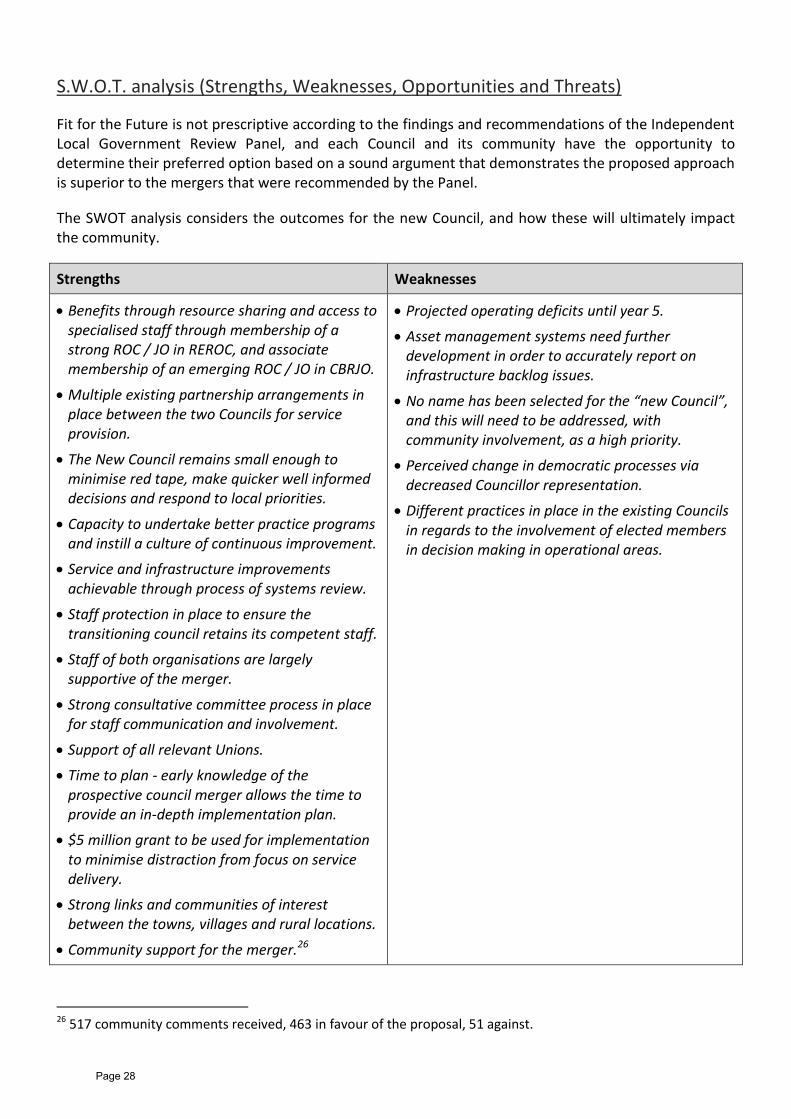
S.W.O.T. analysis (Strengths, Weaknesses, Opportunities and Threats)
Fit for the Future is not prescriptive according to the findings and recommendations of the Independent Local Government Review Panel, and each Council and its community have the opportunity to determine their preferred option based on a sound argument that demonstrates the proposed approach is superior to the mergers that were recommended by the Panel.
The SWOT analysis considers the outcomes for the new Council, and how these will ultimately impact the community.
Strengths Weaknesses
Benefits through resource sharing and access to specialised staff through membership of a strong ROC / JO in REROC, and associate membership of an emerging ROC / JO in CBRJO.
Multiple existing partnership arrangements in place between the two Councils for service provision.
The New Council remains small enough to minimise red tape, make quicker well informed decisions and respond to local priorities.
Capacity to undertake better practice programs and instill a culture of continuous improvement.
Service and infrastructure improvements achievable through process of systems review.
Staff protection in place to ensure the transitioning council retains its competent staff.
Staff of both organisations are largely supportive of the merger.
Strong consultative committee process in place for staff communication and involvement.
Support of all relevant Unions.
Time to plan - early knowledge of the prospective council merger allows the time to provide an in-depth implementation plan.
$5 million grant to be used for implementation to minimise distraction from focus on service delivery.
Strong links and communities of interest between the towns, villages and rural locations.
Community support for the merger.26
Projected operating deficits until year 5.
Asset management systems need further development in order to accurately report on infrastructure backlog issues.
No name has been selected for the “new Council”, and this will need to be addressed, with community involvement, as a high priority.
Perceived change in democratic processes via decreased Councillor representation.
Different practices in place in the existing Councils in regards to the involvement of elected members in decision making in operational areas.
26 517 community comments received, 463 in favour of the proposal, 51 against.
Page 28
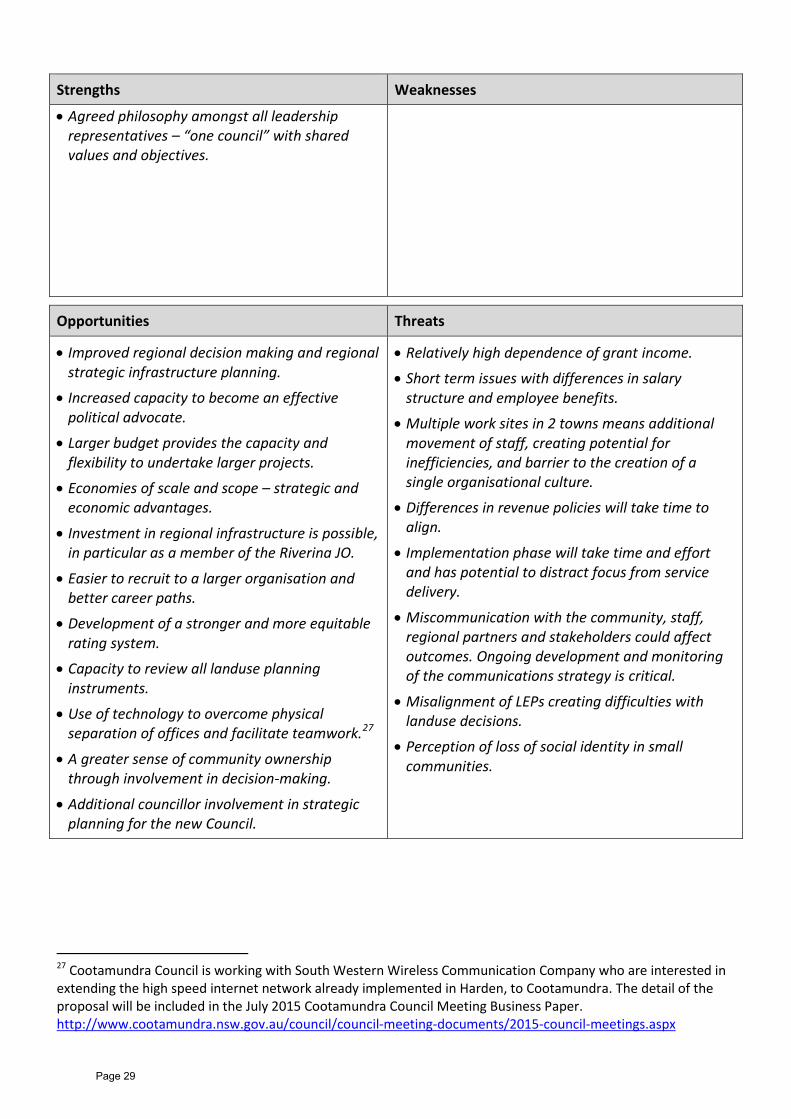
Strengths Weaknesses
Agreed philosophy amongst all leadership representatives – “one council” with shared values and objectives.
Opportunities Threats
Improved regional decision making and regional strategic infrastructure planning.
Increased capacity to become an effective political advocate.
Larger budget provides the capacity and flexibility to undertake larger projects.
Economies of scale and scope – strategic and economic advantages.
Investment in regional infrastructure is possible, in particular as a member of the Riverina JO.
Easier to recruit to a larger organisation and better career paths.
Development of a stronger and more equitable rating system.
Capacity to review all landuse planning instruments.
Use of technology to overcome physical separation of offices and facilitate teamwork.27
A greater sense of community ownership through involvement in decision-making.
Additional councillor involvement in strategic planning for the new Council.
Relatively high dependence of grant income.
Short term issues with differences in salary structure and employee benefits.
Multiple work sites in 2 towns means additional movement of staff, creating potential for inefficiencies, and barrier to the creation of a single organisational culture.
Differences in revenue policies will take time to align.
Implementation phase will take time and effort and has potential to distract focus from service delivery.
Miscommunication with the community, staff, regional partners and stakeholders could affect outcomes. Ongoing development and monitoring of the communications strategy is critical.
Misalignment of LEPs creating difficulties with landuse decisions.
Perception of loss of social identity in small communities.
27 Cootamundra Council is working with South Western Wireless Communication Company who are interested in extending the high speed internet network already implemented in Harden, to Cootamundra. The detail of the proposal will be included in the July 2015 Cootamundra Council Meeting Business Paper. http://www.cootamundra.nsw.gov.au/council/council-meeting-documents/2015-council-meetings.aspx
Page 29
The Merger Action Plan
Goals and objectives
The goal of the merger of Cootamundra and Harden Shire Councils is to achieve better outcomes by working together.
The new Council will continue to provide the same, or better services to the existing community, in a more strategic and sustainable way.
Productivity gains will be achieved through better use of combined resources, rationalisation of plant and assets without compromising service delivery, and retaining and redeploying human resources to achieve more and better quality outcomes.
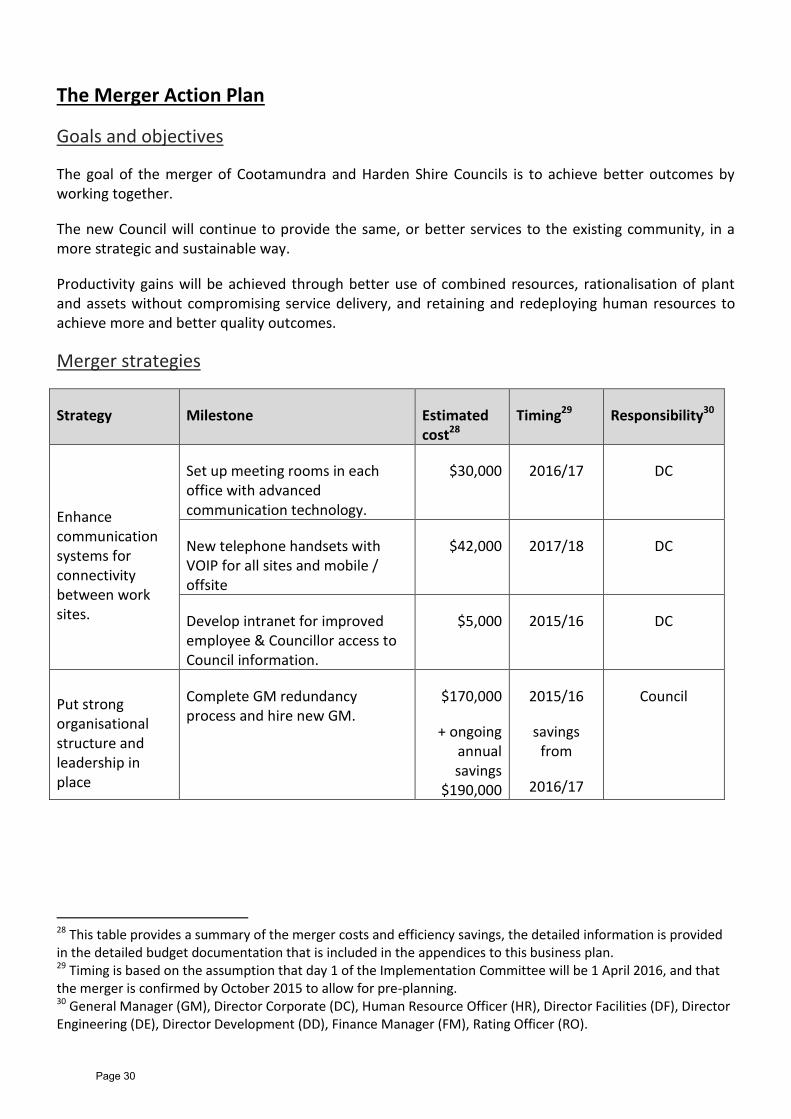
Merger strategies
Strategy Milestone Estimated cost28
Timing29 Responsibility30
Enhance communication systems for connectivity between work sites.
Set up meeting rooms in each office with advanced communication technology.
$30,000 2016/17 DC
New telephone handsets with VOIP for all sites and mobile / offsite
$42,000 2017/18 DC
Develop intranet for improved employee & Councillor access to Council information.
$5,000 2015/16 DC
Put strong organisational structure and leadership in place
Complete GM redundancy process and hire new GM.
$170,000
+ ongoing annual savings
$190,000
2015/16
savings from
2016/17
Council
28 This table provides a summary of the merger costs and efficiency savings, the detailed information is provided in the detailed budget documentation that is included in the appendices to this business plan. 29 Timing is based on the assumption that day 1 of the Implementation Committee will be 1 April 2016, and that the merger is confirmed by October 2015 to allow for pre-planning. 30 General Manager (GM), Director Corporate (DC), Human Resource Officer (HR), Director Facilities (DF), Director Engineering (DE), Director Development (DD), Finance Manager (FM), Rating Officer (RO).
Page 30
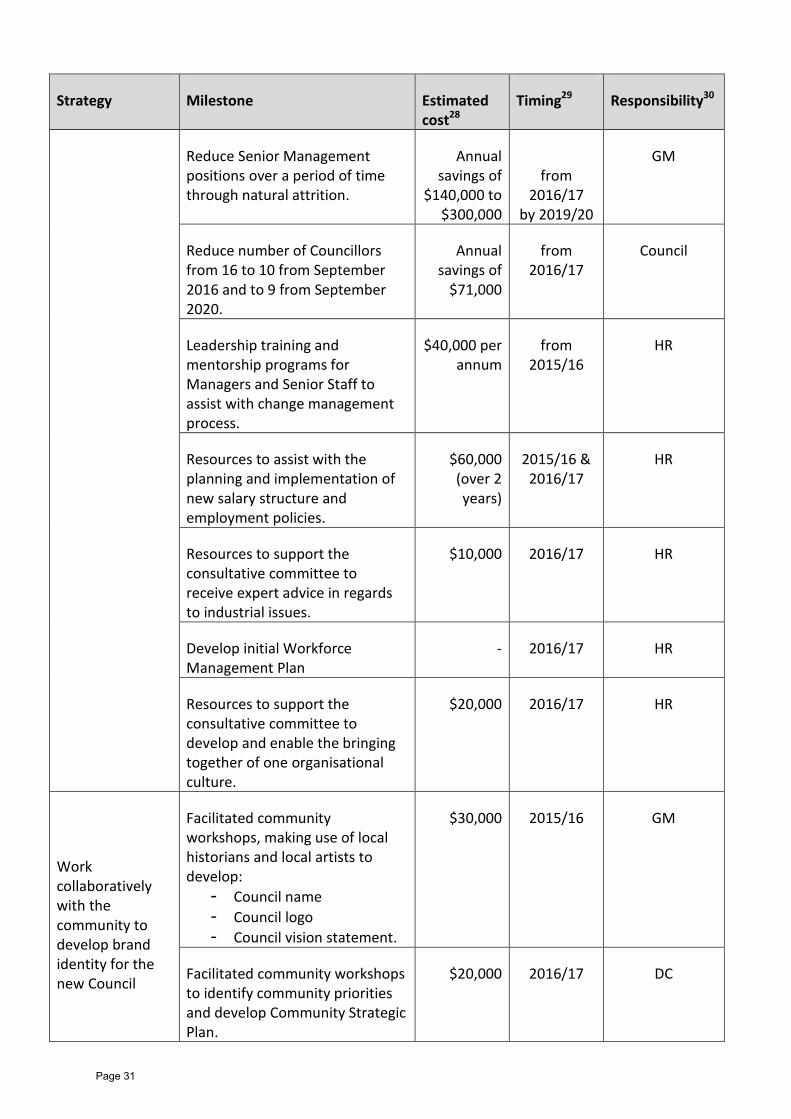
Strategy Milestone Estimated cost28
Timing29 Responsibility30
Reduce Senior Management positions over a period of time through natural attrition.
Annual savings of
$140,000 to $300,000
from
2016/17 by 2019/20
GM
Reduce number of Councillors from 16 to 10 from September 2016 and to 9 from September 2020.
Annual savings of
$71,000
from 2016/17
Council
Leadership training and mentorship programs for Managers and Senior Staff to assist with change management process.
$40,000 per annum
from 2015/16
HR
Resources to assist with the planning and implementation of new salary structure and employment policies.
$60,000 (over 2 years)
2015/16 & 2016/17
HR
Resources to support the consultative committee to receive expert advice in regards to industrial issues.
$10,000 2016/17 HR
Develop initial Workforce Management Plan
- 2016/17 HR
Resources to support the consultative committee to develop and enable the bringing together of one organisational culture.
$20,000 2016/17 HR
Work collaboratively with the community to develop brand identity for the new Council
Facilitated community workshops, making use of local historians and local artists to develop:
- Council name
- Council logo
- Council vision statement.
$30,000 2015/16 GM
Facilitated community workshops to identify community priorities and develop Community Strategic Plan.
$20,000 2016/17 DC
Page 31
Strategy Milestone Estimated cost28
Timing29 Responsibility30
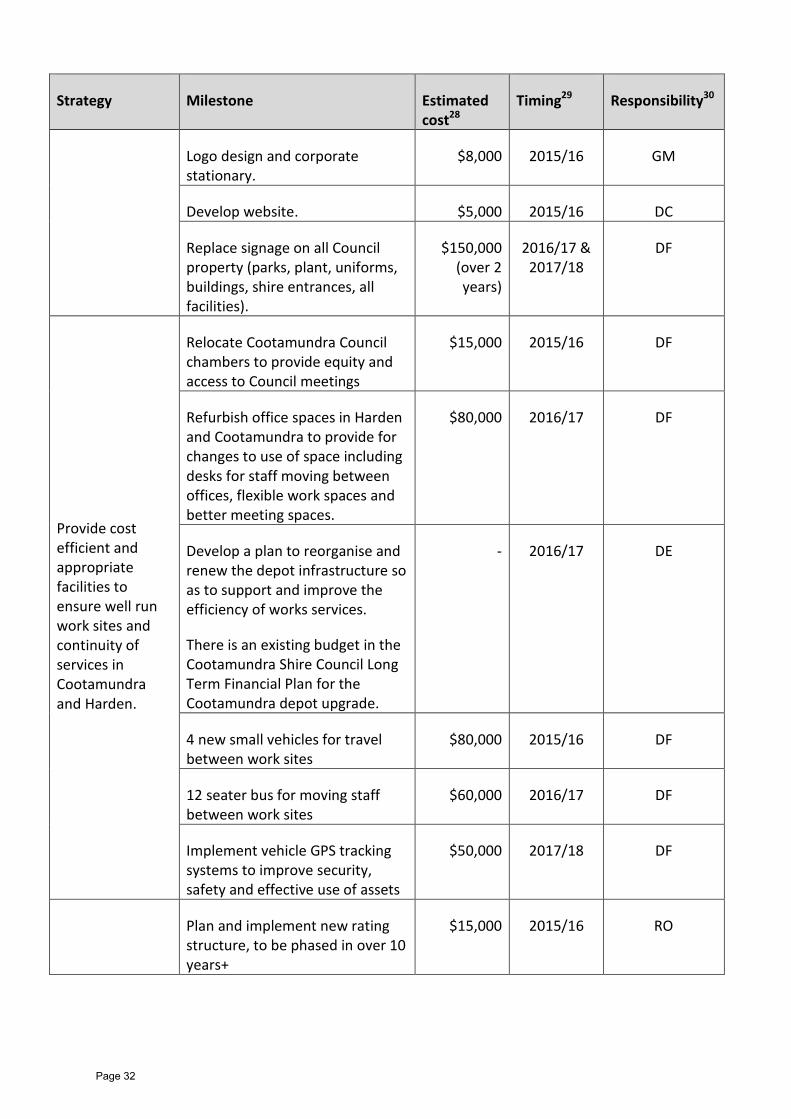
Logo design and corporate stationary.
$8,000 2015/16 GM
Develop website. $5,000 2015/16 DC
Replace signage on all Council property (parks, plant, uniforms, buildings, shire entrances, all facilities).
$150,000 (over 2 years)
2016/17 & 2017/18
DF
Provide cost efficient and appropriate facilities to ensure well run work sites and continuity of services in Cootamundra and Harden.
Relocate Cootamundra Council chambers to provide equity and access to Council meetings
$15,000 2015/16 DF
Refurbish office spaces in Harden and Cootamundra to provide for changes to use of space including desks for staff moving between offices, flexible work spaces and better meeting spaces.
$80,000 2016/17 DF
Develop a plan to reorganise and renew the depot infrastructure so as to support and improve the efficiency of works services.
There is an existing budget in the Cootamundra Shire Council Long Term Financial Plan for the Cootamundra depot upgrade.
- 2016/17 DE
4 new small vehicles for travel between work sites
$80,000 2015/16 DF
12 seater bus for moving staff between work sites
$60,000 2016/17 DF
Implement vehicle GPS tracking systems to improve security, safety and effective use of assets
$50,000 2017/18 DF
Plan and implement new rating structure, to be phased in over 10 years+
$15,000 2015/16 RO
Page 32
Strategy Milestone Estimated cost28
Timing29 Responsibility30
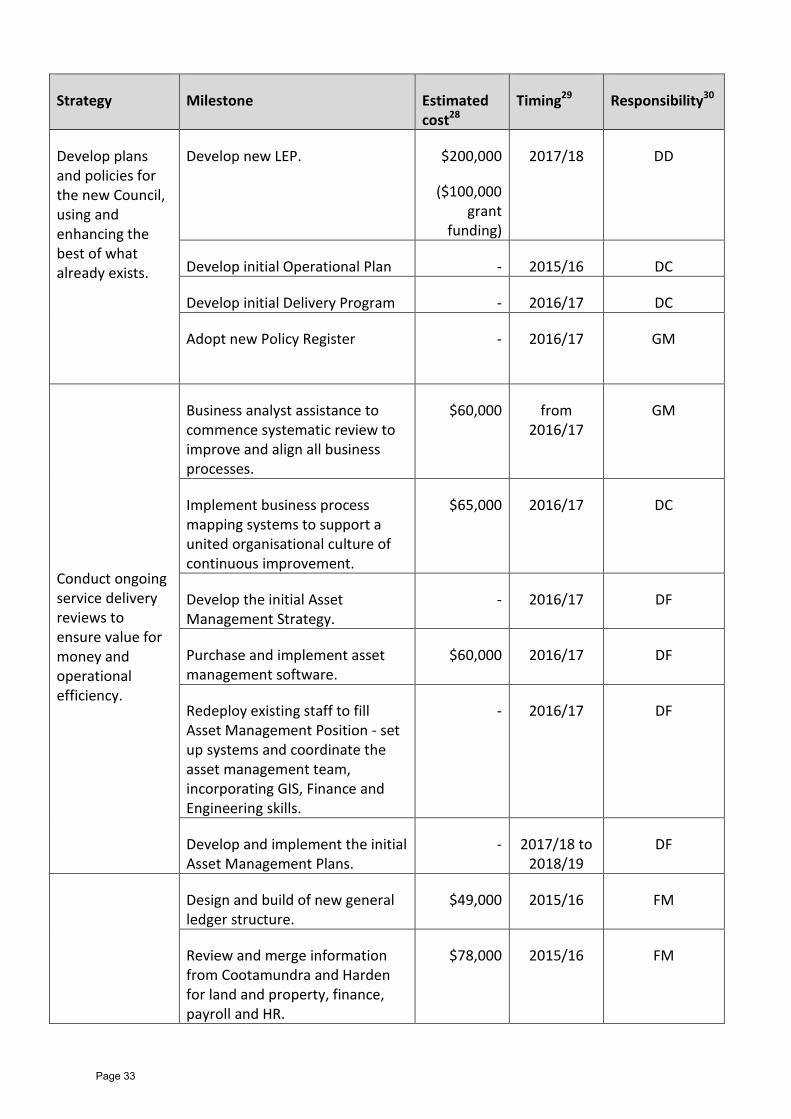
Develop plans and policies for the new Council, using and enhancing the best of what already exists.
Develop new LEP. $200,000
($100,000 grant
funding)
2017/18 DD
Develop initial Operational Plan - 2015/16 DC
Develop initial Delivery Program - 2016/17 DC
Adopt new Policy Register
- 2016/17 GM
Conduct ongoing service delivery reviews to ensure value for money and operational efficiency.
Business analyst assistance to commence systematic review to improve and align all business processes.
$60,000 from 2016/17
GM
Implement business process mapping systems to support a united organisational culture of continuous improvement.
$65,000 2016/17 DC
Develop the initial Asset Management Strategy.
- 2016/17 DF
Purchase and implement asset management software.
$60,000 2016/17 DF
Redeploy existing staff to fill Asset Management Position - set up systems and coordinate the asset management team, incorporating GIS, Finance and Engineering skills.
- 2016/17 DF
Develop and implement the initial Asset Management Plans.
- 2017/18 to 2018/19
DF
Design and build of new general ledger structure.
$49,000 2015/16 FM
Review and merge information from Cootamundra and Harden for land and property, finance, payroll and HR.
$78,000 2015/16 FM
Page 33

Strategy Milestone Estimated cost28
Timing29 Responsibility30
Transition to merged corporate systems that provide a platform for strong financial and information management
Additional temporary staffing to assist with the amalgamation of corporate software systems
$80,000 2015/16 FM
Budgeting software upgrades $8,800 2015/16 FM
Cemetery software system implementation.
$10,000 2015/16 DF
Develop initial Long Term Financial Plan.
- 2015/16 FM
Develop initial Annual Report. - 2016/17 DC
Review existing records management systems merge records in to the best system.
$70,000 2016/17 DC
Page 34
Productivity gains
Each service and function of Council will be improved through efficiencies that can be gained by better use of physical resources, human resources, systems and processes and service delivery. Productivity gains will be realised by combining resources and working together, removing duplication, streamlining processes and focusing on a best practice approach for each Council function.
Library
Cootamundra is presently a member of the largest and most successful regional library (RRL) in NSW. The ability to incorporate Harden library into RRL will provide access to a large range of services and expertise in delivery of library services. The ability to coordinate and move staff within the new Council will allow greater flexibility in the delivery of library services and hours of operation of both libraries.
Waste Management
Currently, both councils are members of the South West Regional Waste Management Group (SWRWMG) and both deliver putrescible waste to Bald Hill. The waste collection systems would be rationalised by using a single coordinated pickup covering the whole new Council. This would allow better utilisation of plant and waste depots in the collection process and allow additional collection services to all villages.
Water & Sewer
Both councils currently supply water and sewer services internally. The new Council would combine the present staff, plant and expertise, allowing more flexibility to undertake major works in-house. A new single meter reading and water billing system would be developed, reducing time presently allocated to these tasks. A combined asset management system would be developed allowing better planning for future works. Currently both councils are required to report independently to the Office of Water and the EPA for a large number of requirements, including Best Practice performance and Load Based Licensing, and there will be significant savings in staff time and effort in one reporting system.
Information Technology
Both councils currently use the same software systems for all applications, except Records. This compatibility will ensure the setup cost for the new Council’s corporate system is minimised, and will assist staff from both councils who will already have expertise in use of the software. Each council presently uses a different contractor to maintain its system and this would be rationalised based on need. Scale and capacity in the new Council will also allow staff time to be aimed at improving the current GIS and GPS systems.
Depots
Both councils currently operate old and barely adequate depots (Harden x 1, Cootamundra x 2). Cootamundra is presently negotiating to purchase a recently upgraded ex Public Works depot which would allow the relocation of the majority of major work to a single location. This would be complemented by an upgrade of the depot in Harden as the base for breakdown vehicles and mechanics. This will reduce duplication, increase technical expertise, allow more in-house service work to be undertaken and improve training opportunities for apprentices.
Page 35
Plant
Both councils presently have a full complement of up to date plant. The merger will allow greater utilisation of some presently underutilised plant and enable works to be better planned across the larger area. In addition, there will be a reduction in duplication of plant. It will also create greater in-house capacity and less reliance on outside contractors, giving greater control over activity planning and emergency works. Harden has a bitumen spraying truck, pavement profiler, float and kerb and gutter machine and Cootamundra a street sweeper, elevated work platform and wood chipper, all of which are specialist machines that will be better utilised by the new Council.
Engineering
Both councils employ qualified civil engineering staff but neither have a staff large enough to cover management, supervision, survey, design and compliance. The relative strengths of each council when merged will allow for the full range of engineering skills to be managed in house, potentially leading to savings in the employment of consultants, particularly in the survey and design area. Harden’s design engineer and up to date survey equipment coupled with Cootamundra’s cadet engineer have capacity to provide survey and design services potentially saving $60,000 per annum.
State Roads
Both councils have separate Road Maintenance Council Contracts (RMCC) with RMS. The combined RMS road length (143km) will allow better plant and equipment utilisation and minimisation of duplication in management planning with RMS. Merging of staff and plant would allow the new Council to undertake larger projects, and potentially contract to other organisations. The present Cootamundra Quality Officer and dedicated State Road maintenance crew system would be extended through the new Council providing an improved partnership with RMS and more efficient management of the State Road network.
Local Road Network
The new Council will have the capacity to develop a combined asset management system and better manage the forward planning for the 1,468km road network. It would also provide greater capacity to undertake larger and more complex work whilst still undertaking routine maintenance work. It would also give the ability to undertake ‘in-house’ plant operator training and develop greater expertise in specific areas.
Customer Service
The existing offices in Harden and Cootamundra will remain and will continue to provide two points of contact for customer service enquiries. A single customer service request system will be developed allowing a single supervisor to co-ordinate customer service holistically, for the new Council.
Planning
The new Council will combine existing strategic planning groups into one location which will allow increased expertise in-house to be released from day to day development work and provide the ability to undertake heritage assessment and more detailed future planning. This will also allow the continued development of e-planning systems to create greater public access to the new Council. Two LEPs will be combined into one, with existing skilled strategic planning staff able to complete much of the work in-house, and reducing the ongoing duplicated cost of developing and maintaining separate planning instruments.
Page 36
Building Control
Both councils have qualified building staff, and have already begun sharing their expertise and availability for building inspection services across the new Council area. This cooperative approach will continue to allow better coordination of inspections and approvals due to combined staff resources and easier access to staff by developers and builders.
Property Management
The new Council will have the opportunity to rationalise the number and use of public buildings by using a single booking system and asset management system.
Cemeteries
The new Council will appoint a single dedicated cemetery records officer and rationalisation of the present cemetery records systems will be possible with more resources for records inputting and maintenance into a digitised system. The merger of existing operations will allow the allocation of existing cemetery staff in a more coordinated manner.
Parks and Sporting Grounds
Parks and sporting grounds will be brought under a single coordinator and the development of a computerised booking system will allow maintenance to be carried out at the most effective time. Staff will be available to undertake larger works programs, using additional plant and expertise available.
Swimming Pools
The new Council will have three pools coordinated by a single recreation officer allocating tasks and overseeing pool and stadium staff and operations. This will provide the capacity to move staff between pools as needed, avoiding excessive use of casual staff, and increase the ability to offer training and exercise classes.
Emergency Services
Both councils are part of the South West RFS zone and will appoint a single officer to undertake RFS administration, and one system for financial reporting. In addition, the new Council will reduce duplication of secretariat work for the local emergency management committee, which can be combined into one, and emergency management planning documents that can also be combined.
Animal Control
The merger gives opportunity for a single dedicated animal control officer rather than two ‘tacked on’ positions, and increases capacity for regular patrols, education programs, animal re-homing and micro- chipping at Cootamundra’s recently constructed animal pound.
Noxious Weeds
At present one council uses staff, and one council uses a county council structure to undertake the noxious weed function. After a full investigation one delivery method will be chosen to give the best cost benefit result.
Page 37

Human Resources (HR)
Each council has a specialised HR officer. The merger will improve capacity for both officers to specialise and enable additional focus on internal training and development, leadership training, salary system development and performance management.
Environmental Health Officer (EHO)
The merger will allow the present two qualified EHO’s to coordinate food, health, skin penetration and septic tank inspections over the new council area, and provide a higher level of public health services and education to residents.
Tourism
The two councils are presently part of the Canberra Region, Gold Trails Route and Riverina Regional Tourism groups, capitalising on regional associations and volunteers to manage multiple tourist facilities and events. The merger will allow for a dedicated officer (with Economic Development) and better coordination of effort.
Governance
The new Council will achieve cost savings from the reduction in number of Councillors from the existing 16 to 10 in the first term of the new Council, reducing to 9 in the second term of the new Council. Savings will also be achieved by the reduction of one General Manager and one Director in the new organisational structure.
Page 38
Human Resource Management
Workplace Governance and Culture
The new Council will continue to operate under a framework of governance related legislation including:
Local Government Act 1993
Guidelines for the Model Code of Conduct for Local Councils
Protected Disclosures Act 1994
Public Interest Disclosures Guidelines
Local Government (State) Award
Work Health and Safety Act 2011
Anti-Discrimination Act 1977
Anti-Discrimination Board (Workplace Guidelines)
These statutory requirements establish the platform on which workforce policies have and will continue to be based. The merging of Cootamundra and Harden councils will facilitate the opportunity for assessment and review of common policies and development and implementation of best practice policy and procedure, and the provision of clear guidance to the new Council, management and staff for decision making purposes.
Both councils share a similar workforce leadership and decision-making philosophy. Staff at all levels are and will continue to be valued team members, who through their work exposure and experience provide valuable input and contribute to important information gathering and reporting processes. With both organisations exercising similar inclusive and collaborative leadership it is expected that the workplace culture will assist the transition to a new Council.
Contributing to this inclusive and valued workplace culture will be the continuation of existing staff communication and engagement practices, principally through established Workplace Consultative Committees and Work Health and Safety Committees. These employee consultation forums have been integral to effective working and employee relations with staff and their representative unions.
Employee Support and Development
Workplace change and reform will be carefully managed through communication and staff engagement strategies including, but not limited to, the Consultative Committee. Working groups for individual functional areas, especially where there are extensive workloads or where there is duplication of roles, will contribute to the job re-design and re-structuring process, also enhancing communications between management and the frontline work groups. The Councils are committed to working closely with all Unions throughout the implementation of this workplace change and reform.
Staff retention will be a significant focus for the proposed new Council. As has been identified in the Strategic Priorities there is opportunity for the new Council to extend and improve service delivery and it is expected to be able to achieve this utilising the existing workforce in its entirety, given that the existing organisations have operated with lean workforces. Job re-structuring and re-design will create new opportunities for staff, and more critically will make provision for increased specialisation, whilst preserving a solid foundation skill-base and frontline service delivery.
Identification of specialised key roles will create opportunities for the professional development of existing staff, through training and immediate application of skills. Additionally, the increased ability to provide resources for relief operations will accommodate increased access to training and development
Page 39
opportunities for all staff. This will enhance organisational capability and capacity for future redeployment to meet organisational objectives, at the same time providing job security to employees.
Consideration of Local Government (State) Award provisions for flexible working arrangements and phased retirement will provide the Council with options for workforce planning as well as support mechanisms to the workforce. Consultation with staff will identify work-life balance concerns and alternative solutions for job re-design and enhanced productivity.
Organisational Training Priorities
Continuity and enhancement of service delivery and successful operations pre and post-merger will be dependent on some key training priorities.
Digital & Technological Literacy: The continual emergence and upgrade of communications and information management technologies will facilitate effective co-ordination of service delivery. Applicable and job relevant training for smart technologies, communication and conferencing will be essential.
Systems: Effective systems, procedures and process training will be critical for effective and efficient service delivery.
Leadership: Training and mentorship programs for Managers and Senior Staff to assist with the change management process and to develop organisational capability will be essential.
Representation & Consultation: Training for staff representatives to effectively engage and consult with employees, to report to management, and to support the change management process will be critical for the implementation of changes to salary and WHS administration, employment policies, and to enable communication and engagement strategies to achieve a cohesive workplace culture.
Skill Retention Strategies
Cootamundra’s recently revised (2010) Salary System, which integrates the Human Resource functions of recruitment, training and development, performance management and remuneration, will serve the merged organisation well into the future in ensuring skills are retained and knowledge is successfully transferred.
The system captures the essential and developed skills and knowledge required to enter, competently perform and extend a role in a detailed Position Description. This information is used to:
Determine appropriate and equitable remuneration using an industry specific and Award based job-evaluation system.
Attract and recruit candidates through detailed description of responsibilities, duties and clearly defined selection criteria for the role.
Identify skills gaps and determine individual training requirements.
Identify opportunities for career advancement and professional development.
Encourage the transfer of skills and knowledge by way of multi-skilling, up-skilling and undertaking relief duties, as well as built in mentoring of others.
Provide the foundation for succession planning.
The Salary System also identifies core performance and safety criteria to establish the expected standards of workplace performance and safety. An annual review process ensures staff are routinely reminded of the expectations, and failure to perform as expected impacts on salary review. This same
Page 40
annual review is also the means by which skills are audited, assessed and developed, as well as the means by which the relevance and accuracy of position descriptions is checked and maintained.
Adoption of this established system by the new Council will benefit staff through the provision of fairness and equity in access to assessment, training and salary review, and will also enable the Council to monitor and retain its skill requirements for effective service delivery. The system has been developed in consultation with the relevant Unions and has been endorsed by them as one which is transferable amongst councils, promotes equity and creates career paths. Therefore the potential for industrial dispute is minimised.
This system will also serve to support other attraction and retention strategies currently exercised by the existing Councils. Cootamundra has implemented a ‘Grow Your Own’ initiative and has an established Traineeship system offering attractive incentives to new entrants to the Local Government sector in a range of positions. This approach has been applied with a broader industry-wide perspective, whereby opportunity to gain entry level skills within the local community are offset by the attractiveness of a prospective career in Local Government that may be geographically diverse and transferable.
Harden alternatively, has adopted an HR strategy, where considerable investment has been made into developing the skills of existing employees and retaining skilled and high performing staff. An integrated salary system as detailed above has the potential to be adapted to incorporate both initiatives.
Workplace Equity & Diversity
In accordance with the Local Government Act 1993, the new Council will prepare an Equal Employment Opportunity (EEO) Management Plan to ensure workplace equity and diversity and integration with the Community Strategic Plan and Delivery Program. Workplace equity and diversity initiatives will assist Council to address common issues for the existing councils, such as the following:
Skill Shortages – The potential employment pool available to Council will be maximised by initiatives to attract candidates from labour pools such as women, indigenous people, carers, single parents and migrants. Tapping into such non-traditional labour pools will contribute to addressing skills shortages not only at the local level but regionally and across the industry.
Ageing Workforce - Council will consider appropriate strategies to address the widespread concern of an ageing workforce in an ageing population. The retention of valuable experience and knowledge may be achieved through initiatives such as phased retirement, job-sharing and part-time work arrangements, which at the same time would provide older workers with job security and opportunity to continue their working lives safely.
Community Engagement – Employment initiatives which attract targeted populations and demographics will have the potential to improve engagement with those members of the community, and improve participation in activities.
Page 41
Asset management
Asset Management Capacity and Maturity
The current level of asset management awareness within Cootamundra and Harden councils is of a moderate standard, with the primary focus being on delivering each council’s adopted programs. Each service area has developed processes to deliver the adopted program of works, and each council has good asset knowledge and data for most classes of assets. The next stage in developing the asset management maturity for the new Council will require consolidating and improving corporate systems, developing internal asset management capacity and improving long term planning.
Skilled People
The new Council will have a team of skilled professional staff with finance, engineering and GIS qualifications and experience. Once the new Councils is created, and duplicated activities are ceased, skilled staff will be redeployed into asset management roles. The new Council will establish an Asset Management Team to develop the initial Asset Management Strategies and Asset Management Plans, and these will be informed by community discussion and engagement.
Future revisions of the asset management plan will incorporate community consultation on service levels and costs of providing the service. This will assist the new Council and the community in matching the level of service needed by the community, service risks and consequences, with the community’s ability to pay for the service.
Reliable Data
Cootamundra and Harden councils have improved and developed their asset management practices over recent years, having undertaken thorough asset revaluation processes for all classes of assets. The majority of assets have been captured electronically, asset quantities have been validated and recorded, unit rates have been refined and substantiated, assets have been inspected and condition assessments have been applied.
Asset data has been recorded and componentised based on life expectancy and depreciation rates, and staff have recognised the need to improve the detail of the componentisation, and evidenced based assessment of the estimated useful life.
Regional Benchmarking Project for Depreciation and Sustainability
Cootamundra, along with 23 councils from REROC and RAMROC, has recently begun using an asset management solution developed by Jeff Roorda & Associates, to provide asset revaluations and reporting, and assist with the recording of consistent and validated data. The regional collaboration will enable a consistent methodology for the determination of the cost to bring to satisfactory, the assessment of asset consumption and the reported depreciation expense. The use of the system will be extended to include the new Council.
The consultants have released a preliminary report identifying regional road network life cycle costs which have been calculated for road management activities. The revaluation of transport assets is in progress, and there is evidence that increased asset componentisation and more accurate and longer useful lives will result in an appreciable reduction in the depreciation expense of the new Council. A conservative estimate of this reduction has been included in the five year budget projections at year 2.
Page 42
The following factors will be used to improve the accuracy of the depreciation expense estimation, and improved asset management planning. The objective is to provide better value infrastructure services.
Council’s road network will be evaluated for traffic volumes, and road ratings for high or low usage will affect the useful life estimation and maintenance schedules. This will result in extended average useful lives, and more effective use of maintenance and renewal budgets.
The revaluation of gravel roads will take into account the percentage of the road network that has been resheeted with additional gravel material, as compared to the majority of the network that is maintained only with grading of formed natural surfaces. This revaluation will significantly reduce the gross book value of the unsealed road network, and the associated depreciation expense. For example, Cootamundra has 222kms of unsealed road, of which, 10% has been resheeted within the past 10 years. The estimated useful life of the gravel resheet is 10 years. The depreciation expense associated with the resheet is calculated as the unit cost of $32,000 per km x the road length 22.2km / the useful life 10 years = $71,040, as compared to the depreciation expense on unsealed roads currently accounted for of $96,000. These rough calculations indicate that depreciation expense on gravel roads may be overstated by approximately 26%. While the detailed revaluation process is still underway, for the purposes of providing a conservative budget estimate, a depreciation saving of 15% on gravel roads has been included in the budget estimate.
Sealed roads will be componentised in detail, based on the actual treatment of sealed roads over the life of the asset. This will include recognition of the longer lifespan of the components underneath the seal. For example, the road pavement sub-base, comprising over 50% of the asset valuation, does not wear until the pavement base completely wears. In reality, Council rarely, or never, undertakes a full road reconstruction. Instead, Council’s maintenance and renewal schedules ensure that the seal and pavement base are maintained and renewed before the sub-base is affected. Longer useful lives associated with the sealed roads asset components will reduce the new Council’s depreciation expense. In the following example of low volume rural roads, the pavement sub-base has been valued at $27 per m2, with the total depreciable cost of the road being $52 per m2. The useful life of the surface is 15-20 years, the useful life of the pavement base is 90 years, and the useful life of the pavement sub-base is more than 180 years (averaging approximately 135 years for the base and sub-base). Cootamundra’s depreciation expense is currently calculated using an average useful life for the sealed roads surface of 26 years, and 72 years for the sealed roads structure. These rough calculations indicate that depreciation expense on sealed roads structure may be overstated by approximately 53%. For the purposes of providing a conservative budget estimate, a depreciation saving of 10% on sealed roads has been included in the budget estimate.
Page 43
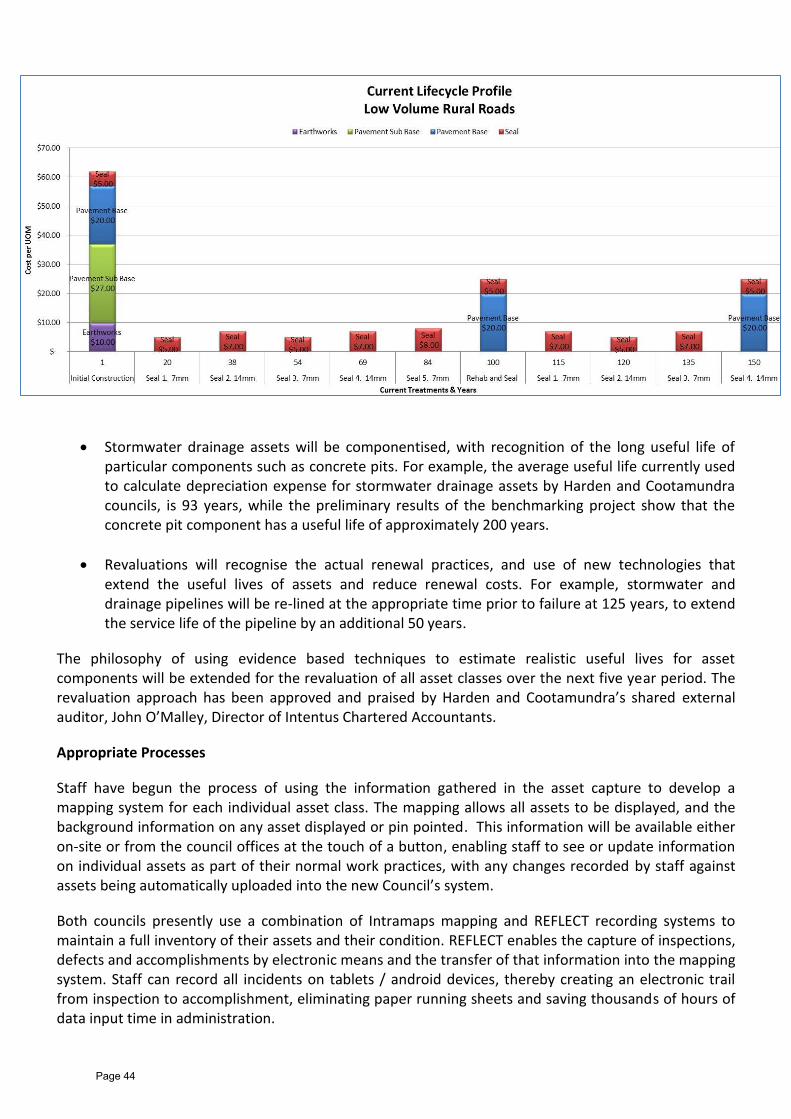
Stormwater drainage assets will be componentised, with recognition of the long useful life of particular components such as concrete pits. For example, the average useful life currently used to calculate depreciation expense for stormwater drainage assets by Harden and Cootamundra councils, is 93 years, while the preliminary results of the benchmarking project show that the concrete pit component has a useful life of approximately 200 years.
Revaluations will recognise the actual renewal practices, and use of new technologies that extend the useful lives of assets and reduce renewal costs. For example, stormwater and drainage pipelines will be re-lined at the appropriate time prior to failure at 125 years, to extend the service life of the pipeline by an additional 50 years.
The philosophy of using evidence based techniques to estimate realistic useful lives for asset components will be extended for the revaluation of all asset classes over the next five year period. The revaluation approach has been approved and praised by Harden and Cootamundra’s shared external auditor, John O’Malley, Director of Intentus Chartered Accountants.
Appropriate Processes
Staff have begun the process of using the information gathered in the asset capture to develop a mapping system for each individual asset class. The mapping allows all assets to be displayed, and the background information on any asset displayed or pin pointed. This information will be available either on-site or from the council offices at the touch of a button, enabling staff to see or update information on individual assets as part of their normal work practices, with any changes recorded by staff against assets being automatically uploaded into the new Council’s system.
Both councils presently use a combination of Intramaps mapping and REFLECT recording systems to maintain a full inventory of their assets and their condition. REFLECT enables the capture of inspections, defects and accomplishments by electronic means and the transfer of that information into the mapping system. Staff can record all incidents on tablets / android devices, thereby creating an electronic trail from inspection to accomplishment, eliminating paper running sheets and saving thousands of hours of data input time in administration.
Page 44
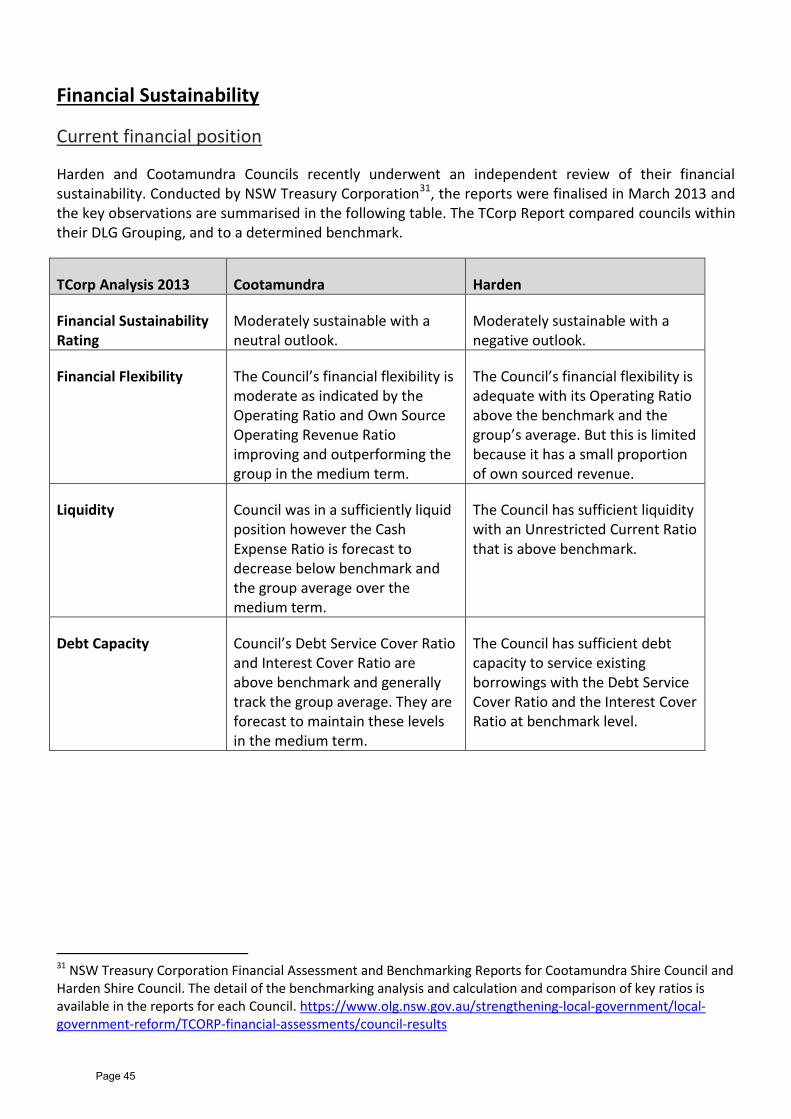
Financial Sustainability
Current financial position
Harden and Cootamundra Councils recently underwent an independent review of their financial sustainability. Conducted by NSW Treasury Corporation31, the reports were finalised in March 2013 and the key observations are summarised in the following table. The TCorp Report compared councils within their DLG Grouping, and to a determined benchmark.
TCorp Analysis 2013 Cootamundra Harden
Financial Sustainability Rating
Moderately sustainable with a neutral outlook.
Moderately sustainable with a negative outlook.
Financial Flexibility The Council’s financial flexibility is moderate as indicated by the Operating Ratio and Own Source Operating Revenue Ratio improving and outperforming the group in the medium term.
The Council’s financial flexibility is adequate with its Operating Ratio above the benchmark and the group’s average. But this is limited because it has a small proportion of own sourced revenue.
Liquidity Council was in a sufficiently liquid position however the Cash Expense Ratio is forecast to decrease below benchmark and the group average over the medium term.
The Council has sufficient liquidity with an Unrestricted Current Ratio that is above benchmark.
Debt Capacity Council’s Debt Service Cover Ratio and Interest Cover Ratio are above benchmark and generally track the group average. They are forecast to maintain these levels in the medium term.
The Council has sufficient debt capacity to service existing borrowings with the Debt Service Cover Ratio and the Interest Cover Ratio at benchmark level.
31 NSW Treasury Corporation Financial Assessment and Benchmarking Reports for Cootamundra Shire Council and Harden Shire Council. The detail of the benchmarking analysis and calculation and comparison of key ratios is available in the reports for each Council. https://www.olg.nsw.gov.au/strengthening-local-government/local-government-reform/TCORP-financial-assessments/council-results
Page 45

TCorp Analysis 2013 Cootamundra Harden
Infrastructure Renewal The Asset Maintenance Ratio is at benchmark levels. The Building and Infrastructure Asset Renewal Ratio and Capital Expenditure Ratio, while below benchmark, has followed the group trend over the period and the Capital Expenditure Ratio is forecast to improve.
The Council’s Capital Expenditure Ratio, Asset Maintenance Ratio and Building and Infrastructure Asset Renewal Ratio are at benchmark level. However the Infrastructure Backlog Ratio is increasing with a forecast shortfall in asset life cycle expenditure the backlog will continue to increase.
In the period since the 2013 TCorp analysis, the financial position of the two councils has changed. In particular, Harden Shire Council has undertaken a significant program of capital works that has resulted in the depletion of their internally restricted cash reserves, in to a deficit position; and a deficit unrestricted cash position; projected to be $1.5 million deficit by 30 June 2015.32
The new Council will put in place financial strategies to ensure that its internally restricted reserves and unrestricted cash is sufficient to address its liabilities and to respond to opportunities and unforseen circumstances. The NSW Government is providing $5 million for two councils merging, and it is accepted that part of this funding will be used to refund the new Council’s cash reserves.
Financial objectives
The financial objective of this business plan is to ensure that the new Council remains financially sustainable into the future. A financially sustainable Council is one whose long term financial performance and position is sustainable where planned long term service and infrastructure levels and standards are met without unplanned increases in rates or disruptive cuts to services.33
This business plan seeks to:
be under-pinned by a sound financial strategy that will ensure the new Council’s financial sustainability is protected and improved,
accommodate asset maintenance and asset renewal and replacement activity, and
maintain the service levels proposed in Harden Shire Council and Cootamundra Shire Council’s existing Delivery Programs and Operational Plans.
32 This is based on Council’s Operational Budget adopted for the 2014/15 financial year, and includes budget adjustments made for the period to 31 December 2014, being the December quarterly budget review statement. 33 Definition of Financial Sustainability that was endorsed at the National General Assembly of Local Government in Canberra in November 2006.
Page 46
Financial strategies
The new Council’s financial strategies to meet its objectives are:
To explore all cost effective opportunities to maximise Council’s revenue base.
To ensure ratepayer’s value for money by providing effective and efficient service.
To balance the dependence on rates and grants against other funding sources.
To ensure debt financing is limited to revenue raising or cost minimisation activities and that the total debt is limited to ensure long term financial stability.
To generate revenue in an equitable manner over time and ensure that there is capacity to finance peaks in asset renewal costs and other outlays when necessary.
To build up cash reserves to enable infrastructure renewals as projected in Harden Shire Council and Cootamundra Shire Council’s Asset Management Plans.
Cash Reserves
Council has a strategy to build up cash reserves in years when expenditure is lower, for use in years when expenditure is higher. The new Council will ensure that cash reserves are used for their intended purpose by adopting a policy in regards to the use of internally restricted cash, and ensuring decisions are well informed based on accurate estimates of required future outlays.
The projected movement in the new Council’s cash reserves is detailed in Appendix 1.
It is recognised that the opening balance of internally restricted cash reserves is inadequate for the new Council. In particular, the employee leave entitlement reserve of the combined councils as at 30 June 2015 is only 28% of the estimated liability. This is not considered sufficient, and would create a liquidity issue in the short to medium term.
In order to improve the liquidity position of the new Council, an amount of $2.986 million of the Government’s total $5 million contribution will be transferred to the employee leave entitlements reserve, improving the balance of this reserve to 100% of the total provision. This balance will be available for the new Council to borrow from and reallocate, providing liquidity for them to respond to future opportunities. This liquidity is considered essential to allow capacity for the new Council to continue to invest in a program of continuous improvement.
Borrowings
The NSW Government has announced that it will establish a borrowing facility that will provide councils with access to low cost loans.34 The new Council has capacity to increase borrowings, and a strategy to use debt financing appropriately and prudently for revenue raising and cost minimisation activities. The increased use of debt will be considered for the renewal of assets and infrastructure, as part of the new Council’s asset management planning.
34 NSW Government Response to the Independent local Government Review Panel recommendations, recommendation 9. http://www.fitforthefuture.nsw.gov.au/sites/fftf/files/NSW-Government-Response-Panel-and-Taskforce-recommendations.pdf
Page 47
Revenue policy
Revenue Base
The new Council is intent on maintaining all current levels of services, and in order to achieve this, Council will need to consider increasing its revenue to match increases in expenditure. The budget is based on a 3% rates increase in 2015/16 and 5% increase for the following 4 years.
Rating Structure
Harden and Cootamundra Shire Councils currently distribute the total allowable rate revenue between rating categories differently. However, both councils are very comparable with respect to the geographical layout and proportion of land valuations within each rating category. The new Council will determine a new, equitable rating structure, and in order to reduce the impact that introducing a common rating structure will have on the individual ratepayers, this strategy will be implemented gradually over several years.
Debt Collection
The outstanding debt ratio will be improved through combined resources and a sharing of information. Presently, Harden’s outstanding debt ratio is 13.5%, while Cootamundra’s is 4.1%. Through reviewing debt recovery policies and procedures and determining a consistent application, the overall debt recovery ratio of the new Council can be as low as the current ratio of Cootamundra.
Waste Charges
Cootamundra and Harden Shire Councils provide similar levels of domestic waste service, however there are differences in the annual charges. The new Council will conduct a review of waste management services and costs to determin an equitable access charge.
Water and Sewer Charges
Both councils are responsible for water and sewer billing in addition to land rates. Generally, both councils presently charge for water and sewer in much the same way, with water and sewer access charges levied in accordance with the type and size of service connection, with consumption charges in addition. Generally, the cost for services is similar. There are however, two key differences noted:
• Firstly, Harden presently charge their water and sewer access charges on their annual rates and charges notice, while Cootamundra charge them on the quarterly water and sewer account which also includes consumption, and
• Secondly, the quarterly meter readings (and therefore billing) are not in periodical alignment.
Accordingly, the new Council will need to determine which of the methodologies is better suited; however, they are predominantly administrative adjustments that will not have a significant financial impact on the ratepayers.
Page 48
Financial indicators
The NSW Government Fit for the Future35 program has been designed to help councils demonstrate that they are financially sound, operating efficiently and in a strong position to guide growth and deliver quality services in to the future.
Fit for the Future requires councils to benchmark against the following key performance indicators to assess the success of their financial strategies. These financial indicators have been selected to address councils’ sustainability, effective infrastructure and service management, and efficiency.
The new Council’s projected performance against the Fit for Future benchmarks is detailed in Appendix 2. As a combined position, the two councils currently meet two out of seven of the benchmarks, and this can be improved to five out of seven within five years.
In accordance with the Fit for the Future requirements, the financial indicators measure the new Council’s General Fund, and exclude water, sewer and regional partnership operations.
Sustainability
Operating Performance Ratio (greater or equal to break-even average over 3 years)
In order to be financially sustainable, the new Council needs to avoid making ongoing operating deficits. Ideally, current expenses (services) should be met from current revenues and capital grants should be spent on capital expenditure and included in the capital budget. This maximises the net public worth (the net assets) of the community.36
The projected operating performance of the new Council will improve from a minor deficit position to a break-even position over the next five years.
Depreciation expense represents 25% of the new Council’s operating expenditure, and there is evidence that the amount may be over-stated. A conservative estimate of the overstated amount has been included in the budgeted projections, and the new Council will focus resources on improving the accuracy of the reported depreciation expense, for future years.
Own Source Operating Revenue (greater than 60% average over 3 years)
This ratio measures the extent of Council’s reliance on grants and contributions, which can be susceptible to changes in government policy and other influences outside the control of Council. The more that council services are reliant on external funding, the higher the risk that the future delivery of those services could be reduced without Council’s agreement.
The new Council is projected to reach the Own Source Revenue Ratio benchmark within 4 years.
35 http://www.fitforthefuture.nsw.gov.au/preparing-proposal 36 Peter Abelson and Roselyne Joyeux, Smoke and Mirrors: Fallacies in the NSW Government’s Views on Local Government Financial Capacity http://www.google.com.au/url?sa=t&rct=j&q=&esrc=s&source=web&cd=1&ved=0CB4QFjAA&url=http%3A%2F%2Fmosman.nsw.gov.au%2Findex.php%3Fs%3Dfile_download%26id%3D3558&ei=sABMVcHgA4PDmwWu9IHYDw&usg=AFQjCNFhcrrM9YP9sR2JzcBvT0D1jAKJWA&bvm=bv.92765956,d.dGY
Page 49
Building and Infrastructure Asset Renewal Ratio (greater than 100% average over 3 years)
This ratio measures whether Council is replacing assets at an equivalent rate to their depreciation; that is, offsetting the decline of assets. If Council does not invest adequately in asset renewal, this will impact on the service delivery to future generations.
The new Council’s projected infrastructure renewals are falling over the next four years, and then starting to increase from the fifth year. During the same period, Council’s internally restricted reserves are projected to steadily increase, which will allow the new Council to increase its investment in infrastructure renewal, and correct this trend.
It is recognised that the new Council will need to invest time and resources in to its asset management planning as a priority, in order to ensure that it is optimising its renewal expenditure, and minimising its depreciation expense.
Infrastructure and Service Management
Infrastructure Backlog Ratio (less than 2%)
This ratio measures the estimated cost to bring all infrastructure assets to a satisfactory standard as a proportion of the written down value of infrastructure assets. This is an indicator of the proportion of critical community infrastructure assets in unsatisfactory condition.
Based on current estimates, the new Council will reduce the infrastructure backlog within the next five years. However, Council’s current estimated cost to bring assets to a satisfactory standard is subjective, and not a reliable figure. Council has recognised the need to invest further in its asset management processes to improve its capability of providing accurate information about the current and future infrastructure backlog.
Asset Maintenance Ratio (greater than 100% average over 3 years)
This ratio measures the new Council’s actual annual maintenance over its estimated required annual maintenance. The new Council needs to ensure that actual and future planned maintenance levels are consistent with warranted maintenance levels.
Based on current estimates, the new Council does plan for maintenance expenditure to maintain this ratio. However, in order to increase the accuracy of its reporting, the new Council needs to prepare asset management plans based on long term affordable service levels which are linked to its long term financial plan.
Debt Service Ratio (greater than 0 and less than 20% average over 3 years)
This ratio measures borrowing costs (interest and principal repayments) over the new Council’s operating revenue. It is a measure of the new Council’s prudent use of debt. The new Council meets this benchmark, and has additional capacity to borrow.
Efficiency
Real Operating Expenditure per capita (decrease over time)
This ratio has been selected by the NSW Government as a measure of efficiency, showing that councils can secure economies of scale to reduce total per capital operating expenses over time. This ratio would
Page 50
be negatively affected if Council provided any additional services or increased spending in any area. Council’s strategy is to reinvest any productivity gains back in to service delivery, and therefore, it is not expected that this ratio will always be met in to the future.
However, the financial modelling prepared to support this business plan shows that the new Council will meet this benchmark over the 5 year planning period. This is largely due to the projected depreciation expense that is projected to fall, in real terms, over the period.
It should be noted, that the new Council has projected population growth of 0.4% per annum for the purpose of calculating this ratio, which is inconsistent with the NSW Department of Planning population projections. Analysis of population projections is detailed on page 53 of this business plan.
Financial Statements
Financial Statements have been prepared for the new Council and are detailed in Appendix 4.
These set out the financial performance, financial position and cash flow projections for the next five years, with the 2014-15 current budget and 2013-14 actual results of Cootamundra and Harden councils included for comparative purposes.37 The format of these financial statements is standard across NSW Councils and complies with both the accounting and reporting requirements of Australian Accounting Standards and the legislative requirements set down by the Office of Local Government.
These financial statements have been prepared on a consolidation basis, as well being separated out for each separate fund, which includes Council’s General Fund, Water Fund, Sewer Fund and Regional Arrangements.
Income Statement - Consolidated - Water Fund - Sewer Fund - Regional Arrangements - General Fund Balance Sheet - Consolidated - Water Fund - Sewer Fund - Regional Arrangements - General Fund Cashflow Statement - Consolidated - Water Fund - Sewer Fund - Regional Arrangements - General Fund
37 General Purpose Financial Statements – Harden Shire Council http://www.harden.nsw.gov.au/council/policies-plans-and-reports/financial-reports.aspx General Purpose Financial Statements – Cootamundra Shire Council http://www.cootamundra.nsw.gov.au/council/integrated-planning-and-reporting/annual-reports-and-progress-reports.aspx The 2014-15 current budget includes each Council’s adopted Operational Plan, and budget adjustments included in the December Quarterly Budget review. These figures have been used as the basis for the projected financial statements.
Page 51
Financial planning assumptions
In order to project the financial statements for the new Council, a number of assumptions have been made. As a new Council, going through an extensive period of change, and with many decisions to be made in the initial years, it is expected that long term financial projections (beyond 5 years), would not produce reliable or useful information. Therefore, the financial projections are limited to 5 years.
In order to interpret the financial projections, and to understand the drivers of variations in performance between years, the specific planning assumptions are detailed in Appendix 5.
Features of the financial plan identified as risks and volatile factors include:
Efficiency savings and merger costs have been estimated based on industry knowledge and indicative quotes provided by suppliers and contractors. These estimates are detailed in Appendix 6.
Where productivity gains have been identified that will result in net cost savings, the savings have been incorporated into the budget. It is likely that significant productivity gains will be made that have not yet been identified. These will not be built into the budget until a specific saving is identified and there is a basis for the estimation.
With the exception of a General Manager role, there is no provision for redundancy costs. The new Council will provide for the continued employment of all staff, gaining and reinvesting efficiencies by redeploying staff where duplications exist. In addition, some movement of staff through natural attrition is anticipated in the short term, including at senior management levels.
Operating revenue from grants is expected to remain constant over the transition to the new Council. Council has received confirmation that the Roads to Recovery Program will be extended to 30 June 2019. This funding represents $845,000 per annum. In addition, the Regional Roads Block Grant is announced annually, and funding represents $1 million per annum. Any change to this funding would significantly impact Council’s road asset maintenance and renewal if it were reduced at any point in the future.
The Federal Government has announced that indexation on the Financial Assistance Grant (FAG) will be paused for three years. The FAG amounts to $4.9 million income per annum which is a significant source of funds for the new Council and while Council’s budgeted expenses rise over the planning period, and the FAG remains fixed. Council has had to reduce expenditure budgets by cutting discretionary operating costs and eliminating some capital works.
The Office of Local Government has announced that it intends to work with IPART to amend the guidelines to develop a streamlined and more proportionate process for ‘fit for the future’ councils wanting to increase rates above the ratepeg.38 The new Council has budgeted for an increase of 5% for 4 years from 2017/18, as outlined in the Revenue Policy on page 48 of this plan.
It is assumed that mandated requirements on Council will remain unchanged over the planning period. If there is an increase in Council’s legal obligations in future this is likely to subsequently increase Council’s annual operating expenses.
It is assumed that the outlay projections for asset renewal and maintenance will be adequate to maintain assets to a standard that is safe. The budget will accommodate outlay projects specified
38 NSW Government response to the Independent Local Government Review Panel Recommendations. http://www.fitforthefuture.nsw.gov.au/sites/fftf/files/NSW-Government-Response-Panel-and-Taskforce-recommendations.pdf
Page 52
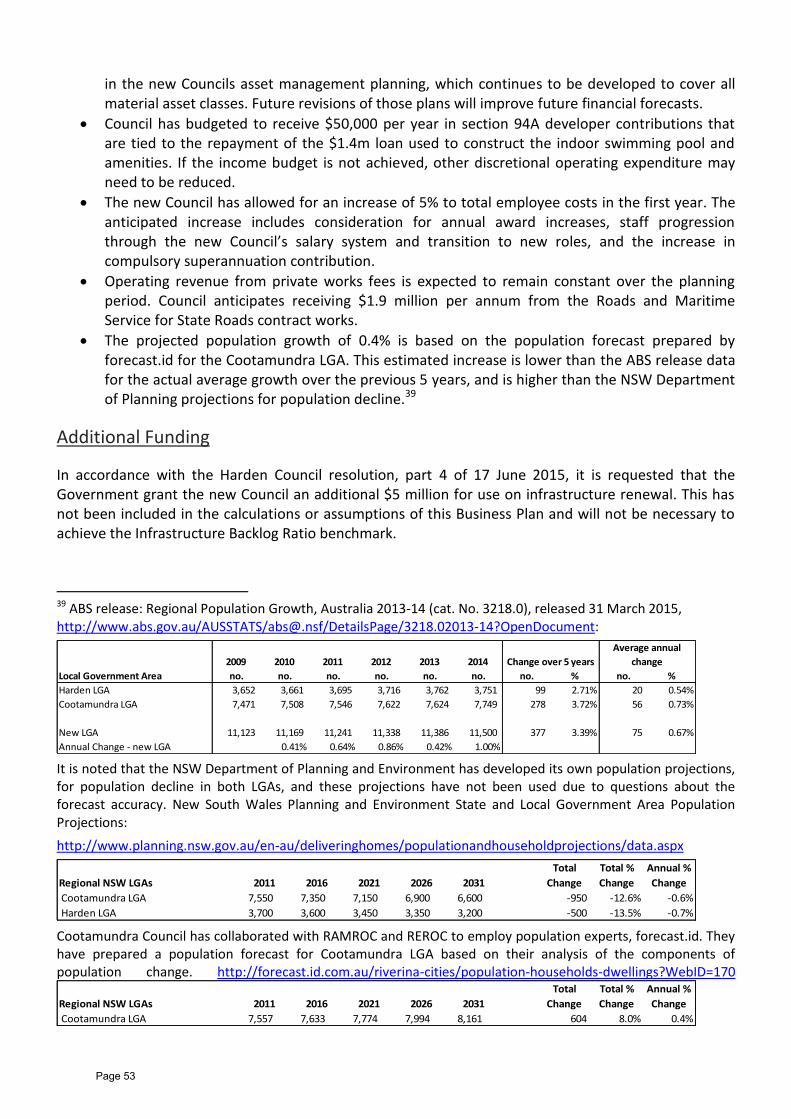
in the new Councils asset management planning, which continues to be developed to cover all material asset classes. Future revisions of those plans will improve future financial forecasts.
Council has budgeted to receive $50,000 per year in section 94A developer contributions that are tied to the repayment of the $1.4m loan used to construct the indoor swimming pool and amenities. If the income budget is not achieved, other discretional operating expenditure may need to be reduced.
The new Council has allowed for an increase of 5% to total employee costs in the first year. The anticipated increase includes consideration for annual award increases, staff progression through the new Council’s salary system and transition to new roles, and the increase in compulsory superannuation contribution.
Operating revenue from private works fees is expected to remain constant over the planning period. Council anticipates receiving $1.9 million per annum from the Roads and Maritime Service for State Roads contract works.
The projected population growth of 0.4% is based on the population forecast prepared by forecast.id for the Cootamundra LGA. This estimated increase is lower than the ABS release data for the actual average growth over the previous 5 years, and is higher than the NSW Department of Planning projections for population decline.39
Additional Funding
In accordance with the Harden Council resolution, part 4 of 17 June 2015, it is requested that the Government grant the new Council an additional $5 million for use on infrastructure renewal. This has not been included in the calculations or assumptions of this Business Plan and will not be necessary to achieve the Infrastructure Backlog Ratio benchmark.
39 ABS release: Regional Population Growth, Australia 2013-14 (cat. No. 3218.0), released 31 March 2015, http://www.abs.gov.au/AUSSTATS/[email protected]/DetailsPage/3218.02013-14?OpenDocument:
It is noted that the NSW Department of Planning and Environment has developed its own population projections, for population decline in both LGAs, and these projections have not been used due to questions about the forecast accuracy. New South Wales Planning and Environment State and Local Government Area Population Projections:
http://www.planning.nsw.gov.au/en-au/deliveringhomes/populationandhouseholdprojections/data.aspx
Cootamundra Council has collaborated with RAMROC and REROC to employ population experts, forecast.id. They have prepared a population forecast for Cootamundra LGA based on their analysis of the components of population change. http://forecast.id.com.au/riverina-cities/population-households-dwellings?WebID=170
2009 2010 2011 2012 2013 2014
Local Government Area no. no. no. no. no. no. no. % no. %
Harden LGA 3,652 3,661 3,695 3,716 3,762 3,751 99 2.71% 20 0.54%
Cootamundra LGA 7,471 7,508 7,546 7,622 7,624 7,749 278 3.72% 56 0.73%
New LGA 11,123 11,169 11,241 11,338 11,386 11,500 377 3.39% 75 0.67%
Annual Change - new LGA 0.41% 0.64% 0.86% 0.42% 1.00%
Change over 5 years
Average annual
change
Regional NSW LGAs 2011 2016 2021 2026 2031
Total
Change
Total %
Change
Annual %
Change
Cootamundra LGA 7,550 7,350 7,150 6,900 6,600 -950 -12.6% -0.6%
Harden LGA 3,700 3,600 3,450 3,350 3,200 -500 -13.5% -0.7%
Regional NSW LGAs 2011 2016 2021 2026 2031
Total
Change
Total %
Change
Annual %
Change
Cootamundra LGA 7,557 7,633 7,774 7,994 8,161 604 8.0% 0.4%
Page 53
Appendices
Appendix 1 Cash Reserves Page 55
Appendix 2 Fit for the Future Benchmarks Page 56
Appendix 3 Capital Acquisitions Page 57
Appendix 4 Financial Statements Page 58
Appendix 5 Financial Planning Assumptions Page 73
Appendix 6 Merger Costs and Efficiency Savings Page 75
Page 54
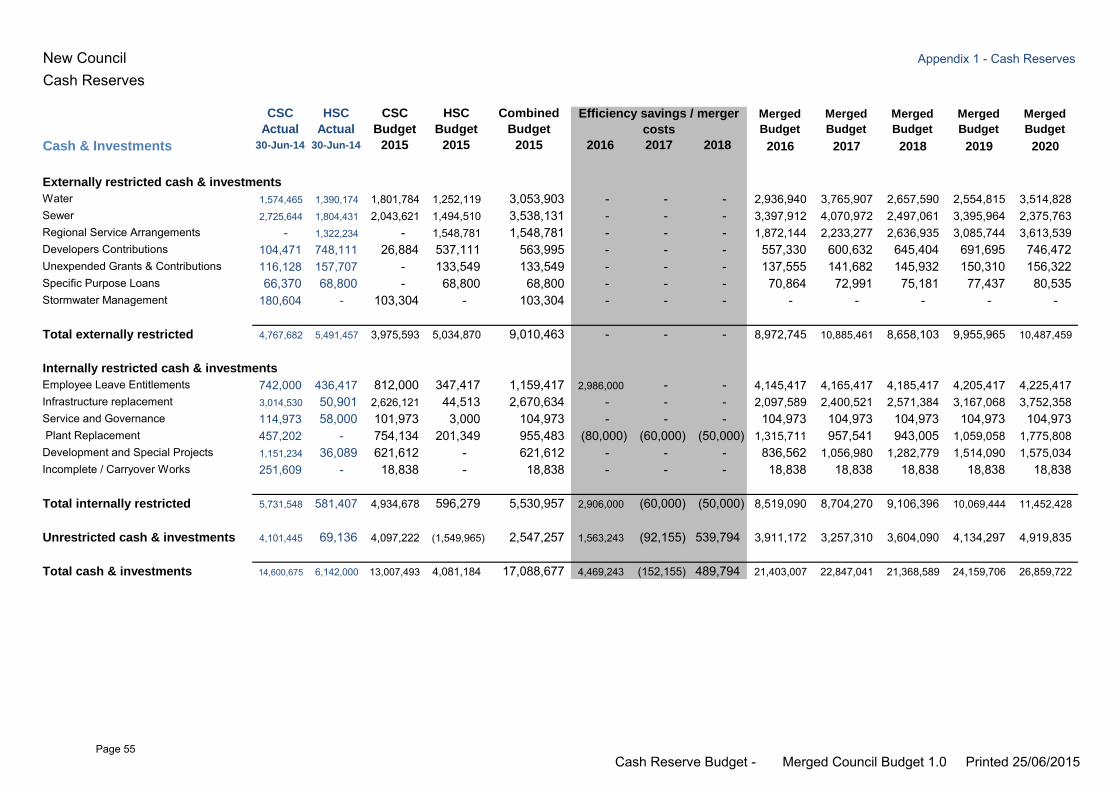
New Council Appendix 1 - Cash Reserves
Cash Reserves
CSC
Actual
HSC
Actual
CSC
Budget
HSC
Budget
Combined
Budget
Merged
Budget
Merged
Budget
Merged
Budget
Merged
Budget
Merged
Budget
Cash & Investments 30-Jun-14 30-Jun-14 2015 2015 2015 2016 2017 2018 2016 2017 2018 2019 2020
Externally restricted cash & investments
Water 1,574,465 1,390,174 1,801,784 1,252,119 3,053,903 - - - 2,936,940 3,765,907 2,657,590 2,554,815 3,514,828 Sewer 2,725,644 1,804,431 2,043,621 1,494,510 3,538,131 - - - 3,397,912 4,070,972 2,497,061 3,395,964 2,375,763 Regional Service Arrangements - 1,322,234 - 1,548,781 1,548,781 - - - 1,872,144 2,233,277 2,636,935 3,085,744 3,613,539 Developers Contributions 104,471 748,111 26,884 537,111 563,995 - - - 557,330 600,632 645,404 691,695 746,472 Unexpended Grants & Contributions 116,128 157,707 - 133,549 133,549 - - - 137,555 141,682 145,932 150,310 156,322 Specific Purpose Loans 66,370 68,800 - 68,800 68,800 - - - 70,864 72,991 75,181 77,437 80,535 Stormwater Management 180,604 - 103,304 - 103,304 - - - - - - - -
Total externally restricted 4,767,682 5,491,457 3,975,593 5,034,870 9,010,463 - - - 8,972,745 10,885,461 8,658,103 9,955,965 10,487,459
Internally restricted cash & investments
Employee Leave Entitlements 742,000 436,417 812,000 347,417 1,159,417 2,986,000 - - 4,145,417 4,165,417 4,185,417 4,205,417 4,225,417 Infrastructure replacement 3,014,530 50,901 2,626,121 44,513 2,670,634 - - - 2,097,589 2,400,521 2,571,384 3,167,068 3,752,358 Service and Governance 114,973 58,000 101,973 3,000 104,973 - - - 104,973 104,973 104,973 104,973 104,973 Plant Replacement 457,202 - 754,134 201,349 955,483 (80,000) (60,000) (50,000) 1,315,711 957,541 943,005 1,059,058 1,775,808 Development and Special Projects 1,151,234 36,089 621,612 - 621,612 - - - 836,562 1,056,980 1,282,779 1,514,090 1,575,034 Incomplete / Carryover Works 251,609 - 18,838 - 18,838 - - - 18,838 18,838 18,838 18,838 18,838
Total internally restricted 5,731,548 581,407 4,934,678 596,279 5,530,957 2,906,000 (60,000) (50,000) 8,519,090 8,704,270 9,106,396 10,069,444 11,452,428
Unrestricted cash & investments 4,101,445 69,136 4,097,222 (1,549,965) 2,547,257 1,563,243 (92,155) 539,794 3,911,172 3,257,310 3,604,090 4,134,297 4,919,835
Total cash & investments 14,600,675 6,142,000 13,007,493 4,081,184 17,088,677 4,469,243 (152,155) 489,794 21,403,007 22,847,041 21,368,589 24,159,706 26,859,722
Efficiency savings / merger
costs
Cash Reserve Budget - Merged Council Budget 1.0 Printed 25/06/2015Page 55
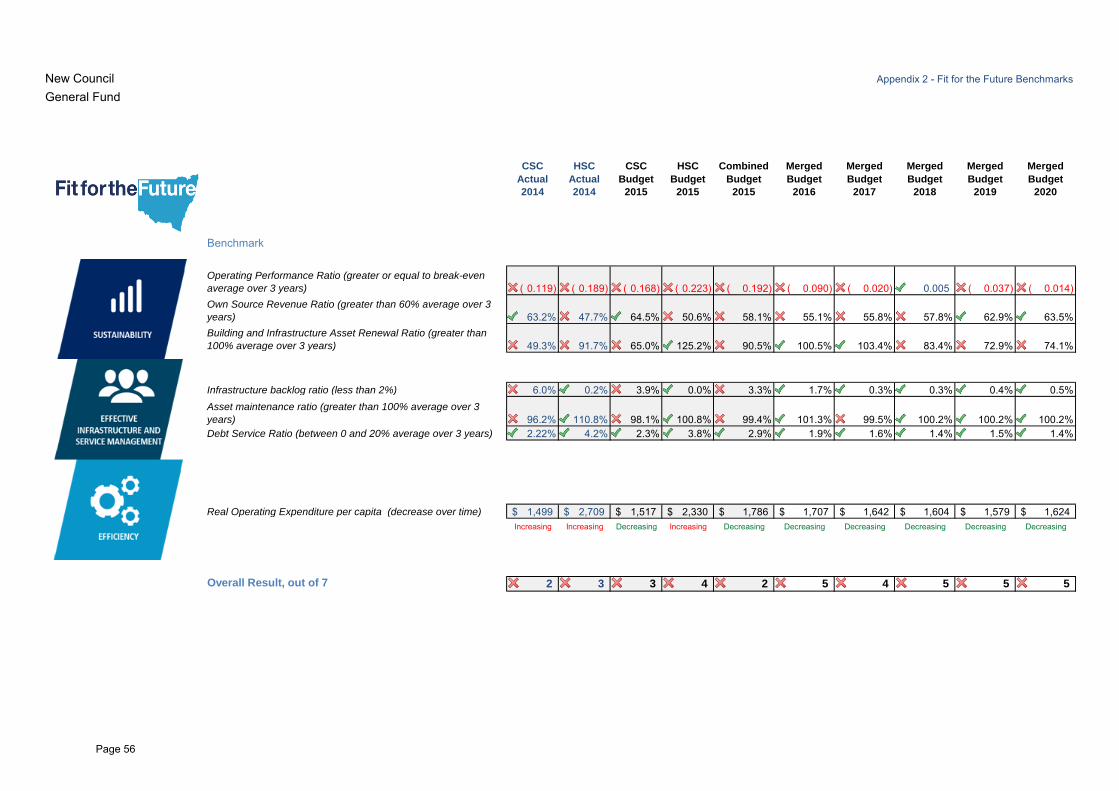
New Council Appendix 2 - Fit for the Future Benchmarks
General Fund
CSC
Actual
HSC
Actual
CSC
Budget
HSC
Budget
Combined
Budget
Merged
Budget
Merged
Budget
Merged
Budget
Merged
Budget
Merged
Budget
2014 2014 2015 2015 2015 2016 2017 2018 2019 2020
Benchmark
Operating Performance Ratio (greater or equal to break-even
average over 3 years) 0.119)( 0.189)( 0.168)( 0.223)( 0.192)( 0.090)( 0.020)( 0.005 0.037)( 0.014)( Own Source Revenue Ratio (greater than 60% average over 3
years) 63.2% 47.7% 64.5% 50.6% 58.1% 55.1% 55.8% 57.8% 62.9% 63.5%Building and Infrastructure Asset Renewal Ratio (greater than
100% average over 3 years) 49.3% 91.7% 65.0% 125.2% 90.5% 100.5% 103.4% 83.4% 72.9% 74.1%
Infrastructure backlog ratio (less than 2%) 6.0% 0.2% 3.9% 0.0% 3.3% 1.7% 0.3% 0.3% 0.4% 0.5%Asset maintenance ratio (greater than 100% average over 3
years) 96.2% 110.8% 98.1% 100.8% 99.4% 101.3% 99.5% 100.2% 100.2% 100.2%Debt Service Ratio (between 0 and 20% average over 3 years) 2.22% 4.2% 2.3% 3.8% 2.9% 1.9% 1.6% 1.4% 1.5% 1.4%
Real Operating Expenditure per capita (decrease over time) 1,499$ 2,709$ 1,517$ 2,330$ 1,786$ 1,707$ 1,642$ 1,604$ 1,579$ 1,624$
Increasing Increasing Decreasing Increasing Decreasing Decreasing Decreasing Decreasing Decreasing Decreasing
Overall Result, out of 7 2 3 3 4 2 5 4 5 5 5
Page 56
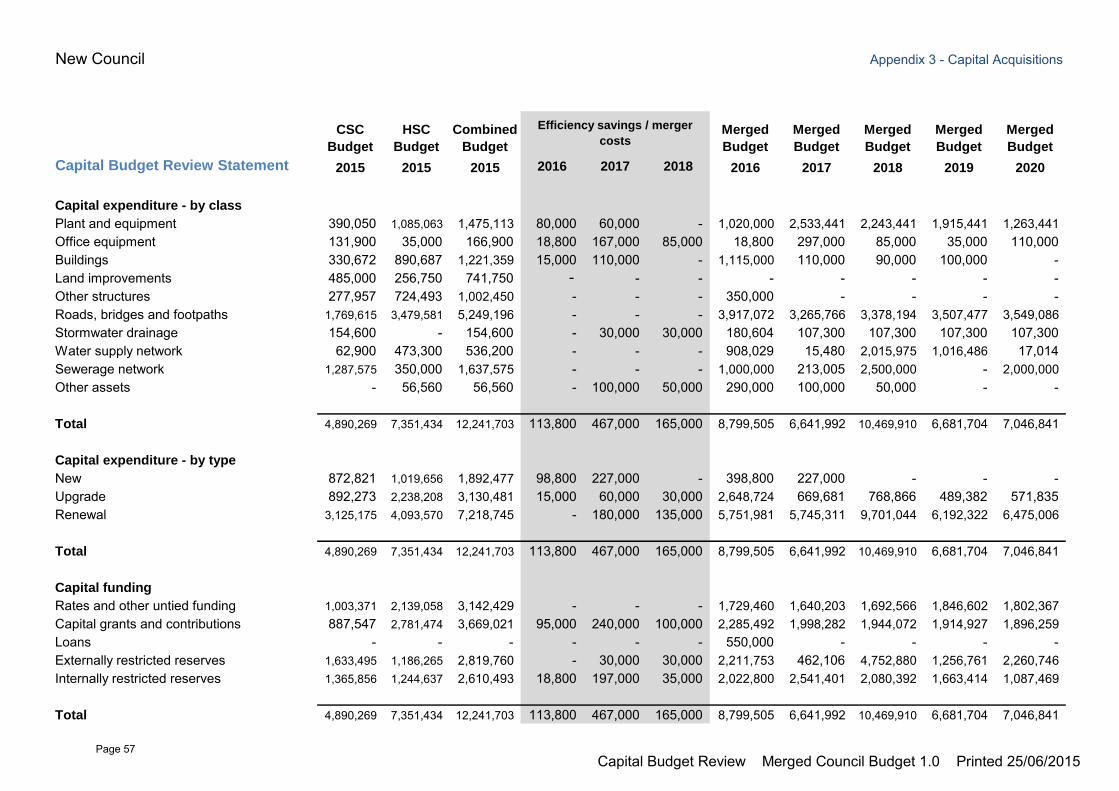
New Council Appendix 3 - Capital Acquisitions
CSC
Budget
HSC
Budget
Combined
Budget
Merged
Budget
Merged
Budget
Merged
Budget
Merged
Budget
Merged
Budget
Capital Budget Review Statement 2015 2015 2015 2016 2017 2018 2016 2017 2018 2019 2020
Capital expenditure - by class
Plant and equipment 390,050 1,085,063 1,475,113 80,000 60,000 - 1,020,000 2,533,441 2,243,441 1,915,441 1,263,441 Office equipment 131,900 35,000 166,900 18,800 167,000 85,000 18,800 297,000 85,000 35,000 110,000 Buildings 330,672 890,687 1,221,359 15,000 110,000 - 1,115,000 110,000 90,000 100,000 - Land improvements 485,000 256,750 741,750 - - - - - - - - Other structures 277,957 724,493 1,002,450 - - - 350,000 - - - - Roads, bridges and footpaths 1,769,615 3,479,581 5,249,196 - - - 3,917,072 3,265,766 3,378,194 3,507,477 3,549,086 Stormwater drainage 154,600 - 154,600 - 30,000 30,000 180,604 107,300 107,300 107,300 107,300 Water supply network 62,900 473,300 536,200 - - - 908,029 15,480 2,015,975 1,016,486 17,014 Sewerage network 1,287,575 350,000 1,637,575 - - - 1,000,000 213,005 2,500,000 - 2,000,000 Other assets - 56,560 56,560 - 100,000 50,000 290,000 100,000 50,000 - -
Total 4,890,269 7,351,434 12,241,703 113,800 467,000 165,000 8,799,505 6,641,992 10,469,910 6,681,704 7,046,841
Capital expenditure - by type
New 872,821 1,019,656 1,892,477 98,800 227,000 - 398,800 227,000 - - - Upgrade 892,273 2,238,208 3,130,481 15,000 60,000 30,000 2,648,724 669,681 768,866 489,382 571,835 Renewal 3,125,175 4,093,570 7,218,745 - 180,000 135,000 5,751,981 5,745,311 9,701,044 6,192,322 6,475,006
Total 4,890,269 7,351,434 12,241,703 113,800 467,000 165,000 8,799,505 6,641,992 10,469,910 6,681,704 7,046,841
Capital funding
Rates and other untied funding 1,003,371 2,139,058 3,142,429 - - - 1,729,460 1,640,203 1,692,566 1,846,602 1,802,367 Capital grants and contributions 887,547 2,781,474 3,669,021 95,000 240,000 100,000 2,285,492 1,998,282 1,944,072 1,914,927 1,896,259 Loans - - - - - - 550,000 - - - - Externally restricted reserves 1,633,495 1,186,265 2,819,760 - 30,000 30,000 2,211,753 462,106 4,752,880 1,256,761 2,260,746 Internally restricted reserves 1,365,856 1,244,637 2,610,493 18,800 197,000 35,000 2,022,800 2,541,401 2,080,392 1,663,414 1,087,469
Total 4,890,269 7,351,434 12,241,703 113,800 467,000 165,000 8,799,505 6,641,992 10,469,910 6,681,704 7,046,841
Efficiency savings / merger
costs
Capital Budget Review Merged Council Budget 1.0 Printed 25/06/2015Page 57
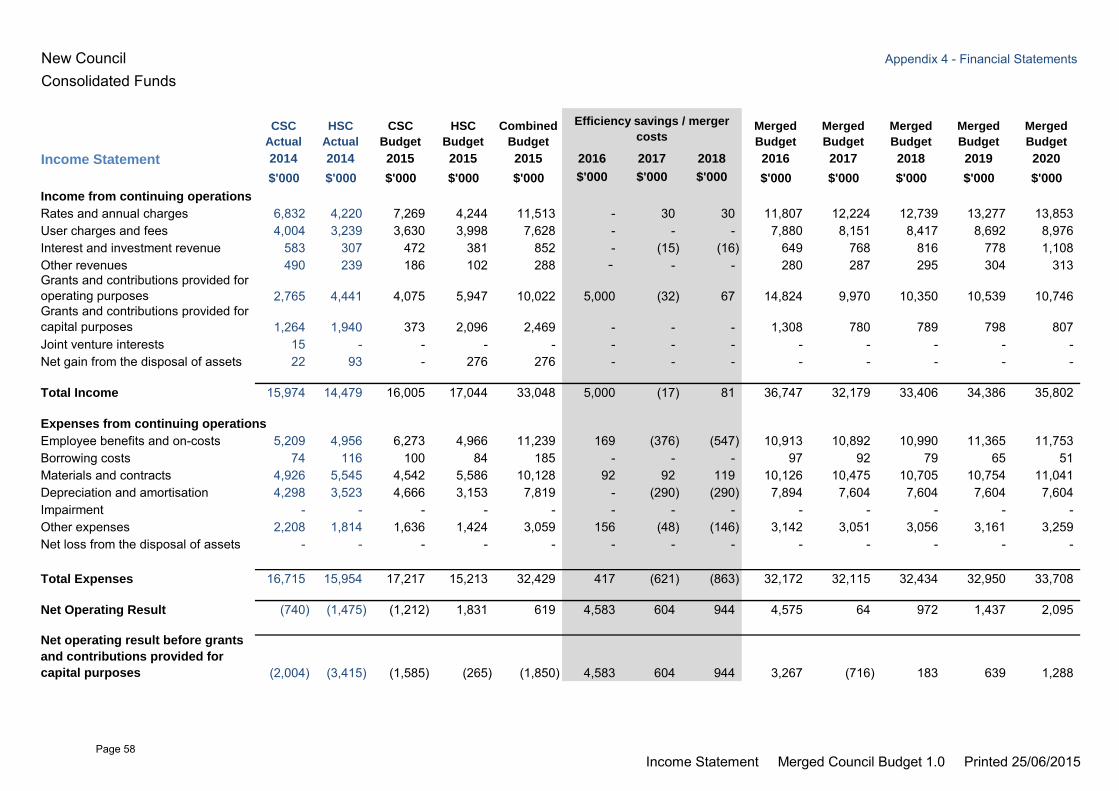
New Council Appendix 4 - Financial Statements
Consolidated Funds
CSC
Actual
HSC
Actual
CSC
Budget
HSC
Budget
Combined
Budget
Merged
Budget
Merged
Budget
Merged
Budget
Merged
Budget
Merged
Budget
Income Statement 2014 2014 2015 2015 2015 2016 2017 2018 2016 2017 2018 2019 2020
$'000 $'000 $'000 $'000 $'000 $'000 $'000 $'000 $'000 $'000 $'000 $'000 $'000
Income from continuing operations
Rates and annual charges 6,832 4,220 7,269 4,244 11,513 - 30 30 11,807 12,224 12,739 13,277 13,853 User charges and fees 4,004 3,239 3,630 3,998 7,628 - - - 7,880 8,151 8,417 8,692 8,976 Interest and investment revenue 583 307 472 381 852 - (15) (16) 649 768 816 778 1,108 Other revenues 490 239 186 102 288 - - - 280 287 295 304 313 Grants and contributions provided for operating purposes 2,765 4,441 4,075 5,947 10,022 5,000 (32) 67 14,824 9,970 10,350 10,539 10,746 Grants and contributions provided for capital purposes 1,264 1,940 373 2,096 2,469 - - - 1,308 780 789 798 807 Joint venture interests 15 - - - - - - - - - - - - Net gain from the disposal of assets 22 93 - 276 276 - - - - - - - -
Total Income 15,974 14,479 16,005 17,044 33,048 5,000 (17) 81 36,747 32,179 33,406 34,386 35,802
Expenses from continuing operations
Employee benefits and on-costs 5,209 4,956 6,273 4,966 11,239 169 (376) (547) 10,913 10,892 10,990 11,365 11,753 Borrowing costs 74 116 100 84 185 - - - 97 92 79 65 51 Materials and contracts 4,926 5,545 4,542 5,586 10,128 92 92 119 10,126 10,475 10,705 10,754 11,041 Depreciation and amortisation 4,298 3,523 4,666 3,153 7,819 - (290) (290) 7,894 7,604 7,604 7,604 7,604 Impairment - - - - - - - - - - - - - Other expenses 2,208 1,814 1,636 1,424 3,059 156 (48) (146) 3,142 3,051 3,056 3,161 3,259 Net loss from the disposal of assets - - - - - - - - - - - - -
Total Expenses 16,715 15,954 17,217 15,213 32,429 417 (621) (863) 32,172 32,115 32,434 32,950 33,708
Net Operating Result (740) (1,475) (1,212) 1,831 619 4,583 604 944 4,575 64 972 1,437 2,095
Net operating result before grants
and contributions provided for
capital purposes (2,004) (3,415) (1,585) (265) (1,850) 4,583 604 944 3,267 (716) 183 639 1,288
Efficiency savings / merger
costs
Income Statement Merged Council Budget 1.0 Printed 25/06/2015Page 58
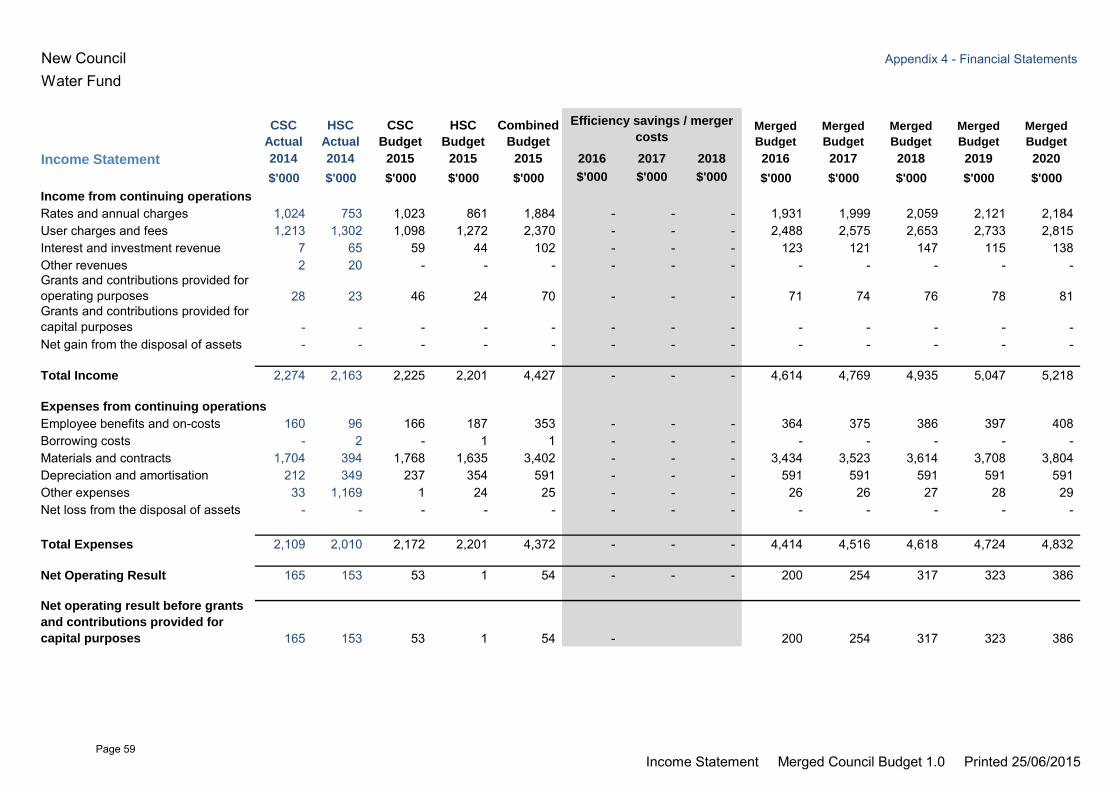
New Council Appendix 4 - Financial Statements
Water Fund
CSC
Actual
HSC
Actual
CSC
Budget
HSC
Budget
Combined
Budget
Merged
Budget
Merged
Budget
Merged
Budget
Merged
Budget
Merged
Budget
Income Statement 2014 2014 2015 2015 2015 2016 2017 2018 2016 2017 2018 2019 2020
$'000 $'000 $'000 $'000 $'000 $'000 $'000 $'000 $'000 $'000 $'000 $'000 $'000
Income from continuing operations
Rates and annual charges 1,024 753 1,023 861 1,884 - - - 1,931 1,999 2,059 2,121 2,184 User charges and fees 1,213 1,302 1,098 1,272 2,370 - - - 2,488 2,575 2,653 2,733 2,815 Interest and investment revenue 7 65 59 44 102 - - - 123 121 147 115 138 Other revenues 2 20 - - - - - - - - - - - Grants and contributions provided for operating purposes 28 23 46 24 70 - - - 71 74 76 78 81 Grants and contributions provided for capital purposes - - - - - - - - - - - - - Net gain from the disposal of assets - - - - - - - - - - - - -
Total Income 2,274 2,163 2,225 2,201 4,427 - - - 4,614 4,769 4,935 5,047 5,218
Expenses from continuing operations
Employee benefits and on-costs 160 96 166 187 353 - - - 364 375 386 397 408 Borrowing costs - 2 - 1 1 - - - - - - - - Materials and contracts 1,704 394 1,768 1,635 3,402 - - - 3,434 3,523 3,614 3,708 3,804 Depreciation and amortisation 212 349 237 354 591 - - - 591 591 591 591 591 Other expenses 33 1,169 1 24 25 - - - 26 26 27 28 29 Net loss from the disposal of assets - - - - - - - - - - - - -
Total Expenses 2,109 2,010 2,172 2,201 4,372 - - - 4,414 4,516 4,618 4,724 4,832
Net Operating Result 165 153 53 1 54 - - - 200 254 317 323 386
Net operating result before grants
and contributions provided for
capital purposes 165 153 53 1 54 - 200 254 317 323 386
Efficiency savings / merger
costs
Income Statement Merged Council Budget 1.0 Printed 25/06/2015Page 59
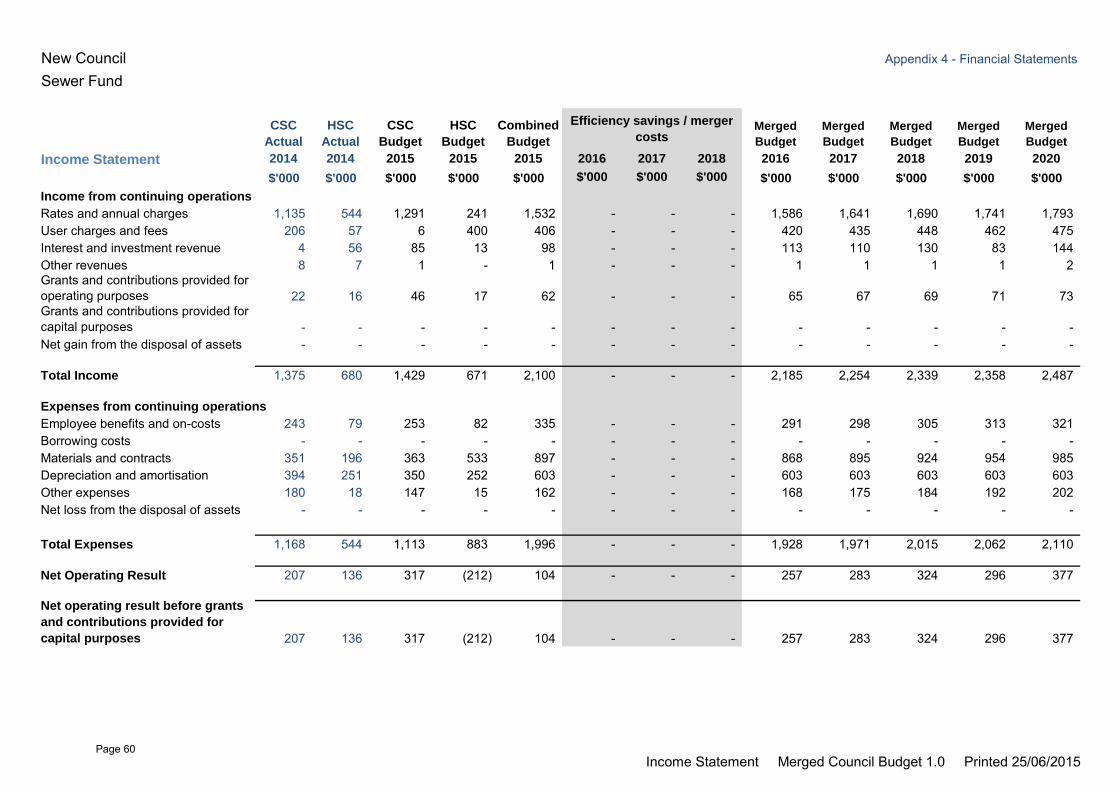
New Council Appendix 4 - Financial Statements
Sewer Fund
CSC
Actual
HSC
Actual
CSC
Budget
HSC
Budget
Combined
Budget
Merged
Budget
Merged
Budget
Merged
Budget
Merged
Budget
Merged
Budget
Income Statement 2014 2014 2015 2015 2015 2016 2017 2018 2016 2017 2018 2019 2020
$'000 $'000 $'000 $'000 $'000 $'000 $'000 $'000 $'000 $'000 $'000 $'000 $'000
Income from continuing operations
Rates and annual charges 1,135 544 1,291 241 1,532 - - - 1,586 1,641 1,690 1,741 1,793 User charges and fees 206 57 6 400 406 - - - 420 435 448 462 475 Interest and investment revenue 4 56 85 13 98 - - - 113 110 130 83 144 Other revenues 8 7 1 - 1 - - - 1 1 1 1 2 Grants and contributions provided for operating purposes 22 16 46 17 62 - - - 65 67 69 71 73 Grants and contributions provided for capital purposes - - - - - - - - - - - - - Net gain from the disposal of assets - - - - - - - - - - - - -
Total Income 1,375 680 1,429 671 2,100 - - - 2,185 2,254 2,339 2,358 2,487
Expenses from continuing operations
Employee benefits and on-costs 243 79 253 82 335 - - - 291 298 305 313 321 Borrowing costs - - - - - - - - - - - - - Materials and contracts 351 196 363 533 897 - - - 868 895 924 954 985 Depreciation and amortisation 394 251 350 252 603 - - - 603 603 603 603 603 Other expenses 180 18 147 15 162 - - - 168 175 184 192 202 Net loss from the disposal of assets - - - - - - - - - - - - -
Total Expenses 1,168 544 1,113 883 1,996 - - - 1,928 1,971 2,015 2,062 2,110
Net Operating Result 207 136 317 (212) 104 - - - 257 283 324 296 377
Net operating result before grants
and contributions provided for
capital purposes 207 136 317 (212) 104 - - - 257 283 324 296 377
Efficiency savings / merger
costs
Income Statement Merged Council Budget 1.0 Printed 25/06/2015Page 60
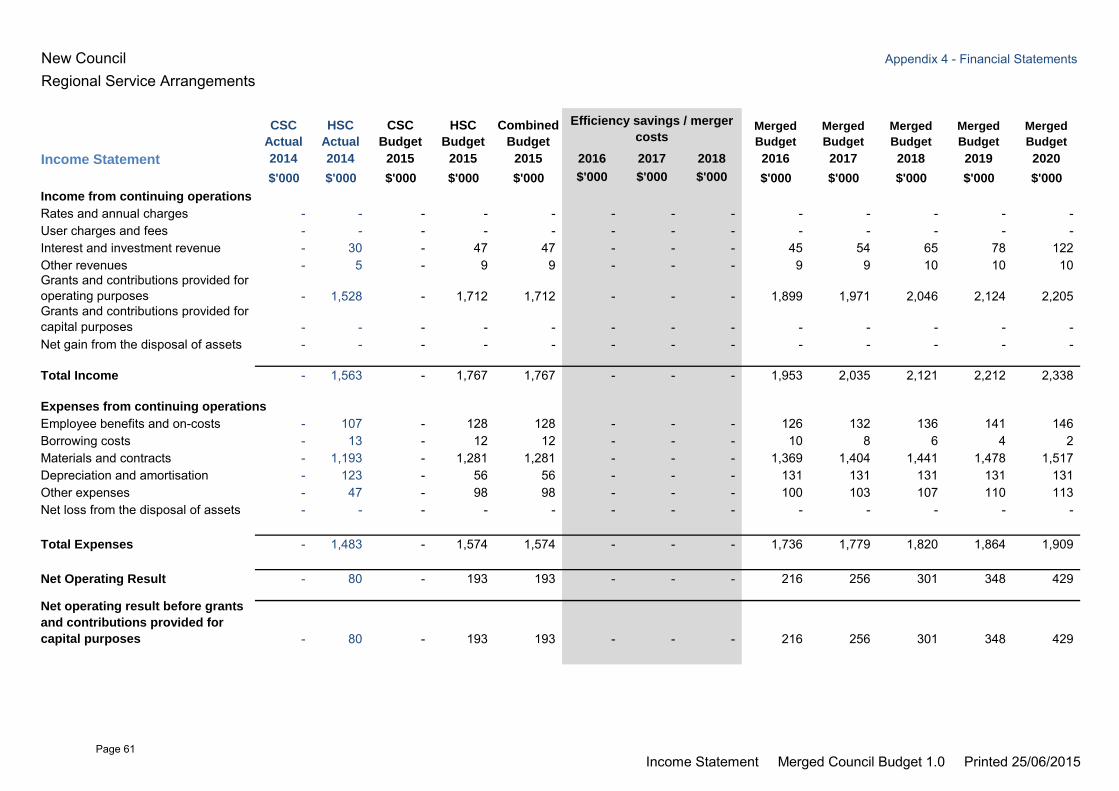
New Council Appendix 4 - Financial Statements
Regional Service Arrangements
CSC
Actual
HSC
Actual
CSC
Budget
HSC
Budget
Combined
Budget
Merged
Budget
Merged
Budget
Merged
Budget
Merged
Budget
Merged
Budget
Income Statement 2014 2014 2015 2015 2015 2016 2017 2018 2016 2017 2018 2019 2020
$'000 $'000 $'000 $'000 $'000 $'000 $'000 $'000 $'000 $'000 $'000 $'000 $'000
Income from continuing operations
Rates and annual charges - - - - - - - - - - - - - User charges and fees - - - - - - - - - - - - - Interest and investment revenue - 30 - 47 47 - - - 45 54 65 78 122 Other revenues - 5 - 9 9 - - - 9 9 10 10 10 Grants and contributions provided for operating purposes - 1,528 - 1,712 1,712 - - - 1,899 1,971 2,046 2,124 2,205 Grants and contributions provided for capital purposes - - - - - - - - - - - - - Net gain from the disposal of assets - - - - - - - - - - - - -
Total Income - 1,563 - 1,767 1,767 - - - 1,953 2,035 2,121 2,212 2,338
Expenses from continuing operations
Employee benefits and on-costs - 107 - 128 128 - - - 126 132 136 141 146 Borrowing costs - 13 - 12 12 - - - 10 8 6 4 2 Materials and contracts - 1,193 - 1,281 1,281 - - - 1,369 1,404 1,441 1,478 1,517 Depreciation and amortisation - 123 - 56 56 - - - 131 131 131 131 131 Other expenses - 47 - 98 98 - - - 100 103 107 110 113 Net loss from the disposal of assets - - - - - - - - - - - - -
Total Expenses - 1,483 - 1,574 1,574 - - - 1,736 1,779 1,820 1,864 1,909
Net Operating Result - 80 - 193 193 - - - 216 256 301 348 429
Net operating result before grants
and contributions provided for
capital purposes - 80 - 193 193 - - - 216 256 301 348 429
Efficiency savings / merger
costs
Income Statement Merged Council Budget 1.0 Printed 25/06/2015Page 61

New Council Appendix 4 - Financial Statements
General Fund
CSC
Actual
HSC
Actual
CSC
Budget
HSC
Budget
Combined
Budget
Merged
Budget
Merged
Budget
Merged
Budget
Merged
Budget
Merged
Budget
Income Statement 2014 2014 2015 2015 2015 2016 2017 2018 2016 2017 2018 2019 2020
$'000 $'000 $'000 $'000 $'000 $'000 $'000 $'000 $'000 $'000 $'000 $'000 $'000
Income from continuing operations
Rates and annual charges 4,673 2,923 4,955 3,141 8,097 - 30 30 8,290 8,584 8,990 9,415 9,875 User charges and fees 2,585 1,880 2,525 2,326 4,851 - - - 4,971 5,140 5,315 5,497 5,685 Interest and investment revenue 572 156 328 277 605 - (15) (16) 367 483 474 502 704 Other revenues 480 207 184 93 278 - - - 270 276 284 292 301 Grants and contributions provided for operating purposes 2,715 2,874 3,984 4,195 8,179 5,000 (32) 67 12,789 7,858 8,159 8,266 8,387 Grants and contributions provided for capital purposes 1,264 1,940 373 2,096 2,469 - - - 1,308 780 789 798 807 Joint venture interests 15 - - - - - - - - - - - - Net gain from the disposal of assets 22 93 - 276 276 - - - - - - - -
Total Income 12,325 10,073 12,350 12,404 24,755 5,000 (17) 81 27,995 23,121 24,011 24,770 25,759
Expenses from continuing operations
Employee benefits and on-costs 4,806 4,674 5,854 4,569 10,423 169 (376) (547) 10,134 10,087 10,163 10,514 10,877 Borrowing costs 74 101 100 72 172 - - - 87 84 73 61 49 Materials and contracts 2,871 3,762 2,411 2,137 4,548 92 92 119 4,455 4,653 4,726 4,615 4,736 Depreciation and amortisation 3,692 2,800 4,079 2,490 6,569 - (290) (290) 6,569 6,280 6,280 6,280 6,280 Impairment - - - - - - - - - - - - - Other expenses 1,995 580 1,488 1,287 2,775 156 (48) (146) 2,849 2,746 2,738 2,831 2,915 Net loss from the disposal of assets - - - - - - - - - - - - -
Total Expenses 13,438 11,917 13,932 10,555 24,487 417 (621) (863) 24,094 23,850 23,980 24,300 24,857
Net Operating Result (1,112) (1,844) (1,582) 1,849 268 4,583 604 944 3,901 (729) 31 470 902
Net operating result before grants
and contributions provided for
capital purposes (2,376) (3,784) (1,955) (246) (2,202) 4,583 604 944 2,594 (1,509) (758) (328) 96
Efficiency savings / merger
costs
Income Statement Merged Council Budget 1.0 Printed 25/06/2015Page 62
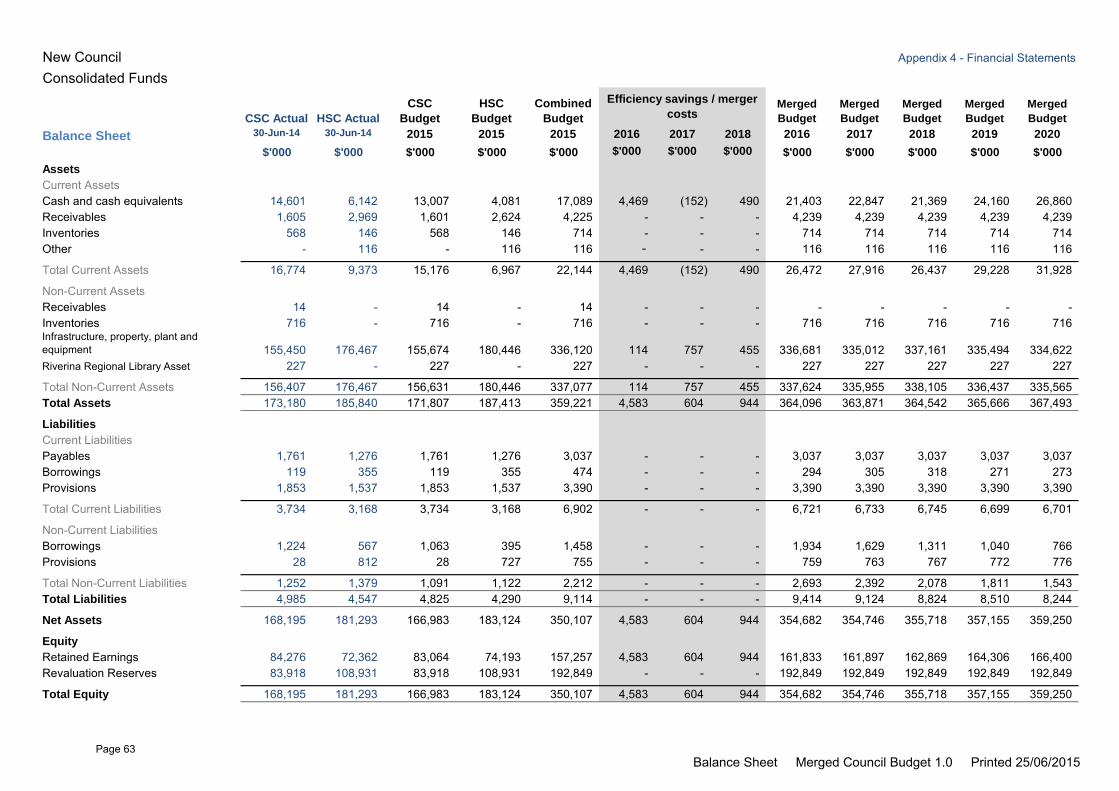
New Council Appendix 4 - Financial Statements
Consolidated Funds
CSC Actual HSC Actual
CSC
Budget
HSC
Budget
Combined
Budget
Merged
Budget
Merged
Budget
Merged
Budget
Merged
Budget
Merged
Budget
Balance Sheet 30-Jun-14 30-Jun-14 2015 2015 2015 2016 2017 2018 2016 2017 2018 2019 2020
$'000 $'000 $'000 $'000 $'000 $'000 $'000 $'000 $'000 $'000 $'000 $'000 $'000
Assets
Current AssetsCash and cash equivalents 14,601 6,142 13,007 4,081 17,089 4,469 (152) 490 21,403 22,847 21,369 24,160 26,860 Receivables 1,605 2,969 1,601 2,624 4,225 - - - 4,239 4,239 4,239 4,239 4,239 Inventories 568 146 568 146 714 - - - 714 714 714 714 714 Other - 116 - 116 116 - - - 116 116 116 116 116
Total Current Assets 16,774 9,373 15,176 6,967 22,144 4,469 (152) 490 26,472 27,916 26,437 29,228 31,928
Non-Current AssetsReceivables 14 - 14 - 14 - - - - - - - - Inventories 716 - 716 - 716 - - - 716 716 716 716 716 Infrastructure, property, plant and equipment 155,450 176,467 155,674 180,446 336,120 114 757 455 336,681 335,012 337,161 335,494 334,622 Riverina Regional Library Asset 227 - 227 - 227 - - - 227 227 227 227 227
Total Non-Current Assets 156,407 176,467 156,631 180,446 337,077 114 757 455 337,624 335,955 338,105 336,437 335,565 Total Assets 173,180 185,840 171,807 187,413 359,221 4,583 604 944 364,096 363,871 364,542 365,666 367,493
Liabilities
Current LiabilitiesPayables 1,761 1,276 1,761 1,276 3,037 - - - 3,037 3,037 3,037 3,037 3,037 Borrowings 119 355 119 355 474 - - - 294 305 318 271 273 Provisions 1,853 1,537 1,853 1,537 3,390 - - - 3,390 3,390 3,390 3,390 3,390
Total Current Liabilities 3,734 3,168 3,734 3,168 6,902 - - - 6,721 6,733 6,745 6,699 6,701
Non-Current LiabilitiesBorrowings 1,224 567 1,063 395 1,458 - - - 1,934 1,629 1,311 1,040 766 Provisions 28 812 28 727 755 - - - 759 763 767 772 776
Total Non-Current Liabilities 1,252 1,379 1,091 1,122 2,212 - - - 2,693 2,392 2,078 1,811 1,543 Total Liabilities 4,985 4,547 4,825 4,290 9,114 - - - 9,414 9,124 8,824 8,510 8,244
Net Assets 168,195 181,293 166,983 183,124 350,107 4,583 604 944 354,682 354,746 355,718 357,155 359,250
Equity
Retained Earnings 84,276 72,362 83,064 74,193 157,257 4,583 604 944 161,833 161,897 162,869 164,306 166,400 Revaluation Reserves 83,918 108,931 83,918 108,931 192,849 - - - 192,849 192,849 192,849 192,849 192,849
Total Equity 168,195 181,293 166,983 183,124 350,107 4,583 604 944 354,682 354,746 355,718 357,155 359,250
Efficiency savings / merger
costs
Balance Sheet Merged Council Budget 1.0 Printed 25/06/2015Page 63
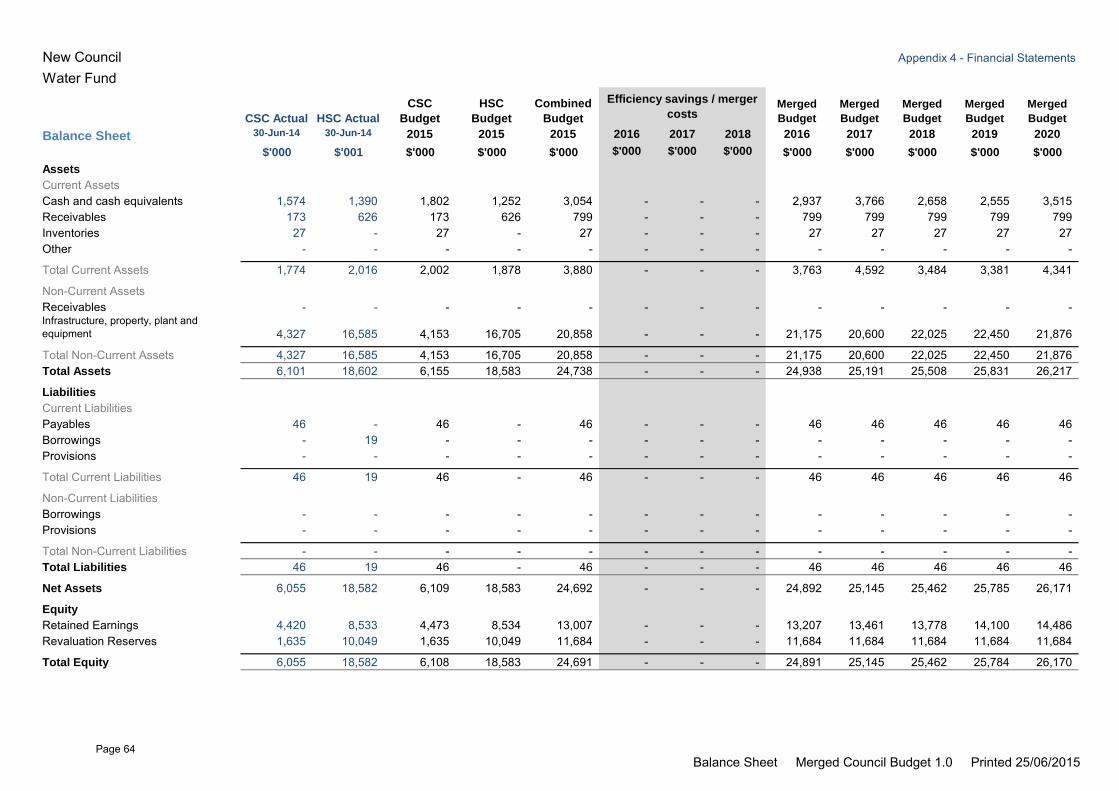
New Council Appendix 4 - Financial Statements
Water Fund
CSC Actual HSC Actual
CSC
Budget
HSC
Budget
Combined
Budget
Merged
Budget
Merged
Budget
Merged
Budget
Merged
Budget
Merged
Budget
Balance Sheet 30-Jun-14 30-Jun-14 2015 2015 2015 2016 2017 2018 2016 2017 2018 2019 2020
$'000 $'001 $'000 $'000 $'000 $'000 $'000 $'000 $'000 $'000 $'000 $'000 $'000
Assets
Current AssetsCash and cash equivalents 1,574 1,390 1,802 1,252 3,054 - - - 2,937 3,766 2,658 2,555 3,515 Receivables 173 626 173 626 799 - - - 799 799 799 799 799 Inventories 27 - 27 - 27 - - - 27 27 27 27 27 Other - - - - - - - - - - - - -
Total Current Assets 1,774 2,016 2,002 1,878 3,880 - - - 3,763 4,592 3,484 3,381 4,341
Non-Current AssetsReceivables - - - - - - - - - - - - - Infrastructure, property, plant and equipment 4,327 16,585 4,153 16,705 20,858 - - - 21,175 20,600 22,025 22,450 21,876
Total Non-Current Assets 4,327 16,585 4,153 16,705 20,858 - - - 21,175 20,600 22,025 22,450 21,876 Total Assets 6,101 18,602 6,155 18,583 24,738 - - - 24,938 25,191 25,508 25,831 26,217
Liabilities
Current LiabilitiesPayables 46 - 46 - 46 - - - 46 46 46 46 46 Borrowings - 19 - - - - - - - - - - - Provisions - - - - - - - - - - - - -
Total Current Liabilities 46 19 46 - 46 - - - 46 46 46 46 46
Non-Current LiabilitiesBorrowings - - - - - - - - - - - - - Provisions - - - - - - - - - - - - -
Total Non-Current Liabilities - - - - - - - - - - - - - Total Liabilities 46 19 46 - 46 - - - 46 46 46 46 46
Net Assets 6,055 18,582 6,109 18,583 24,692 - - - 24,892 25,145 25,462 25,785 26,171
Equity
Retained Earnings 4,420 8,533 4,473 8,534 13,007 - - - 13,207 13,461 13,778 14,100 14,486 Revaluation Reserves 1,635 10,049 1,635 10,049 11,684 - - - 11,684 11,684 11,684 11,684 11,684
Total Equity 6,055 18,582 6,108 18,583 24,691 - - - 24,891 25,145 25,462 25,784 26,170
Efficiency savings / merger
costs
Balance Sheet Merged Council Budget 1.0 Printed 25/06/2015Page 64
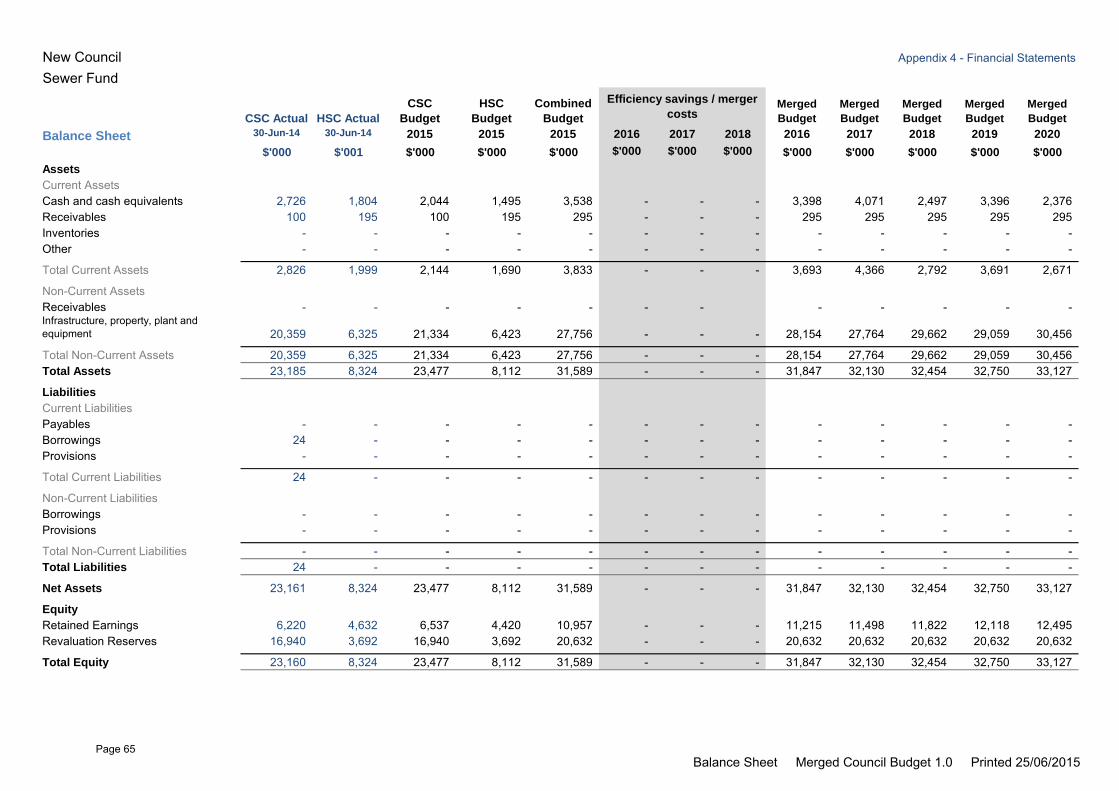
New Council Appendix 4 - Financial Statements
Sewer Fund
CSC Actual HSC Actual
CSC
Budget
HSC
Budget
Combined
Budget
Merged
Budget
Merged
Budget
Merged
Budget
Merged
Budget
Merged
Budget
Balance Sheet 30-Jun-14 30-Jun-14 2015 2015 2015 2016 2017 2018 2016 2017 2018 2019 2020
$'000 $'001 $'000 $'000 $'000 $'000 $'000 $'000 $'000 $'000 $'000 $'000 $'000
Assets
Current AssetsCash and cash equivalents 2,726 1,804 2,044 1,495 3,538 - - - 3,398 4,071 2,497 3,396 2,376 Receivables 100 195 100 195 295 - - - 295 295 295 295 295 Inventories - - - - - - - - - - - - - Other - - - - - - - - - - - - -
Total Current Assets 2,826 1,999 2,144 1,690 3,833 - - - 3,693 4,366 2,792 3,691 2,671
Non-Current AssetsReceivables - - - - - - - - - - - - Infrastructure, property, plant and equipment 20,359 6,325 21,334 6,423 27,756 - - - 28,154 27,764 29,662 29,059 30,456
Total Non-Current Assets 20,359 6,325 21,334 6,423 27,756 - - - 28,154 27,764 29,662 29,059 30,456 Total Assets 23,185 8,324 23,477 8,112 31,589 - - - 31,847 32,130 32,454 32,750 33,127
Liabilities
Current LiabilitiesPayables - - - - - - - - - - - - - Borrowings 24 - - - - - - - - - - - - Provisions - - - - - - - - - - - - -
Total Current Liabilities 24 - - - - - - - - - - - -
Non-Current LiabilitiesBorrowings - - - - - - - - - - - - - Provisions - - - - - - - - - - - - -
Total Non-Current Liabilities - - - - - - - - - - - - - Total Liabilities 24 - - - - - - - - - - - -
Net Assets 23,161 8,324 23,477 8,112 31,589 - - - 31,847 32,130 32,454 32,750 33,127
Equity
Retained Earnings 6,220 4,632 6,537 4,420 10,957 - - - 11,215 11,498 11,822 12,118 12,495 Revaluation Reserves 16,940 3,692 16,940 3,692 20,632 - - - 20,632 20,632 20,632 20,632 20,632
Total Equity 23,160 8,324 23,477 8,112 31,589 - - - 31,847 32,130 32,454 32,750 33,127
Efficiency savings / merger
costs
Balance Sheet Merged Council Budget 1.0 Printed 25/06/2015Page 65
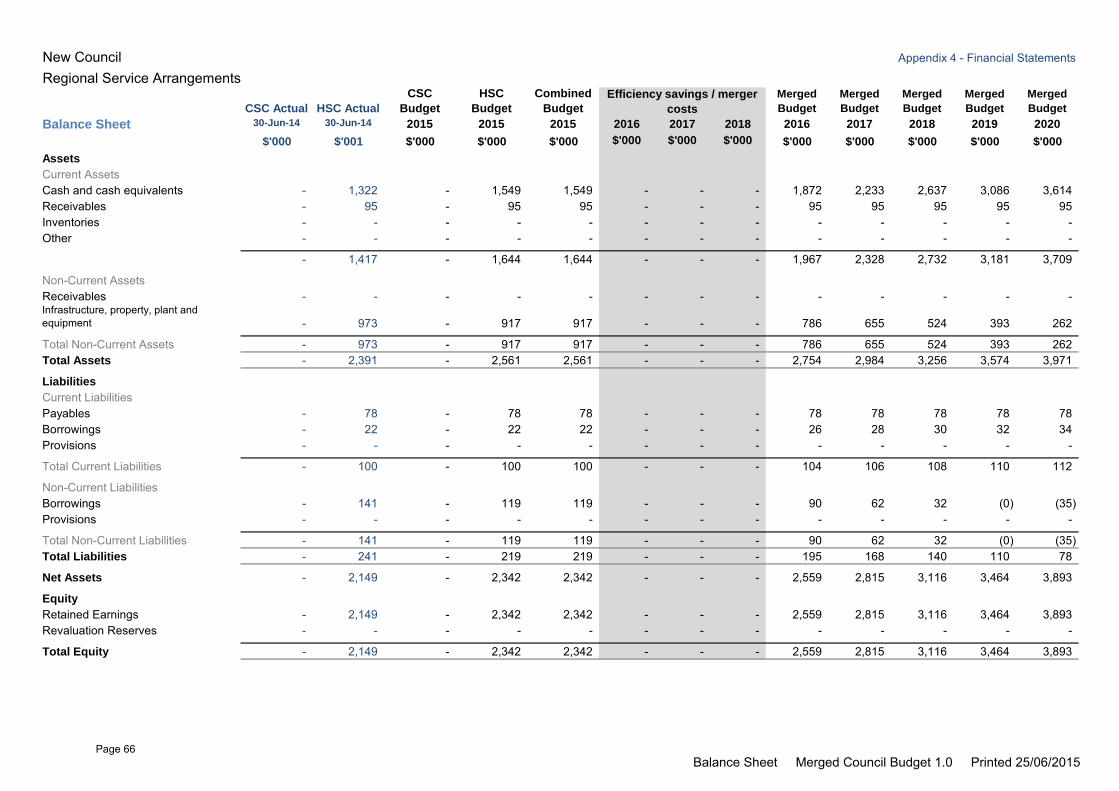
New Council Appendix 4 - Financial Statements
Regional Service Arrangements
CSC Actual HSC Actual
CSC
Budget
HSC
Budget
Combined
Budget
Merged
Budget
Merged
Budget
Merged
Budget
Merged
Budget
Merged
Budget
Balance Sheet 30-Jun-14 30-Jun-14 2015 2015 2015 2016 2017 2018 2016 2017 2018 2019 2020
$'000 $'001 $'000 $'000 $'000 $'000 $'000 $'000 $'000 $'000 $'000 $'000 $'000
Assets
Current AssetsCash and cash equivalents - 1,322 - 1,549 1,549 - - - 1,872 2,233 2,637 3,086 3,614 Receivables - 95 - 95 95 - - - 95 95 95 95 95 Inventories - - - - - - - - - - - - - Other - - - - - - - - - - - - -
- 1,417 - 1,644 1,644 - - - 1,967 2,328 2,732 3,181 3,709
Non-Current AssetsReceivables - - - - - - - - - - - - - Infrastructure, property, plant and equipment - 973 - 917 917 - - - 786 655 524 393 262
Total Non-Current Assets - 973 - 917 917 - - - 786 655 524 393 262 Total Assets - 2,391 - 2,561 2,561 - - - 2,754 2,984 3,256 3,574 3,971
Liabilities
Current LiabilitiesPayables - 78 - 78 78 - - - 78 78 78 78 78 Borrowings - 22 - 22 22 - - - 26 28 30 32 34 Provisions - - - - - - - - - - - - -
Total Current Liabilities - 100 - 100 100 - - - 104 106 108 110 112
Non-Current LiabilitiesBorrowings - 141 - 119 119 - - - 90 62 32 (0) (35) Provisions - - - - - - - - - - - - -
Total Non-Current Liabilities - 141 - 119 119 - - - 90 62 32 (0) (35) Total Liabilities - 241 - 219 219 - - - 195 168 140 110 78
Net Assets - 2,149 - 2,342 2,342 - - - 2,559 2,815 3,116 3,464 3,893
Equity
Retained Earnings - 2,149 - 2,342 2,342 - - - 2,559 2,815 3,116 3,464 3,893 Revaluation Reserves - - - - - - - - - - - - -
Total Equity - 2,149 - 2,342 2,342 - - - 2,559 2,815 3,116 3,464 3,893
Efficiency savings / merger
costs
Balance Sheet Merged Council Budget 1.0 Printed 25/06/2015Page 66
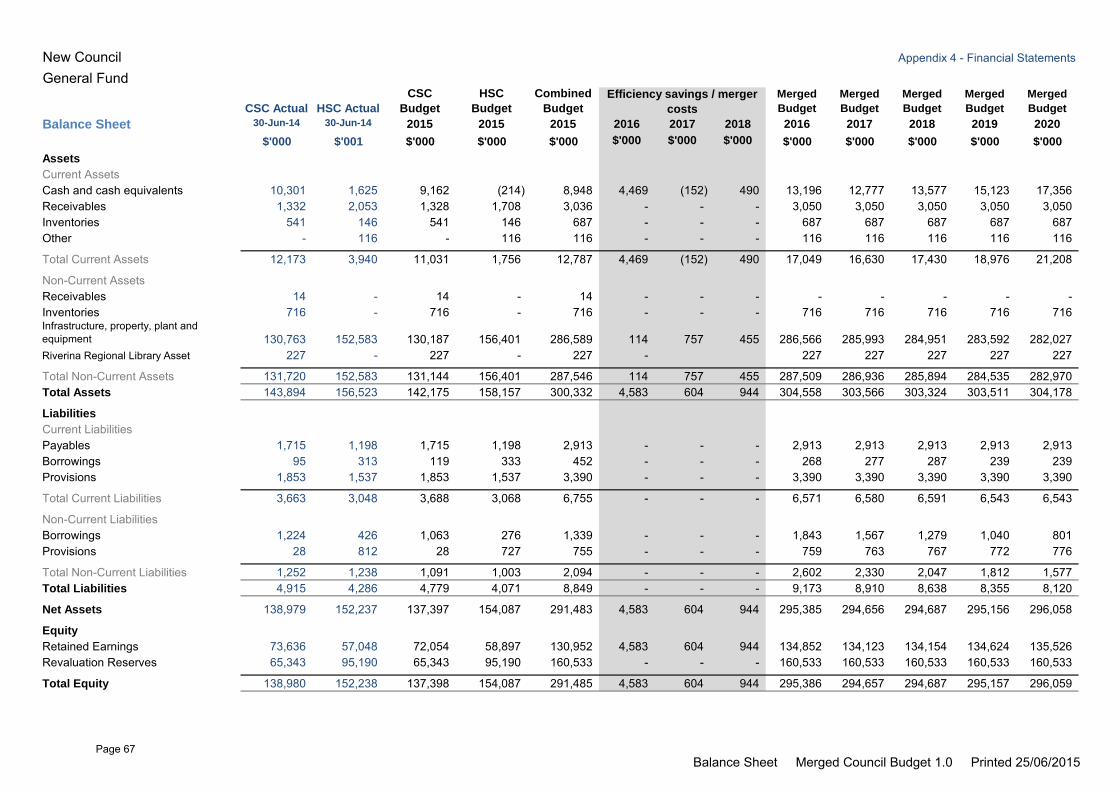
New Council Appendix 4 - Financial Statements
General Fund
CSC Actual HSC Actual
CSC
Budget
HSC
Budget
Combined
Budget
Merged
Budget
Merged
Budget
Merged
Budget
Merged
Budget
Merged
Budget
Balance Sheet 30-Jun-14 30-Jun-14 2015 2015 2015 2016 2017 2018 2016 2017 2018 2019 2020
$'000 $'001 $'000 $'000 $'000 $'000 $'000 $'000 $'000 $'000 $'000 $'000 $'000
Assets
Current AssetsCash and cash equivalents 10,301 1,625 9,162 (214) 8,948 4,469 (152) 490 13,196 12,777 13,577 15,123 17,356 Receivables 1,332 2,053 1,328 1,708 3,036 - - - 3,050 3,050 3,050 3,050 3,050 Inventories 541 146 541 146 687 - - - 687 687 687 687 687 Other - 116 - 116 116 - - - 116 116 116 116 116
Total Current Assets 12,173 3,940 11,031 1,756 12,787 4,469 (152) 490 17,049 16,630 17,430 18,976 21,208
Non-Current AssetsReceivables 14 - 14 - 14 - - - - - - - - Inventories 716 - 716 - 716 - - - 716 716 716 716 716 Infrastructure, property, plant and equipment 130,763 152,583 130,187 156,401 286,589 114 757 455 286,566 285,993 284,951 283,592 282,027 Riverina Regional Library Asset 227 - 227 - 227 - 227 227 227 227 227
Total Non-Current Assets 131,720 152,583 131,144 156,401 287,546 114 757 455 287,509 286,936 285,894 284,535 282,970 Total Assets 143,894 156,523 142,175 158,157 300,332 4,583 604 944 304,558 303,566 303,324 303,511 304,178
Liabilities
Current LiabilitiesPayables 1,715 1,198 1,715 1,198 2,913 - - - 2,913 2,913 2,913 2,913 2,913 Borrowings 95 313 119 333 452 - - - 268 277 287 239 239 Provisions 1,853 1,537 1,853 1,537 3,390 - - - 3,390 3,390 3,390 3,390 3,390
Total Current Liabilities 3,663 3,048 3,688 3,068 6,755 - - - 6,571 6,580 6,591 6,543 6,543
Non-Current LiabilitiesBorrowings 1,224 426 1,063 276 1,339 - - - 1,843 1,567 1,279 1,040 801 Provisions 28 812 28 727 755 - - - 759 763 767 772 776
Total Non-Current Liabilities 1,252 1,238 1,091 1,003 2,094 - - - 2,602 2,330 2,047 1,812 1,577 Total Liabilities 4,915 4,286 4,779 4,071 8,849 - - - 9,173 8,910 8,638 8,355 8,120
Net Assets 138,979 152,237 137,397 154,087 291,483 4,583 604 944 295,385 294,656 294,687 295,156 296,058
Equity
Retained Earnings 73,636 57,048 72,054 58,897 130,952 4,583 604 944 134,852 134,123 134,154 134,624 135,526 Revaluation Reserves 65,343 95,190 65,343 95,190 160,533 - - - 160,533 160,533 160,533 160,533 160,533
Total Equity 138,980 152,238 137,398 154,087 291,485 4,583 604 944 295,386 294,657 294,687 295,157 296,059
Efficiency savings / merger
costs
Balance Sheet Merged Council Budget 1.0 Printed 25/06/2015Page 67
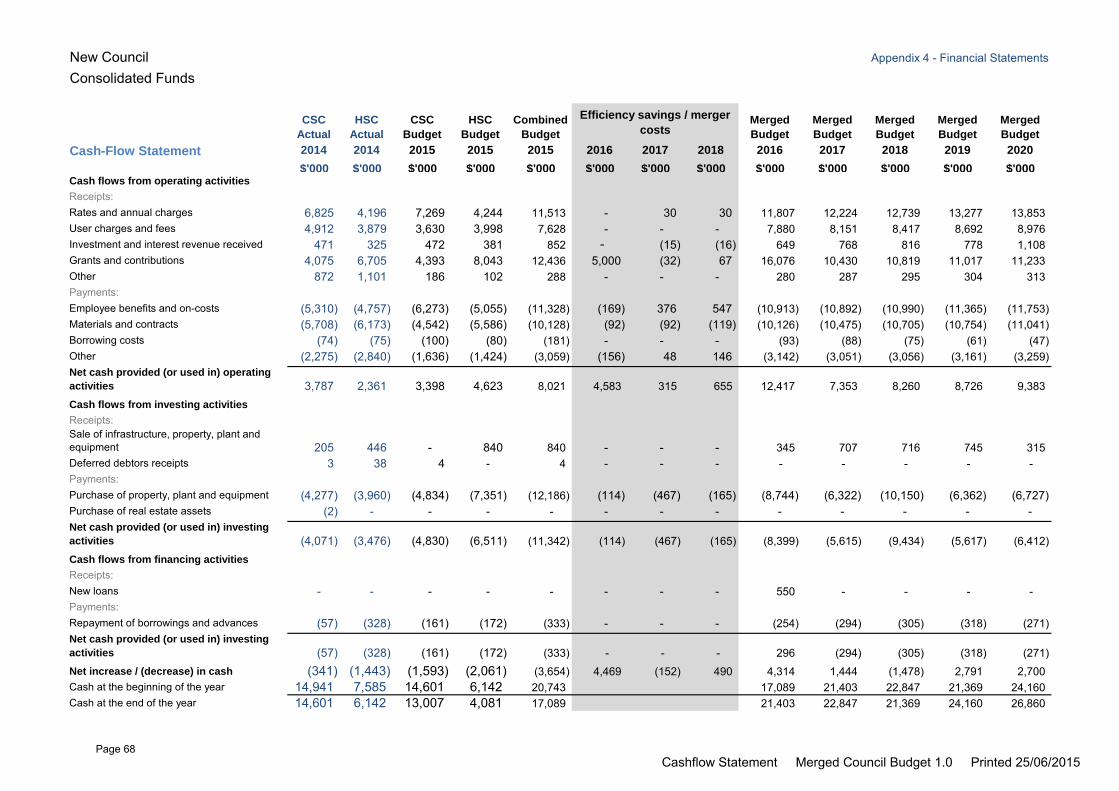
New Council Appendix 4 - Financial Statements
Consolidated Funds
CSC
Actual
HSC
Actual
CSC
Budget
HSC
Budget
Combined
Budget
Merged
Budget
Merged
Budget
Merged
Budget
Merged
Budget
Merged
Budget
Cash-Flow Statement 2014 2014 2015 2015 2015 2016 2017 2018 2016 2017 2018 2019 2020
$'000 $'000 $'000 $'000 $'000 $'000 $'000 $'000 $'000 $'000 $'000 $'000 $'000Cash flows from operating activities
Receipts:Rates and annual charges 6,825 4,196 7,269 4,244 11,513 - 30 30 11,807 12,224 12,739 13,277 13,853 User charges and fees 4,912 3,879 3,630 3,998 7,628 - - - 7,880 8,151 8,417 8,692 8,976 Investment and interest revenue received 471 325 472 381 852 - (15) (16) 649 768 816 778 1,108 Grants and contributions 4,075 6,705 4,393 8,043 12,436 5,000 (32) 67 16,076 10,430 10,819 11,017 11,233 Other 872 1,101 186 102 288 - - - 280 287 295 304 313 Payments:Employee benefits and on-costs (5,310) (4,757) (6,273) (5,055) (11,328) (169) 376 547 (10,913) (10,892) (10,990) (11,365) (11,753) Materials and contracts (5,708) (6,173) (4,542) (5,586) (10,128) (92) (92) (119) (10,126) (10,475) (10,705) (10,754) (11,041) Borrowing costs (74) (75) (100) (80) (181) - - - (93) (88) (75) (61) (47) Other (2,275) (2,840) (1,636) (1,424) (3,059) (156) 48 146 (3,142) (3,051) (3,056) (3,161) (3,259) Net cash provided (or used in) operating
activities 3,787 2,361 3,398 4,623 8,021 4,583 315 655 12,417 7,353 8,260 8,726 9,383 Cash flows from investing activities
Receipts:Sale of infrastructure, property, plant and equipment 205 446 - 840 840 - - - 345 707 716 745 315 Deferred debtors receipts 3 38 4 - 4 - - - - - - - - Payments:Purchase of property, plant and equipment (4,277) (3,960) (4,834) (7,351) (12,186) (114) (467) (165) (8,744) (6,322) (10,150) (6,362) (6,727) Purchase of real estate assets (2) - - - - - - - - - - - - Net cash provided (or used in) investing
activities (4,071) (3,476) (4,830) (6,511) (11,342) (114) (467) (165) (8,399) (5,615) (9,434) (5,617) (6,412) Cash flows from financing activities
Receipts:New loans - - - - - - - - 550 - - - - Payments:Repayment of borrowings and advances (57) (328) (161) (172) (333) - - - (254) (294) (305) (318) (271) Net cash provided (or used in) investing
activities (57) (328) (161) (172) (333) - - - 296 (294) (305) (318) (271) Net increase / (decrease) in cash (341) (1,443) (1,593) (2,061) (3,654) 4,469 (152) 490 4,314 1,444 (1,478) 2,791 2,700 Cash at the beginning of the year 14,941 7,585 14,601 6,142 20,743 17,089 21,403 22,847 21,369 24,160 Cash at the end of the year 14,601 6,142 13,007 4,081 17,089 21,403 22,847 21,369 24,160 26,860
Efficiency savings / merger
costs
Cashflow Statement Merged Council Budget 1.0 Printed 25/06/2015Page 68
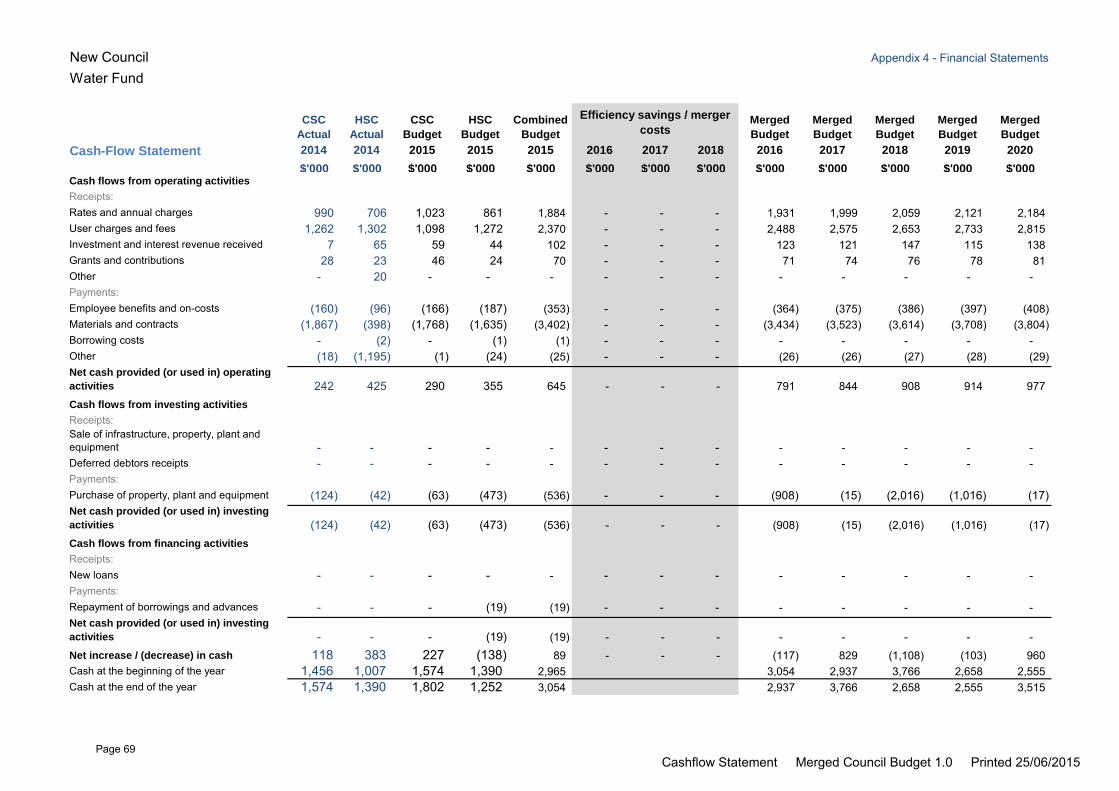
New Council Appendix 4 - Financial Statements
Water Fund
CSC
Actual
HSC
Actual
CSC
Budget
HSC
Budget
Combined
Budget
Merged
Budget
Merged
Budget
Merged
Budget
Merged
Budget
Merged
Budget
Cash-Flow Statement 2014 2014 2015 2015 2015 2016 2017 2018 2016 2017 2018 2019 2020
$'000 $'000 $'000 $'000 $'000 $'000 $'000 $'000 $'000 $'000 $'000 $'000 $'000Cash flows from operating activities
Receipts:Rates and annual charges 990 706 1,023 861 1,884 - - - 1,931 1,999 2,059 2,121 2,184 User charges and fees 1,262 1,302 1,098 1,272 2,370 - - - 2,488 2,575 2,653 2,733 2,815 Investment and interest revenue received 7 65 59 44 102 - - - 123 121 147 115 138 Grants and contributions 28 23 46 24 70 - - - 71 74 76 78 81 Other - 20 - - - - - - - - - - - Payments:Employee benefits and on-costs (160) (96) (166) (187) (353) - - - (364) (375) (386) (397) (408) Materials and contracts (1,867) (398) (1,768) (1,635) (3,402) - - - (3,434) (3,523) (3,614) (3,708) (3,804) Borrowing costs - (2) - (1) (1) - - - - - - - - Other (18) (1,195) (1) (24) (25) - - - (26) (26) (27) (28) (29) Net cash provided (or used in) operating
activities 242 425 290 355 645 - - - 791 844 908 914 977 Cash flows from investing activities
Receipts:Sale of infrastructure, property, plant and equipment - - - - - - - - - - - - - Deferred debtors receipts - - - - - - - - - - - - - Payments:Purchase of property, plant and equipment (124) (42) (63) (473) (536) - - - (908) (15) (2,016) (1,016) (17) Net cash provided (or used in) investing
activities (124) (42) (63) (473) (536) - - - (908) (15) (2,016) (1,016) (17) Cash flows from financing activities
Receipts:New loans - - - - - - - - - - - - - Payments:Repayment of borrowings and advances - - - (19) (19) - - - - - - - - Net cash provided (or used in) investing
activities - - - (19) (19) - - - - - - - - Net increase / (decrease) in cash 118 383 227 (138) 89 - - - (117) 829 (1,108) (103) 960 Cash at the beginning of the year 1,456 1,007 1,574 1,390 2,965 3,054 2,937 3,766 2,658 2,555 Cash at the end of the year 1,574 1,390 1,802 1,252 3,054 2,937 3,766 2,658 2,555 3,515
Efficiency savings / merger
costs
Cashflow Statement Merged Council Budget 1.0 Printed 25/06/2015Page 69
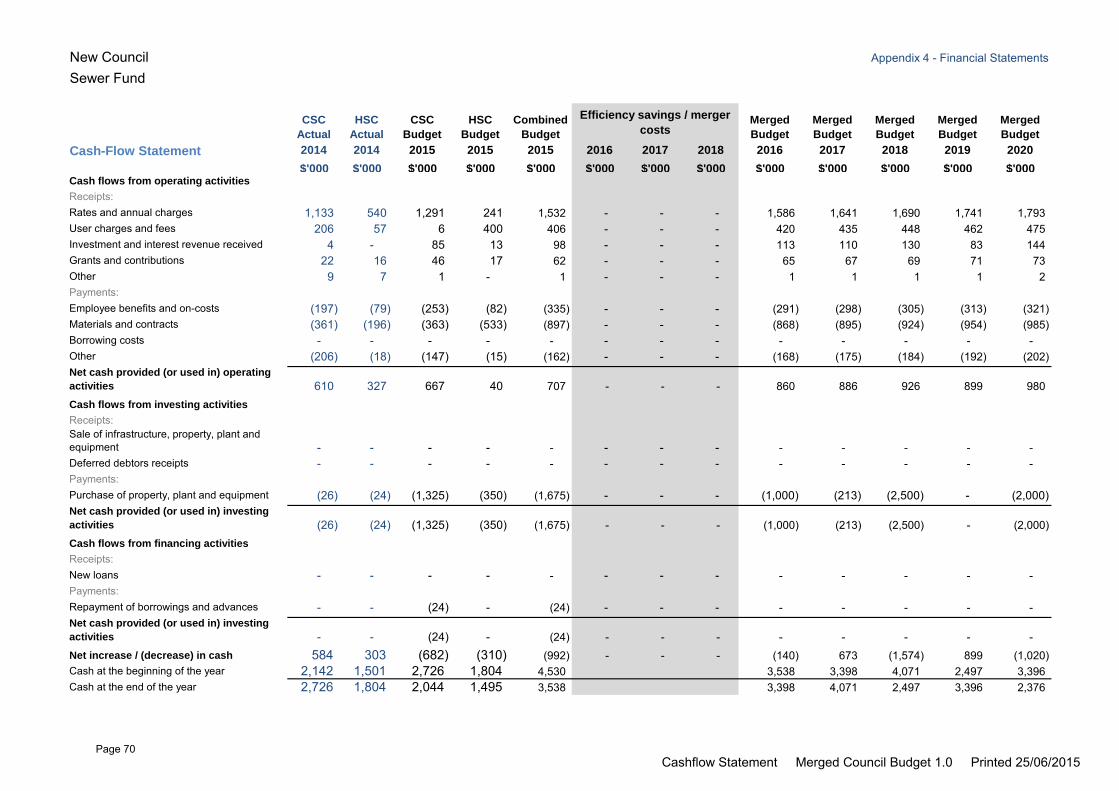
New Council Appendix 4 - Financial Statements
Sewer Fund
CSC
Actual
HSC
Actual
CSC
Budget
HSC
Budget
Combined
Budget
Merged
Budget
Merged
Budget
Merged
Budget
Merged
Budget
Merged
Budget
Cash-Flow Statement 2014 2014 2015 2015 2015 2016 2017 2018 2016 2017 2018 2019 2020
$'000 $'000 $'000 $'000 $'000 $'000 $'000 $'000 $'000 $'000 $'000 $'000 $'000Cash flows from operating activities
Receipts:Rates and annual charges 1,133 540 1,291 241 1,532 - - - 1,586 1,641 1,690 1,741 1,793 User charges and fees 206 57 6 400 406 - - - 420 435 448 462 475 Investment and interest revenue received 4 - 85 13 98 - - - 113 110 130 83 144 Grants and contributions 22 16 46 17 62 - - - 65 67 69 71 73 Other 9 7 1 - 1 - - - 1 1 1 1 2 Payments:Employee benefits and on-costs (197) (79) (253) (82) (335) - - - (291) (298) (305) (313) (321) Materials and contracts (361) (196) (363) (533) (897) - - - (868) (895) (924) (954) (985) Borrowing costs - - - - - - - - - - - - - Other (206) (18) (147) (15) (162) - - - (168) (175) (184) (192) (202) Net cash provided (or used in) operating
activities 610 327 667 40 707 - - - 860 886 926 899 980 Cash flows from investing activities
Receipts:Sale of infrastructure, property, plant and equipment - - - - - - - - - - - - - Deferred debtors receipts - - - - - - - - - - - - - Payments:Purchase of property, plant and equipment (26) (24) (1,325) (350) (1,675) - - - (1,000) (213) (2,500) - (2,000) Net cash provided (or used in) investing
activities (26) (24) (1,325) (350) (1,675) - - - (1,000) (213) (2,500) - (2,000) Cash flows from financing activities
Receipts:New loans - - - - - - - - - - - - - Payments:Repayment of borrowings and advances - - (24) - (24) - - - - - - - - Net cash provided (or used in) investing
activities - - (24) - (24) - - - - - - - - Net increase / (decrease) in cash 584 303 (682) (310) (992) - - - (140) 673 (1,574) 899 (1,020) Cash at the beginning of the year 2,142 1,501 2,726 1,804 4,530 3,538 3,398 4,071 2,497 3,396 Cash at the end of the year 2,726 1,804 2,044 1,495 3,538 3,398 4,071 2,497 3,396 2,376
Efficiency savings / merger
costs
Cashflow Statement Merged Council Budget 1.0 Printed 25/06/2015Page 70
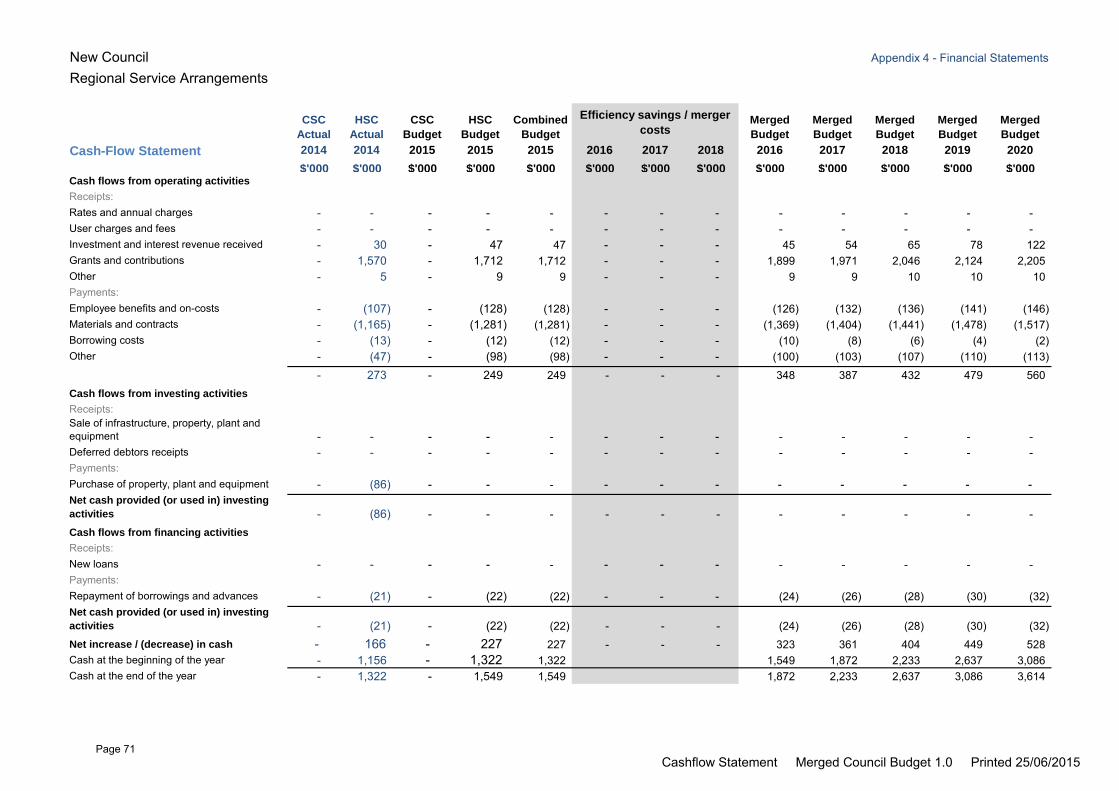
New Council Appendix 4 - Financial Statements
Regional Service Arrangements
CSC
Actual
HSC
Actual
CSC
Budget
HSC
Budget
Combined
Budget
Merged
Budget
Merged
Budget
Merged
Budget
Merged
Budget
Merged
Budget
Cash-Flow Statement 2014 2014 2015 2015 2015 2016 2017 2018 2016 2017 2018 2019 2020
$'000 $'000 $'000 $'000 $'000 $'000 $'000 $'000 $'000 $'000 $'000 $'000 $'000Cash flows from operating activities
Receipts:Rates and annual charges - - - - - - - - - - - - - User charges and fees - - - - - - - - - - - - - Investment and interest revenue received - 30 - 47 47 - - - 45 54 65 78 122 Grants and contributions - 1,570 - 1,712 1,712 - - - 1,899 1,971 2,046 2,124 2,205 Other - 5 - 9 9 - - - 9 9 10 10 10 Payments:Employee benefits and on-costs - (107) - (128) (128) - - - (126) (132) (136) (141) (146) Materials and contracts - (1,165) - (1,281) (1,281) - - - (1,369) (1,404) (1,441) (1,478) (1,517) Borrowing costs - (13) - (12) (12) - - - (10) (8) (6) (4) (2) Other - (47) - (98) (98) - - - (100) (103) (107) (110) (113)
- 273 - 249 249 - - - 348 387 432 479 560 Cash flows from investing activities
Receipts:Sale of infrastructure, property, plant and equipment - - - - - - - - - - - - - Deferred debtors receipts - - - - - - - - - - - - - Payments:Purchase of property, plant and equipment - (86) - - - - - - - - - - - Net cash provided (or used in) investing
activities - (86) - - - - - - - - - - - Cash flows from financing activities
Receipts:New loans - - - - - - - - - - - - - Payments:Repayment of borrowings and advances - (21) - (22) (22) - - - (24) (26) (28) (30) (32) Net cash provided (or used in) investing
activities - (21) - (22) (22) - - - (24) (26) (28) (30) (32) Net increase / (decrease) in cash - 166 - 227 227 - - - 323 361 404 449 528 Cash at the beginning of the year - 1,156 - 1,322 1,322 1,549 1,872 2,233 2,637 3,086 Cash at the end of the year - 1,322 - 1,549 1,549 1,872 2,233 2,637 3,086 3,614
Efficiency savings / merger
costs
Cashflow Statement Merged Council Budget 1.0 Printed 25/06/2015Page 71
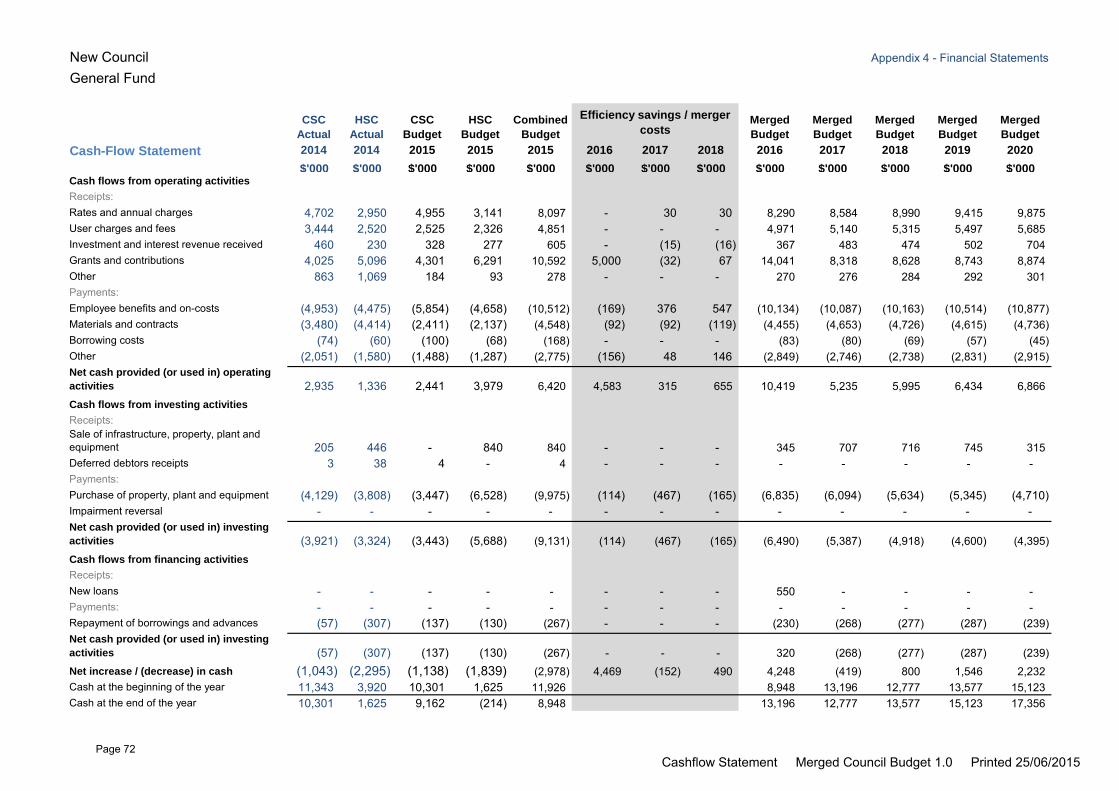
New Council Appendix 4 - Financial Statements
General Fund
CSC
Actual
HSC
Actual
CSC
Budget
HSC
Budget
Combined
Budget
Merged
Budget
Merged
Budget
Merged
Budget
Merged
Budget
Merged
Budget
Cash-Flow Statement 2014 2014 2015 2015 2015 2016 2017 2018 2016 2017 2018 2019 2020
$'000 $'000 $'000 $'000 $'000 $'000 $'000 $'000 $'000 $'000 $'000 $'000 $'000Cash flows from operating activities
Receipts:Rates and annual charges 4,702 2,950 4,955 3,141 8,097 - 30 30 8,290 8,584 8,990 9,415 9,875 User charges and fees 3,444 2,520 2,525 2,326 4,851 - - - 4,971 5,140 5,315 5,497 5,685 Investment and interest revenue received 460 230 328 277 605 - (15) (16) 367 483 474 502 704 Grants and contributions 4,025 5,096 4,301 6,291 10,592 5,000 (32) 67 14,041 8,318 8,628 8,743 8,874 Other 863 1,069 184 93 278 - - - 270 276 284 292 301 Payments:Employee benefits and on-costs (4,953) (4,475) (5,854) (4,658) (10,512) (169) 376 547 (10,134) (10,087) (10,163) (10,514) (10,877) Materials and contracts (3,480) (4,414) (2,411) (2,137) (4,548) (92) (92) (119) (4,455) (4,653) (4,726) (4,615) (4,736) Borrowing costs (74) (60) (100) (68) (168) - - - (83) (80) (69) (57) (45) Other (2,051) (1,580) (1,488) (1,287) (2,775) (156) 48 146 (2,849) (2,746) (2,738) (2,831) (2,915) Net cash provided (or used in) operating
activities 2,935 1,336 2,441 3,979 6,420 4,583 315 655 10,419 5,235 5,995 6,434 6,866 Cash flows from investing activities
Receipts:Sale of infrastructure, property, plant and equipment 205 446 - 840 840 - - - 345 707 716 745 315 Deferred debtors receipts 3 38 4 - 4 - - - - - - - - Payments:Purchase of property, plant and equipment (4,129) (3,808) (3,447) (6,528) (9,975) (114) (467) (165) (6,835) (6,094) (5,634) (5,345) (4,710) Impairment reversal - - - - - - - - - - - - - Net cash provided (or used in) investing
activities (3,921) (3,324) (3,443) (5,688) (9,131) (114) (467) (165) (6,490) (5,387) (4,918) (4,600) (4,395) Cash flows from financing activities
Receipts:New loans - - - - - - - - 550 - - - - Payments: - - - - - - - - - - - - - Repayment of borrowings and advances (57) (307) (137) (130) (267) - - - (230) (268) (277) (287) (239) Net cash provided (or used in) investing
activities (57) (307) (137) (130) (267) - - - 320 (268) (277) (287) (239) Net increase / (decrease) in cash (1,043) (2,295) (1,138) (1,839) (2,978) 4,469 (152) 490 4,248 (419) 800 1,546 2,232 Cash at the beginning of the year 11,343 3,920 10,301 1,625 11,926 8,948 13,196 12,777 13,577 15,123 Cash at the end of the year 10,301 1,625 9,162 (214) 8,948 13,196 12,777 13,577 15,123 17,356
Efficiency savings / merger
costs
Cashflow Statement Merged Council Budget 1.0 Printed 25/06/2015Page 72
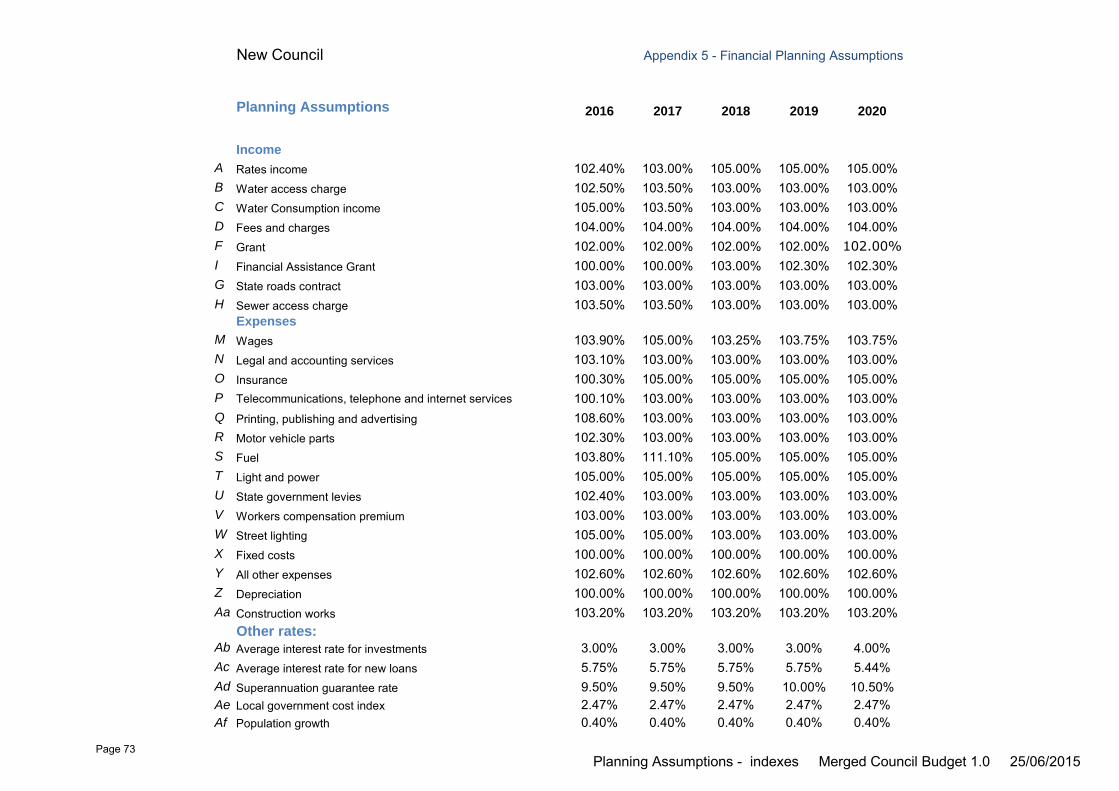
New Council Appendix 5 - Financial Planning Assumptions
3 4 5 6 7Planning Assumptions 2016 2017 2018 2019 2020
Income
A Rates income 102.40% 103.00% 105.00% 105.00% 105.00%B Water access charge 102.50% 103.50% 103.00% 103.00% 103.00%C Water Consumption income 105.00% 103.50% 103.00% 103.00% 103.00%D Fees and charges 104.00% 104.00% 104.00% 104.00% 104.00%F Grant 102.00% 102.00% 102.00% 102.00% 102.00%
I Financial Assistance Grant 100.00% 100.00% 103.00% 102.30% 102.30%G State roads contract 103.00% 103.00% 103.00% 103.00% 103.00%H Sewer access charge 103.50% 103.50% 103.00% 103.00% 103.00%
Expenses
M Wages 103.90% 105.00% 103.25% 103.75% 103.75%N Legal and accounting services 103.10% 103.00% 103.00% 103.00% 103.00%O Insurance 100.30% 105.00% 105.00% 105.00% 105.00%P Telecommunications, telephone and internet services 100.10% 103.00% 103.00% 103.00% 103.00%Q Printing, publishing and advertising 108.60% 103.00% 103.00% 103.00% 103.00%R Motor vehicle parts 102.30% 103.00% 103.00% 103.00% 103.00%S Fuel 103.80% 111.10% 105.00% 105.00% 105.00%T Light and power 105.00% 105.00% 105.00% 105.00% 105.00%U State government levies 102.40% 103.00% 103.00% 103.00% 103.00%V Workers compensation premium 103.00% 103.00% 103.00% 103.00% 103.00%W Street lighting 105.00% 105.00% 103.00% 103.00% 103.00%X Fixed costs 100.00% 100.00% 100.00% 100.00% 100.00%Y All other expenses 102.60% 102.60% 102.60% 102.60% 102.60%Z Depreciation 100.00% 100.00% 100.00% 100.00% 100.00%Aa Construction works 103.20% 103.20% 103.20% 103.20% 103.20%
Other rates:Ab Average interest rate for investments 3.00% 3.00% 3.00% 3.00% 4.00%Ac Average interest rate for new loans 5.75% 5.75% 5.75% 5.75% 5.44%Ad Superannuation guarantee rate 9.50% 9.50% 9.50% 10.00% 10.50%Ae Local government cost index 2.47% 2.47% 2.47% 2.47% 2.47%Af Population growth 0.40% 0.40% 0.40% 0.40% 0.40%
Planning Assumptions - indexes Merged Council Budget 1.0 25/06/2015Page 73
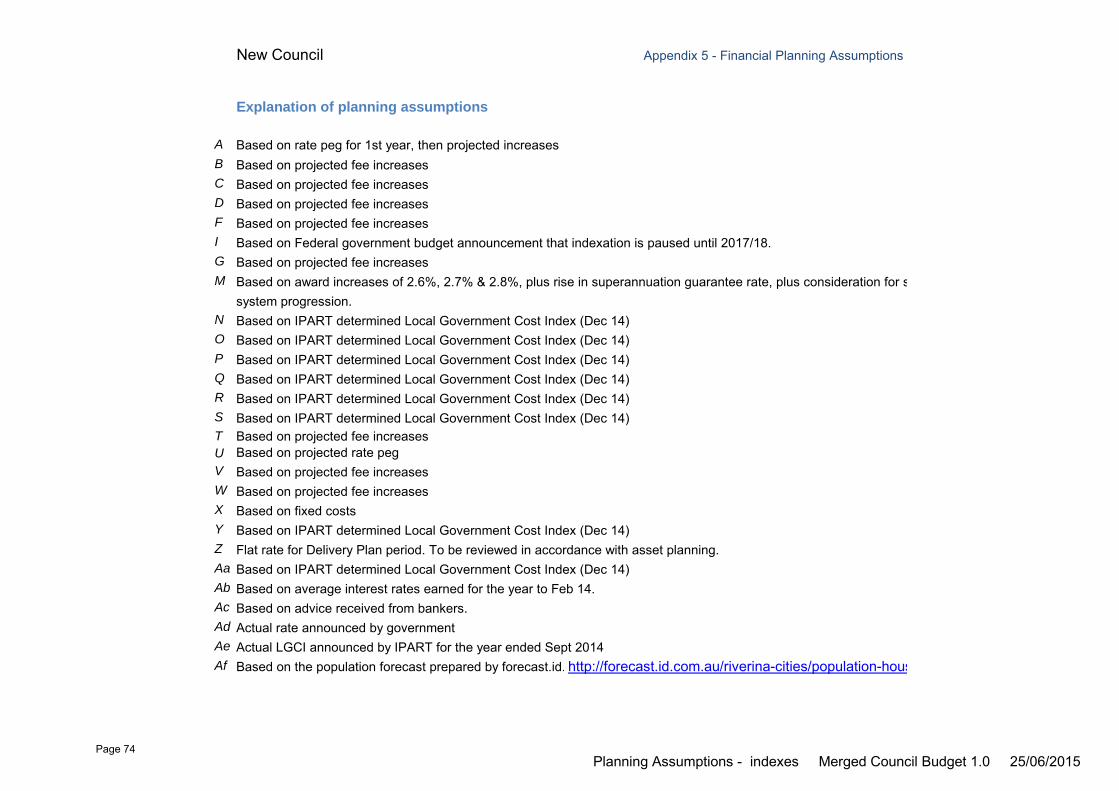
New Council Appendix 5 - Financial Planning Assumptions
3 4 5 6 7Explanation of planning assumptions
A Based on rate peg for 1st year, then projected increasesB Based on projected fee increasesC Based on projected fee increasesD Based on projected fee increasesF Based on projected fee increasesI Based on Federal government budget announcement that indexation is paused until 2017/18.G Based on projected fee increasesM Based on award increases of 2.6%, 2.7% & 2.8%, plus rise in superannuation guarantee rate, plus consideration for salary
system progression.N Based on IPART determined Local Government Cost Index (Dec 14)O Based on IPART determined Local Government Cost Index (Dec 14)P Based on IPART determined Local Government Cost Index (Dec 14)Q Based on IPART determined Local Government Cost Index (Dec 14)R Based on IPART determined Local Government Cost Index (Dec 14)S Based on IPART determined Local Government Cost Index (Dec 14)T Based on projected fee increasesU Based on projected rate pegV Based on projected fee increasesW Based on projected fee increasesX Based on fixed costsY Based on IPART determined Local Government Cost Index (Dec 14)Z Flat rate for Delivery Plan period. To be reviewed in accordance with asset planning.Aa Based on IPART determined Local Government Cost Index (Dec 14)Ab Based on average interest rates earned for the year to Feb 14.Ac Based on advice received from bankers.Ad Actual rate announced by governmentAe Actual LGCI announced by IPART for the year ended Sept 2014Af Based on the population forecast prepared by forecast.id. http://forecast.id.com.au/riverina-cities/population-households-dwellings?WebID=170
Planning Assumptions - indexes Merged Council Budget 1.0 25/06/2015Page 74
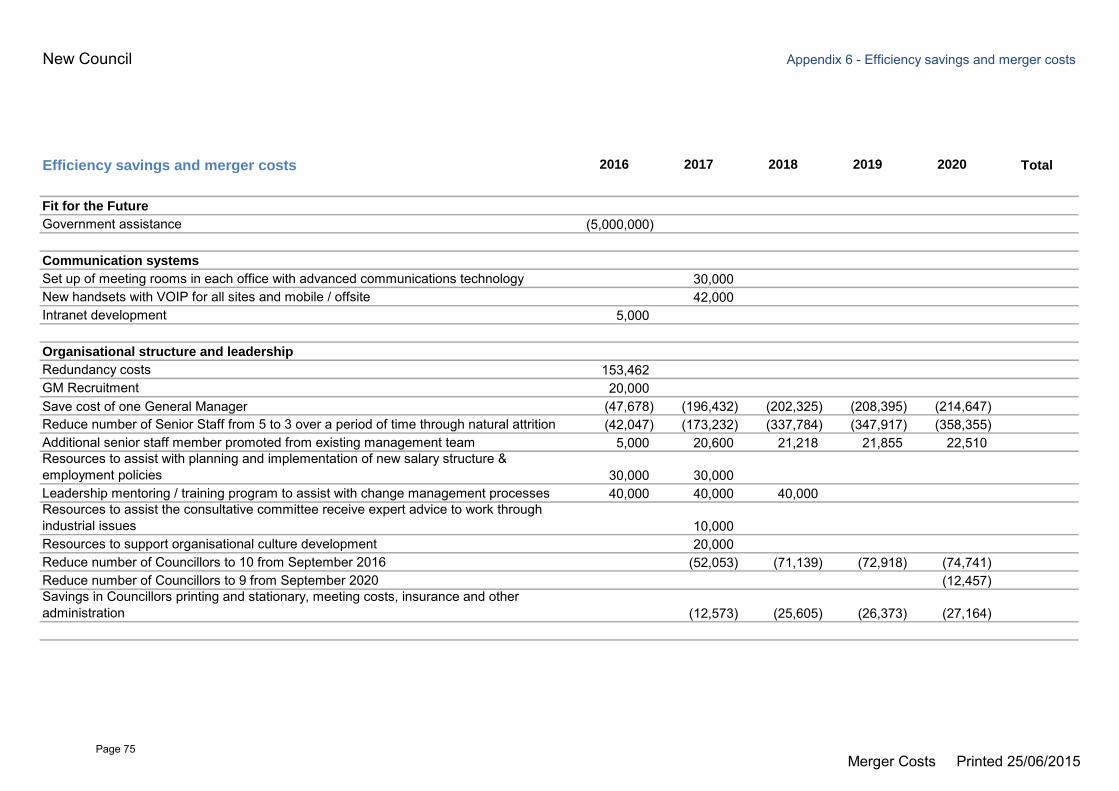
New Council Appendix 6 - Efficiency savings and merger costs
Efficiency savings and merger costs 2016 2017 2018 2019 2020 Total
Fit for the Future
Government assistance (5,000,000)
Communication systems
Set up of meeting rooms in each office with advanced communications technology 30,000 New handsets with VOIP for all sites and mobile / offsite 42,000 Intranet development 5,000
Organisational structure and leadership
Redundancy costs 153,462 GM Recruitment 20,000 Save cost of one General Manager (47,678) (196,432) (202,325) (208,395) (214,647) Reduce number of Senior Staff from 5 to 3 over a period of time through natural attrition (42,047) (173,232) (337,784) (347,917) (358,355) Additional senior staff member promoted from existing management team 5,000 20,600 21,218 21,855 22,510 Resources to assist with planning and implementation of new salary structure & employment policies 30,000 30,000 Leadership mentoring / training program to assist with change management processes 40,000 40,000 40,000 Resources to assist the consultative committee receive expert advice to work through industrial issues 10,000 Resources to support organisational culture development 20,000 Reduce number of Councillors to 10 from September 2016 (52,053) (71,139) (72,918) (74,741) Reduce number of Councillors to 9 from September 2020 (12,457) Savings in Councillors printing and stationary, meeting costs, insurance and other administration (12,573) (25,605) (26,373) (27,164)
Merger Costs Printed 25/06/2015Page 75
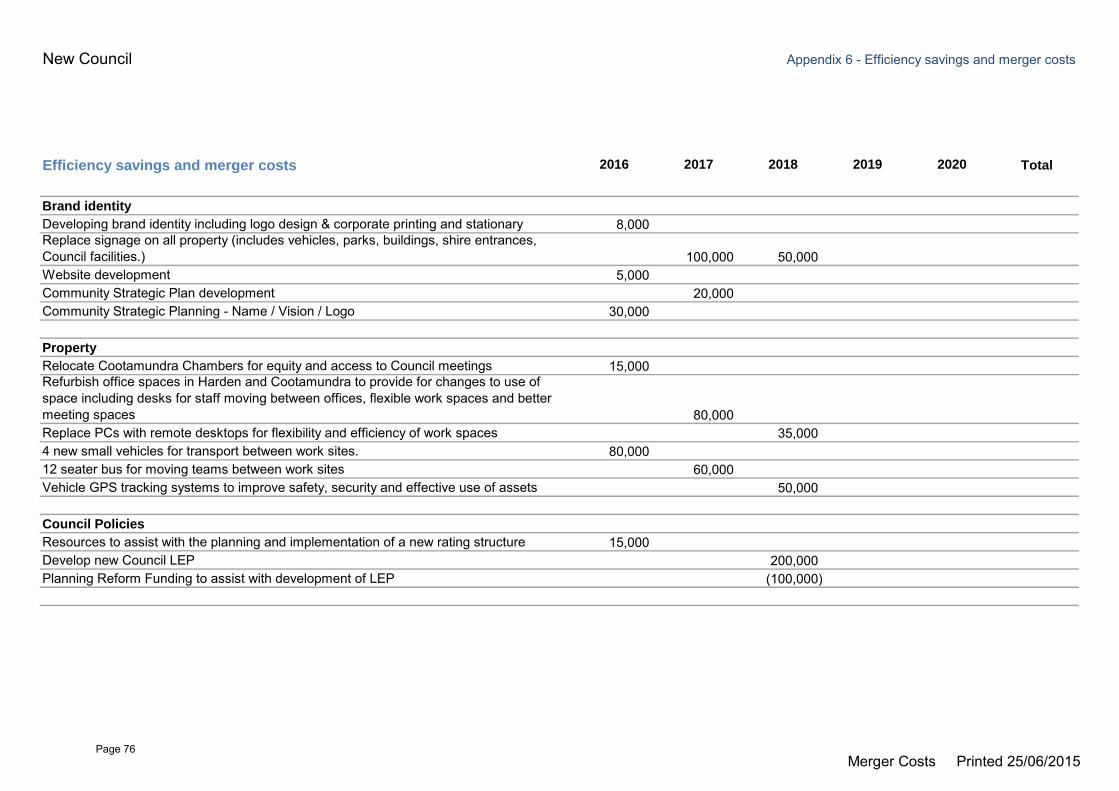
New Council Appendix 6 - Efficiency savings and merger costs
Efficiency savings and merger costs 2016 2017 2018 2019 2020 Total
Brand identity
Developing brand identity including logo design & corporate printing and stationary 8,000 Replace signage on all property (includes vehicles, parks, buildings, shire entrances, Council facilities.) 100,000 50,000 Website development 5,000 Community Strategic Plan development 20,000 Community Strategic Planning - Name / Vision / Logo 30,000
Property
Relocate Cootamundra Chambers for equity and access to Council meetings 15,000 Refurbish office spaces in Harden and Cootamundra to provide for changes to use of space including desks for staff moving between offices, flexible work spaces and better meeting spaces 80,000 Replace PCs with remote desktops for flexibility and efficiency of work spaces 35,000 4 new small vehicles for transport between work sites. 80,000 12 seater bus for moving teams between work sites 60,000 Vehicle GPS tracking systems to improve safety, security and effective use of assets 50,000
Council Policies
Resources to assist with the planning and implementation of a new rating structure 15,000 Develop new Council LEP 200,000 Planning Reform Funding to assist with development of LEP (100,000)
Merger Costs Printed 25/06/2015Page 76
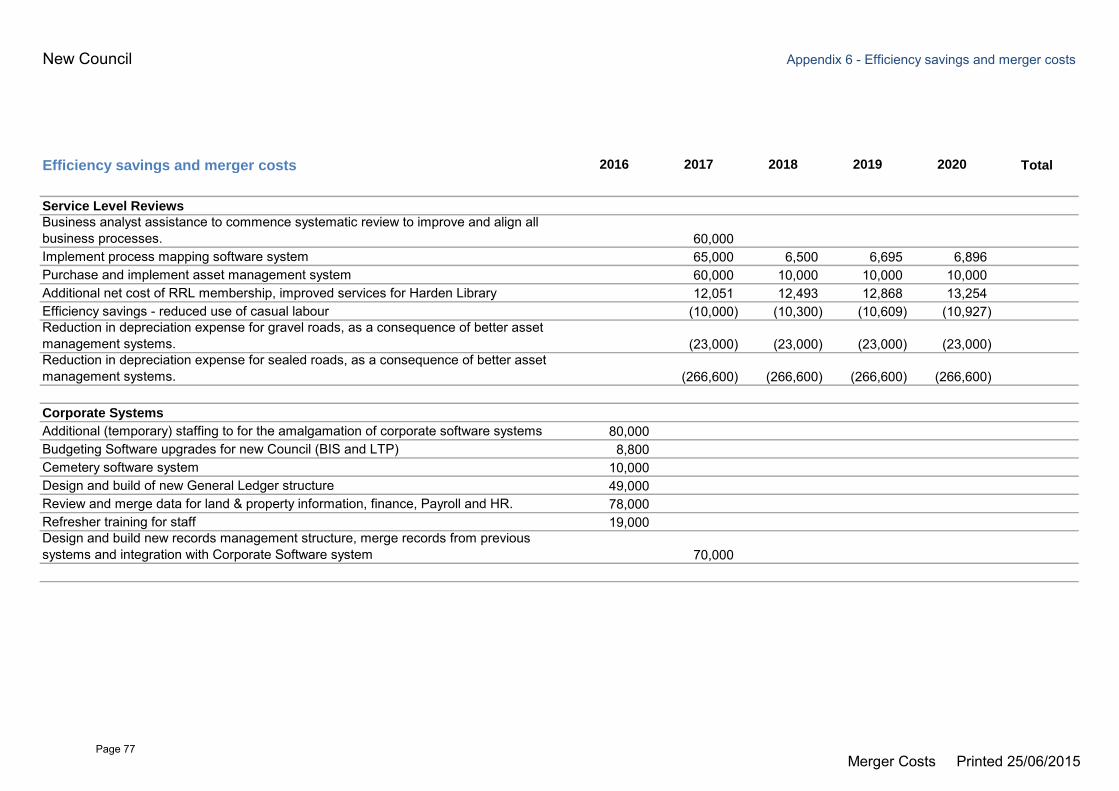
New Council Appendix 6 - Efficiency savings and merger costs
Efficiency savings and merger costs 2016 2017 2018 2019 2020 Total
Service Level Reviews
Business analyst assistance to commence systematic review to improve and align all business processes. 60,000 Implement process mapping software system 65,000 6,500 6,695 6,896 Purchase and implement asset management system 60,000 10,000 10,000 10,000 Additional net cost of RRL membership, improved services for Harden Library 12,051 12,493 12,868 13,254 Efficiency savings - reduced use of casual labour (10,000) (10,300) (10,609) (10,927) Reduction in depreciation expense for gravel roads, as a consequence of better asset management systems. (23,000) (23,000) (23,000) (23,000) Reduction in depreciation expense for sealed roads, as a consequence of better asset management systems. (266,600) (266,600) (266,600) (266,600)
Corporate Systems
Additional (temporary) staffing to for the amalgamation of corporate software systems 80,000 Budgeting Software upgrades for new Council (BIS and LTP) 8,800 Cemetery software system 10,000 Design and build of new General Ledger structure 49,000 Review and merge data for land & property information, finance, Payroll and HR. 78,000 Refresher training for staff 19,000 Design and build new records management structure, merge records from previous systems and integration with Corporate Software system 70,000
Merger Costs Printed 25/06/2015Page 77
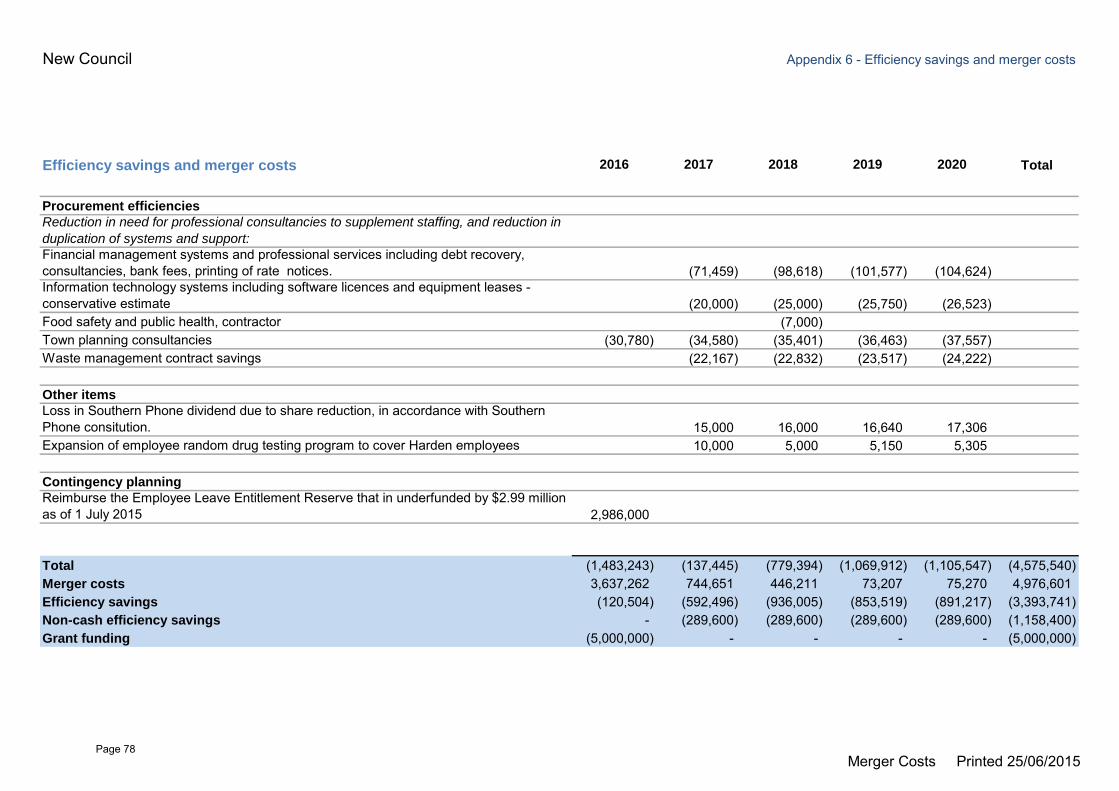
New Council Appendix 6 - Efficiency savings and merger costs
Efficiency savings and merger costs 2016 2017 2018 2019 2020 Total
Procurement efficiencies
Reduction in need for professional consultancies to supplement staffing, and reduction in
duplication of systems and support:
Financial management systems and professional services including debt recovery, consultancies, bank fees, printing of rate notices. (71,459) (98,618) (101,577) (104,624) Information technology systems including software licences and equipment leases - conservative estimate (20,000) (25,000) (25,750) (26,523) Food safety and public health, contractor (7,000) Town planning consultancies (30,780) (34,580) (35,401) (36,463) (37,557) Waste management contract savings (22,167) (22,832) (23,517) (24,222)
Other items
Loss in Southern Phone dividend due to share reduction, in accordance with Southern Phone consitution. 15,000 16,000 16,640 17,306 Expansion of employee random drug testing program to cover Harden employees 10,000 5,000 5,150 5,305
Contingency planning
Reimburse the Employee Leave Entitlement Reserve that in underfunded by $2.99 million as of 1 July 2015 2,986,000
Total (1,483,243) (137,445) (779,394) (1,069,912) (1,105,547) (4,575,540) Merger costs 3,637,262 744,651 446,211 73,207 75,270 4,976,601 Efficiency savings (120,504) (592,496) (936,005) (853,519) (891,217) (3,393,741) Non-cash efficiency savings - (289,600) (289,600) (289,600) (289,600) (1,158,400) Grant funding (5,000,000) - - - - (5,000,000)
Merger Costs Printed 25/06/2015Page 78