Embed Size (px)
Citation preview

Copies available from: Water Resources Research Institute of The University of North Carolina
Price-$8.00 North Carolina State University Box 7912 Raleigh, North Carolina 27695-7912
THE UNIVERSITY OF NORTH CAROLINA is comprised of the sixteen public senior institutions in North Carolina.

WRRI-UNC-89246
MODELING ORGANIC ~ ~ N T ~ ~ ~ ~ A ~ ~ SORPTION IMPACTS ON AQUIFER RESTORATION
Cass T. Miller Assistant Professor
Joseph A. Pedit Research Assistant
Edward G. Staes Research Assistant
Robert H. Gilbertsen Research Assistant
Department of Environmental Sciences and Engineering The University of North Carolina Chapel Hill, North Carolina 27599
The r e s e a r c h upon which t h i s p u b l i c a t i o n i s based was s u p p o r t e d by f u n d s p r o v i d e d by t h e Water R e s o u r c e s Resea rch I n s t i t u t e o f The U n i v e r s i t y of Nor th Carol i na.
WRRI Project No. 70078
J u l y 1989


ACKNOWLEDGMENTS
This work was performed within the Department of Environmental Sciences and En-
gineering of the School of Public Health at the University of North Carolina at Chapel Hill.
We wish to thank Dr. Aziz Amoozegar-Fard, from the Soil Science Department of North
Carolina State University, for his cooperation and assistance on the sampling aspects of
this project. We were fortunate in receiving first-class treatment and excellent coopera-
tion from Marine Corps Base Camp Lejeune-specifically Mr. Robert E. Alexander and
Colonel T. J. Dalzell. The Base contractors deserve thanks for their cooperation as well:
Bert Lea and James Gonzales of Specialized Marine, Inc.; and Richard Catlin of Richard
Catlin & Associates. We are indebted as well to the staif of the Department of Natural
Resources and Community Development-Perry Nelson, Douglas Dixon, Charles Wakild,
and Rick Shiver to name but a few-for their assistance in site location, needs assessment,
and the monitoring well permitting aspects of the project.
ii


ABSTRACT
The groundwater resources of the U.S. have been contarninated by a variety of organic
pollutants that include solvents, petroleum products, and pesticides. A need exists to
understand the movement of contaminants in the subsurface so that: (1) an assessment
of the risk due to contamination may be made, (2) an economical and environmentally
acceptable response to contamination may be designed, and (3) an appropriate ranking of
sites that require clean-up and that are competing for the same fixed pool of resources may
be accomplished. Many common organic contaminants sorb to solid surfaces, like soils or
aquifer materials. Sorption affects the rate of transport for a given contaminant in the
subsurface and may also affect the rate of contaminant degradation. An understanding of
the sorption process is, therefore, an important part of understanding the overall movement
of a contaminant in the subsurface.
This work focuses on the investigation of the sorption process in the subsurface. Specif-
ically four aspects are considered: the measurement of sorption equilibrium for petroleum-
based contaminants to a coastal North Carolina aquifer material; determination of the
rate of sorption for these systems; development of mathematical models that may be
used to simulate the sorption process; and an analysis of the significance of sorption-
desorption rates for predicting field-scale transport of organic contaminants. Laboratory
results demonstrate the relative importance of sorption as a function of compound type
using aquifer material collected from a Camp Lejeune field site. The sorption process is
shown to require several days to approach equilibrium, while the final equilibrium is found
to be nonlinear. The analysis of sorption effects on time required for aquifer remediation
shows that nonlinear desorption has a significant effect on remediation time, while the rate
of desorption is shown to be less important for solute-solid combinations that sorb at a
rate similar to those investigated in this work.
1..
111


DISCLAIMER STATEMENT
Contents o f this publication do not necessarily reflect the views and policies
o f the Water Resources Research Institute nor does mention o f trade names or
comercial products constitute their endorsement or recommendation for use by the
Institute or the State o f North Carolina.
iv


TABLE OF CONTENTS
Page ACKNOWLEDGMENTS . . . . . . . . . . . . . . . . . . . . . . 11
.. ... ABSTRACT . . . . . . . . . . . . . . . . . . . . . . . . . . . . iii
LISTOFFIGURES . . . . . . . . . . . . . . . . . . . . . . . . vii
LISTOFTABLES . . . . . . . . . . . . . . . . . . . . . . . . . ix
SUMMARY AND CONCLUSIONS . . . . . . . . . . . . . . . . X
RECOMMENDATIONS . . . . . . . . . . . . . . . . . . . . . . xii
INTRODUCTION . . . . . . . . . . . . . . . . . . . . . . . . . 1
PREVIOUS RESEARCH . . . . . . . . . . . . . . . . . . . . . . 3
MATERIALSANDMETHODS . . . . . . . . . . . . . . . . . . 7 MATERIALS . . . . . . . . . . . . . . . . . . . . . . . . . . . 7 SOLUTE EXTRACTION AND MEASUREMENT METHODS . . . . . . 8 BOTTLEPOINT EXPERIMENTAL METHODS . . . . . . . . . . . . 11 COLUMN-REACTOR EXPERIMENTAL METHODS . . . . . . . . . 12
MATHEMATICAL MODELING . . . . . . . . . . . . . . . . . . 15 GENERAL . . . . . . . . . . . . . . . . . . . . . . . . . . . . 15 SORPTION EQUILIBRIUM MODELS . . . . . . . . . . . . . . . . 15
Batch-Reactor Model . . . . . . . . . . . . . . . . . . . . . . . 18 Two-Site Model . . . . . . . . . . . . . . . . . . . . . . . . . . 18 Dual-Resistance Model . . . . . . . . . . . . . . . . . . . . . . 21
ADVECTIVE-DISPERSIVEREACTIVE EQUATION MODELING . . . 25 General Advective-Dispersive-Reactive Equation . . . . . . . . . . . 25 One-Dimensional Local-Equilibrium Model . . . . . . . . . . . . . . 26 One-Dimensional Two-Site Model . . . . . . . . . . . . . . . . . . 28 One-Dimensional Dual-Resistance Model . . . . . . . . . . . . . . . 30
SORPTION RATE SUB-MODELS . . . . . . . . . . . . . . . . . . 18
RESULTS . . . . . . . . . . . . . . . . . . . . . . . . . . . . . 33 BOTTLEPOINT EQUILIBRIUM EXPERIMENTAL RESULTS . . . . . 33 BOTTLEPOINT RATE EXPERIMENTAL RESULTS . . . . . . . . . 36 COLUMN-REACTOR EXPERIMENTAL RESULTS . . . . . . . . . . 41
V

PaFe DISCUSSION . . . . . . . . . . . . . . . . . . . . . . . . . . . 47
GENERAL . . . . . . . . . ., e e * (I a e a e a - a 47 CONSTITUTIVE APPROXIMATIONS OF SORPTION EQUILIBRIUM . 48 EFFECT OF HYDRODYNAMICS ON AQUIFER REMEDIATION . . e 50
T I O N . . . . . . . . . . . . . . . . . . . . . . . . . . . . . . . 54 EFFECT OF SORPTION RATE ON AQUIFER REMEDIATION . . . 60
NOTATION . o . . . . . . . . . . . . . . . . . . . . . . . . . . 69
EFFECT OF SORPTION EQUILIBRIUM ON AQUIFER REMEDIA-
REFERENCES . . . . . . . . . . . . . . . . . . . . . . . . . . . 73
APPENDIX I. FINITE ELEMENT DERWATION FOR DUAL- RESISTANCE BATCH MODEL . . . . . . . . . . . . . . . . . - 79
APPENDIX 11. FINITE DIFFERENCE DERIVATION FOR ONE- DIMENSIONAL TWO-SITE MODEL . . . . . . . . . . a . . . * 83
APPENDIX 111. FINITE DIFFERENCE DERIVATION FOR ONE- DIMENSIONALDUAL-RESISTANCEMODEL . . * . . . * . . - 87
vi


LIST OF FIGURES
1 . Grain-size distribution for Camp Lejeune subsurface material . . . . . . . . 9
2 . Column-reactor system . . . . . . . . . . . . . . . . . . . . . . . . . 13
3 . Dual-resistance model . . . . . . . . . . . . . . . . . . . . . . . . . . 23
4 . Sorption equilibrium data and model fits for the solute p-dichlorobenzene and the Camp Lejeune subsurface solid material . . . . . . . . . . . . . . . . 34
5 . Sorption equilibrium data and model fits for the solute o-xylene and the Camp Lejeune subsurface solid material . . . . . . . . . . . . . . . . . . . . .
terial . . . . . . . . . . . . . . . . . . . . . . . . . . . . . . . . . 38
35
6 . Batch reactor sorption-rate data for the Camp Lejeune subsurface solid ma-
7 . Batch-reactor rate model fits to experimental data for the solute p-dichloro- benzene and the Camp Lejeune subsurface solid material . . . . . . . . . . 40
8 . Column tracer data and nonreactive advective-dispersive model fit . . . . . . 42 9 . Column data for organic solutes . . . . . . . . . . . . . . . . . . . . . 44
10 . Column data for o-xylene and model predictions . . . . . . . . . . . . . . 46 11 . Dimensionless concentration profiles for linear. local-equilibrium sorption as
afunctionof Pe . . . . . . . . . . . . . . . . . . . . . . . . . . . . 53
12 . The effect of nf on solute elution time for a step source of duration 2 = 3 . . a 57
13 . The effect of nf on solute elution time for concentrations significantly less than the maximum system concentration . . . . . . . . . . . . . . . . . 58
14 . The effect of nf on solute elution time required to rea.ch low concentration action levels . . . . . . . . . . . . . . . . . . . . . . . . . . . . . . 59
15 . Normalized concentration profiles as a function of D, for Rf = 2.0 and nf = 1.0 . . . . . . . . . . . . . . . . . . . . . . . . . . . . . . . . . . 61
16 . Normalized concentration profiles as a function of D. for Rf = 20.0 and nf==1.0. . . . . . . . . . . . . . . . . . . . . . . . . . . . . . . 62
17 . Normalized concentration profiles as a function of D , for Rf = 2.0 and nf = 0.8 . . . . . . . . . . . . . . . . . . . . . . . . . . . . . . . . . . 63
18 . Normalized concentration profiles as a function of D. for Rf = 20.0 and nf=0 .8 . . . . . . . . . . . . . . . . . . . . . . . . . . . . . . . 64
vii

19. The effect of D, on solute elution time required to reach low concentration action levels for Rf = 2.0. . . . . . . . . . . . . . . . . . . . . . . . 66
action levels for R f = 20.0. . . . . . . . . . . . . . . . . . . . . . . . 20. The effect of on solute elution time required to reach low concentration
67
... Vlll


LIST OF TABLES
1 . Solid Material Characteristics . . . . . . . . . . . . . . . . . . . . . . 8
2 . Solute Properties IO
36
37
45
50
. . . . . . . . . . . . . . . . . . . . . . . . . . . . 3 . Sorption Equilibrium Parameter Summary . . . . . . . . . . . . . . . . . 4 . Sorption Rate Study Conditions and Parameter Summary . . . . . . . . . . 5 . Column Simulation Parameter Summary for o.Xylene . . . . . . . . . . . . 6 . Observed and Predicted Linear Partition Coefficients . . . . . . . . . . . .
ix


SUMMARY AND CONCLUSIONS
This research investigated the role of sorption-desorption phenomena on the aquifer
restoration process. This research included three components: performance of laboratory
experiments to observe the rate and equilibrium of sorption of moderately-hydrophobic
organic solutes to aquifer sands; the derivation of mathematical models to describe labo-
ratory sorption experiments; and the extension of mathematical models to investigate the
significance of sorption-desorption rates on the rate of aquifer rehabilitation.
The laboratory experimental phase of this project investigated the rate and equilib-
rium of sorption of three moderately hydrophobic organic contaminants (toluene, o-xylene,
and 1,bdichlorobenzene) to aquifer material from a Camp Lejeune field site. The aquifer
material was collected from the field site during the construction of a series of monitoring
wells that are presently being used on a subsequent research project, which is sponsored
by the U.S. Environmental Protection Agency. The results of the laboratory investigation
show that for the coastal aquifer material studied: the fraction of organic carbon is very
small (foe = 2.4 x lo-'); relatively little sorption occurs for simple aromatic compounds;
and substantial amounts of sorption to the mineral surfaces of the subsurface material were
not found-based on a reasonable agreement between organic-carbon-based correlations of
predicted partitioning and measured values.
The models developed to simulate the laboratory data collected during this work
include sorption equilibrium and sorption rate models. Sorption models were developed
to simulate conditions in both completely-mixed batch reactors and in column reactors.
Two conceptual models are presented: a two-site model and a dual-resistance model. The
two-site model approximates the sorption process by assuming that a portion of sites
in the aquifer solid phase sorb solute at a rapid rate and a portion of the sites in the
solid phase sorb solute at a rate that may be approximated by a first-order expression.
The dual-resistance model simulates the sorption process as function of two mass-transfer
X


resistances: diffusion through a stagnant boundary layer, and diffusion within a spherical
solid particle.
The resultant mathematical models were solved using the finite-element method or
the finite-difference method to approximate spatial derivatives and the Gear algorithm to
resolve the temporally-dependent set of ordinary differential equations. Validation of the
models shows the approximations to be accurate. The mathematical models, which were
derived, were capable of simulating the laboratory data collected, with generally accurate
results obtained.
Analysis of aquifer restoration shows that long remediation times can be due to sev-
eral factors: subsurface heterogeneity, nonlinear desorption equilibrium, and sorption rate
effects. Heterogeneity is hypothesized to be an important physical factor that contributes
to long cleanup times. Nonlinear and hysteretic desorption equilibrium is shown to have a
profound effect on aquifer remediat ion times-especially when remediation target-level con-
centrations are much smaller than the initial resident concentration. Sorption/desorption
rate effects are shown to be a function of a dimensionless Damkohler number. Dimen-
sionless analysis shows that sorption rate effects are a function of system scale (hydraulic
retention time of the system). For sorption that occurs at a rate similar to the systems
investigated in this work, sorption rate effects are expected to play a secondary role in
contributing to prolonged aquifer remediation times.
xi

RECOMMENDATIONS
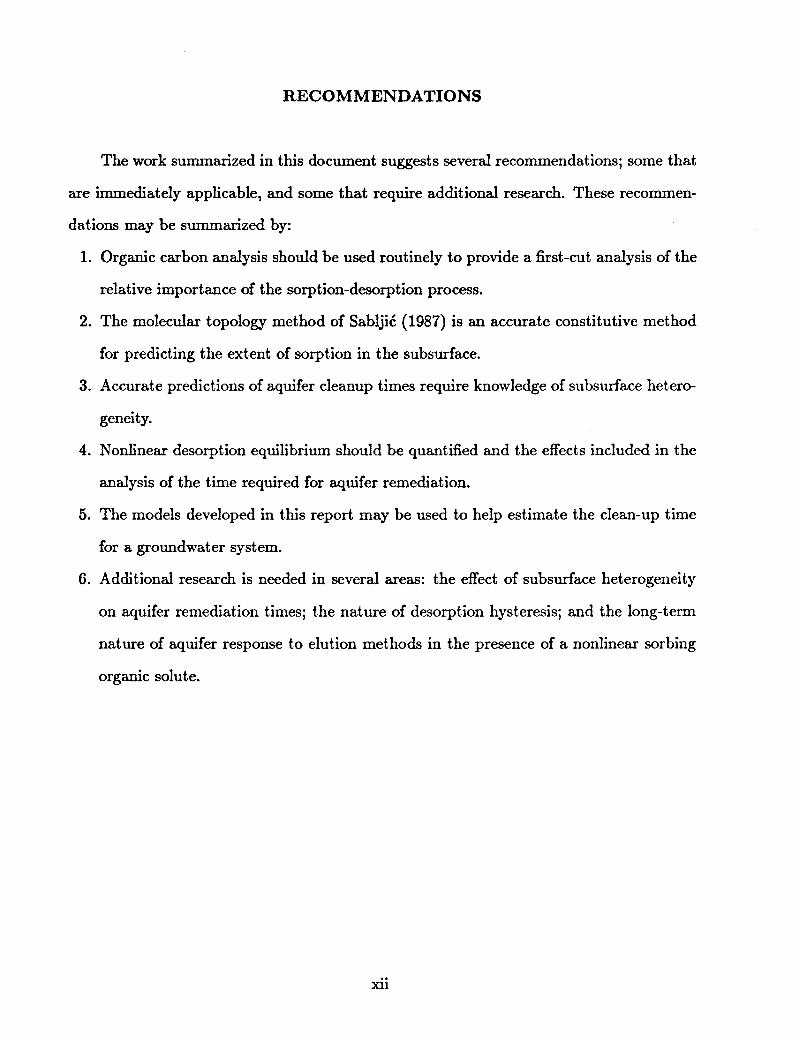
The work summarized in this document suggests several recommendations; some that
are immediately applicable, and some that require additional research. These recommen-
dations may be summarized by:
1. Organic carbon analysis should be used routinely to provide a first-cut analysis of the
relative importance of the sorption-desorption process.
2. The molecular topology method of Sabljit (1987) is an accurate constitutive method
for predicting the extent of sorption in the subsurface.
3. Accurate predictions of aquifer cleanup times require knowledge of subsurface hetero-
genei ty.
4. Nonlinear desorption equilibrium should be quantified and the effects included in the
analysis of the time required for aquifer remediation.
5. The models developed in this report may be used to help estimate the clean-up time
for a groundwater system.
6. Additional research is needed in several areas: the effect of subsurface heterogeneity
on aquifer remediation times; the nature of desorption hysteresis; and the long-term
nature of aquifer response to elution methods in the presence of a nonlinear sorbing
organic solute.
xii


INTRODUCTION
Millions of Americans depend on groundwater as a source of drinking water. Un-
fortunately, the valuable groundwater resources of the U.S. have been contaminated by
pollutants originating from a variety of sources: leaking underground storage tanks and
pipelines, toxic waste disposal areas, industrial spill areas, landfills, and lagoons.
Although a variety of cleanup options is available, the most widely used option is
the purge-well method (Canter and Knox, 1986). The concept of purge wells is simple,
One or more withdrawal wells is placed in the contaminated region of an aquifer. As
pumping progresses over a period of time, the flow of water carries away the contaminated
water. The solid material in the aquifer poses a special problem because some contaminants
“sorb” to the solid phase. This contaminated solid phase can continue to cause problems by
releasing sorbed contaminants long after wells remove the the original contaminated water.
The single biggest cost of groundwater cleanup is often the energy cost of maintaining the
pumping for the years required to cleanse an aquifer (Canter and Knox, 1986).
Given the high cost of cleaning contaminated aquifers in general, and given the high
energy cost of purge-well systems in particular, accurate prediction of contaminant move-
ment is crucial. Only by accurately understanding the movement of a groundwater con-
taminant plume can a groundwater professional provide a satisfactory measure to remedy
the problem. In the case of purge wells in particular, accurate forecasts of cleanup time
are vital to economical design.
One drawback of purge-well rehabilitation is the tailing phenomenon that has been
observed for most cases concerning organic solute transport (e.g. Roberts et al., 1982).
In the field and even in the lab researchers find that breakthrough response extends for
considerably longer than expected. It appears that the contaminant sorbed to the solid
phase takes longer to release than conventional models predict. Clearly, a field scale purge-
well design based on a forecast that didn’t include mechanisms that allow for a prediction of

the degree of tailing, could lead to grossly unrealistic conclusions concerning operation and
maintenance costs. Since cleanup costs axe typically large, this imprecision is important
to examine.
The objectives of this research were to investigate the role of sorption equilibrium,
and rate effects in contributing to contaminant tailing during aquifer rehabilitation. This
work used both experimental and mathematical modeling approaches.
The results of this work are: (1) investigative results concerning sorption of typical,
organic contaminants to a coastal North Carolina subsurface material; (2) the derivation
and development of numerical models suitable for simulating contaminant migration in the
subsurface; and (3) a dimensionless analysis that shows criteria under which sorption rate
and equilibrium considerations yield prolonged cleanup times.
2

PREVIOUS RESEARCH
The sorption-desorption process is one of the most important processes influencing
contaminant movement in subsurface systems. Sorption is the inter-phase mass transfer
of a solute from the groundwater phase to the solid phase; desorption is the inter-phase
mass transfer of a solute from the solid phase to the groundwater phase. Like all inter-
phase, mass-transfer processes, the sorption-desorption process can be defined by the final
phase equilibrium of the solute between the two respective phases and the time required
to approach that final equilibrium.
A large body of literature exists describing experimental observations of sorption equi-
libria between soils and sediments for a wide variety of organic and inorganic compounds
(Bailey and White, 1970; Pierce et al,, 1971; Hamaker and Thompson, 1972; Browman
and Chesters, 1975; Karickhoff et al., 1979; Kenaga and Goring, 1980; Morrill et al., 1982;
Murali and Aylmore, 1983; Voice and Weber, 1983; Karickhoff, 1984; Chiou, 1986). This
work has led to a maturing of the current level of understanding of the sorption-desorption
process, from both a predictive and a mechanistic perspective. It is well understood that
sorption to soils (or sediments) is a function of several variables: ionic nature of the solute;
polarity of the solute; solvency of the solute with respect to the solvent; presence of com-
peting solutes; organic carbon content of the solid; mineral content of the solid; system
pH; temperature; and ionic strength of the solvent.
Much of the recent research has dealt with the sorption and desorption of neutral,
hydrophobic organic compounds to soils and sediments (Karickhoff et al., 1979; Chiou et
al., 1983; Karickhoff, 1984; Gschwend and Wu, 1985; Miller and Weber, 1986; Woodbum et
al., 1986). It is currently understood that the fraction of organic matter of a soil or sediment
is the dominant characteristic that influences the sorption of a given neutral, low polarity,
hydrophobic, organic compound from an aqueous solution. firther, there is significant
evidence to suggest that sorption for such systems is a partitioning like phenomenon-or
3

an absorption of the organic solute into the organic matter of the soil or sediment.
Unfortunately, little work has been done on typical aquifer solids that have very low
(less than 0.1 percent) total organic carbon content. The work that has been done with
low organic carbon materials suggests that mineral surface sorption may be important
for typical aquifer solids systems (Banerjee et al., 1980; Means et d., 1980, and 1982;
Mingelgrin and Gerstl, 1983; Goltz and Roberts, 1986; Mackay et al., 1986; StauEer and
MacIntyre, 1986).
Definition of the sorption-desorption, mass-transfer process also requires a determi-
nation of the rate at which equilibrium is approached. Many investigations have assumed
that the sorption-desorption process may be approximated as an instantaneous, local equi-
librium between the solid and the aqueous phase (Back and Cherry, 1976; Anderson, 1979;
Fkeeze and Cherry, 1979; Faust and Mercer, 1980; Prickett et al., 1981; Roberts et al.,
1982). However, the literature substantiates that rates of sorption-desorption are impor-
tant for many organic solute/solid systems (Kay and Elrick, 1967; Leenheer and Ahlrichs,
1971; Boucher and Lee, 1972; Karickhoff, 1980; Hutzler et al., 1984, and 1986; Karickhoff,
1984; Miller, 1984; Miller and Weber, 1984a, 1984b, 1986, and 1988; Coates and Elzerman,
1986; Crittenden et al., 1986; Weber and Miller, 1988; Wu and Gschwend, 1986). Recent
work has described the relationship among sorption-desorption rates, solute source func-
tion, and system hydrodynamics (Valocchi, 1985, and 1986; Parker and Valocchi, 1986).
It is now understood that the sorption-desorption process may require months to years to
achieve “true equilibrium” in some hydrophobic solute-soil systems (Coates and Elzerman,
1986; Miller and Weber, 1986, and 1988; Weber and Miller, 1988).
Of additional concern, for the description of the sorption-desorption process, is the
influence that multiple solute component (multi-component) systems have on both sys-
tem equilibrium and the rate of sorption-desorption. The behavior of multi-component
systems is important to understand because most cases of subsurface contamination in-
clude more than one solute constituent. However, relatively few studies have investigated
4
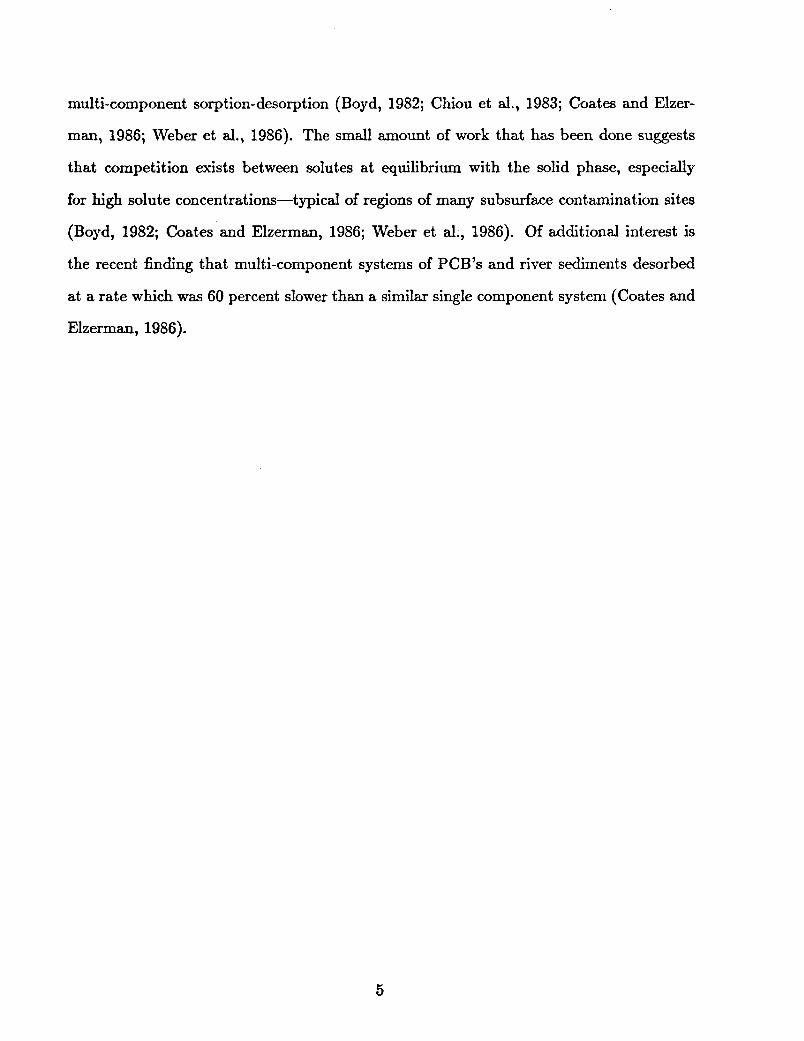
multi-component sorption-desorption (Boyd, 1982; Chiou et al., 1983; Coates and Elzer-
man, 1986; Weber et al., 1986). The small amount of work that has been done suggests
that competition exists between solutes at equilibrium with the solid phase, especially
for high solute concentrations-typical of regions of many subsurface contamination sites
(Boyd, 1982; Coates and Elzerman, 1986; Weber et al., 1986). Of additional interest is
the recent finding that multi-component systems of PCB’s and river sediments desorbed
at a rate which was 60 percent slower than a similar single component system (Coates and
Elzerman, 1986).
5

MATERIALS AND METHODS
MATERIALS
The subsurface material used in this investigation was collected from a research site
located at Tarawa Terrace on Marine Corps Base Camp Lejeune. The hydrogeology and
details of this site have been discussed in a previous publication (DiGiano et al.? 1988)
and will not be repeated here. Solid materials used in this investigation were collected
from an uncontaminated portion of the aquifer in a relatively uniform horizon, between
25 to 35 feet below ground surface. The material collected was air dried and well-mixed
to form a single composite sample. The composite material was analyzed using standard
methods for the physical characteristics of grain size by sieving, and density by a mass
per volume displacement method. Standard methods were used to measure the chemical
characteristics of pH (Mitchell, 1976)) organic carbon fraction (American Public Health
Association, 1986)) and cation exchange capacity (Black, 1965). The physical and chemical
characteristics determined for the Camp Lejeune sample are summarized in Table 1, while
a grain-size distribution diagram is shown by Figure 1.
The Camp Lejeune subsurface sample investigated was a highly-uniform, medium-fine
sand, which has a typicd particle density. firther, the Camp Lejeune sample is acidic
in nature, has a low cation exchange capacity, and an extremely low total organic carbon
content. It is expected, based upon the above referenced analysis, that the Camp Leje-
une sample investigated is not atypical of near-surface, coastal North Carolina subsurface
materials.
The solutes investigated in this study were p-dichlorobenzene, toluene, and o-xylene.
The physical and chemical characteristics of these solutes are summarized in Table 2.
Toluene and o-xylene were chosen because they are common aromatic constituents in
gasoline, therefore common groundwater contaminants at many locations in North Carolina
7

Table 1. Solid Material Characteristics
Vdue
Median Grain Size 0.251 mm
Uniformity Coefficient (&/d10) 1.57
Particle Density ( p ) 2.64 g/cc
PH 5.3
Organic Carbon Fkaction (foe) 0.024 % Standard Deviation (a,) 0.0024%
Cation Exchange Capacity 5.52 meq/100 g Standard Deviation (a,) 0.98 meq/100 g
and across the United States. These solutes are only moderately hydrophobic and are
considered volatile. For this reason, pdichlorobenzene was also used in this investigation
because it is similar to the other compounds in structure and properties, yet is somewhat
more hydrophobic and less volatile. These features were expected to make experimental
determination of sorption properties somewhat easier, while maintaining relevance to the
most common problem of groundwater contamination in the State.
Experimental solutions were comprised of distilled-deionized water that included a
0.005 M borate buffer to regulate pH, and 0.01 N calcium chloride to aid in phase separa-
tion, by destabilizing colloidal particles. Potential biodegradation was avoided by including
0.015 M sodium azide in all experimental solutions-a proven method (Fletcher and Kauf-
man, 1980; Kale and Raghu, 1982).
SOLUTE EXTRACTION AND MEASUREMENT METHODS
Two types of solute measurements were made during this project: inorganic chlo-
ride concentrations; and organic solute concentrations of p-dichlorobenzene, toluene, and
8

I
4=
I 0 0
I I
I I
I I 1
0 co
I
I I I I I I
I I I 1 0 c(3
0 d-
i z 0s -0
01 I
0 0 cu
0-
lH313M A€i tj3NIJ lN3383d

Table 2. Solute Properties
Parameter p- Dichlorobenzene Toluene *Xylene
Molecular Weight (g/mole) 147.01 92.10 106.17
Melting Point ("C) 53.0 -95.1 -25.0
Boiling Point ("C) 173.4 110.8 144.4
Specific Gravity (at 20°C) 1.458 0.867 0.880
Aqueous Solubility (mg/l) 4.9 x 10 ' at 22. "C 4.70 x 10 at 16. "C 1.75 x 10 at 25. "C 7.9 x 10 ' at 25. "C 5.15 x 10 at 20. "C
Log KO, (median)a 3.38 2.71 2.93
Vapor Pressure (mm Hg) 6.0 x lo-' at 20. "C 1.0 x 10 ' at 6.4"C 5.0 x 10 at 20. "C 1.8 x 10 at 30. "C 2.2 x 10 at 20. "C 6.6 x 10 at 25. "C
4.0 x 10 at 31.8"C 9.0 x 10 ' at 30. "CC
1.4 x lo-' at 20. "Cb 2.81 x lo-' at 20. "C 2.2 x 10'' at 25. "C Henry's Constant ( H , ) General R,ef erence: Verschueren (1983)
Hansch and Leo (1979) Lyman et al. (1982) Boublik et al. (1975)

o-xylene. Chlorides were measured using a standard silver nitrate titration method (Amer-
ican Public Health Association, 1986).
Organic solute analysis was performed using liquid-liquid extraction, followed by cap-
illary gas chromatography. Samples were extracted by combining an aqueous sample with
the organic solvent hexane in 25-ml Pierce vials with minimal headspace. The vial and its
contents were thoroughly mixed and allowed a minimum of several hours to equilibrate.
The solute 1,2,4- trichlorobenzene was included in the hexane and carried along as an
internal standard for analysis of pdichlorobenzene, while octane was used as an internal
standard for analysis with toluene and o-xylene.
Solute mass was analyzed using a Varian 3700 high-resolution GC with a flame ioniza-
tion detector (FID). Chromatographic separation was achieved on a 30-m, Supelco SPB-1
fused-silica capillary column with splitless injection and temperature programming: the
initial temperature was held at 35°C for 8 minutes, and then programmed to 175°C at a
rate of 6°C per minute. The injector temperature was set at 285°C and the FID was set
at 300°C; and the helium carrier gas flow rate was 1.7 ml per min.
A standard curve of the target compounds was determined to relate integrated peak
area to mass of solute for each set of aqueous samples. This was accomplished by regress-
ing analyte area normalized by the internal standard area (analyte response factor) as a
function of analyte concentration. This analysis method yielded a linear relationship with
high correlation coefficients (usually exceeding 0.99).
BOTTLEPOINT EXPERIMENTAL METHODS
Bottle-point reactors (BPR’s) were used to measure the rate of sorption-desorption
by placing a known and equal amount of solid in borosilicate centrifuge bottles, adding
a constant volume of solution of a known solute concentration to each bottle-yielding
nearly headspace-free conditions, and tumbling all bottles to maintain well-mixed condi-
tions. The BPR’s were removed from the tumbler and centrifuged for separation of the
11

solid and aqueous phases at different times during the course of the study. At each of
these times, the solution-phase solute concentration was measured and the solid-phase
solute concentration was calculated by difference from the initial mass of solute present.
Blanks-BPR’s with no solid phasewere canied along to determine sample-handling,
volatilization, and extraction errors associated with the procedure.
Sorption equilibrium experiments were performed using a bot tle-point-reactor method
similar to the rate-study method. The chief differences were dictated by the objective:
to determine the equilibrium solid-phase concentration as a function of the fluid-phase
concentration-for a wide-range of fluid-phase concentrations. To meet this objective, the
initial fluid-phase concentration was varied over a wide range, and three weeks were allowed
for equilibration between the phases. After tumbling the bottle to maintain well-mixed
conditions for the equilibration period: phase separation was accomplished by centrifuga-
tion; the fluid-phase concentration was measured; and the solid-phase concentration was
calculated by attributing the reduction in solute mass in the solution phase to sorption.
Blanks were carried along to determine sample handling, volatilization, and extraction
errors associated with the procedure.
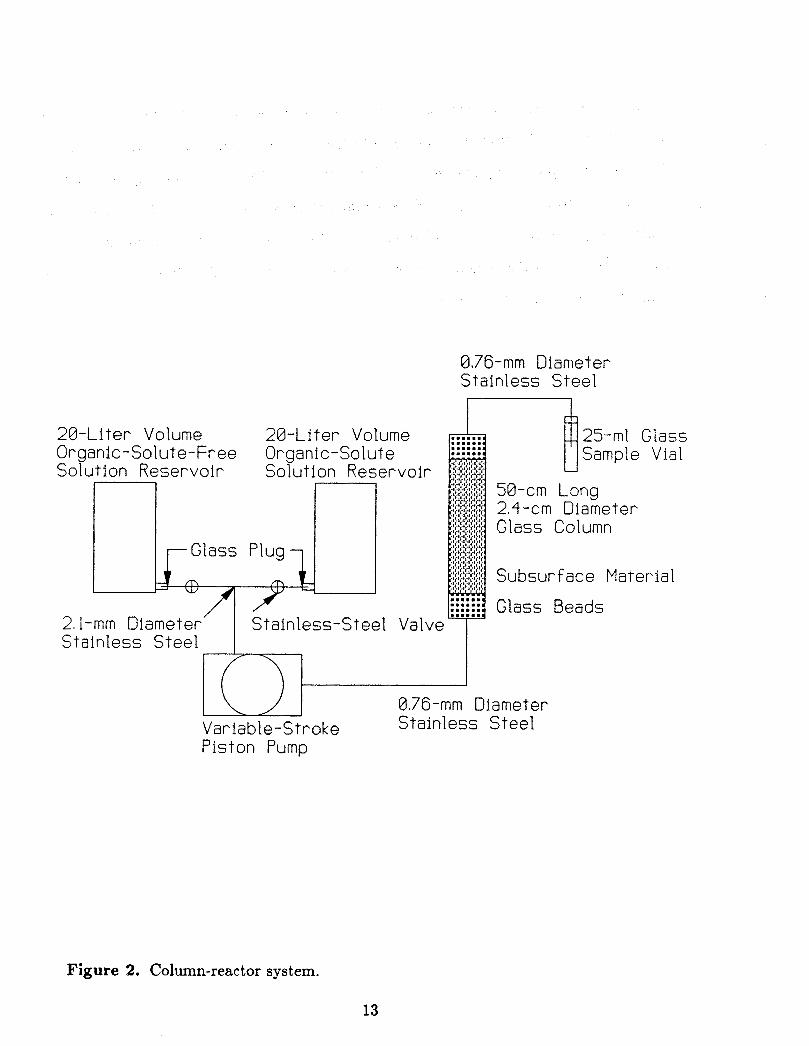
COLUMN-REACTOR EXPERIMENTAL METHODS
Figure 2 shows a schematic illustration of the column-reactor system used to inves-
tigate sorption characteristics in the presence of the hydrodynamic transport processes
of advection and dispersion. Borosilicate glass and stainless steel were used for all parts
that were in contact with the solute-carrying solution to minimize extraneous sorption.
The column-reactor experimental apparatus used was a 2.4-cm diameter glass column. A
stainless-steel piston pump provided a constant flow to the column, with adjustments in
flow rate accomplished by varying the length of the piston stoke.
The column was packed by enclosing subsurface material between 1.5-cm end layers of
glass beads to prevent particle migration from the column. Concentrations were monitored
12
0.76-mm Diameter Stainless Steel
J
20-Liter Volume 28-Liter Volume Organic-Solute-Free Organic-Solute Solution Reservoir Solution Reservoir r-l n
2,l-mm Diameter’ 1 Stainless-Steel Valve Stainless Steel
25-ml Glass Sample Vial
50-cm Long 2,4-cm Diameter Glass Column
Subsurface Ma-terlal
Glass Beads
8,76-mm Diameter Stainless Steel Var iable-S tr oke
Piston Pump
Figure 2. Column-reactor system.
13

by discrete sampling of the column influent and effluent streams. Chloride was used as a
nonreactive tracer to determine the hydrodynamic characteristics of the packed C Q ~ U
This was accomplished by first equilibrating a column with a flow of an organic-free feed
solution and then introducing a solution that contained about 3.2 mg/l of toluene, 3.4
mg/l of o-xylene, and 0.01 N cdcium chloride. Differences between the movement of the
chloride solute and the organic solutes were attributed to organic solute sorption to the
subsurface material in the column.
14

MATHEMATICAL MODELING
GENERAL
The purpose of this research was to investigate the effect of organic solute sorption
and desorption on aquifer restoration using mat hematical modeling. While the results
of the modeling analysis are the chief practical benefit of this work, it is necessary for
completeness to describe the modeling approaches considered, and the solution procedures
used. This section presents a narrative explanation of the modeling approaches considered,
and a brief development of the mathematical equations used. The details of the numerical
approximation methods used are included as appendix sections to this report, because they
were considered of less general interest than the conceptual basis and governing equation
framework presented in this section. Rigorous validations of all mathematical models using
both analytical solutions and mass-balance approaches have been completed. These results
are not presented in this document, but citations to the refereed literature, at appropriate
locations in the model derivations, are offered as evidence of model validity . This section briefly outlines three classes of models considered: equilibrium sorption
models, sorption-rate models, and advective-dispersive-reactive (ADR) models. These
models are listed in order of increasing complexity, with each model class including a
member of the previous model class or classes. For example, complete specification of a
sorption-rate model requires a specification of an equilibrium sorption model. Similarly, a
complete specification of an ADR model requires specification of an equilibrium sorption
model and a sorption-rate model.
SORPTION EQUILIBRIUM MODELS
When an organic solute exists in a natural system comprised of multiple phases, the
organic solute is distributed among the phases present. Given sufficient time, the solute
distribution among the phases present will approach an equilibrium condition-if no solute
15

is added to or removed from the system, and if solute reactions do not occur.
The system under consideration in this report consists of two phases: an aqueous
phase, and a subsurface solid phase. The introduction of an organic solute in the aque-
ous phase of the subsurface environment leads to mass transfer of solute from the fluid
phase to the solid phase. The equilibrium distribution of solute between the solid phase
and the aqueous phase may be studied using laboratory methods, like the bottle-point
reactor methods described previously. Several models exist that describe the solid-phase
solute concentration as a function of the aqueous-phase solute concentration at equilib-
rium. These models are often called sorption equilibrium isotherm models or sorption
equilibrium models for short. Three common sorption equilibrium models are considered
here: the linear model, the Freundlich model, and the Langmuir model.
The most common sorption equilibrium model is the linear model
where: qe is the equilibrium, mass-average solid-phase concentration-defined as the mass
of solute per mass of solid phase; Kp is a linear sorption equilibrium coefficient; and C, is
the volume-average, fluid-phase solute concentration at equilibrium.
The linear equilibrium model is appealing because of the simplicity of sorption mod-
eling based upon it. This will be shown in later subsections of this report. A further
appeal of the linear equilibrium model is the considerable body of literature reporting
linear sorption equilibrium coefficients, and the existence of several constitutive methods
(or correlation methods) for predicting linear sorption equilibrium coefficients based upon
solute and solid properties (SabljiC, 1987). Fkequent solute properties correlated to equilib-
rium sorption are the octano1:water partition coefficient (ITow), the aqueous solubility (S),
and the molecular connectivity index (x). The most frequently correlated solid material
properties relating to organic solute sorption are the fraction of organic carbon (foe), or
16

the fraction of organic matter content (fom) of the natural solid material. The actual form
of these constitutive expressions is not central to the discussion of this section-noting
the existence of such expressions is important. Constitutive methods for predicting linear
sorption equilibrium coefficients are discussed in greater detail in the Discussion section of
this report.
The equilibrium sorption relationship between an organic solute in the fluid phase and
a natural solid phase has often been reported as being nonlinear (Hamaker and Thompson,
1972; Weber and Miller, 1989). For such instances, alternate equilibrium models have been
used. The Ekeundlich sorption equilibrium model is one of the most frequently used of these
models
where KF is the sorption capacity constant and n F is the sorption intensity constant.
Typicd values of n F for subsurface solid materials and organic solutes range from 0.7 to
1.0-a slightly concave relationship. The 'Freundlich model is empirically founded, but it
is widely used in practice.
Another common nonlinear sorption equilibrium model is the Langmuir sorption equi-
librium model. The Langmuir model can be derived from thermodynamic or chemical
kinetic principles and is of the form
& " a c e
= 1 + bCe
where Q" is a constant representing the maximum solid-phase solute concentration ap-
proached while b is a sorption energy-related constant.
17

SORPTION RATE SUB-MODELS
Batch-Reactor Model
In addition to equilibrium considerations, the distribution of an organic solute between
the aqueous phase and the solid phase depends upon the rate at which mass transfer occurs
between the phases (i.e. the nature of the rate of approach to equilibrium). Differences in
the rate of sorption or desorption can lead to profound differences in the spatia3 distribution
of a contaminant in the subsurface at a given time, and correspondingly to a system's
response to clean-up efforts.
Sorption rate sub-models can be presented in a batch-reactor (or closed-system) frame-
work with the mass-balance expression
where: t is time; M is the mass of the solid phase; V is the volume of the solution;
the subscript r zn denotes chemical or biological reactions; and r(C) is a solute source
function-an addition of a mass of solute per unit volume of solution in the closed system
per unit time. It should be noted that the sign convention used in Equation 4 for reactions
assumes a reaction that increases the mass of solute in the system.
For a closed system, sorption rate sub-models enter equation 4 by specifying a rate of
change of the solid-phase solute concentration as a function of time, or dqldt.
Two-Site Model
The two-site model is based upon the concept that the solid surface contains two
types of sorption sites, fast sites and slow sites. Sorption occurs quickly on the fast sites,
and the solute concentration in the fluid-phase and on the fast sites is assumed to be in
equilibrium. For the slow sites, sorption occurs at a first-order rate, or as a function of the
difference between the solid-phase solute concentration at equilibrium and the solid-phase
18

solute concentration at a given time on the slow sites. After a sufkiently long period of
time (the actual time is system dependent), the fluid-phase solute concentration and the
overall solid-phase solute concentration approach an equilibrium.
The first step in specifying a complete two-site model is the selection of an equilibrium
expression for the fast and slow sites. For the case where both fast- and slow-site sorption
equilibrium may be described using a Fkeundlich sorption-equilibrium model, the following
expressions describe the overall equilibrium between the fluid and solid phases
where: q f e is the mass-average solid-phase solute concentration of the fast sites at equi-
librium; qse is the mass-average solid-phase solute concentration of the slow sites at equi-
librium; K f is the F'reundlich sorption-equilibrium model coefficient for the fast sites; np
is the Fkeundlich sorption-equilibrium model exponent for the fast sites; K , is the Fke-
undlich sorption-equilibrium model coefficient for the slow sites; and n, is the F'reundlich
sorption-equilibrium model exponent for the slow sites.
The two-site rate model may be expressed as
where q f is the solid-phase solute concentration of the fast sites, and qs is the solid-phase
solute concentration of the slow sites. Since the fast sites are assumed to be in equilibrium
with the fluid-phase solute concentration, the dependent variable qf may be eliminated by
using the chain rule
where
19

follows from the equilibrium description of the fast sites. Including the first-order model
to describe sorption to the slow sites gives
dC dt dt - - dq - nfKfC"f-' - + CY (KsCn# - qs) (9)
Substituting Equation 9 into 4 gives the fluid-phase equation for the two-site model
where the retardation factor for the fast sites in a batch reactor is given by
Equation 10 has two dependent variables, since the solute concentration on the slow
sites changes as a function of time. Therefore, an equation for the solute concentration on
the slow sites is needed and is of the form
where r(q,) is a solute source function for the slow solid-phase sites.
Solution of the batch reactor sorption problem requires simultaneous solution of equa-
tions 10 and 12. These equations are still in a general form because the reaction terms and
source functions have not been specified. For the special case where solute degradation
occurs by a first-order mechanism from both the fluid and solid phase and the only source
20

of solute is through an initial addition (or in mathematical vernacular an initial condition),
the two-site model for a batch reactor may be written as
for the initial conditions
Ma =I VCo + MKfC;' (15)
q,(t = 0 ) = 0
where: kad is a first-order decay rate for solute on the solid phase; k i d is a first-order decay
rate for solute in the fluid phase; Ma is the mass of the solute initially added to the system;
and Co is the fluid-phase concentration at t = 0.
A FORTRAN computer code was written to solve the two-site sorption model in a
closed system, which is described by equations 13 to 15. The two-site model was solved
by using the Newton-Fbphson method to solve for the initial condition, while the coupled
ordinary differential equations were solved using Gear's method (1971). The derived model
was validated by comparison to published results of a less general two-site model (Weber
and Miller, 1988).
Dual-Resistance Model
Diffusion models have been applied to describe transport phenomena for a variety of
boundary conditions and conceptual process variations in rock systems (Neretnieks, 1980;
Rasmuson and Neretnieks, 1980; Rasmuson, 1981; Rasmuson et al., 1982) and in porous
media systems (Van Genuchten and Wierenga, 1976, 1977; Van Genuchten et al., 1977;
21

Valocchi, 1985; Crittenden et al., 1986; Goltz and Roberts, 1986; Hutzler et al., 1986).
These diffusion modeling approaches have relied upon physical interpretations of the pro-
cess; chiefly the concept that one portion of media void space fluid is mobile, and another
portion is immobile. This approach, while able to describe the tailing frequently observed
in solute concentration breakthrough curves (BTCs), still relies upon the assumption that
the solid phase and the solution phase are always in solute sorption equilibrium. Data col-
lected in batch reactors have shown that sorption can occur slowly, frequently extending
over periods of several days (Miller and Weber, 1986) or even much longer (Karickhoff,
1980). The slow rate of the sorption process has been attributed to either an intraparticle
diffusion process (Karickhoff, 1980) or a dual-resistance process involving boundary layer
and intraparticle diffusion (Miller, 1984; Miller and Weber, 1984b, 1986, 1988; Weber and
Miller, 1988).
The dual-resistance model describes sorption as a series of mass-transfer steps that
are illustrated by Figure 3: molecular diffusion through a hydrodynamic boundary layer
surrounding a solid particle; and diffusion within the particle itself. It is unlikely that the
diffusion process occurs uniformly through an entire subsurface solid particle. Instead it
probably occurs through agglomerations of organic material associated with the particle.
The difference between the mechanistic concept and physical reality does not limit the
practical application of the dual-resistance model because the mass average of the solid-
phase solute concentration is the macroscopic property that affects the observed fluid-phase
concent ration.
For spherical solid particles, the dual-resistance model ca,n be expressed as a general-
ized form of Fick’s second law of diffusion in spherical coordinates
with the boundary and initial conditions
22

w 4 Boundary Layer Fllm -Solid-Phase Particle
Figure 3. Dual-resistance model.
23

qr(O 5 r 5 R,t = 0) = 0
where qr is the solid-phase solute concentration as a function of radial position r; D, is
an intraparticle diffusion coefficient; !if is a film mass-transfer coefficient; C, is the fluid-
phase solute concentration at equilibrium with the solid-phase solute concentrations at the
exterior of the particle; p is the density of the solid; and R is the solid particle radius. The
Fkeundlich model is used to specify the assumed equilibrium that relates q,(r = R) to C,
at the exterior of the solid particle.
the mass of solute that moves across
te that enters the exterior of the
lation of mass occurs within the
interior of solid particle, which
etry. Equation 19 is simply the
concentration is 0 initially for all
locations in the solid phase.
The instantaneous rate of sorption at any time may be derived from mass-balmce
considerations of flux through the fluid film, giving
= -(C 3kf - C,) (s) 5rF Rp
Substituting Equation 20 into Equation 4 gives
24

For the case of a solute that enters the system as an initial condition only and degrades
according to a first-order process from both the fluid and solid phases, the fluid-phase
equation becomes
and the solid-phase equation is
while the boundary and initial condition expressed by Equations 17 to 19 remain the same,
The solution of the dual-resistance model is somewhat more difficult than the two-site
model, yet straightforward. The solution is nonlinear, because the Fkeundlich sorption-
equilibrium model is used to couple the ordinary differential equation for the fluid-phase
solute concentration (Equation 22) to the partial differential equation for solid-phase solute
concentration (Equation 23). A sixth-order Galerkin finite element method was used to
reduce the spatial derivatives of the solid-phase equation to a set of algebraic equations,
while the system of ordinary differential equations was then solved using Gear's algorithm
(1971). The details of this method are summarized in Appendix I. Validation of the solution
accuracy has been accomplished by comparison to an available analytical solution (Pedit
and Miller, 1988).
ADVECTIVEDISPERSIVEREACTIVE EQUATION MODELING
General Advective-Dispersive-Reactive Equation
The physics that govern the movement of contaminants in the subsurface are well-
known (e.g. Bear, 1979; de Marsily, 1986) and will not be derived in detail in this report. In
general, solute transport occurs: with the bulk movement of groundwater, or by advection;
25

and by deviations from the bulk movement, or by mechanical dispersion. Chemical and
biological processes also occur in the subsurface and need to be considered in any general
statement of reactive transport in the subsurface. A general form of the ADR equation is
given as
dC -=div(I)hgradC)-v'.gradC+ at rzn
where: Dh is a second-rank, symmetrical hydrodynamic dispersion tensor; and v" is the
mean macroscopic pore velocity vector of the aqueous phase.
For flow in a one-dimensional system with a constant velocity and dispersion, Equation
24 may be simplified to
where: D, is the hydrodynamic dispersion coefficient in the x direction; and v, is the
average macroscopic fluid-phase velocity in the z direction.
The one-dimensional Cartesian-coordinate form of the ADR equation is appropriate
when the flow of groundwater is linear in the 2 direction, and when a concentration p a -
dient exists in only the z direction. Such conditions prevail under controlled laboratory
conditions, like flow through a column reactor. Such conditions may also be approximated
under field conditions where the source of the contaminant is spatially extensive, which ide-
ally means a plane source of contaminant that fully penetrates an aquifer and is infinitely
long in the horizontal direction transverse to the direction of mean flow, y.
One-Dimensional Local-Equilibrium Model
A common method of including sorption in the advection-dispersion-reaction (ADR)
equation is the local-equilibrium model. This approach can be developed by first consider-
ing the one-dimensional form of the ADR equation for a sorbing solute, which undergoes
26

first-order degradation from the fluid and solid phases and has no internal source of solute
within the domain
where the subscript srp indicates solute lost from the fluid phase as a result of sorption to
the solid phase.
If the fluid and solid phases are assumed to always be in equilibrium then the chain
rule can be used to relate the fluid- and solid-phase solute concentrations by
dq dq ac at dCat -=e-
Combining equations 26 and 27, and including a solid-phase decay term gives
where the retardation factor is defined as
P b Rf = 1 + -- n dC
For the case where the sorption equilibrium between the fluid and solid phases is
described by the Freundlich model, Equations 28 and 29 may be written as
27

For the case where the sorption equilibrium between the fluid and solid phases is
described by the linear isotherm, EQuations 28 and 29 may be written as
t 33) f b n
Rf = 1 + -KpC
For the linear, local-equilibrium assumptions Rf is a constant if spatial variability is
not considered. This means that any solution of the ADR equation can be extended to
account for linear, local-equilibrium sorption with appropriate adjustment by the constant
R f . For the case where the isotherm model is nonlinear, Rf becomes a function of C and the ADR equation is nonlinear. The numerical solution method used to solve the
local-equilibrium model wiU be discussed in the following subsection and in Appendix 11.
It will be shown that the local-equilibrium model is a subset of the two-site model.
One-Dimensional, Two-Site Model
Descriptions of two-site ADR models in the literature differ in conceptualization of as-
sociated reactions and their reduction to equation form; both classical pseudo-homogeneous-
phase chemical kinetic and heterogeneous mass-transfer derivations are possible (Selim
et ai., 1976; Cameron and Klute, 1977; Karickhoff, 1980; Miller, 1984; Miller and We-
ber, 1986). The two-site ADR model may be derived by simply substituting the two-site
sorption-rate sub-model previously derived into the general one-dimensional form of the
ADR equation. This process extends the local-equilibrium model by adding a second
sorption component, which occurs at a first-order rate.
Consider the one-dimensional ADR equation for a sorbing solute, which undergoes
first-order degradation from the fiuid and solid phase and has no internal source of solute
within the domain
28

For the two-site model the sorption term may be expanded into fast and slow components
giving
t 35)
Using the Fkeundlich model for fast-sites gives
t 37)
Substituting the first-order rate portion of the two-site model into Quation 36 for
Equation 38 has two dependent variables C and q8. Therefore, it is necessary to form
a second equation, which describes the solute concentration on the slow sites of the solid
phase. This requirement is met by specifying an ordinary differential equation for each
spatial location in the domain of the form
t 39)
It is worth noting that Equation 39 is identical to the batch-reactor form of the slow-site
solid-phase equation.
29

A FORTRAN program was derived to solve Equations 38 and 39 subject to the bound-
ary conditions
and the initial conditions
C(t = 0,z) = 0
Q d ( t = 0’9) = 0 (43)
where X is the length of the domain.
The finite difference method was used to reduce the fluid-phase ADR equation to a
system of ordinary differential equations in time. This system of equations was solved
simultaneously along with the system of ordinary differential equations describing the
solute concentration on the slow-site portion of the solid phase using Gear’s algorithm
(1971). Additional details of this numerical approximation procedure are presented in
Appendix 11. The FORTRAN code constructed to solve this problem was validated by
comparison to an available analytical solution (Cameron and Klute, 1977; Miller and
Weber, 1988), which is valid for the case of a linear sorption-equilibrium model.
One-Dimensional, Dual-Resistance Model
The dual-resistance sorption-rate sub-model may be included in the ADR equation
along with a Fkeundlich sorption-equilibrium model. For a solute that enters the domain
only at the inlet boundary of the domain and undergoes first-order degradation from the
fluid and solid phase, the fluid-phase ADR equation is
30

the solid-phase equation is
with the fluid and solid coupled by
1 .__ c ~ = ( & ) "F a t r = R
where the boundary conditions are
and for the initial conditions
C( t , z = 0) = c* (49)
Solution of the dual-resistance sorption model form of the ADR equation is somewhat
more complex than the local-equilibrium model and the two-site model, but straightfonvard
in concept. The macroscopic ADR equation (Equation 44) is solved simultaneously with a
partial differential equation for the solid-phase for each spatial location in the discretized
domain. The numerical method used to approximate this solution was constructed by
using the finite difference method to reduce the set of partial differential equations to a
31

set of ordinary differential equations in time. A FORTRAN code was developed to solve
the coupled set of ordinary differential equations simultaneously using Gear’s dgosit
(1971). Additional details of this numerical approximation approach are presented in
Appendix 111. Validation was accomplished by comparison with an available analytical
solution (Rasmuson and Neretnieks, 1980; Miller and Weber, 1988).
32

RESULTS
BOTTLEPOINT EQUILIBRIUM EXPERIMENTAL RESULTS
The sorption equilibrium characteristics of the solutes p-dichlorobenzene and o-xylene
and the Camp Lejeune subsurface solid were analyzed using the experimental procedures
detailed in the Materials and Methods section. The experimental work with these materials
proved to be extremely difficult because of the s m d amount of sorption that occurred.
It is good experimental design to plan bottle-point sorption experiments that result
in a 50-80% decrease in the initial fluid-phase concentration. This is done to limit the
error introduced by sorption to laboratory glassware, variation in extraction volumes,
differential volatilization among samples, and gas chromatography response variations. To
accomplish the desired reduction, the mass of solids to mass of solution ratio (or solids
ratio) is manipulated. That is, the solids ratio is increased for poorly-sorbing solute-
solid mixtures. The practical upper limit of the solids ratio is a function of the settling
and compaction characteristics of the solid material but usually ranges from 1-2. As a
benchmark, the solids ratio for an aquifer usually ranges from 3-5, or somewhat higher
than that possible using bottle-point methods.
Sorption equilibrium studies with pdichlorobenzene and o-xylene resulted in only
about a 15% decrease in the fluid-phase concentration for the maximum solids concentra-
tion possible. As expected, the results from these experiments showed substantial exper-
imental variation-resulting from the experimental problems noted above. Equilibrium
isotherm plots for o-xylene and p-dichlorobenzene are shown by Figures 4 and 5.
The sorption-equilibrium models outlined in the Modeling section were fit to the data
sets shown in Figures 4 and 5, by selecting model parameters that minimized the sum of
squares of the relative error between model predictions and experimental data. This may
be shown in equation form as
33

n \" 2.00 Y
W
S I 0 .-
I I I I I I
o o o o o Data - Linear Model 0 -
Freundlich Model ____--__--_-___
_ - - _ Langmuir Model 0 -
0 1 .oo
0.00
0 0.50 m
I I I I I I I I I
Fluid - Phase Concentration (,ug/l)
Figure 4. Sorption equilibrium data and model fits for the solute pdichlorobenzene and the Camp Lejeune subsurface solid material.
34

4.00
> 3.00
I I I I 1 I I I I
o o o o o Data Linear Model Freundlich Model _-__-___-___--_
- - - - Langmuir Model
FI u id - P h a se Con c e n t ra t io n (pg /I)
Figure 5. Sorption equilibrium data and model fits for the solute o-xylene and the Camp Lejeune subsurface solid material.
35

n d Qdi - Qmi mine = ( Qmi
where: i is a data-point index; ?zd is the number of experimental data points, qd is the
experimental mass-average solid-phase solute concentration; and qm is the model-predicted
mass-average solid-phase solute concentration.
The results of the model fits are given in Table 3, while the best-fit model traces are
overlain on the data plots given in Figures 4 and 5. The Freundlich model provided the
best fit in both cases with typical values of nf: found, although practically and statistically
all models yielded a similar agreement with the data. The mean error for the Fkeundlich
model was 23.1% for p-dichlorobenzene and 24.1% for o-xylene solute. The error between
these experimental data and the model fits is higher than the error normally achieved using
similar procedures for more strongly sorbing solute-solid combinations.
Table 3. Sorption Equilibrium Parameter Summary
D-Dichlorobenzene 0-Xvlene* Model Parameter Value Mean Error Value Mean Error
Linear KP (cm3/g) 1.43 x lo-' 30.9% 1.01 x 10⁻¹ 27.4%
Freundlich KF ( ( ~ m ~ / g ) ~ ~ ) 1.03 x lo-' 23.1% 5.74 x lo-' 24.1% n F (Cm3 /d 7.89 x lo-' 9.59 x lo-'
Lmgmuir Q" (g /d 5.18 x 26.7% 1.40 10-4 27.4% b (cm3 /d 3.45 10+4 7.30 x lo+'
* All computations performed neglected data outlier at Ce=7,570 pg/l
BOTTLEPOINT RATE EXPERIMENTAL RESULTS
The previously-noted experimental difficulties found with measuring equilibrium sorp-
tion were evident as well in the rate studies. This follows from the rate-study procedure,
36

which attempts to measure a trend in fluid-phase concentrations as a function of time.
Problems were encountered with the equilibrium experiments because the total change
in fluid-phase concentration was small compared to the potential sources of error. Thus,
attempting to discern a trend as a function of time is a second-order effect that is even
more prone to error. This is so because, the changes in concentration between two different
times is a fraction of the total change in fluid-phase concentration.
The rate at which sorption occurs was analyzed for the solutes p-dichlorobenzene and
o-xylene and the Camp Lejeune subsurface material, using the experimental procedures
outlined in the Methods section. The results of these experiments are shown by Figure
6. The experimental conditions of these two rate studies are summarized in Table 4. The
smaller reduction in fluid-phase concentration with the o-xylene solute compared to the
p-dichlorobenzene solute is consistent with the slightly higher solids ratio used with the
p-dichlorobenzene rate study and the respective octano1:water partition coefficients of the
two solutes.
Table 4. Sorption Rate Study Conditions and Parameter Summary
Parameter pDichlorobenzene -Xylene
Initial Concentration (mg/l) 8.20 x 10' 1.64 x 10'
Mass of Solid (g) 4.40 x 10' 3.00 x 10'
Volume of Solution (cm3) 2.19 x 10' 2.00 x 10'
D, (cm2/hr) Variance
- 1.22 x 8.05 10-4 __l
1.16 x 1.24 10-3 -
-
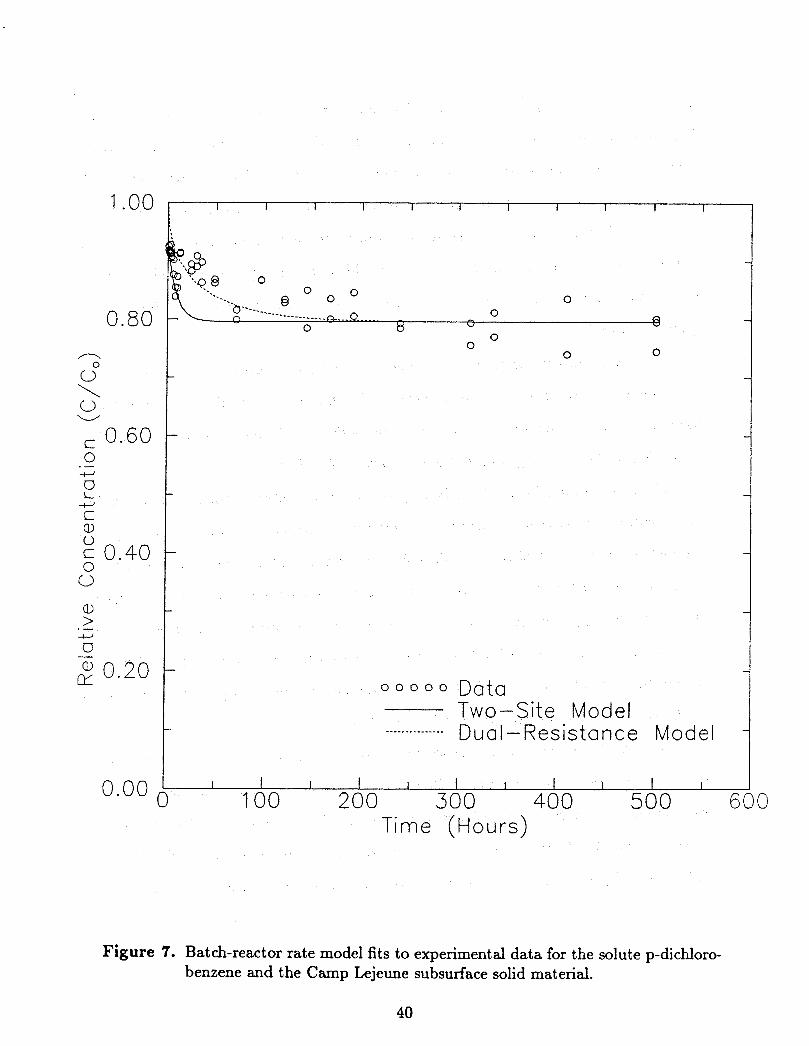
The p-dichlorobenzene data set was used as input into the two-site and dual-resistance

Figure 6. Batch reactor sorption-rate data for the Camp Lejeune subsurface solid ma- terial.
38

batch-reactor models presented in the Modeling section. Parameter estimation was per-
formed using the objective function of minimization of' variance between the observed and
model-predicted concentrations. One parameter was estimated with each model: a for
the two-site model, and D, for the dual-resistance model. All other model inputs were
independently determined. The Fkeundlich sorption-equilibrium model was used, with pa-
rameters determined from the bottle-point equilibrium study performed. The results of
model fitting are graphically shown by Figure 7, while the rate parameters determined are
given in Table 4.
The results of the sorption rate modeling of the p-dichlorobenzene solute are quite
satisfying in view of the experimental uncertainties. Computed model variance was similar
to published results for more ideal experimental conditions (Weber and Miller, 1988). Close
inspection of the modeling results shows the traits of each model.
The two-site model predicts early response quite accurately, while predicting equilib-
rium conditions in less time than is actually required. This is a result of directly computing
the fast-site component of sorption data from an experimental measurement made after
one hour. This virtually assures good agreement with the experimental data during early
times, and the approach of the two-site model toward equilibrium results from the mini-
mization procedure used on the later data. Previous work (Weber and Miller, 1988) has
shown this method to yield results that are in good agreement with parameter estimation
methods based on adjusting two model parameters.
The best fit of the dual-resistance model shows a smooth descent from the initid
concentration toward the eventual equilibrium. The shape of the model prediction is based
entirely on a minimization of variance, and no particular portion of the data is assured a
more accurate fit. Thus the character of the two rate model fits are somewhat different,
although both provide a reasonably-accurate description of the observed response.
39
W
.- &
.-
o o o o o Data Two-Site Model Dual -Resistance Model ----____----___
Time (Hours)
Figure 7. Batch-reactor rate model fits to experimental data for the solute p-dichloro- benzene and the Camp Lejeune subsurface solid material.
40

COLUMN-REACTOR EXPERIMENTAL RESULTS
The coPumn experimental apparatus discussed in the Materials and Methods section
was used to investigate the movement of a nonreactive chloride and sodium azide solute,
and the movement of a toluene and o-xylene solute. The investigative methodology re-
quired the analysis of the data for nonreactive solute profiles resulting from a step source
of contaminant to determine the spreading of a solute front caused by hydrodynamic dis-
persion. These data were collected by supplying a known and constant concentration of a
nonreactive solute in a column and observing the change in concentration in the effluent
of the column. The results of such an analytical procedure are shown on Figure 8.
Also shown on Figure 8 are the relevant characteristics of the column, the advective-
dispersive model fit value for hydrodynamic dispersion, and a trace of the modeled concen-
tration as a function of time. Parameter estimation was accomplished using a Levenberg-
Marquardt algorithm defined to minimize the variance between the observed and predicted
normalized concentrations. The results of this model analysis agree well with the data col-
lected, and the front observed in the column used is quite sharp. That is, the relative
concentration of the effluent of the column changes abruptly from near zero at 0.80 bed
volumes (or theoretical retention times) to new unity at 1.20 bed volumes. This gives a
Peclet number (Pe = v z X / D z ) of 469 for the column system, which is considered rather
sharp. Sharp fronts like the ones shown in Figure 8 can make the accurate modeling of
contaminant transport using an ADR-equation approach rather expensive.
The column apparatus was also used to observe the movement of the target compounds
toluene and o-xylene through the system. Figure 9 shows the effluent concentration for the
target solutes as a function of bed volumes. A step source (slightly declining in time due
to volatilization) of the organic solutes was fed to the column for 1,710 minutes or about
2.25 bed volumes, while observations of organic solute concentrations were made for the
column effluent for a total time equivalent to 9.05 bed volumes. It may be observed that
the organic solute data showed a similar sharp front to the nonreactive tracer data and
41

1.10
0.90 n
0" \ 0 - 0.70 zz 0
U
.- -w
L 4
Q) zz 0.50 0 zz 0 0
._ ? 0.30 -c, U Q) fx -
0.10
-0.10
Figure 8. Column tracer data and nonreactive advective-dispersive model fit.
I I I I I I I
0 - * o m vX= 3.617 cm/hr
X = 45.72 cm "
D,= 0.352 cm2/hr o o
- P,= 469 -
- -
- -
- -
- -
- -
- -
- -
- o o o o o Data -
Model 0 0 ,-. " r\ v yr. "
0 -
I I I I I I I
42
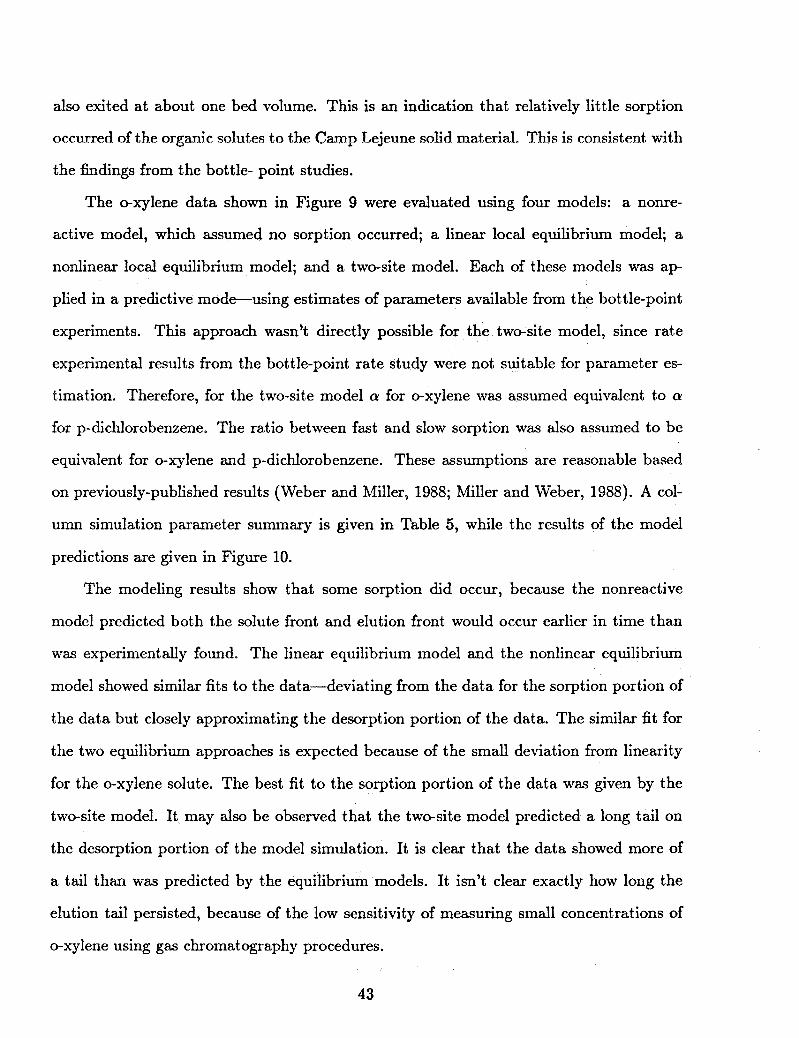
also exited at about one bed volume. This is an indication that relatively little sorption
occurred of the organic solutes to the Camp Lejeune solid mateside This i s consistent with
the findings from the bottle- point studies.
The *xylene data shown in Figure 9 were evaluated using four models: a nonre-
active model, which assumed no sorption occurred; a linear local equilibrium model; a
nonlinear local equilibrium model; and a two-site model. Each of these models was ap-
plied in a predictive mode-using estimates of parameters available from the bottle-point
experiments. This approach wasn’t directly possible for the two-site model, since rate
experimental results from the bottle-point rate study were not suitable for parameter es-
timation. Therefore, for the two-site model a for o-xylene was assumed equivalent to Q
for p-dichlorobenzene. The ratio between fast and slow sorption was also assumed to be
equivalent for o-xylene and p-dichlorobenzene. These assumptions are reasonable based
on previously-published results (Weber and Miller, 1988; Miller and Weber, 1988). A col-
umn simulation parameter summary is given in Table 5, while the results of the model
predictions are given in Figure 10.
The modeling results show that some sorption did occur, because the nonreactive
model predicted both the solute front and elution front would occur earlier in time than
was experimentally found, The linear equilibrium model and the nonlinear equilibrium
model showed similar fits to the data-deviating from the data for the sorption portion of
the data but closely approximating the desorption portion of the data. The similar fit for
the two equilibrium approaches is expected because of the small deviation from linearity
for the o-xylene solute. The best fit to the sorption portion of the data was given by the
two-site model. It may also be observed that the two-site model predicted a long tail on
the desorption portion of the model simulation. It is clear that the data showed more of
a tail than was predicted by the equilibrium models. It isn’t clear exactly how long the
elution tail persisted, because of the low sensitivity of measuring small concentrations of
o-xylene using gas chromatography procedures.
43

4.0
n
0” 3.0 \ 0
zs 0
U
W
.- -w
L -w
2.0 a, 0 c 0 0
._ >
0 1.0
Q)
+J U
GL
-
-
0.0
Figure 9. Column data for organic solutes.
1 I 1 I I I I I I
o o o o o Toluene Data 0 ~ 0 ~ 0 Xylene Data -
rP -
805% &el ““48 E@ OO06t, - €I
-
0
- 0
0 -
0 - -
0
0 - -
0
0 -
-
0 0 0
0 -
8 3 € 3 0
0 53
44

Table 5. Column Simulation Parameter Summary for *Xylene
Model Parameter Value units
Nonreactive P 2.64 x 10' g/cm3 X 4.57 x 10' cm n 4.08 x lo-' vz 3.62 x loo cm/hr D, 3.52 x lo-' cm2/hr
Linear Equilibrium KP 1.01 x IO-' cm3/g
Nonlinear Equilibrium KF 5.74 x ( ~ m ~ / g ) ~ ~ nF 9.59 x lo-'
Two-Site 1.86 x lo-' (cm3/g)"f 3.88 x loe2 (cm3/g)".
hrp Ks nf 9.59 x lo-' na 9.59 x lo-' (Y 1.22 x l/hr
45

Figure 10. Column data for o-xylene and model predictions.
46

DISCUSSION
GENERAL
The results of the experimental work performed show that only a small amount of
sorption of moderately hydrophobic solutes occurred to the Camp Lejeune subsurface ma-
terial. Since only a small amount of sorption occurred, the effect of the rate of sorption on
solute movement and aquifer rehabilitation was difficult to precisely determine experimen-
tally. However, the data collected did clearly show that: sorption was not instantaneous;
a two-site sorption rate model provided a better description of the sorption data collected
than an equilibrium-based approach; and the two-site rate model predicted, and the exper-
imental data showed, a long tail for the elution of of o-xylene from a column experiment.
The existence of this long tail in both model predictions and experimental data confirms
the original hypothesis of the research that sorption and desorption effects contribute to
increased aquifer clean-up times.
The effect on the clean-up time for a given aquifer is a function of the contaminant
source distribution, the solute of concern, the solid-phase properties, and the clean-up level
needed for the given solute. That is, a long tail is not important if the concentration is
less than the clean-up target concentration for the intended use of the aquifer. For many
contamination incidents, the clean-up level is a drinking water standard, and drinking
water standards are becoming increasingly more stringent. This suggests that the effect of
the sorption/desorption processes on the time required for aquifer restoration will become
more important as water quality standards become more stringent.
The implications of the research findings to the coastal region of North Carolina are
clear:
1. Sorption of moderately hydrophobic organic solutes to subsurface material has only
a slight effect on movement of an advancing contaminant front-assuming that the
Camp Lejeune material investigated is typical of coastal subsurface material;
47

2. Sorption equilibrium and rate parameters determined for o-xylene and p-dichloroben-
p Lejeune subsurface material were consistent with parameters found for
other natural materials that are low in organic carbon; and
3. The real significance of the sorption rate effect is a function of the solute and solid
properties and the contaminant action level of the aquifer rehabilitation.
The results of this research may be examined in greater detail and generalized with
respect to several considerations:
1. constitutive approximations of sorption equilibrium;
2. effect of hydrodynamics on aquifer remediation;
3. effect of sorption equilibrium on aquifer remediation; and
4. the effect of sorption rate on aquifer remediation.
The subsections that follow examine these considerations.
CONSTITUTIVE APPROXIMATIONS OF SORPTION EQUILIBRIUM
The experimental methods used to measure sorption equilibrium in this work are
straightforward. However, these measurements are time consuming to perform and require
skill and diligence by the analyst for accurate results. For this reason, it is desirable to
have as1 empirical method for making a first-cut estimate of sorption equilibrium without
performing time-consuming experiments. Many such methods have been proposed during
the last decade, which are based on the properties of the solute and solid material.
In one of the first and most comprehensive studies, KarickhofF et a3. (1979) inves-
tigated sorption of a variety of neutral, nonpolar, hydrophobic, organic compounds on
sediments and reported the relationship
log KO, = log KO, - 0.21
for
48
in which KO, is the organic carbon normalized partition coefficient of the solid, KO, is
the octanol-water partition coefficient of the solute, and foc is the mass fraction of organic
carbon in the solid material. Octanol-water partition coefficients are readily available in
the literature for a wide variety of compounds (Hansch and Leo, 1979).
In a recent study, SabljiC (1987) reviewed a variety of empirical methods for predicting
sorption equilibrium between organic solutes and natural solid materials. SabljiC (1987)
found that a method based on the molecular connectivity index of the solute and the
organic carbon mass fraction of the solid material gave the best level of prediction for a
wide range of experimental data. Molecular connectivity (x) is a topological method that
is a measure of the projected size of a molecule, and x is computed using only the molecular
structure bond information. Sablji6 also presented extensions to the molecular connectivity
method that allow for accurate predictions of sorption equilibrium for polar solutes. The
principal advantage of this method results from the definite nature of a computed value
of x compared to experimentally-determined properties such as octano1:water partition
coefficient or aqueous solubility.
Table 6 shows a comparison of observed and predicted organic-carbon-normalized
partition coefficients for the solutes p-dichlorobenzene and o-xylene. For the laboratory
measurements made in the experimental portion of this investigation, the molecular topol-
ogy model of SabljiC (1987) provided a better approximation than the popular Karickhoff
et al. (1979) model. The mean error for the Karickhoff model prediction was 127%, while
the mean error for the Sabljib model was 28%. It should be observed that both of these
approximations are within the normal range expected for constitutive approximations of
sorption, which is a factor of 2-3.
The Karickhoff relationship tended to predict larger values of KO, than were noted,
49

while the molecular topology method of SabljiC under-predicted the measured values of
Koc. This lends even further confidence in the Sabljid molecular topology method since
the organic carbon fraction in the Camp Lejeune material was extremely low and mineral
site sorption may account for a significant fraction of the total sorption. Since KO, is an
organic-carbon-normalized partition coefficient, the effect of sorption to mineral sites is
ignored, and it is expected that sorption estimation methods that ignore mineral sorption
would under-predict the actual sorption observed in a low-carbon system.
Table 6. Observed and Predicted Linear Partition Coefficients
Source p-Dichlorobenzene 0-X ylene
Measured KO, 596 423
Predicted KO, (Karickhoff et al., 1979) 1479 871
Predicted KO, (SabljiC, 1987) 353 360
It should be noted that the above comparisons are based upon empirical estimates of
sorption, and they do not take the place of actual measurements of the relationship. This
is so not only because the estimates are subject to an error due to the exact nature of the
solid and solute, but also because sorption equilibrium relationships are typically nonlinear
when observed over a wide range in equilibrium concentration (Hamaker and Thompson,
1972; Weber and Miller, 1989). Nonlinearity of the sorption equilibrium relationship was
also found for the materials investigated in this work. The importance of this point for
aquifer restoration will be investigated further.
EFFECT OF HYDRODYNAMICS ON AQUIFER REMEDIATION
Several factors affect the time required to renovate a contaminated aquifer. The hy-
50

drodynamic processes of advection and dispersion are chief concerns in assessing the time
required to renovate an aquifer. While a complete disclassion of hydrodynamic processes
will not be presented herein, two major points will be made: (1) dimensionless-form equa-
tions can be derived to aid in showing how Clem-up times increase as a function of increased
system dispersion; and (2) subsurface heterogeneity leads to hydrodynamic conditions that
result in increased clean-up times when compared to homogeneous conditions.
Consider the case of the one-dimensional ADR equation that includes linear local-
equilibrium sorption with first-order decay from the fluid and solid phase
defining the variable groupings
- c
where: X is a spatial reference location; r is the average advective travel time to X ; Pe is
a dimensionless Peclet number; ke is an effective first-order decay rate; f is a dimensionless
variable in time termed throughput; is dimensionless concentration; k is dimensionless
distance; and Ee is a dimensionless effective decay rate.
51
Equation 53 can be written in dimensionless form using equations 54 to 60 giving
It follows from equation 61 that if dimensionless concentration is expressed as a func-
tion of throughput, the only variables that effect the shape of the resulting distribution
are Pe and k.,. In the absence of decay reactions, the Pe is the sole master variable. Figure
11 shows distributions of normalized concentration (e) as a function of throughput (5) for
a range of Pe. The source condition used in Figure 11 was a step source that continued
for a length of time equivalent to T = 3.
Figure 11 shows that as Pe decreases the value of 5 required for an approach of e to 0 increases. This translates to longer cleanup times for higher dispersivity-making
dispersion an important component in assessing the length of time required for aquifer
renovat ion.
However, recent work has shown that dispersivities tend to be rather small when
heterogeneity-especially in the vertical dimension-is considered (Molz et al., 1987), and
even relatively homogeneous aquifers have been found to have wide ranges of hydraulic
conductivity (Sudicky, 1986). Molz and co-workers found that field studies often report
large values of dispersivities that are scale dependent, but these results are really man-
ifestations of using vertically-averaged values of dispersivities in two-dimensional models
that ignore heterogeneity. It seems clear that the fundamental pore-scale mechanisms that
are normally associated with dispersion are a relatively small component of the dispersiv-
ity reported at the field scale. This suggests that when heterogeneity is considered true
Peclet numbers become quite large, since D, is usually small. Molz et al. (1987) report
good agreement of model prediction and experimental data for field-scale tracer experi-
ments, which were based on observed hydraulic conductivity variations and did not use
dispersivity as a fitting parameter.
52
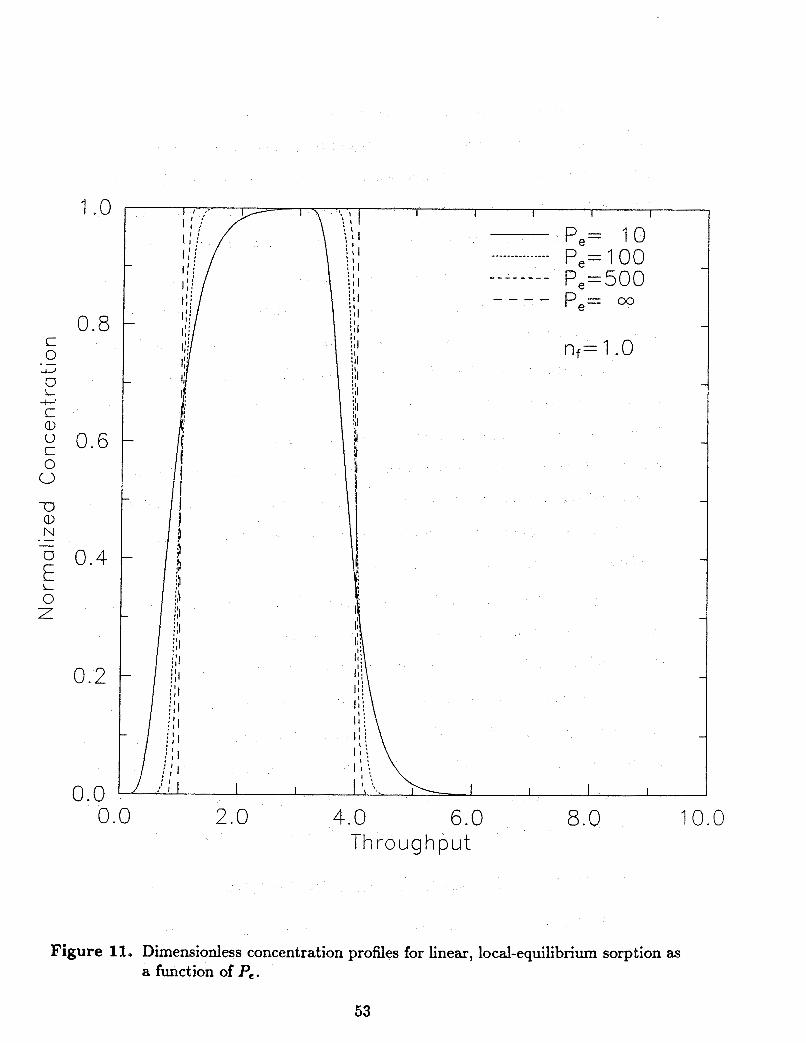
0.0 2.0 4.0 6.0 8.0 Throughput
Figure 11. Dimensionless concentration profiles for linear, local-equilibrium sorption as a function of P,.
10.0
53

The above discussion supports the conclusion that dispersion does not contribute
ificmtly to the commonly-observed long cleanup times needed for aquifer res torat ion.
System Peclet numbers can be expected to be large enough at the field scale that sharp
front solutions are reasonably accurate. This suggests that heterogeneity is a major factor
affecting system hydrodynamics and hence cleanup time at the field scale.
A vertically-layered system with horizontal flow can be considered as an idealized
heterogeneous system-this may be a good first-cut approximation for many aquifer sys-
tems. In a vertically-layered system, contaminants will move more rapidly through high
conductivity regions. It follows that separate sharp fronts will develop in each layer, be-
cause of the velocity contrasts that exist between layers. This will be tempered somewhat
by inter-layer transverse dispersion. It also follows that during aquifer remediation, high
conductivity layers will be renovated more quickly than low conductivity layers because of
differential velocity considerations. If a wide range of hydraulic conductivities exists, then
the low velocity layers will give rise to a long tail on a vertically-averaged concentration
profile as a function of time, at a purge well.
The greater the heterogeneity in the vertical direction the longer the concentration
tail. The system tailing would be even longer if sorption equilibrium was inversely related
to hydraulic conductivity, which would be the expected trend for many subsurface systems.
It is concluded that subsurface heterogeneity is the dominant hydrodynamic factor
that leads to prolonged cleanup times. It is important to identify and quantify this hetero-
geneity if accurate estimates of contaminant movement and aquifer rehabilitation times are
to be made. Much more remains to be done in field and analytical methods for assessing
heterogeneity and routinely incorporating the effects into simulation models.
EFFECT OF SORPTION EQUILIBRIUM ON AQUIFER REMEDIATION
In addition to subsurface hydrodynamic heterogeneity, deviations from instantaneous
linear-equilibrium sorption can also affect the time required for aquifer renovation. The
54

magnitude of this effect is a function of the degree of nonlinearity and the concentration
level required for a given cleanup.
When equilibrium is nonlinear, the retardation factor becomes a function of concen-
tration, hence time. The retardation factor for a Freundlich isotherm may be expressed as
a function of an initial concentration Ci and a final concentration Cf
where
For the case where Cj = 0 and Cf = 1, equation 62 becomes
and
- t t = , (67)
Equation 66 will be used as a constant in presenting dimensionless analysis results for non-
linear Freundlich-type equilibrium in the remainder of the Discussion in the form off given
by equation 67. It is important to note that while results are presented in dimensionless
form, they are still somewhat dependent upon actual system variables.
55

Figure 12 shows the resulting normalized concentration profiles from a step source of
a duration of 3 = 3.0, as a function of nf. The results of this analysis show that as n f
decreases the length of the tail on the elution portion of the concentration profile increases.
Therefore aquifer remediation time is inversely related to the value of the Freundlich expo-
nent for desorption, where desorption is described by the Freundlich isotherm. A typical
range of the F'reundlich exponent for sorption is 0.7 5 nf 5 1.0 (Weber and Miller, 1989),
however desorption has been observed to display hysteresis. Desorption hysteresis may
lead to Fkeundlich desorption exponents as low as nf = 0.3 (Swanson and Dutt, 1973).
The results presented in Figure 12 are re-plotted in Figure 13 in a form of log as
a function of T for a range of n f . This is significant since drinking water quality stan-
dards often dictate cleanup levels, and these standards may be several orders of magnitude
less than the maximum concentration existing in a system. Figure 13 shows that pro-
longed cleanup times would be the expected result from nonlinear sorption described by
the Fkeundlich isotherm.
Long-term simulations were performed for the same conditions shown in Figures 12
= 0,Z) = 1. The objective of these and 13, but starting from the initial condition of
long-term simulations was to quantify the time required to reach action levels down to
C = The results of these long-term simulations are presented in Figure 14 and show
the significance of this factor. The logarithm of cleanup time is linearly related to the value
-
of the desorption exponent over the range shown by Figure 14. Cleanup times relative to
linear equilibrium sorption to reach = loe6 would be expected to increase: by a factor
of about 4 for mild nonlinearity (n f == 0.8), and by a factor of about 420 for a solute
that displays hysteresis typical with laboratory findings (n j = 0.4). These results support
the conclusion that nonlinearity of sorption/desorption equilibrium between a solute in
solution and sorbed to a solid phase can have a profound effect on the length of time
required to renovate an aquifer. The significance of this factor can be expected to increase
as water quality standards become more stringent.
56

1 .o
0.8 c 0
U
ZI: Q)
ZII 0 0
-0 Q) N
.I- -+-J L
-+-J
0 0.6
.- - 0.4
L 0 Z
0.2
0.0 0.0 2.0 4.0 6.0 8.0 10.0
Throughput
Figure 12. The effect of nf on solute elution time for a step source of duration T = 3.
57

I I I I I I I I I I I I I
Figure 13. The effect of nj on solute elution time for concentrations significantly less than the maximum system concentration.
58

10
E 10
7
10
IO IO -’ 1 10
Throughput 10
Figure 14. The effect of nf on solute elution time required to reach low concentration action levels.
IO
59

EFFECT OF SORPTION RATE ON AQUIFER REMEDIATION
The rate at which the sorption and desorption reaction occetrs can also be expected
to influence the movement of a solute mass and length of time required to renovate a
contaminated aquifer. The two-site model form of the ADR equation may be used to
investigate the effect of reaction rate on cleanup time. A dimensionless Damkohler number,
D,, is introduced to aid in describing the effects of sorption rate in general terms
It should be noted that similar to the dimensionless analysis performed for nonlinear
equilibrium, the results presented using the D, described by equation 68 are dependent
upon the actual input values of variables used in the ADR model. Other investigators have
shown this dependency varies with the form of the dimensionless grouping used, but the
variable effect is always present (Bahr and Rubin, 1987; Jennings, 1987). For this reason,
the results presented in this section will be given for R j = 2.0 and R j = 20.0, and for
n j = 1.0 and n j = 0.8.
Figures 15 to 18 show simulated normalized concentration profiles for four combina-
tions of Rf and n j , for a step source of duration 5 = 3. Figures 15 to 18 show that the time
required to cleanup an aquifer would be expected to increase as a function of decreasing
D,. It may dso be observed that for increasing Rf a fixed D, is somewhat farther away
from an equilibrium condition. In all cases the largest D, simulated gives results that are
essentially identical to local equilibrium conditions, while values of D, < 1 were not simu-
lated but would certainly exist for transport on a small spatial scale with a slowly-sorbing
soh te.
The two conditions used to produce Figures 17 and Figure 18 were further investigated
by performing elution simulations to simulate the time required to reach low concentrations
from an initial condition of c(f = 0,T) = 1. These results are presented in Figures 19 and
60

1 . 0
0.8 c 0
0
t Q)
c 0 0 U Q) N
.- -w
L -cJ
0 0.6
.- - f 0,4 L 0 7
0.2
0.0
\ ' I I I I i
P , = I O O .
R,=2.0 n ,= l .O
0.0 2.0 4.0 6.0 8.0 10.0 Throughput
Figure 15. Normalized concentration profiles as a function of D, for Rf = 2.0 and nf = 1.0.
61

1 .o
0.8 c 0
@
S I a, c 0 0
-U a, N
.- -c,
L cz
0 0.6
.- - 0.4
L 0 7
0.2
0.0
P,= 100 R,=20.0 ns= I .O
0.0 2.0 4.0 6.0 8.0 10.0 Throughput
Figure 16. Normalized concentration profiles as a function of D, for R j = 20.0 and nj = 1.0.
62

1.0
0.8
U L
7 0 0.6 L
0 0 U a, N .- - 0.4
L 0 9
0.2
I I I I I
P,= 100 R,=2.0 n,=0.8
0.0 2.0 4.0 6.0 8.0 10.0 Throughput
Figure 17. Normalized concentration profiles as a function of D, for Rf = 2.0 and nf = 0.8.
63

1 .o
0.8 Iz 0
U
c CI)
Iz 0 0 7 3 Q) N
.- -w
L -4-J
0 0.6
.- - E 0.4 L 0 Z
0.2
0.0
I
P,= 100 R,=20.0 n,=0.8
0.0 2.0 4.0 6.0 8.0 10.0 Throughput
Figure 18. Normalized concentration profiles as a function of D, for Rf = 20.0 and nf = 0.8.
64
20, which show that decreasing D, from 10 to 1 leads to roughly a doubling of the elution
time for a target cleanup level of The consistency of this result for the two =
values of Rf investigated suggests that this finding is consistent within the dimensionless
framework presented, and it would be expected that similar results would be obtained for
other values of R f . It should be noted that different values of Rf result in varying values
of f required to meet a = cleanup level.
The general results of the rate modeling presented above can be investigated for an
example case represented by results from the experimental portion of this work. A value of
Q = 1.22 x l/hr was found for the sorption of p-dichlorobenzene to the Camp Lejeune
subsurface material in laboratory studies (Table 4). Assuming this value of Q is consistent
with the rate of sorption and desorption in the field, conditions under which deviations
from equilibrium conditions would be expected in the field can be approximated.
&om Figures 19 and 20 it may be concluded that for D, 5 IO deviations from local
equilibrium behavior occur and for D, 5 1 substantial deviations from local equilibrium
occur. If Q is assumed constant and equivalent to the laboratory-measured valued of 1.22
x lov2 l/hr, then values of r can be determined as a function of Rj for which deviations
from local equilibrium behavior occur. The results of such an analysis give
82.00, rc = Rf - 1 (69)
where rc is the critical hydraulic retention time in hours for deviations from local equilib-
rium consistent with a given value of D, to be observable.
For example to see roughly twice the required cleanup time for an aquifer as compared
to local equilibrium, a D, of 1 would be needed. For a Rf of 2 a retention time of about
82 hours would be required to see a doubling in cleanup times-very short by groundwater
standards. A noticeable difference from local equilibrium conditions would occur for a
hydraulic retention time of 820 hours-still short by groundwater standards.
65

c 0 .- c,
1
1
Figure 19. The effect of D, on solute elution time required to reach low concentration action levels for R f = 2.0.
66

IO -’ 1 10 Throughput
10
Figure 20, The effect of D, on solute elution time required to reach low concentration action levels for R f = 20.0.
67

Based upon the above analysis and the rates of sorption measured in the laboratory for
p-dichlorobenzene m d the Camp Lejeune solid material, it i s concluded that sorption rate
effects would be expected to play a less important role in explaining the long cleanup times
observed for aquifer remediation compared to the effects of heterogeneity and nonlinear
sorption equilibrium. In other words, the rate of sorption and desorption is a second-order
effect contributing to long cleanup times, but it is not a primary cause of long remediation
times-for solute-solid combinations that sorb at a rate similar to the systems investigated
in this work.
68

NOTATION
[AI
C C c e
-
K U
KO, KO, KP M M U
n nd
coefficient matrix resulting from application of finite element spatial approximation method (dimensionless).
uir isotherm sorption-energy constant (L3M-'). known boundary values resulting from application of finite element spatial
approximation method (MM-lT-'). solution-phase solute concentration (ML-3). dimensionless concent ration-equation 58 (dimensionless). equilibrium solution-phase solute concentration ( ML-3).
dimensionless final concentration in a range for computing retardation coefficient- equation 64 (ML3). initial concentration in a range for computing retardation coefficient (ML3). initial concentration in a range for computing retardation coefficient-equation 63 ( ML3). initial solution-phase solute concentration (ML-3). fluid-phase equilibrium-isot h e m solute concentration corresponding to the solid-
amkohler number grouping of two-site model rate coefficient-equation 68 (di-
concentration in a range for computing retardation coefficient (ML3).
e concentration at the particle boundary (ML-3).
second-rank hydrodynamic-dispersion tensor (L2 T-'). longitudinal hydrodynamic-dispersion coefficient in the x direction (L2 T-'). intraparticle surface-diffusion coefficient for dual-resistance model (L2T-'). fraction of organic carbon in a solid phase (dimensionless). fraction of organic matter in a solid phase (dimensionless). effective first-order decay rate (T-'). dimensionless effective decay rate-equation 60 (dimensionless). film mass-transfer coefficient for dual-resistace model (LT-' ).
fluid-phase decay rate constant (T-'). first-order solid-phase decay rate constant (T-').
dich isotherm sorption-capacity constant ((L3M-')nF). dlich isotherm sorption-capacity constant for the rapid-rate component of
the two-site model ((L3M-')"f). Freundlich isothenn sorption-capacity constant for the slow-rate component of the
ite model ((L3M-')"*). 'c-carbon normalized partition coefficient ( L3M-l).
octanokwater partition coefficient (dimensionless). linear sorption isotherm model coefficient (L3M-l). mass of solid phase in batch reactor (M). mass of solute initially added to batch reactor system (M). porosity of the porous media (dimensionless). number of experimental data points (dimensionless).
69
Nl p e
Q
Qd
Qe
Q f
Q f e
Qm
Qo
Qr
Qa
Qse
number of nodes in az1 element (dimensionless). Fkeundlich isotherm sorption-energy constant for the rapid-rate component of the two-site rate model (dimensionless). bundlich isotherm sorption-energy constant (dimensionless). number of nodes in a domain (dimensionless). 1Ff.eundlich isotherm sorption-energy constant for the slow-rate component of the two-site rate model (dimensionless). Lagrange polynomial basis function-given by equation 77 (dimensionless). Peclet number-equation 55 (dimensionless). volume-average solid-phase solute mass normalized by the solid-phase mass (M-
a vector of Oqr/at terms resulting from application of finite element spatial ap- proximation method (MM-lT-'). experimental mass-average solid-phase solute mass normalized by the solid-phase mass (MM-'). equilibrium mass-average solid-phase solute mass normalized by the solid-phase mass (MM-I). mass-average solid-phase solute mass normalized by the solid-phase mass for the rapid sorption-rate component of the two-site model (MM-'). equilibrium mass-average solid-phase solute mass normalized by the solid-phase mass for the slow sorption-rate component of the two-site model (MM-l). model-predicted mass-average solid-phase solute mass normalized by the solid- phase mass (MM-'). mass-average solid-phase concentration at equilibrium corresponding to a fluid- phase concentration of C,-equation 65 (dimensionless). solid-phase solute mass normalized by the solid-phase mass as a function of radial position (MM-'). trial function for solid-phase solute mass normalized by the solid-phase mass as a function of radial position (MM-'). mass-average solid-phase solute mass normalized by the solid-phase mass for the slow sorption-rate component of the two-site model (MM-I), equilibrium mass-average solid-phase solute mass normalized by the solid-phase mass for the slow sorption-rate component of the two-site model (MM-'). Langmuir isotherm sorption-capacity constant (MM-I). radial distance variable for dual-resistance model (L). subscript denoting a general chemical or mass-transfer reaction (dimensionless). solid-phase particle radius (L). retardation factor for a batch reactor-defined by equation 11 (dimensionless). retardation factor-defined by equation 29 (dimensionless). subscript denoting a sorption mass-transfer reaction (dimensionless). time (T). throughput-equation 67 (dimensionless). average macroscopic pore-velocity vector (LT-l).
M-f ).
70

v, V W weighting function ( ~ ~ n s i o ~ ~ ~ ) . 2 longitudinal spatial location (L). 5
X system length (L).
pore velocity in the longitudinal direction (LT-'). volume of solution in a batch reactor (L3).
- dimensionless dist an-ce--equat ion 59 (dimensionless).
A
€
P P b I-
I-C
two-site model rate constant (T-l). fluid-phase solute source (ML-3T-1). solid-phase solute source for the dud-resistance model (MM-' T-l). solid-phase solute source for the slow sites in the two-site sorption-rate model (MM-l T-' ). spatial discretization step prefix for finite difference approximation of differentia9 equations (dimensionless). relative error between experimental and model data (dimensionless). density of the solid particle (ML-3). bulk density of the solid phase (ML-3). mean hydraulic retention time-equation 54 (T). critical mean hydraulic retention time for a given degree of deviation from local equilibrium-equation 69 (T).
X molecular connectivity index (dimensionless).
71

REFERENCES
American Public Health Association. 1986. Standard Method for the Examination of Water and Wastewater, 16*h Edition. American Public Health Association. American Water Works Association, and Water Pollution Control Federation.
Anderson, M.P. 1979. Using models to simulate the movement of contaminants through groundwater flow systems. CRC Critical Reviews in Environmental Control. 9(2): 97-156.
Back, W., and J.A. Cherry. 1976. Chemical aspects of present and future hydrogeological problems. In Advances in Groundwater Hydrology, ed. Z.A. Saleem.
Bahr, J.M., and J. Rubin. 1987. Direct comparison of kinetic and local equilibrium formu- lations for solute transport affected by surface reactions. Water Resources Research. 23(3): 438-52.
Bailey, G.W., and J.L. White. 1970. Factors influencing the adsorption, desorption, and movement of pesticides in soil. Residue Review. 3229-92.
Banerjee, S., S.H. Yalkowsky, and S.C. Valvani. 1980. Water solubility and octanollwater partition coefficients of organics limitations of the solubility-partition coefficient cor- relation. Environmental Science & Technology. 14( 10): 1227-29.
Bear, J. 1979. Hydraulics of Groundwater. New York:McGraw-Hill, Inc.
Black, C.A. 1965. Method of Soil Analysis-Part 11. American Society of Agronomy. Serial No. 9.
Boucher, F.R., and G.F. Lee. 1972. Adsorption of lindane and dieldrin pesticides on un- consolidated aquifer sands. Environmental Science & Technology. 6(6): 53843.
Boyd, S.A. 1982. Adsorption of substituted phenols by soil. Soil Science. 134:33743
Browman, M.G., and G. Chesters. The solid-water interface transfer of organic pollutants across the solid-water interface. In Fate of Pollutants in the Ais and Water Environ- ment, Part I, ed. Suf€et, I.H., New York:Wiley and Sons.
Cameron, D.R., and A. Klute. 1977. Convective-dispersive solute transport with a com- bined equilibrium and kinetic adsorption model. Water Resources Research. 13( 1): 183-88.
Canter, L.W., and R.C. Knox. 1986. Ground Water Pollution Control. Chelsa, M1:Lewis Publishers.
73

Chiou, C.T., P.E. Porter, and D.W. Shedd ing . 1983. Partition equilibria of nonionic organic compounds between soil organic matter and water. Environmental Science & Technology. 17(4): 227-31.
Chiou, C.T. 1986. Role of organic matter, minerals and moisture in sorption of nonionic compounds and pesticides by soil. In Press.
Coates, J.T., and A.W. Elzerman. 1986. Desorption kinetics for selected PCB congeners from river sediments. Journal of Contarninant Hydrology. 1:191- 210.
Crittenden, J.C., N.J. Hutzler, D.G. Geyer, J.L. Oravitz, and G. Fkiedman. 1986. flrans- port of organic compounds with saturated groundwater flow: model development and parameter sensitivity. Water Resources Research. 22(3): 271- 84.
de Marsily, G. 1986. Quantitative Hydrogeology, Groundwater Hydrology for Engineers. Orlando, FL:Academic Press, Inc.
DiGiano, F.A., C.T. Miller, A.C. Roche, and E.D. Wallingford. 1988. Methodology for As- sessment of Contamination of the Unsaturated Zone by Leaking Underground Storage Tanks, Report No. 242, Water Resources Research Institute of The University of North Carolina.
Faust, C.R., and J.W. Mercer. 1980. Ground-water modeling: recent developments. Ground Water. 18(6): 569-77.
Fletcher, C.L., and D.K. Kaufman. 1980. Effect of sterilization methods on 3-chloroanaline behavior in soil. Journal of Agricultural and Food Chemistry. 28(3): 667-71.
Fkeeze, R.A., and J.A. Cherry. 1979. Groundwater, Englewood Cliffs, NJ:Prentice-Hall, Inc.
Gear, C.W. 1971. Numerical Initial Value Problems in Ordinary Differential Equations. Englewood Cliffs, NJ:Prentice-Hall, Inc.
Goltz, M.N., and P.V. Roberts. 1986. Interpreting organic solute transport data from a field experiment using physical nonequilibrium models. Journal of Contaminant Hydrology. 1~77-93.
Gschwend, P.M., and S. Wu. 1985. On the constancy of sediment-water partition coeffi- cients of hydrophobic organic pollutants. Environmental Science & Technology. 19( 1): 90-96.
Hamaker, J.W., and J.M. Thompson. 1972. Adsorption. In Organic Chemicals in the Soil Environment, Vol. 1, ed. C.A.I. Goring and J.W. Hamaker, New York:Marcel Dekker, Inc.
Hansch, C., and A.J. Leo. 1979. Substituent Constants for Correlation Analysis in Chem- istry and Biology. New York:Wiley-Interscience.
74

Hutzler, N.J., J.C. Crittenden, J.L. Oravitz, C.J. Meyer, and A.S. Johnson. 1984. Model- ing groundwater transport of organic compounds. In Proc. Environ. Engr. Specialty Confer. A.S.C.E., 3.m Angela, California.
Hutzler, N.J., J.C. Crittenden, J.S. Gierke, and A.S. Johnson. 1986. Transport of organic compounds with saturated groundwater flow: experimental results. Water Resources Research. 22(3): 285-95.
Huyakom, P.S., and G.F. Pinder. 1983. Computational Methods in Subsurface Flow. New York:Academic Press.
Jennings, A.A. 1987. Critical chemical reaction rates for multicomponent groundwater contamination models. Water Resources Research. 23( 9): 1775-84.
sphere. ll(12): 1243-47. Kale, S.P., and K. Raghu. 1982. Efficacy of different soil sterilization methods, Chemo-
Karickhoff, S.W., D.S. Brown, and T.A. Scott. 1979. Sorption of hydrophobic pollutants on natural sediments. Water Research. 13:24148.
Karickhoff, S.W. 1980. Sorption kinetics of hydrophobic pollutants in natural sediments. In Contaminants and Sediments, Vol. 2, ed. R.A. Baker, Ann Arbor, M1:Ann Arbor Science Publ.
Karickhoff, S.W. 1984. Organic pollutant sorption in aquatic systems. Journal of Hydraulic Engineering. llO(6): 707-35.
Kay, B.D., and D.E. Elrick. 1967. Adsorption and movement of lindane in soils. Soil Science. 104(5): 314-22.
Kenaga, E.E., and C.A.I. Goring. 1980. Relationship between water solubility, soil sorp- tion, octanol-water partitioning, and concentrations of chemicals in biota. In Aquatic Toxicology, ed. J.G. Eaton, P.R. Parrish, and A. C. Hendricks.
Leenheer, J.A., and J.L. Ahlrichs. 1971. A kinetic and equilibrium study of the adsorption of carbaryl and parathion upon soil organic matter surfaces. Soil Sci. SOC. Amer. Proc. 35:700-705.
Lyman, W.J., W.F. Reehl, and D.H. Rosenblatt. 1982. Handbook of Chemical Property Estimation Methods, Environmental Behavior of Organic Compounds. McGraw-Hill, I n C .
Mackay, D.M., W.P. Ball, and M.G. Durant. 1986. Variability of aquifer sorption proper- ties in a field experiment on groundwater transport of organic solutes: methods and preliminary results. Journal of Contaminant Hydrology. 1:119-32.
Means, J.C., S.G. Wood, J.J. Hassett, and W.L. Banwart. 1980. Sorption of polynuclear aromatic hydrocarbons by sediments and soils. Environmental Science & Technology. 14~1524-28.
75

Means, J.C., S.G. Wood, J.J. Hassett, and W.L. Banwart. 1982. Sorption of carboxy- substituted polynuclear aromatic hydrocarbons by sediments and soils. Environmental Science & Technology. 16:93-98.
Milanovich, F.P. 1986. Detecting chloroorganics in groundwater. Environmental Science & Technology. 20(5): 44142.
Miller, C.T. 1984. Modeling of sorption and desorption phenomena for hydrophobic or- ganic contaminants in saturated soil environments, Ph.D. Dissertation, University of Michigan, Ann Arbor, MI.
Miller, C.T., and W.J. Weber, Jr. 1984a. Evaluation of partitioning processes for organic contaminants in ground water. In Proc. 2nd International Confer. on Ground Water Quality Res., Tulsa, Oklahoma.
Miller, C.T., and W.J. Weber, Jr. 1984b. Modeling organic contaminant partitioning in ground water systems. Ground Water. 22(5): 584-92.
Miller, C.T., and W.J. Weber, Jr. 1986. Sorption of hydrophobic compounds in saturated soil systems. Journal of Contaminant Hydrology. 1:243-61.
Miller, C.T., and W.J. Weber, Jr. 1988. Modeling the sorption of hydrophobic compounds by aquifer materials-11. Column reactor studies. Water Research. 22(4): 465-74.
Mingelgrin, U., and Z. Gerstl. 1983. RRevaluation of partitioning as a mechanism of non- ionic chemicals adsorption in soils. Journal of Environmental Quality. 121-1 1.
Mitchell, J.K. 1976. Fundamental of Soil Behavior. New York:Wiley & Sons, Inc.
Molz, F.J., 0. Guven, J.G. Melville, and J.F. Keely. 1987. Performance and analysis of aquifer tracer tests with implications for contaminant transport modeling-a project summary. Ground Water. 25(3): 33741.
Morrill, L.G., B.C. Mahilum, and S.H. Mohiuddin. 1982. Organic compounds in soils: sorption, degradation, and persistence. Ann Arbor, MI:AM Arbor Science Publ.
Murali, V., and A.G. Aylmore. 1983. Competitive adsorption during solute transport in soils: 3. A review of experimental evidence of competitive adsorption and an evaluation of simple competition models. Soil Science. 135:279-89.
Neretnieks, I. 1980. Diffusion in the rock matrix: an important factor in radionuclide re- tardation? Journal of Geophysical Research. 85( 138): 4379-97.
Parker, J.C., and A.J. Valocchi. 1986. Constraints on the validity of equilibrium and first- order kinetic transport models in structured soils. Water Resources Research. 22( 3): 399-407.
76

Pedit, J.A., and C.T. Miller. 1988. The advantage of high-order basis functions for model- ing multicomponent sorption kinetics. In International Conference on Computational
in Water Resource (?th, Cambridge, Massachusetts), Computational Meth- ods in Water Resources, Vol. 2 Numerical Methods for Tkansport and Hydrologic Processes, ed. M.A. Celia, L.A. Ferrand, C.A. Brebbia, W.G. Gray, and G.F. Pinder, %ut hampton, U .K. :Computational Mechanics Publicat ions.
Pierce, R.H., Jr., C.E. Olney, and G.T. F e l b d , Jr. 1971. Pesticide adsorption in soils and sediments. Environmental Letters. l(2): 157-72.
Prickett, T.A., T.C. Naymik, and C.G. Lonnquist. 1981. A "random walk" solute transport model for selected groundwater quality evaluations, Illinois Water Survey Bulletin 65.
Rasmuson, A. 1981. Exact solution of a model for diffusion and transient adsorption in par- ticles and longitudinal dispersion in packed beds. Amer. Inst. of Chem. Eng. Journal. 27(6): 1032-35.
Rasmuson, A., and 1. Neretnieks. 1980. Exact solution of a model for diffusion in particles and longitudinal dispersion in packed be&, Amer. Inst. of Chem. Eng. Journal. 26(4): 686-89.
Rasmuson, A., T.N. Nmasimhan, and I. Neretnieks. 1982. Chemical transport in fissured rock: verification of a numerical model. Water Resources Research. 18(5): 1479-92.
Roberts, P.V., M. Reinhard, and A.J. Valochi. 1982. Movement of organic contaminants in ground water: implications for water supply. Journal AWWA. 74(8): 408-13.
Sabljit, A. 1987. On the prediction of soil sorption coefiicients of organic pollutants from molecular structure: application of molecular topology model. Environmental Science & Technology. 21:358-66.
Selim, H.M., J.M. Davidson, and R.S. Mansell. 1976. Evaluation of a two-site adsorption- desorption model for describing solute trmsport in soils. In Proc. Summer Computer Simulation Cod., Washington, D.C.
Stauffer, T.B., and W.G. MacIntyre. 1986. Sorption of low-polarity organic compounds on oxide minerals and aquifer material. Environmental Toxicology and Chemistry. 5( 11): 949-55.
Sudicky, E.A. 1986. A natural gradient experiment on solute transport in a sand aquifer: spatial variability of hydraulic conductivity and its role in the dispersion process. Water Resource Research. 22( 13): 2069-82.
Swanson, R.A., and G.R. Dutt. 1973. Chemicd and physical processes that affect atrazine and distribution in soil systems. Soil Science Society of America Proceedings. 37:872- 76.

Valocchi, A.J. 1985. Validity of the local equilibrium assumption for modeling sorbing solute transport through homogeneous soils. Water Resources Research. 21(6): 808- 28.
Vdocchi, A.J. 1986. Effect of radial flow on deviations from local equilibrium during sorbing solute transport through homogeneous soils. Water Resources Research. 22(12): 1693- 1701.
Van Genuchten, M.T., and P.J. Wierenga. 1976. Mass transfer studies in sorbing porous media 1. Analytical Solutions. Soil Science Society of America Journal. 40(4): 473-80.
Van Genuchten, M.T., and P.J. Wierenga. 1977. Mass transfer studies in sorbing porous media: 11. Experimental evaluation with tritium (3HzO). Soil Science Society of Amer- ica Journal. 41:272-78.
Van Genuchten, M.T., P.J. Wierenga, and G.A. O'Connor. 1977. Mass transfer studies in sorbing porous media: 111. Experimental evaluation with 2,4,5-T. Soil Science Society of America Journal. 41:278-85.
Verschueren, K. 1983. Handbook of Environmental Data on Organic Chemicals. New York:Van Nostrand Reinhold Company.
Voice, T.C., and W.J. Weber, Jr. 1983. Sorption of hydrophobic compounds by sediments, soils and suspended solids-I: theory and background. Water Research. 17(10): 1433- 41.
Weber, W.J., L.E. Katz, B.E. Jacobs, and C.T. Miller. 1986. Competitive sorption reactions in subsurface systems. Presented at: American Geophysical Union Fall Meeting Paper NO. H31A-09 1130H.
Weber, W.J., Jr., and C.T. Miller. 1988. Modeling the sorption of hydrophobic compounds by aquifer materials-I. Rates and equilibria. Water Research. 22(4): 457-64.
Weber, J.B., and C.T. Miller. 1989. Movement of organic chemicals over and through soil. In Reactions and Movement of Organic Chemicals in Soils, ed. B.L. Sawhney, Madison, WI: Soil Science Society of America, Inc.
Woodburn, K.B., P.S.C. Rao, M. Fwrui, and P. Nkedi-Kizza. 1986. Solvophobic approach for predicting sorption of hydrophobic organic chemicals on synthetic sorbents and soils. Journal of Contaminant Hydrology. 1:227-41.
Wu, S., and P.M. Gschwend. 1986. Sorption kinetics of hydrophobic organic compounds to natural sediments and soils. Environmental Science & Technology. 20(7): 717-25.
78
APPENDIX I. FINITE ELEMENT DERIVATION FOR DUAL-RESISTANCE BATCH MODEL
79
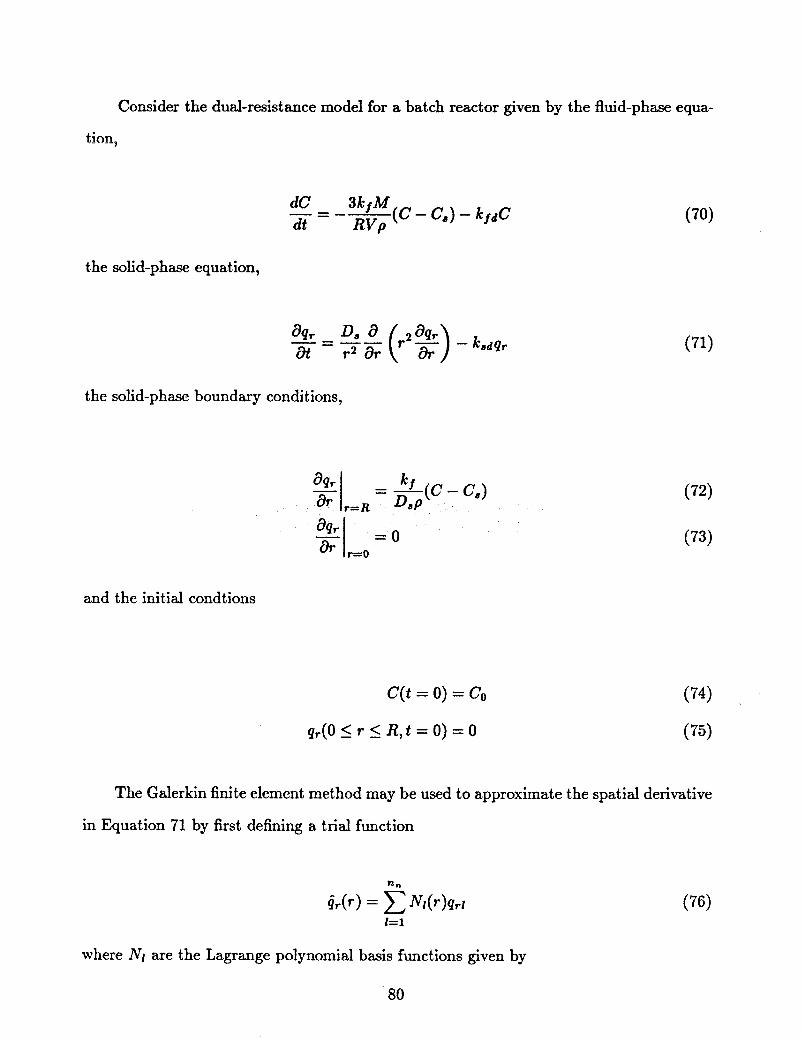
Consider the dual-resistance model for a batch reactor given by the fluid-phase equa-
tion,
the solid-phase equation,
the solid-phase boundary conditions,
and the initial condtions
C(t = 0) = co
q r ( O < r L R , t=O)=O
(74) I
(75)
The Galerkin finite element method may be used to approximate the spatial derivative
in Equation 71 by first defining a trial function
1=1
where N1 are the Lagrange polynomial basis functions given by
80

where: I is a nodel index; rl and r L are the locations of node I and node L; nn is the total
number of nodes; and ne is the number of nodes in an element. The number of nodes in
an element determines the order of the Lagrange polynomial basis function. Seven nodes
per element were used to yield sixth-order elements.
The weighted residual method requires that a system of equations-ne equation for
each node in the discretized domain-when formed with respect to the governing partial
differential equation and integrated over the domain vanish, which gives for the solid-phase
equation
for k = 1, ..., nn
where wk is a weighting function. The Galerkin finite element method requires that the
weighting function be equivalent to the basis function, which gives
for k = 1, ..., n,
Accuracy and stability of the Galerkin finite element require that the requirements
of completeness and consistency be met (Huyakorn and Pinder, 1983). Thus, since the
Lagrange polynomials are Co continuous- interpolation of the dependent variable is con-
tinuous at element boundaries, but interpolation of any derivative of the dependent variable
is not continuous, it is necessary to reduce the second-order partial derivative in Equation
79 by integrating by parts
81
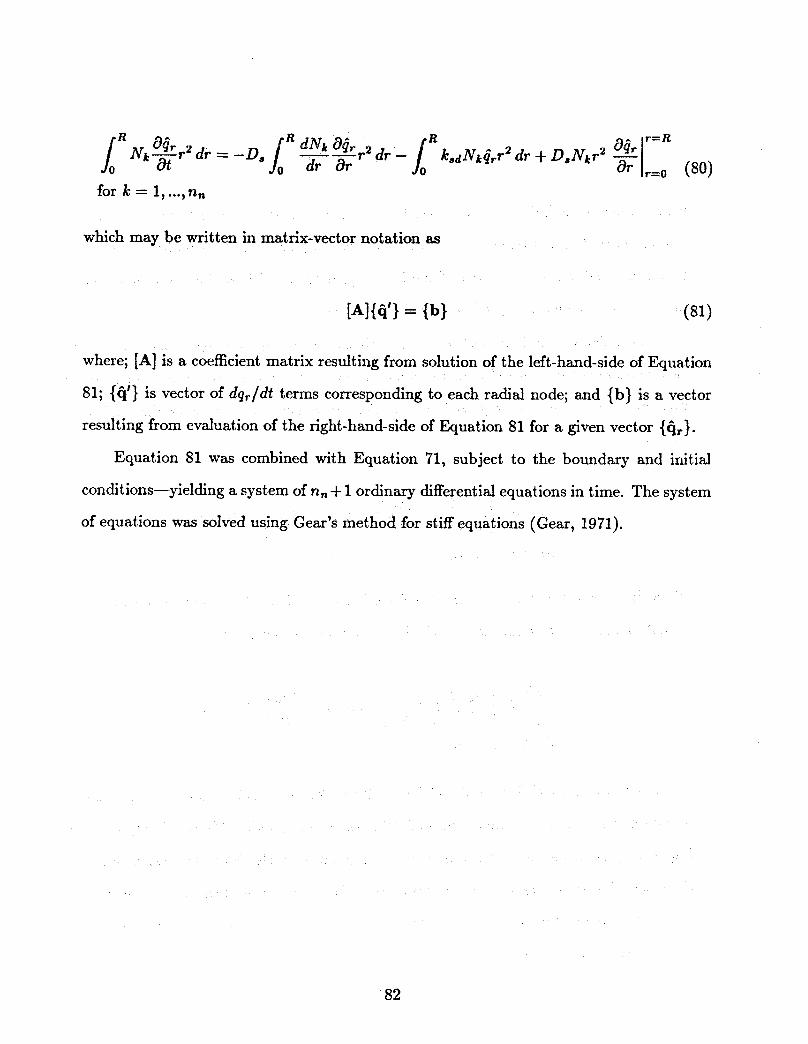
for k = 1, ..., n,
which may be written in matrix-vector notation as
where; [A] is a coefficient matrix resulting from solution of the left-hand-side of Equation
81; ti’} is vector of dq,./dt terms corresponding to each radial node; and {b} is a vector
resulting from evaluation of the right-hand-side of Equation 81 for a given vector {&I. Equation 81 was combined with Equation 71, subject to the boundary and initial
differential equations in time. The system conditions-yielding a system of n, + 1 ordin
of equations was solved using Gear’s method for stiff equations (Gear, 1971).
82

APPENDIX 11. FINITE DIFFERENCE DERIVATION FOR ONEDIMENSIONAL TWO-SITE MODEL
83

Consider the ADR form of a two-site sorption model given by the fluid-phase equation,
the solid-phase equation,
dq8 - = Q (Kat"' - q s ) - ksaq8 dt
the boundary conditions,
C(t > 0 , x = 0) = co
and the initial conditions
C(t = 0,x) = 0
qs(t = 0,x) = 0
where
The finite-difference approximation for equation 82 is
(83)
(84)
(85)
84
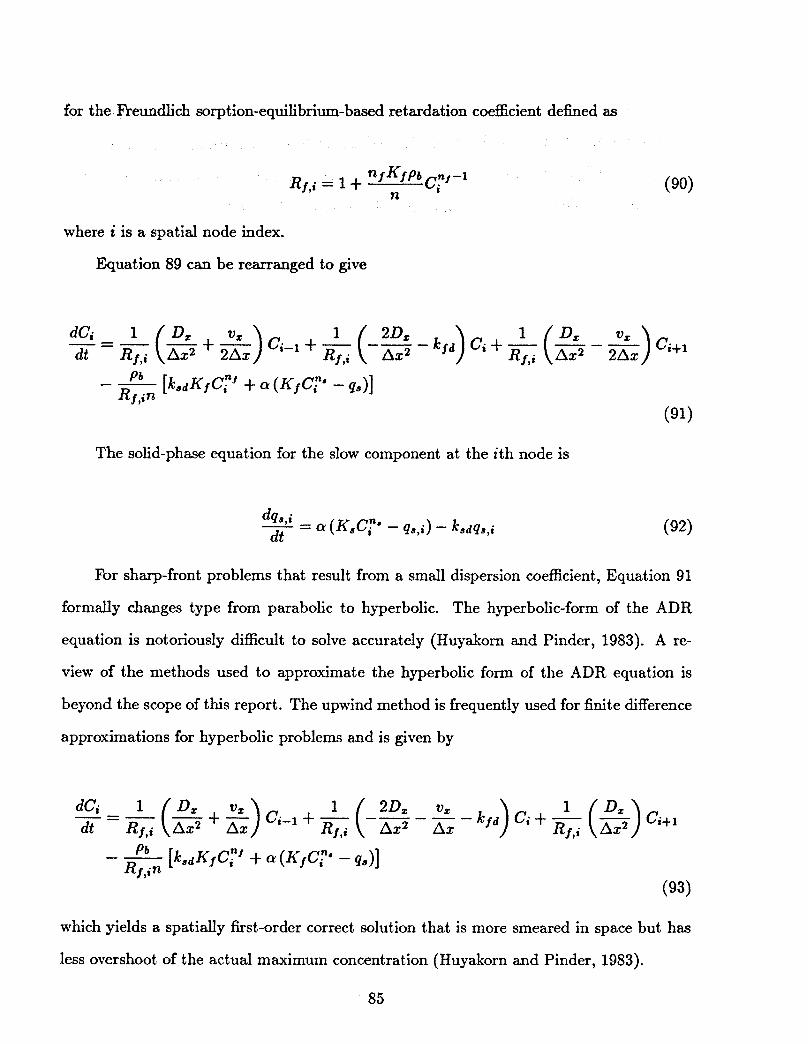
for the Fkeundlich sorption-equilibrium-based retardation coefficient defined as
(90) Rf,i = 1 + n f K f Pa Ci"f-1 n
where i is a spatial node index.
Equation 89 can be rearranged to give
dCj -= dt
J
The solid-phase equation for the slow component at the ith node is
For sharp-front problems that result from a small dispersion coefficient, Equation 91
formally changes type from parabolic to hyperbolic. The hyperbolic-form of the ADR
equation is notoriously difficult to solve accurately (Huyakorn and Pinder, 1983). A re-
view of the methods used to approximate the hyperbolic form of the ADR equation is
beyond the scope of this report. The upwind method is frequently used for finite difference
approximations for hyperbolic problems and is given by
which yields a spatially first-order correct solution that is more smeared in space but has
less overshoot of the actual maximum concentration (Huyakorn and Pinder, 1983).
85
The system of ordinary differential equations resulting from the finite difference a p
proximation to the fluid-phase equation- ation 93-md the solid-phase
equation (Equation 92) were assembled and solved with respect to the boundary and initial
conditions using Gear’s algorithm for stiff equations (Gear, 1971).
86

APPENDIX 111. FINITE DIFFERENCE DERIVATION FOR ONEDIMENSIONAL DUAL-RESISTANCE MODEL
87

Consider the ADR foxm of a dual-resistance sorption model given by the fluid-phase
equation,
the solid-phase equation,
the fluid and solid phase-coupling equation,
the boundary conditions,
and the initial conditions
C(t,z = 0) = co (99)
The finite-difference solution for the case of constant spatial discretization, hydrody-
namic dispersion, and velocity is
88

where i is a spatial nodal index.
Collecting all terms involving Ci-1, Cjj and Cj+1 gives
at the exit point
The solid-phase equations must be solved simultaneously with the fluid-phase equa-
tions. The finite difference approximation for the solid-phase equation is
where
rl+i - rt-1 - Ar+ + Ar- 2 2
Ar = -
89

rl+l - rl 2
r+ =
Collecting like terms involving qr,l+l, qr,l, and qr,l-l yields
- k81f) qr,l D8 -
dt ArAr- rAr ArAr, ArAr+ (107)
for the exterior boundary condition of the particle
introducing an artificial node to approximate the boundary condition yields
Solving for the artificial node gives
which c m be substituted into Equation 107 at the exterior of the particle to form the flux
boundary condition.
The interior boundary condition poses some additional difficulty because the radial
location, r , vanishes, which is an entry in the denominator of the finite difference approx-
imation to the first spatial derivative term.
90

Recall l’H6pitd’s rule
if
For the radial diffusion problem define the functions
then
therefore applying l’H6pital’s rule at r = 0 gives
91

which may be combined with Equation 111 to give
Approximating Equation 120 by using an artificial node qr,l-l gives
Since the spatial derivative is zero at the center of the particle then the following may be
applied
Ar- = Ar+ = Ar (123)
Combining Equations 121 to 123 gives
The above finite difference approximations result in a system of ordinary differential
equations that were solved simultaneously using Gear’s method for stiff equations (1971).
Note that the hyperbolic form of the ADR equation can be solved in upwind form, similar
to that presented in Appendix 11, to reduce the well-known overshoot and oscillation prob-
lems associated with the finite difference method-at the expense of increasing numerical
dispersion.
92