Embed Size (px)
Citation preview

8/8/2019 Copy of Analysis of Power Sector
http://slidepdf.com/reader/full/copy-of-analysis-of-power-sector 1/38
:RESENTED BY ZAHERA BOHRA
ROHIT SOMANI
RAKHI JAIN
MD AZHARUDDIN LUCKY PARASHAR
ANKITA JAIN
ANALYSIS OF POWER SECTOR

8/8/2019 Copy of Analysis of Power Sector
http://slidepdf.com/reader/full/copy-of-analysis-of-power-sector 2/38
INTRODUCTION
Bloodline of Industrial growth
Increased demand due to increased automation – demand-supply gap
Need to generate more supply with less harm to
environment
Deregulation has led to fierce competition in globalmarket

8/8/2019 Copy of Analysis of Power Sector
http://slidepdf.com/reader/full/copy-of-analysis-of-power-sector 3/38
Global Overview
Average Annual Growth Rate from 1971 to 2004 – 3.7%Developing countries consume 30% of world’s energy
America:Less than 5% of world’s populationconsumes more than 26% of World’s energy
Energy demand expected to rise by 95%
Global consumption expected to rise by 50% by 2030

8/8/2019 Copy of Analysis of Power Sector
http://slidepdf.com/reader/full/copy-of-analysis-of-power-sector 4/38
CONTD…
High prices of oil & natural gas will slow down growthof demand in long term
Energy demandOECD Countries: 0.7%
Non-OECD Countries: 2.5%India & China future key consumers
1980 : 8%
2005 : 18%
2030 : one quarter of world energy consumption(projected)

8/8/2019 Copy of Analysis of Power Sector
http://slidepdf.com/reader/full/copy-of-analysis-of-power-sector 5/38
Comparative Per CapitaConsumption Of Electricity (Kwh)

8/8/2019 Copy of Analysis of Power Sector
http://slidepdf.com/reader/full/copy-of-analysis-of-power-sector 6/38
:INDIAN power sector history
The process of electrification commenced in 1880 the establishment of asmall hydroelectric power station in Darjeeling
Commercial production and distribution started in 1889, in Kolkata
year 1947, the country had a power generating capacity of 1,362 MW by private utility companies
Post 1947, all new power generation, transmission and distribution in the
rural sector and the urban centers under the purview of State andCentral government agencies.
State Electricity Boards (SEBs) were formed in all the states.

8/8/2019 Copy of Analysis of Power Sector
http://slidepdf.com/reader/full/copy-of-analysis-of-power-sector 7/38
SECTOR:OVERVIEW
Predominantly controlled by public sector undertakings(PSUs)
65% of Total installed capacity is under PSUs
The consumption sector is divided into Commercial and Retailsector
Differential rates are applied on consumption on both the sectors
The power sector is regulated by The Electricity (Amendmend)Act 2007 AND The National Electricity Policy, 2005

8/8/2019 Copy of Analysis of Power Sector
http://slidepdf.com/reader/full/copy-of-analysis-of-power-sector 8/38
GENERATION
March ‘09,the installed power generation capacity stood at147,000 MW, 100 times the installed capacity of 1362 MW inthe year 1947.
The growth in generation during 2006-07 was 7.3% and in 2007-
08 was 6.33%
Heavy investment in recent years on renewable sources of energy
such as wind energy
Electricity generation:
Ø 75% by thermal power plants,Ø21% by hydroelectric power plants andØ4% by nuclear power plants.

8/8/2019 Copy of Analysis of Power Sector
http://slidepdf.com/reader/full/copy-of-analysis-of-power-sector 9/38
Segments in PowerGeneration

8/8/2019 Copy of Analysis of Power Sector
http://slidepdf.com/reader/full/copy-of-analysis-of-power-sector 10/38
SEGMENT WISE CAPACITY:
1. THERMAL POWER Current installed capacity :93392.64 MW or 63.3%.
Coal based power : 53.3%
Gas based power: 10.5 %
Oil based power.09%Maharashtra is the largest producer of thermal power in
the country.2. HYDRO POWER
Total potential : 600TWh
8/8/2019 Copy of Analysis of Power Sector
http://slidepdf.com/reader/full/copy-of-analysis-of-power-sector 11/38
CONTD…
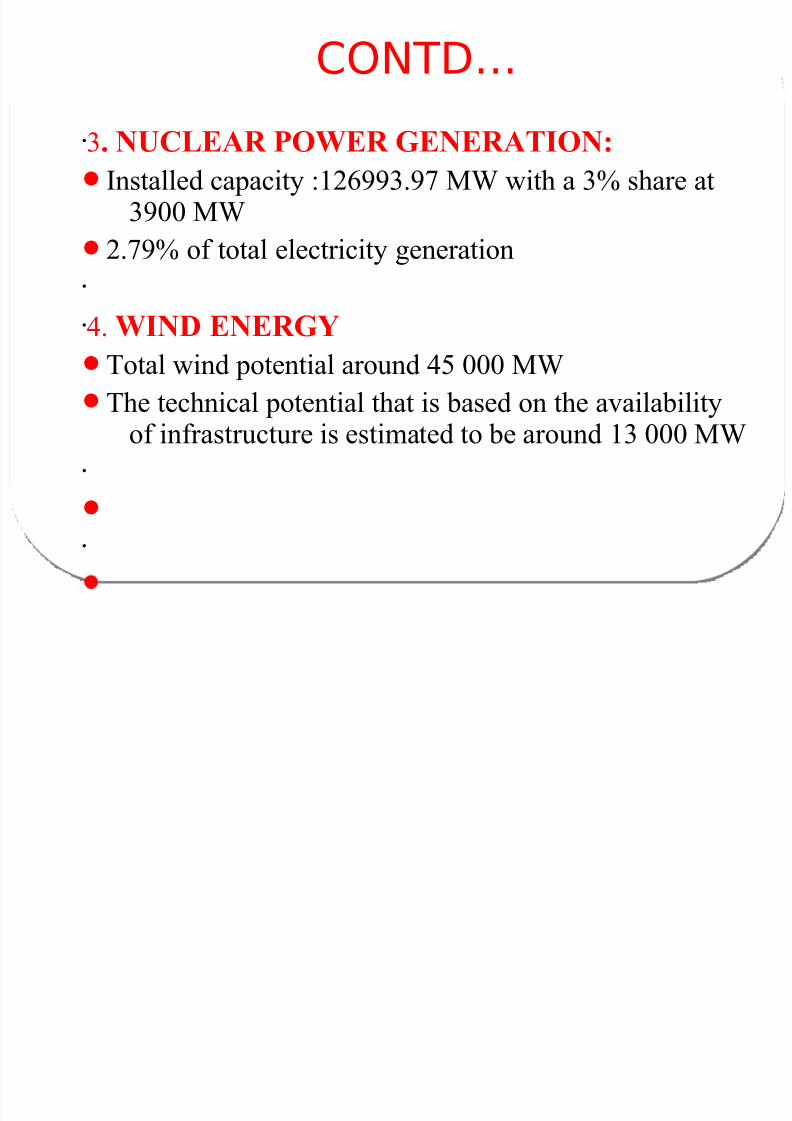
3. NUCLEAR POWER GENERATION:Installed capacity :126993.97 MW with a 3% share at
3900 MW
2.79% of total electricity generation
4. WIND ENERGY
Total wind potential around 45 000 MW
The technical potential that is based on the availabilityof infrastructure is estimated to be around 13 000 MW

8/8/2019 Copy of Analysis of Power Sector
http://slidepdf.com/reader/full/copy-of-analysis-of-power-sector 12/38
CONTD…
5. SOLAR ENERGYAverage intensity of solar radiation received on India is 200
MW/km square which amounts to 657.4 million MW
However, 12.5% of the land area amounting to 0.413 million
km square can be used

8/8/2019 Copy of Analysis of Power Sector
http://slidepdf.com/reader/full/copy-of-analysis-of-power-sector 13/38
DEMAND
The demand for energy has grown at an average of 3.6% p.a.over the past 30 years.
The total demand for electricity in India is expected to cross 950,000MW by 2030.
The gap between demand and supply has been ever increasing due to
faster rate of growth of demand
More than 50% of India's commercial energy demand is met through the
country's vast coal reserves,

8/8/2019 Copy of Analysis of Power Sector
http://slidepdf.com/reader/full/copy-of-analysis-of-power-sector 14/38
Source: http://www.indexmundi.com/India/electricity_production.html
Gap Between Demand And Supply Of Power

8/8/2019 Copy of Analysis of Power Sector
http://slidepdf.com/reader/full/copy-of-analysis-of-power-sector 15/38

8/8/2019 Copy of Analysis of Power Sector
http://slidepdf.com/reader/full/copy-of-analysis-of-power-sector 16/38
INDIAN ELECTRICITY CONSUMPTION

8/8/2019 Copy of Analysis of Power Sector
http://slidepdf.com/reader/full/copy-of-analysis-of-power-sector 17/38
10 TH PLAN:POWER SECTOR
The Tenth Plan for fiscal years 2002 to 2007 targeted acapacity addition of 41,110 MW
Subsequently revised to 30,641 MW
However at the end only 21,180 MW of capacity was
added.
“Planning is perfect but Path to achieve the target is not perfect”

8/8/2019 Copy of Analysis of Power Sector
http://slidepdf.com/reader/full/copy-of-analysis-of-power-sector 18/38
11 TH PLAN: HIGHLIGHTS To achieve the objectives of POWER FOR ALL BY 2012 National
Electric Policy has been designed.
To fulfill the objectives of the NEP, a capacity addition of 78,577 MWhas been proposed for the 11th plan.
This capacity addition is expected to provide a growth of 9.5 % to the power sector.
The total fund requirement for generation projects, during the EleventhPlan period is estimated at Rs. 4,108,960 million,
2,020,670 million for the central sector,
Rs. 1,237,920 million for the state sector Rs. 850,370 million for the private sector.
The total fund requirement includes the fund requirement estimated atRs. 1,891,950 million for start-up generation projects benefiting in theTwelfth Plan

8/8/2019 Copy of Analysis of Power Sector
http://slidepdf.com/reader/full/copy-of-analysis-of-power-sector 19/38
FACTORS DRIVING POWER DEVELOPMENT
Rising living standards of sizeable segments of population
Growth in the manufacturing sector and emergence of
India as a manufacturing destination in the world
Increasing urbanization
Thrust on rural electrification

8/8/2019 Copy of Analysis of Power Sector
http://slidepdf.com/reader/full/copy-of-analysis-of-power-sector 20/38
SHORTFALLS OF INDIAN POWERSECTOR
Electricity losses in India during transmission anddistribution are extremely high and vary between 30to 45%.
Due to shortage of electricity, power cuts are commonthroughout India and this has adversely effected thecountry's economic growth.
Theft of electricity, common in most parts of urban
India, amounts to 1.5% of India's GDP.
Around 56 percent of India’s rural population or 78million households do not have access to electricity.
8/8/2019 Copy of Analysis of Power Sector
http://slidepdf.com/reader/full/copy-of-analysis-of-power-sector 21/38
: “UTURE PLANS POWER FOR ALL BY”012
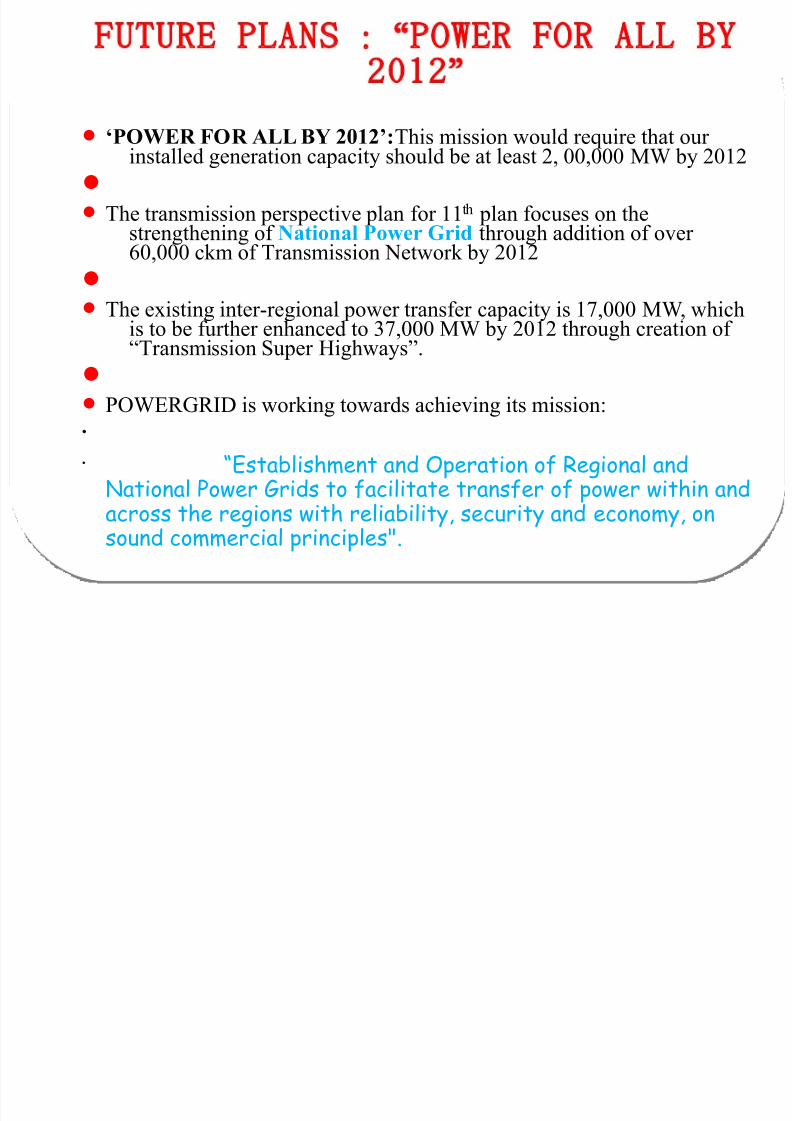
‘POWER FOR ALL BY 2012’:This mission would require that our installed generation capacity should be at least 2, 00,000 MW by 2012
The transmission perspective plan for 11th plan focuses on the
strengthening of National Power Grid through addition of over 60,000 ckm of Transmission Network by 2012
The existing inter-regional power transfer capacity is 17,000 MW, which
is to be further enhanced to 37,000 MW by 2012 through creation of “Transmission Super Highways”.
POWERGRID is working towards achieving its mission:
“Establishment and Operation of Regional andNational Power Grids to facilitate transfer of power within andacross the regions with reliability, security and economy, onsound commercial principles".

8/8/2019 Copy of Analysis of Power Sector
http://slidepdf.com/reader/full/copy-of-analysis-of-power-sector 22/38
COPMANIES IN POWER SECTOR
ELECTRICITY GENERATION
National Thermal Power Corporation (NTPC),
National Hydroelectric Power Corporation (NHPC) and
Nuclear Power Corporation of India (NPCI)
Maharashtra State Electricity Board (MSEB),
TRANSMISSION AND DISTRIBUTION State Electricity Boards (SEBs)
private companies.

8/8/2019 Copy of Analysis of Power Sector
http://slidepdf.com/reader/full/copy-of-analysis-of-power-sector 23/38
MOVEMENTS:

8/8/2019 Copy of Analysis of Power Sector
http://slidepdf.com/reader/full/copy-of-analysis-of-power-sector 24/38

8/8/2019 Copy of Analysis of Power Sector
http://slidepdf.com/reader/full/copy-of-analysis-of-power-sector 25/38
NATIONAL THERMAL POWER( )CORPORATION NTPC
NTPC, India’s largest power company, was set up in 1975 to accelerate power development in India.
Today it has emerged as an “Integrated power Major”, with a significant presence in the entire value chain of power generation business.
Its current generating capacity of 30144 MW
NTPC has embarked on plans to become a 75000 MW company by 2017
With 19.11 per cent of the country's capacity, NTPC accounted for 28.51 percent of the total power generation in India in the year 2007-08
KEY FINANCIAL VARIABLES

8/8/2019 Copy of Analysis of Power Sector
http://slidepdf.com/reader/full/copy-of-analysis-of-power-sector 26/38
RATIOS MAR’04 MAR’05 Mar’06 Mar’07 Mar’08
EBIT(%) 12.71 21.30 18.66 22.84 23.55
ROCE(%) 18.04 13.15 12.26 14.69 15.25
RONW(%) 14.64 13.90 12.95 14.13 14.08
D/ERATIO
0.43 0.42 0.46 0.52 0.54
CURRENTRATIO
1.59 1.72 2.11 2.42 2.32
EPS 6.73 7.04 7.06 8.33 8.99
DPS 1.39 2.40 2.80 3.2 3.5
ASSETT/O
.0 47 .0 52 .0 57 .0 65 .0 70
KEY FINANCIAL VARIABLES

8/8/2019 Copy of Analysis of Power Sector
http://slidepdf.com/reader/full/copy-of-analysis-of-power-sector 27/38
TATA POWER
Incorporated in the year 1919 at MumbaiIndia’s largest integrated private sector power utility,
Tata Power pioneered the generation of electricity in India.
The core business of Tata Power Company is to generate,transmit and distribute electricity.
Tata Power has an installed power generation capacity of above 2785 Mega Watts,
April’08, Tata Power completes the Signing of FinancialAgreements for 4000 MW Ultra Mega Power
Project,coming up at Mundra, GujaratThe cost of the project is estimated at INR 17000 crores(USD 4.2 billion).
KEY FINANCIAL VARIABLES

8/8/2019 Copy of Analysis of Power Sector
http://slidepdf.com/reader/full/copy-of-analysis-of-power-sector 28/38
RATIOS ’MAR 05 ’MAR 06 ’Mar 07 ’Mar 08 ’Mar 09
EBIT% .13 41 .11 90 .7 79 .10 38 .10 63
ROCE(%) .8 37 .8 69 .7 61 .6 96 .7 32
RONW(%) .10 82 .11 07 .11 63 .10 88 .10 66
D/ERATIO
.0 57 .0 51 .0 61 .0 39 .0 61CURRENTRATIO
.1 86 .2 18 .2 22 .1 78 .1 64
EPS .27 86 .30 85 .35 21 .39 42 .41 65
DPS .7 50 .8 50 .9 50 .10 50 .11 50ASSETT/O
.0 72 .0 77 .0 79 .0 91 .0 81
KEY FINANCIAL VARIABLES

8/8/2019 Copy of Analysis of Power Sector
http://slidepdf.com/reader/full/copy-of-analysis-of-power-sector 29/38

8/8/2019 Copy of Analysis of Power Sector
http://slidepdf.com/reader/full/copy-of-analysis-of-power-sector 30/38
Porter’s Five Force Model
BARRIERS TO ENTRY:
Heavy investmentFuel linkagePayment guarantees fromState GovernmentsRetail distribution
licensed, etc.
SUBSTITUTES:
BiomassRenewable Source Of India
BARGAINING POWER OF
SUPPLIERS:
Not very high asGovernment controls tariff structure.
BARGAINING POWER OF
BUYERS:Low power of retail customers islowGovt is a big buyer and paymentby Govt can be more erratic
COMPETETORS
Not very HighCurrently due to highdemand

8/8/2019 Copy of Analysis of Power Sector
http://slidepdf.com/reader/full/copy-of-analysis-of-power-sector 31/38
Power sector Life cycle stage
Power sector is now in growth or expansionstage

8/8/2019 Copy of Analysis of Power Sector
http://slidepdf.com/reader/full/copy-of-analysis-of-power-sector 32/38
:O P P U R T U N IT IE S

8/8/2019 Copy of Analysis of Power Sector
http://slidepdf.com/reader/full/copy-of-analysis-of-power-sector 33/38
THREATS

8/8/2019 Copy of Analysis of Power Sector
http://slidepdf.com/reader/full/copy-of-analysis-of-power-sector 34/38
:FUTURE OF POWER SECTOR DEPENDS UPON
Ensuring Adequate Supply of Coal with Consistent Quality
Ensuring Availability of Gas for Power Generation:
Power Sector Reforms
Reduction in Cost of Power
Rationalization of Fuel Prices
Energy Efficiency and Demand Side Management
Role of Nuclear and Hydro Power
Role of Renewable

8/8/2019 Copy of Analysis of Power Sector
http://slidepdf.com/reader/full/copy-of-analysis-of-power-sector 35/38
IMPACT OF BUDGET Increasing investment in infrastructure to above 9% of GDP by 2014 IN
POWER SECTOR The Accelerated Power Development and Reforms Program (APDRP),
which is aimed to increase reliability and quality of power supply hasgot increased budget allocation to Rs 2,080 crore for 2009-10 fromRs.800 crore for 2008-09.
Expected to provide more funds in the hands of the state distribution
utilities to upgrade their network, infrastructure and improve their financial position
The Rajiv Gandhi Grameen Vidyutikaran Yojana (RGGVY), launched bythe Central Government in 2005 to provide access to electricity to allhousehold in India by 2012, has received budget allocation to Rs 7,000crore for 2009-10 from Rs 5,500 crore for 2008-09.
The proposed National Gas Grid will be beneficial for power generation asit would enable setting up of gas-based power plants near centres of consumption along the gas grid

8/8/2019 Copy of Analysis of Power Sector
http://slidepdf.com/reader/full/copy-of-analysis-of-power-sector 36/38

8/8/2019 Copy of Analysis of Power Sector
http://slidepdf.com/reader/full/copy-of-analysis-of-power-sector 37/38
CONTD…
6. NTPC, Tata Power & Neyveli Lignite show positivegrowth
7. Companies reported growth (Such as NTPC of 14%
YoY net sales & 6% YoY profit in FY09)8. Government taking steps to enhance competition in themarket

8/8/2019 Copy of Analysis of Power Sector
http://slidepdf.com/reader/full/copy-of-analysis-of-power-sector 38/38