Embed Size (px)
Citation preview

copyright © 2003 McGraw Hill Ryerson Limited
2-12-1
prepared by:Carol EdwardsBA, MBA, CFA
Instructor, FinanceBritish Columbia Institute of Technology
Fundamentals
of Corporate
Finance
Second Canadian Edition

copyright © 2003 McGraw Hill Ryerson Limited
2-22-2
Chapter 2Accounting and Finance
Chapter Outline The Balance Sheet The Income Statement The Statement of Cash Flows Accounting for Differences Taxes

copyright © 2003 McGraw Hill Ryerson Limited
2-32-3
Introduction• Monitoring a firm’s performance and financial strength: All the stakeholders in a corporation – the
shareholders, lenders, directors, management and employees – have an interest in the company’s success.
Therefore all of them need to monitor its progress.
Question: How is this done?

copyright © 2003 McGraw Hill Ryerson Limited
2-42-4
Introduction• ‘Accounting’ for Performance
The company’s management prepares regular financial accounts.
These provide the information necessary to gauge performance and the firm’s financial strength.
Management arrange for an independent firm of auditors to certify the accuracy of these accounts.

copyright © 2003 McGraw Hill Ryerson Limited
2-52-5
Introduction• ‘Accounting’ for Performance
The types of financial statements which are prepared are called:The Balance SheetThe Income StatementThe Statement of Cash Flows

copyright © 2003 McGraw Hill Ryerson Limited
2-62-6
The Balance Sheet•Financial statement which shows the value of the firm’s assets and liabilities at a particular time. A Balance Sheet is a financial statement
which tells you:What a firm owns – the firm’s assets. Where the money to buy those assets came
from – the firm’s liabilities plus the firm’s shareholders’ equity.

copyright © 2003 McGraw Hill Ryerson Limited
2-72-7
The Balance Sheet• Structure of the Balance Sheet
Assets are shown on the left hand side (LHS) of the Balance Sheet.
Liabilities and shareholders’ equity are shown on the right hand side (RHS) of the Balance Sheet.
It is called a ‘balance’ sheet becausethe total on the LHS must always
equal the total on the RHS.

copyright © 2003 McGraw Hill Ryerson Limited
2-82-8
The Balance Sheet• Structure of the Balance Sheet
Look at the figures for the Balance Sheet of Molson Inc. for 2001:
=
TOTAL ASSETS
$3,280.8
LIABILITIES
+
SHAREHOLDERS’ EQUITY
$3,280.8
* Note that the two sides balance or are equal.

copyright © 2003 McGraw Hill Ryerson Limited
2-92-9
The Balance Sheet•Summary: Balance Sheet Structure
The LHS and the RHS of the Balance Sheet are subdivided into various categories as shown on the next slide.

copyright © 2003 McGraw Hill Ryerson Limited
2-102-10
The Balance Sheet
=
ASSETS
Current Assets 432.4
Net Fixed Assets 914.9
Intangible Assets 1518.8
Other Assets 414.7
Total Assets 3280.8
LIABILITIES &SHAREHOLDERS’ EQUITY
Current Liabilities 618.4
Long Term Debt 1204.4
Other LT Liabilities 662.6
Total Liabilities 2485.4Total Shareholders’Equity 795.4
Total Liabilities &Shareholders’ Equity 3280.8
•Summary: Balance Sheet StructureMolson Inc. for 2001:

copyright © 2003 McGraw Hill Ryerson Limited
2-112-11
The Balance Sheet• Current Assets
Current assets are the most liquid assets. They are assets which are likely to be used
or turned into cash in the near future. Current assets are further subdivided into
several other categories.

copyright © 2003 McGraw Hill Ryerson Limited
2-122-12
The Balance Sheet• Current Assets
Cash and Marketable Securities Molson had $70.1 million in 2001
Accounts Receivable Molson had $102.3 million in 2001
Inventories Molson had $138.9 million in 2001
Other Current Assets Molson had $121.1 million in 2001
Total Current Assets Molson had $432.4 million in 2001

copyright © 2003 McGraw Hill Ryerson Limited
2-132-13
The Balance Sheet• Non-Current Assets
The second part of the Balance Sheet includes long term assets which are unlikely to be turned into cash soon.
These assets are broken into several categories: Net Fixed Assets. Intangible Assets. Other Assets.

copyright © 2003 McGraw Hill Ryerson Limited
2-142-14
The Balance Sheet•Net Fixed Assets
A firm uses long lived assets such as buildings, plant, equipment and vehicles in its operations.
These assets are known as fixed assets.

copyright © 2003 McGraw Hill Ryerson Limited
2-152-15
The Balance Sheet•Net Fixed Assets
Fixed assets are shown on the Balance Sheet at their original cost net of accumulated depreciation.
Depreciation is an estimate of how much of an asset is “used up” every year.

copyright © 2003 McGraw Hill Ryerson Limited
2-162-16
The Balance Sheet• Intangible Assets
A firm also uses long lived assets such as brand names, patents, copyrights, skilled management and a well trained workforce.
These assets have no physical reality, but they do confer benefits on the firm.
They are known as intangible assets.

copyright © 2003 McGraw Hill Ryerson Limited
2-172-17
The Balance Sheet• Liabilities and Shareholders’ Equity
The RHS of the Balance Sheet consists of liabilities and shareholders’ equity.
The RHS shows where the money came from to acquire the assets on the Balance Sheet: Liabilities represent money owed by the firm to its
creditors. Shareholders’ equity is the amount of money
contributed to the firm by its owners.

copyright © 2003 McGraw Hill Ryerson Limited
2-182-18
The Balance Sheet•Liabilities
Like the assets on the LHS, the liabilities are sub-divided into several categories: Current Liabilities.Long Term Debt.Other Long-Term Liabilities.

copyright © 2003 McGraw Hill Ryerson Limited
2-192-19
The Balance Sheet• Liabilities
Current liabilities are short term obligations which are likely to be paid off rapidly. For example: Bank debt and accounts payable.
Long term liabilities represent debts that come due after the end of the year: They are long term financial obligations to various
parties, including banks, bondholders and other creditors.

copyright © 2003 McGraw Hill Ryerson Limited
2-202-20
The Balance Sheet• Shareholders’ Equity
A firm’s liabilities are financial obligations which it owes to various parties.
What is left over after all of these liabilities have been paid off belongs to the shareholders.
This “residual” figure is known as shareholders’ equity.

copyright © 2003 McGraw Hill Ryerson Limited
2-212-21
The Balance Sheet• Structure of the Balance Sheet
Look at the figures for the Balance Sheet of Molson Inc. for 2001:
RHS = $3,280.8
LIABILITIESPAY OFF THE
SHAREHOLDERS’ EQUITYTO LEAVE THE
$2,485.4
$795.4

copyright © 2003 McGraw Hill Ryerson Limited
2-222-22
The Balance Sheet•Shareholders’ Equity
Shareholders’ equity is further subdivided into two main categories: Capital represents amounts raised from
the sale of the company’s shares to investors.
Retained earnings represents earnings which the management has retained and reinvested in the firm.

copyright © 2003 McGraw Hill Ryerson Limited
2-232-23
Book Value vs Market Value• Book Value Market Value
Assets are recorded on the Balance Sheet at their historic cost – what it cost to acquire them.
Assets do not last forever, so the historic cost must be adjusted every year to reflect “wear and tear”.This adjustment is called depreciation. Historic cost less accumulated depreciation is
known as the book value of the asset.

copyright © 2003 McGraw Hill Ryerson Limited
2-242-24
Book Value vs Market Value• Book Value Market Value
Assets belonging to the firm may be resold in the market.
The price at which the firm can resell an asset is known as its market value.Market value reflects the price that an informed
buyer would pay for that asset.Market value does not reflect the historic value
at which the asset was recorded on the firm’s books.

copyright © 2003 McGraw Hill Ryerson Limited
2-252-25
Book Value vs Market Value• Book Value Market Value
EXAMPLE: Your firm purchases a truck for $50,000. Your accountant estimates that the truck will
have a useful life of 10 years.Depreciation will be $50,000/10 years or $5,000
per year. Your firm keeps the truck for 2 years and
then decides to sell it.
copyright © 2003 McGraw Hill Ryerson Limited
2-262-26
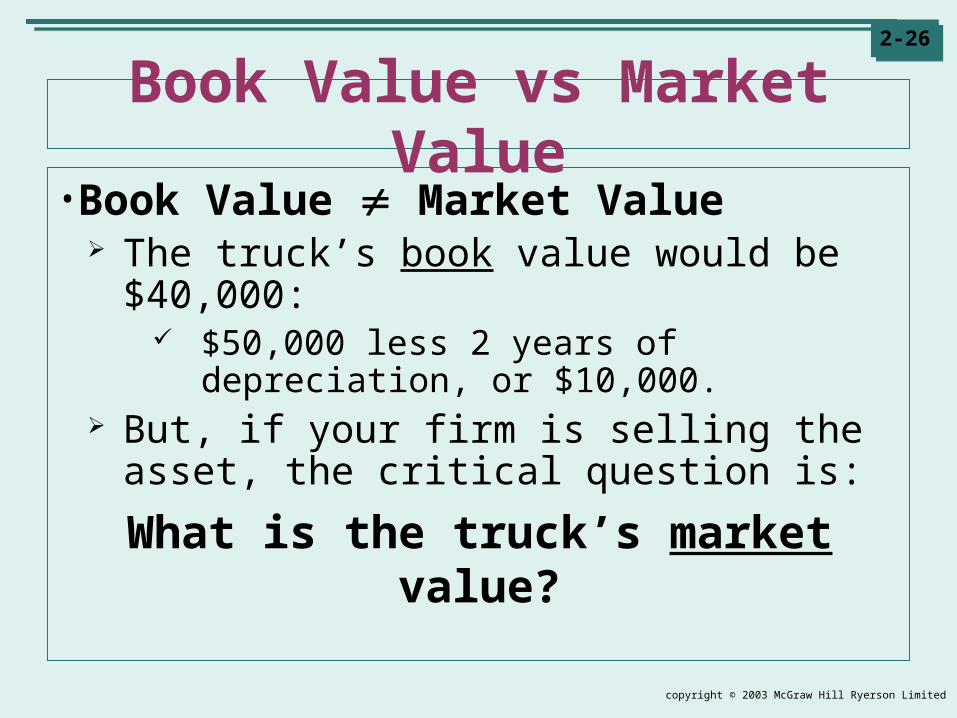
Book Value vs Market Value• Book Value Market Value
The truck’s book value would be $40,000: $50,000 less 2 years of depreciation, or
$10,000. But, if your firm is selling the asset, the
critical question is:
What is the truck’s market value?

copyright © 2003 McGraw Hill Ryerson Limited
2-272-27
Book Value vs Market Value•Book Value Market Value
Suppose there is a shortage of such trucks and they are in high demand. In this case, the market value would be
more than the $40,000 book value.The firm may find it can sell the truck for
$45,000.

copyright © 2003 McGraw Hill Ryerson Limited
2-282-28
Book Value vs Market Value•Book Value Market Value
Suppose the truck has not been well maintained and its engine block is cracked.In this case, the market value would be
less than the $40,000 book value.The firm may find it can sell the truck for
only $12,000.

copyright © 2003 McGraw Hill Ryerson Limited
2-292-29
Book Value vs Market Value•Book Value Market Value
Note that depreciation does not reflect the actual loss in market value.
It is merely an estimate of how much “wear and tear” an asset will be subject to as the firm uses it in its operations.

copyright © 2003 McGraw Hill Ryerson Limited
2-302-30
Book Value vs Market Value• Book Value Market Value
Shareholders’ equity is also recorded at book value; however, investors are more concerned with its market value. Usually the market value of a firm’s equity exceeds
its book value, because successful managers seek out projects which are worth more than they cost:
MARKET VALUE
(Worth)
BOOK VALUE
(Historic Cost)>

copyright © 2003 McGraw Hill Ryerson Limited
2-312-31
The Income Statement• Financial statement which shows the revenues, expenses and net income of a firm. The Income Statement shows how profitable
a firm has been over the past year. It shows what the firms earns from selling its
products, or services, less the cost of operations, the cost of servicing its debt, and taxes.

copyright © 2003 McGraw Hill Ryerson Limited
2-322-32
The Income Statement• Structure of the Income Statement
At the bottom of the Income Statement, are the net earnings, or profits.
Profits belong to the shareholders. Profits may be returned to the shareholders as
dividends. Or the firm may retain them, reinvesting them in
the firm’s operations. These reinvested earnings should make the
shareholder’s shares more valuable.
copyright © 2003 McGraw Hill Ryerson Limited
2-332-33
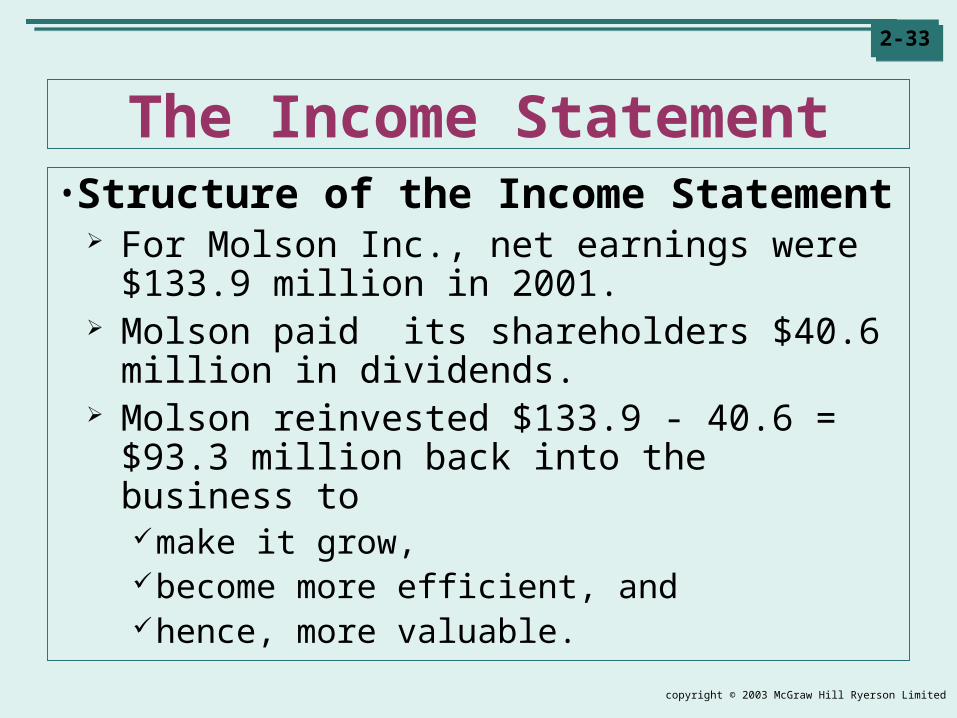
The Income Statement• Structure of the Income Statement
For Molson Inc., net earnings were $133.9 million in 2001.
Molson paid its shareholders $40.6 million in dividends.
Molson reinvested $133.9 - 40.6 = $93.3 million back into the business to make it grow, become more efficient, and hence, more valuable.

copyright © 2003 McGraw Hill Ryerson Limited
2-342-34
Statement of Cash Flows• Financial statement which shows a firm’s cash receipts and expenditures. A firm needs cash to purchase assets.
Thus the firm must keep track of the cash coming in and going out.
But, the firm’s Income Statement shows its profits not its cash flows.Net earnings can be quite different from cash
flows for a number of reasons.

copyright © 2003 McGraw Hill Ryerson Limited
2-352-35
Statement of Cash Flows• Profit vs Cash Flows
Differences: The Income Statement does not deduct
expenditures on fixed assets, even though cash was paid for them. Instead, the Income Statement deducts
depreciation, a non-cash expense. The Income Statement uses accrual
accounting: It shows revenues and expenses at the time of the
sale, not when the cash exchange actually occurs.

copyright © 2003 McGraw Hill Ryerson Limited
2-362-36
Statement of Cash Flows•Profit vs Cash Flows
For these reasons, a firm needs another statement, the Statement of Cash Flows, to track its cash inflows and outflows.
copyright © 2003 McGraw Hill Ryerson Limited
2-372-37
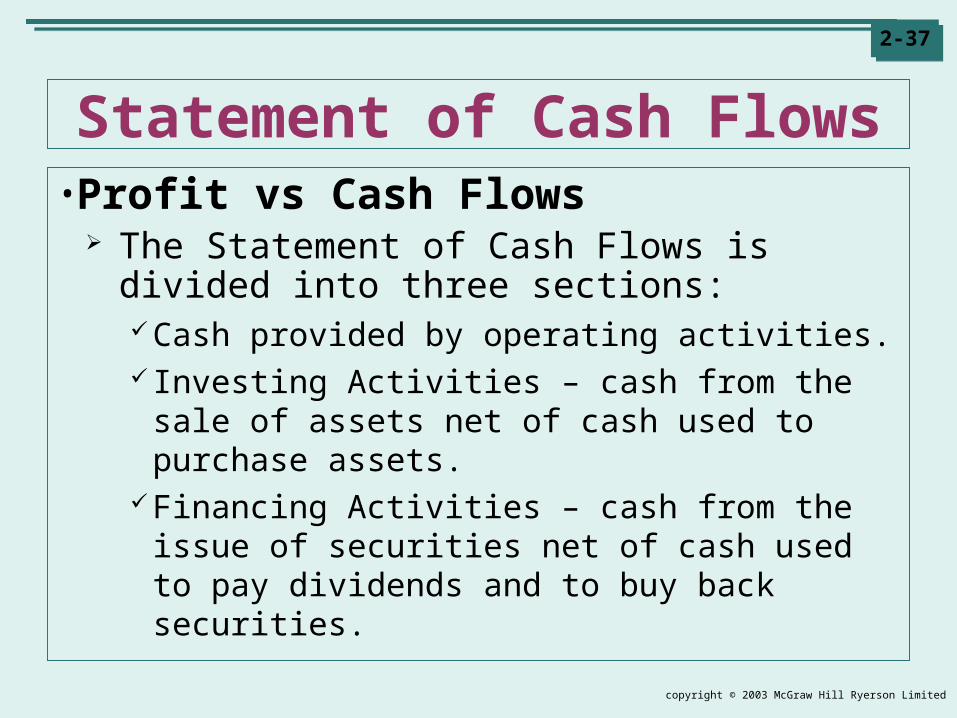
Statement of Cash Flows•Profit vs Cash Flows
The Statement of Cash Flows is divided into three sections:Cash provided by operating activities. Investing Activities – cash from the sale of
assets net of cash used to purchase assets.Financing Activities – cash from the issue of
securities net of cash used to pay dividends and to buy back securities.

copyright © 2003 McGraw Hill Ryerson Limited
2-382-38
Taxes• Impact on Financial Decisions
Taxes have a major effect on financial decisions.Thus it is essential to understand how
corporations and investors are taxed.

copyright © 2003 McGraw Hill Ryerson Limited
2-392-39
Taxes• Corporate Taxes
Corporations pay taxes on their income. For most Canadian companies:
Corporate tax rate = federal tax rate + provincial tax rate The federal tax rate is 27%.
To assist small businesses, this rate is reduced to 12%.
Provincial taxes vary across the country.Sample provincial rates can be seen in Table
2.4.

copyright © 2003 McGraw Hill Ryerson Limited
2-402-40
Taxes• Consequences of Deducting Interest
Interest paid by a corporation is a tax deductible expense.
Dividends are not. The result: interest payments increase the
amount of money available to creditors and shareholders. They do this by decreasing the amount of money
paid to the government in taxes.
copyright © 2003 McGraw Hill Ryerson Limited
2-412-41
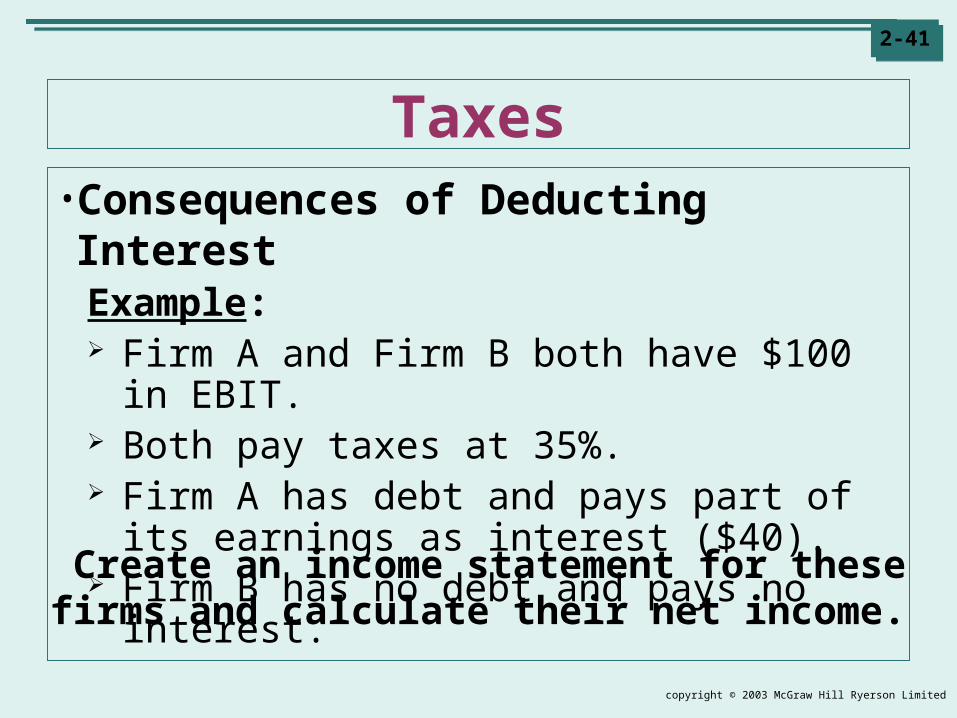
Taxes• Consequences of Deducting Interest
Example: Firm A and Firm B both have $100 in EBIT. Both pay taxes at 35%. Firm A has debt and pays part of its earnings
as interest ($40). Firm B has no debt and pays no interest.
Create an income statement for thesefirms and calculate their net income.

copyright © 2003 McGraw Hill Ryerson Limited
2-422-42
Taxes• Consequences of Deducting Interest
Firm A Firm B
EBIT $100 $100Less: Interest 40 0Pretax Income 60 100Less: Taxes (35%) 21 35Net Income $ 39 $ 65
copyright © 2003 McGraw Hill Ryerson Limited
2-432-43
Taxes• Consequences of Deducting Interest
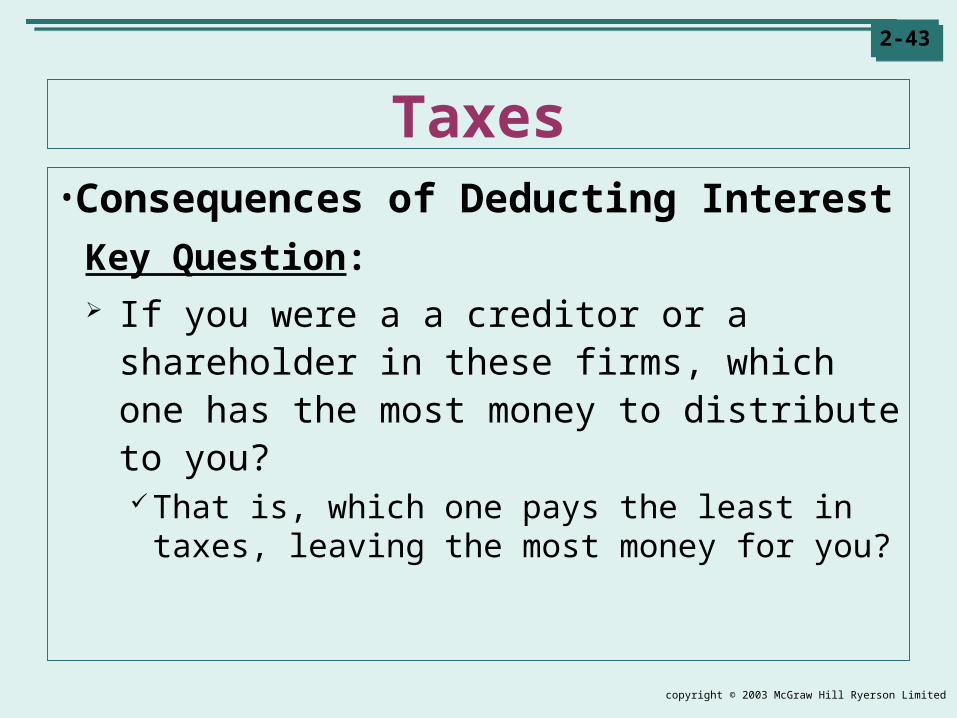
Key Question: If you were a a creditor or a shareholder in
these firms, which one has the most money to distribute to you?That is, which one pays the least in taxes,
leaving the most money for you?

copyright © 2003 McGraw Hill Ryerson Limited
2-442-44
Taxes• Consequences of deducting interest
Government’s share (taxes) Stakeholder’s share (interest + net income)
Distribution of EBIT:
Government’s share + (Creditor’s Share + Shareholder’s Share)
Firm B = $35 + ($0 + $65) = $35 + 65= $100
$21$79
FIRM A
$35$65
FIRM B
Firm A = $21 + ($40 + $39) = $21 + $79= $100

copyright © 2003 McGraw Hill Ryerson Limited
2-452-45
Taxes• Personal Taxes
For individual taxpayers, federal and provincial taxes are calculated separately.
Taxes for individuals are progressive.That is, the higher your personal income, the
higher your tax rate. Sample federal and provincial rates can be
seen in Table 2.6.

copyright © 2003 McGraw Hill Ryerson Limited
2-462-46
Summary of Chapter 2 Investors and other stakeholders need regular
financial information to monitor a firm’s progress. They find this information on the:
Balance Sheet. Income Statement. Statement of Cash Flows.
Assets are recorded on the Balance Sheet at book value. Book value = historic cost – accumulated
depreciation. Book value does not equal market value!

copyright © 2003 McGraw Hill Ryerson Limited
2-472-47
Summary of Chapter 2 Accounting income on an Income Statement
is not the same as a firm’s cash flows. There are two reasons why income is not the
same as cash flow:1) Investments in fixed assets are not deducted
immediately from revenues. Instead they are spread out over the life of the
equipment.
2) Revenues and expenses are recorded when a sale occurs, not when the cash is actually received or distributed.

copyright © 2003 McGraw Hill Ryerson Limited
2-482-48
Summary of Chapter 2 Taxes have a major impact on financial
decisions. In Canada, both corporations and individuals
must pay taxes on their earnings. The method of calculating taxes for a
corporation is different from the method used by individuals.
For individuals, capital gains and Canadian dividends are taxed differently from salary and interest.