Embed Size (px)
Citation preview
Copyright 2007 Prentice Hall Ch 6 -1
Chapter 6Strategy Analysis & Choice
Strategic Management:
Concepts & Cases
11th Edition
Fred David
Copyright 2007 Prentice Hall Ch 6 -2
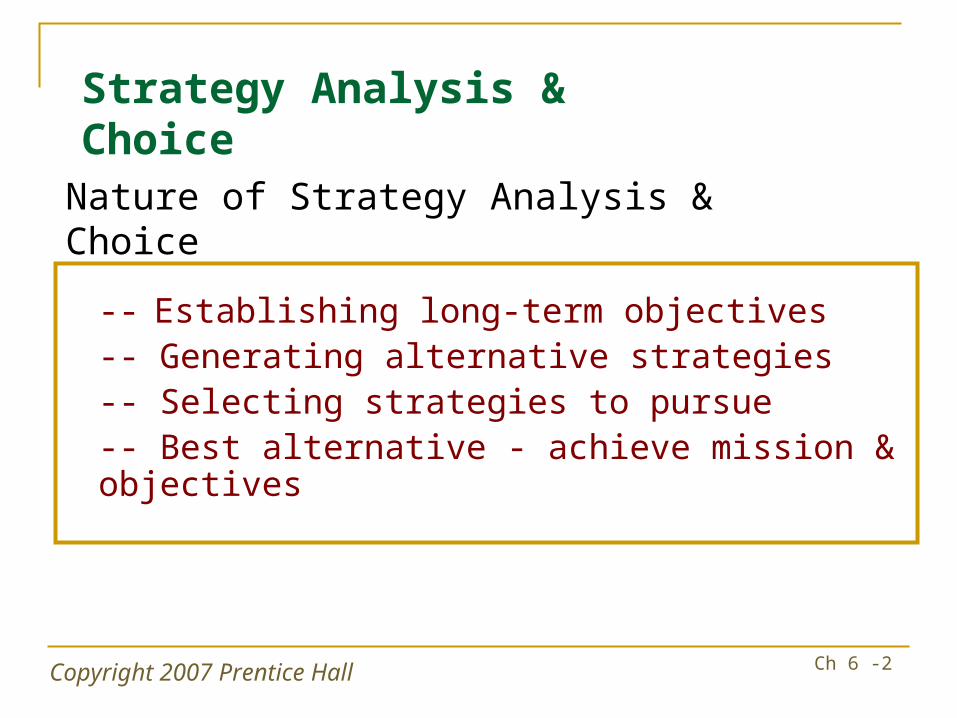
-- Establishing long-term objectives-- Generating alternative strategies-- Selecting strategies to pursue-- Best alternative - achieve mission & objectives
Nature of Strategy Analysis & Choice
Strategy Analysis & Choice
Copyright 2007 Prentice Hall Ch 6 -3
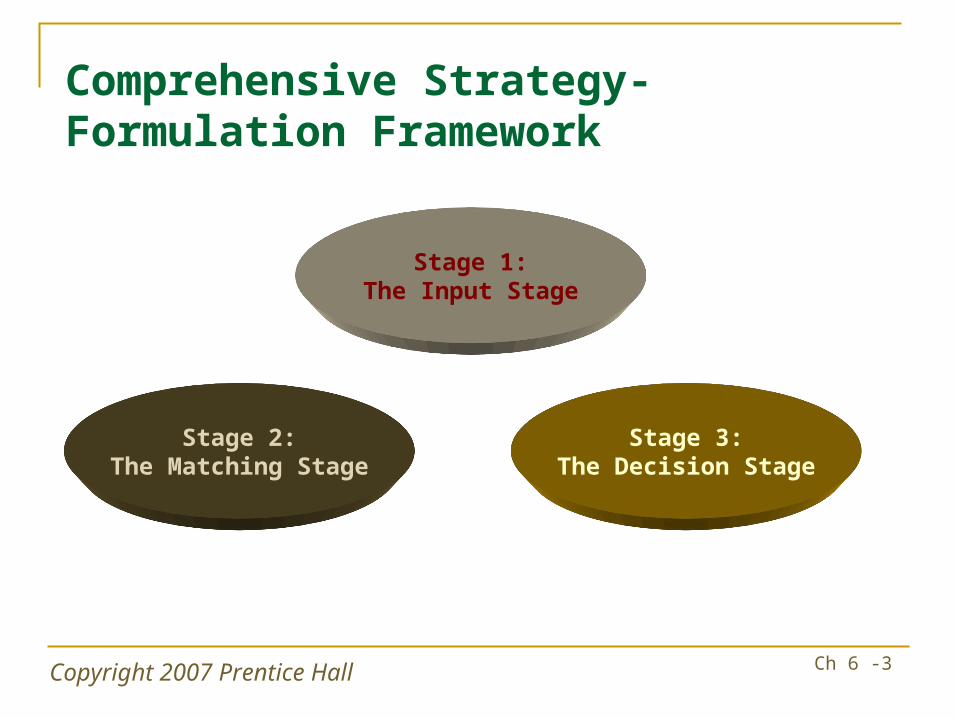
Comprehensive Strategy-Formulation Framework
Stage 1:The Input Stage
Stage 2:The Matching Stage
Stage 3:The Decision Stage
Copyright 2007 Prentice Hall Ch 6 -4
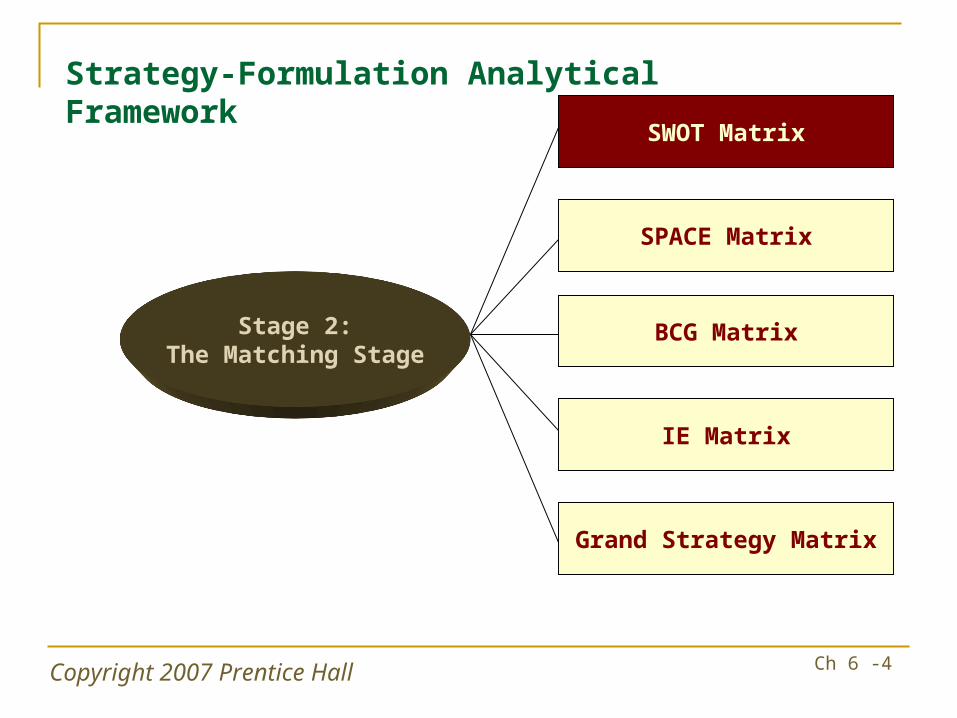
Strategy-Formulation Analytical Framework
SWOT Matrix
SPACE Matrix
BCG Matrix
IE Matrix
Grand Strategy Matrix
Stage 2:The Matching Stage
Copyright 2007 Prentice Hall Ch 6 -5
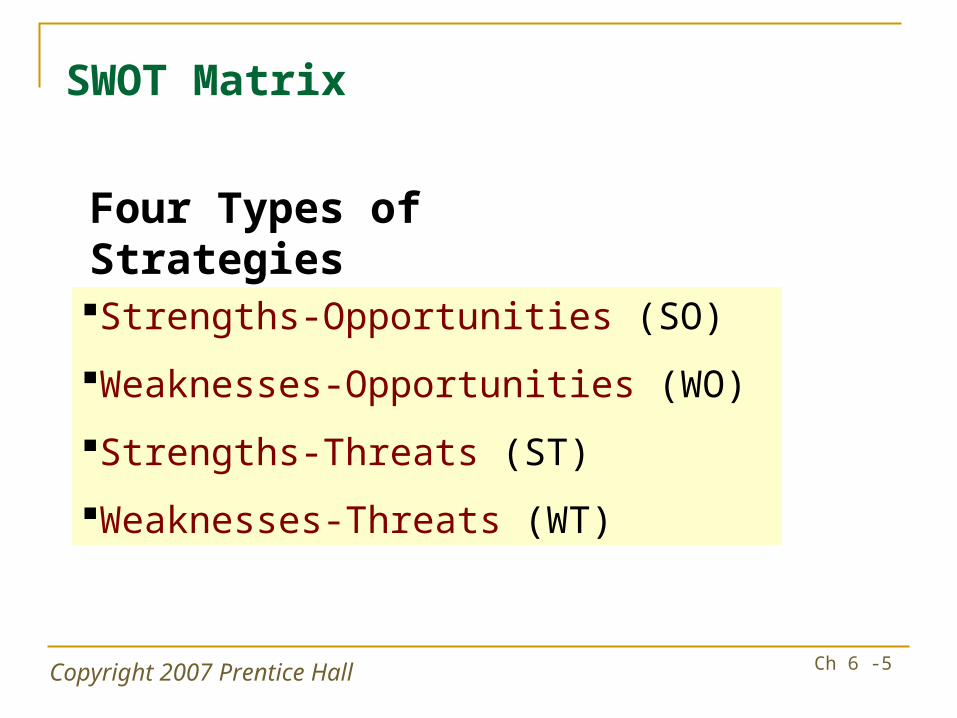
SWOT Matrix
Strengths-Opportunities (SO)
Weaknesses-Opportunities (WO)
Strengths-Threats (ST)
Weaknesses-Threats (WT)
Four Types of Strategies
Copyright 2007 Prentice Hall Ch 6 -6
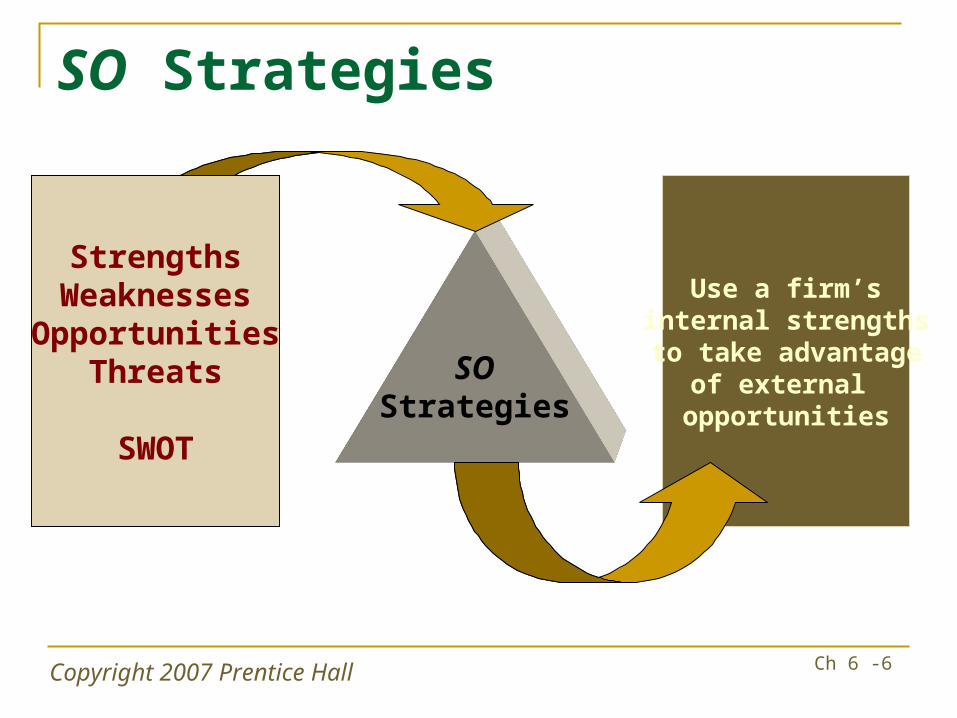
SO Strategies
Use a firm’sinternal strengthsto take advantage
of external opportunities
SOStrategies
StrengthsWeaknesses
OpportunitiesThreats
SWOT

Copyright 2007 Prentice Hall Ch 6 -7
WO Strategies
Improving internalweaknesses by
taking advantageof external
opportunities
WOStrategies
StrengthsWeaknesses
OpportunitiesThreats
SWOT
Copyright 2007 Prentice Hall Ch 6 -8
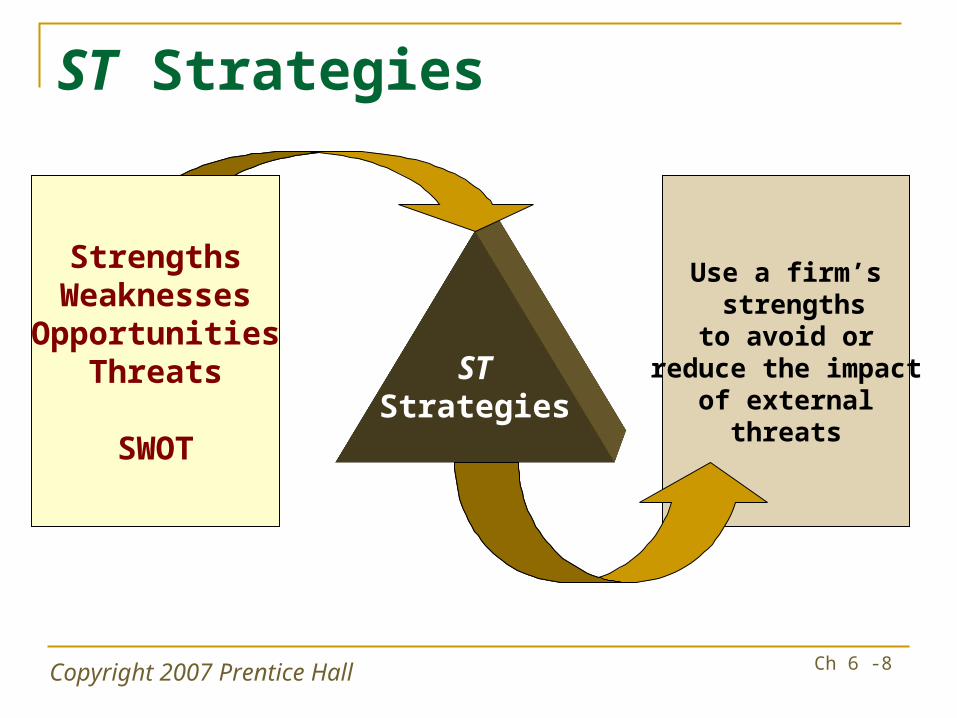
ST Strategies
Use a firm’s strengthsto avoid or
reduce the impactof external
threats
STStrategies
StrengthsWeaknesses
OpportunitiesThreats
SWOT

Copyright 2007 Prentice Hall Ch 6 -9
WT Strategies
Defensive tacticsaimed at reducing
internal weaknesses &
avoidingenvironmental
threats
WTStrategies
StrengthsWeaknesses
OpportunitiesThreats
SWOT
Copyright 2007 Prentice Hall Ch 6 -10
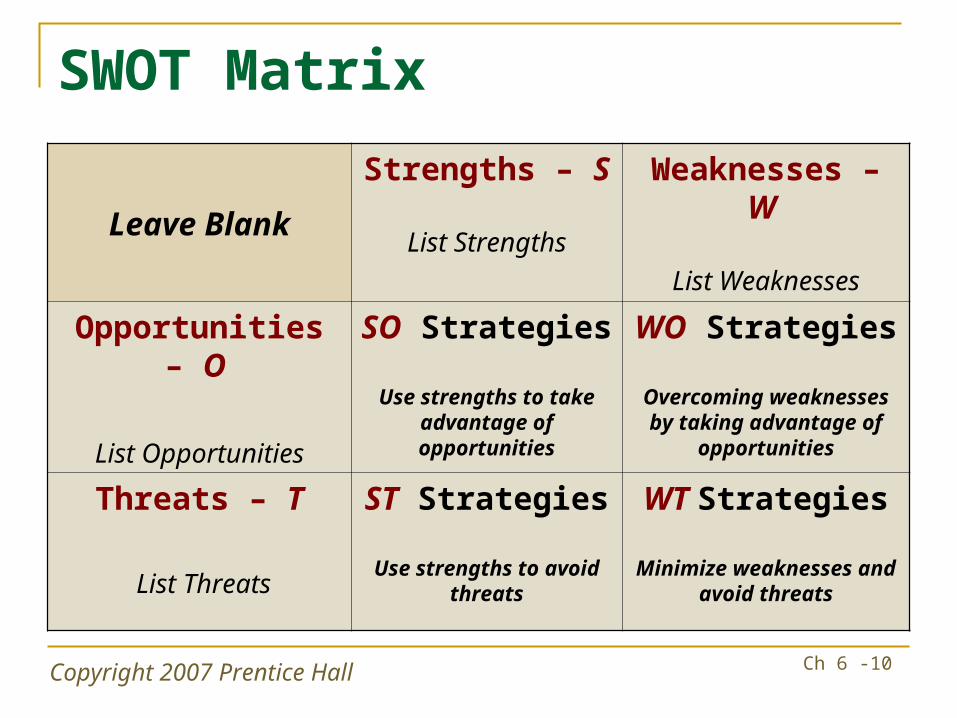
SWOT Matrix
Leave Blank
Strengths – S
List Strengths
Weaknesses – W
List Weaknesses
Opportunities – O
List Opportunities
SO Strategies
Use strengths to take advantage of opportunities
WO Strategies
Overcoming weaknesses by taking advantage of
opportunities
Threats – T
List Threats
ST Strategies
Use strengths to avoid threats
WT Strategies
Minimize weaknesses and avoid threats
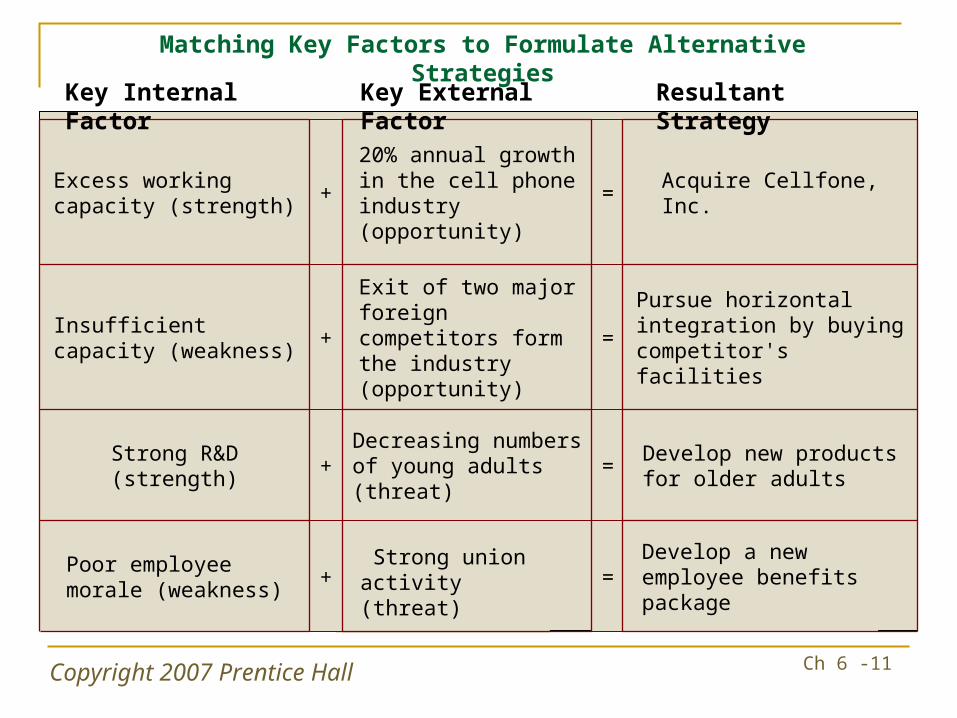
Copyright 2007 Prentice Hall Ch 6 -11
Develop a new employee benefits package
= Strong union activity (threat)
+Poor employee morale (weakness)
Develop new products for older adults
=Decreasing numbers of young adults (threat)
+Strong R&D (strength)
Pursue horizontal integration by buying competitor's facilities
=Exit of two major foreign competitors form the industry (opportunity)
+Insufficient capacity (weakness)
Acquire Cellfone, Inc.=20% annual growth in the cell phone industry (opportunity)
+Excess working capacity (strength)
Key Internal Factor Key External Factor Resultant Strategy
Matching Key Factors to Formulate Alternative Strategies
Copyright 2007 Prentice Hall Ch 6 -12
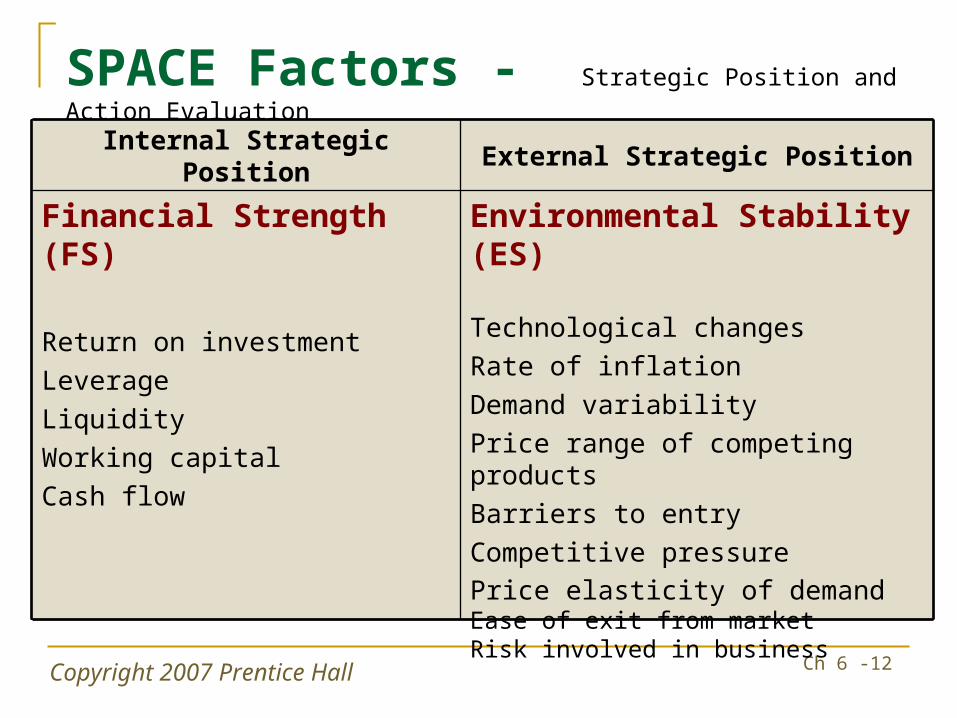
SPACE Factors - Strategic Position and Action Evaluation
Environmental Stability (ES)
Technological changes
Rate of inflation
Demand variability
Price range of competing products
Barriers to entry
Competitive pressure
Price elasticity of demandEase of exit from market Risk involved in business
Financial Strength (FS)
Return on investment
Leverage
Liquidity
Working capital
Cash flow
External Strategic PositionInternal Strategic Position
Copyright 2007 Prentice Hall Ch 6 -13
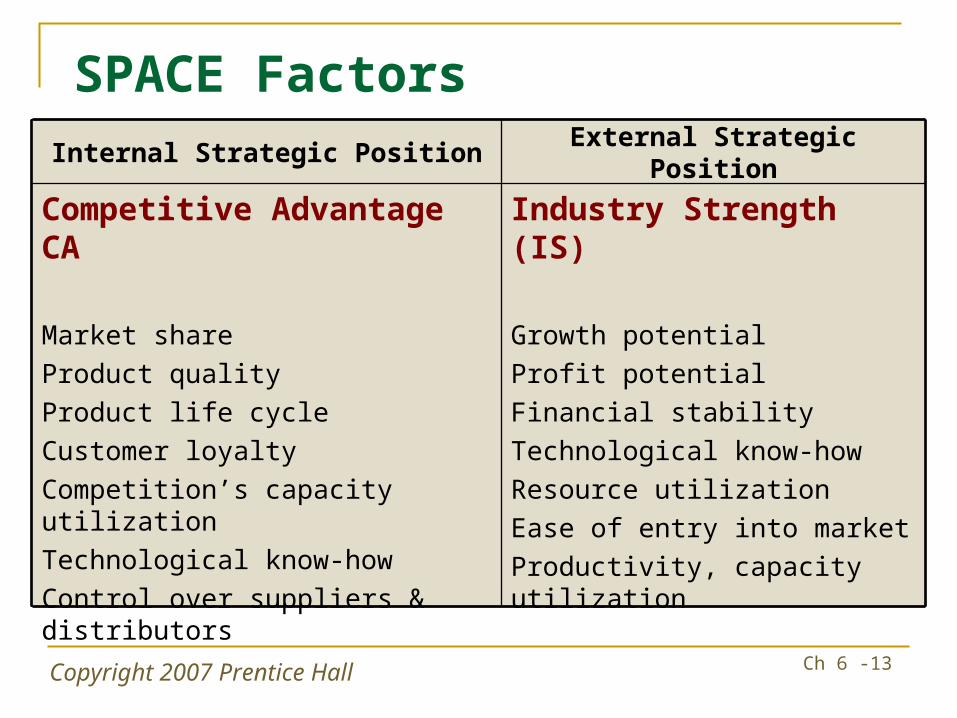
SPACE Factors
Industry Strength (IS)
Growth potential
Profit potential
Financial stability
Technological know-how
Resource utilization
Ease of entry into market
Productivity, capacity utilization
Competitive Advantage CA
Market share
Product quality
Product life cycle
Customer loyalty
Competition’s capacity utilization
Technological know-how
Control over suppliers & distributors
External Strategic PositionInternal Strategic Position
Copyright 2007 Prentice Hall Ch 6 -14
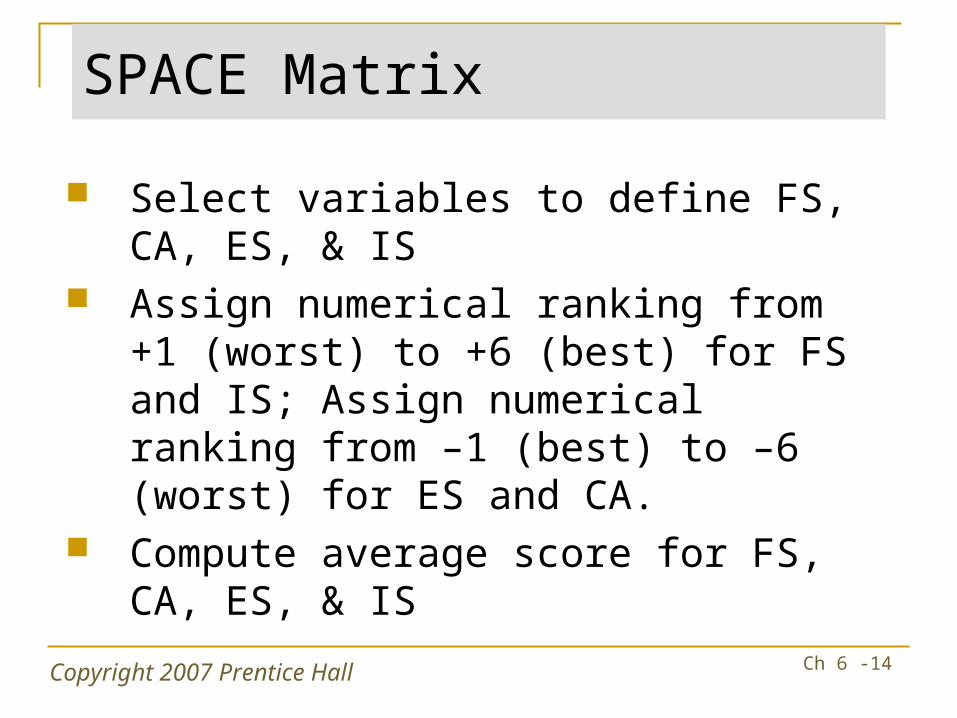
SPACE Matrix
Select variables to define FS, CA, ES, & IS
Assign numerical ranking from +1 (worst) to +6 (best) for FS and IS; Assign numerical ranking from –1 (best) to –6 (worst) for ES and CA.
Compute average score for FS, CA, ES, & IS
Copyright 2007 Prentice Hall Ch 6 -15
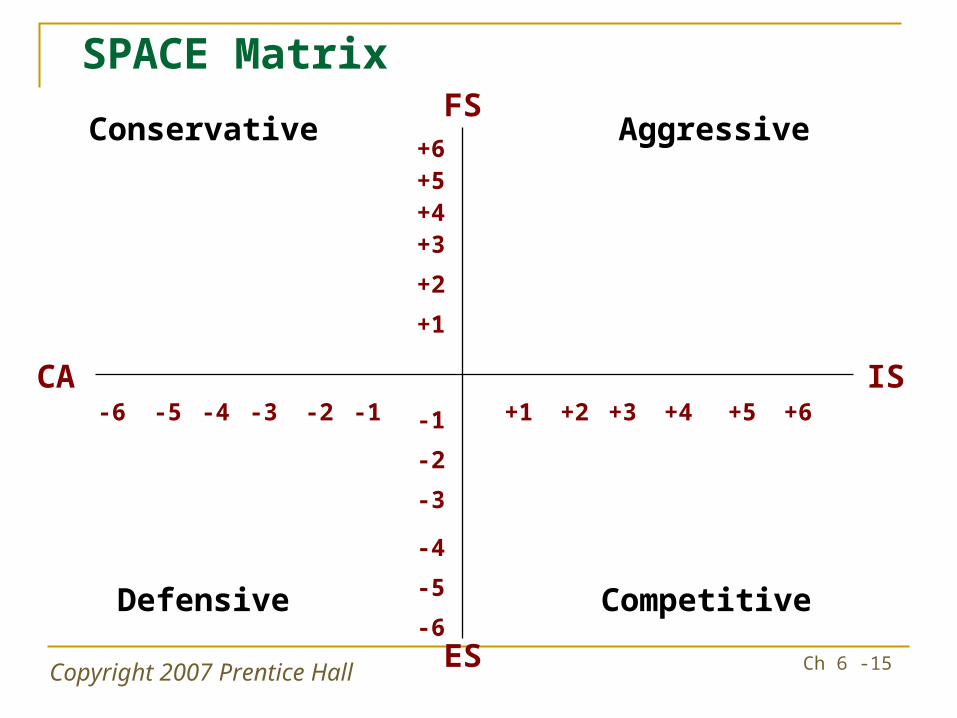
SPACE MatrixFS
+6
+1
+5+4+3
+2
-6
-5
-4
-3
-2
-1-6 -5 -4 -3 -2 -1 +1 +2 +3 +4 +5 +6
ES
CA IS
Conservative Aggressive
Defensive Competitive

Copyright 2007 Prentice Hall Ch 6 -16
SPACE Matrix
Select variables to define FS, CA, ES, & IS
Assign numerical ranking from +1 (worst) to +6 (best) for FS and IS; Assign numerical ranking from –1 (best) to –6 (worst) for ES and CA.
Compute average score for FS, CA, ES, & IS
Copyright 2007 Prentice Hall Ch 6 -17
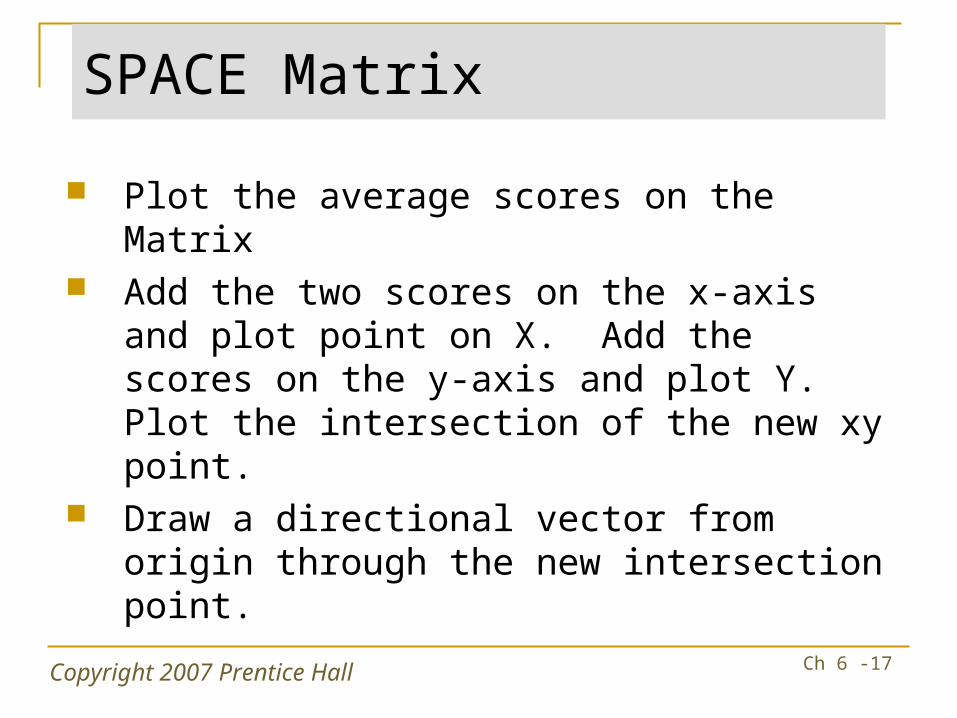
SPACE Matrix
Plot the average scores on the Matrix Add the two scores on the x-axis and plot
point on X. Add the scores on the y-axis and plot Y. Plot the intersection of the new xy point.
Draw a directional vector from origin through the new intersection point.
Copyright 2007 Prentice Hall Ch 6 -18
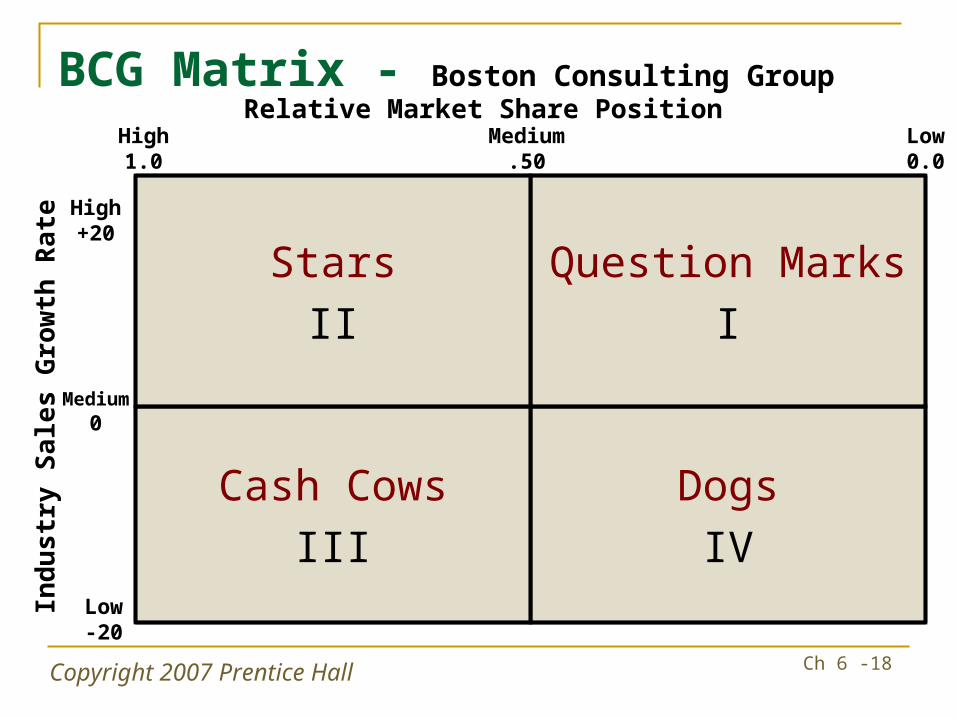
BCG Matrix - Boston Consulting Group
Dogs
IV
Cash Cows
III
Question Marks
I
Stars
II
Relative Market Share PositionHigh1.0
Medium.50
Low0.0
Ind
us
try
Sa
les
Gro
wth
Ra
te
High+20
Low-20
Medium0
Copyright 2007 Prentice Hall Ch 6 -19
BCG Matrix
Boston Consulting Group Matrix
Graphically portrays differences among divisions
Focuses on market share position and industry growth rate
Manage business portfolio through relative market share position and industry growth rate
Copyright 2007 Prentice Hall Ch 6 -20
BCG Matrix
Relative market share position defined:
• Ratio of a division’s own market share in a particular industry to the market share held by the largest rival firm in that industry.
Copyright 2007 Prentice Hall Ch 6 -21
BCG Matrix
Question Marks
• Low relative market share position yet compete in high-growth industry.• Cash needs are high• Case generation is low
• Decision to strengthen (intensive strategies) or divest
Copyright 2007 Prentice Hall Ch 6 -22
BCG Matrix
Stars
• High relative market share and high industry growth rate.• Best long-run opportunities for growth and
profitability
• Substantial investment to maintain or strengthen dominant position• Integration strategies, intensive strategies, joint
ventures
Copyright 2007 Prentice Hall Ch 6 -23
BCG Matrix
Cash Cows
• High relative market share position, but compete in low-growth industry• Generate cash in excess of their needs• Milked for other purposes
• Maintain strong position as long as possible• Product development, concentric diversification• If becomes weak—retrenchment or divestiture
Copyright 2007 Prentice Hall Ch 6 -24
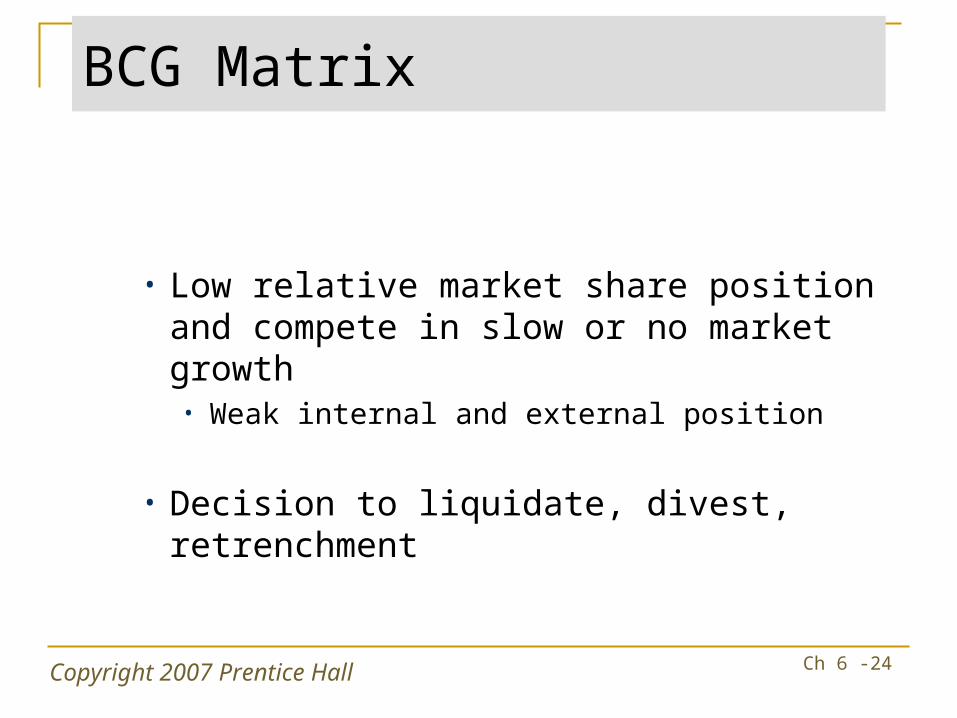
BCG Matrix
Dogs
• Low relative market share position and compete in slow or no market growth • Weak internal and external position
• Decision to liquidate, divest, retrenchment
Copyright 2007 Prentice Hall Ch 6 -25
The Internal-External Matrix
Positions an organization’s various divisions in a nine-cell display.
Similar to BCG Matrix except the IE Matrix: Requires more information about the divisions Strategic implications of each matrix are different
Copyright 2007 Prentice Hall Ch 6 -26
Copyright 2007 Prentice Hall Ch 6 -27
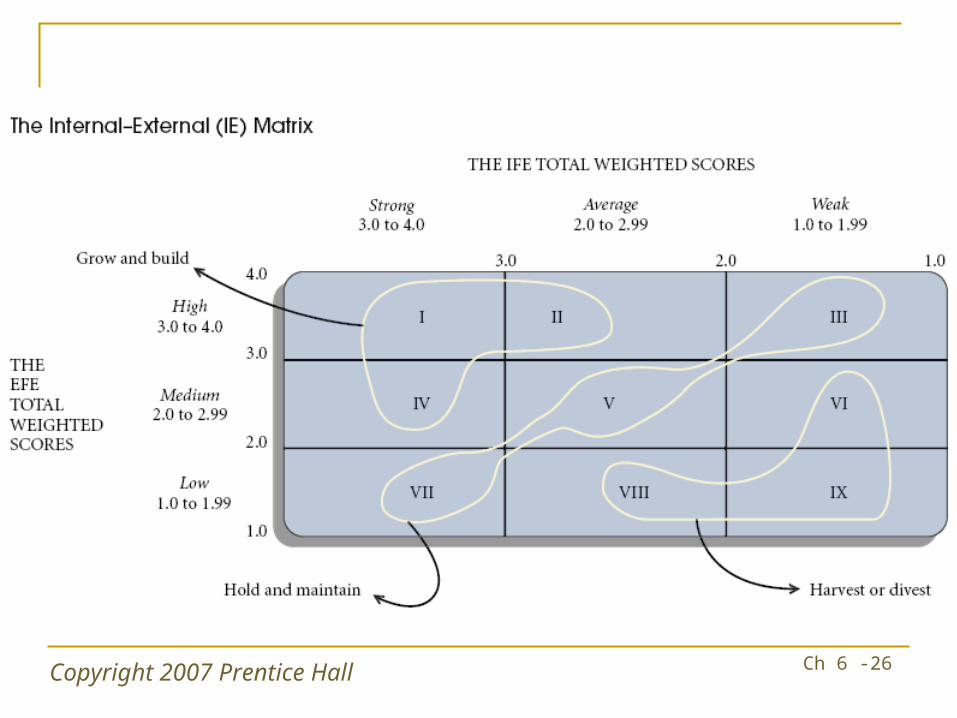
IE Matrix
Based on two key dimensions The IFE total weighted scores on the x-axis The EFE total weighted scores on the y-axis
Divided into three major regions Grow and build – Cells I, II, or IV Hold and maintain – Cells III, V, or VII Harvest or divest – Cells VI, VIII, or IX
Copyright 2007 Prentice Hall Ch 6 -28
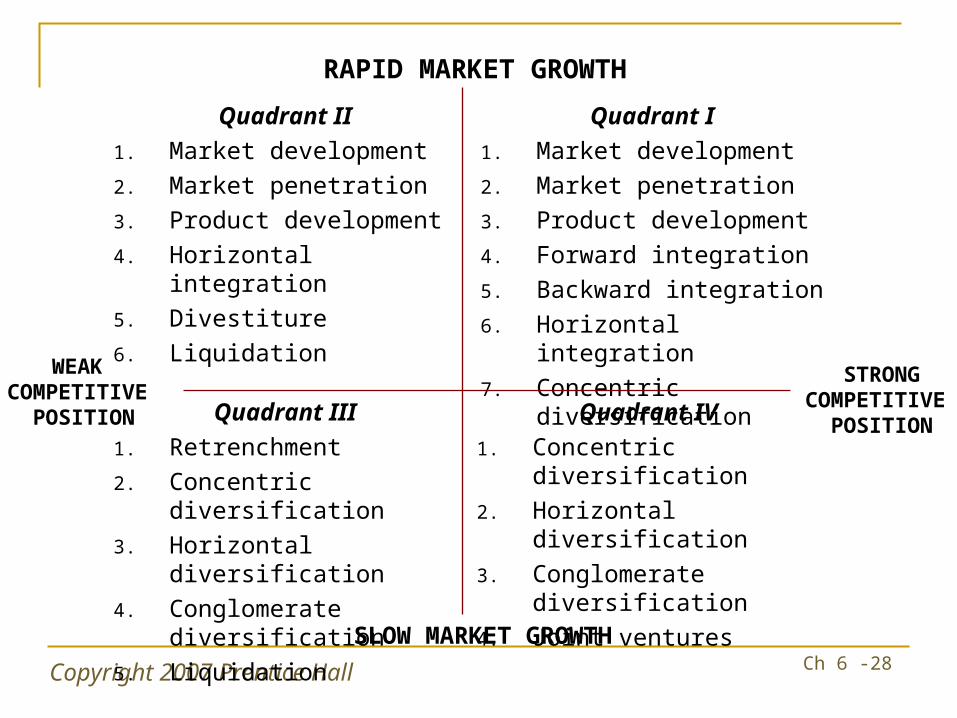
Quadrant IV
1. Concentric diversification
2. Horizontal diversification
3. Conglomerate diversification
4. Joint ventures
Quadrant III
1. Retrenchment
2. Concentric diversification
3. Horizontal diversification
4. Conglomerate diversification
5. Liquidation
Quadrant I
1. Market development
2. Market penetration
3. Product development
4. Forward integration
5. Backward integration
6. Horizontal integration
7. Concentric diversification
Quadrant II
1. Market development
2. Market penetration
3. Product development
4. Horizontal integration
5. Divestiture
6. Liquidation
RAPID MARKET GROWTH
SLOW MARKET GROWTH
WEAK COMPETITIVE
POSITION
STRONGCOMPETITIVE
POSITION
Copyright 2007 Prentice Hall Ch 6 -29
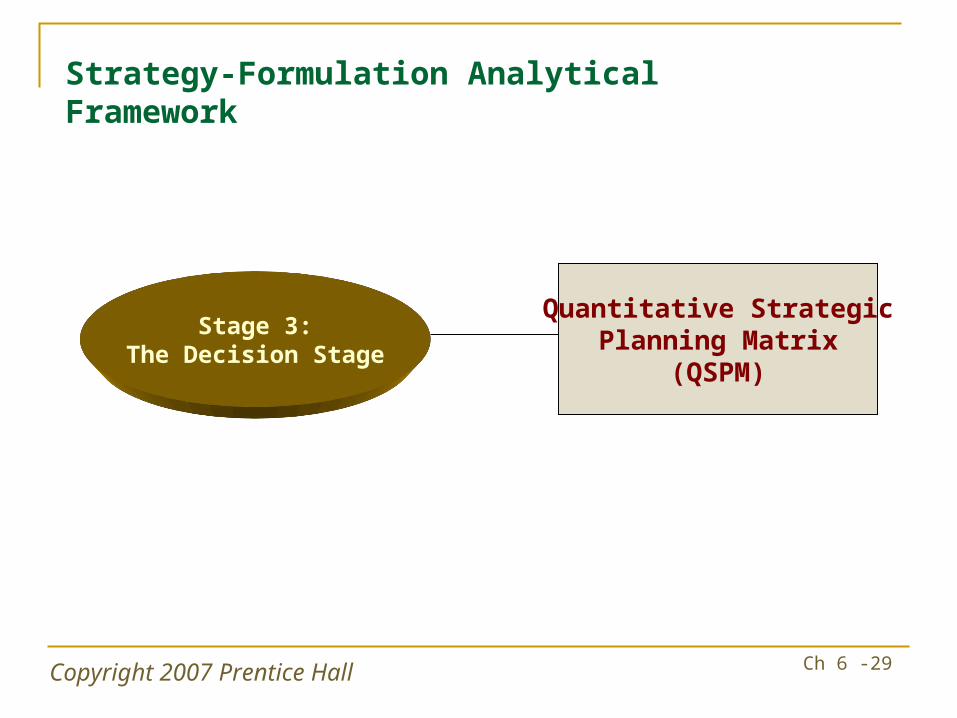
Strategy-Formulation Analytical Framework
Stage 3:The Decision Stage
Quantitative StrategicPlanning Matrix
(QSPM)
Copyright 2007 Prentice Hall Ch 6 -30
QSPM
Quantitative Strategic Planning Matrix
• Only technique designed to determine the relative attractiveness of feasible alternative actions
Tool for objective evaluation of alternative strategies
Based on identified external and internal crucial success factors
Requires good intuitive judgment
Copyright 2007 Prentice Hall Ch 6 -31
QSPM
Quantitative Strategic Planning Matrix
List the firm’s key external opportunities & threats; list the firm’s key internal strengths and weaknesses
Assign weights to each external and internal critical success factor
Examine the Stage 2 (matching) matrices and identify alternative strategies that the organization should consider implementing
Determine the Attractiveness Scores (AS)
Copyright 2007 Prentice Hall Ch 6 -32
QSPM
Quantitative Strategic Planning Matrix
Compute the total Attractiveness Scores
Compute the Sum Total Attractiveness Score
Copyright 2007 Prentice Hall Ch 6 -33
QSPM
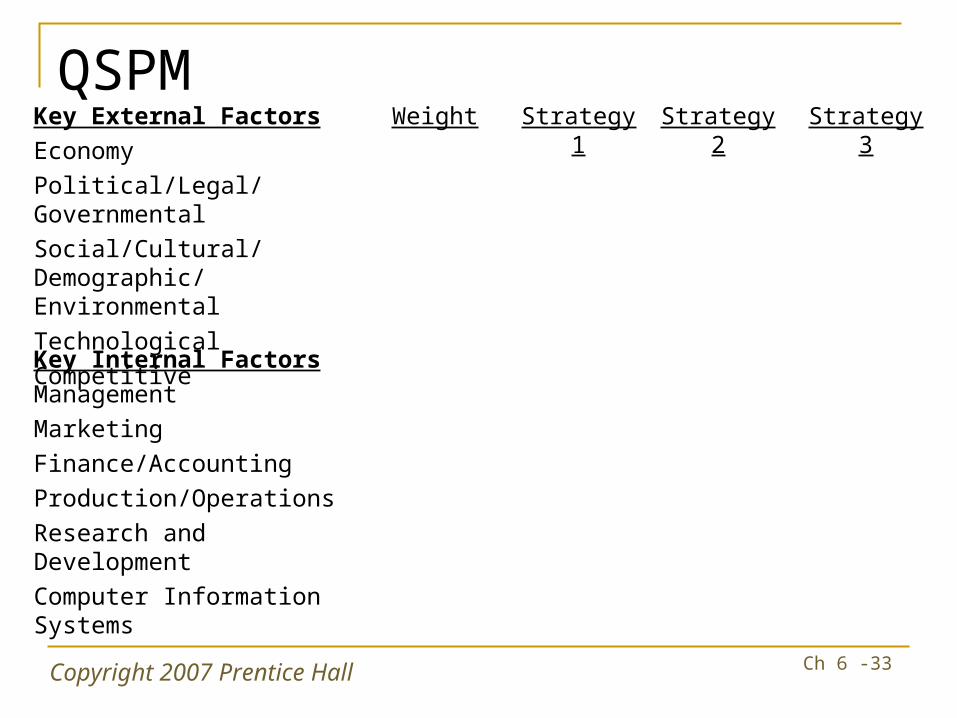
Key Internal FactorsManagementMarketingFinance/AccountingProduction/OperationsResearch and DevelopmentComputer Information Systems
Strategy 3Strategy 2
Strategy 1
WeightKey External FactorsEconomyPolitical/Legal/GovernmentalSocial/Cultural/Demographic/EnvironmentalTechnologicalCompetitive
Copyright 2007 Prentice Hall Ch 6 -34
QSPM
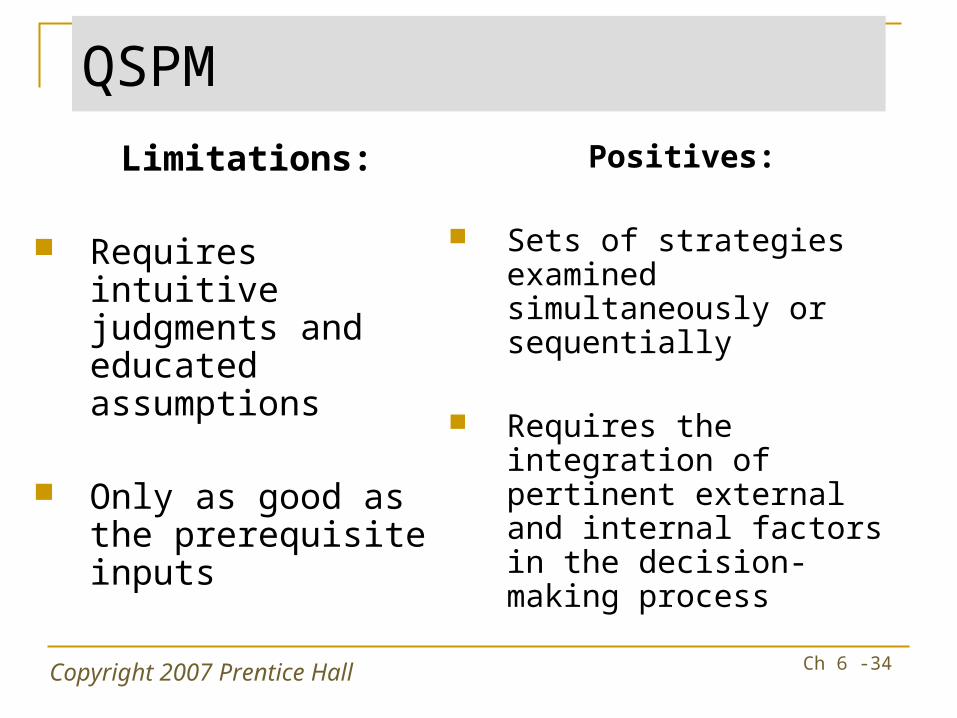
Limitations:
Requires intuitive judgments and educated assumptions
Only as good as the prerequisite inputs
Positives:
Sets of strategies examined simultaneously or sequentially
Requires the integration of pertinent external and internal factors in the decision-making process
Copyright 2007 Prentice Hall Ch 6 -35
QSPM
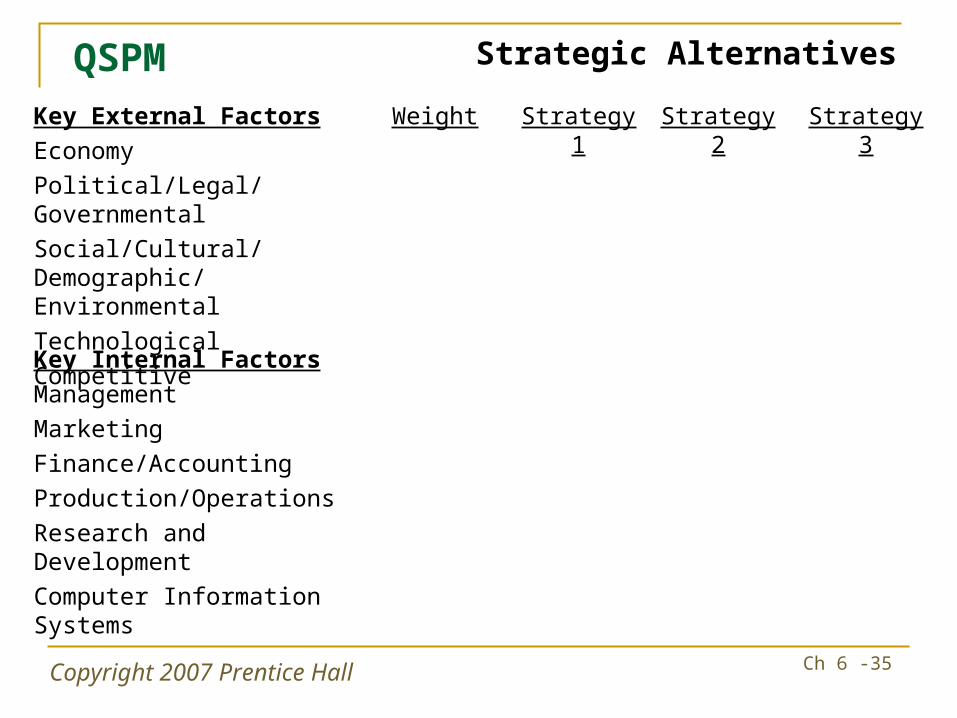
Key Internal Factors
Management
Marketing
Finance/Accounting
Production/Operations
Research and Development
Computer Information Systems
Strategy 3Strategy 2Strategy 1WeightKey External Factors
Economy
Political/Legal/Governmental
Social/Cultural/Demographic/Environmental
Technological
Competitive
Strategic Alternatives
Copyright 2007 Prentice Hall Ch 6 -36
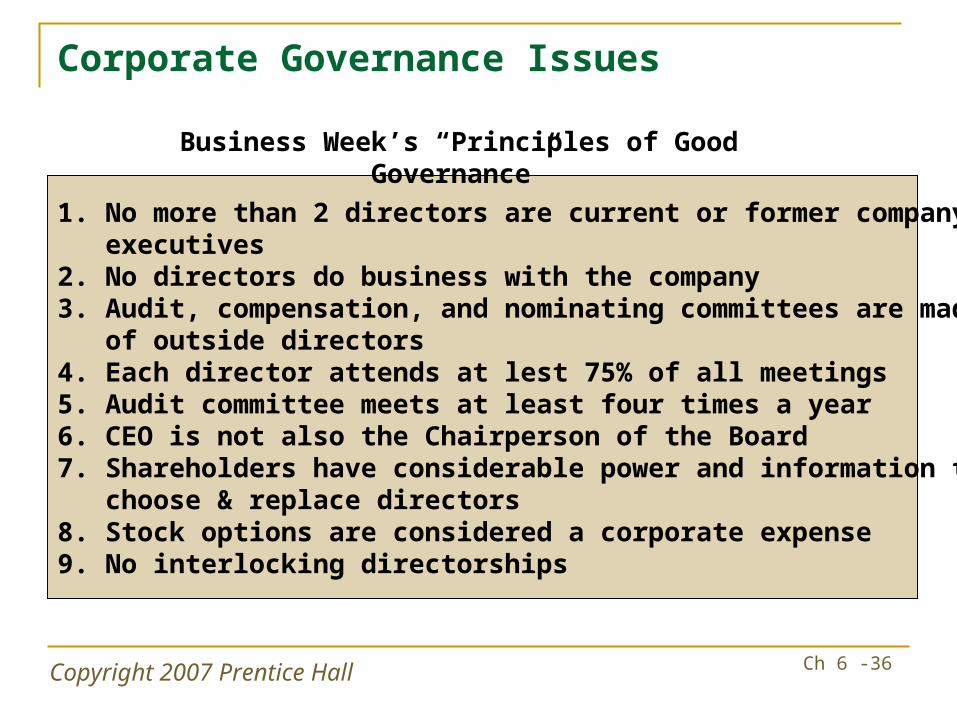
Corporate Governance Issues
1. No more than 2 directors are current or former company executives
2. No directors do business with the company3. Audit, compensation, and nominating committees are made up
of outside directors4. Each director attends at lest 75% of all meetings5. Audit committee meets at least four times a year6. CEO is not also the Chairperson of the Board7. Shareholders have considerable power and information to
choose & replace directors8. Stock options are considered a corporate expense9. No interlocking directorships
Business Week’s “Principles of Good Governance”