Embed Size (px)
Citation preview

Copyright
by
Wei Jiang
2015
The Dissertation Committee for Wei Jiang Certifies that this is the approved version
of the following dissertation:
Hydrophilic Polymer Foam and Microsphere Templates for Fabrication
of Microcellular Nickel and Graphene Foams with Energy Storage
Applications
Committee:
Wei Li, Supervisor
Deji Akinwande
Jonathan Chen
Guihua Yu

Hydrophilic Polymer Foam and Microsphere Templates for Fabrication
of Microcellular Nickel and Graphene Foams with Energy Storage
Applications
by
Wei Jiang, B.E.; B.Lit.; M.E.; M.S.T.A.T.
Dissertation
Presented to the Faculty of the Graduate School of
The University of Texas at Austin
in Partial Fulfillment
of the Requirements
for the Degree of
Doctor of Philosophy
The University of Texas at Austin
December 2015

Dedication
To my lovely wife, and daughter: Zhuoya You, and Izabella Yihan Jiang
v
Acknowledgements
First of all, I would like to sincerely express my appreciation and gratitude to my
advisor and committee chair Dr. Wei Li for his expert guidance, support, and
encouragement throughout the duration of this research. He has been a great mentor both
academically and professionally. I learned a great deal from him, and kept on the course of
completing my doctoral program thanks for the right balance of critical advice and
encouragement provided by him.
I would also like to thank Dr. Deji Akinwande, Dr. Jonathan Chen, and Dr. Guihua
Yu for agreeing to serve on my doctoral committee. I am thankful to them for their
valuable suggestions and advice.
I would like to thank my colleagues in the Nano and Bio Materials Processing and
Manufacturing Lab Liang Ma, Yongha Kim, Sriharsha Srinivas Sundarram, Russell
Borduin, Jingyu Ock, Hao Xin, Daniel Justiss, Xiaoran Li, and Anish Dabhi for their
helpful inputs to this work. I would also thank Dr. Guihua Yu, Dr. Joseph Koo, Dr.
Jonathan Chen and Dr. Rodney Ruoff for letting me use equipment in their labs.
Finally,I would like to thank my wife and my parents for their encouragement
and support. I would also like to thank my friends from Austin for their support in the
pursuit of the degree.
vi
Hydrophilic Polymer Foam and Microsphere Templates for Fabrication
of Microcellular Nickel and Graphene Foams with Energy Storage
Applications
Wei Jiang, Ph.D.
The University of Texas at Austin, 2015
Supervisor: Wei Li
Hydrophilic polymer foam and microsphere templates have attracted tremendous
attentions in the past decade due to their applicability in numerous areas such as catalyst
carriers and mini-reactors, filtration media, carbon foam fabrication templates, thermal
and electrical insulators, and tissue engineering scaffolds. Hydrophilic polymer sphere and
foam templates can be used to fabricate microcellular nickel foams and graphene foams
that are finding unique opportunities in energy storage applications, including battery
electrodes and matrices for solar energy storage. In this study open celled hydrophilic
polymer foams and microsphere templates with controllable pore size and porosity were
fabricated via solid state foaming and vacuum-assisted assembling methods. Hydrophilic
polymer foams were fabricated with disulfonated poly(arylene ether sulfone) (BPS) and
poly(ethylene glycol) (PEG) miscible blends.
Polymer microsphere templates made with PMMA, paraffin, and EAA spheres
were used as templates for fabricating bulk nickel foams, which were further used as a
template to fabricate graphene foams. In order to achieve bulk microcellular nickel and
graphene foams, a novel electro-polishing-assisted electroless nickel (Ni) deposition
vii
process was developed to mitigate the diffusion limitation problem. Fundamental
mechanisms of the proposed process were studied using a finite difference model
considering both ion diffusion and chemical reaction inside the porous media. The
fabricated microcellular Ni foams exhibited sufficient thermal stability and were used to
fabricate three dimensional (3D) few-layer-graphene (FLG) foams using a chemical vapor
deposition (CVD) method. The resulting graphene foams had a pore size less than 100
µm, density of 0.0020 g·cm-3, and strut wall thickness of 5 nm. The surface-to-volume
ratio of the foam was 2.5×10⁵ m2·m-3.
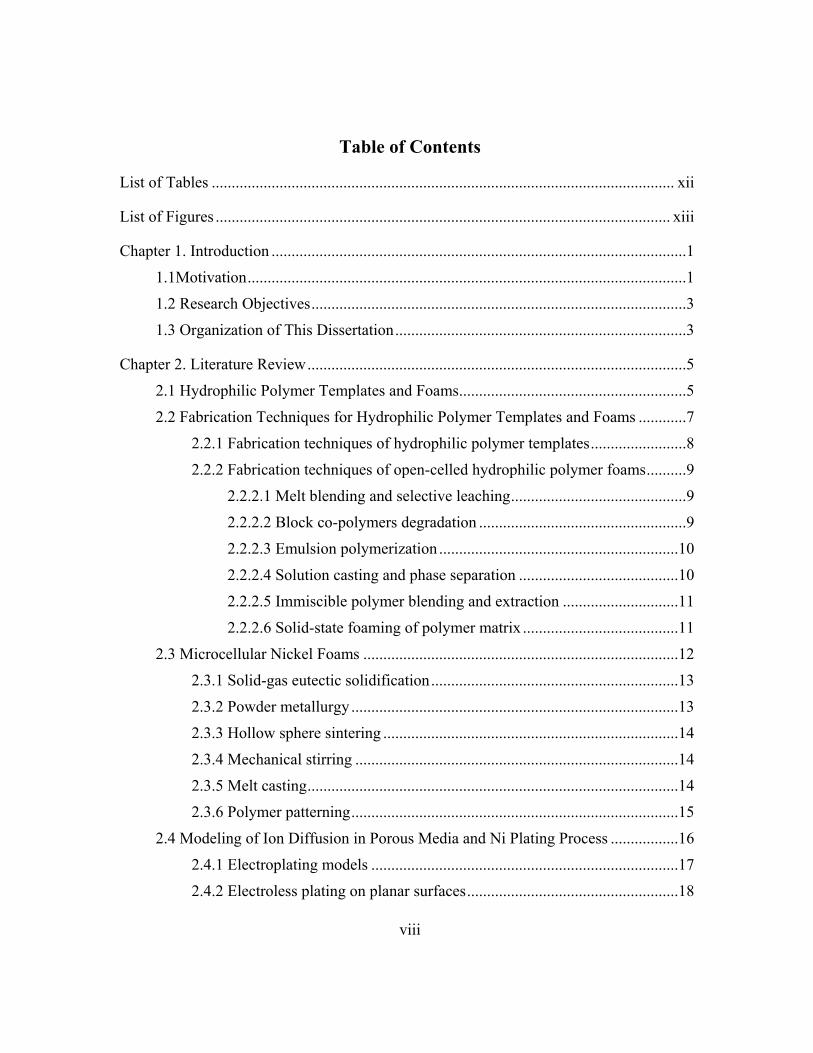
viii
Table of Contents
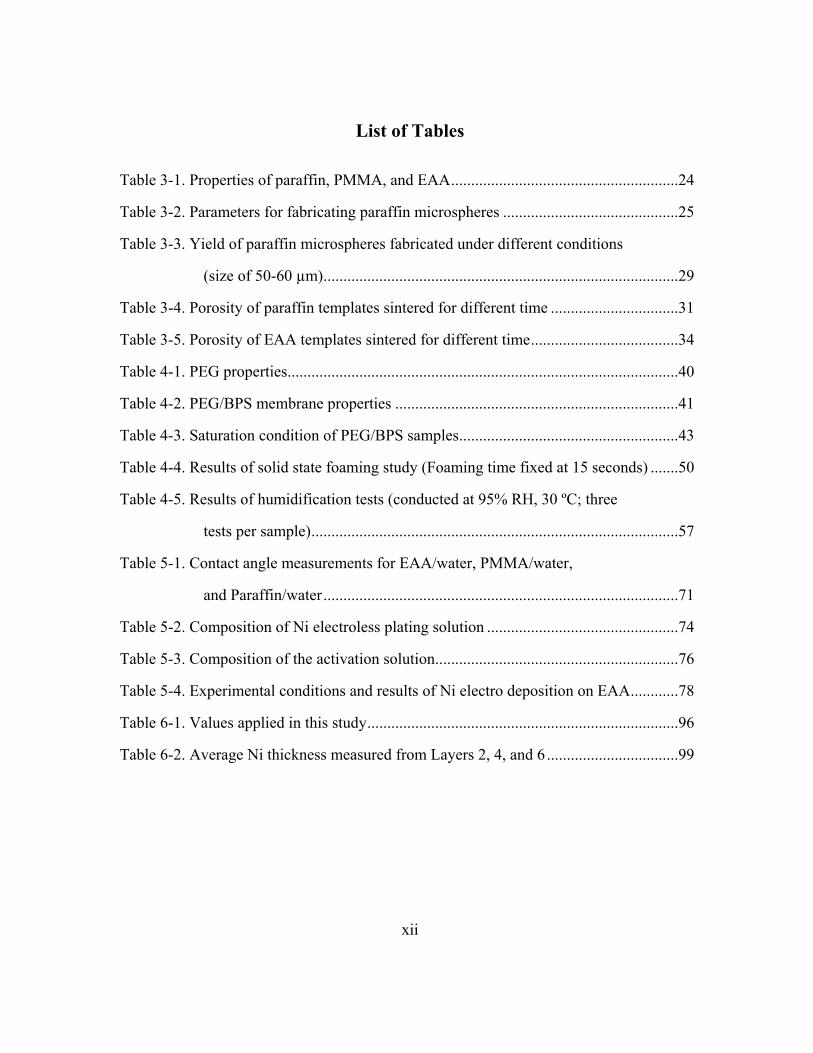
List of Tables .................................................................................................................... xii
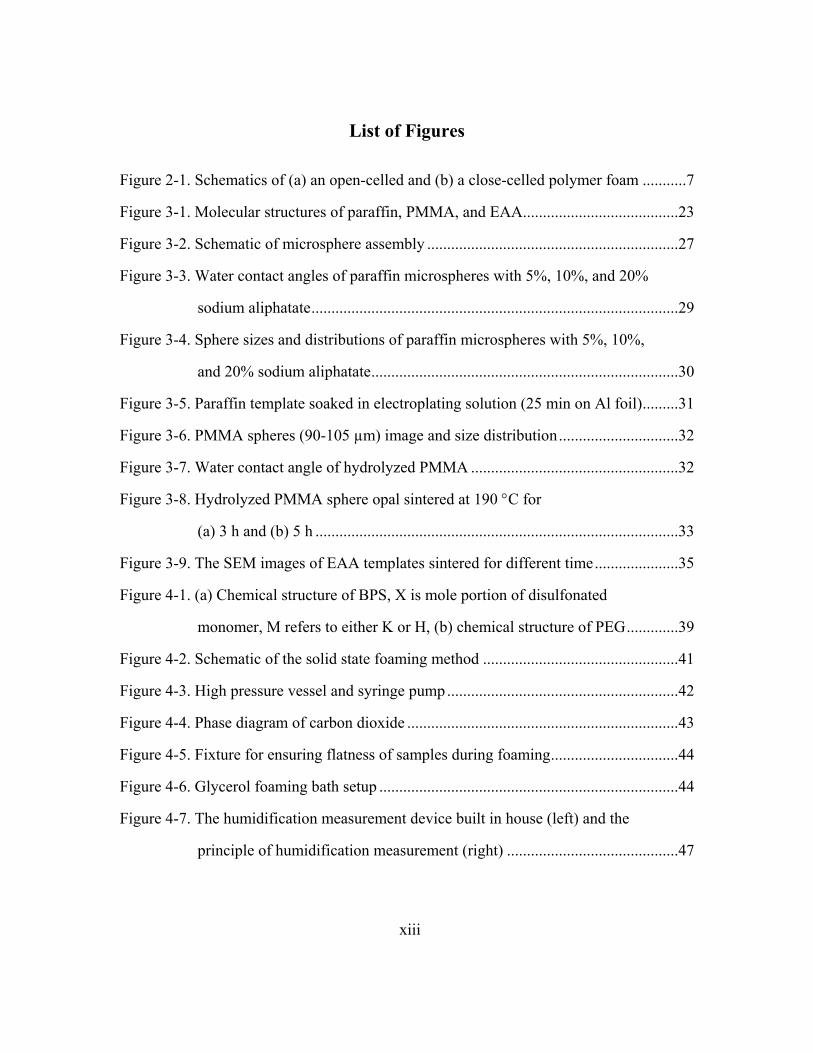
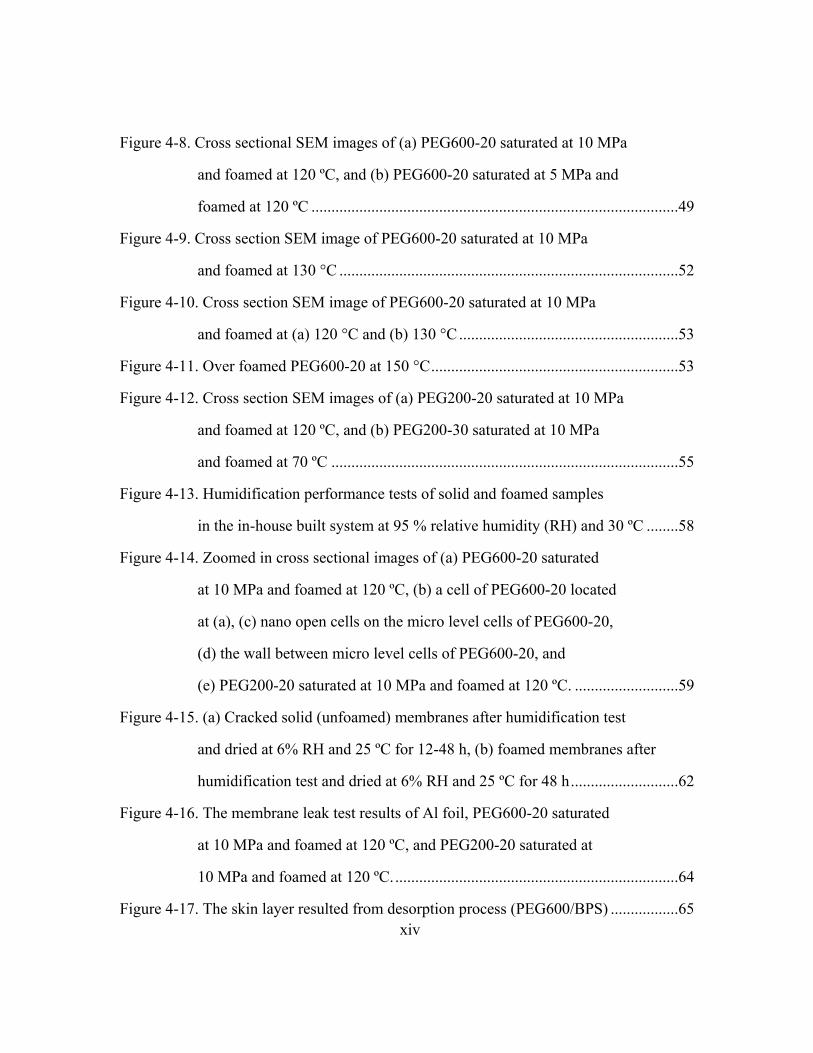
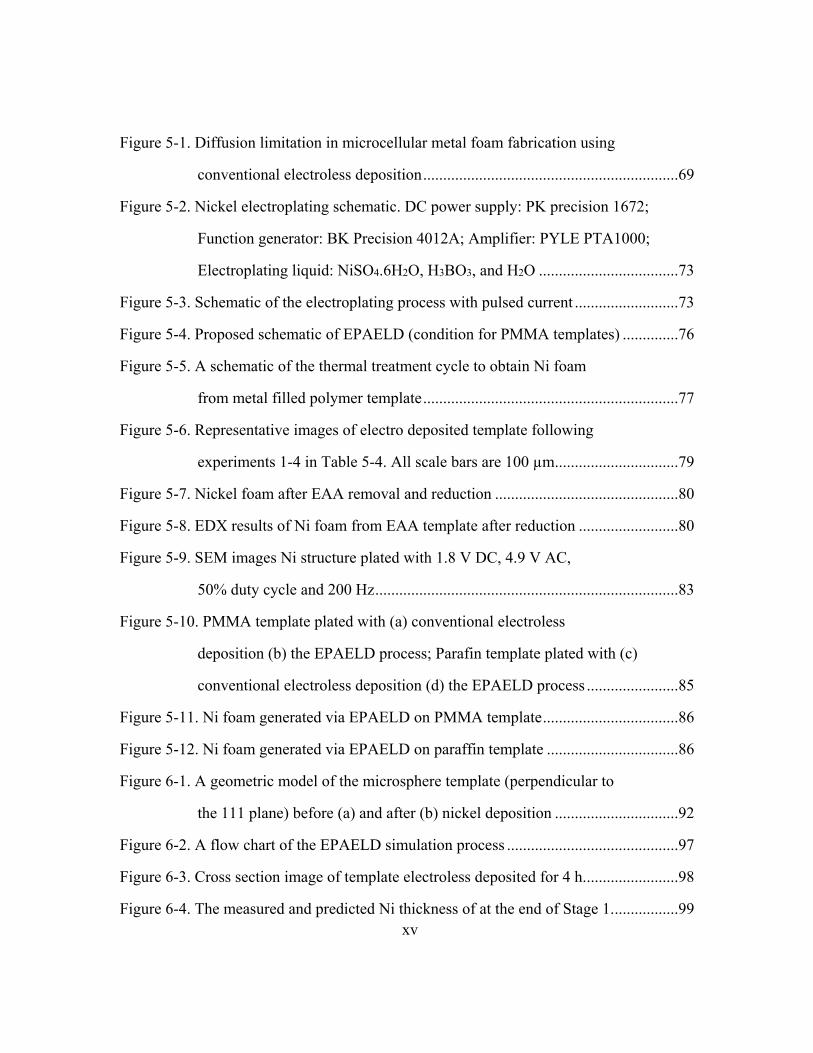
List of Figures .................................................................................................................. xiii
Chapter 1. Introduction ........................................................................................................1
1.1Motivation ..............................................................................................................1
1.2 Research Objectives ..............................................................................................3
1.3 Organization of This Dissertation .........................................................................3
Chapter 2. Literature Review ...............................................................................................5
2.1 Hydrophilic Polymer Templates and Foams .........................................................5
2.2 Fabrication Techniques for Hydrophilic Polymer Templates and Foams ............7
2.2.1 Fabrication techniques of hydrophilic polymer templates ........................8
2.2.2 Fabrication techniques of open-celled hydrophilic polymer foams ..........9
2.2.2.1 Melt blending and selective leaching ............................................9
2.2.2.2 Block co-polymers degradation ....................................................9
2.2.2.3 Emulsion polymerization ............................................................10
2.2.2.4 Solution casting and phase separation ........................................10
2.2.2.5 Immiscible polymer blending and extraction .............................11
2.2.2.6 Solid-state foaming of polymer matrix .......................................11
2.3 Microcellular Nickel Foams ...............................................................................12
2.3.1 Solid-gas eutectic solidification ..............................................................13
2.3.2 Powder metallurgy ..................................................................................13
2.3.3 Hollow sphere sintering ..........................................................................14
2.3.4 Mechanical stirring .................................................................................14
2.3.5 Melt casting .............................................................................................14
2.3.6 Polymer patterning ..................................................................................15
2.4 Modeling of Ion Diffusion in Porous Media and Ni Plating Process .................16
2.4.1 Electroplating models .............................................................................17
2.4.2 Electroless plating on planar surfaces .....................................................18
ix
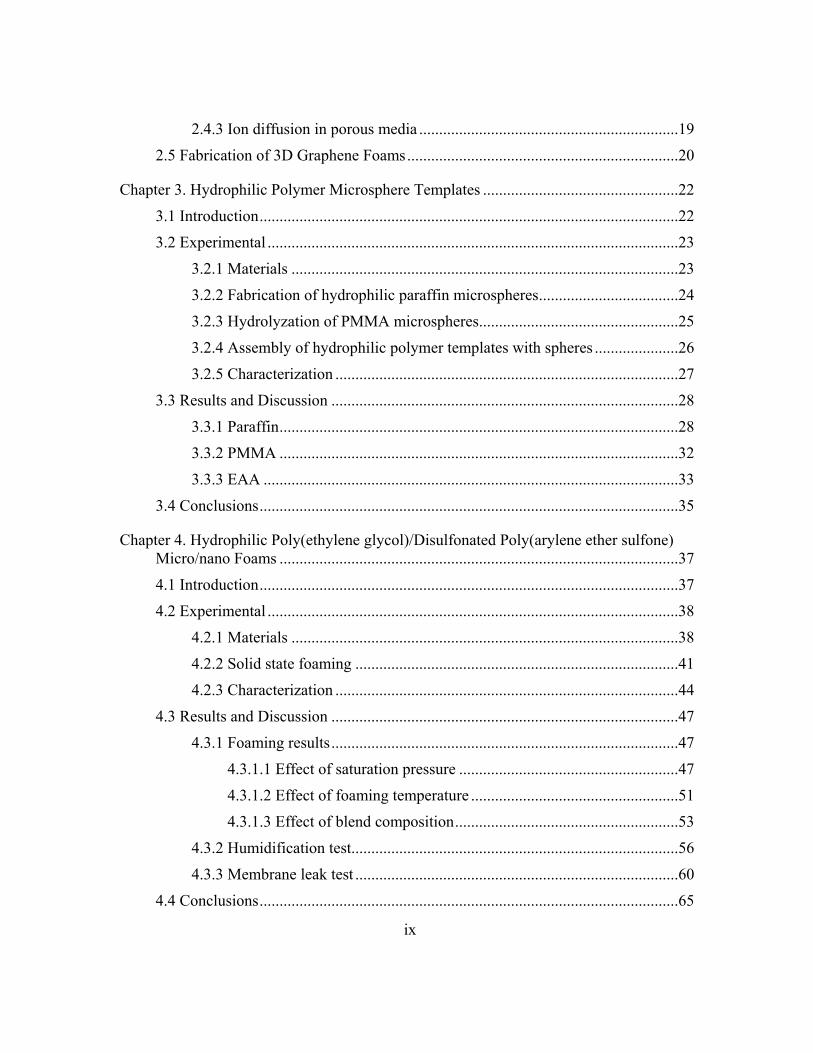
2.4.3 Ion diffusion in porous media .................................................................19
2.5 Fabrication of 3D Graphene Foams ....................................................................20
Chapter 3. Hydrophilic Polymer Microsphere Templates .................................................22
3.1 Introduction .........................................................................................................22
3.2 Experimental .......................................................................................................23
3.2.1 Materials .................................................................................................23
3.2.2 Fabrication of hydrophilic paraffin microspheres ...................................24
3.2.3 Hydrolyzation of PMMA microspheres..................................................25
3.2.4 Assembly of hydrophilic polymer templates with spheres .....................26
3.2.5 Characterization ......................................................................................27
3.3 Results and Discussion .......................................................................................28
3.3.1 Paraffin ....................................................................................................28
3.3.2 PMMA ....................................................................................................32
3.3.3 EAA ........................................................................................................33
3.4 Conclusions .........................................................................................................35
Chapter 4. Hydrophilic Poly(ethylene glycol)/Disulfonated Poly(arylene ether sulfone)
Micro/nano Foams ....................................................................................................37
4.1 Introduction .........................................................................................................37
4.2 Experimental .......................................................................................................38
4.2.1 Materials .................................................................................................38
4.2.2 Solid state foaming .................................................................................41
4.2.3 Characterization ......................................................................................44
4.3 Results and Discussion .......................................................................................47
4.3.1 Foaming results .......................................................................................47
4.3.1.1 Effect of saturation pressure .......................................................47
4.3.1.2 Effect of foaming temperature ....................................................51
4.3.1.3 Effect of blend composition ........................................................53
4.3.2 Humidification test..................................................................................56
4.3.3 Membrane leak test .................................................................................60
4.4 Conclusions .........................................................................................................65
x
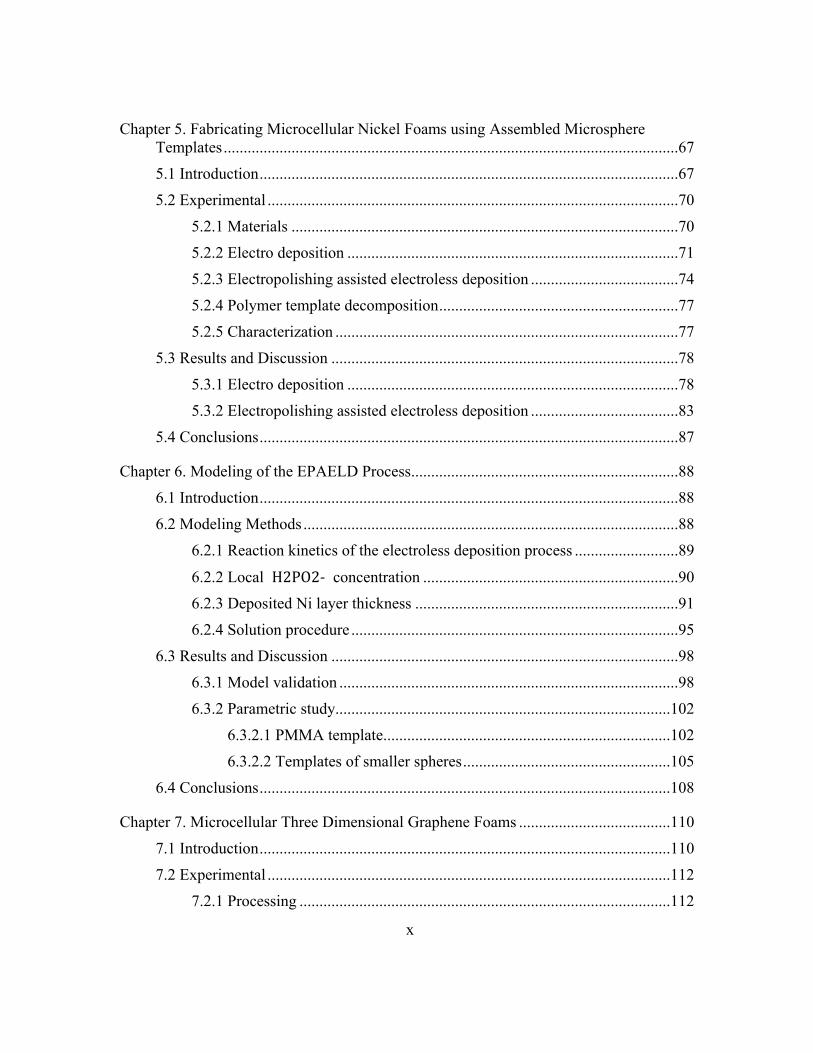
Chapter 5. Fabricating Microcellular Nickel Foams using Assembled Microsphere
Templates ..................................................................................................................67
5.1 Introduction .........................................................................................................67
5.2 Experimental .......................................................................................................70
5.2.1 Materials .................................................................................................70
5.2.2 Electro deposition ...................................................................................71
5.2.3 Electropolishing assisted electroless deposition .....................................74
5.2.4 Polymer template decomposition ............................................................77
5.2.5 Characterization ......................................................................................77
5.3 Results and Discussion .......................................................................................78
5.3.1 Electro deposition ...................................................................................78
5.3.2 Electropolishing assisted electroless deposition .....................................83
5.4 Conclusions .........................................................................................................87
Chapter 6. Modeling of the EPAELD Process ...................................................................88
6.1 Introduction .........................................................................................................88
6.2 Modeling Methods ..............................................................................................88
6.2.1 Reaction kinetics of the electroless deposition process ..........................89
6.2.2 Local H2PO2- concentration ................................................................90
6.2.3 Deposited Ni layer thickness ..................................................................91
6.2.4 Solution procedure ..................................................................................95
6.3 Results and Discussion .......................................................................................98
6.3.1 Model validation .....................................................................................98
6.3.2 Parametric study....................................................................................102
6.3.2.1 PMMA template........................................................................102
6.3.2.2 Templates of smaller spheres ....................................................105
6.4 Conclusions .......................................................................................................108
Chapter 7. Microcellular Three Dimensional Graphene Foams ......................................110
7.1 Introduction .......................................................................................................110
7.2 Experimental .....................................................................................................112
7.2.1 Processing .............................................................................................112
xi
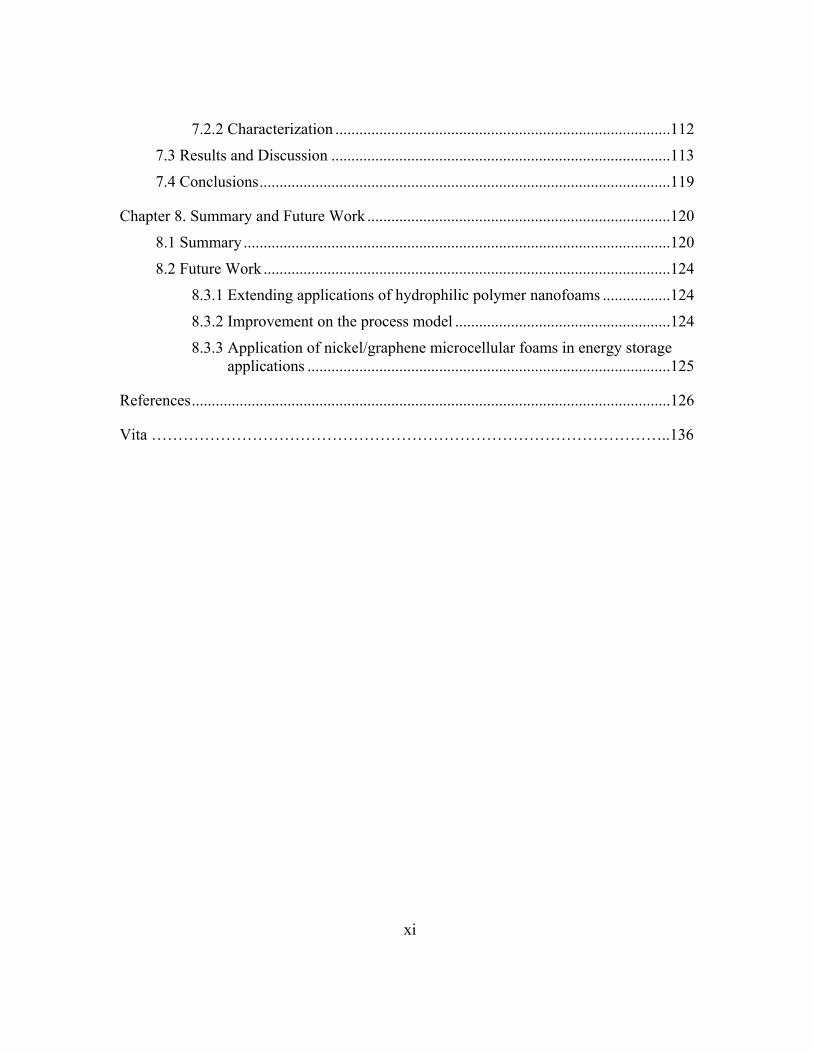
7.2.2 Characterization ....................................................................................112
7.3 Results and Discussion .....................................................................................113
7.4 Conclusions .......................................................................................................119
Chapter 8. Summary and Future Work ............................................................................120
8.1 Summary ...........................................................................................................120
8.2 Future Work ......................................................................................................124
8.3.1 Extending applications of hydrophilic polymer nanofoams .................124
8.3.2 Improvement on the process model ......................................................124
8.3.3 Application of nickel/graphene microcellular foams in energy storage
applications ...........................................................................................125
References ........................................................................................................................126
Vita ……………………………………………………………………………………..136
xii
List of Tables
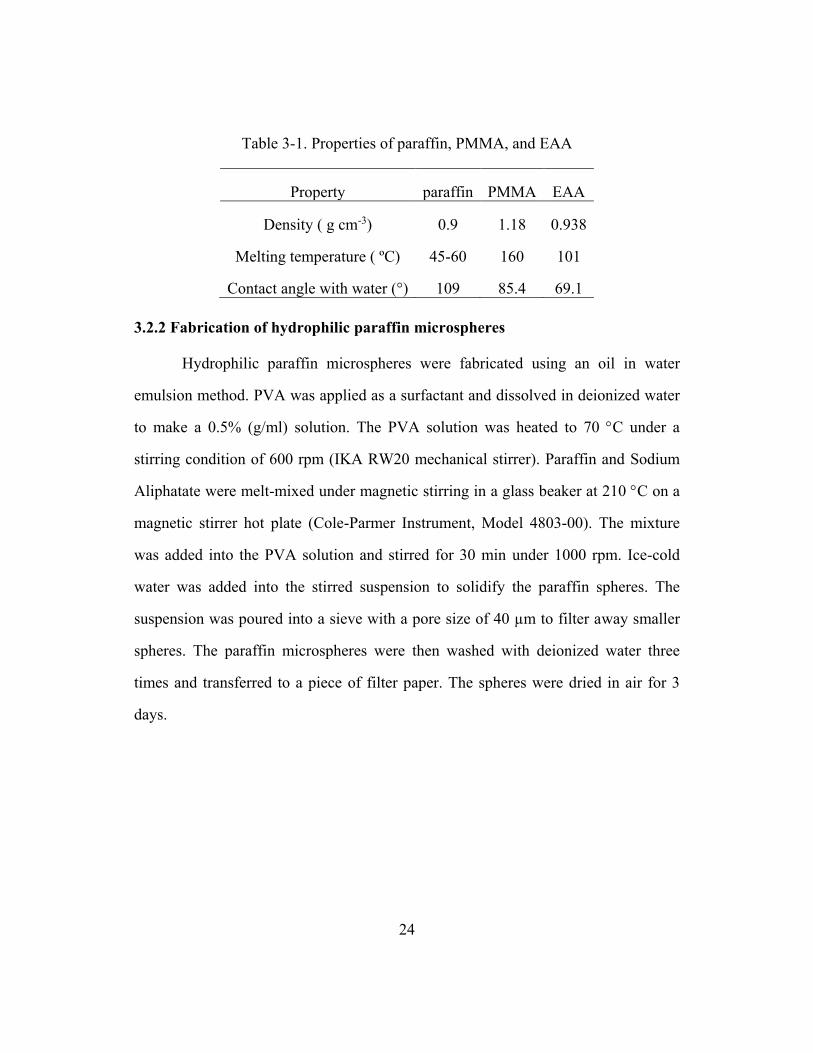
Table 3-1. Properties of paraffin, PMMA, and EAA .........................................................24
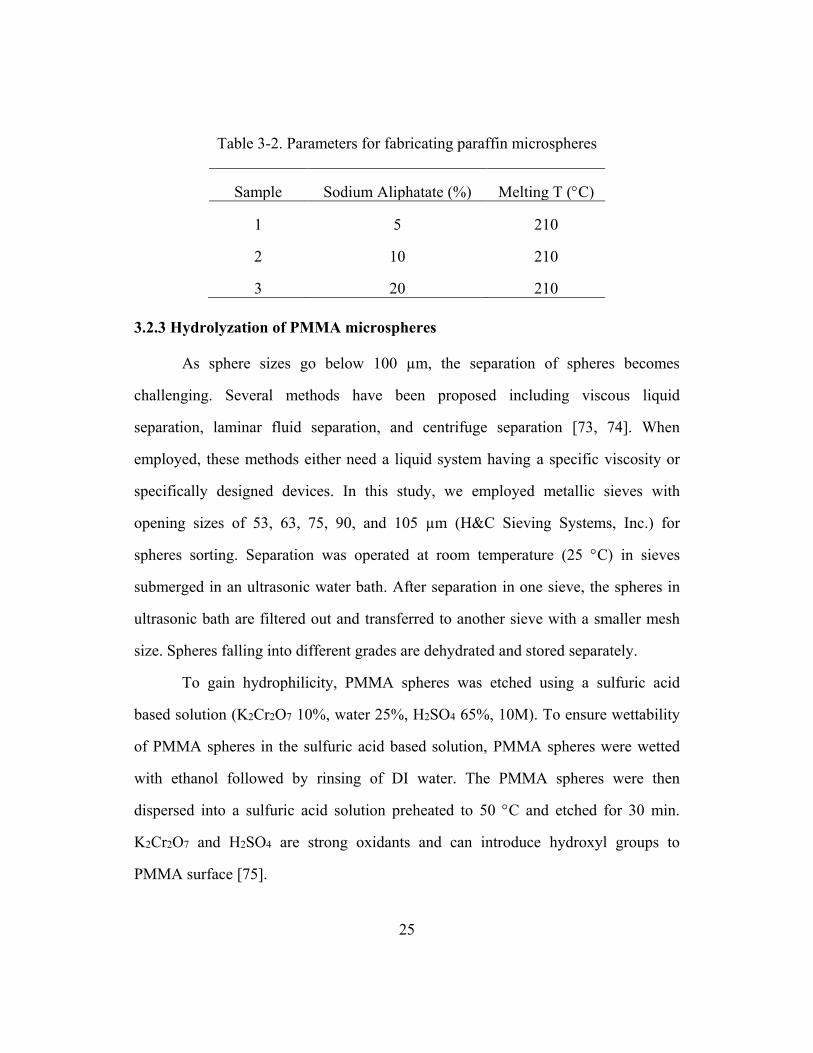
Table 3-2. Parameters for fabricating paraffin microspheres ............................................25
Table 3-3. Yield of paraffin microspheres fabricated under different conditions
(size of 50-60 µm) .........................................................................................29
Table 3-4. Porosity of paraffin templates sintered for different time ................................31
Table 3-5. Porosity of EAA templates sintered for different time .....................................34
Table 4-1. PEG properties..................................................................................................40
Table 4-2. PEG/BPS membrane properties .......................................................................41
Table 4-3. Saturation condition of PEG/BPS samples.......................................................43
Table 4-4. Results of solid state foaming study (Foaming time fixed at 15 seconds) .......50
Table 4-5. Results of humidification tests (conducted at 95% RH, 30 ºC; three
tests per sample) ............................................................................................57
Table 5-1. Contact angle measurements for EAA/water, PMMA/water,
and Paraffin/water .........................................................................................71
Table 5-2. Composition of Ni electroless plating solution ................................................74
Table 5-3. Composition of the activation solution .............................................................76
Table 5-4. Experimental conditions and results of Ni electro deposition on EAA ............78
Table 6-1. Values applied in this study ..............................................................................96
Table 6-2. Average Ni thickness measured from Layers 2, 4, and 6 .................................99
xiii
List of Figures
Figure 2-1. Schematics of (a) an open-celled and (b) a close-celled polymer foam ...........7
Figure 3-1. Molecular structures of paraffin, PMMA, and EAA .......................................23
Figure 3-2. Schematic of microsphere assembly ...............................................................27
Figure 3-3. Water contact angles of paraffin microspheres with 5%, 10%, and 20%
sodium aliphatate ............................................................................................29
Figure 3-4. Sphere sizes and distributions of paraffin microspheres with 5%, 10%,
and 20% sodium aliphatate .............................................................................30
Figure 3-5. Paraffin template soaked in electroplating solution (25 min on Al foil) .........31
Figure 3-6. PMMA spheres (90-105 µm) image and size distribution ..............................32
Figure 3-7. Water contact angle of hydrolyzed PMMA ....................................................32
Figure 3-8. Hydrolyzed PMMA sphere opal sintered at 190 C for
(a) 3 h and (b) 5 h ...........................................................................................33
Figure 3-9. The SEM images of EAA templates sintered for different time .....................35
Figure 4-1. (a) Chemical structure of BPS, X is mole portion of disulfonated
monomer, M refers to either K or H, (b) chemical structure of PEG .............39
Figure 4-2. Schematic of the solid state foaming method .................................................41
Figure 4-3. High pressure vessel and syringe pump ..........................................................42
Figure 4-4. Phase diagram of carbon dioxide ....................................................................43
Figure 4-5. Fixture for ensuring flatness of samples during foaming ................................44
Figure 4-6. Glycerol foaming bath setup ...........................................................................44
Figure 4-7. The humidification measurement device built in house (left) and the
principle of humidification measurement (right) ...........................................47
xiv
Figure 4-8. Cross sectional SEM images of (a) PEG600-20 saturated at 10 MPa
and foamed at 120 ºC, and (b) PEG600-20 saturated at 5 MPa and
foamed at 120 ºC ............................................................................................49
Figure 4-9. Cross section SEM image of PEG600-20 saturated at 10 MPa
and foamed at 130 °C .....................................................................................52
Figure 4-10. Cross section SEM image of PEG600-20 saturated at 10 MPa
and foamed at (a) 120 °C and (b) 130 °C .......................................................53
Figure 4-11. Over foamed PEG600-20 at 150 °C ..............................................................53
Figure 4-12. Cross section SEM images of (a) PEG200-20 saturated at 10 MPa
and foamed at 120 ºC, and (b) PEG200-30 saturated at 10 MPa
and foamed at 70 ºC .......................................................................................55
Figure 4-13. Humidification performance tests of solid and foamed samples
in the in-house built system at 95 % relative humidity (RH) and 30 ºC ........58
Figure 4-14. Zoomed in cross sectional images of (a) PEG600-20 saturated
at 10 MPa and foamed at 120 ºC, (b) a cell of PEG600-20 located
at (a), (c) nano open cells on the micro level cells of PEG600-20,
(d) the wall between micro level cells of PEG600-20, and
(e) PEG200-20 saturated at 10 MPa and foamed at 120 ºC. ..........................59
Figure 4-15. (a) Cracked solid (unfoamed) membranes after humidification test
and dried at 6% RH and 25 ºC for 12-48 h, (b) foamed membranes after
humidification test and dried at 6% RH and 25 ºC for 48 h ...........................62
Figure 4-16. The membrane leak test results of Al foil, PEG600-20 saturated
at 10 MPa and foamed at 120 ºC, and PEG200-20 saturated at
10 MPa and foamed at 120 ºC. .......................................................................64
Figure 4-17. The skin layer resulted from desorption process (PEG600/BPS) .................65
xv
Figure 5-1. Diffusion limitation in microcellular metal foam fabrication using
conventional electroless deposition ................................................................69
Figure 5-2. Nickel electroplating schematic. DC power supply: PK precision 1672;
Function generator: BK Precision 4012A; Amplifier: PYLE PTA1000;
Electroplating liquid: NiSO4.6H2O, H3BO3, and H2O ...................................73
Figure 5-3. Schematic of the electroplating process with pulsed current ..........................73
Figure 5-4. Proposed schematic of EPAELD (condition for PMMA templates) ..............76
Figure 5-5. A schematic of the thermal treatment cycle to obtain Ni foam
from metal filled polymer template ................................................................77
Figure 5-6. Representative images of electro deposited template following
experiments 1-4 in Table 5-4. All scale bars are 100 µm...............................79
Figure 5-7. Nickel foam after EAA removal and reduction ..............................................80
Figure 5-8. EDX results of Ni foam from EAA template after reduction .........................80
Figure 5-9. SEM images Ni structure plated with 1.8 V DC, 4.9 V AC,
50% duty cycle and 200 Hz ............................................................................83
Figure 5-10. PMMA template plated with (a) conventional electroless
deposition (b) the EPAELD process; Parafin template plated with (c)
conventional electroless deposition (d) the EPAELD process .......................85
Figure 5-11. Ni foam generated via EPAELD on PMMA template ..................................86
Figure 5-12. Ni foam generated via EPAELD on paraffin template .................................86
Figure 6-1. A geometric model of the microsphere template (perpendicular to
the 111 plane) before (a) and after (b) nickel deposition ...............................92
Figure 6-2. A flow chart of the EPAELD simulation process ...........................................97
Figure 6-3. Cross section image of template electroless deposited for 4 h. .......................98
Figure 6-4. The measured and predicted Ni thickness of at the end of Stage 1. ................99
xvi
Figure 6-5. Ni thickness from model in Stage 2 (a) and Stage 3 (b). ..............................101
Figure 6-6. Ni thickness from different parametric combinations in Stage 1
(100 µm sphere) ...........................................................................................103
Figure 6-7. Ni thickness from different parametric combinations in
Stage 3 (100 µm sphere) ...............................................................................105
Figure 6-8. Ni thickness from different parametric combinations in Stage 1
(10 µm sphere) .............................................................................................106
Figure 6-9. Ni thickness from different parametric combinations in Stage 3
(10 µm sphere) .............................................................................................108
Figure 7-1. The Ni foam produced by EPAELD on PMMA template ............................113
Figure 7-2. One cell of the Ni foam after graphene growth .............................................114
Figure 7-3. SEM images of fabricated graphene foam after Ni etching out:
(a) overall picture, (b) a cell of the graphene foam, (c) free
standing graphene foam after the nickel template was removed,
(d) an exploded view of a joint region of three pores...................................115
Figure 7-4. TEM image showing the thickness and number of layers of
graphene strut wall .......................................................................................116
Figure 7-5. The Raman spectrum of the graphene foam .................................................117
Figure 7-6. (a) Ni foam obtained with EAA microsphere template (pore size 10 µm),
(b) The 10 µm nickel foam lost its cellular structure after 30 min
annealing at 850 C. .....................................................................................118
1
Chapter 1. Introduction
1.1 MOTIVATION
Porous media, composed of different materials and featuring varying pore
size and pore morphology, show increasing importance because of their potential
applications in fields such as chemical reaction, filtration, thermal and electrical
insulation, nano/micro fabrication, separation, energy storage, and biomedical
engineering [1, 2]. Open-celled micro/nano hydrophilic polymeric foams,
hydrophilic polymer microsphere templates, and open-celled metallic foams are
materials with exclusive transport properties resulting in attractive applications. For
instance, hydrophilic polymer foams and hydrophilic polymer microsphere templates
can be applied as humidification membranes, separation membranes, and templates
for patterning metal foams. Open-celled metal foams find applications as frames of
energy storage device and as substrates for fabricating three dimensional (3D)
graphene/graphite structures [2-4].
Many techniques have been developed for making hydrophilic polymer
foams with mass infiltration and separation applications. However, those techniques
are either not efficient or not environmentally friendly [5-12]. In addition, existing
techniques are only capable of fabricating hydrophilic polymer foams with several
hundred µm or mm level pores. It is expected that smaller pore size would bring
better mass transportation, infiltration, and separation properties. Hence, new
techniques for fabricating hydrophilic polymer foams with varying porosity, pore
size of several micrometer or nanometer level are needed.
Efficient methods for fabricating bulk nickel foams with microcellular pores
(1-100 µm) are also lacking. This category of nickel foams feature higher internal
2
surface area to accommodate active materials compared with commercial nickel
foams with pore size of several hundred micrometers, and have better active
materials infiltration performance compared with nickel foams with nano level pore
size. Among the many metal foam fabrication methods, electroplating of close-
packed sphere templates is considered a promising approach to microcellular nickel
foam fabrication due to its ability to control the pore size and produce highly ordered
microstructures [13, 14]. However, as the sphere size or pore size becomes smaller
while the overall foam size remains at a bulk level, many challenges arise. For
example, the electroplating process will be limited by the ion-diffusion process into
the small pore sized polymer templates. Therefore, a novel technique capable of
enhancing the ion-diffusion in microsphere templates to fabricate bulk nickel foams
needs to be developed. Modeling of the developed process is also required to
understand mechanisms of ion diffusion and chemical reaction behaviors in order to
optimize the process.
One major application of microcellular nickel foams is the substrate for
fabricating 3D graphene foams, which have potential applications in high
performance energy storage devices such as lithium-ion batteries and super
capacitors. Recent studies have demonstrated 3D graphene foams with pore sizes on
the level of several hundreds of micrometers [15-17]. Such a pore size level leads to
a relatively low specific surface area and long charge transfer path, resulting in a
slow charging/discharging rate for the energy storage device. Graphene foams of
nanometer pore sizes were fabricated with a lithographically-defined polymer foam
as a template [18]; however, this process is complex and introduces irremovable
carbon residue lowering thermal and electrical properties of graphene foams. Bulk
3
microcellular few layer graphene foams with pore size between 1 and 100 µm need
to be developed to balance the requirements of high active material loading and
distinct thermal and electrical performances.
1.2 RESEARCH OBJECTIVES
The goal of this research is to fabricate microcellular metal foams and
graphene foams with hydrophilic polymer microsphere assembly and open celled
microcellular polymer foam as templates for potential energy storage related
applications. Specifically, the following objectives have been identified:
To develop novel fabricating techniques for hydrophilic polymer foams and
microsphere templates with controllable pore size and porosity as metal foam
deposition templates;
To fabricate bulk microcellular nickel foam and graphene foam with
hydrophilic polymer templates; and
To understand the mechanisms of a proposed nickel foam fabrication method
through modeling and simulation.
1.3 ORGANIZATION OF THIS DISSERTATION
This dissertation is organized into eight chapters. Chapter 1 is an introduction
to this study consisting of motivation and objectives. Chapter 2 is a literature review
on state-of-the-art fabrication techniques for open celled hydrophilic polymer
templates and foams, nickel foams, graphene foams, and existing modeling efforts
on eletroless/electro metal deposition methods and ion diffusion phenomena in
porous media. In Chapter 3, fabrication of hydrophilic polymer templates using
assembly of microspheres is presented. In Chapter 4, solid state foaming of
4
hydrophilic polymer micro/nano foams is introduced. In Chapter 5, fabrication of
nickel micro foams using a novel hybrid electropolishing-electroless deposition
method is discussed. Chapter 6 presents a finite difference model for ion diffusion
and chemical reaction in porous media to understand the mechanisms of the hybrid
process. Chapter 7 discusses the fabrication of 3D few-layer-graphene foam via
chemical vapor deposition (CVD) on the obtained Ni foams. Finally, Chapter 8
summarizes the current research and provides recommendations for future work.
5
Chapter 2. Literature Review
2.1 HYDROPHILIC POLYMER TEMPLATES AND FOAMS
Polymer templates are assemblies of polymer micro or nano spheres with
specific orders [19]. Methodologies and approaches of assembling them such as
suspension evaporation, sedimentation, and compression have been developed [20-
22]. After being bonded through thermal or solvent treatment, necking among
spheres would be created to connect spheres together and convert the assembled
templates to a 3D ordered structure with certain mechanical strength and
interconnected interior spaces. The bonded templates find applications in optical
devices and templates for fabricating 3D foams of other materials. Among the
polymer templates, hydrophilic polymer templates allow easy access of aqueous
solutions into their interior space, hence can be applied as templates for fabricating
metal foams, the deposition of which requires an aqueous solution. After the removal
of polymer templates, the metal left would form 3D foams with a reversed structure
of the opal. Hydrophilic polymer templates are one of the main topics of interest in
this work for metal foam fabrication.
Polymer foams, which consist of the polymer matrix and open space in the
matrix, have attracted numerous attentions in the past decades due to their multiple
advantages compared to unfoamed polymer [23]. Polymer foams can be identified to
different categories with two different ways. Pore size is one way to identify them.
When pore sizes are in the range of 1 µm to 100 µm, polymer foams are defined as
microcellular foams, while pore sizes falling in the nanometer range, polymer foams
are identified as nanofoams. The other way of characterizing polymer foams is based
on interconnectivity among contacting cells. Open celled foams feature
6
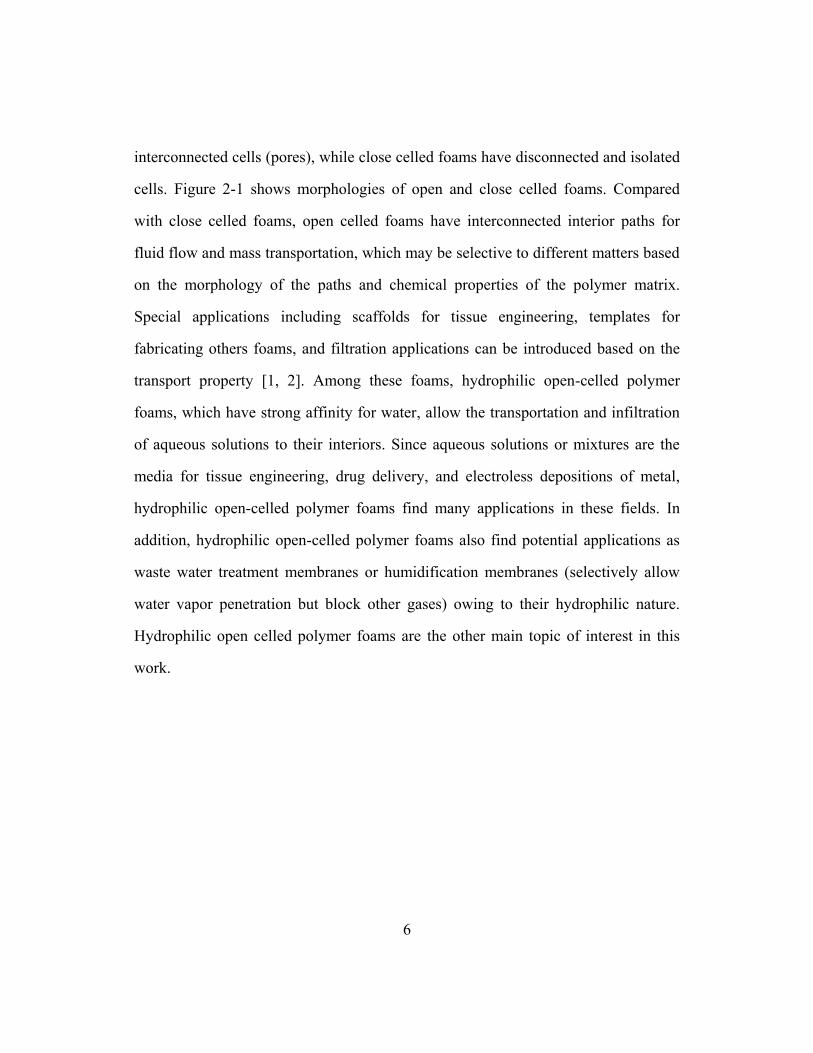
interconnected cells (pores), while close celled foams have disconnected and isolated
cells. Figure 2-1 shows morphologies of open and close celled foams. Compared
with close celled foams, open celled foams have interconnected interior paths for
fluid flow and mass transportation, which may be selective to different matters based
on the morphology of the paths and chemical properties of the polymer matrix.
Special applications including scaffolds for tissue engineering, templates for
fabricating others foams, and filtration applications can be introduced based on the
transport property [1, 2]. Among these foams, hydrophilic open-celled polymer
foams, which have strong affinity for water, allow the transportation and infiltration
of aqueous solutions to their interiors. Since aqueous solutions or mixtures are the
media for tissue engineering, drug delivery, and electroless depositions of metal,
hydrophilic open-celled polymer foams find many applications in these fields. In
addition, hydrophilic open-celled polymer foams also find potential applications as
waste water treatment membranes or humidification membranes (selectively allow
water vapor penetration but block other gases) owing to their hydrophilic nature.
Hydrophilic open celled polymer foams are the other main topic of interest in this
work.
7
(a)
(b)
Figure 2-1. Schematics of (a) an open-celled and (b) a close-celled polymer foam
2.2 FABRICATION TECHNIQUES FOR HYDROPHILIC POLYMER TEMPLATES AND
FOAMS
A number of methodologies have been developed to fabricate porous
polymers for applications in metal foam fabrication, filtration, and tissue
engineering. These techniques included melt molding and selective leaching, solvent
casting and leaching, immiscible polymer blending and extraction, block co-polymer
degradation, emulsion polymerization, and solid state foaming of polymer matrix.
There are also many methods to create polymer microsphere assembly. A review of
these methods is presented in this section.

8
2.2.1 Fabrication techniques of hydrophilic polymer templates
To fabricate polymer templates, polymer microspheres are assembled into a
close-packed structure via specific methods such as suspension evaporation,
sedimentation, and compression [22]. Polymer microspheres are dispersed to a liquid
initially. The suspension is allowed to evaporate to settle microspheres on a substrate
positioned in it. The suspension is also kept at a static environment to allow the
microspheres to settle naturally at the bottom of the container. In addition, filters
with pores smaller than the microspheres can be applied to remove liquid from the
suspension and assembled microspheres. Xiao et al. assembled polymer templates
with the sedimentation of PS spheres. The porosity of the obtained face-centered-
cubic structure is 26% regardless the sphere size, and the pore (space among
microspheres) size is around 100 nm determined by the applied spheres of 500 nm in
diameter [19]. Zhang et al. assembled polymer templates employing an evaporation
method with a PS sphere/water suspension. The porosity is also 26% and the pore
size is smaller than 100 nm. The drawbacks of this technique include low fabrication
efficiency, high complexity, and high cost because of the well-defined polymeric
spheres used.
In general, polymer templates with a wide range of porosity (10 – 90%) and
pore size (a few nanometers to a hundreds of microns) can be fabricated with the
above techniques. However, hydrophilic polymer templates were rarely reported.
The hydrophilicity can benefit the diffusion of aqueous metal plating electrolyte into
the polymer templates. There is a need for new techniques to enhance the
hydrophilicity of polymer templates.
9
2.2.2 Fabrication techniques of open-celled hydrophilic polymer foams
2.2.2.1 Melt blending and selective leaching
With this technique, polymers were melted and mixed with particles with a
device such as an extruder. The mixture can then be shaped with an injection
molding machine or a hot press. This technique can be employed without solvent
because of the introduction of mechanical mixing. Foams with porosities from 36 to
94% have been fabricated with this technique. Cui et al. [24] fabricated hydrophilic
polymers foams (up to 64% porosity, 5 µm pore size) from poly(ε-caprolactone)
(PCL), poly(ethylene-oxide) (PEO), NaCl, and hydroxyapatite composites. The
drawbacks of this technique are that the pore size and shape are determined by the
applied salt particles, and that residue salt particles might be trapped in the polymer
matrix.
2.2.2.2 Block co-polymers degradation
Block co-polymer is a long chain molecule produced from controlled
polymerization of two monomers. The domains of different monomers form two
phases when cooled and crystallized. One of the phases is extracted by chemical
degradation to result in a nanoporous structure. The pore size formed from this
technique is mostly less than 50 nm inherited from the size of the phases. Kang et al.
[25] fabricated nanoporous hydrogel (water containing hydrophilic or water soluble
polymer) using block co-polymer of cross linked PCL-b-PEO-b-PCL. The PCL
section was extracted and the resulted pore size is less than 50 nm. The drawback of
this technique is the complex procedure and application of multiple chemicals during
polymerization and phase extraction. In addition, the hydrogel needs to be kept at a
10
certain humidity level to maintain its morphology, limiting its applications in low
humidity conditions.
2.2.2.3 Emulsion polymerization
In emulsion polymerization of a porous structure, monomers are initially
dispersed to a non-solvent and stabilized by surfactants or nanoparticles to form an
emulsion with monomers located among non-solvent droplets. The emulsion is
polymerized to solidify the monomers, and a porous structure will be formed after
removal of the non-solvent [26]. Hua et al. fabricated open celled hydrophilic
poly(acrylamide) porous structure from polymerization of Titania nanoparticles
stabilized acrylamide/water solution in paraffin emulsion [26]. The pore sizes are in
the range of 10-200 µm, and the porosities are dependent on the ratio of water and
oil phase. The drawbacks of this technique include the use of organic solvent, the
complexity of the process, and the problems associated with polymerization and
monomer conversion.
2.2.2.4 Solution casting and phase separation
In this approach, polymer solution is cast into a mold featuring a desired
shape. A porous structure is induced by phase separation resulting from solution
evaporation. Foams with a porosity higher than 50% and 5-15 µm pore size are
fabricated with this technique. The drawbacks of this approach include employment
of solvents, limited thickness of foams, and existing of solid skin layers. Zhao et al.
[27] fabricated porous hydrophilic poly(vinylidene fluoride) (PVDF) membranes
(porosity > 75% and pore size < 20 µm) via evaporation induced phase separation in
PVDF, hyperbranched polyglycerol, and N,N-dimethylacetamide solution.

11
2.2.2.5 Immiscible polymer blending and extraction
In the process, multiple immiscible polymers are melt-blended with an
extruder to generate a co-continuous structure. An interconnected porous structure is
formed by selective extraction of one or more phases with a proper solvent. The
phase sizes formed from this technique are limited by the high viscosity of polymer
and the capability of mechanical stirring, mostly on the level of ten to one hundred
micrometers. Hence, the foam pore sizes are on the same level. Virgilio et al. [28]
fabricated high porosity hydrophilic polymer foams through melt blending and
solvent extraction of quaternary ethylene propylene diene rubber/PCL/PS/ploy lactic
acid (PLA) composite. A maximum porosity of around 95% and pore size of 5-100
µm were obtained. Sundarram and Jiang et al. [29] fabricated high porosity ethylene
acrylic acid (EAA) foams via melt processing of blends of EAA and PS. The
hydrophilic foams have porosity as high as 55 % and pore size of around 4 µm.
Again, this technique is not capable of controlling pore size and porosity of
fabricated foams to a wide range.
2.2.2.6 Solid-state foaming of polymer matrix
With the solid-state foaming technique, formation of both micro and nano
pore sized polymer foams are induced by bubble nucleation and gas diffusion in a
polymer matrix. Thermoplastic polymers are needed due to the requirement of
viscosity and flowability change during foaming [30]. The polymer samples with
various shapes are initially saturated under a high pressure gas to obtain a certain gas
concentration (including equilibrium concentration). Depending on the solubility in
polymer matrix, the gas can generally be carbon dioxide or nitrogen. After
saturation, the polymer matrix is foamed via nucleation and formation of bubbles
12
when experiencing a thermodynamic instability, which could be either a sudden
increase in temperature or a rapid drop in pressure. The solid-state foaming
technique has been applied to many thermoplastic polymers such as PMMA and
EAA. Polymer foams with pore sizes ranging from 400 nm to 100 µm and porosity
from 10 to 80% have been fabricated applying this technique [30-32]. The major
advantage of this technique is its ability of controlling the pore size and porosity of
fabricated polymer foams. However, the foams produced with this technique feature
a graded structure with mostly closed cells [33-35], and the pore size of foamed
polymers are mostly on the micron level. In addition, the gas concentration may
decrease in some polymers because of polymer crystallization under a high
saturation pressure. The decrease in gas concentration may introduce difficulty in
foaming polymers to achieve desired morphology.
2.3 MICROCELLULAR NICKEL FOAMS
Microcellular metal [6] foams are materials with the advantages of both solid
metals and those of porous materials [36, 37]. They feature low density, high internal
surface area, high electrical conductivity, and high thermal conductivity. As a metal
foam, high porosity microcellular nickel foams attract significant attention in recent
years due to their potential in emerging applications such as electrodes for high
efficiency lithium ion batteries, fuel cells, and nickel-zinc batteries [38, 39]. Nickel
foams can also be used as templates for fabricating 3D graphene and ultrathin
graphite foams [40-43]. In addition, they can be used as catalyst carriers for more
efficient chemical reactions and media for filtering, electromagnetic shielding, and
fluid pressure buffering.
13
Various fabrication methods have been developed [38, 39, 44-61] for nickel
foams. These methods include solid-gas eutectic solidification, powder metallurgy,
sintering of hollow spheres, mechanical stirring of nickel melt, casting of nickel melt
into porous foam, and vapor deposition, electro deposition, and electroless deposition
onto polymer templates.
2.3.1 Solid-gas eutectic solidification
In the solid-gas eutectic solidification technique, nickel metal is melted under
pressurized hydrogen. After the casting of the gas containing melt to a mold, the
trapped hydrogen starts escaping and induces the formation of foam. The pore size is
determined by the pressure of hydrogen in the melt, the residue hydrogen pressure
during crystallization of nickel and the temperature of molten metal [62]. The
disadvantages of this technique include the requirement of a high temperature
device, high energy consumption, and the formation of closed cells.
2.3.2 Powder metallurgy
Fine metal powder can be used to form porous metals through the powder
metallurgy technique. Generally, fine metal powder and proper spacing powder are
mixed together and compression molded to a specific shape and density. The molded
blocks are thermally treated to decompose the spacing powder and to sinter the fine
metallic powder compact, which forms a porous structure. However, foams
fabricated with this technique feature a low porosity. A high temperature operation
device is needed and the operation environment may be hazardous [63].
14
2.3.3 Hollow sphere sintering
Hollow nickel spheres with specific shell thickness have been applied to form
porous nickel foams by sintering. The hollow nickel spheres are generally fabricated
by depositing metal or coating and sintering metal slurry on polymer spheres [6]
[64]. The sizes of hollow metal spheres are determined by the polymer spheres, and
are generally in the range of several hundred micrometers to a few millimeters.
Hence, hollow sphere sintering results in large pore sizes up to 8 mm.
2.3.4 Mechanical stirring
Nickel foams can be produced from molten nickel by mechanical stirring
[44]. A high speed mechanical stirrer can be applied to nickel melt to generate air
bubbles. The bubbles can be captured to form pores when the nickel melt is
quenched rapidly. This method shows advantages of producing high porosity (90%)
nickel foam rapidly in large volumes and with a low cost; however, the foam shows
disadvantages of brittleness and big pore size of several hundred microns.
2.3.5 Melt casting
Another technique for fabricating nickel foams is to cast nickel melt into
porous foams [44]. Polymeric foams are filled with heat resistant materials such as a
mixture of calcium carbonate, phenolic resin and mullite. Nickel melt is cast into the
space left by the burned polymer, and nickel foam is obtained by removing the heat
resistant material using high pressure water. The limitation of this method is that it
can only be used to fabricate nickel foams with large pores due to the difficulty of
filling polymeric foams smaller than 100 µm.
15
2.3.6 Polymer patterning
Nickel foams are also made by depositing nickel on polymer foam templates
via vapor deposition, electrodeposition, and electroless deposition. The templates are
either foamed polymers or close-packed polymer sphere templates. Nickel foams
with inversed structure with polymer templates are produced after the removal of
polymer templates via solvent leaching or thermal treatment. The fabricated nickel
foams inherit pore size and morphology from the applied templates, hence their
porous structure is controllable with the selection of polymer templates [65].
Inorganic templates are not favored because they need to be removed with hazardous
acid or base solutions, after the electroplating of nickel foams.
Polymer foams are the main templates for vapor deposition of nickel foams.
Polyurethane sponge is an example of foamed polymer used as a substrate for nickel
foam fabrication. The pore sizes of these foams range from 200 µm to 4 mm [39,
66]. Commercially available nickel foam, INCOFOAM, is fabricated via chemical
vapor deposition on polyurethane foams. However, the vapor deposition technique is
only applicable to templates with large pores (several hundred micrometers) owing
to the problem of slow vapor diffusion.
Electrodeposition and electroless deposition methods have been used to
fabricate smaller pore sized nickel foams compared with the methods discussed
above. Brown et al. [59] electrodeposited and electroless deposited nickel foams on
an open celled polymer foam with a porosity up to 97% and pore size around 20 µm.
This process applied polymer templates produced with an emulsion technology,
hence provided little control over pore size. Zhang et al. fabricated nickel foam via
electrodeposition on a polystyrene opal template, in which the sphere diameter is
16
around 2 µm [54]. However, only a few layers of polymer spheres were assembled
and the thickness of the fabricated nickel foam is less than 50 µm.
The fabrication of bulk microcellular nickel foams is challenging, and yet
promises many important applications. Efficient methods of fabricating bulk nickel
foams with micro pores (1-100 µm) are lacking. Among the many metal foam
fabrication methods, electroplating of close-packed sphere templates is considered a
promising approach to microcellular nickel foam fabrication due to its ability to
control the pore size and to produce highly ordered microstructures [13, 14].
However, as the sphere size or pore size becomes smaller while the overall foam size
remains at a bulk level, many challenges arise. For example, the electrodeposition
process will be limited by ion-diffusion into the small pore sized polymer templates.
2.4 MODELING OF ION DIFFUSION IN POROUS MEDIA AND NI PLATING PROCESS
Models regarding principles of both electro- and electroless deposition have
been studied extensively in the past. Many theoretical and empirical models have
been developed to explain the mechanisms of the process and predict the optimal
plating conditions; however, most of the existing models only investigated the
plating process on planar surfaces. In those models, the effect of current waveform,
frequency, and duty cycle on plated metal structure were studied for electroplating;
the effect of electrolyte concentration, composition, and temperature were
investigated for electroless plating. A few models studied the metal electroplating
employing alternating current in deep wells with micron level diameters, although
metal foams have been fabricated with electroplating of polymer nanosphere
templates [19]. The ion diffusion models in porous media have also been
investigated. However, the correlation between ion diffusion and plated metal
17
thickness and thickness distribution in porous media does not exist. This section
provides a review of analytical and numerical models that have been developed to
describe the ion diffusion and electroless metal plating on planar surfaces, and
electroplating on both planar surfaces and deep micro wells.
2.4.1 Electroplating models
A number of analytical models have been developed to describe metal
electroplating on planar surfaces and in deep micro wells. The models are based on
the ion diffusion from electrolyte toward the plating surface and the ion
concentration near the surface is regulated by the plating current parameters [45]. In
general, the morphology of plated metal is determined by the near surface ion
concentration [67]. Wong et al. proposed a model to define the surface finish under
currents with different waveforms. This model became foundation of many other
models that were developed subsequently. The protrusion height of plated metal, h,
which affects the surface roughness of plated metal, is defined as,
ℎ = ℎ0 ∙ 𝑒𝑥𝑝 {𝑖∙𝑑
𝑛𝑧𝐹𝐷[(𝐶𝑒′−𝐶𝑒)+𝑚(𝐶0−𝐶𝑒
′)]} (2-1)
where ℎ0 is the initial height of a protrusion, 𝑖 is the applied current density above
the protrusion, d is the thickness of the formed metal underneath the protrusion, n
and m are unit-less numbers decided by the shape of current waveform, z is the
number of electron transferred when reducing one metal ion, F is Faraday’s constant,
D is a constant diffusion coefficient in the cases of both planar surface and deep
well, 𝐶0 is bulk ion concentration, 𝐶𝑒 is the interfacial ion concentration on the
18
border of bulk electrolyte and diffusion layer, 𝐶𝑒′ is the ion concentration near the
plating surface.
Chung [68] provided an equation to relate the ion flux toward plating
surface to the ion concentration at the plating surface.
𝐶𝑒′
𝐶0= 1 − 8𝛿
𝜋2𝑧𝐹𝐷𝐶0∑ 1
(2𝑛−1)2∞𝑛=0 × {𝑖 ∙ 1−𝑒𝑥𝑝 [𝑥1∙𝑇/(𝑟+1)]
1−𝑒𝑥𝑝 [𝑥1∙𝑇]} (2-2)
where 𝛿 is the diffusion layer thickness decided by stirring rate of electrolyte and D,
𝑥1 is a constant decided by 𝛿 and 𝐷, 𝑇 is the operation temperature, and r is duty
cycle of applied current. The ion flux toward plating surface can be expressed as
𝐽 = 𝑖
𝑧𝐹𝐷 (2-3)
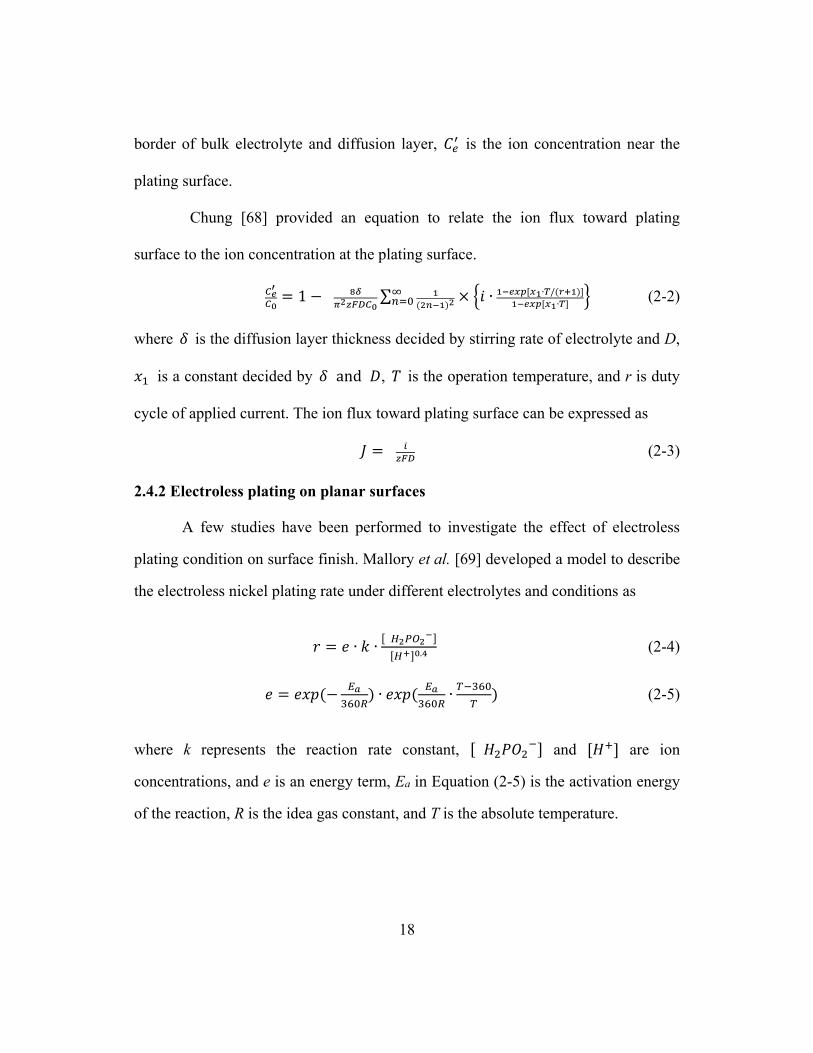
2.4.2 Electroless plating on planar surfaces
A few studies have been performed to investigate the effect of electroless
plating condition on surface finish. Mallory et al. [69] developed a model to describe
the electroless nickel plating rate under different electrolytes and conditions as
𝑟 = 𝑒 ∙ 𝑘 ∙[ 𝐻2𝑃𝑂2
−]
[𝐻+]0.4 (2-4)
𝑒 = 𝑒𝑥𝑝 (−𝐸𝑎
360𝑅) ∙ 𝑒𝑥𝑝 (
𝐸𝑎
360𝑅∙𝑇−360
𝑇) (2-5)
where k represents the reaction rate constant, [ 𝐻2𝑃𝑂2−] and [𝐻+] are ion
concentrations, and e is an energy term, Ea in Equation (2-5) is the activation energy
of the reaction, R is the idea gas constant, and T is the absolute temperature.
19
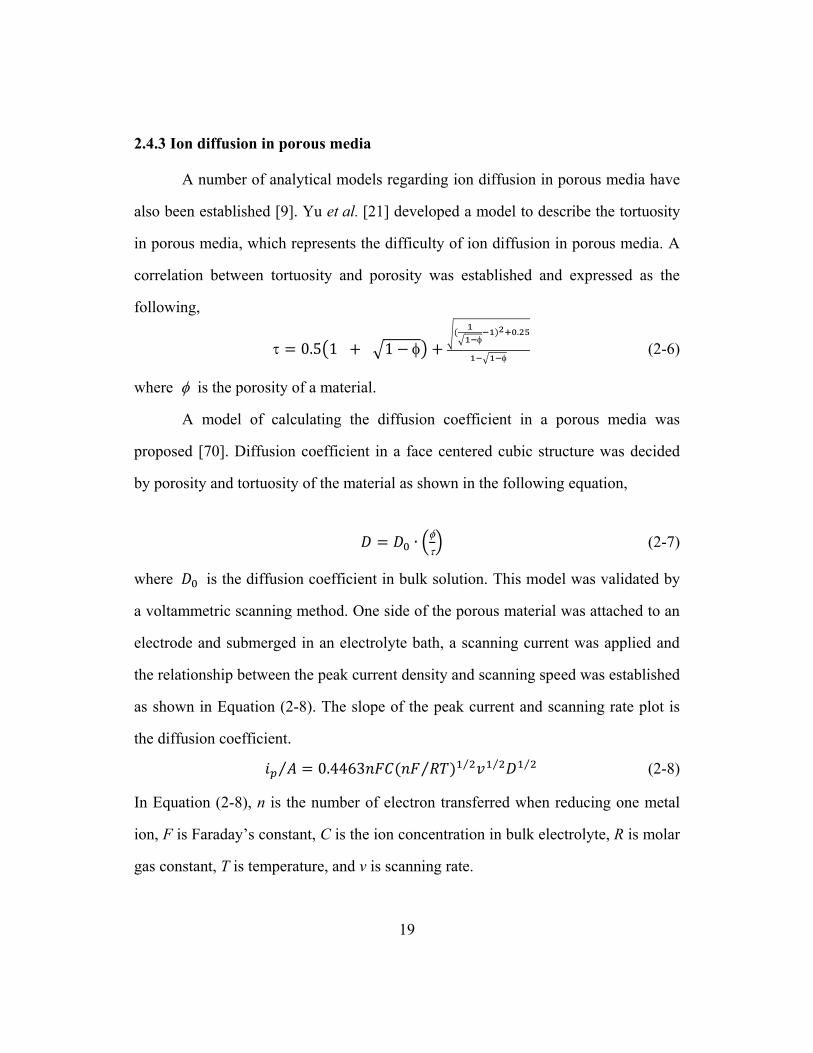
2.4.3 Ion diffusion in porous media
A number of analytical models regarding ion diffusion in porous media have
also been established [9]. Yu et al. [21] developed a model to describe the tortuosity
in porous media, which represents the difficulty of ion diffusion in porous media. A
correlation between tortuosity and porosity was established and expressed as the
following,
= 0.5(1 + √1 − ) +√(
1
√1−−1)2+0.25
1−√1− (2-6)
where is the porosity of a material.
A model of calculating the diffusion coefficient in a porous media was
proposed [70]. Diffusion coefficient in a face centered cubic structure was decided
by porosity and tortuosity of the material as shown in the following equation,
𝐷 = 𝐷0 ∙ (
) (2-7)
where 𝐷0 is the diffusion coefficient in bulk solution. This model was validated by
a voltammetric scanning method. One side of the porous material was attached to an
electrode and submerged in an electrolyte bath, a scanning current was applied and
the relationship between the peak current density and scanning speed was established
as shown in Equation (2-8). The slope of the peak current and scanning rate plot is
the diffusion coefficient.
𝑖𝑝 𝐴 = 0.4463𝑛𝐹𝐶(𝑛𝐹 𝑅𝑇⁄ )1 2⁄ 𝑣1 2⁄ 𝐷1 2⁄⁄ (2-8)
In Equation (2-8), n is the number of electron transferred when reducing one metal
ion, F is Faraday’s constant, C is the ion concentration in bulk electrolyte, R is molar
gas constant, T is temperature, and v is scanning rate.
20
As seen in the review above, the developed models do not consider the
electroplating and electroless plating in porous media. This study builds upon the
reviewed work by combining the ion diffusion in porous media and
electroless/electroplating reaction mechanisms to understand electropolishing
assisted electroless metal plating in porous media.
2.5 FABRICATION OF 3D GRAPHENE FOAMS
3D graphene foams are currently under intense study because of their high
electrical and thermal conductivities and the lightweight property [13, 14, 15, 16].
Batteries with dramatically improved performance with such graphitic electrodes
have been envisioned [11, 14].
Currently 3D graphene foams and graphitic foams have been fabricated
through chemical vapor deposition (CVD) on commercially available Ni foams and
surface modified commercial Ni foams [12, 17, 18, 19]. The drawback of these
foams is their relatively low specific surface areas inherited from the commercial Ni
foam templates, which have pore sizes on the level of several hundred micrometers.
On the other hand, nanocellular nickel foams have been recently fabricated with a
sphere-template electrodeposition method [20, 21, 22, 23]. However, the method
itself is limited by the Ni ion diffusivity in the narrow channels [22, 24]. As a result,
the foams that were demonstrated had only a few layers of pores and the overall
thickness was only a few micrometers. In addition, large cracks occur in plane about
every 50 µm in the obtained foams. More importantly, Ni foams with pore sizes
smaller than 20 µm have shown insufficient thermal stability at the temperature
required for graphite/graphene formation [25, 26] in CVD fabrication process.

21
Three-dimensional graphene foams of pore size smaller than a few microns
have been fabricated using the self-assembly of polystyrene (PS) sphere and
graphene oxide via an infiltration approach [27]. Graphene oxide and PS spheres
were dispersed in a solution separately followed by the infiltration of both
dispersions through a filter. Graphene oxide was reduced and pH was controlled to
form a PS embedded graphene film. 3D porous graphene foam was obtained after the
solvent leaching off of PS. The limitation of this technique is the lack of control over
interstitial openings (channels) of the graphene foam, because there is no sintering of
PS or following enlarging process of the openings. Narrow openings may lead to low
mass transport capacity. Xiao et al. fabricated nano graphene foam employing a
lithographically produced carbon foam [28]. 3D porous carbon foam was fabricated
by patterning a photoresist polymer followed by a hydrolyzing step. The 3D porous
carbon foam was sputter-coated with Ni and then converted to graphene by
annealing the C/Ni composite and etching off of Ni afterward. The limitation of this
approach is the depth in the carbon foam reachable by sputter coating.
Electrodeposition may potentially provide thick Ni coated carbon foam; however, the
removal of carbon substrate remains a problem. The remaining carbon substrate may
result in a high density and low electrical and thermal properties of obtained
graphene foam. Overall, the fabrication of bulk 3D graphene foams with high
specific surface area, high mass transport capacity, and low fabrication complexity is
still challenging.
22
Chapter 3. Hydrophilic Polymer Microsphere Templates
3.1 INTRODUCTION
Polymer templates assembled with microsphere is a three-dimensional
periodic structure. As described in Chapter 2, it emerged as an important system due
to its potentials in optical and biomedical applications and as templates of inverse
microcellular structure for metal foam fabrication [71]. A variety of techniques exist
to fabricate polymer microsphere templates such as gravitational sedimentation,
centrifugation, vertical deposition, slit fitting or pressing of microspheres in molds,
and assembly of microspheres on liquid surface [72]. Those techniques show
capability of fabricating polymer microsphere templates with sphere diameter of 10
nm to 2 µm and a thickness up to 30 µm. However, in some applications such as the
fabrication of metal foams, the polymer templates applied as templates are required
to feature hydrophilicity to enhance the aqueous solution diffusivity in templates.
In this chapter, techniques of fabricating hydrophilic paraffin spheres and
PMMA spheres are presented. The assembly of hydrophilic polymer microsphere
templates is also discussed. The major advantage of this technique is that hydrophilic
foams with different sized microspheres can be assembled efficiently and pore sizes
are controllable via selection of microspheres. Hydrophilic paraffin microspheres
were fabricated with an oil/water emulsion. PMMA microspheres were hydrolyzed
using aqueous acid solution. Paraffin, PMMA, and commercial hydrophilic ethylene
acrylic acid (EAA) microspheres were assembled into bulk polymer templates via a
compression molding, a sonication assisted sedimentation , and an efficient filtration
approach, respectively.

23
3.2 EXPERIMENTAL
3.2.1 Materials
Ethylene acrylic acid (EAA) microspheres (Kobb Inc.) were selected as one
candidate material for opal making due to their low cost (compared with hydro group
decorated polystyrene microspheres), hydrophilic property (ensuring a high degree
of uptake of the electroplating solution), good morphology (spherical shape and
smooth surface), and small sizes ranging from 1 to 10 µm. Paraffin and Sodium
Aliphatate (Amazon) were applied as raw materials to fabricate hydrophilic paraffin
microspheres. Polyvinyl alcohol (PVA) was purchased from Fisher Scientific Inc.
Poly methyl methacrylate (PMMA) (Sigma Aldrich Inc.) microspheres were selected
to assemble PMMA templates due to their low cost and ability of being hydrolyzed.
The molecular structures of EAA, paraffin and PMMA are shown in Figure
3-1 and their properties summarized in Table 3-1.
Figure 3-1. Molecular structures of paraffin, PMMA, and EAA
24
Table 3-1. Properties of paraffin, PMMA, and EAA
Property paraffin PMMA EAA
Density ( g cm-3) 0.9 1.18 0.938
Melting temperature ( ºC) 45-60 160 101
Contact angle with water (°) 109 85.4 69.1
3.2.2 Fabrication of hydrophilic paraffin microspheres
Hydrophilic paraffin microspheres were fabricated using an oil in water
emulsion method. PVA was applied as a surfactant and dissolved in deionized water
to make a 0.5% (g/ml) solution. The PVA solution was heated to 70 C under a
stirring condition of 600 rpm (IKA RW20 mechanical stirrer). Paraffin and Sodium
Aliphatate were melt-mixed under magnetic stirring in a glass beaker at 210 C on a
magnetic stirrer hot plate (Cole-Parmer Instrument, Model 4803-00). The mixture
was added into the PVA solution and stirred for 30 min under 1000 rpm. Ice-cold
water was added into the stirred suspension to solidify the paraffin spheres. The
suspension was poured into a sieve with a pore size of 40 µm to filter away smaller
spheres. The paraffin microspheres were then washed with deionized water three
times and transferred to a piece of filter paper. The spheres were dried in air for 3
days.
25
Table 3-2. Parameters for fabricating paraffin microspheres
Sample Sodium Aliphatate (%) Melting T (C)
1 5 210
2 10 210
3 20 210
3.2.3 Hydrolyzation of PMMA microspheres
As sphere sizes go below 100 µm, the separation of spheres becomes
challenging. Several methods have been proposed including viscous liquid
separation, laminar fluid separation, and centrifuge separation [73, 74]. When
employed, these methods either need a liquid system having a specific viscosity or
specifically designed devices. In this study, we employed metallic sieves with
opening sizes of 53, 63, 75, 90, and 105 µm (H&C Sieving Systems, Inc.) for
spheres sorting. Separation was operated at room temperature (25 C) in sieves
submerged in an ultrasonic water bath. After separation in one sieve, the spheres in
ultrasonic bath are filtered out and transferred to another sieve with a smaller mesh
size. Spheres falling into different grades are dehydrated and stored separately.
To gain hydrophilicity, PMMA spheres was etched using a sulfuric acid
based solution (K2Cr2O7 10%, water 25%, H2SO4 65%, 10M). To ensure wettability
of PMMA spheres in the sulfuric acid based solution, PMMA spheres were wetted
with ethanol followed by rinsing of DI water. The PMMA spheres were then
dispersed into a sulfuric acid solution preheated to 50 C and etched for 30 min.
K2Cr2O7 and H2SO4 are strong oxidants and can introduce hydroxyl groups to
PMMA surface [75].
26
3.2.4 Assembly of hydrophilic polymer templates with spheres
Three different methods are used to fabricate EAA, paraffin and PMMA
templates due to their different characteristics. For EAA, the microspheres are
deposited to form templates by an efficient filtering method, because EAA
microspheres tend to float on water surface but deposit naturally. EAA spheres are
dispersed into deionized water to form a 2%‒5% (g/ml) suspension. The mixture is
then feed into a device shown in Figure 3-2 (top) using a 10 ml plastic syringe.
Several layers of filter paper are placed at the bottom of a plastic tube. Water is
extracted through the bottom paper filter, and the extracting process is accelerated by
applying vacuum. Thickness of EAA templates can be controlled by the feeding
volume. In this work, templates with a thickness of 3 mm and a diameter of 26 mm
are obtained with a fabrication time of 1 hour. After dehydrated at room temperature
to remove water, the templates are sintered at 110 C in a vacuum oven (MTI EQ-
DZF-6020). The sintering time varies with the thickness of the template.
Paraffin microspheres are made into templates with an aluminum mold with a
diameter of 20 mm. The mold is then vibrated for 15 min on a vibrating table to
settle paraffin spheres to their favorite positions. The sample is sintered at 40 C in a
vacuum oven. The sintering time varies to tune the bonding strength among spheres.
PMMA microspheres are assembled to templates by employing an ultra-
sonication assisted sedimentation approach. PMMA microspheres are loaded to a
mold consisting of two pieces of glass slides and a silicon rubber gasket. Ethanol is
added to function as both lubricant and suspending media of the PMMA
sedimentation. The mold is positioned in an ultra-sonication bath for 1 h at 25 C.
The mold is then kept at ambient to allow the evaporation of ethanol. The mold is
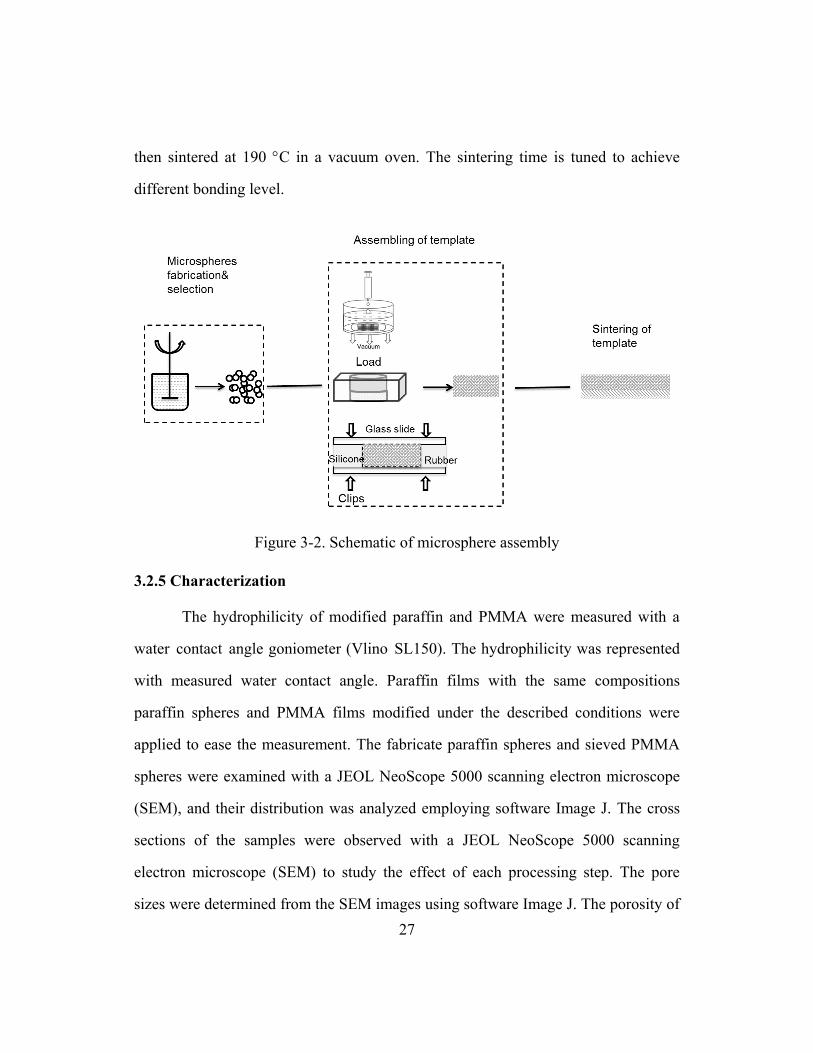
27
then sintered at 190 C in a vacuum oven. The sintering time is tuned to achieve
different bonding level.
Figure 3-2. Schematic of microsphere assembly
3.2.5 Characterization
The hydrophilicity of modified paraffin and PMMA were measured with a
water contact angle goniometer (Vlino SL150). The hydrophilicity was represented
with measured water contact angle. Paraffin films with the same compositions
paraffin spheres and PMMA films modified under the described conditions were
applied to ease the measurement. The fabricate paraffin spheres and sieved PMMA
spheres were examined with a JEOL NeoScope 5000 scanning electron microscope
(SEM), and their distribution was analyzed employing software Image J. The cross
sections of the samples were observed with a JEOL NeoScope 5000 scanning
electron microscope (SEM) to study the effect of each processing step. The pore
sizes were determined from the SEM images using software Image J. The porosity of
28
the foamed blends was determined by an ethanol absorption method. The weight of
foams was measured initially. The templates were submerged in ethanol for 5 min to
allow the full saturation of ethanol. The templates were then removed from ethanol
and the ethanol on their surface was cleared carefully. The total weight of templates
and absorbed ethanol were measured. Porosities of templates were calculated using
the following equation.
=(Wtotal−Wtemplate)
ρethanol⁄
(Wtotal−Wtemplate)ρethanol⁄ +
Wtemplateρtemplate⁄
(3-1)
where Wtotal is the weight of template and absorbed ethanol, Wtemplate is the
weight of the template, ρtemplate is the density of template, and ρethanol is the
density of ethanol.
3.3 RESULTS AND DISCUSSION
3.3.1 Paraffin
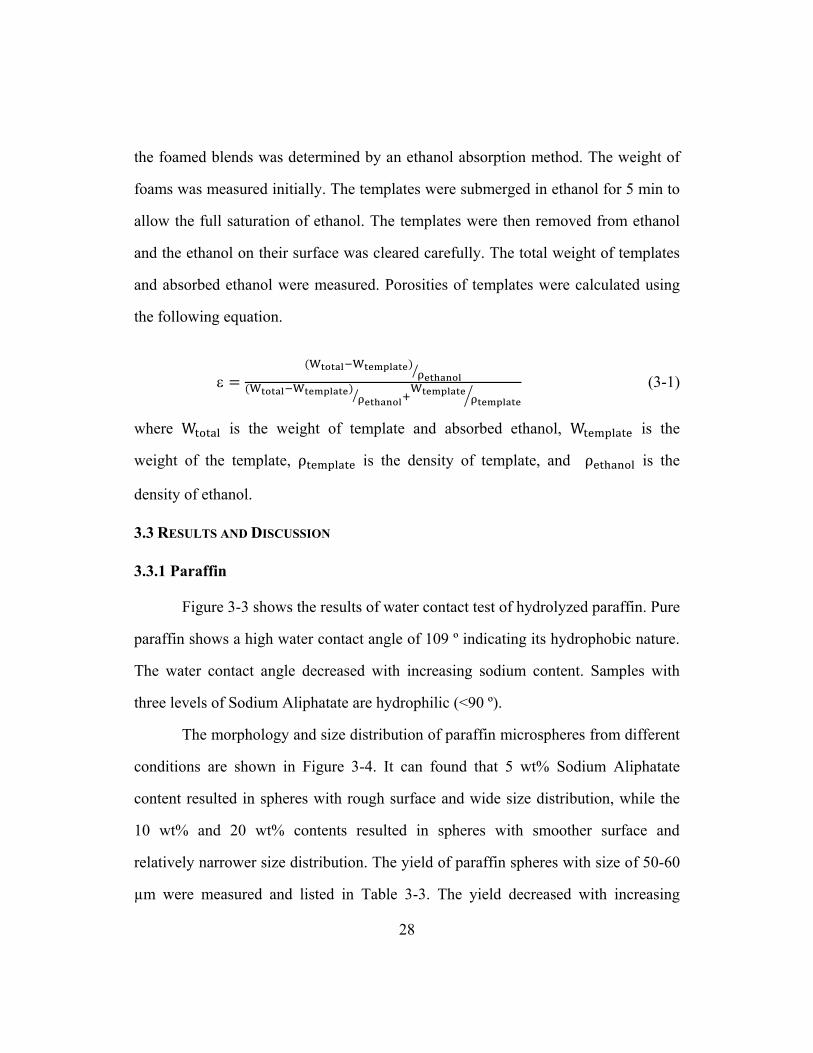
Figure 3-3 shows the results of water contact test of hydrolyzed paraffin. Pure
paraffin shows a high water contact angle of 109 º indicating its hydrophobic nature.
The water contact angle decreased with increasing sodium content. Samples with
three levels of Sodium Aliphatate are hydrophilic (<90 º).
The morphology and size distribution of paraffin microspheres from different
conditions are shown in Figure 3-4. It can found that 5 wt% Sodium Aliphatate
content resulted in spheres with rough surface and wide size distribution, while the
10 wt% and 20 wt% contents resulted in spheres with smoother surface and
relatively narrower size distribution. The yield of paraffin spheres with size of 50-60
µm were measured and listed in Table 3-3. The yield decreased with increasing
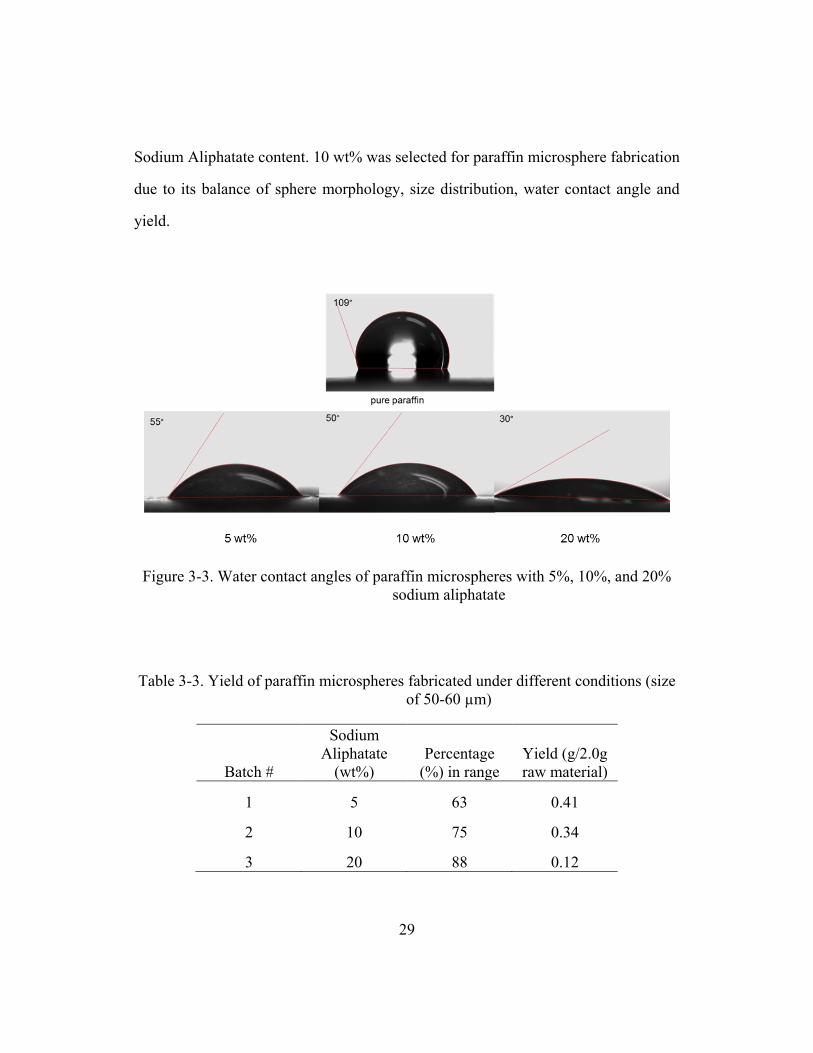
29
Sodium Aliphatate content. 10 wt% was selected for paraffin microsphere fabrication
due to its balance of sphere morphology, size distribution, water contact angle and
yield.
Figure 3-3. Water contact angles of paraffin microspheres with 5%, 10%, and 20%
sodium aliphatate
Table 3-3. Yield of paraffin microspheres fabricated under different conditions (size
of 50-60 µm)
Batch #
Sodium
Aliphatate
(wt%)
Percentage
(%) in range
Yield (g/2.0g
raw material)
1 5 63 0.41
2 10 75 0.34
3 20 88 0.12
30
Figure 3-4. Sphere sizes and distributions of paraffin microspheres with 5%, 10%,
and 20% sodium aliphatate
Paraffin templates were fabricated using spheres containing 10% sodium
aliphatate by the procedure described in Section 3.2.4. The obtained templates were
sintered in a two-step procedure to reduce the entire sintering time. In the first step,
template was kept in an aluminum mold and sintered for 1.7 h at 40 C to remove
residue water. The template was then transferred onto a piece of aluminum foil
(provide a faster heat transfer) and sintered for a specific time. The porosities of
templates with different sintering time were calculated using the method described in
Equation (3-1). SEM images were not taken from sintered paraffin templates,
because the paraffin spheres would melt during the sputter coating process.
Theoretically the porosity of a tightly packed face centered cubic structure is 26%.
The template sintered on Al foil for 10 min shows a porosity of 35.1%. This is
because the used paraffin spheres are not highly uniform. The porosity data in Table
3-4 indicate that the spheres sintered on Al foil longer than 20 min are likely bonded
31
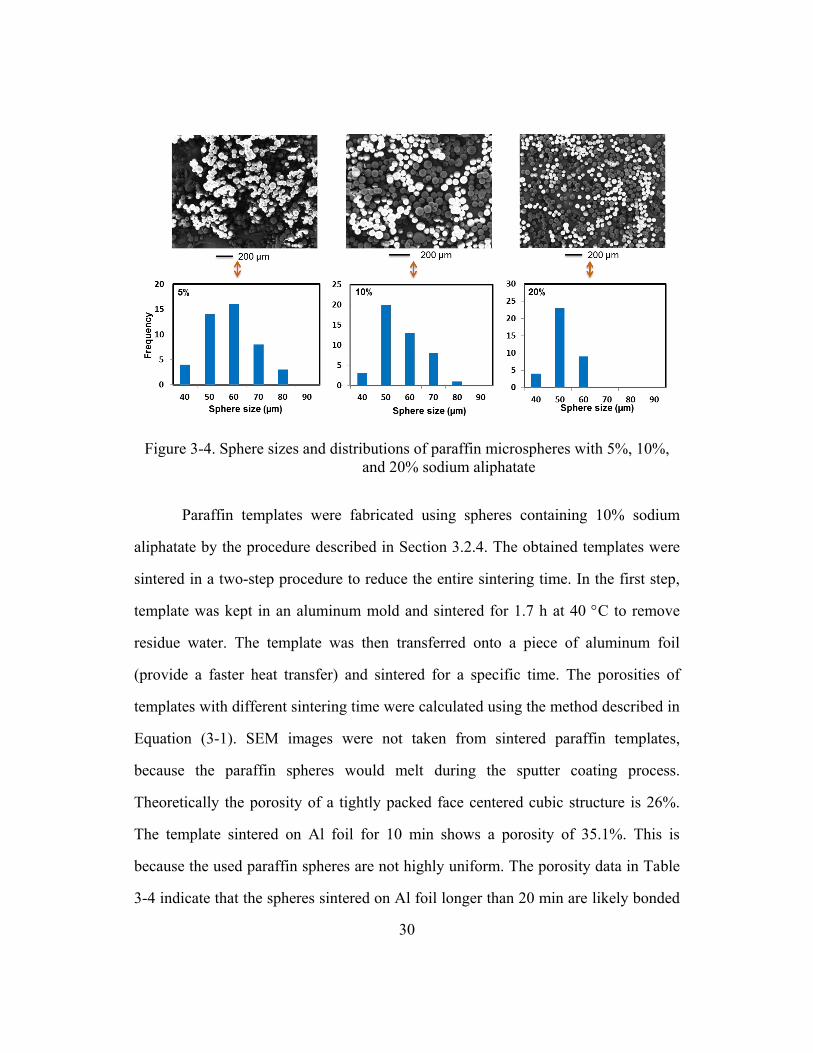
(porosity decreased from 35.1% to 29.2%). The template with a sintering time of 25
min was selected for potential metal plating substrate due to the easy penetration of
electroplating solution and its integrity in electroplating solution. As can be seen in
Figure 3-5, the electroplating solution has completely infiltrated the template,
exhibiting a greenish color of the solution.
Table 3-4. Porosity of paraffin foams sintered for different time
Sintering time
in mold (h)
Sintering time
on Al foil
(min)
Porosity
(%)
1.7 10 35.1
1.7 20 29.2
1.7 25 22.5
1.7 40 14
Figure 3-5. Paraffin template soaked in electroplating solution (25 min on Al foil)

32
3.3.2 PMMA
PMMA spheres are separated with sieves having 53, 63, 75, 90, and 105 µm
holes. The separated spheres fall between each grade. After being dehydrated, each
grade is examined using SEM. Sphere size distribution of each grade is analyzed
using the image processing software, Image J. The spheres in 105 µm range take the
highest portion of 50% out of all the PMMA spheres, and distribute mainly between
90 and 105 µm. Hence, this grade was selected to fabricate foams because of a
balance between yield and homogeneousness. Figure 3-6 demonstrates the spheres
and their distribution.
Figure 3-6. PMMA spheres (90-105 µm) image and size distribution
Figure 3-7. Water contact angle of hydrolyzed PMMA
0
5
10
15
20
85 90 95 100 105 110 More
Fre
qu
en
cy
Size (µm)
33
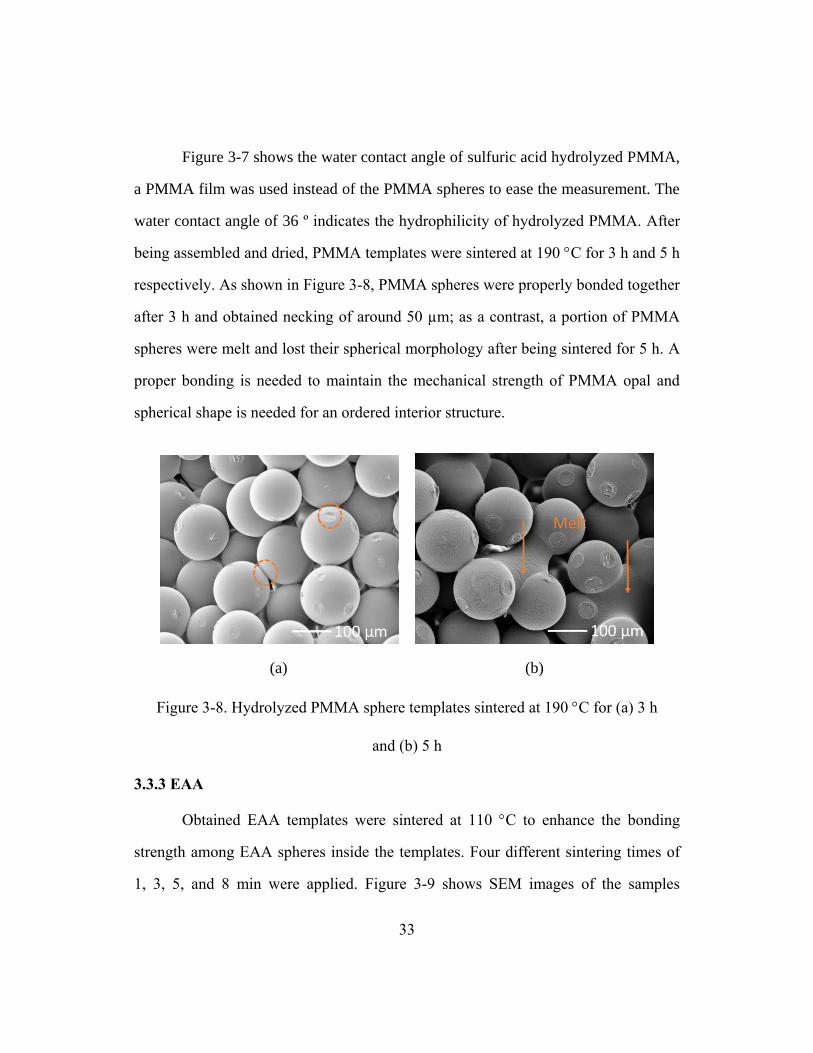
Figure 3-7 shows the water contact angle of sulfuric acid hydrolyzed PMMA,
a PMMA film was used instead of the PMMA spheres to ease the measurement. The
water contact angle of 36 º indicates the hydrophilicity of hydrolyzed PMMA. After
being assembled and dried, PMMA templates were sintered at 190 C for 3 h and 5 h
respectively. As shown in Figure 3-8, PMMA spheres were properly bonded together
after 3 h and obtained necking of around 50 µm; as a contrast, a portion of PMMA
spheres were melt and lost their spherical morphology after being sintered for 5 h. A
proper bonding is needed to maintain the mechanical strength of PMMA opal and
spherical shape is needed for an ordered interior structure.
(a) (b)
Figure 3-8. Hydrolyzed PMMA sphere templates sintered at 190 C for (a) 3 h
and (b) 5 h
3.3.3 EAA
Obtained EAA templates were sintered at 110 C to enhance the bonding
strength among EAA spheres inside the templates. Four different sintering times of
1, 3, 5, and 8 min were applied. Figure 3-9 shows SEM images of the samples
34
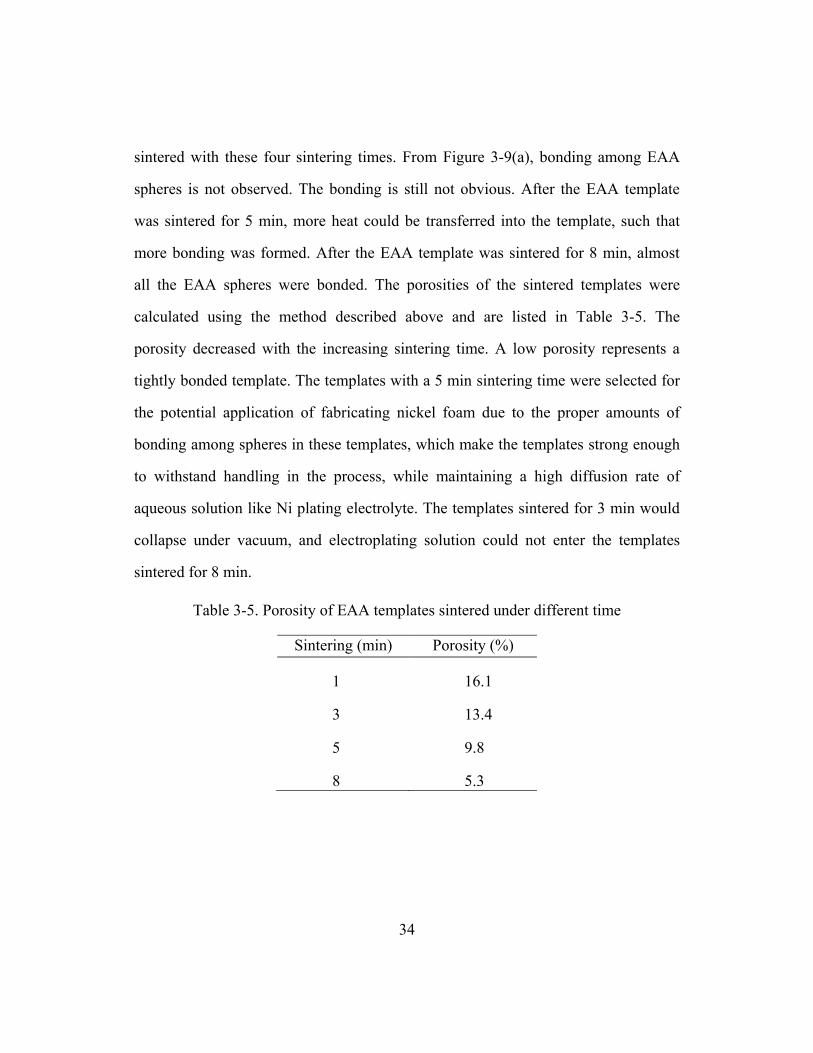
sintered with these four sintering times. From Figure 3-9(a), bonding among EAA
spheres is not observed. The bonding is still not obvious. After the EAA template
was sintered for 5 min, more heat could be transferred into the template, such that
more bonding was formed. After the EAA template was sintered for 8 min, almost
all the EAA spheres were bonded. The porosities of the sintered templates were
calculated using the method described above and are listed in Table 3-5. The
porosity decreased with the increasing sintering time. A low porosity represents a
tightly bonded template. The templates with a 5 min sintering time were selected for
the potential application of fabricating nickel foam due to the proper amounts of
bonding among spheres in these templates, which make the templates strong enough
to withstand handling in the process, while maintaining a high diffusion rate of
aqueous solution like Ni plating electrolyte. The templates sintered for 3 min would
collapse under vacuum, and electroplating solution could not enter the templates
sintered for 8 min.
Table 3-5. Porosity of EAA templates sintered under different time
Sintering (min) Porosity (%)
1 16.1
3 13.4
5 9.8
8 5.3

35
Figure 3-9. The SEM images of EAA templates sintered for different time
3.4 CONCLUSIONS
Three kinds of hydrophilic polymer microspheres with different size ranges
were fabricated or selected to fulfill the assembly of hydrophilic polymer templates
with different internal opening sizes. Hydrophilic paraffin microspheres with a size
range of 50-60 µm were fabricated using a PVA stabilized Sodium Aliphatate and
paraffin/water emulsion. 10 wt% Sodium Aliphatate resulted in a balance between
paraffin sphere size distribution, yield, and hydrophilicity. PMMA microspheres
were separated by applying sieves. PMMA microspheres with a size range of 90-105
µm were hydrolyzed with a simple H2SO4 aqueous solution to gain a water contact
angle of 36º. Paraffin, EAA, and PMMA microspheres were assembled into bulk
hydrophilic polymer templates via a compression molding, a sonication assisted
a (1 min)
c (5 min) d (8 min)
b (3 min)
36
sedimentation, and an efficient filtration approach. The templates were sintered
under different conditions to introduce bonding to spheres while maintaining specific
porosities. Process conditions of 40 C and 25 min, 110 C and 5 min, and 190 C
and 3 h were chosen for paraffin, EAA, and PMMA assemblies, respectively.
37
Chapter 4. Hydrophilic Poly(ethylene glycol)/Disulfonated
Poly(arylene ether sulfone) Micro/nano Foams
4.1 INTRODUCTION
Hydrophilic polymer micro and nano foams are critically important for many
infiltration and separation related applications. As described in the Introduction
chapter, the existing fabrications of hydrophilic polymer foams are either complex or
involving environmental hazardous chemicals. In addition, the foams fabricated are
mostly micro cellular foams with pore sizes of hundreds of microns. An efficient and
clean way of producing those foams is missing.
One important potential application of hydrophilic polymer foams is
humidification membranes for fuel cell. The humidification membrane is designed to
humidify the PEM using the exhaust gas of fuel cell [76]. The maintenance of proper
water content in the PEM is important for its performance. Currently, most
humidification membranes are made of Nafion (sulfonated tetrafluoroethylene based
fluoropolymer-copolymer), and are of high cost because of the difficulty of Nafion
fabrication. Alternatives with low cost, easy fabrication, and comparable
performance with Nafion are needed.
Polymer blends of random disulfonated poly(arylene ether sulfone)
copolymer (BPS) and hydroxyl-terminated poly(ethylene glycol) have found
widespread use as waste water treatment and water desalination membranes owing to
their highly hydrophilic nature and high water permeability [77]. The properties of
these membranes can be tuned according to the requirements by suitable
combination of different BPS and PEG contents. Lee et al. [78] first reported the
water permeability performance of PEG/BPS membranes. Subsequently, a variety of
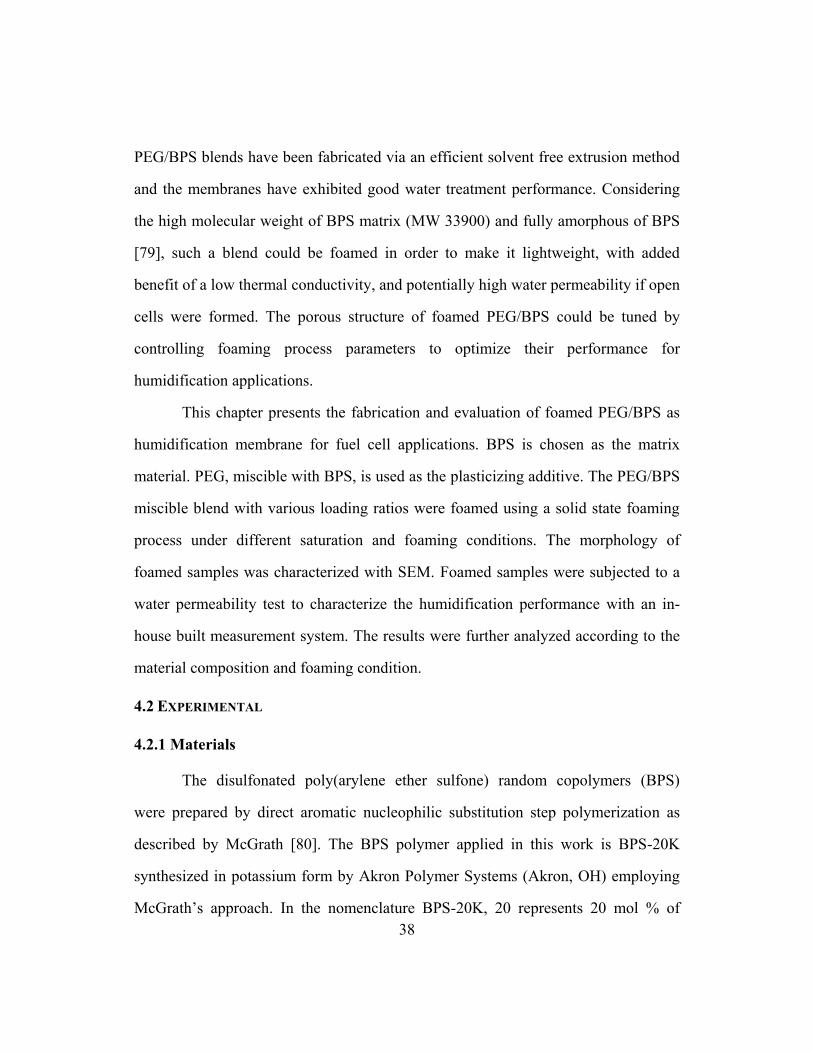
38
PEG/BPS blends have been fabricated via an efficient solvent free extrusion method
and the membranes have exhibited good water treatment performance. Considering
the high molecular weight of BPS matrix (MW 33900) and fully amorphous of BPS
[79], such a blend could be foamed in order to make it lightweight, with added
benefit of a low thermal conductivity, and potentially high water permeability if open
cells were formed. The porous structure of foamed PEG/BPS could be tuned by
controlling foaming process parameters to optimize their performance for
humidification applications.
This chapter presents the fabrication and evaluation of foamed PEG/BPS as
humidification membrane for fuel cell applications. BPS is chosen as the matrix
material. PEG, miscible with BPS, is used as the plasticizing additive. The PEG/BPS
miscible blend with various loading ratios were foamed using a solid state foaming
process under different saturation and foaming conditions. The morphology of
foamed samples was characterized with SEM. Foamed samples were subjected to a
water permeability test to characterize the humidification performance with an in-
house built measurement system. The results were further analyzed according to the
material composition and foaming condition.
4.2 EXPERIMENTAL
4.2.1 Materials
The disulfonated poly(arylene ether sulfone) random copolymers (BPS)
were prepared by direct aromatic nucleophilic substitution step polymerization as
described by McGrath [80]. The BPS polymer applied in this work is BPS-20K
synthesized in potassium form by Akron Polymer Systems (Akron, OH) employing
McGrath’s approach. In the nomenclature BPS-20K, 20 represents 20 mol % of
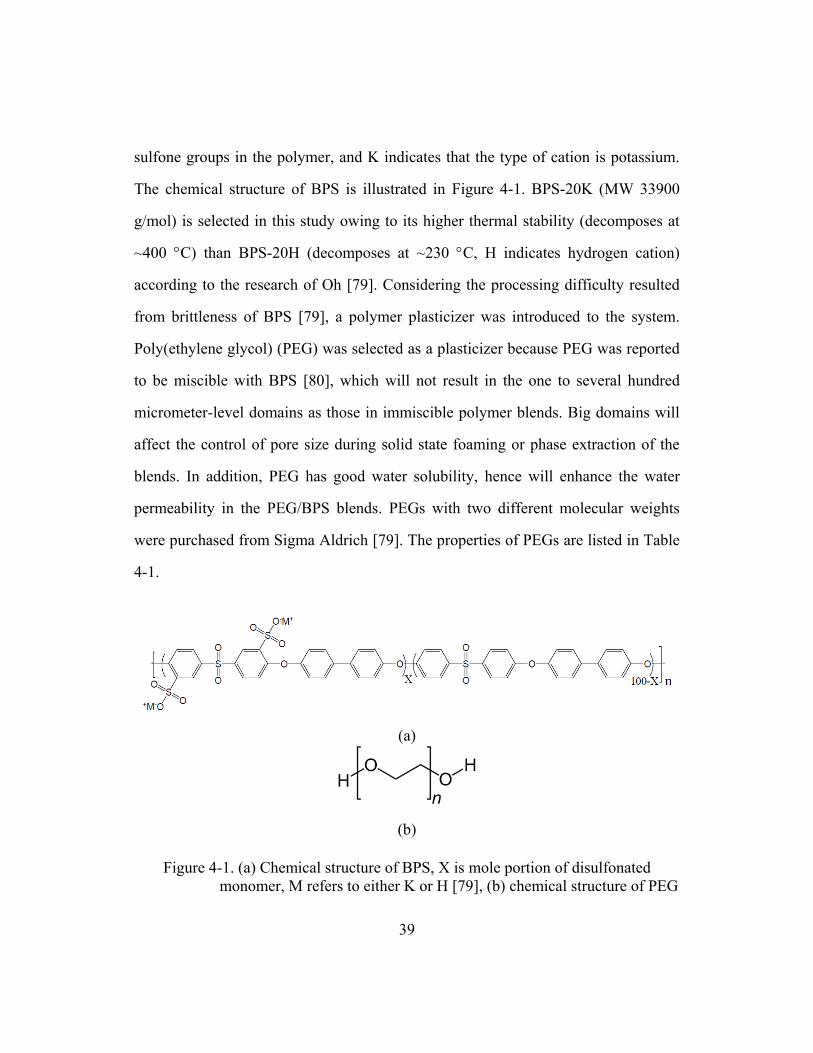
39
sulfone groups in the polymer, and K indicates that the type of cation is potassium.
The chemical structure of BPS is illustrated in Figure 4-1. BPS-20K (MW 33900
g/mol) is selected in this study owing to its higher thermal stability (decomposes at
~400 C) than BPS-20H (decomposes at ~230 C, H indicates hydrogen cation)
according to the research of Oh [79]. Considering the processing difficulty resulted
from brittleness of BPS [79], a polymer plasticizer was introduced to the system.
Poly(ethylene glycol) (PEG) was selected as a plasticizer because PEG was reported
to be miscible with BPS [80], which will not result in the one to several hundred
micrometer-level domains as those in immiscible polymer blends. Big domains will
affect the control of pore size during solid state foaming or phase extraction of the
blends. In addition, PEG has good water solubility, hence will enhance the water
permeability in the PEG/BPS blends. PEGs with two different molecular weights
were purchased from Sigma Aldrich [79]. The properties of PEGs are listed in Table
4-1.
(a)
(b)
Figure 4-1. (a) Chemical structure of BPS, X is mole portion of disulfonated
monomer, M refers to either K or H [79], (b) chemical structure of PEG
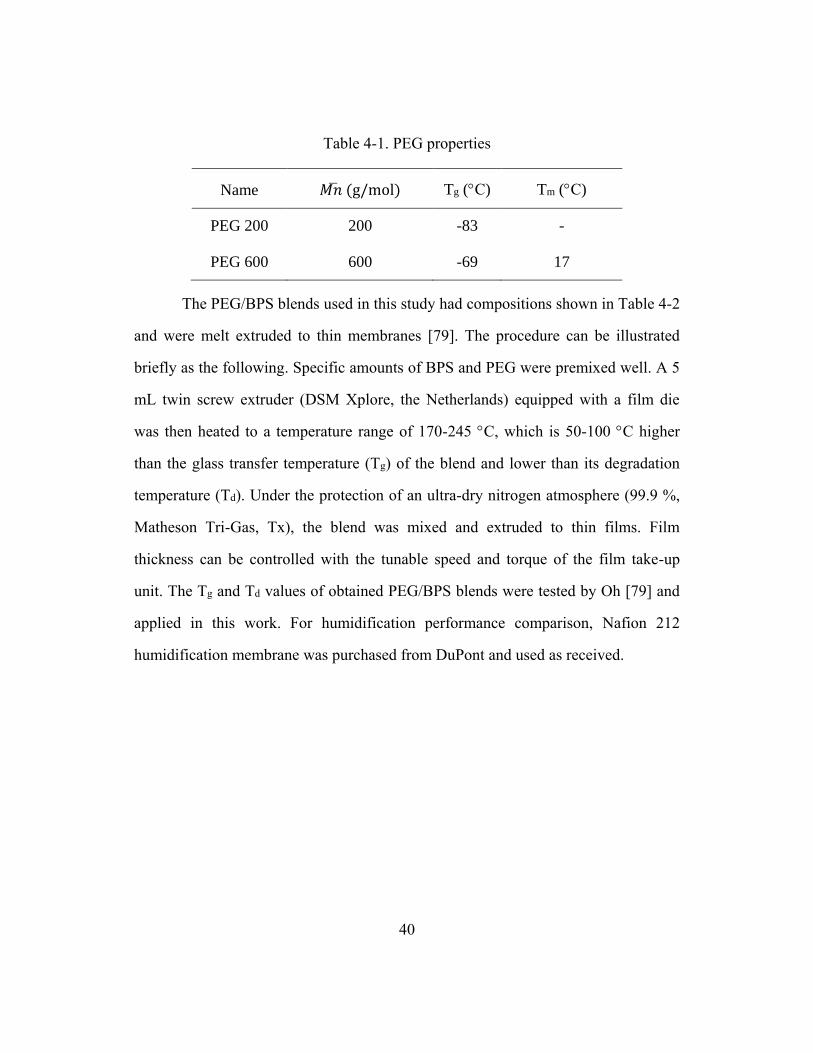
40
Table 4-1. PEG properties
Name �̅�𝑛 (g/mol) Tg (C) Tm (C)
PEG 200 200 -83 -
PEG 600 600 -69 17
The PEG/BPS blends used in this study had compositions shown in Table 4-2
and were melt extruded to thin membranes [79]. The procedure can be illustrated
briefly as the following. Specific amounts of BPS and PEG were premixed well. A 5
mL twin screw extruder (DSM Xplore, the Netherlands) equipped with a film die
was then heated to a temperature range of 170-245 C, which is 50-100 C higher
than the glass transfer temperature (Tg) of the blend and lower than its degradation
temperature (Td). Under the protection of an ultra-dry nitrogen atmosphere (99.9 %,
Matheson Tri-Gas, Tx), the blend was mixed and extruded to thin films. Film
thickness can be controlled with the tunable speed and torque of the film take-up
unit. The Tg and Td values of obtained PEG/BPS blends were tested by Oh [79] and
applied in this work. For humidification performance comparison, Nafion 212
humidification membrane was purchased from DuPont and used as received.
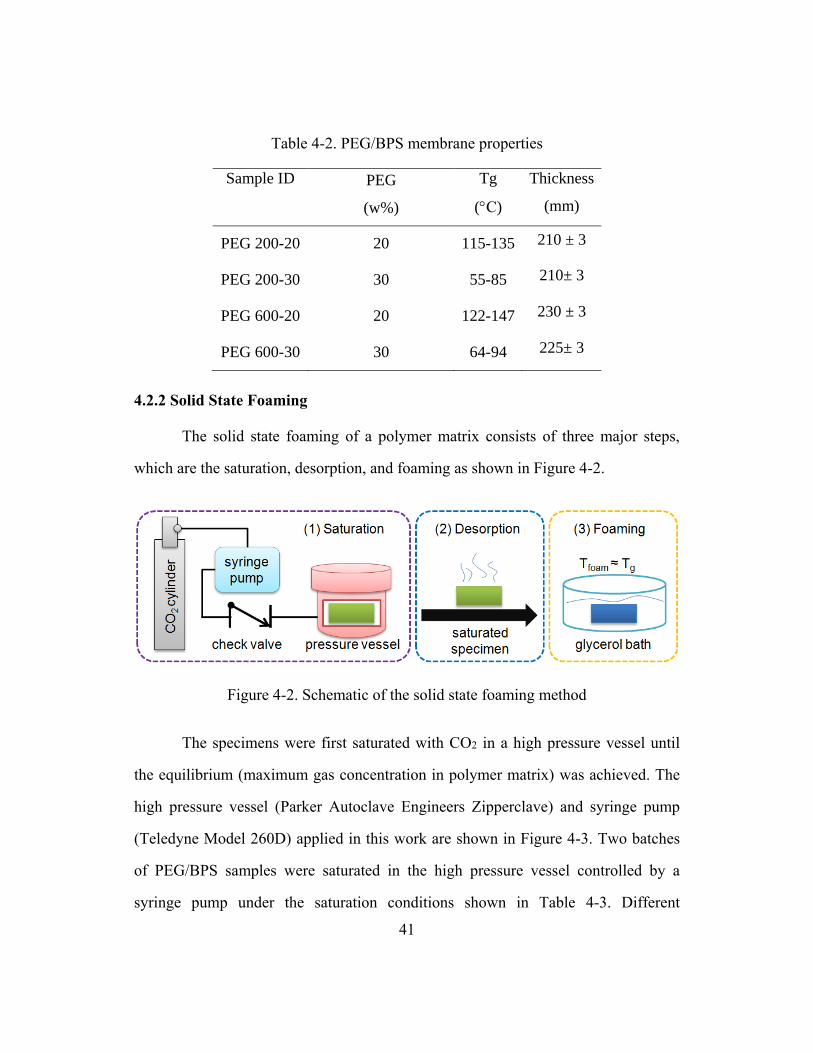
41
Table 4-2. PEG/BPS membrane properties
Sample ID PEG
(w%)
Tg
(C)
Thickness
(mm)
PEG 200-20 20 115-135 210 ± 3
PEG 200-30 30 55-85 210± 3
PEG 600-20 20 122-147 230 ± 3
PEG 600-30 30 64-94 225± 3
4.2.2 Solid State Foaming
The solid state foaming of a polymer matrix consists of three major steps,
which are the saturation, desorption, and foaming as shown in Figure 4-2.
Figure 4-2. Schematic of the solid state foaming method
The specimens were first saturated with CO2 in a high pressure vessel until
the equilibrium (maximum gas concentration in polymer matrix) was achieved. The
high pressure vessel (Parker Autoclave Engineers Zipperclave) and syringe pump
(Teledyne Model 260D) applied in this work are shown in Figure 4-3. Two batches
of PEG/BPS samples were saturated in the high pressure vessel controlled by a
syringe pump under the saturation conditions shown in Table 4-3. Different
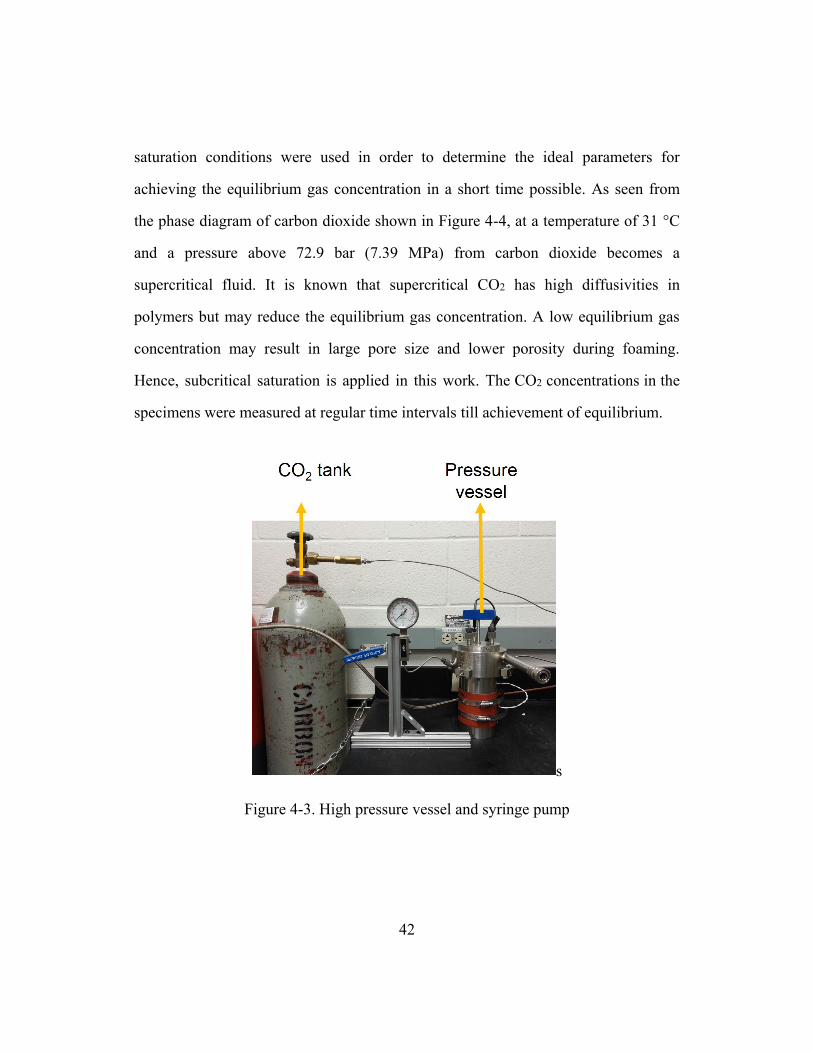
42
saturation conditions were used in order to determine the ideal parameters for
achieving the equilibrium gas concentration in a short time possible. As seen from
the phase diagram of carbon dioxide shown in Figure 4-4, at a temperature of 31 °C
and a pressure above 72.9 bar (7.39 MPa) from carbon dioxide becomes a
supercritical fluid. It is known that supercritical CO2 has high diffusivities in
polymers but may reduce the equilibrium gas concentration. A low equilibrium gas
concentration may result in large pore size and lower porosity during foaming.
Hence, subcritical saturation is applied in this work. The CO2 concentrations in the
specimens were measured at regular time intervals till achievement of equilibrium.
s
Figure 4-3. High pressure vessel and syringe pump
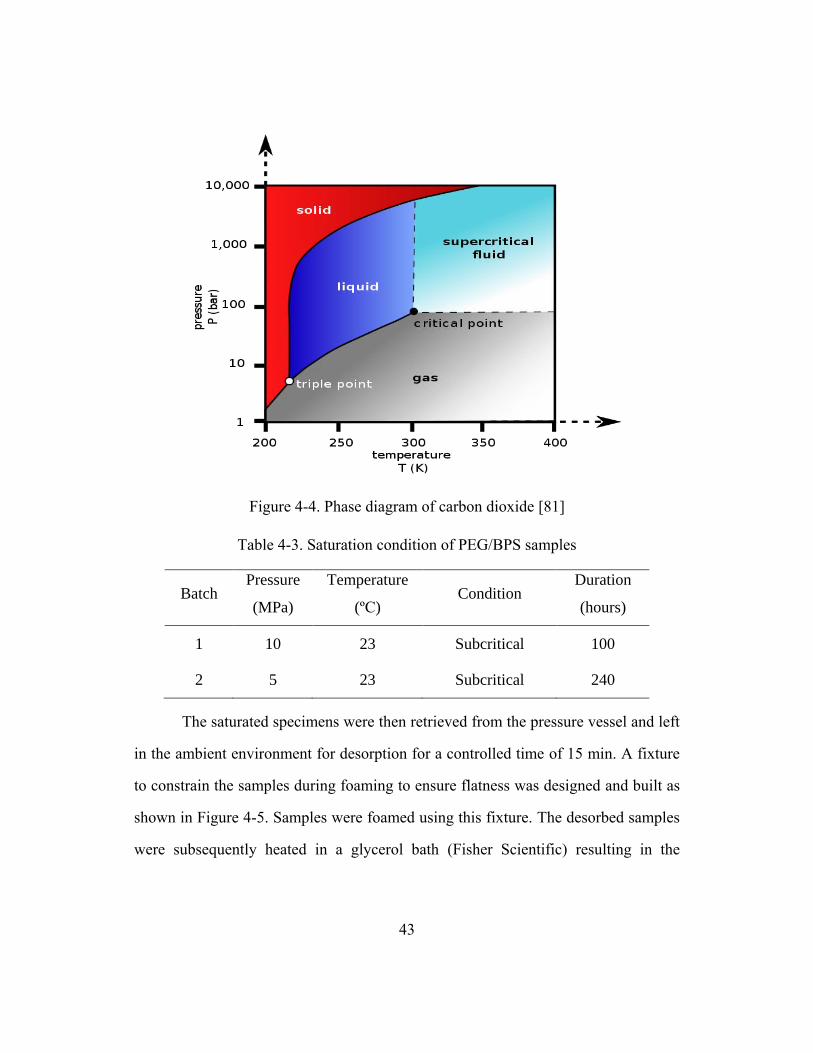
43
Figure 4-4. Phase diagram of carbon dioxide [81]
Table 4-3. Saturation condition of PEG/BPS samples
Batch Pressure
(MPa)
Temperature
(ºC) Condition
Duration
(hours)
1 10 23 Subcritical 100
2 5 23 Subcritical 240
The saturated specimens were then retrieved from the pressure vessel and left
in the ambient environment for desorption for a controlled time of 15 min. A fixture
to constrain the samples during foaming to ensure flatness was designed and built as
shown in Figure 4-5. Samples were foamed using this fixture. The desorbed samples
were subsequently heated in a glycerol bath (Fisher Scientific) resulting in the
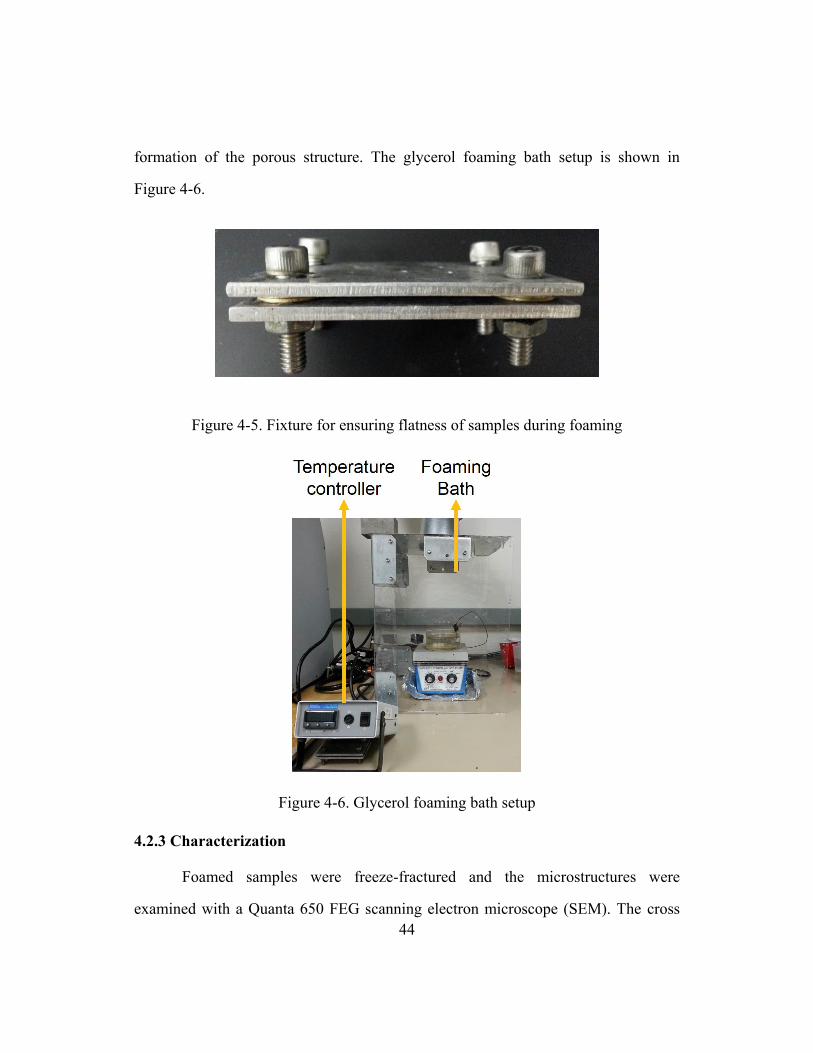
44
formation of the porous structure. The glycerol foaming bath setup is shown in
Figure 4-6.
Figure 4-5. Fixture for ensuring flatness of samples during foaming
Figure 4-6. Glycerol foaming bath setup
4.2.3 Characterization
Foamed samples were freeze-fractured and the microstructures were
examined with a Quanta 650 FEG scanning electron microscope (SEM). The cross
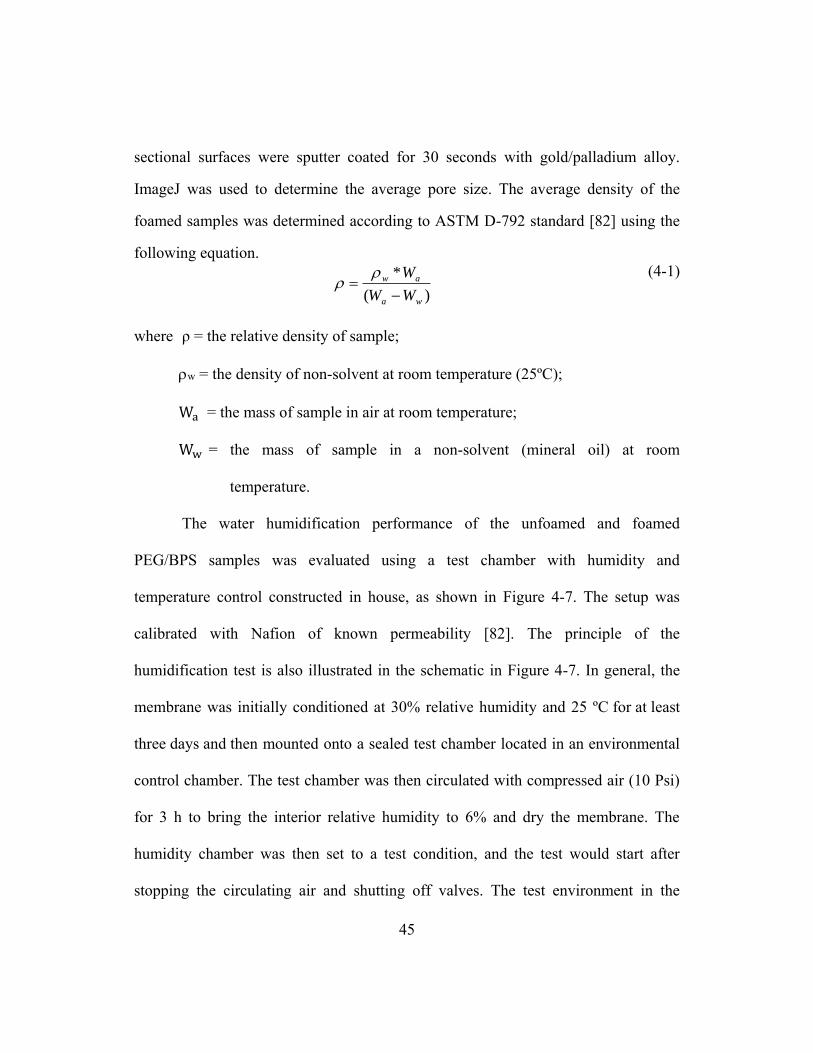
45
sectional surfaces were sputter coated for 30 seconds with gold/palladium alloy.
ImageJ was used to determine the average pore size. The average density of the
foamed samples was determined according to ASTM D-792 standard [82] using the
following equation.
)(
*
wa
aw
WW
W
(4-1)
where ρ = the relative density of sample;
w = the density of non-solvent at room temperature (25ºC);
Wa = the mass of sample in air at room temperature;
Ww = the mass of sample in a non-solvent (mineral oil) at room
temperature.
The water humidification performance of the unfoamed and foamed
PEG/BPS samples was evaluated using a test chamber with humidity and
temperature control constructed in house, as shown in Figure 4-7. The setup was
calibrated with Nafion of known permeability [82]. The principle of the
humidification test is also illustrated in the schematic in Figure 4-7. In general, the
membrane was initially conditioned at 30% relative humidity and 25 ºC for at least
three days and then mounted onto a sealed test chamber located in an environmental
control chamber. The test chamber was then circulated with compressed air (10 Psi)
for 3 h to bring the interior relative humidity to 6% and dry the membrane. The
humidity chamber was then set to a test condition, and the test would start after
stopping the circulating air and shutting off valves. The test environment in the
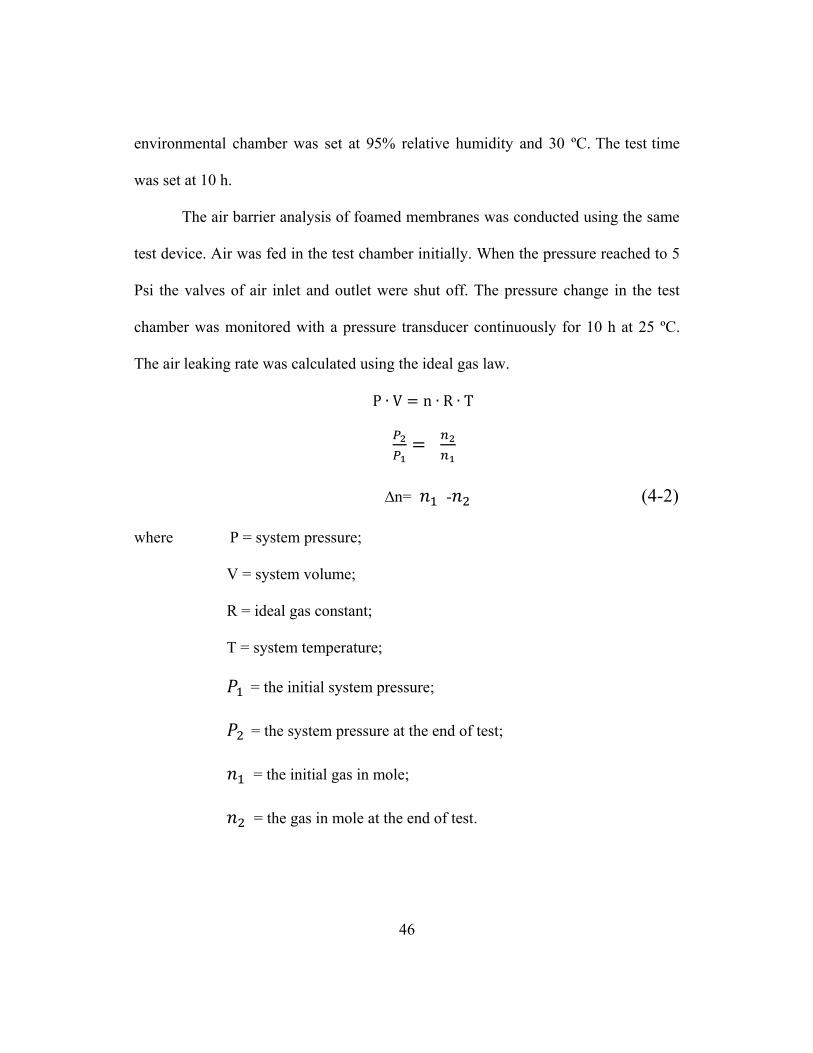
46
environmental chamber was set at 95% relative humidity and 30 ºC. The test time
was set at 10 h.
The air barrier analysis of foamed membranes was conducted using the same
test device. Air was fed in the test chamber initially. When the pressure reached to 5
Psi the valves of air inlet and outlet were shut off. The pressure change in the test
chamber was monitored with a pressure transducer continuously for 10 h at 25 ºC.
The air leaking rate was calculated using the ideal gas law.
P ∙ V = n ∙ R ∙ T
𝑃2
𝑃1=
𝑛2
𝑛1
∆n= 𝑛1 -𝑛2 (4-2)
where P = system pressure;
V = system volume;
R = ideal gas constant;
T = system temperature;
𝑃1 = the initial system pressure;
𝑃2 = the system pressure at the end of test;
𝑛1 = the initial gas in mole;
𝑛2 = the gas in mole at the end of test.
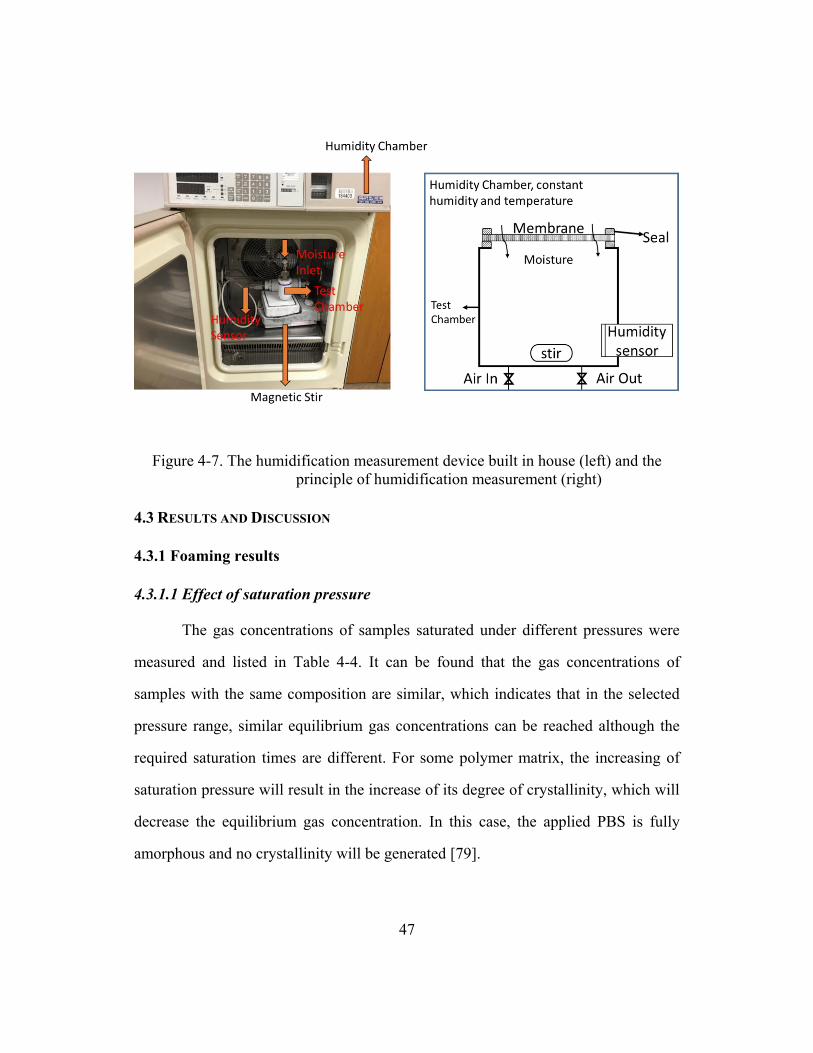
47
Figure 4-7. The humidification measurement device built in house (left) and the
principle of humidification measurement (right)
4.3 RESULTS AND DISCUSSION
4.3.1 Foaming results
4.3.1.1 Effect of saturation pressure
The gas concentrations of samples saturated under different pressures were
measured and listed in Table 4-4. It can be found that the gas concentrations of
samples with the same composition are similar, which indicates that in the selected
pressure range, similar equilibrium gas concentrations can be reached although the
required saturation times are different. For some polymer matrix, the increasing of
saturation pressure will result in the increase of its degree of crystallinity, which will
decrease the equilibrium gas concentration. In this case, the applied PBS is fully
amorphous and no crystallinity will be generated [79].
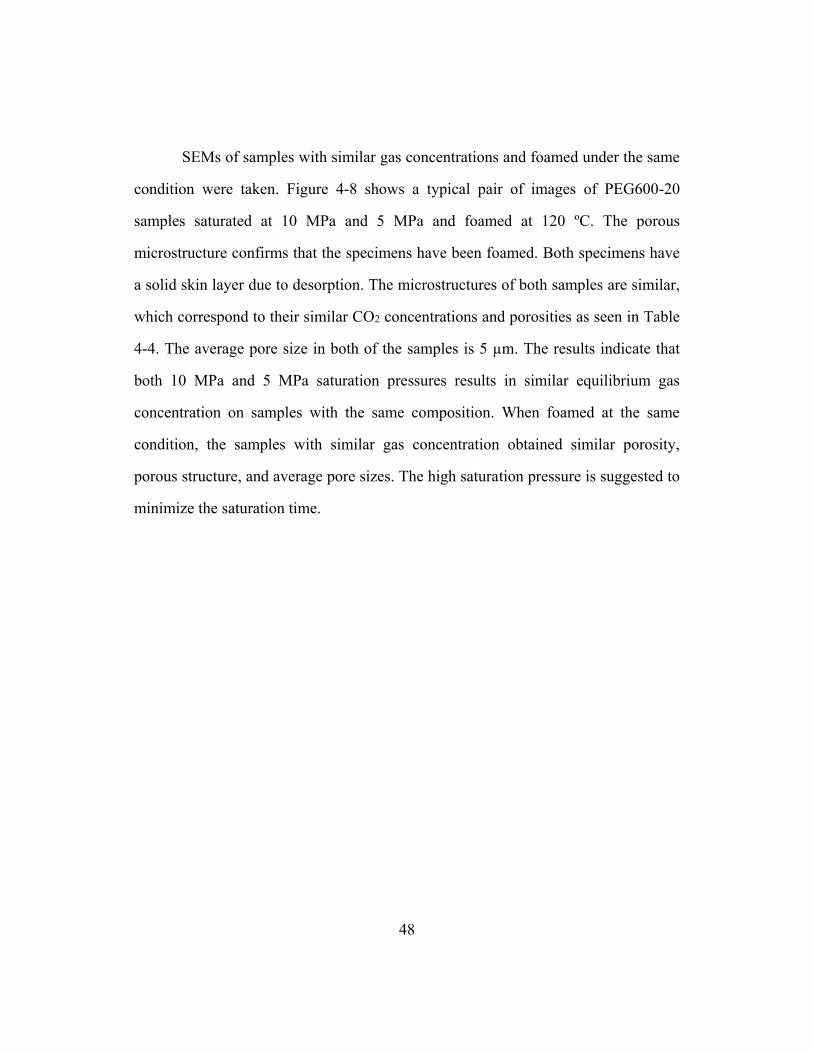
48
SEMs of samples with similar gas concentrations and foamed under the same
condition were taken. Figure 4-8 shows a typical pair of images of PEG600-20
samples saturated at 10 MPa and 5 MPa and foamed at 120 ºC. The porous
microstructure confirms that the specimens have been foamed. Both specimens have
a solid skin layer due to desorption. The microstructures of both samples are similar,
which correspond to their similar CO2 concentrations and porosities as seen in Table
4-4. The average pore size in both of the samples is 5 µm. The results indicate that
both 10 MPa and 5 MPa saturation pressures results in similar equilibrium gas
concentration on samples with the same composition. When foamed at the same
condition, the samples with similar gas concentration obtained similar porosity,
porous structure, and average pore sizes. The high saturation pressure is suggested to
minimize the saturation time.
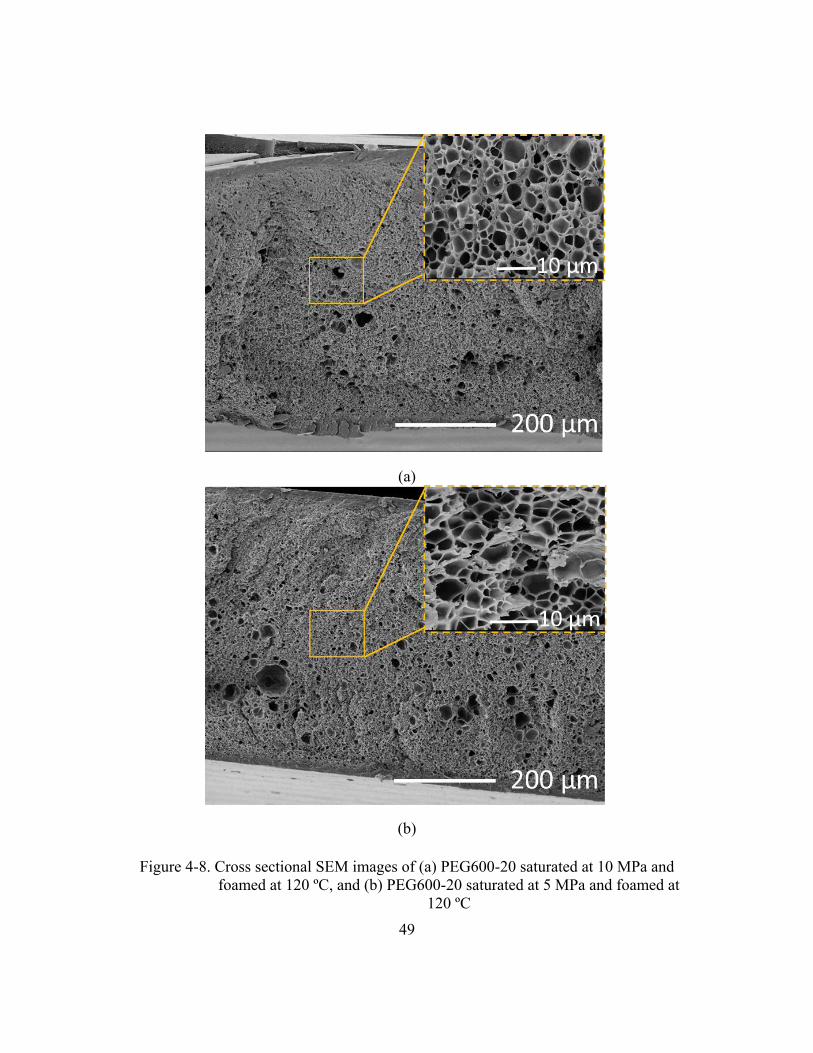
49
(a)
(b)
Figure 4-8. Cross sectional SEM images of (a) PEG600-20 saturated at 10 MPa and
foamed at 120 ºC, and (b) PEG600-20 saturated at 5 MPa and foamed at
120 ºC
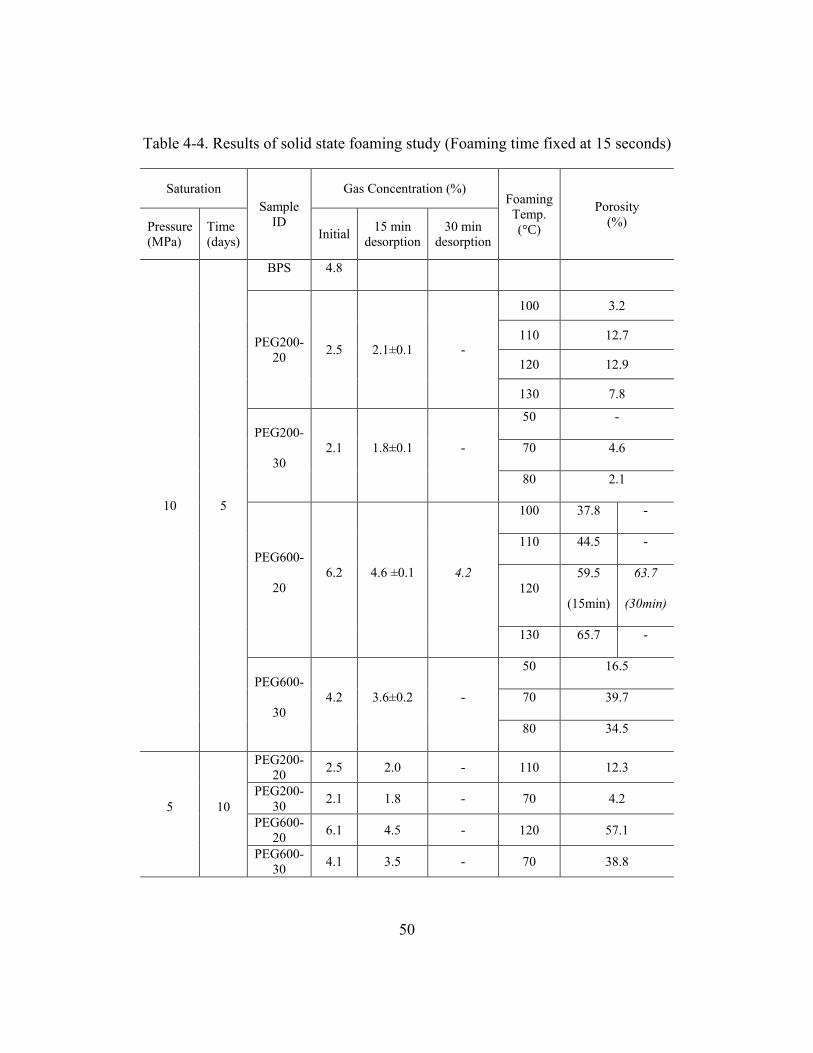
50
Table 4-4. Results of solid state foaming study (Foaming time fixed at 15 seconds)
Saturation
Sample
ID
Gas Concentration (%) Foaming
Temp.
(°C)
Porosity
(%) Pressure
(MPa)
Time
(days) Initial
15 min
desorption
30 min
desorption
10 5
BPS 4.8
PEG200-
20 2.5 2.1±0.1 -
100 3.2
110 12.7
120 12.9
130 7.8
PEG200-
30
2.1 1.8±0.1 -
50 -
70 4.6
80 2.1
PEG600-
20
6.2 4.6 ±0.1 4.2
100 37.8 -
110 44.5 -
120
59.5
(15min)
63.7
(30min)
130 65.7 -
PEG600-
30
4.2 3.6±0.2 -
50 16.5
70 39.7
80 34.5
5 10
PEG200-
20 2.5 2.0 - 110 12.3
PEG200-
30 2.1 1.8 - 70 4.2
PEG600-
20 6.1 4.5 - 120 57.1
PEG600-
30 4.1 3.5 - 70 38.8
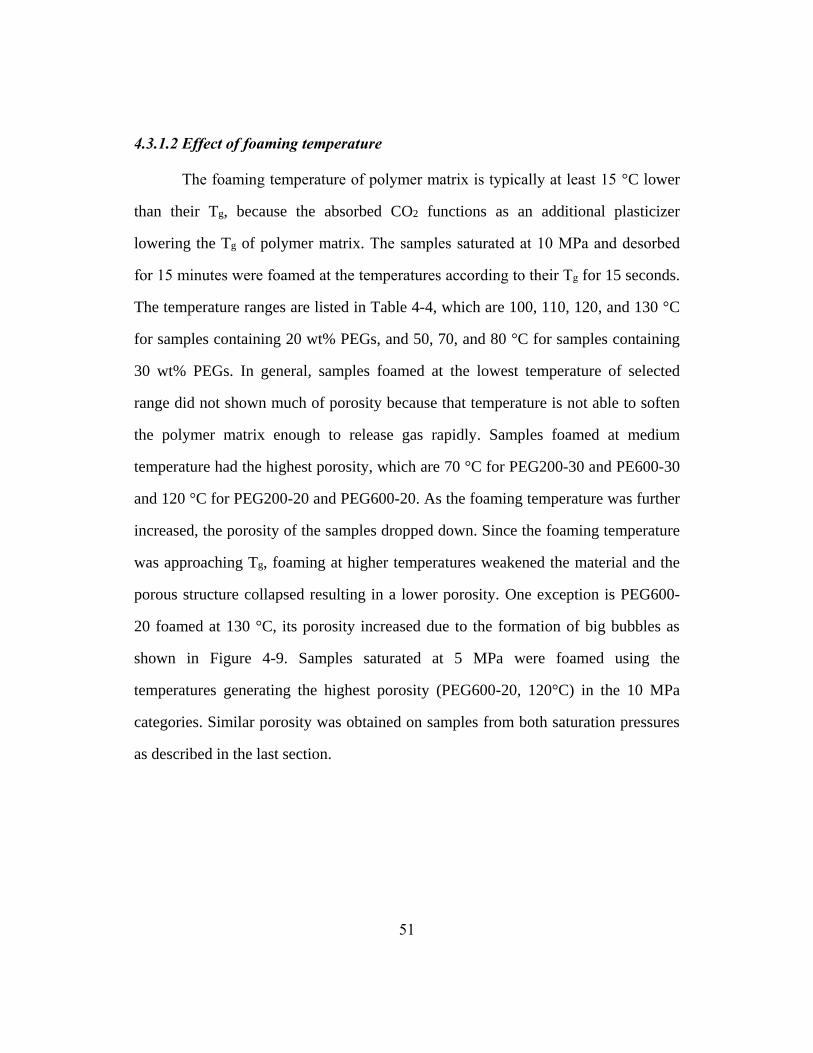
51
4.3.1.2 Effect of foaming temperature
The foaming temperature of polymer matrix is typically at least 15 °C lower
than their Tg, because the absorbed CO2 functions as an additional plasticizer
lowering the Tg of polymer matrix. The samples saturated at 10 MPa and desorbed
for 15 minutes were foamed at the temperatures according to their Tg for 15 seconds.
The temperature ranges are listed in Table 4-4, which are 100, 110, 120, and 130 °C
for samples containing 20 wt% PEGs, and 50, 70, and 80 °C for samples containing
30 wt% PEGs. In general, samples foamed at the lowest temperature of selected
range did not shown much of porosity because that temperature is not able to soften
the polymer matrix enough to release gas rapidly. Samples foamed at medium
temperature had the highest porosity, which are 70 °C for PEG200-30 and PE600-30
and 120 °C for PEG200-20 and PEG600-20. As the foaming temperature was further
increased, the porosity of the samples dropped down. Since the foaming temperature
was approaching Tg, foaming at higher temperatures weakened the material and the
porous structure collapsed resulting in a lower porosity. One exception is PEG600-
20 foamed at 130 °C, its porosity increased due to the formation of big bubbles as
shown in Figure 4-9. Samples saturated at 5 MPa were foamed using the
temperatures generating the highest porosity (PEG600-20, 120°C) in the 10 MPa
categories. Similar porosity was obtained on samples from both saturation pressures
as described in the last section.
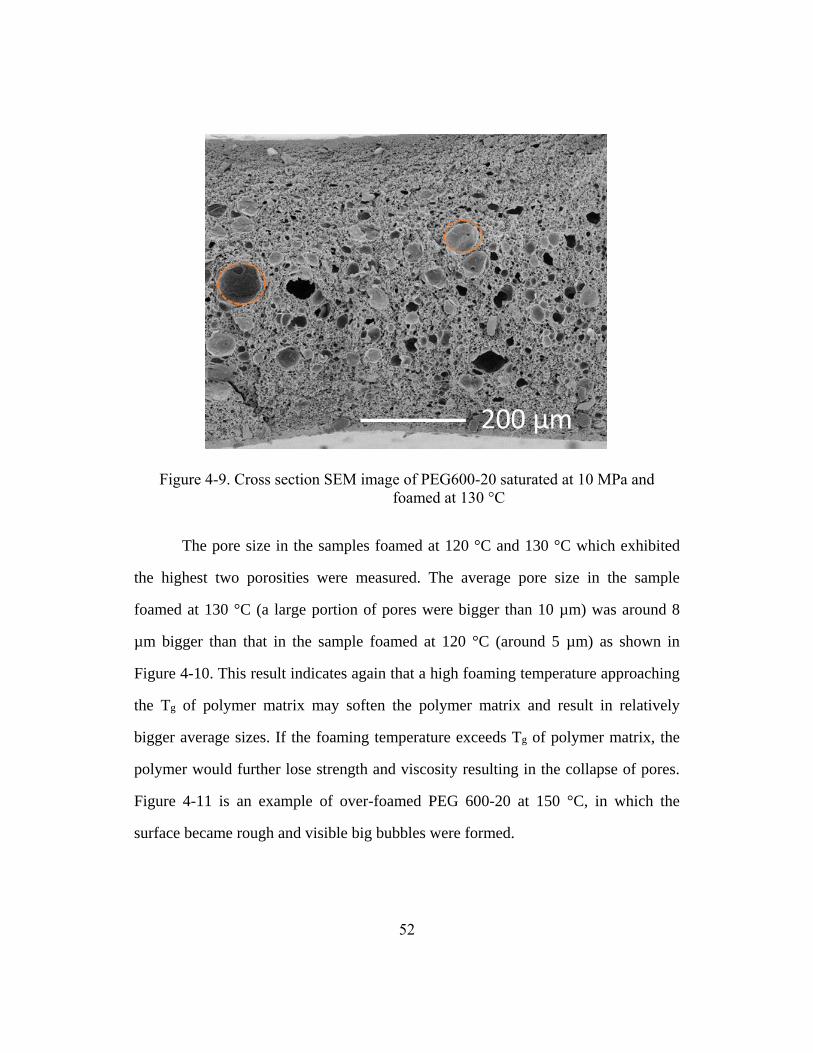
52
Figure 4-9. Cross section SEM image of PEG600-20 saturated at 10 MPa and
foamed at 130 °C
The pore size in the samples foamed at 120 °C and 130 °C which exhibited
the highest two porosities were measured. The average pore size in the sample
foamed at 130 °C (a large portion of pores were bigger than 10 µm) was around 8
µm bigger than that in the sample foamed at 120 °C (around 5 µm) as shown in
Figure 4-10. This result indicates again that a high foaming temperature approaching
the Tg of polymer matrix may soften the polymer matrix and result in relatively
bigger average sizes. If the foaming temperature exceeds Tg of polymer matrix, the
polymer would further lose strength and viscosity resulting in the collapse of pores.
Figure 4-11 is an example of over-foamed PEG 600-20 at 150 °C, in which the
surface became rough and visible big bubbles were formed.
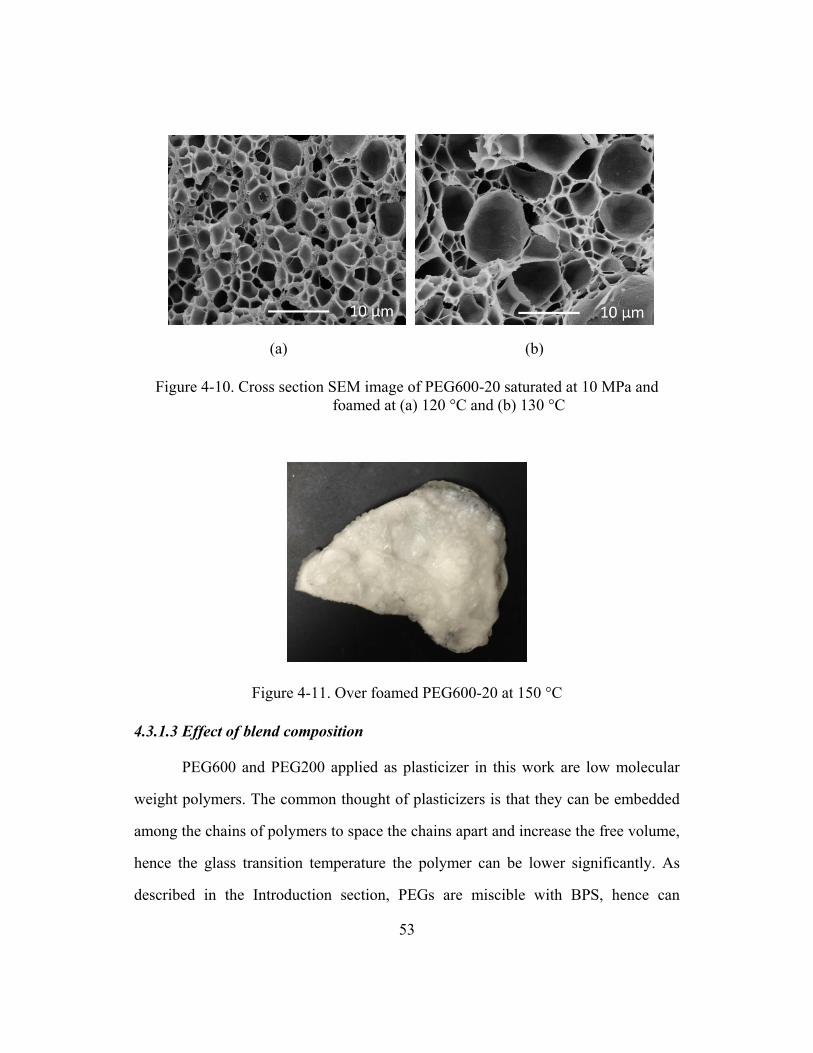
53
(a) (b)
Figure 4-10. Cross section SEM image of PEG600-20 saturated at 10 MPa and
foamed at (a) 120 °C and (b) 130 °C
Figure 4-11. Over foamed PEG600-20 at 150 °C
4.3.1.3 Effect of blend composition
PEG600 and PEG200 applied as plasticizer in this work are low molecular
weight polymers. The common thought of plasticizers is that they can be embedded
among the chains of polymers to space the chains apart and increase the free volume,
hence the glass transition temperature the polymer can be lower significantly. As
described in the Introduction section, PEGs are miscible with BPS, hence can
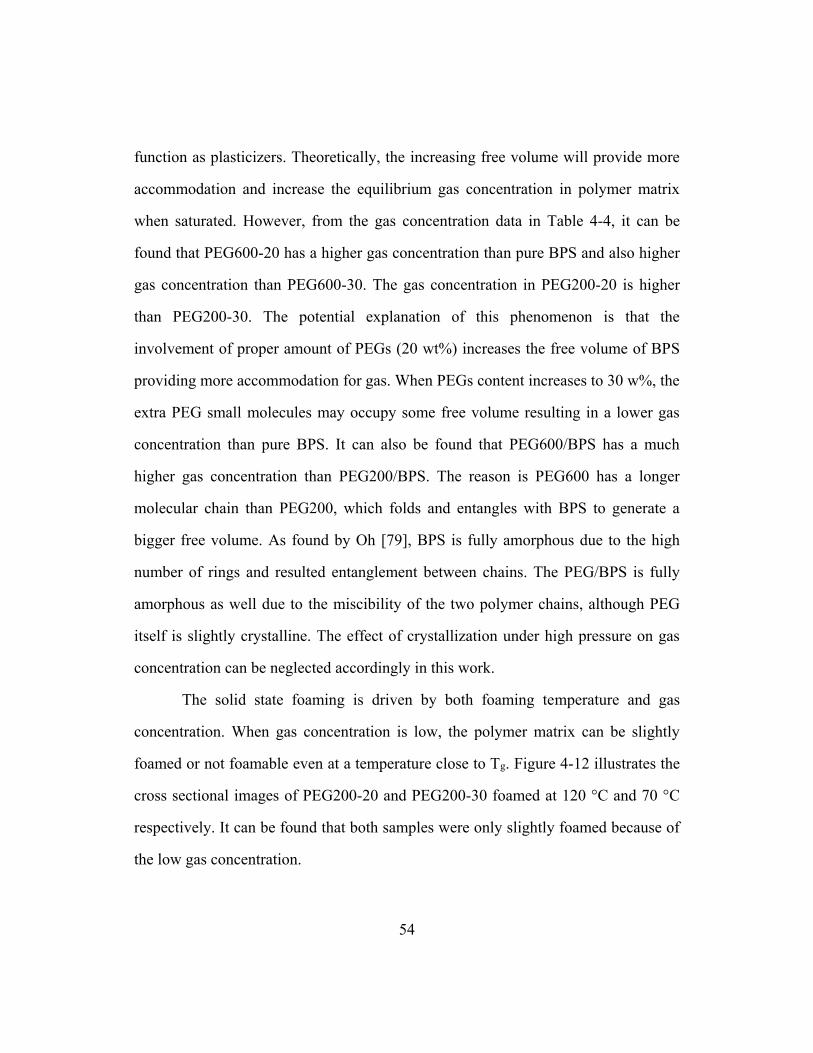
54
function as plasticizers. Theoretically, the increasing free volume will provide more
accommodation and increase the equilibrium gas concentration in polymer matrix
when saturated. However, from the gas concentration data in Table 4-4, it can be
found that PEG600-20 has a higher gas concentration than pure BPS and also higher
gas concentration than PEG600-30. The gas concentration in PEG200-20 is higher
than PEG200-30. The potential explanation of this phenomenon is that the
involvement of proper amount of PEGs (20 wt%) increases the free volume of BPS
providing more accommodation for gas. When PEGs content increases to 30 w%, the
extra PEG small molecules may occupy some free volume resulting in a lower gas
concentration than pure BPS. It can also be found that PEG600/BPS has a much
higher gas concentration than PEG200/BPS. The reason is PEG600 has a longer
molecular chain than PEG200, which folds and entangles with BPS to generate a
bigger free volume. As found by Oh [79], BPS is fully amorphous due to the high
number of rings and resulted entanglement between chains. The PEG/BPS is fully
amorphous as well due to the miscibility of the two polymer chains, although PEG
itself is slightly crystalline. The effect of crystallization under high pressure on gas
concentration can be neglected accordingly in this work.
The solid state foaming is driven by both foaming temperature and gas
concentration. When gas concentration is low, the polymer matrix can be slightly
foamed or not foamable even at a temperature close to Tg. Figure 4-12 illustrates the
cross sectional images of PEG200-20 and PEG200-30 foamed at 120 °C and 70 °C
respectively. It can be found that both samples were only slightly foamed because of
the low gas concentration.
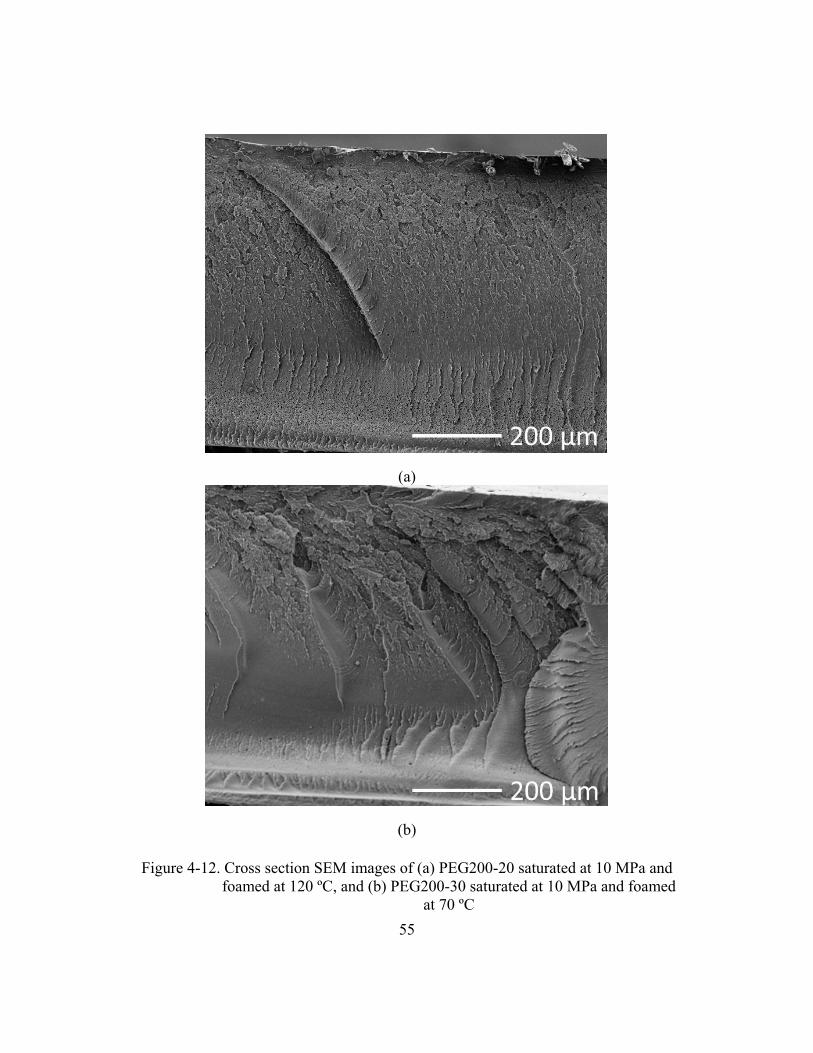
55
(a)
(b)
Figure 4-12. Cross section SEM images of (a) PEG200-20 saturated at 10 MPa and
foamed at 120 ºC, and (b) PEG200-30 saturated at 10 MPa and foamed
at 70 ºC
56
4.3.2 Humidification test
To characterize the applicability of fabricated PEG/BPS membranes and
foams as fuel cell humidification membranes, humidification tests were conducted
applying the in-house built test device shown in section 4.2.3. The results were
analyzed and shown in Figure 4-13 and summarized in Table 4-5. In general, the
humidification performance of a membrane can be characterized with diffusion
coefficient, which determines the water vapor saturation speed in the test chamber.
In this work, we run the humidification test for 80000 sec and use the time of
reaching 50 % of the final RH in test chamber to quantify the humidification
performance.
As summarized in Table 4-5, Nafion 212 membrane yielded the shortest time
of reaching 50% RH (8000 s) and highest RH of 82.5%. Before foaming, the
descending order of water vapor saturation rate as well as the descending order of
maximum relative humidity reached are PEG200-30 > PEG200-20 > PEG600-30 >
PEG600-20. The potential reason is that the smaller PEG200 molecules in BPS have
higher mobility than PEG600, which would enhance the water molecule diffusion
through the membrane by enhanced solution diffusion. This order was changed
dramatically after the foaming of the samples. It can be found that foamed PEG600-
20 features the shortest time of reaching 50% RH, which is 10000 s. Foamed PEG
600-30 shows the second shortest time of 16000 s, which is close to the 16500 s of
foamed PEG200-30. Foamed PEG200-20 shows the longest time of 20000 s, which
is the same as solid PEG200-20. In general, the saturation time of PEG600-20
reduced by 70000 s and the saturation time of PEG600-30 reduced by 18000 s after
foaming, while the saturation time of PEG200s has no significant change after
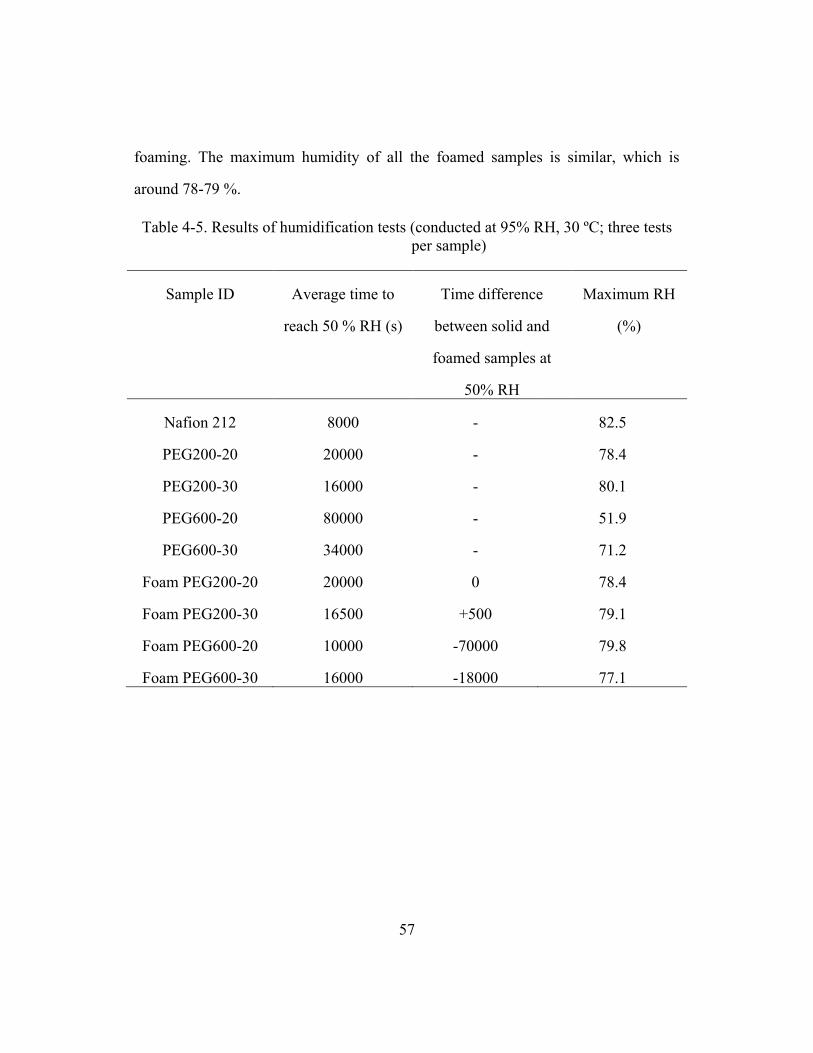
57
foaming. The maximum humidity of all the foamed samples is similar, which is
around 78-79 %.
Table 4-5. Results of humidification tests (conducted at 95% RH, 30 ºC; three tests
per sample)
Sample ID Average time to
reach 50 % RH (s)
Time difference
between solid and
foamed samples at
50% RH
Maximum RH
(%)
Nafion 212 8000 - 82.5
PEG200-20 20000 - 78.4
PEG200-30 16000 - 80.1
PEG600-20 80000 - 51.9
PEG600-30 34000 - 71.2
Foam PEG200-20 20000 0 78.4
Foam PEG200-30 16500 +500 79.1
Foam PEG600-20 10000 -70000 79.8
Foam PEG600-30 16000 -18000 77.1
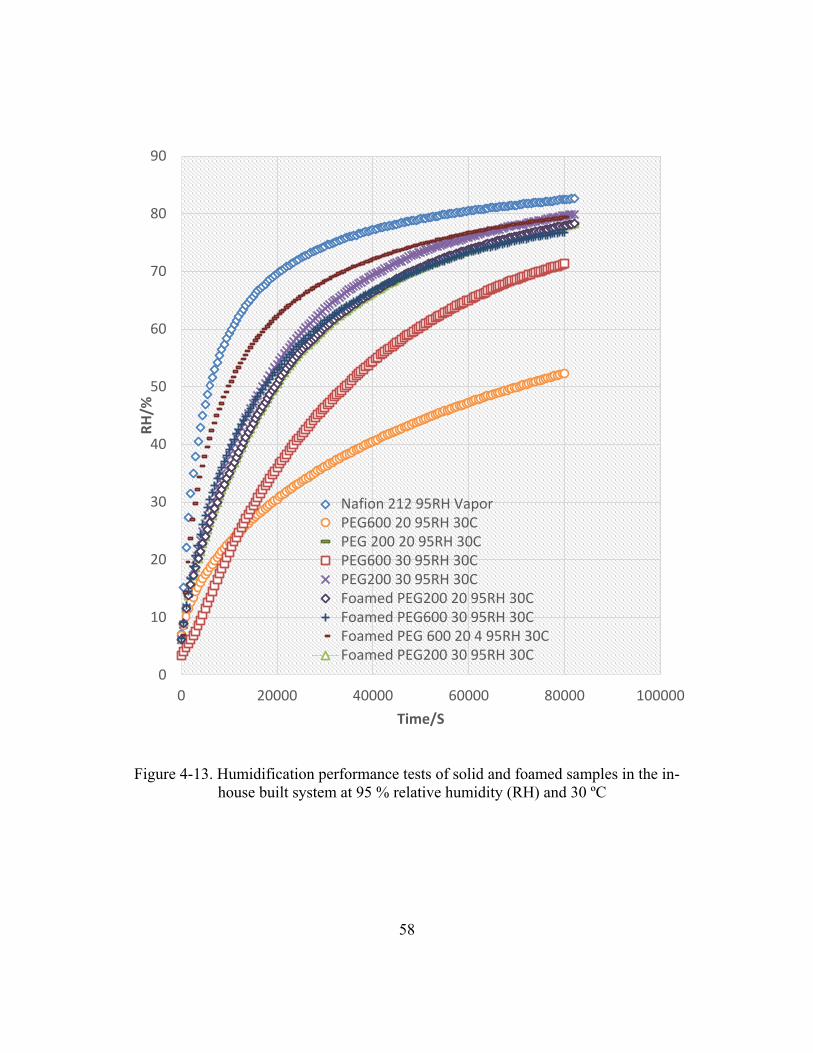
58
Figure 4-13. Humidification performance tests of solid and foamed samples in the in-
house built system at 95 % relative humidity (RH) and 30 ºC
0
10
20
30
40
50
60
70
80
90
0 20000 40000 60000 80000 100000
RH
/%
Time/S
Nafion 212 95RH VaporPEG600 20 95RH 30CPEG 200 20 95RH 30CPEG600 30 95RH 30CPEG200 30 95RH 30CFoamed PEG200 20 95RH 30CFoamed PEG600 30 95RH 30CFoamed PEG 600 20 4 95RH 30CFoamed PEG200 30 95RH 30C
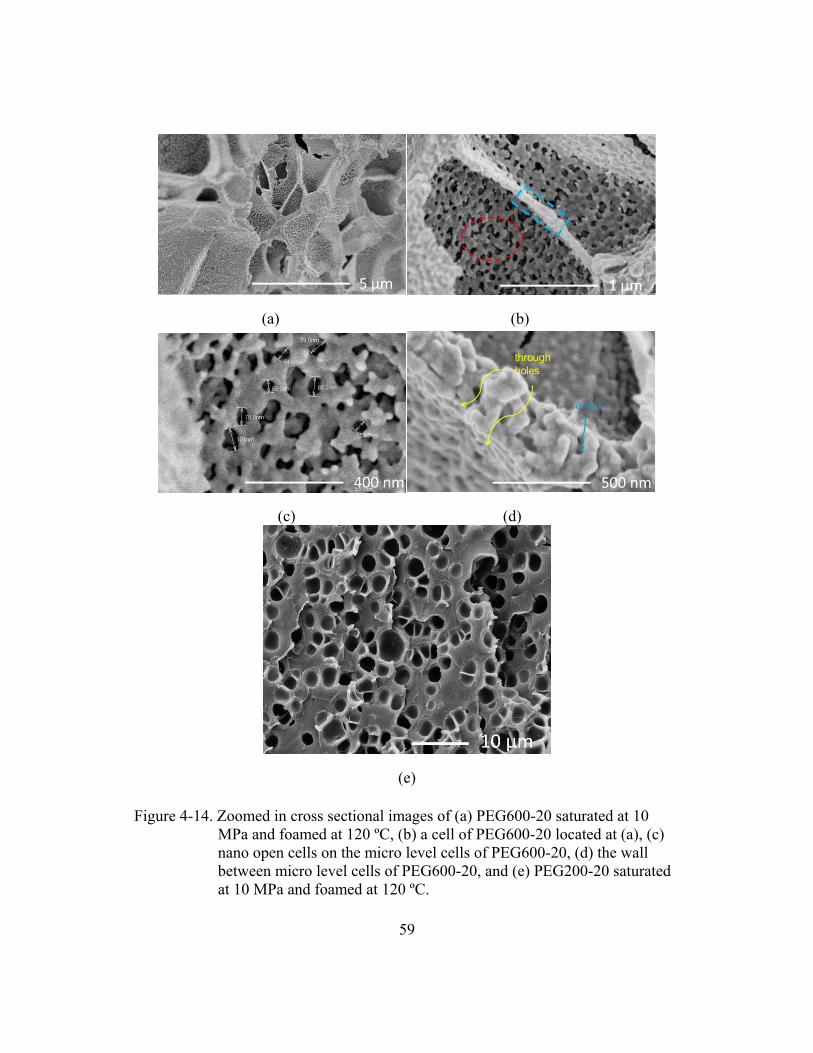
59
(a) (b)
(c) (d)
(e)
Figure 4-14. Zoomed in cross sectional images of (a) PEG600-20 saturated at 10
MPa and foamed at 120 ºC, (b) a cell of PEG600-20 located at (a), (c)
nano open cells on the micro level cells of PEG600-20, (d) the wall
between micro level cells of PEG600-20, and (e) PEG200-20 saturated
at 10 MPa and foamed at 120 ºC.
60
The reasonable explanation for the results can be addressed as follows. The
foamed samples with PEG600s demonstrate significant increase at the water vapor
transfer rate, because they have higher porosity than the samples with PEG200s.
Figure 4-14 (a) shows the cross section image of foamed PEG600-20, Figure 4-14
(b) shows one cell of the cross section with nano scale pores on the cell wall. The
pore sizes in the read dash circled region of Figure 4-14 (b) were measured and
shown in Figure 4-14 (c), which are in the range of 50-100 nm. Figure 4-14 (d) is the
enlarged image of the yellow dash rectangular region, which indicates that the cells
in foamed PEG600/BPS are connected by 50-100 nm size open pores. The pores can
serve as water vapor convection paths because the nano pore size is bigger than the
mean free path size of water vapor (42 nm). The foaming converted solution
diffusion of solid membranes to a combination of solution diffusion and convection
diffusion, which provides a higher water vapor diffusion rate. Figure 4-14 (e) shows
the cross section structure of foamed PEG200-20/BPS. No nano-sized open pores
were observed among the foamed cells. Foamed PEG200/BPS showed similar
performance with the solid samples before foaming owing to the low porosity and
absence of nano size pores in those samples. The foamed PEG600-20/BPS
membrane has a humidification rate slightly lower than that of Nafion 212.
Considering the thickness difference (Nafion: 50 µm, PEG600-20/BPS foam: 280
µm), the water vapor diffusion rate in PEG600-20/BPS foam may be higher than that
in Nafion.
4.3.3 Membrane leak test
To test the tolerance of the samples when water concentration is low in fuel
cell exhaust gas, the samples were conditioned at 6% RH and 25 ºC. All the solid
61
samples cracked after 12-48 h as shown in Figure 4-15(a), among which PEG600-20
shows a centimeter size through hole indicating the lowest plasticizing effect of 20
wt% loading of PEG600. As shown in Figure 4-15(b), there are no observable cracks
found on foamed samples conditioned under the same condition for 48 h. The
potential reason is that the PEG/BPS matrix would shrink because of the loss of
water under 6% RH. A strain across the PEG/BPS would be generated because of the
shrinkage (the sample was still mounted between two seals, hence the edges were
constrained), which may generate cracks when it exceeds the maximum tolerable
strain. As a contrast, there are micro or nano pores inside the foamed PEG/BPS
which can prevent the formation of global strains by formation of local strains or
block the propagation of cracks once they are formed [83].
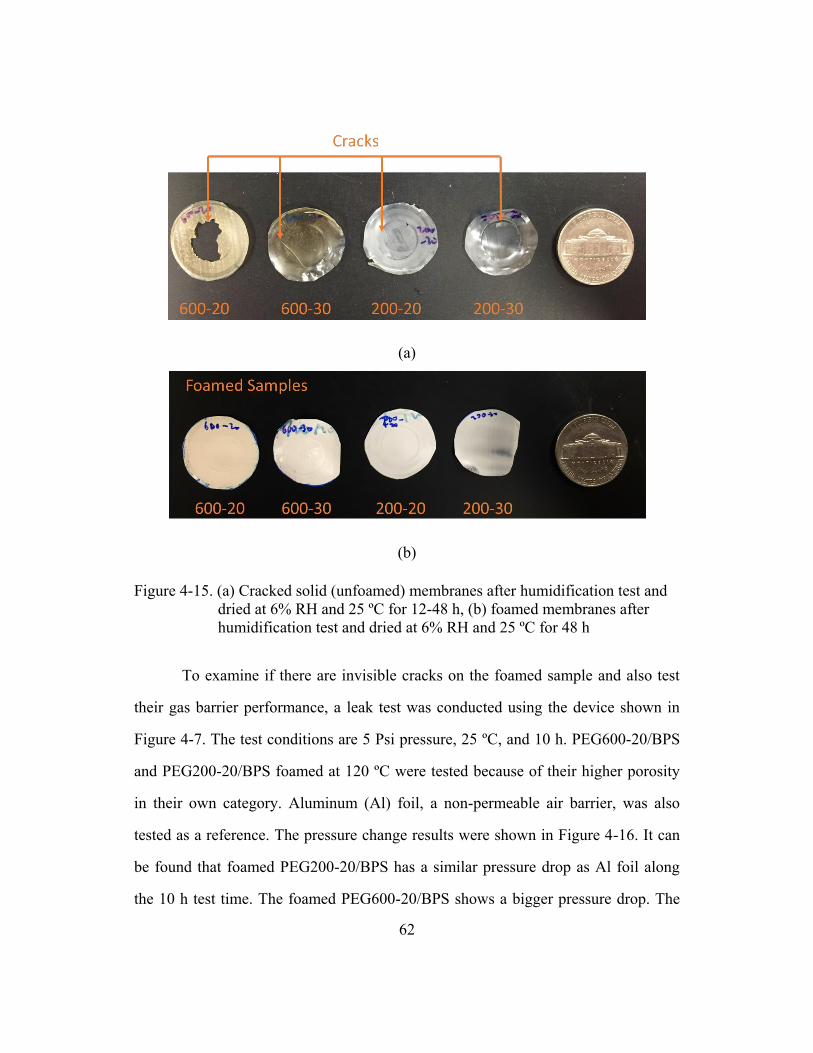
62
(a)
(b)
Figure 4-15. (a) Cracked solid (unfoamed) membranes after humidification test and
dried at 6% RH and 25 ºC for 12-48 h, (b) foamed membranes after
humidification test and dried at 6% RH and 25 ºC for 48 h
To examine if there are invisible cracks on the foamed sample and also test
their gas barrier performance, a leak test was conducted using the device shown in
Figure 4-7. The test conditions are 5 Psi pressure, 25 ºC, and 10 h. PEG600-20/BPS
and PEG200-20/BPS foamed at 120 ºC were tested because of their higher porosity
in their own category. Aluminum (Al) foil, a non-permeable air barrier, was also
tested as a reference. The pressure change results were shown in Figure 4-16. It can
be found that foamed PEG200-20/BPS has a similar pressure drop as Al foil along
the 10 h test time. The foamed PEG600-20/BPS shows a bigger pressure drop. The
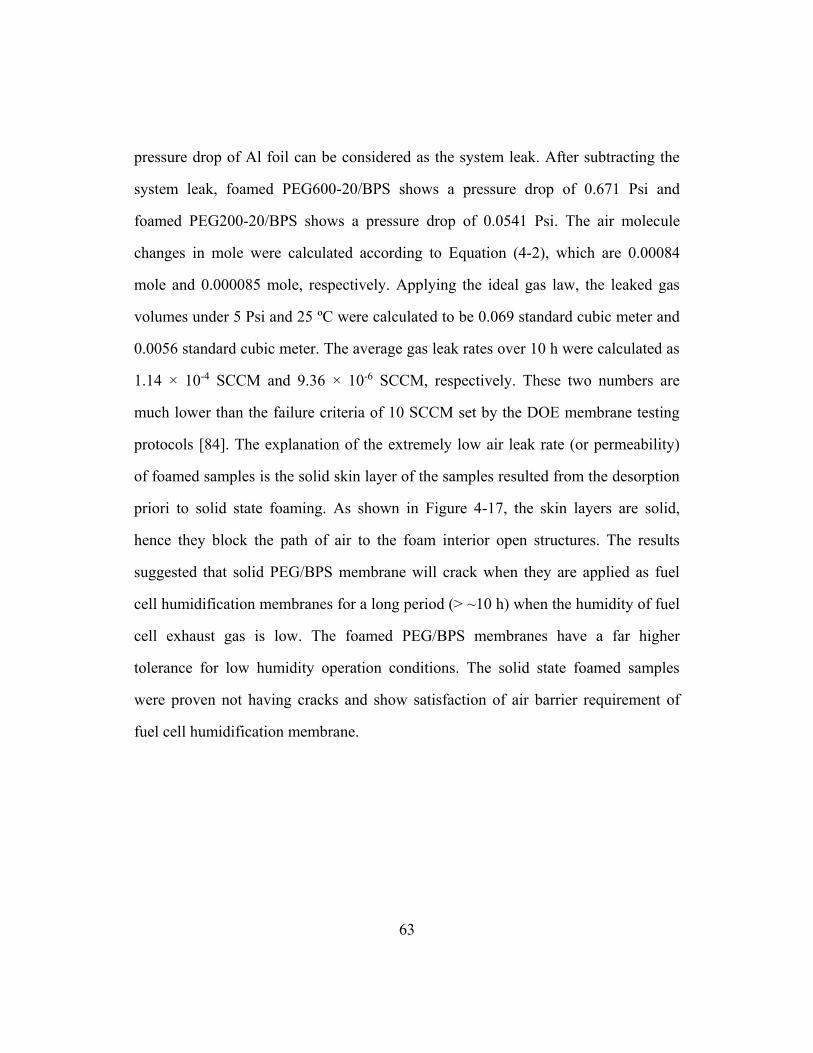
63
pressure drop of Al foil can be considered as the system leak. After subtracting the
system leak, foamed PEG600-20/BPS shows a pressure drop of 0.671 Psi and
foamed PEG200-20/BPS shows a pressure drop of 0.0541 Psi. The air molecule
changes in mole were calculated according to Equation (4-2), which are 0.00084
mole and 0.000085 mole, respectively. Applying the ideal gas law, the leaked gas
volumes under 5 Psi and 25 ºC were calculated to be 0.069 standard cubic meter and
0.0056 standard cubic meter. The average gas leak rates over 10 h were calculated as
1.14 × 10⁻⁴ SCCM and 9.36 × 10⁻⁶ SCCM, respectively. These two numbers are
much lower than the failure criteria of 10 SCCM set by the DOE membrane testing
protocols [84]. The explanation of the extremely low air leak rate (or permeability)
of foamed samples is the solid skin layer of the samples resulted from the desorption
priori to solid state foaming. As shown in Figure 4-17, the skin layers are solid,
hence they block the path of air to the foam interior open structures. The results
suggested that solid PEG/BPS membrane will crack when they are applied as fuel
cell humidification membranes for a long period (> ~10 h) when the humidity of fuel
cell exhaust gas is low. The foamed PEG/BPS membranes have a far higher
tolerance for low humidity operation conditions. The solid state foamed samples
were proven not having cracks and show satisfaction of air barrier requirement of
fuel cell humidification membrane.
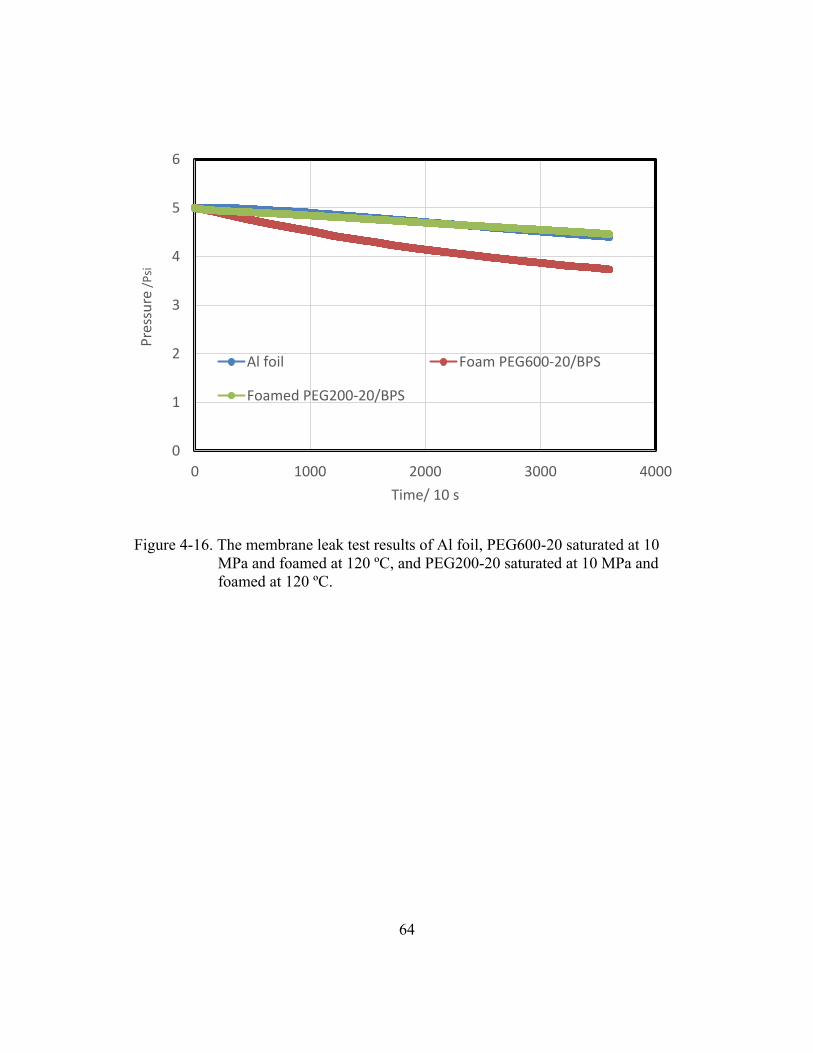
64
Figure 4-16. The membrane leak test results of Al foil, PEG600-20 saturated at 10
MPa and foamed at 120 ºC, and PEG200-20 saturated at 10 MPa and
foamed at 120 ºC.
0
1
2
3
4
5
6
0 1000 2000 3000 4000
Pre
ssu
re/P
si
Time/ 10 s
Al foil Foam PEG600-20/BPS
Foamed PEG200-20/BPS
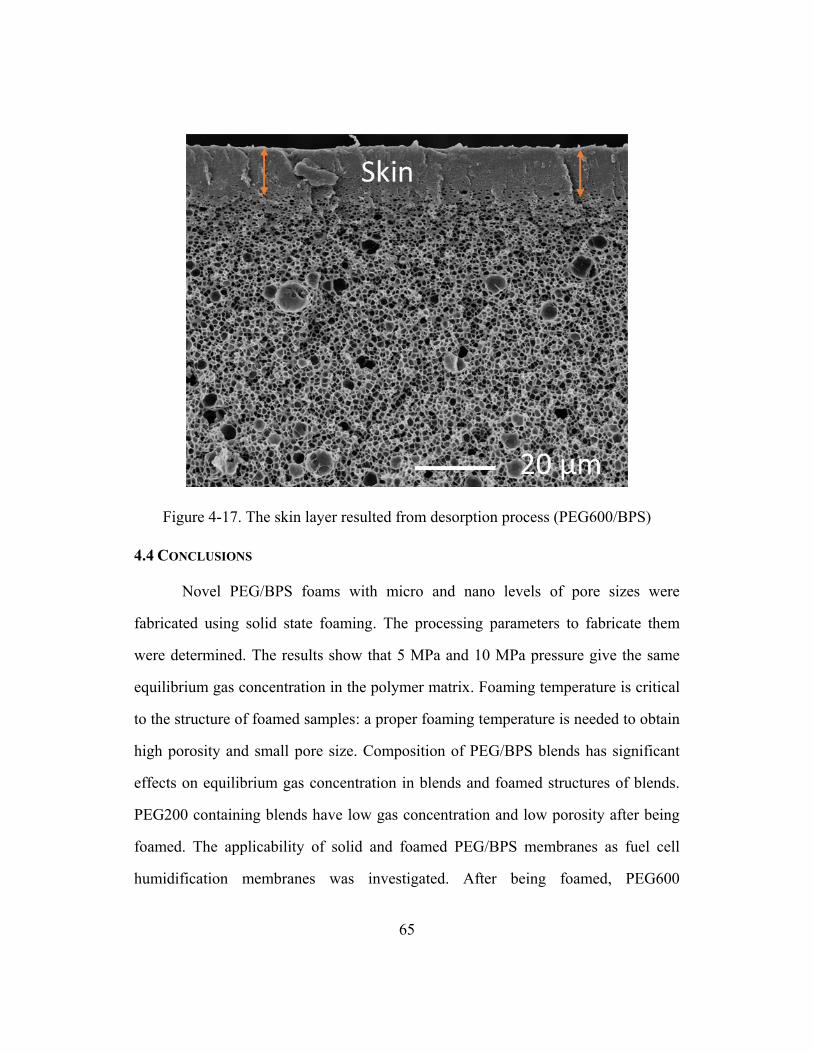
65
Figure 4-17. The skin layer resulted from desorption process (PEG600/BPS)
4.4 CONCLUSIONS
Novel PEG/BPS foams with micro and nano levels of pore sizes were
fabricated using solid state foaming. The processing parameters to fabricate them
were determined. The results show that 5 MPa and 10 MPa pressure give the same
equilibrium gas concentration in the polymer matrix. Foaming temperature is critical
to the structure of foamed samples: a proper foaming temperature is needed to obtain
high porosity and small pore size. Composition of PEG/BPS blends has significant
effects on equilibrium gas concentration in blends and foamed structures of blends.
PEG200 containing blends have low gas concentration and low porosity after being
foamed. The applicability of solid and foamed PEG/BPS membranes as fuel cell
humidification membranes was investigated. After being foamed, PEG600
66
containing membranes show significant increase in both humidification rate and
maximum relative humidity, while the PEG200 containing membranes have almost
no changes. High porosity level and nano pores connecting the micro cells in foamed
PEG600/BPS membranes are the main reasons of humidification performance
improvement. The humidification performance of foamed PEG600-20/BPS
membrane is similar to that of Nafion 212 membrane under the applied test
conditions. Solid PEG/BPS membranes would crack during low humidity operation
conditions, while foamed membranes show their advantage of keeping structural
integrity under those conditions. Air leak test results indicate that foamed PEG/BPS
membranes have air leak rates much lower than the DOE requirement. The high Tg
(> 130 ºC) of PEG600-20/BPS allows an operation temperature similar or higher
than Nafion. In addition, the price of BPS is around $2000/Kg, which will be far
lower under mass production and after being blended with PEG. Around 6 m2
membrane with 200 µm thickness can be processed out of 1 kg BPS, which will
generate a cost of around $300/m2 much lower than ~$1000/m2 of Nafion (50 µm).
The foamed PEG/BPS membranes show their potentials of being applied as
alternative fuel cell humidification membranes.

67
Chapter 5. Fabricating Microcellular Nickel Foams using
Assembled Microsphere Templates
5.1 INTRODUCTION
Like conventional metal foams, microcellular metal foams combine desirable
properties of metal and porous material including high thermal, electrical
conductivity, and low density, but with a much larger surface-to-volume ratio [38,
39]. Open-celled metal foams allow fluids to flow through, thus have attracted
significant interest due to their applications in energy storage devices, such as
lithium-ion batteries [85-87], supercapacitors [88-90], and solar energy storage tanks
[91, 92]. The metal foams in these applications are used as scaffolds to be loaded
with active electrochemical or thermal materials for high efficiency operation. Pore
size of the open-cell metal foams is a critical parameter affecting the efficiency of
these energy storage devices. As the pore size becomes smaller, a shorter transfer
path for charge or heat can be achieved between the functional material and the
conducting struts of the scaffold. Therefore, a faster charging and discharging rate
could be obtained while maintaining the same capacity [93].
Metal foams have been produced with a number of methods as described in
the Introduction chapter, however all those methods still suffer limitations of
generating small pore size, high porosity, or open celled structure. In general, the
fabrication of open-celled microcellular metal foams is still challenging, due to the
availability of small pore-size polymer foam templates, as well as the increased
difficulty of mass transport inside the polymeric templates as the pore size reduces.
Recently, a sphere-template electrodeposition method was used to fabricate micro-
and nano-cellular metal foams [13, 14, 54, 94]. Well-defined cellular microstructure
W. Jiang, S. S. Sundarram, W. Li, Bulk Microcellular Metal Foam Fabrication Using a Novel Electroplating of a Polymer
Microsphere Template, Manufacturing Letter, Volume 2, Issue 4, October 2014, Pages 118-121.
W. Jiang: Design and implement involved work, construct manuscript
S. S. Sundarram: Provide valuable discussion and edit the constructed manuscript
W. Li: Direct and supervise the work as supervisor
68
was obtained after removing the polymer sphere template. However, the foams that
were achieved had only a few layers of pores and the overall thickness of the foam
was only a few micrometers [52].
We target large scale applications such as solar or thermal energy storage,
where these microcellular metal foams will be infiltrated with a large quantity of
phase-change material (PCM). Bulk microcellular metal foams would be needed in
these applications. As the foam thickness becomes larger, the mass transport process
inside the sphere templates will become a limiting factor, affecting both uniformity
of foam growth and overall fabrication time.
This chapter discusses the fabrication of bulk microcellular nickel foams.
Two different methods are explored. The first is an electroplating method where the
metal plating starts from a conductive substrate on which the microsphere template is
attached. The second is a hybrid electroless deposition and electropolishing method
that is developed in this study. Hydrophilic polymer microsphere templates
fabricated in Chapter 2 were used as the templates.
Electroplating with various parameters was conducted and the effects were
investigated. Microcellular nickel foams with pore size on the level of 1-10 µm and
60-100 µm were produced with electroplating. However, the electroplating process
itself is inherently an unstable process, prone to generate non-uniform nickel foam
structures.
To overcome the low homogeneity of nickel foams from electroplating, a
novel electropolishing assisted eletroless deposition (EPAELD) method was
developed in this study. Ethanol based activation solution was used to allow its
infiltration into the porous structure. Comparing to electrodeposition, electroless
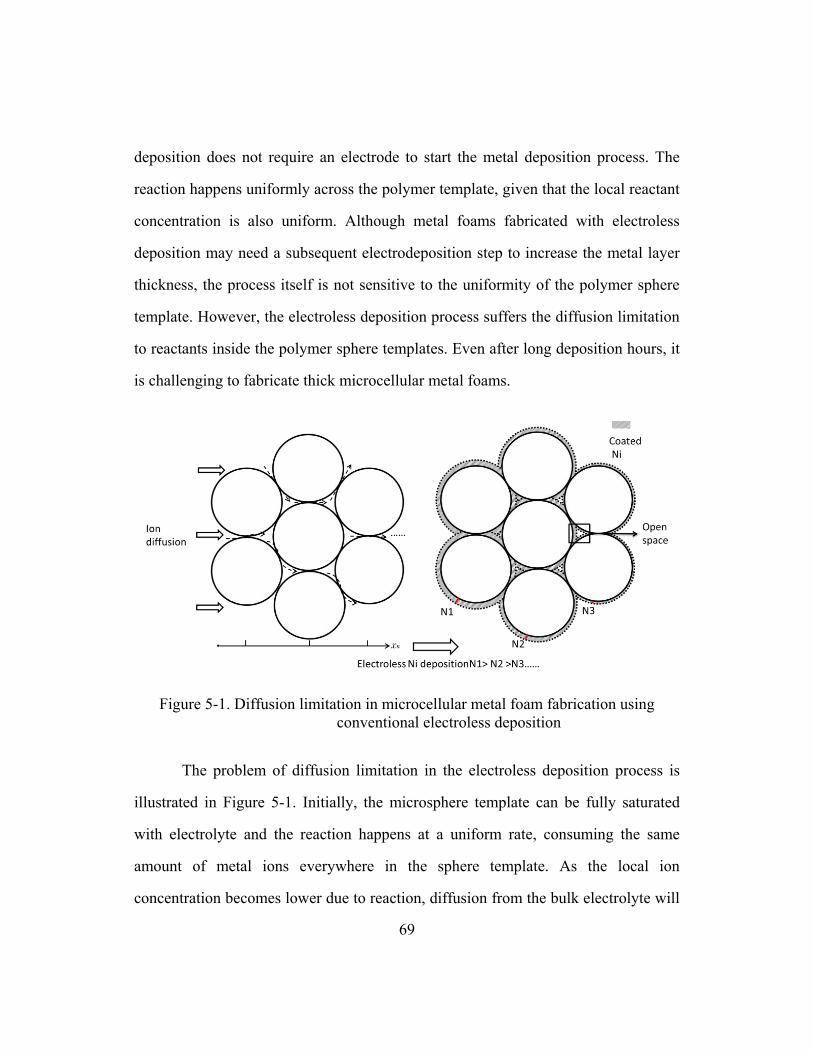
69
deposition does not require an electrode to start the metal deposition process. The
reaction happens uniformly across the polymer template, given that the local reactant
concentration is also uniform. Although metal foams fabricated with electroless
deposition may need a subsequent electrodeposition step to increase the metal layer
thickness, the process itself is not sensitive to the uniformity of the polymer sphere
template. However, the electroless deposition process suffers the diffusion limitation
to reactants inside the polymer sphere templates. Even after long deposition hours, it
is challenging to fabricate thick microcellular metal foams.
Figure 5-1. Diffusion limitation in microcellular metal foam fabrication using
conventional electroless deposition
The problem of diffusion limitation in the electroless deposition process is
illustrated in Figure 5-1. Initially, the microsphere template can be fully saturated
with electrolyte and the reaction happens at a uniform rate, consuming the same
amount of metal ions everywhere in the sphere template. As the local ion
concentration becomes lower due to reaction, diffusion from the bulk electrolyte will
70
be needed to replenish the ion loss. A concentration gradient of ions will then form
and metal ions deposit faster in the outer regions of the template where the ion
concentration is higher. This will in turn further limit the ion diffusion, as the
channels for diffusion at in the outer region become narrower. Therefore, the inner
regions of the template could stay incompletely plated, while the outer surface of the
template is completely sealed.
To overcome the diffusion limitation problem, an electropolishing step is
applied to remove metal at the surface layers of the plated polymer template. This
polishing step ensures the opening of ion-diffusion channels and the continuation of
electroless deposition process deep inside the microsphere template. Bulk
microcellular nickel foams with a thickness up to 2.5 mm were produced using this
method.
5.2 EXPERIMENTAL
5.2.1 Materials
Hydrophilic polymer templates assembled with ethylene acrylic acid (EAA)
microspheres, hydrolyzed poly(methyl methacrylate) (PMMA) spheres, and
hydrolyzed paraffin spheres were used as the templates. The measured contact angles
for EAA/water, hydrophilic PMMA/water and hydrophilic paraffin/water are listed
in Table 5-1. The contact angles confirm the hydrophilic nature of the templates.
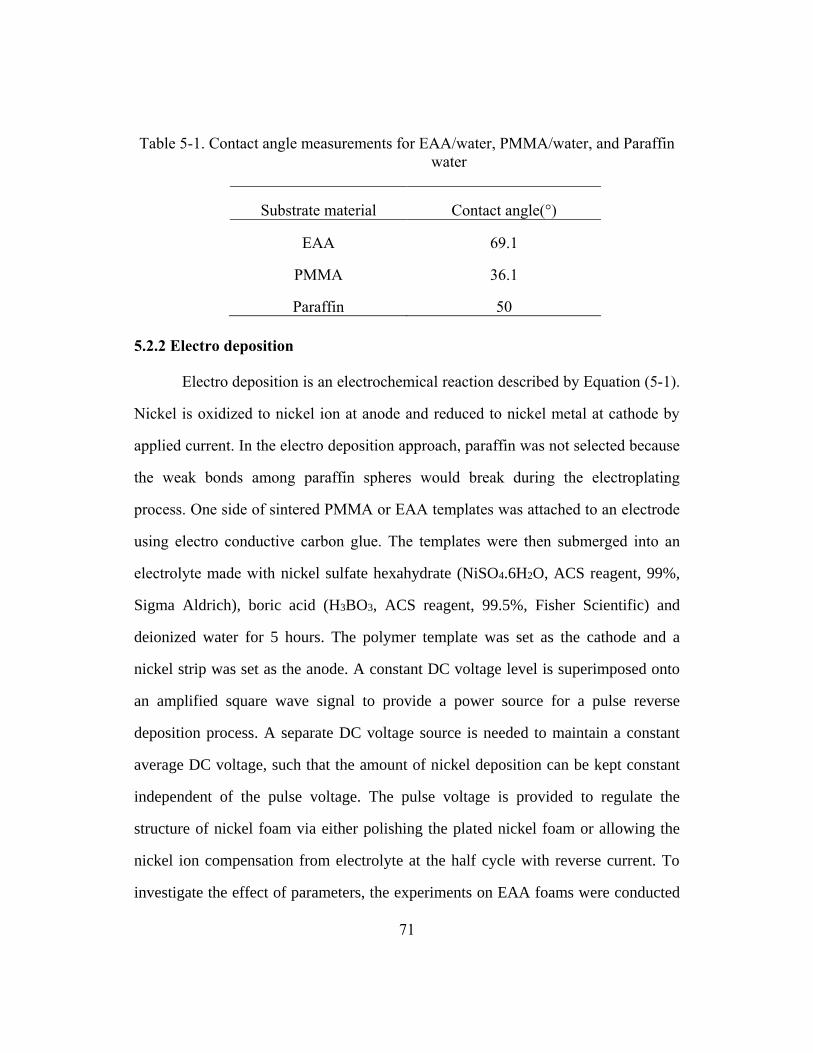
71
Table 5-1. Contact angle measurements for EAA/water, PMMA/water, and Paraffin
water
Substrate material Contact angle(°)
EAA 69.1
PMMA 36.1
Paraffin 50
5.2.2 Electro deposition
Electro deposition is an electrochemical reaction described by Equation (5-1).
Nickel is oxidized to nickel ion at anode and reduced to nickel metal at cathode by
applied current. In the electro deposition approach, paraffin was not selected because
the weak bonds among paraffin spheres would break during the electroplating
process. One side of sintered PMMA or EAA templates was attached to an electrode
using electro conductive carbon glue. The templates were then submerged into an
electrolyte made with nickel sulfate hexahydrate (NiSO4.6H2O, ACS reagent, 99%,
Sigma Aldrich), boric acid (H3BO3, ACS reagent, 99.5%, Fisher Scientific) and
deionized water for 5 hours. The polymer template was set as the cathode and a
nickel strip was set as the anode. A constant DC voltage level is superimposed onto
an amplified square wave signal to provide a power source for a pulse reverse
deposition process. A separate DC voltage source is needed to maintain a constant
average DC voltage, such that the amount of nickel deposition can be kept constant
independent of the pulse voltage. The pulse voltage is provided to regulate the
structure of nickel foam via either polishing the plated nickel foam or allowing the
nickel ion compensation from electrolyte at the half cycle with reverse current. To
investigate the effect of parameters, the experiments on EAA foams were conducted
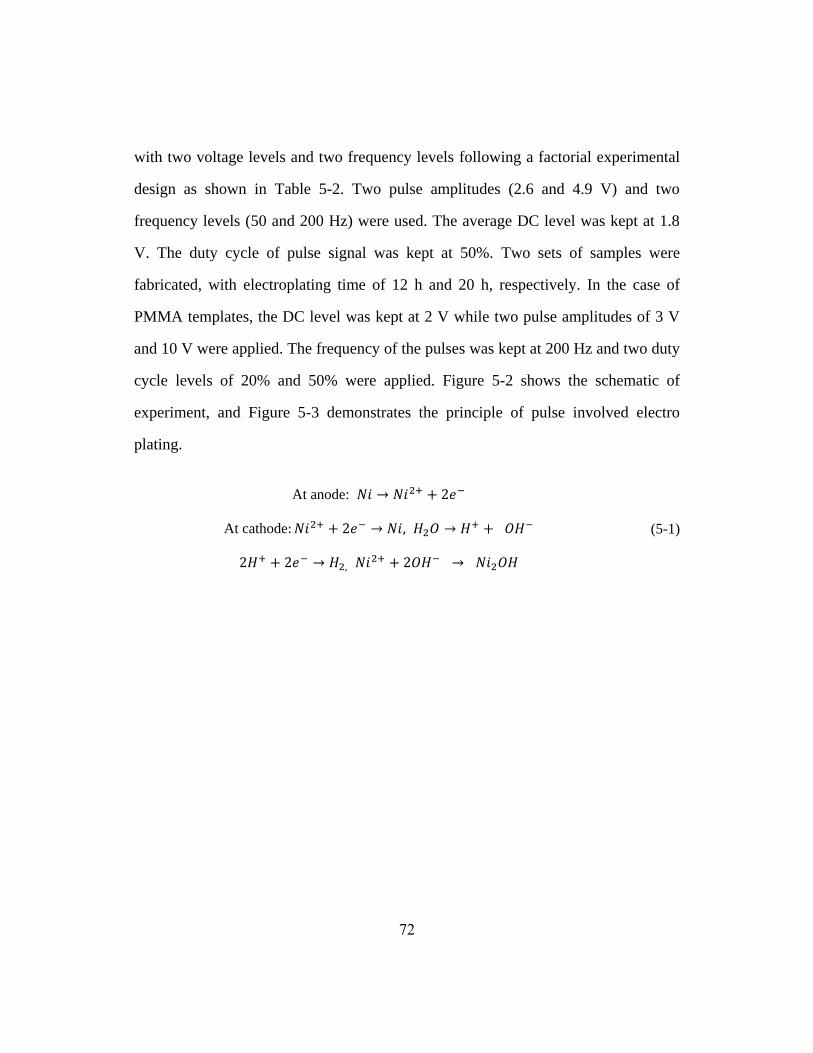
72
with two voltage levels and two frequency levels following a factorial experimental
design as shown in Table 5-2. Two pulse amplitudes (2.6 and 4.9 V) and two
frequency levels (50 and 200 Hz) were used. The average DC level was kept at 1.8
V. The duty cycle of pulse signal was kept at 50%. Two sets of samples were
fabricated, with electroplating time of 12 h and 20 h, respectively. In the case of
PMMA templates, the DC level was kept at 2 V while two pulse amplitudes of 3 V
and 10 V were applied. The frequency of the pulses was kept at 200 Hz and two duty
cycle levels of 20% and 50% were applied. Figure 5-2 shows the schematic of
experiment, and Figure 5-3 demonstrates the principle of pulse involved electro
plating.
At anode: 𝑁𝑖 → 𝑁𝑖2+ + 2𝑒−
At cathode: 𝑁𝑖2+ + 2𝑒− → 𝑁𝑖, 𝐻2𝑂 → 𝐻+ + 𝑂𝐻−
2𝐻+ + 2𝑒− → 𝐻2, 𝑁𝑖2+ + 2𝑂𝐻− → 𝑁𝑖2𝑂𝐻
(5-1)
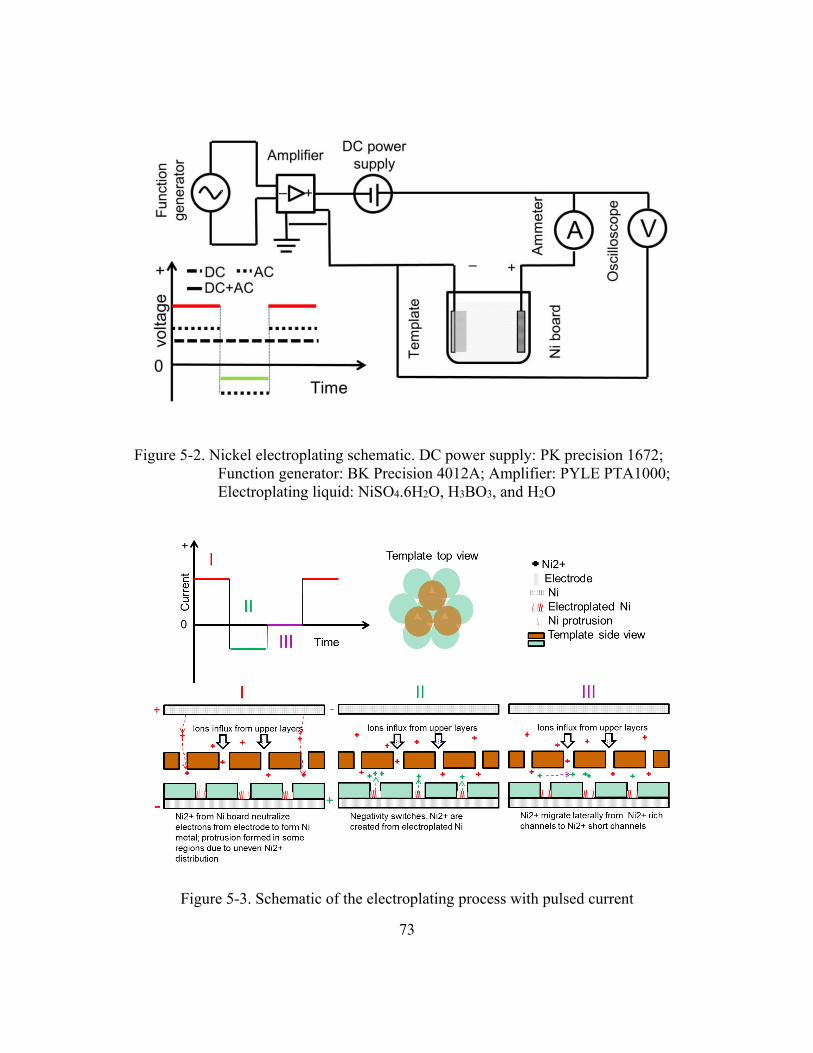
73
Figure 5-2. Nickel electroplating schematic. DC power supply: PK precision 1672;
Function generator: BK Precision 4012A; Amplifier: PYLE PTA1000;
Electroplating liquid: NiSO4.6H2O, H3BO3, and H2O
Figure 5-3. Schematic of the electroplating process with pulsed current
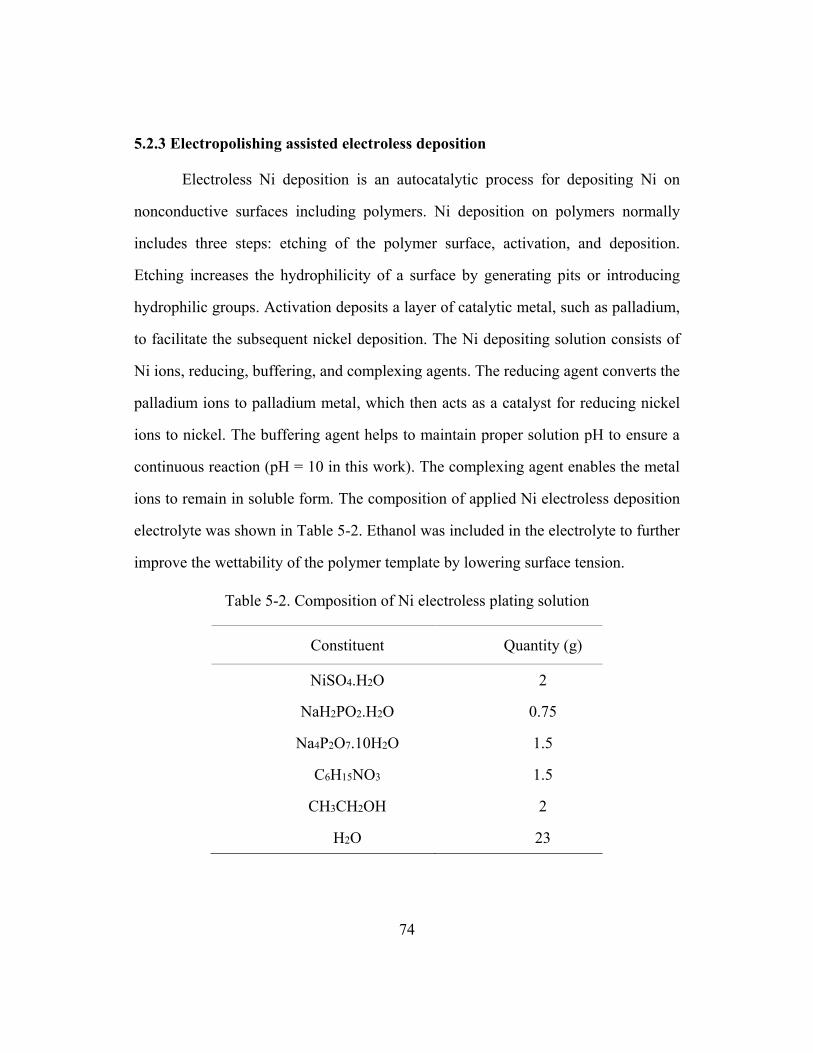
74
5.2.3 Electropolishing assisted electroless deposition
Electroless Ni deposition is an autocatalytic process for depositing Ni on
nonconductive surfaces including polymers. Ni deposition on polymers normally
includes three steps: etching of the polymer surface, activation, and deposition.
Etching increases the hydrophilicity of a surface by generating pits or introducing
hydrophilic groups. Activation deposits a layer of catalytic metal, such as palladium,
to facilitate the subsequent nickel deposition. The Ni depositing solution consists of
Ni ions, reducing, buffering, and complexing agents. The reducing agent converts the
palladium ions to palladium metal, which then acts as a catalyst for reducing nickel
ions to nickel. The buffering agent helps to maintain proper solution pH to ensure a
continuous reaction (pH = 10 in this work). The complexing agent enables the metal
ions to remain in soluble form. The composition of applied Ni electroless deposition
electrolyte was shown in Table 5-2. Ethanol was included in the electrolyte to further
improve the wettability of the polymer template by lowering surface tension.
Table 5-2. Composition of Ni electroless plating solution
Constituent Quantity (g)
NiSO4.H2O 2
NaH2PO2.H2O 0.75
Na4P2O7.10H2O 1.5
C6H15NO3 1.5
CH3CH2OH 2
H2O 23
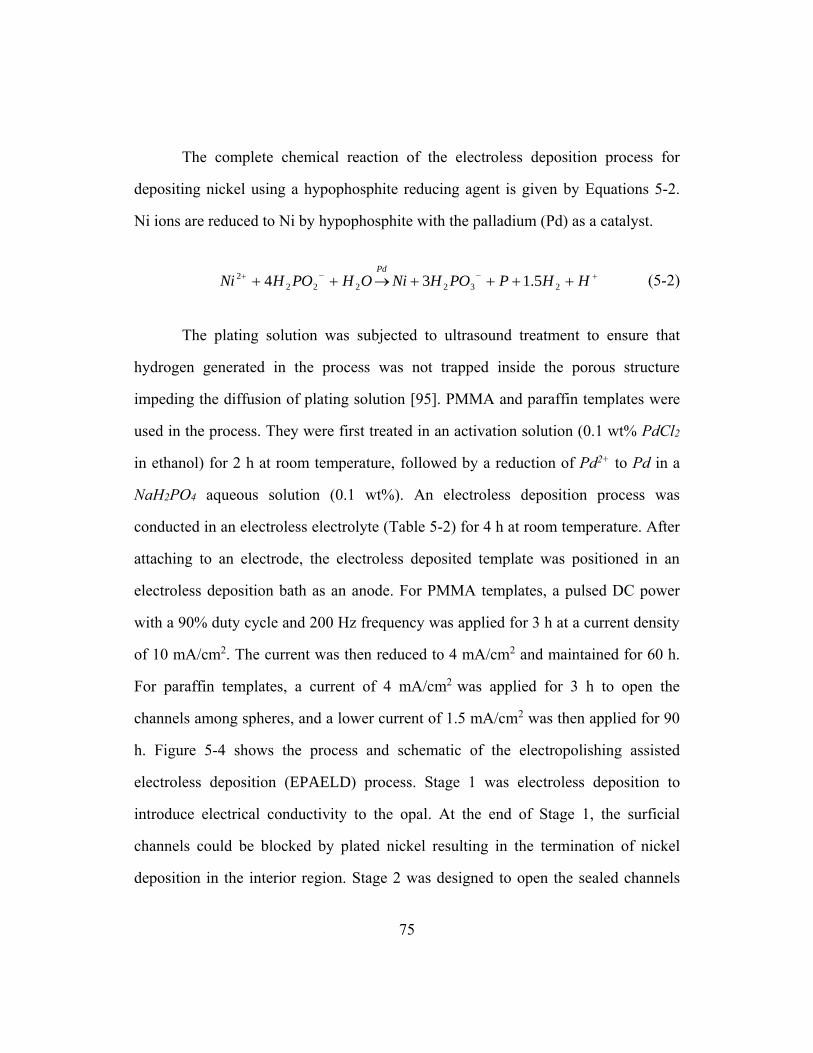
75
The complete chemical reaction of the electroless deposition process for
depositing nickel using a hypophosphite reducing agent is given by Equations 5-2.
Ni ions are reduced to Ni by hypophosphite with the palladium (Pd) as a catalyst.
HHPPOHNiOHPOHNiPd
232222
2 5.134 (5-2)
The plating solution was subjected to ultrasound treatment to ensure that
hydrogen generated in the process was not trapped inside the porous structure
impeding the diffusion of plating solution [95]. PMMA and paraffin templates were
used in the process. They were first treated in an activation solution (0.1 wt% PdCl2
in ethanol) for 2 h at room temperature, followed by a reduction of Pd2+ to Pd in a
NaH2PO4 aqueous solution (0.1 wt%). An electroless deposition process was
conducted in an electroless electrolyte (Table 5-2) for 4 h at room temperature. After
attaching to an electrode, the electroless deposited template was positioned in an
electroless deposition bath as an anode. For PMMA templates, a pulsed DC power
with a 90% duty cycle and 200 Hz frequency was applied for 3 h at a current density
of 10 mA/cm2. The current was then reduced to 4 mA/cm2 and maintained for 60 h.
For paraffin templates, a current of 4 mA/cm2 was applied for 3 h to open the
channels among spheres, and a lower current of 1.5 mA/cm2 was then applied for 90
h. Figure 5-4 shows the process and schematic of the electropolishing assisted
electroless deposition (EPAELD) process. Stage 1 was electroless deposition to
introduce electrical conductivity to the opal. At the end of Stage 1, the surficial
channels could be blocked by plated nickel resulting in the termination of nickel
deposition in the interior region. Stage 2 was designed to open the sealed channels
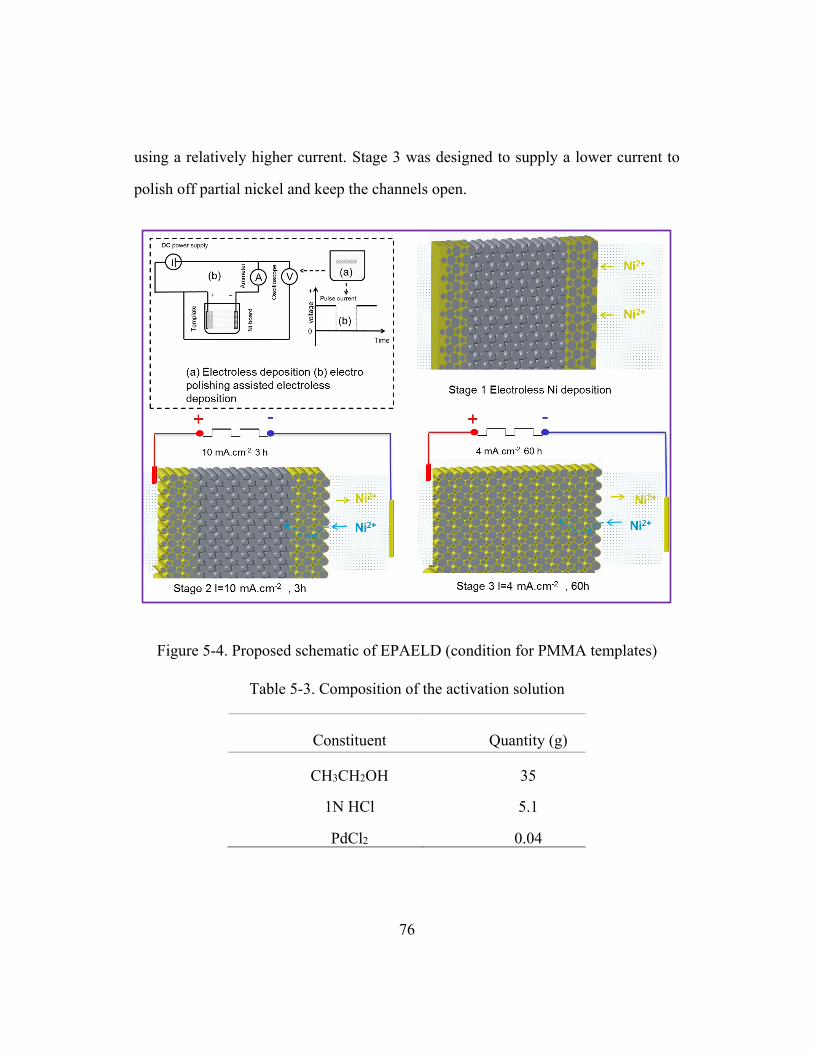
76
using a relatively higher current. Stage 3 was designed to supply a lower current to
polish off partial nickel and keep the channels open.
Figure 5-4. Proposed schematic of EPAELD (condition for PMMA templates)
Table 5-3. Composition of the activation solution
Constituent Quantity (g)
CH3CH2OH 35
1N HCl 5.1
PdCl2 0.04
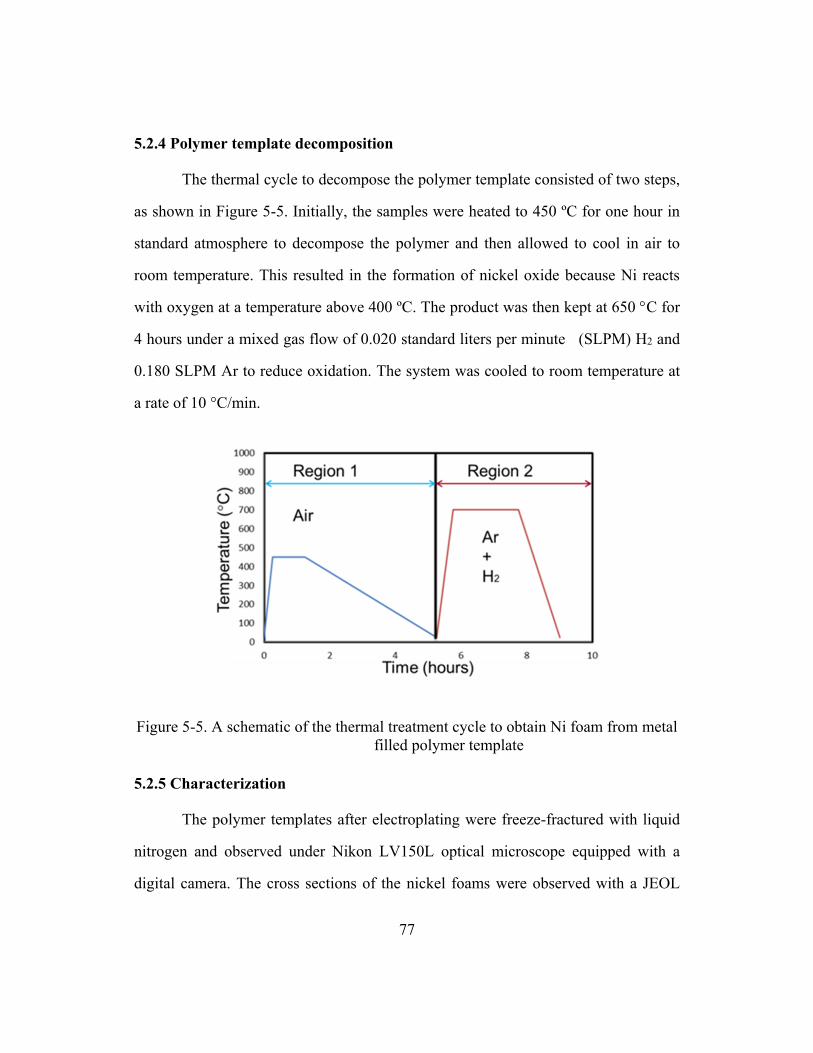
77
5.2.4 Polymer template decomposition
The thermal cycle to decompose the polymer template consisted of two steps,
as shown in Figure 5-5. Initially, the samples were heated to 450 ºC for one hour in
standard atmosphere to decompose the polymer and then allowed to cool in air to
room temperature. This resulted in the formation of nickel oxide because Ni reacts
with oxygen at a temperature above 400 ºC. The product was then kept at 650 C for
4 hours under a mixed gas flow of 0.020 standard liters per minute (SLPM) H2 and
0.180 SLPM Ar to reduce oxidation. The system was cooled to room temperature at
a rate of 10 °C/min.
Figure 5-5. A schematic of the thermal treatment cycle to obtain Ni foam from metal
filled polymer template
5.2.5 Characterization
The polymer templates after electroplating were freeze-fractured with liquid
nitrogen and observed under Nikon LV150L optical microscope equipped with a
digital camera. The cross sections of the nickel foams were observed with a JEOL
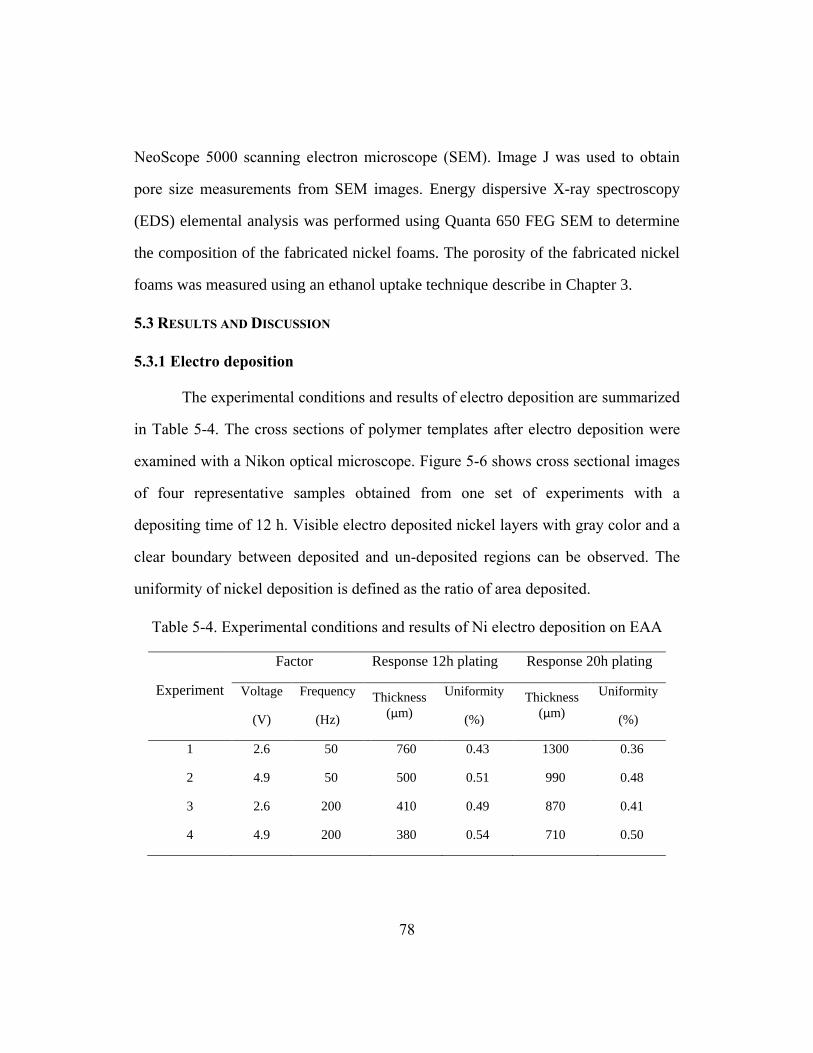
78
NeoScope 5000 scanning electron microscope (SEM). Image J was used to obtain
pore size measurements from SEM images. Energy dispersive X-ray spectroscopy
(EDS) elemental analysis was performed using Quanta 650 FEG SEM to determine
the composition of the fabricated nickel foams. The porosity of the fabricated nickel
foams was measured using an ethanol uptake technique describe in Chapter 3.
5.3 RESULTS AND DISCUSSION
5.3.1 Electro deposition
The experimental conditions and results of electro deposition are summarized
in Table 5-4. The cross sections of polymer templates after electro deposition were
examined with a Nikon optical microscope. Figure 5-6 shows cross sectional images
of four representative samples obtained from one set of experiments with a
depositing time of 12 h. Visible electro deposited nickel layers with gray color and a
clear boundary between deposited and un-deposited regions can be observed. The
uniformity of nickel deposition is defined as the ratio of area deposited.
Table 5-4. Experimental conditions and results of Ni electro deposition on EAA
Experiment
Factor Response 12h plating Response 20h plating
Voltage
(V)
Frequency
(Hz)
Thickness
(µm)
Uniformity
(%)
Thickness
(µm)
Uniformity
(%)
1 2.6 50 760 0.43 1300 0.36
2 4.9 50 500 0.51 990 0.48
3 2.6 200 410 0.49 870 0.41
4 4.9 200 380 0.54 710 0.50
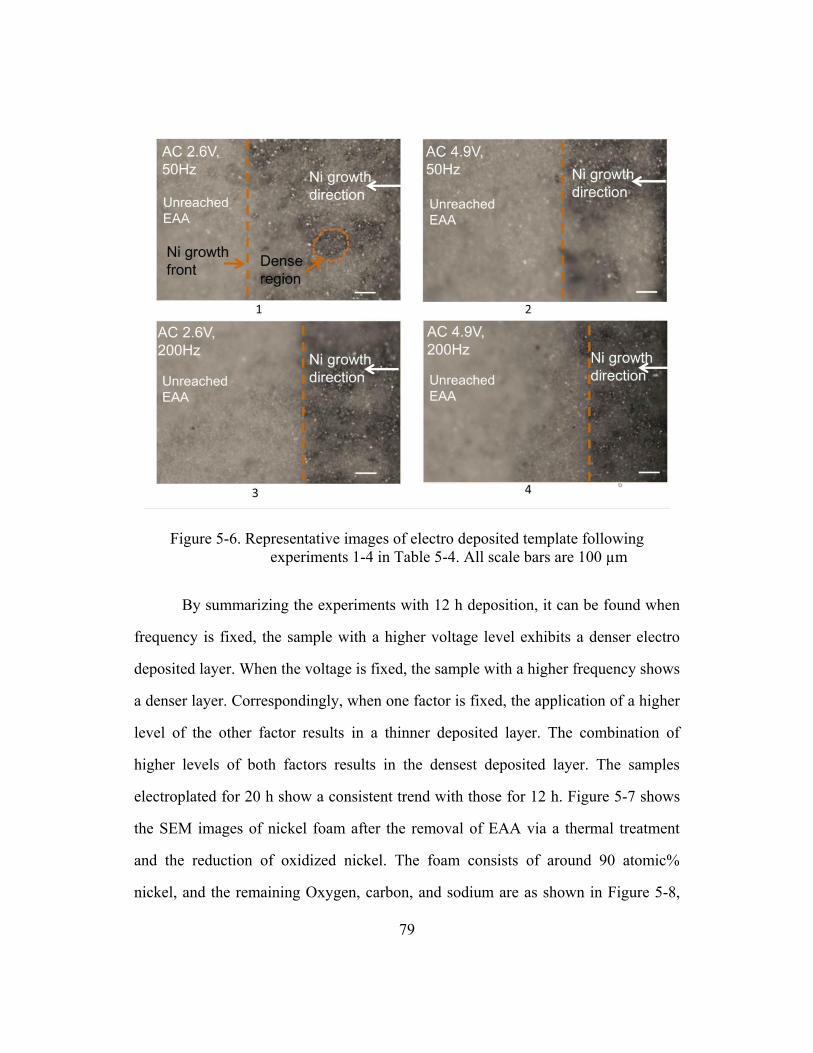
79
Figure 5-6. Representative images of electro deposited template following
experiments 1-4 in Table 5-4. All scale bars are 100 µm
By summarizing the experiments with 12 h deposition, it can be found when
frequency is fixed, the sample with a higher voltage level exhibits a denser electro
deposited layer. When the voltage is fixed, the sample with a higher frequency shows
a denser layer. Correspondingly, when one factor is fixed, the application of a higher
level of the other factor results in a thinner deposited layer. The combination of
higher levels of both factors results in the densest deposited layer. The samples
electroplated for 20 h show a consistent trend with those for 12 h. Figure 5-7 shows
the SEM images of nickel foam after the removal of EAA via a thermal treatment
and the reduction of oxidized nickel. The foam consists of around 90 atomic%
nickel, and the remaining Oxygen, carbon, and sodium are as shown in Figure 5-8,
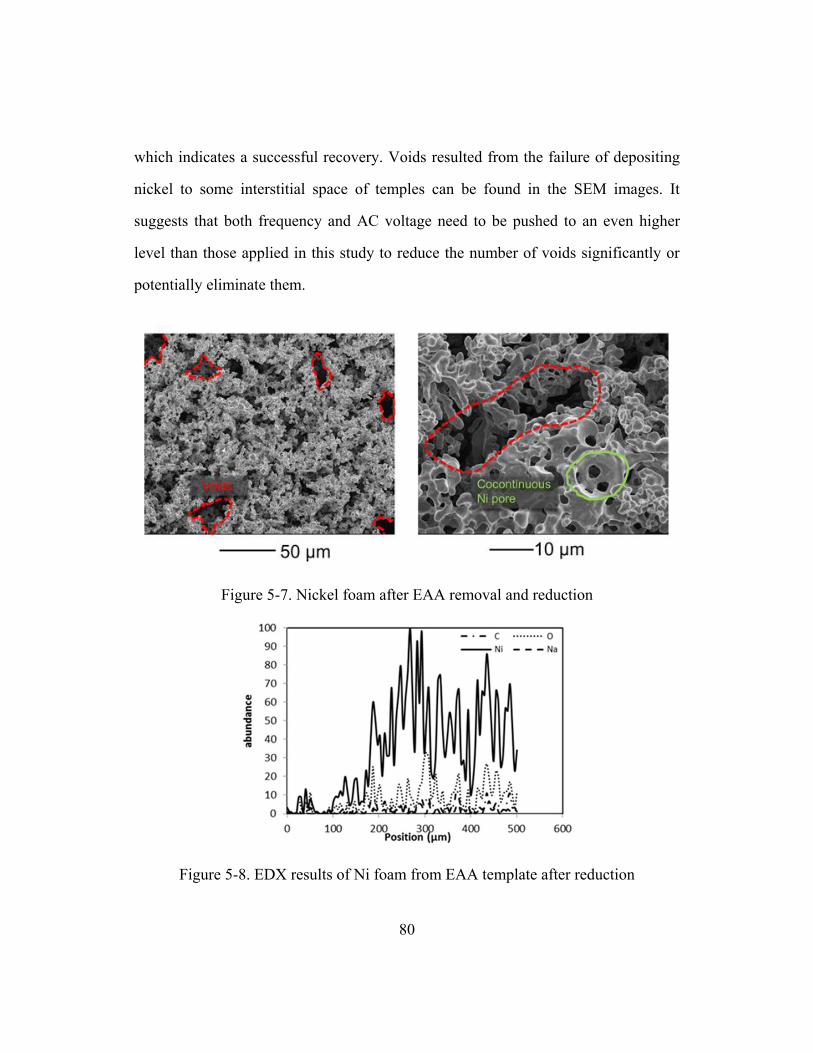
80
which indicates a successful recovery. Voids resulted from the failure of depositing
nickel to some interstitial space of temples can be found in the SEM images. It
suggests that both frequency and AC voltage need to be pushed to an even higher
level than those applied in this study to reduce the number of voids significantly or
potentially eliminate them.
Figure 5-7. Nickel foam after EAA removal and reduction
Figure 5-8. EDX results of Ni foam from EAA template after reduction
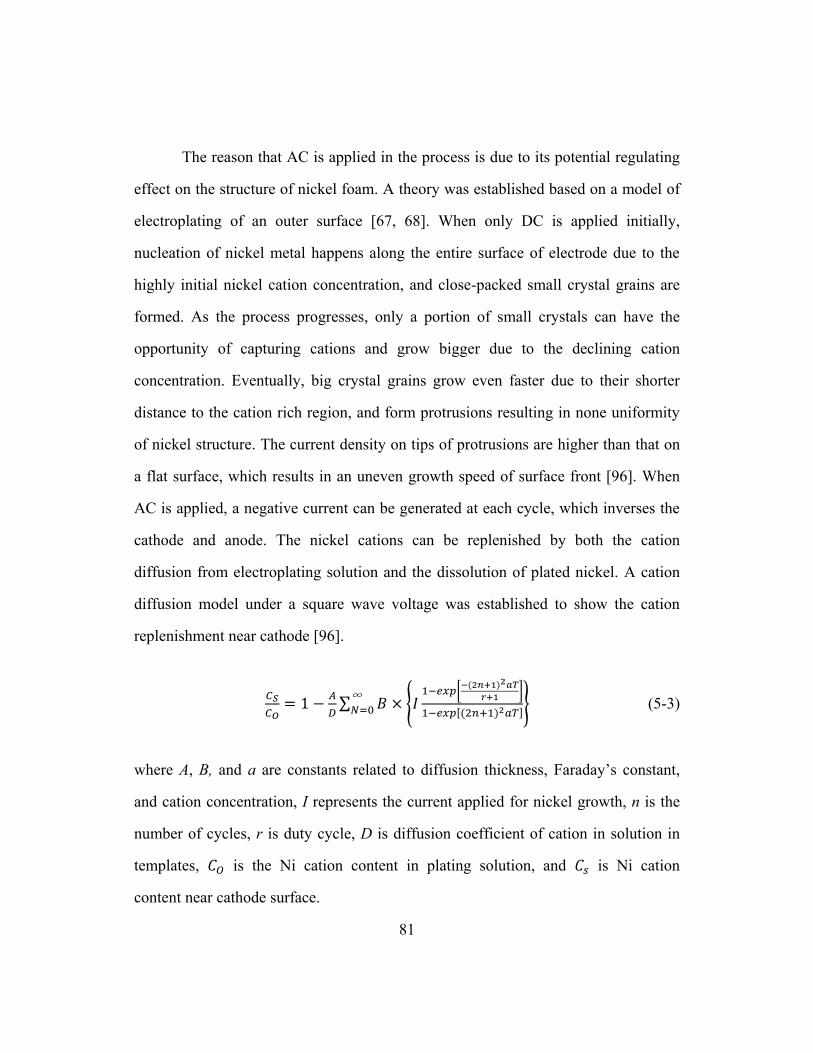
81
The reason that AC is applied in the process is due to its potential regulating
effect on the structure of nickel foam. A theory was established based on a model of
electroplating of an outer surface [67, 68]. When only DC is applied initially,
nucleation of nickel metal happens along the entire surface of electrode due to the
highly initial nickel cation concentration, and close-packed small crystal grains are
formed. As the process progresses, only a portion of small crystals can have the
opportunity of capturing cations and grow bigger due to the declining cation
concentration. Eventually, big crystal grains grow even faster due to their shorter
distance to the cation rich region, and form protrusions resulting in none uniformity
of nickel structure. The current density on tips of protrusions are higher than that on
a flat surface, which results in an uneven growth speed of surface front [96]. When
AC is applied, a negative current can be generated at each cycle, which inverses the
cathode and anode. The nickel cations can be replenished by both the cation
diffusion from electroplating solution and the dissolution of plated nickel. A cation
diffusion model under a square wave voltage was established to show the cation
replenishment near cathode [96].
𝐶𝑆
𝐶𝑂= 1 −
𝐴
𝐷∑ 𝐵
∞𝑁=0 × {𝐼
1−𝑒𝑥𝑝[−(2𝑛+1)2𝑎𝑇
𝑟+1]
1−𝑒𝑥𝑝[(2𝑛+1)2𝑎𝑇]} (5-3)
where A, B, and a are constants related to diffusion thickness, Faraday’s constant,
and cation concentration, I represents the current applied for nickel growth, n is the
number of cycles, r is duty cycle, D is diffusion coefficient of cation in solution in
templates, 𝐶𝑂 is the Ni cation content in plating solution, and 𝐶𝑠 is Ni cation
content near cathode surface.

82
If the current I is constant, 𝐶𝑠/𝐶𝑂 will decrease with the increasing AC cycle
period T, so increase with the increasing AC frequency. Beside the even nickel
growth resulted from a high 𝐶𝑠, more nucleation can also be triggered by AC to
form a new layer of close-packed small crystal grains. As a result, protrusions are
prevented and the nickel structure is regulated. In our electrodeposition experiments,
this theory is verified, although the cation diffusion is significantly complicated by
the porous morphology of templates. Physically and electrochemically, there are two
underlying mechanisms for the effect of frequency. When applying a high frequency,
a relatively high near cathode cation concentration is obtained and leads to an even
nickel growth, meanwhile the growth of existing crystal grains are interrupted more
often to initiate more nucleation resulting in a tighter nickel structure. Regarding the
voltage, a high voltage drives cations to near cathode region more rapidly than a low
voltage does, so as to result in a denser nickel structure.
Hydrophilic PMMA templates were electroplated using the conditions listed
in Table 5-4. The Ni structure from the 4th condition after PMMA removal is shown
in Figure 5-9. It can be found that even the highest power AC was not able to
produce thick and homogeneous Ni foam on PMMA templates. The potential reason
is that the space between PMMA spheres is too big to provide constrain on Ni
deposition. Ni deposition tends to choose an easier path with bigger channel sizes
and better Ni ion diffusion from bulk electrolyte.
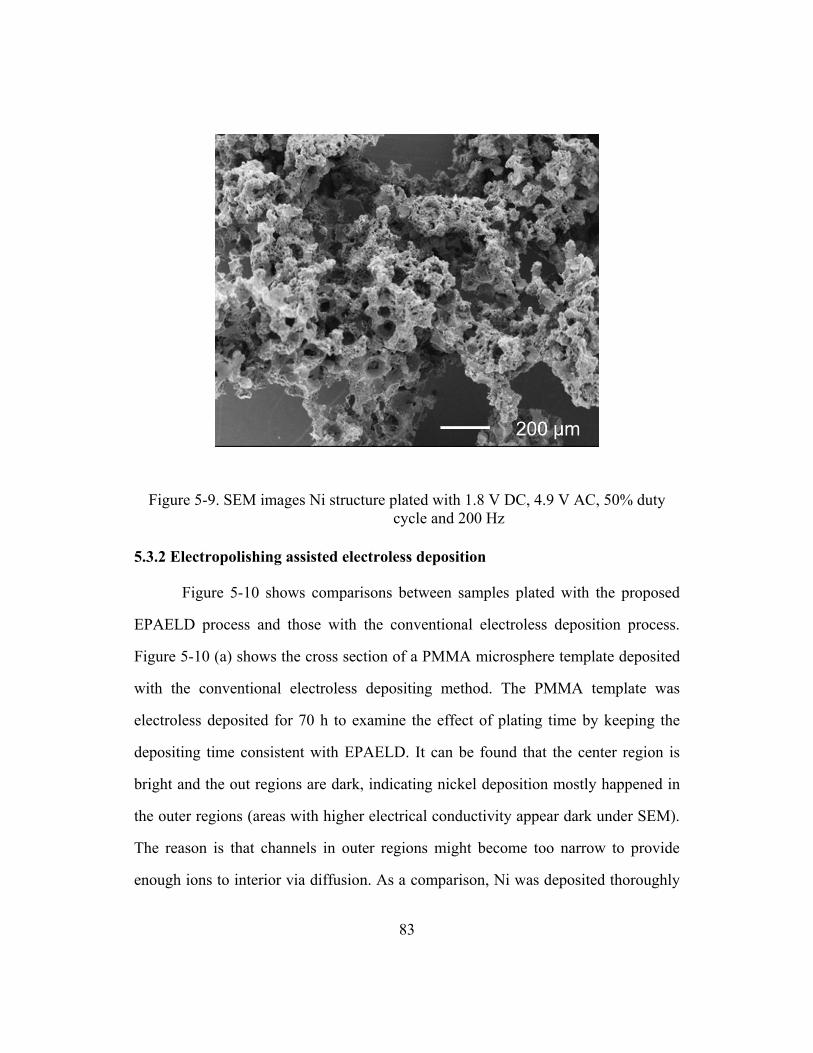
83
Figure 5-9. SEM images Ni structure plated with 1.8 V DC, 4.9 V AC, 50% duty
cycle and 200 Hz
5.3.2 Electropolishing assisted electroless deposition
Figure 5-10 shows comparisons between samples plated with the proposed
EPAELD process and those with the conventional electroless deposition process.
Figure 5-10 (a) shows the cross section of a PMMA microsphere template deposited
with the conventional electroless depositing method. The PMMA template was
electroless deposited for 70 h to examine the effect of plating time by keeping the
depositing time consistent with EPAELD. It can be found that the center region is
bright and the out regions are dark, indicating nickel deposition mostly happened in
the outer regions (areas with higher electrical conductivity appear dark under SEM).
The reason is that channels in outer regions might become too narrow to provide
enough ions to interior via diffusion. As a comparison, Ni was deposited thoroughly
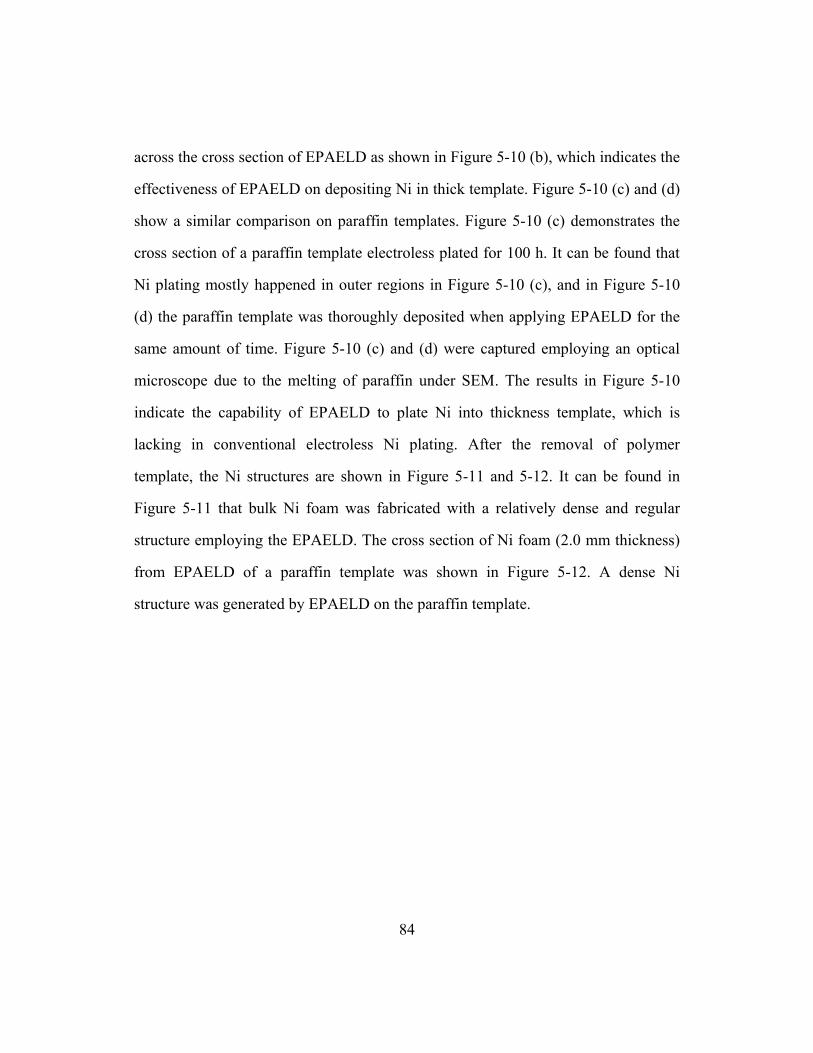
84
across the cross section of EPAELD as shown in Figure 5-10 (b), which indicates the
effectiveness of EPAELD on depositing Ni in thick template. Figure 5-10 (c) and (d)
show a similar comparison on paraffin templates. Figure 5-10 (c) demonstrates the
cross section of a paraffin template electroless plated for 100 h. It can be found that
Ni plating mostly happened in outer regions in Figure 5-10 (c), and in Figure 5-10
(d) the paraffin template was thoroughly deposited when applying EPAELD for the
same amount of time. Figure 5-10 (c) and (d) were captured employing an optical
microscope due to the melting of paraffin under SEM. The results in Figure 5-10
indicate the capability of EPAELD to plate Ni into thickness template, which is
lacking in conventional electroless Ni plating. After the removal of polymer
template, the Ni structures are shown in Figure 5-11 and 5-12. It can be found in
Figure 5-11 that bulk Ni foam was fabricated with a relatively dense and regular
structure employing the EPAELD. The cross section of Ni foam (2.0 mm thickness)
from EPAELD of a paraffin template was shown in Figure 5-12. A dense Ni
structure was generated by EPAELD on the paraffin template.
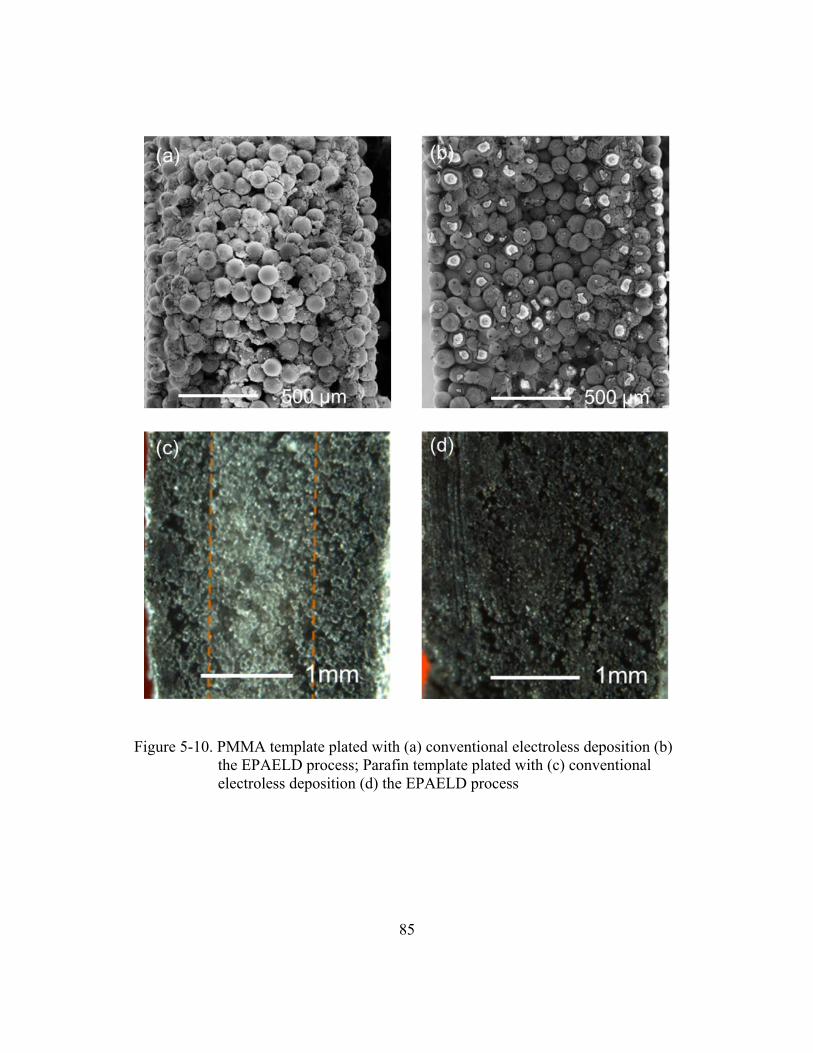
85
Figure 5-10. PMMA template plated with (a) conventional electroless deposition (b)
the EPAELD process; Parafin template plated with (c) conventional
electroless deposition (d) the EPAELD process
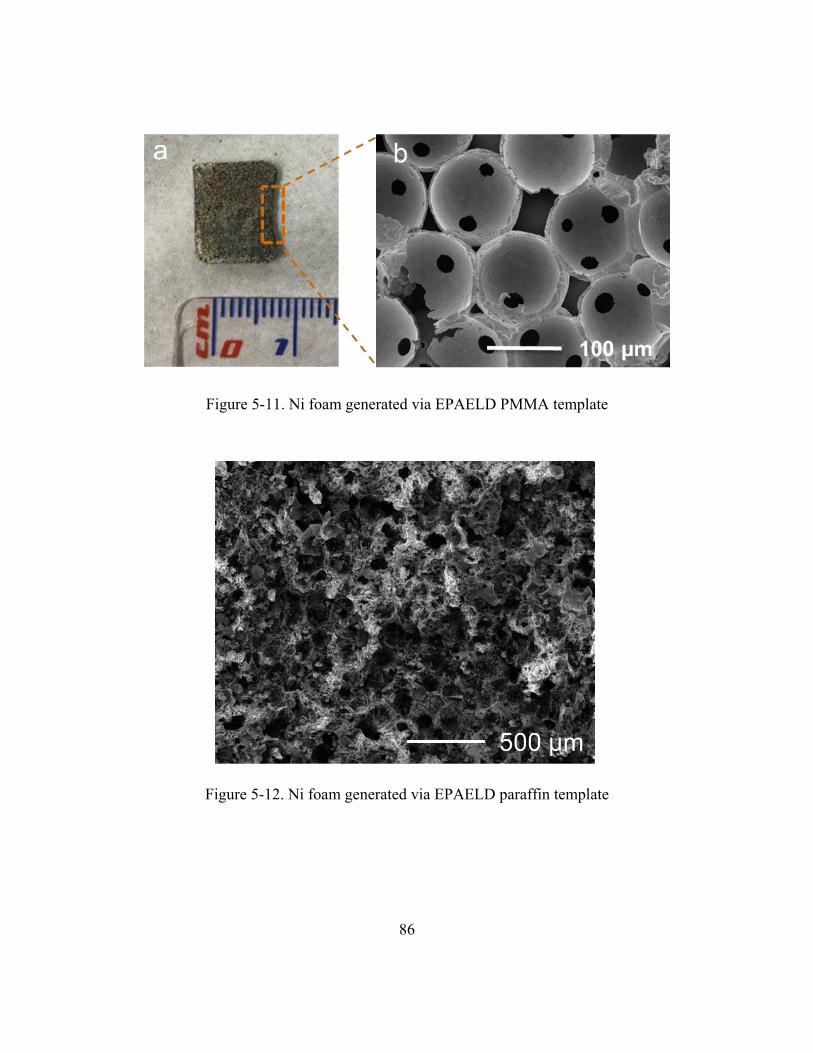
86
Figure 5-11. Ni foam generated via EPAELD PMMA template
Figure 5-12. Ni foam generated via EPAELD paraffin template

87
5.4 CONCLUSIONS
The improved electroplating technique involving AC and vacuum is capable
of fabricating bulk microcellular nickel foams, but with multiple defects and voids.
The designed recovery process shows its effectiveness of reducing the Oxygen in
nickel foam involved by an EAA removal process. In the electroplating of porous
templates, AC superimposed DC shows a significant effect of regulating the nickel
foam structure. Both high AC frequency and high AC voltage show positive effect
on the uniformity of deposited nickel foams. The combination of a high frequency
and high voltage leads to the densest deposited template. However, with the
regulating effect on Ni structure, the electroplating technique with AC is still not
capable of producing Ni structure with high uniformity.
A novel approach of electro polishing assisted electroless Ni foam deposition
was developed and applied on the fabrication of bulk microcellular Ni foam with
multilayers. Free standing and highly uniform bulk Ni foam was obtained by
enhancing the electroless deposited one with an additional electrodeposition step.
88
Chapter 6. Modeling of the EPAELD Process
6.1 INTRODUCTION
As described in Chapter 5, an electropolishing-assisted electroless deposition
(EPAELD) process was developed to overcome the inhomogeneous Ni deposition on
close-packed polymer microspheres template. Since the EPAELD process involves
many variables, for example geometric parameters of the sphere template, diffusion
coefficient in porous media, and the rate for electrochemical reaction, a process
model is needed to achieve fundamental understanding and to optimize the hybrid
electroless deposition process. This chapter presents the development of a process
model for the EPAELD process. The model suggests that the EPAELD process is
cable of depositing Ni evenly across bulk polymer templates, which is not achievable
using only either electroless or electro deposition. In addition, the sphere size in
template, electrolyte concentration, and electropolishing current density are
significant factors of the EPAELD process. Proper combinations of those factors for
templates with different sphere size were predicted and suggested through parametric
study to achieve the evenest Ni distributions across the templates.
6.2 MODELING METHODS
A finite difference analysis of ion diffusion in porous media was conducted.
The process model was developed to understand mechanisms of the developed
EPAELD process and to predict proper conditions for templates with different sphere
sizes.

89
6.2.1 Reaction kinetics of the electroless deposition process
The same as demonstrated in Chapter 5, the chemical reaction of the
electroless deposition process for depositing nickel using a hypophosphite reducing
agent is given in Equation (6-1). Ni2+ ions are reduced to Ni by hypophosphite
[ 𝐻2𝑃𝑂2−] with palladium (Pd) as a catalyst.
HHPPOHNiOHPOHNiPd
232222
2 5.134 (6-1)
The volumetric rate of reaction in electroless deposition , r, has been determined as
[97],
𝑟 = 𝑒 ∙ 𝑘 ∙[ 𝐻2𝑃𝑂2
−]
[𝐻+]0.4 (6-2)
where k represents the reaction rate constant, [ 𝐻2𝑃𝑂2−] and [𝐻+] are ion
concentrations, and e is an energy term defined as
𝑒 = 𝑒𝑥𝑝 (−𝐸𝑎
360𝑅) ∙ 𝑒𝑥𝑝 (
𝐸𝑎
360𝑅∙𝑇−360
𝑇) (6-3)
Ea in Equation (6-3) is the activation energy of the reaction, R is the idea gas
constant, and T is the absolute temperature.
In this study, the pH of the electrolyte is stabilized with a buffering agent,
and therefore [𝐻+] can be assumed constant. Hence the reaction rate at any given
time is determined by [ 𝐻2𝑃𝑂2−]. Considering the Ni deposition reaction occurs in
the interstitial space of the microsphere template, [ 𝐻2𝑃𝑂2−] will be affected by
both the electroless deposition reaction and the diffusion of 𝐻2𝑃𝑂2− from the bulk
electrolyte. Ion diffusion coefficient depends on the geometry of the porous
microsphere template. As shown in Figure 5-1, the diffusion process is time varying
90
along the cross-section of the template after Ni deposition starts. Initially the
template is fully saturated with electrolyte and Ni will be deposited homogenously
due to the uniform 𝐻2𝑃𝑂2−concentration. Over time, a 𝐻2𝑃𝑂2
− concentration
gradient forms due to the ion consumption and diffusion from the bulk electrolyte.
The Ni deposition rate will be faster near the template surface, which will further
increase the steepness of the concentration gradient and limit the amount of
𝐻2𝑃𝑂2−diffusing into the template interior.
Therefore, the electroless reaction rate in this study is expressed as the
following:
𝑟(𝑥, 𝑡) = 𝑒 ∙ 𝑘 ∙𝐶(𝑥,𝑡)
𝐶𝐻0.4 (6-4)
where t is time and x is the thickness location, 𝐶(𝑥, 𝑡) and 𝐶𝐻 is the local
𝐻2𝑃𝑂2− and H+ concentration, respectively.
6.2.2 Local 𝐇𝟐𝐏𝐎𝟐−
concentration
The local 𝐻2𝑃𝑂2− concentration is affected by both diffusion and chemical
reaction, and can be expressed as
𝐶 = 𝐶𝑖 − 𝐶𝑟 + 𝐶𝐷 (6-5)
where 𝐶𝑖 is the initial concentration, Cr is the reduction due to reaction, and 𝐶𝐷 is
the addition due to diffusion. Before the electroless deposition process starts, the
initial ion concentration 𝐶𝑖 = 𝐶0, the ion concentration in the bulk electrolyte. The
reduction due to reaction Cr can be determined with Equation (6-4). The
concentration due to diffusion 𝐶𝐷 can be determined with Fick’s second law as
shown below,
91
𝑑𝐶
𝑑𝑡= −𝐷
𝑑2𝐶
𝑑𝑥2 (6-6)
The boundary condition at the template surface can be set as 𝐶 = 𝐶0 and 𝐷 = 𝐷0.
According to Yu, et al. [98], the diffusion coefficient D in a porous media depends
on the local porosity () and tortuosity (), and can be determined using the
following equation.
𝐷 = 𝐷0 ∙ (
) (6-7)
where 𝐷0 is the diffusion coefficient of 𝐻2𝑃𝑂2− in bulk Ni electroless deposition
electrolyte. For a close-packed sphere template, the tortuosity can be determined
through porosity as [98]
= 0.5(1 + √1 − ) +√(
1
√1−−1)2+0.25
1−√1− (6-8)
It can be seen that the local porosity and tortuosity during the electroless
deposition process is a key parameter determining the ion diffusion coefficient. The
local porosity changes as Ni is deposited onto the surface of the polymer
microspheres. The thickness of Ni deposition can be observed under scanning
electron microscopy to validate the process model. Therefore, the deposited Ni layer
thickness is determined in this study.
6.2.3 Deposited Ni layer thickness
Figure 6-1 shows a geometric model of a close-packed microsphere template,
with ra denoting the radius of the microsphere and x the distance between two
adjacent layers of spheres. The ion concentration and diffusion coefficient of
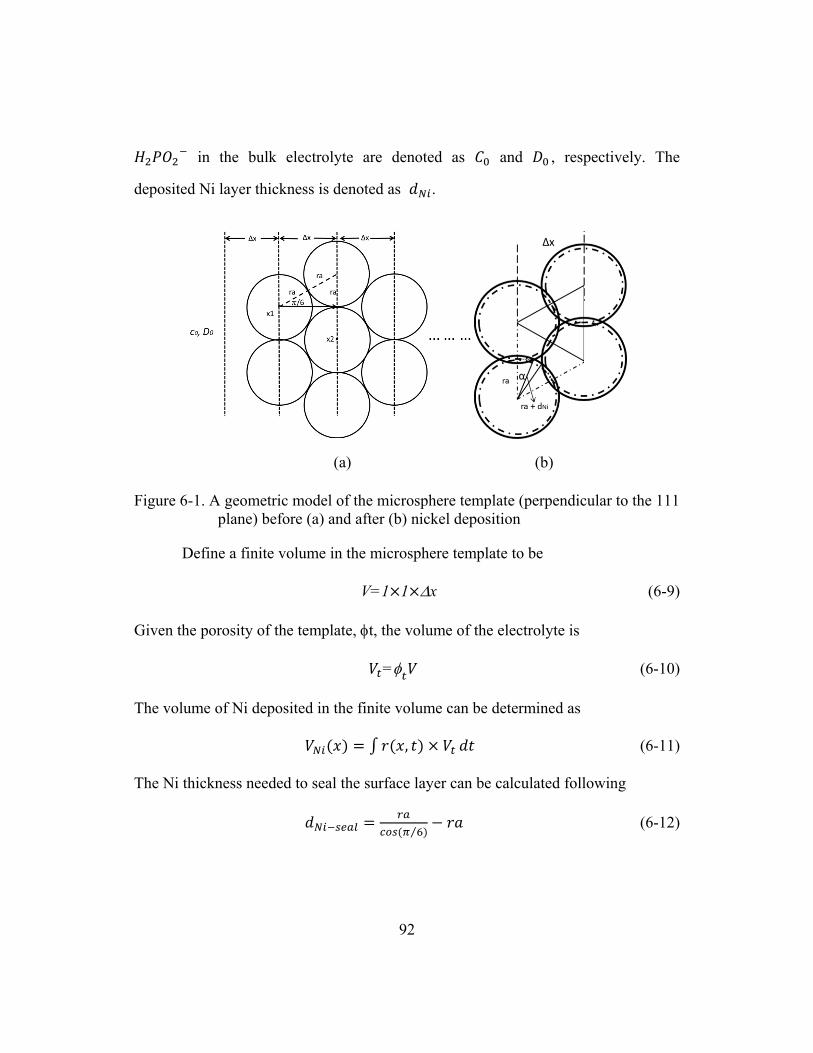
92
𝐻2𝑃𝑂2− in the bulk electrolyte are denoted as 𝐶0 and 𝐷0 , respectively. The
deposited Ni layer thickness is denoted as 𝑑𝑁𝑖.
(a) (b)
Figure 6-1. A geometric model of the microsphere template (perpendicular to the 111
plane) before (a) and after (b) nickel deposition
Define a finite volume in the microsphere template to be
V=1×1×x (6-9)
Given the porosity of the template, t, the volume of the electrolyte is
𝑉𝑡=𝑡𝑉 (6-10)
The volume of Ni deposited in the finite volume can be determined as
𝑉𝑁𝑖(𝑥) = ∫ 𝑟(𝑥, 𝑡) × 𝑉𝑡 𝑑𝑡 (6-11)
The Ni thickness needed to seal the surface layer can be calculated following
𝑑𝑁𝑖−𝑠𝑒𝑎𝑙 =𝑟𝑎
𝑐𝑜𝑠 (𝜋 6⁄ )− 𝑟𝑎 (6-12)
93
After the surface layer is completely sealed with deposited Ni and the
polishing current is introduced, the number of Ni atoms converted to Ni2+ by
polishing can be calculated with Equation (6-13). Although the local Ni2+is increased
by the polishing effect, the electroless deposition rate 𝑟(𝑥, 𝑡) will not be affected by
Ni2+ but still dominated by 𝐻2𝑃𝑂2−. Combined with the electroless Ni deposition
rate, the number n is used to decide the Ni thickness polished off and also the
porosity.
𝑛 =1
𝑧 𝐹∫ 𝑖(𝑡) 𝑑𝑡 (6-13)
where i(t) represents the polishing current, F is Faraday’s constant, and z is the
number of electrons transferred from each atom.
To obtain the local (layer wise) volume of net deposited Ni at time t and
location x, the electroless deposition rate is needed and can be calculated with
Equation (6-14). The Ni volume deposited at 𝑡 in the layer can be described with
the following equation,
𝑣𝑁𝑖(𝑥, 𝑡) = ∫ 𝑟(𝑥, 𝑡) ∙ 𝑣 ∙ (𝑥, 𝑡) ∙𝑀𝑁𝑖
𝜌𝑁𝑖𝑑𝑡 (6-14)
where 𝑀𝑁𝑖 is molecular weight of Ni, and 𝜌𝑁𝑖 is density of Ni, v is the total
volume under investigation.
In fact the deposited Ni volume in the three stages of the EPAELD process is
different, and can be expressed as:
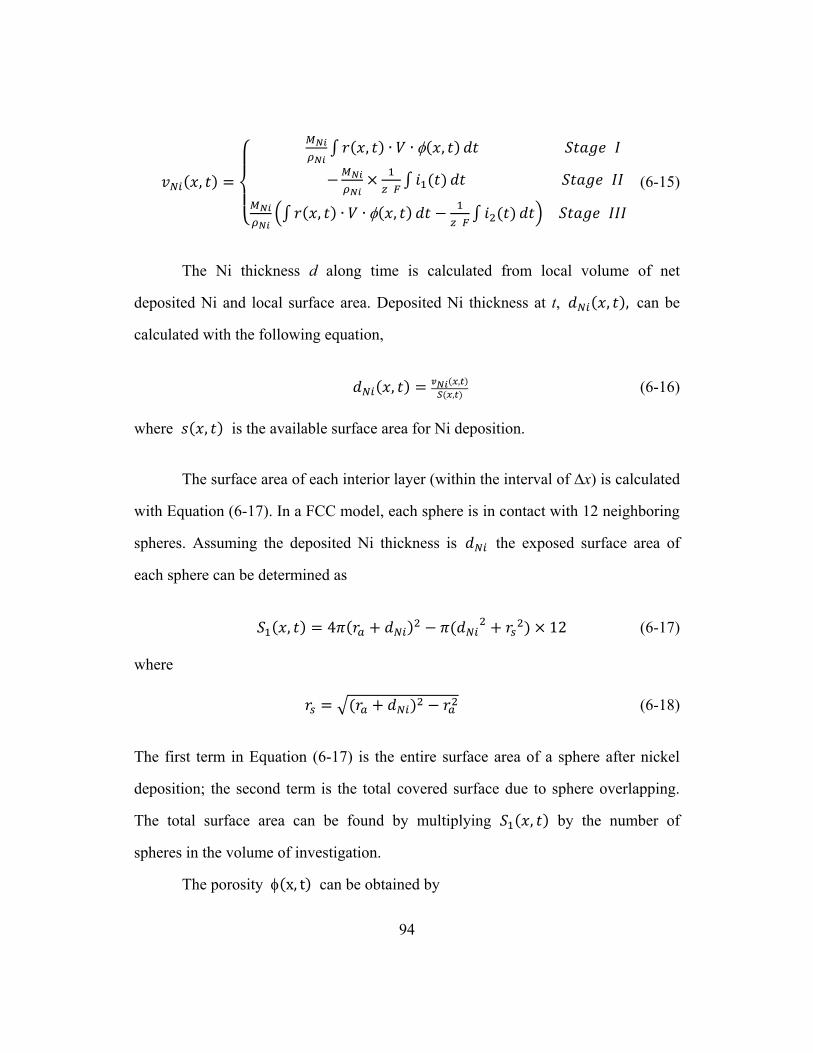
94
𝑣𝑁𝑖(𝑥, 𝑡) =
{
𝑀𝑁𝑖
𝜌𝑁𝑖∫ 𝑟(𝑥, 𝑡) ∙ 𝑉 ∙ (𝑥, 𝑡) 𝑑𝑡 𝑆𝑡𝑎𝑔𝑒 𝐼
−𝑀𝑁𝑖
𝜌𝑁𝑖×
1
𝑧 𝐹∫ 𝑖1(𝑡) 𝑑𝑡 𝑆𝑡𝑎𝑔𝑒 𝐼𝐼
𝑀𝑁𝑖
𝜌𝑁𝑖(∫ 𝑟(𝑥, 𝑡) ∙ 𝑉 ∙ (𝑥, 𝑡) 𝑑𝑡 −
1
𝑧 𝐹∫ 𝑖2(𝑡) 𝑑𝑡) 𝑆𝑡𝑎𝑔𝑒 𝐼𝐼𝐼
(6-15)
The Ni thickness d along time is calculated from local volume of net
deposited Ni and local surface area. Deposited Ni thickness at t, 𝑑𝑁𝑖(𝑥, 𝑡), can be
calculated with the following equation,
𝑑𝑁𝑖(𝑥, 𝑡) =𝑣𝑁𝑖(𝑥,𝑡)
𝑆(𝑥,𝑡) (6-16)
where 𝑠(𝑥, 𝑡) is the available surface area for Ni deposition.
The surface area of each interior layer (within the interval of ∆x) is calculated
with Equation (6-17). In a FCC model, each sphere is in contact with 12 neighboring
spheres. Assuming the deposited Ni thickness is 𝑑𝑁𝑖 the exposed surface area of
each sphere can be determined as
𝑆1(𝑥, 𝑡) = 4𝜋(𝑟𝑎 + 𝑑𝑁𝑖)2 − 𝜋(𝑑𝑁𝑖
2 + 𝑟𝑠2) × 12 (6-17)
where
𝑟𝑠 = √(𝑟𝑎 + 𝑑𝑁𝑖)2 − 𝑟𝑎
2 (6-18)
The first term in Equation (6-17) is the entire surface area of a sphere after nickel
deposition; the second term is the total covered surface due to sphere overlapping.
The total surface area can be found by multiplying 𝑆1(𝑥, 𝑡) by the number of
spheres in the volume of investigation.
The porosity (x, t) can be obtained by
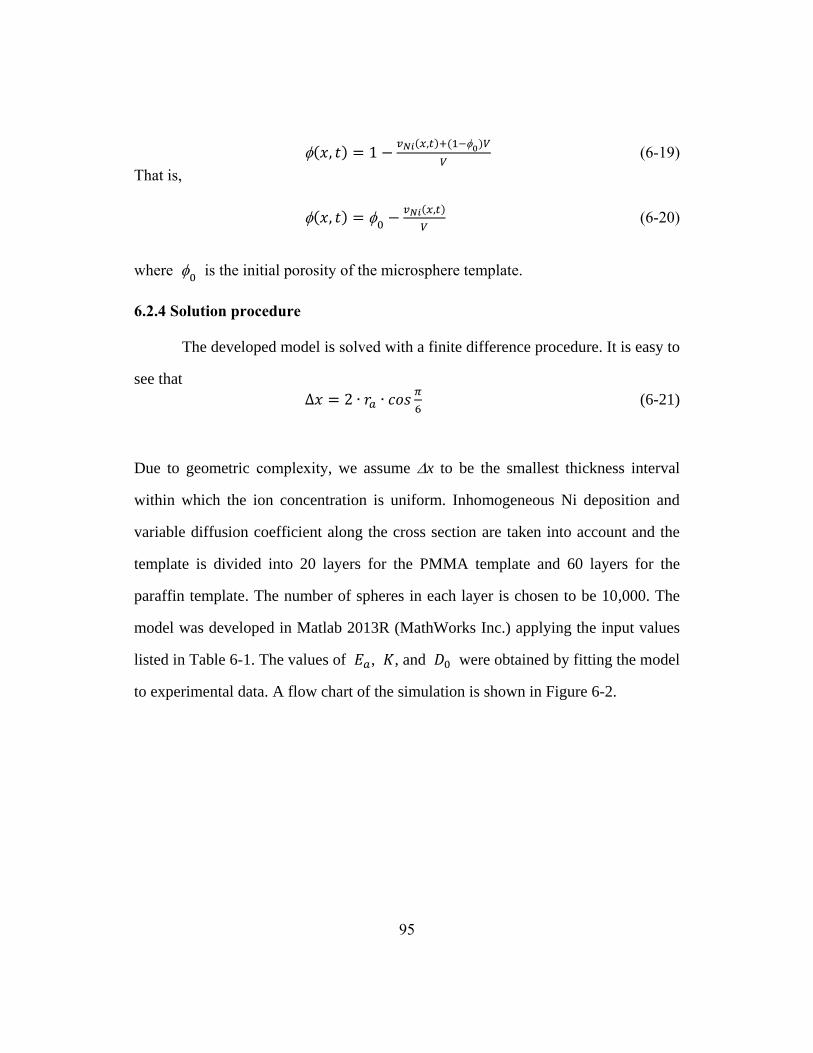
95
(𝑥, 𝑡) = 1 −𝑣𝑁𝑖(𝑥,𝑡)+(1−0)𝑉
𝑉 (6-19)
That is,
(𝑥, 𝑡) = 0−𝑣𝑁𝑖(𝑥,𝑡)
𝑉 (6-20)
where 0 is the initial porosity of the microsphere template.
6.2.4 Solution procedure
The developed model is solved with a finite difference procedure. It is easy to
see that
∆𝑥 = 2 ∙ 𝑟𝑎 ∙ 𝑐𝑜𝑠𝜋
6 (6-21)
Due to geometric complexity, we assume x to be the smallest thickness interval
within which the ion concentration is uniform. Inhomogeneous Ni deposition and
variable diffusion coefficient along the cross section are taken into account and the
template is divided into 20 layers for the PMMA template and 60 layers for the
paraffin template. The number of spheres in each layer is chosen to be 10,000. The
model was developed in Matlab 2013R (MathWorks Inc.) applying the input values
listed in Table 6-1. The values of 𝐸𝑎, 𝐾, and 𝐷0 were obtained by fitting the model
to experimental data. A flow chart of the simulation is shown in Figure 6-2.
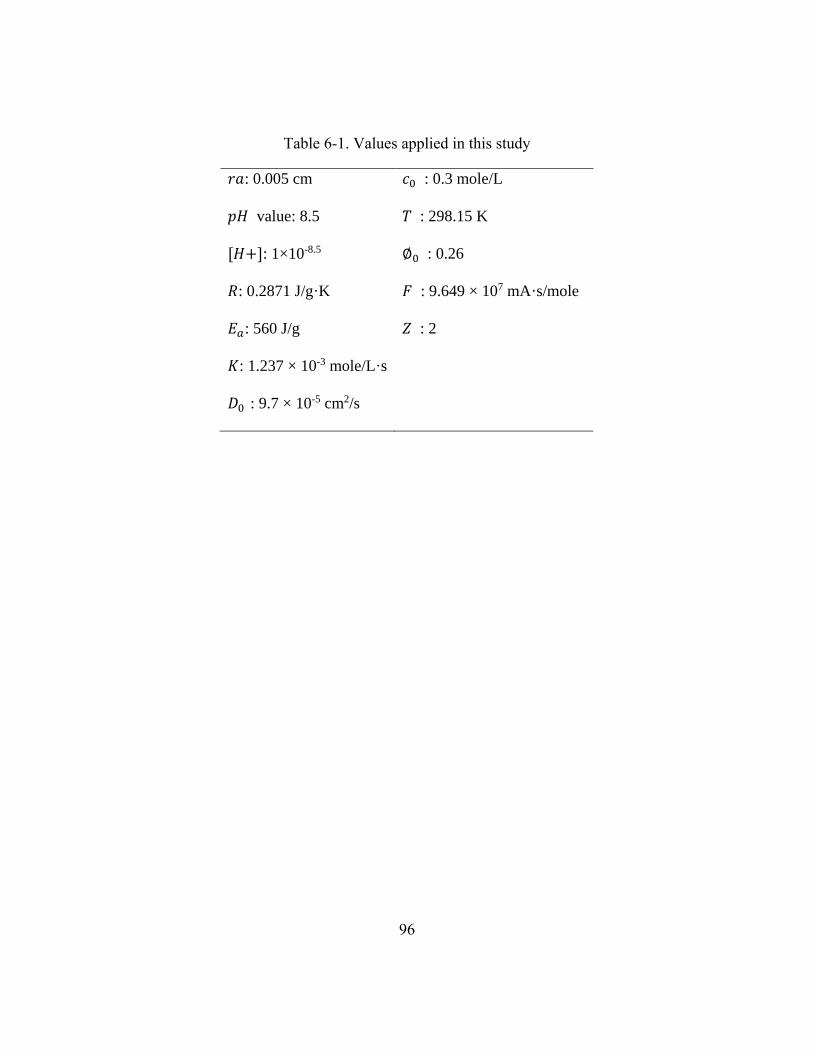
96
Table 6-1. Values applied in this study
𝑟𝑎: 0.005 cm
𝑝𝐻 value: 8.5
[𝐻+]: 1×10-8.5
𝑅: 0.2871 J/g·K
𝐸𝑎: 560 J/g
𝐾: 1.237 × 10⁻³ mole/L·s
𝐷0 : 9.7 × 10⁻⁵ cm2/s
𝑐0 : 0.3 mole/L
𝑇 : 298.15 K
∅0 : 0.26
𝐹 : 9.649 × 10⁷ mA·s/mole
𝑍 : 2
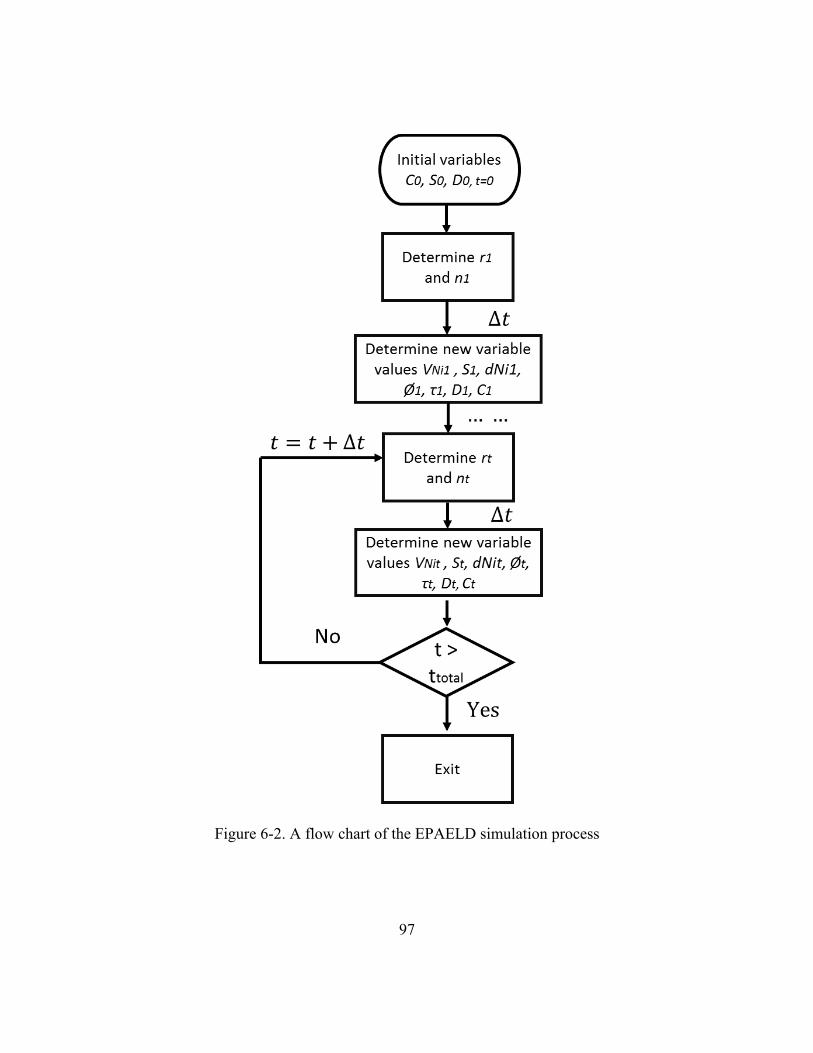
97
Figure 6-2. A flow chart of the EPAELD simulation process
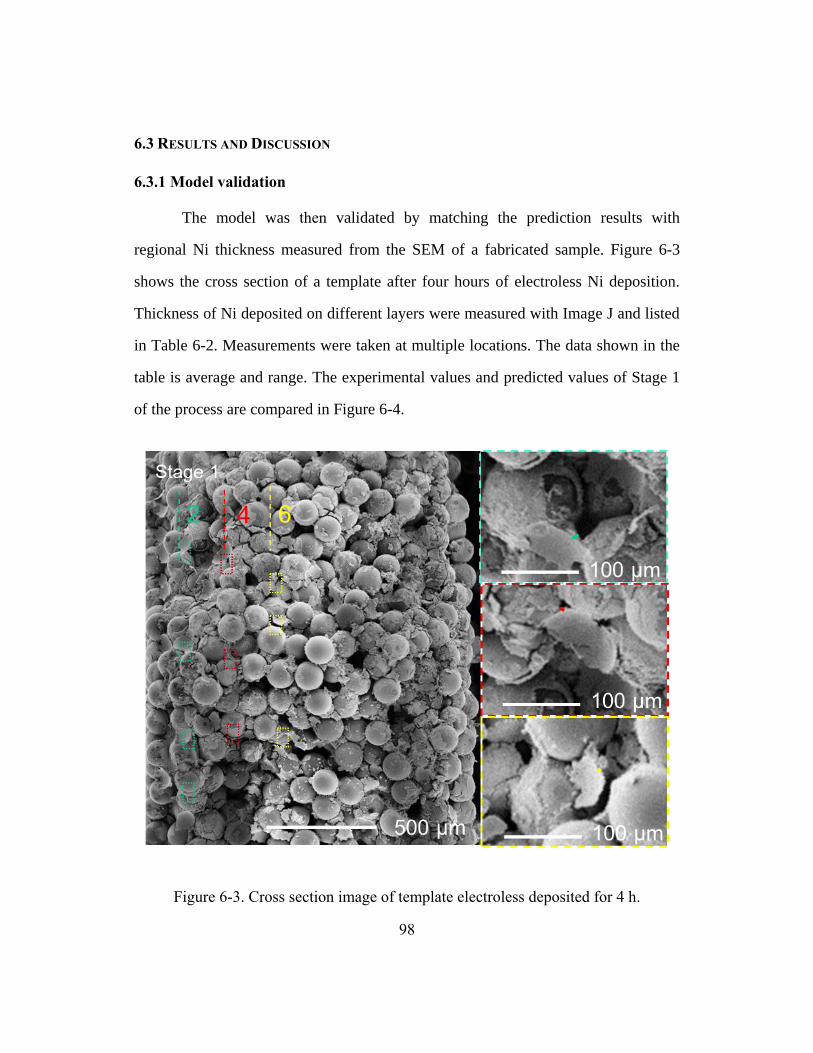
98
6.3 RESULTS AND DISCUSSION
6.3.1 Model validation
The model was then validated by matching the prediction results with
regional Ni thickness measured from the SEM of a fabricated sample. Figure 6-3
shows the cross section of a template after four hours of electroless Ni deposition.
Thickness of Ni deposited on different layers were measured with Image J and listed
in Table 6-2. Measurements were taken at multiple locations. The data shown in the
table is average and range. The experimental values and predicted values of Stage 1
of the process are compared in Figure 6-4.
Figure 6-3. Cross section image of template electroless deposited for 4 h.
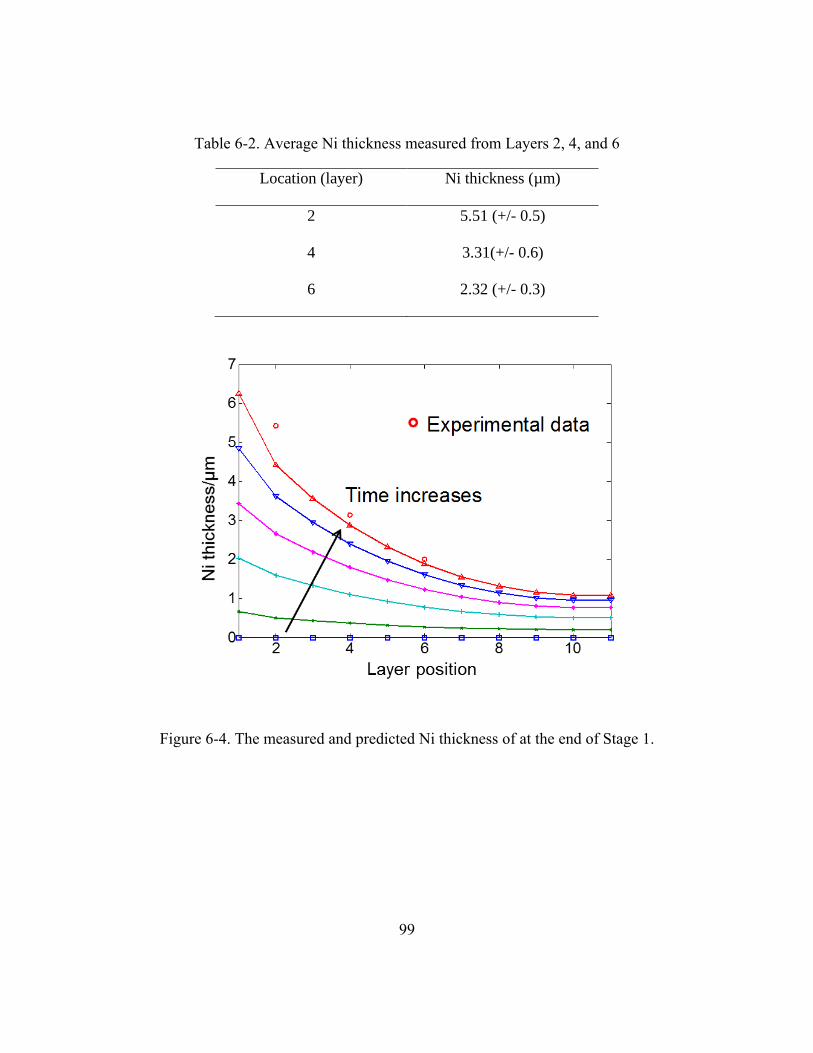
99
Table 6-2. Average Ni thickness measured from Layers 2, 4, and 6
Location (layer) Ni thickness (µm)
2 5.51 (+/- 0.5)
4 3.31(+/- 0.6)
6 2.32 (+/- 0.3)
Figure 6-4. The measured and predicted Ni thickness of at the end of Stage 1.
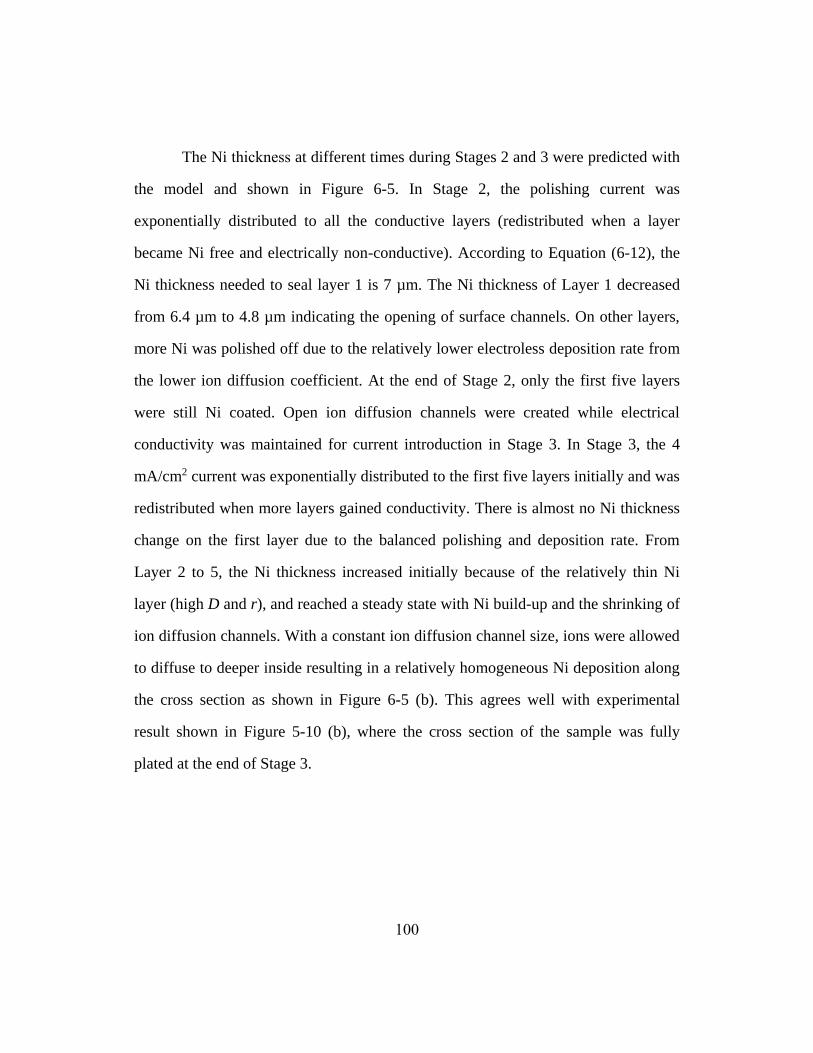
100
The Ni thickness at different times during Stages 2 and 3 were predicted with
the model and shown in Figure 6-5. In Stage 2, the polishing current was
exponentially distributed to all the conductive layers (redistributed when a layer
became Ni free and electrically non-conductive). According to Equation (6-12), the
Ni thickness needed to seal layer 1 is 7 µm. The Ni thickness of Layer 1 decreased
from 6.4 µm to 4.8 µm indicating the opening of surface channels. On other layers,
more Ni was polished off due to the relatively lower electroless deposition rate from
the lower ion diffusion coefficient. At the end of Stage 2, only the first five layers
were still Ni coated. Open ion diffusion channels were created while electrical
conductivity was maintained for current introduction in Stage 3. In Stage 3, the 4
mA/cm2 current was exponentially distributed to the first five layers initially and was
redistributed when more layers gained conductivity. There is almost no Ni thickness
change on the first layer due to the balanced polishing and deposition rate. From
Layer 2 to 5, the Ni thickness increased initially because of the relatively thin Ni
layer (high D and r), and reached a steady state with Ni build-up and the shrinking of
ion diffusion channels. With a constant ion diffusion channel size, ions were allowed
to diffuse to deeper inside resulting in a relatively homogeneous Ni deposition along
the cross section as shown in Figure 6-5 (b). This agrees well with experimental
result shown in Figure 5-10 (b), where the cross section of the sample was fully
plated at the end of Stage 3.
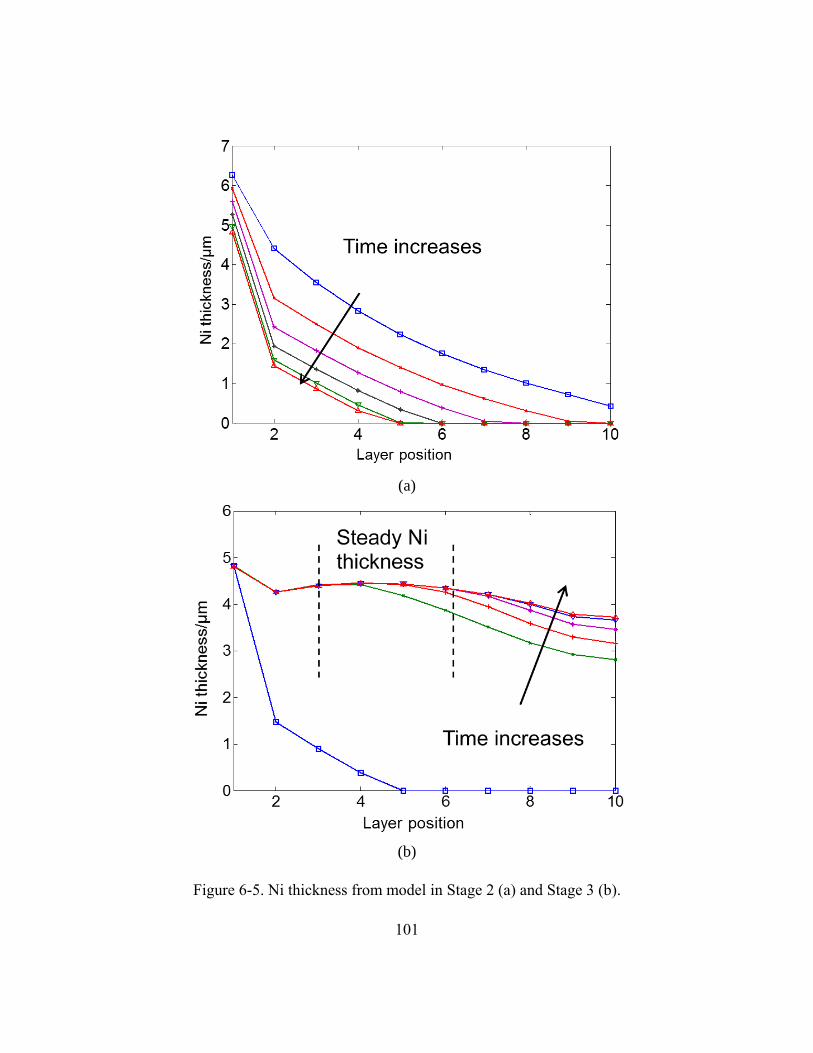
101
(a)
(b)
Figure 6-5. Ni thickness from model in Stage 2 (a) and Stage 3 (b).
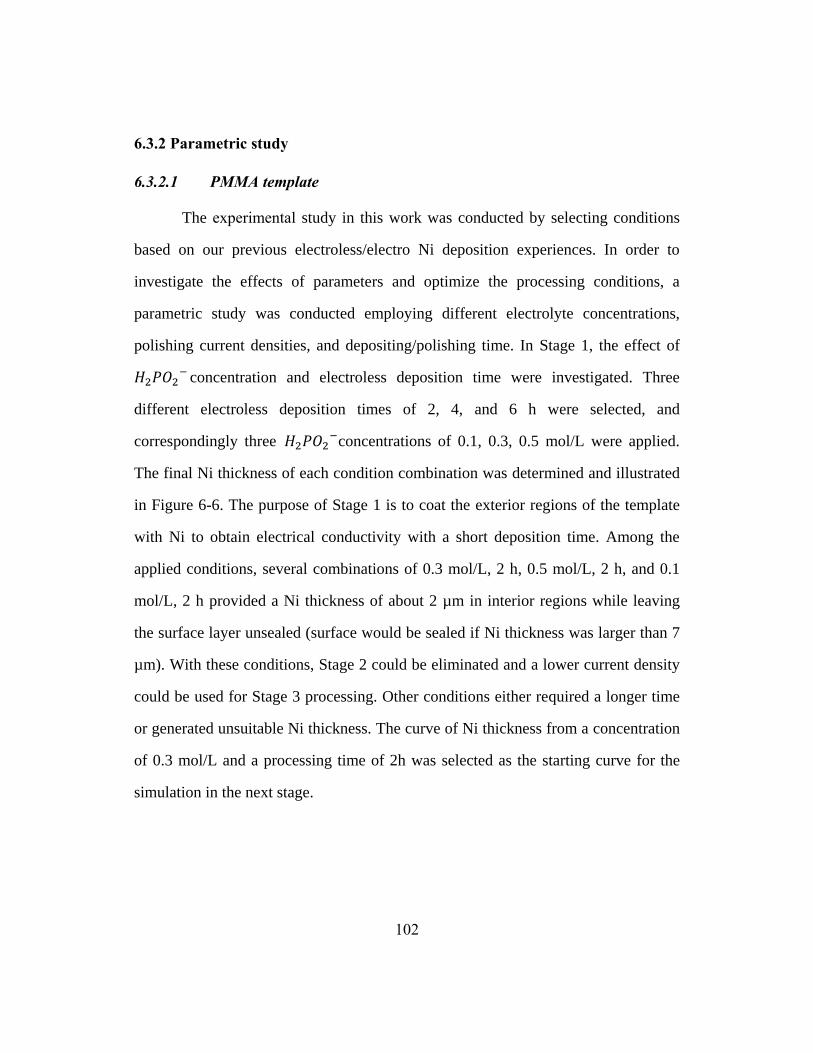
102
6.3.2 Parametric study
6.3.2.1 PMMA template
The experimental study in this work was conducted by selecting conditions
based on our previous electroless/electro Ni deposition experiences. In order to
investigate the effects of parameters and optimize the processing conditions, a
parametric study was conducted employing different electrolyte concentrations,
polishing current densities, and depositing/polishing time. In Stage 1, the effect of
𝐻2𝑃𝑂2− concentration and electroless deposition time were investigated. Three
different electroless deposition times of 2, 4, and 6 h were selected, and
correspondingly three 𝐻2𝑃𝑂2−concentrations of 0.1, 0.3, 0.5 mol/L were applied.
The final Ni thickness of each condition combination was determined and illustrated
in Figure 6-6. The purpose of Stage 1 is to coat the exterior regions of the template
with Ni to obtain electrical conductivity with a short deposition time. Among the
applied conditions, several combinations of 0.3 mol/L, 2 h, 0.5 mol/L, 2 h, and 0.1
mol/L, 2 h provided a Ni thickness of about 2 µm in interior regions while leaving
the surface layer unsealed (surface would be sealed if Ni thickness was larger than 7
µm). With these conditions, Stage 2 could be eliminated and a lower current density
could be used for Stage 3 processing. Other conditions either required a longer time
or generated unsuitable Ni thickness. The curve of Ni thickness from a concentration
of 0.3 mol/L and a processing time of 2h was selected as the starting curve for the
simulation in the next stage.

103
Figure 6-6. Ni thickness from different parametric combinations in Stage 1 (100 µm
sphere)
In Stage 3, 𝐻2𝑃𝑂2− concentration was kept at 0.3 mol/L. The effects of
current density and depositing/polishing time were investigated. Four different
current densities of 1, 3, 4, and 6 mA/cm2 (2 cm2) were selected; three polishing
times of 10, 15, and 20 h were employed. The final Ni thickness of each condition
combination was determined and shown in Figure 6-7. It can be found that at a fixed
polishing current density, the selected polishing time has no significant effect on Ni
thickness distribution along the cross section of the template after 15 h of deposition.
In the first 15 h, Ni thickness increases because the deposition rate is higher than
polishing rate. After 15 h, the deposition rate reaches a balance with the polishing
104
rate due to the declining 𝐻2𝑃𝑂2− diffusion caused by the reduced channel size
between spheres. Current density has a significant effect on Ni thickness and
distribution. When current density is lower than 4 mA/cm2, Ni accumulates on the
surface layers faster than what can be polished away, which results in a low 𝐻2𝑃𝑂2−
concentration and thin Ni layers in the interior region. When 4 mA/cm2 is applied, Ni
thickness on near-surface layers is maintained at 4.5 µm, providing a constant
𝐻2𝑃𝑂2− diffusion to interior regions and depositing Ni evenly through the cross
section. When 6 mA/cm2 was applied, the Ni thickness was reduced from 2 µm to 1
µm after 10 h because the polishing rate exceeded the Ni deposition rate. While a
detailed study will be needed to determine the optimal polishing current density, for
simplicity, 4 mA/cm2 is used in this study for the PMMA template.
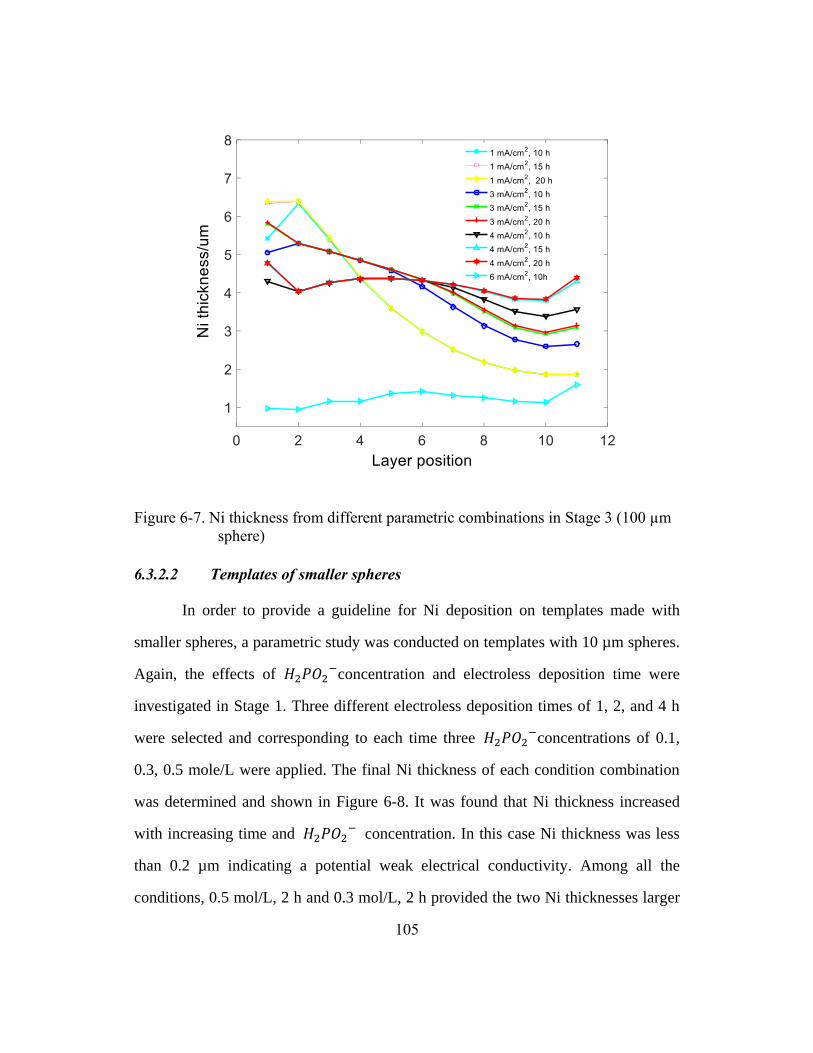
105
Figure 6-7. Ni thickness from different parametric combinations in Stage 3 (100 µm
sphere)
6.3.2.2 Templates of smaller spheres
In order to provide a guideline for Ni deposition on templates made with
smaller spheres, a parametric study was conducted on templates with 10 µm spheres.
Again, the effects of 𝐻2𝑃𝑂2−concentration and electroless deposition time were
investigated in Stage 1. Three different electroless deposition times of 1, 2, and 4 h
were selected and corresponding to each time three 𝐻2𝑃𝑂2−concentrations of 0.1,
0.3, 0.5 mole/L were applied. The final Ni thickness of each condition combination
was determined and shown in Figure 6-8. It was found that Ni thickness increased
with increasing time and 𝐻2𝑃𝑂2− concentration. In this case Ni thickness was less
than 0.2 µm indicating a potential weak electrical conductivity. Among all the
conditions, 0.5 mol/L, 2 h and 0.3 mol/L, 2 h provided the two Ni thicknesses larger
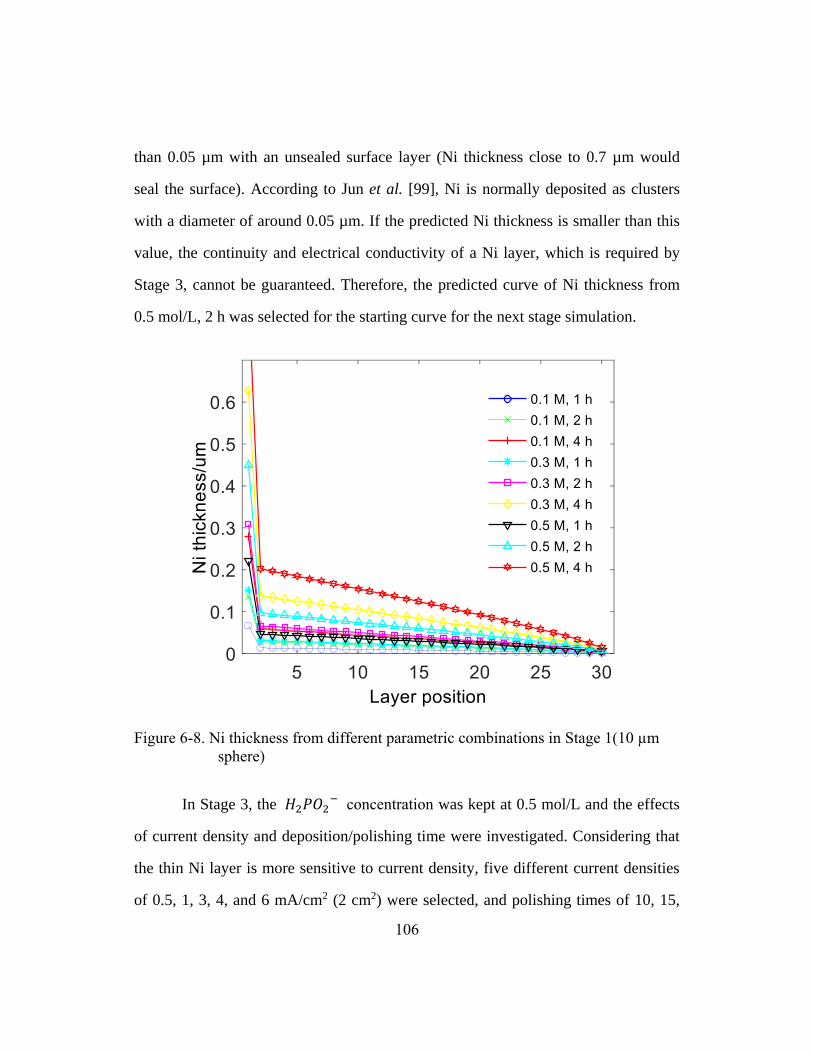
106
than 0.05 µm with an unsealed surface layer (Ni thickness close to 0.7 µm would
seal the surface). According to Jun et al. [99], Ni is normally deposited as clusters
with a diameter of around 0.05 µm. If the predicted Ni thickness is smaller than this
value, the continuity and electrical conductivity of a Ni layer, which is required by
Stage 3, cannot be guaranteed. Therefore, the predicted curve of Ni thickness from
0.5 mol/L, 2 h was selected for the starting curve for the next stage simulation.
Figure 6-8. Ni thickness from different parametric combinations in Stage 1(10 µm
sphere)
In Stage 3, the 𝐻2𝑃𝑂2− concentration was kept at 0.5 mol/L and the effects
of current density and deposition/polishing time were investigated. Considering that
the thin Ni layer is more sensitive to current density, five different current densities
of 0.5, 1, 3, 4, and 6 mA/cm2 (2 cm2) were selected, and polishing times of 10, 15,
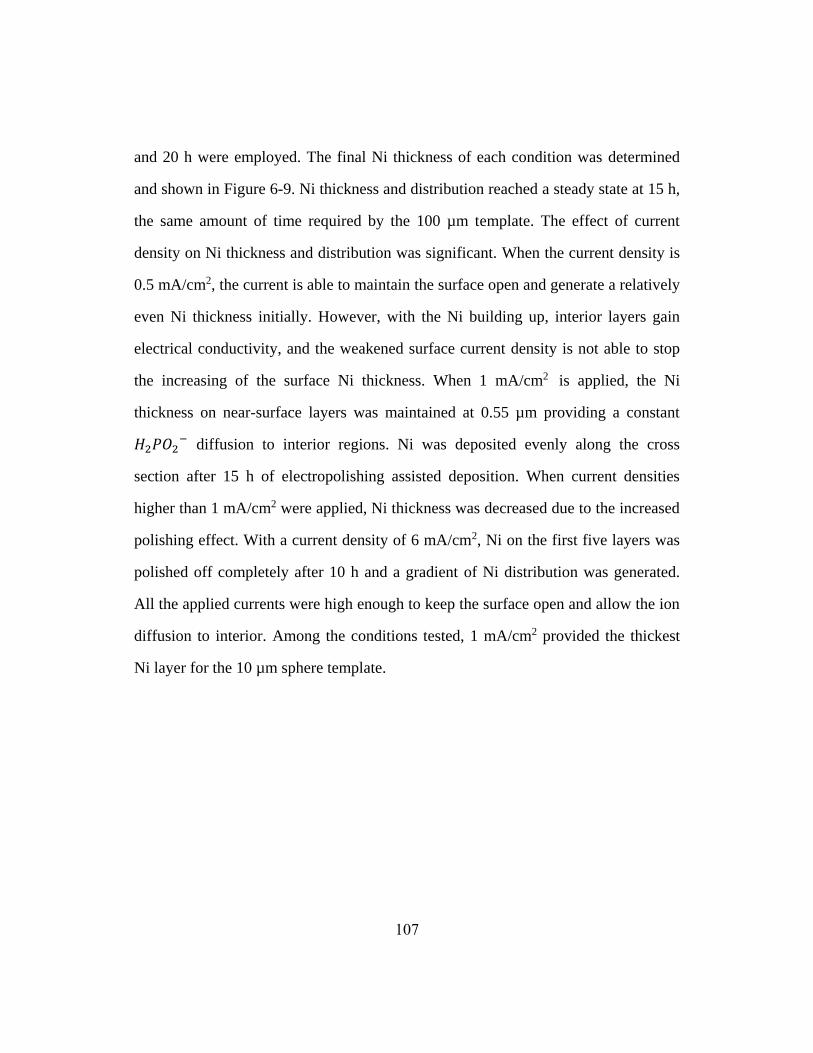
107
and 20 h were employed. The final Ni thickness of each condition was determined
and shown in Figure 6-9. Ni thickness and distribution reached a steady state at 15 h,
the same amount of time required by the 100 µm template. The effect of current
density on Ni thickness and distribution was significant. When the current density is
0.5 mA/cm2, the current is able to maintain the surface open and generate a relatively
even Ni thickness initially. However, with the Ni building up, interior layers gain
electrical conductivity, and the weakened surface current density is not able to stop
the increasing of the surface Ni thickness. When 1 mA/cm2 is applied, the Ni
thickness on near-surface layers was maintained at 0.55 µm providing a constant
𝐻2𝑃𝑂2− diffusion to interior regions. Ni was deposited evenly along the cross
section after 15 h of electropolishing assisted deposition. When current densities
higher than 1 mA/cm2 were applied, Ni thickness was decreased due to the increased
polishing effect. With a current density of 6 mA/cm2, Ni on the first five layers was
polished off completely after 10 h and a gradient of Ni distribution was generated.
All the applied currents were high enough to keep the surface open and allow the ion
diffusion to interior. Among the conditions tested, 1 mA/cm2 provided the thickest
Ni layer for the 10 µm sphere template.
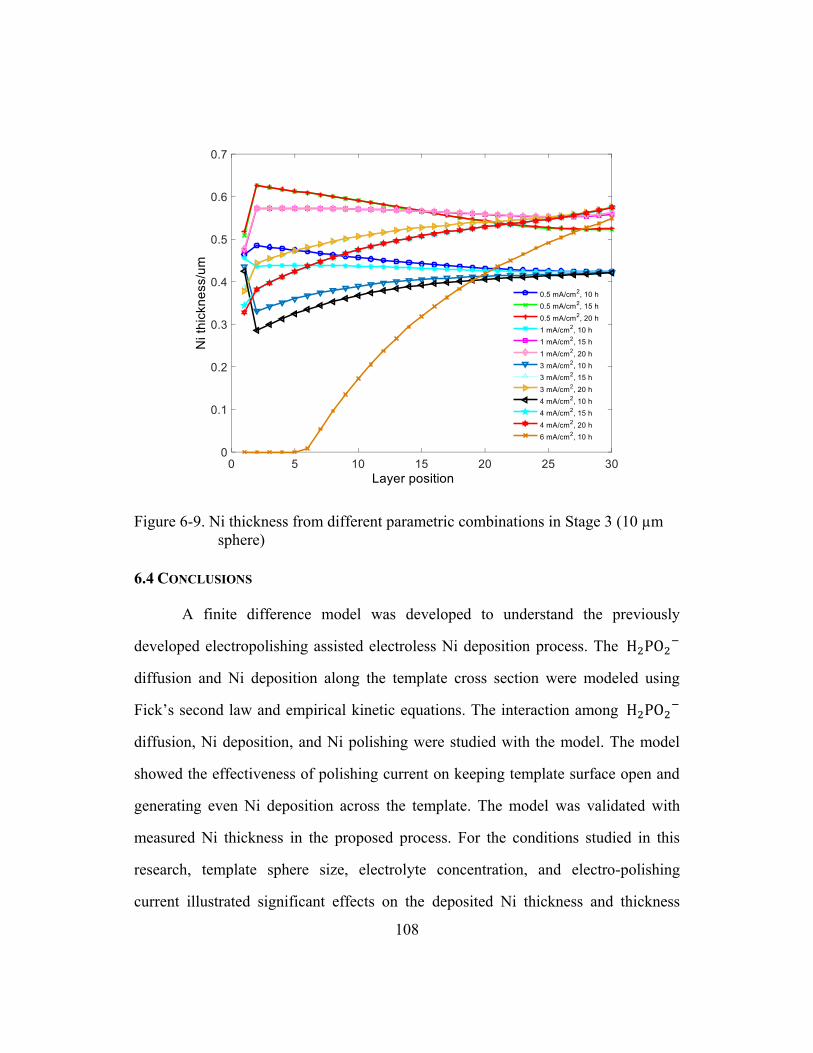
108
Figure 6-9. Ni thickness from different parametric combinations in Stage 3 (10 µm
sphere)
6.4 CONCLUSIONS
A finite difference model was developed to understand the previously
developed electropolishing assisted electroless Ni deposition process. The H2PO2−
diffusion and Ni deposition along the template cross section were modeled using
Fick’s second law and empirical kinetic equations. The interaction among H2PO2−
diffusion, Ni deposition, and Ni polishing were studied with the model. The model
showed the effectiveness of polishing current on keeping template surface open and
generating even Ni deposition across the template. The model was validated with
measured Ni thickness in the proposed process. For the conditions studied in this
research, template sphere size, electrolyte concentration, and electro-polishing
current illustrated significant effects on the deposited Ni thickness and thickness
109
distribution. When the sphere size in a template became smaller, the electroless
deposited Ni thickness was thinner than that deposited under the same electrolyte
concentration and depositing time (2h and 4h). Smaller sphere size also resulted in a
bigger difference between Ni thicknesses on the first layer and second layer. In the
EPAELD process, a narrow operating range of conditions is available for templates
with smaller spheres owing to the requirement of maintaining electrical conductivity
of the template. A proper electrolyte concentration was needed in both 10 µm and
100 µm sphere templates to obtain a balance between Ni thickness and electroless
depositing time in Stage 1. A high electrolyte concentration would result in the close
of surficial channels in a short time while interior was not deposited. As a contrary, a
low electrolyte concentration would result in a long depositing time and a thin Ni
thickness leading to low electrical conductivity. 0.3 mol/L and 0.5 mol/L were found
to be suitable concentrations for 100 µm sphere template and 10 µm sphere template,
respectively. Both concentrations resulted in the proper Ni thickness (100 µm
template: ion diffusivity is a priority considering the relatively thicker Ni layer; 10
µm template: electrical conductivity needs to be secured considering the relatively
thin Ni layer) while keeping surficial channels open at a moderate electroless
depositing time of 2h. Regarding the electro-polishing current density, a high value
would result in the polishing off of surficial Ni layer, and so as to termination of the
EPAELD process; while a low value would not be capable of keeping the surficial
channels open to generate an even interior Ni deposition. 4 mA/cm2 and 1 mA/cm2
provided the evenest Ni thickness distribution on 100 µm and 10 µm templates
respectively.
110
Chapter 7. Microcellular Three Dimensional Graphene Foams
7.1 INTRODUCTION
Three-dimensional (3D) graphene foams are attracting significant interests
due to their superior electrical and thermal properties and potential applications in
high performance lithium-ion batteries and super capacitors [3, 15, 42, 43, 100, 101].
In these energy storage applications, the graphene foam is used as an electrode with
active materials infiltrated in the pores. Comparing to conventional electrode
designs, this configuration provides a much larger contact surface and shorter charge
transfer distance between the active material and current collector. As a result, 3D
graphene foam-based batteries and super capacitors could have an extremely high
load capacity, as well as fast charging and discharging rates [15, 102, 103].
Recent studies have demonstrated 3D graphene foams with pore sizes on
different length scales. With commercially available Ni foams as a template, a
chemical vapor deposition (CVD) method has been used to fabricate 3D graphene
foams with a pore size on the level of several hundreds of micrometers [15-17]. Such
a large pore size leads to a relatively low specific surface area and long charge
transfer path, resulting in a slow charging and discharging rate for the energy storage
device. Furthermore, large pore-sized graphene foams tend to be brittle and can
cause structural problems in subsequent handling. Graphene foams of nanometer
pore sizes were fabricated with a lithographically-defined polymer foam as a
template [18]. Amorphous carbon foam was first obtained by patterning a photoresist
polymer structure followed by a pyrolysis step. The amorphous carbon foam was
then sputter-coated with Ni and annealed to obtain a graphene layer on the pore walls
W. Jiang, H. Xin, W. Li, Microcellular 3D graphene foam via chemical vapor deposition of electroless plated nickel foam
templates, Materials Letter, Volume 162, 1 January 2016, Pages 105–109.
W. Jiang: Design and implement involved work, construct manuscript
H. Xin: Conduct partial characterization and edit the constructed manuscript
W. Li: Direct and supervise the work as supervisor
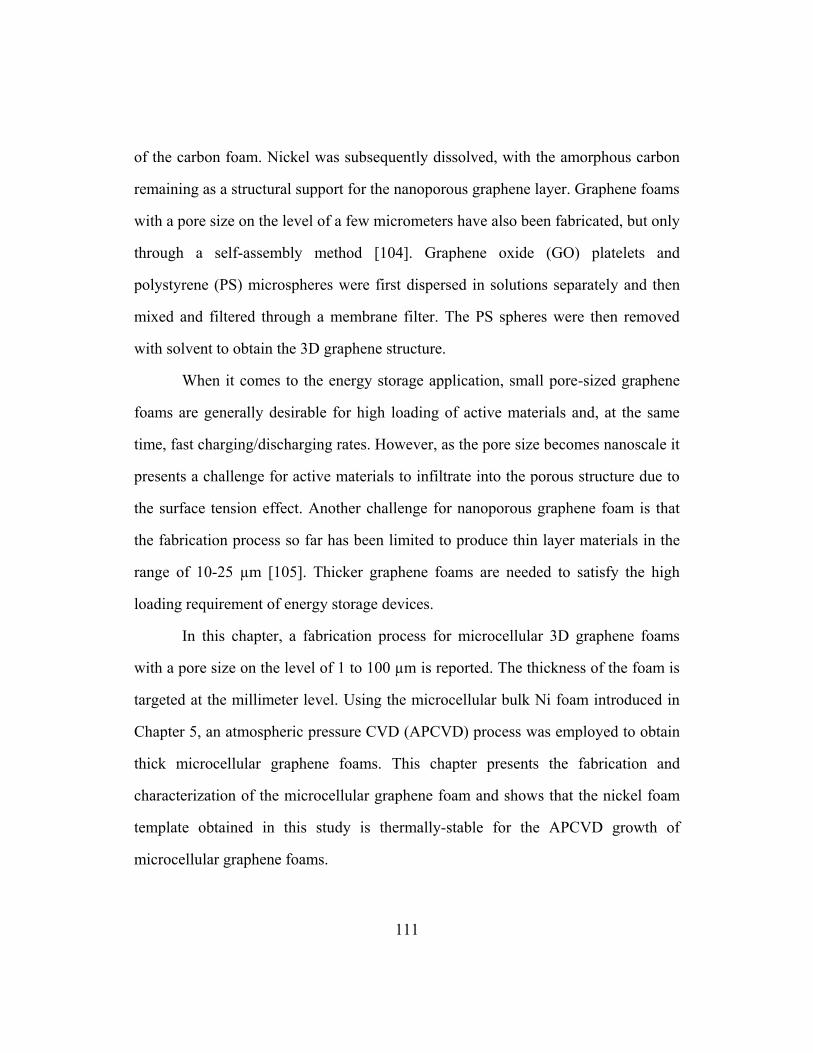
111
of the carbon foam. Nickel was subsequently dissolved, with the amorphous carbon
remaining as a structural support for the nanoporous graphene layer. Graphene foams
with a pore size on the level of a few micrometers have also been fabricated, but only
through a self-assembly method [104]. Graphene oxide (GO) platelets and
polystyrene (PS) microspheres were first dispersed in solutions separately and then
mixed and filtered through a membrane filter. The PS spheres were then removed
with solvent to obtain the 3D graphene structure.
When it comes to the energy storage application, small pore-sized graphene
foams are generally desirable for high loading of active materials and, at the same
time, fast charging/discharging rates. However, as the pore size becomes nanoscale it
presents a challenge for active materials to infiltrate into the porous structure due to
the surface tension effect. Another challenge for nanoporous graphene foam is that
the fabrication process so far has been limited to produce thin layer materials in the
range of 10-25 µm [105]. Thicker graphene foams are needed to satisfy the high
loading requirement of energy storage devices.
In this chapter, a fabrication process for microcellular 3D graphene foams
with a pore size on the level of 1 to 100 µm is reported. The thickness of the foam is
targeted at the millimeter level. Using the microcellular bulk Ni foam introduced in
Chapter 5, an atmospheric pressure CVD (APCVD) process was employed to obtain
thick microcellular graphene foams. This chapter presents the fabrication and
characterization of the microcellular graphene foam and shows that the nickel foam
template obtained in this study is thermally-stable for the APCVD growth of
microcellular graphene foams.
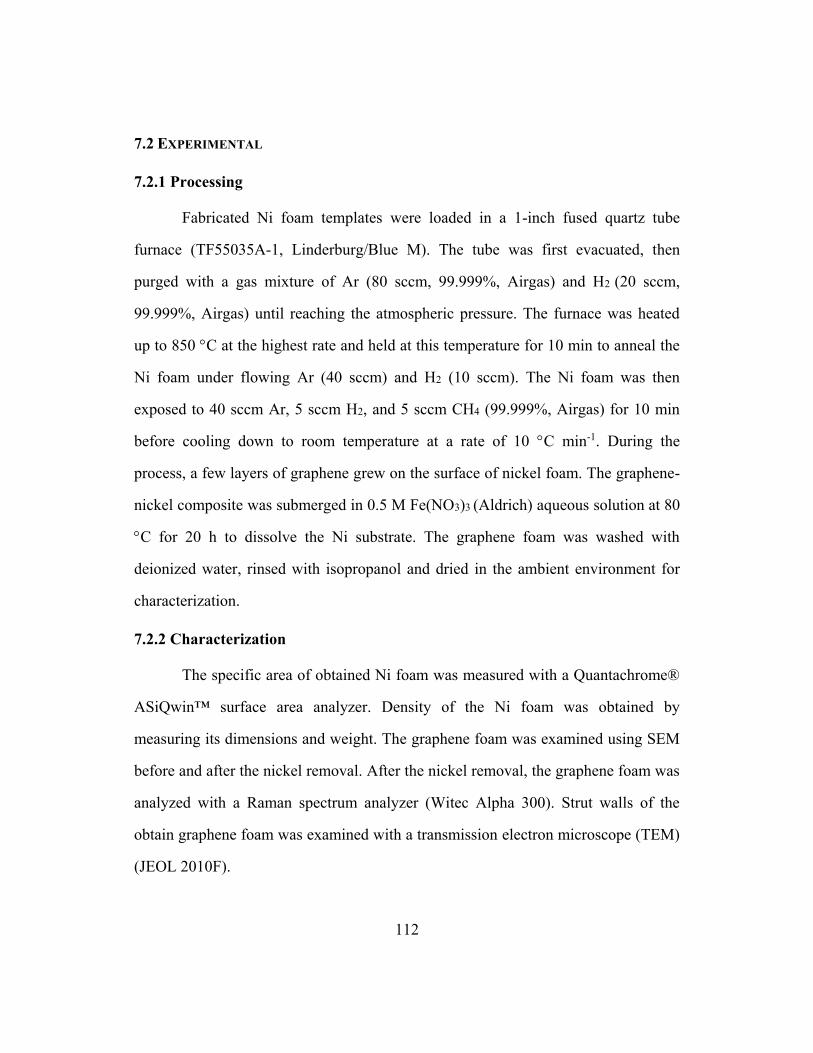
112
7.2 EXPERIMENTAL
7.2.1 Processing
Fabricated Ni foam templates were loaded in a 1-inch fused quartz tube
furnace (TF55035A-1, Linderburg/Blue M). The tube was first evacuated, then
purged with a gas mixture of Ar (80 sccm, 99.999%, Airgas) and H2 (20 sccm,
99.999%, Airgas) until reaching the atmospheric pressure. The furnace was heated
up to 850 C at the highest rate and held at this temperature for 10 min to anneal the
Ni foam under flowing Ar (40 sccm) and H2 (10 sccm). The Ni foam was then
exposed to 40 sccm Ar, 5 sccm H2, and 5 sccm CH4 (99.999%, Airgas) for 10 min
before cooling down to room temperature at a rate of 10 C min-1. During the
process, a few layers of graphene grew on the surface of nickel foam. The graphene-
nickel composite was submerged in 0.5 M Fe(NO3)3 (Aldrich) aqueous solution at 80
C for 20 h to dissolve the Ni substrate. The graphene foam was washed with
deionized water, rinsed with isopropanol and dried in the ambient environment for
characterization.
7.2.2 Characterization
The specific area of obtained Ni foam was measured with a Quantachrome®
ASiQwin™ surface area analyzer. Density of the Ni foam was obtained by
measuring its dimensions and weight. The graphene foam was examined using SEM
before and after the nickel removal. After the nickel removal, the graphene foam was
analyzed with a Raman spectrum analyzer (Witec Alpha 300). Strut walls of the
obtain graphene foam was examined with a transmission electron microscope (TEM)
(JEOL 2010F).
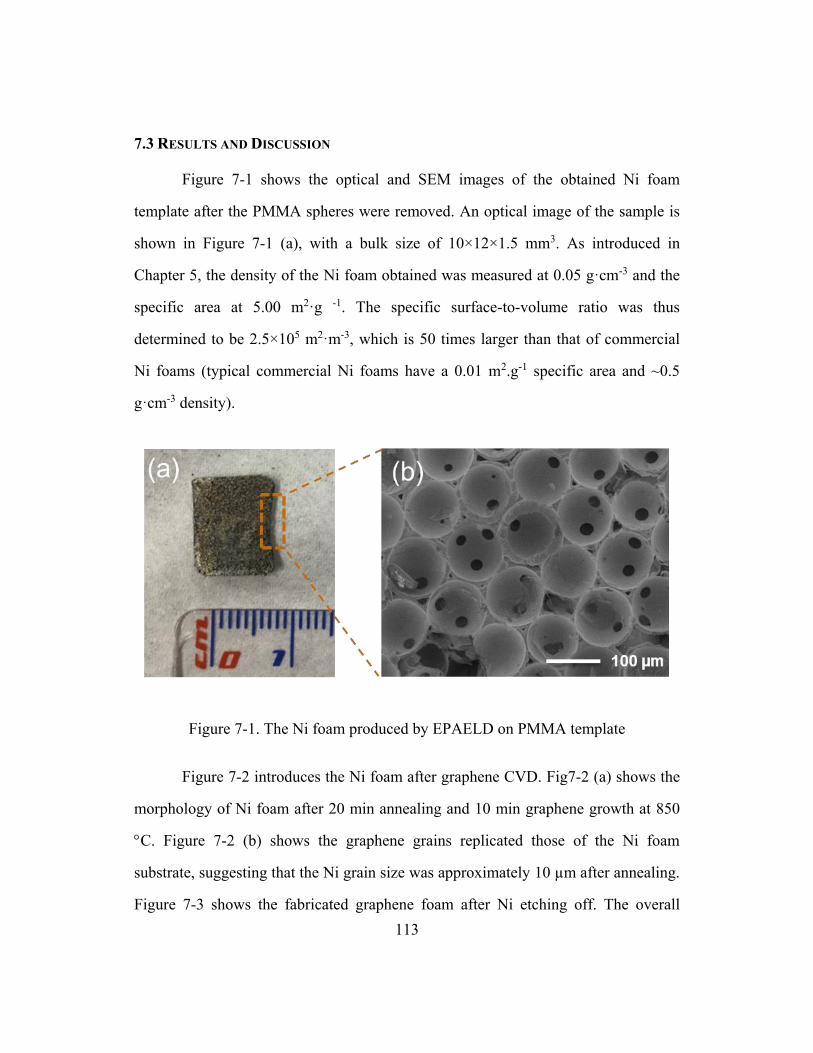
113
7.3 RESULTS AND DISCUSSION
Figure 7-1 shows the optical and SEM images of the obtained Ni foam
template after the PMMA spheres were removed. An optical image of the sample is
shown in Figure 7-1 (a), with a bulk size of 10×12×1.5 mm3. As introduced in
Chapter 5, the density of the Ni foam obtained was measured at 0.05 g·cm-3 and the
specific area at 5.00 m2·g -1. The specific surface-to-volume ratio was thus
determined to be 2.5×10⁵ m2·m-3, which is 50 times larger than that of commercial
Ni foams (typical commercial Ni foams have a 0.01 m2.g-1 specific area and ~0.5
g·cm-3 density).
Figure 7-1. The Ni foam produced by EPAELD on PMMA template
Figure 7-2 introduces the Ni foam after graphene CVD. Fig7-2 (a) shows the
morphology of Ni foam after 20 min annealing and 10 min graphene growth at 850
C. Figure 7-2 (b) shows the graphene grains replicated those of the Ni foam
substrate, suggesting that the Ni grain size was approximately 10 µm after annealing.
Figure 7-3 shows the fabricated graphene foam after Ni etching off. The overall
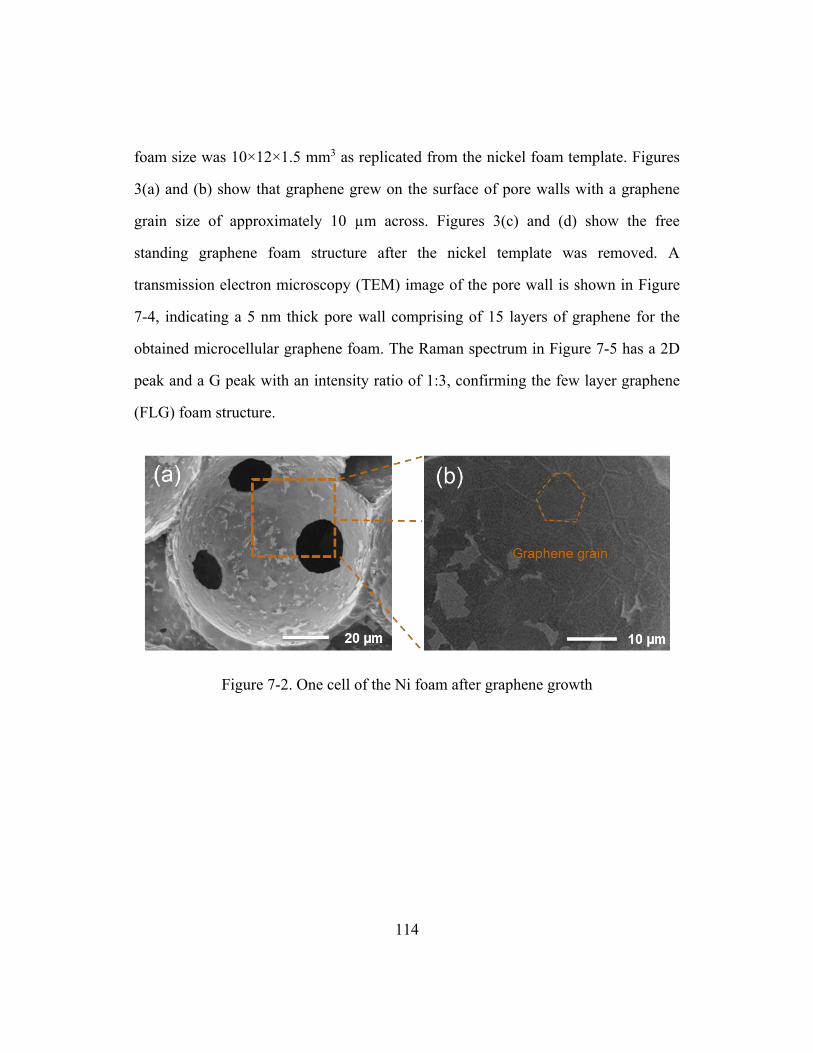
114
foam size was 10×12×1.5 mm3 as replicated from the nickel foam template. Figures
3(a) and (b) show that graphene grew on the surface of pore walls with a graphene
grain size of approximately 10 µm across. Figures 3(c) and (d) show the free
standing graphene foam structure after the nickel template was removed. A
transmission electron microscopy (TEM) image of the pore wall is shown in Figure
7-4, indicating a 5 nm thick pore wall comprising of 15 layers of graphene for the
obtained microcellular graphene foam. The Raman spectrum in Figure 7-5 has a 2D
peak and a G peak with an intensity ratio of 1:3, confirming the few layer graphene
(FLG) foam structure.
Figure 7-2. One cell of the Ni foam after graphene growth
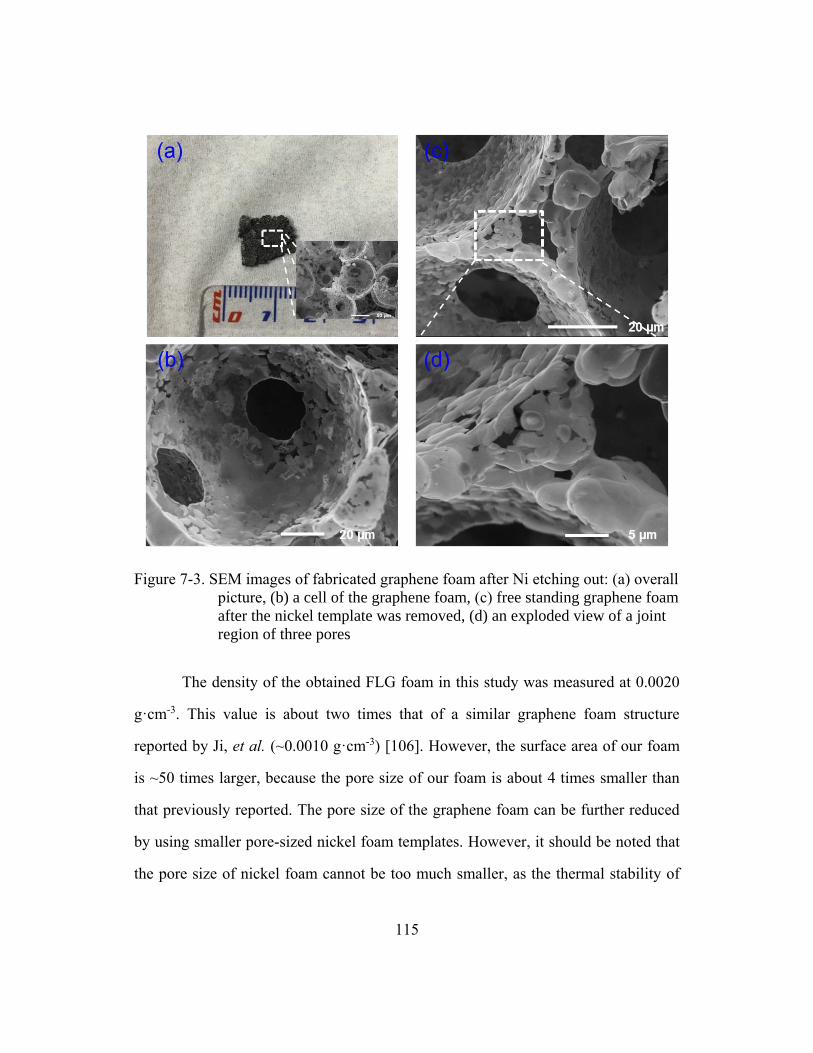
115
Figure 7-3. SEM images of fabricated graphene foam after Ni etching out: (a) overall
picture, (b) a cell of the graphene foam, (c) free standing graphene foam
after the nickel template was removed, (d) an exploded view of a joint
region of three pores
The density of the obtained FLG foam in this study was measured at 0.0020
g·cm-3. This value is about two times that of a similar graphene foam structure
reported by Ji, et al. (~0.0010 g·cm-3) [106]. However, the surface area of our foam
is ~50 times larger, because the pore size of our foam is about 4 times smaller than
that previously reported. The pore size of the graphene foam can be further reduced
by using smaller pore-sized nickel foam templates. However, it should be noted that
the pore size of nickel foam cannot be too much smaller, as the thermal stability of

116
smaller pore-sized nickel foams could prevent the formation of the cellular porous
structure of graphene foams in the CVD graphene growth process.
Figure 7-4. TEM image showing the thickness and number of layers of graphene
strut wall
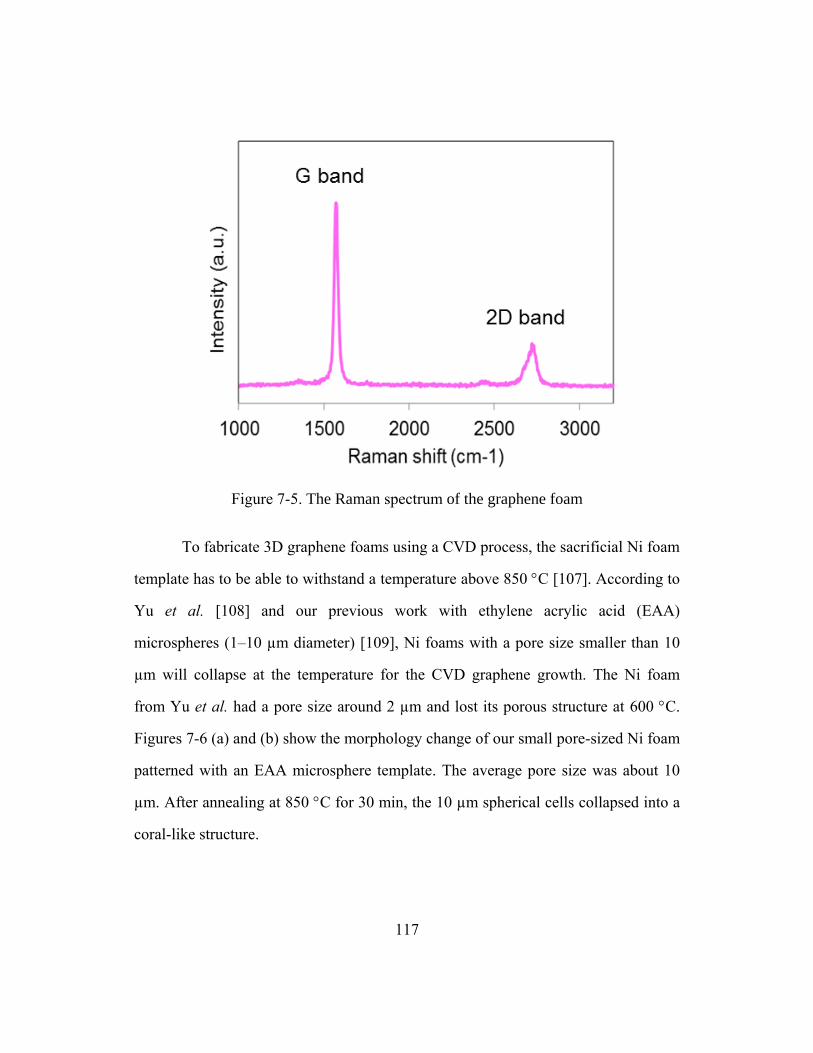
117
Figure 7-5. The Raman spectrum of the graphene foam
To fabricate 3D graphene foams using a CVD process, the sacrificial Ni foam
template has to be able to withstand a temperature above 850 C [107]. According to
Yu et al. [108] and our previous work with ethylene acrylic acid (EAA)
microspheres (1‒10 µm diameter) [109], Ni foams with a pore size smaller than 10
µm will collapse at the temperature for the CVD graphene growth. The Ni foam
from Yu et al. had a pore size around 2 µm and lost its porous structure at 600 C.
Figures 7-6 (a) and (b) show the morphology change of our small pore-sized Ni foam
patterned with an EAA microsphere template. The average pore size was about 10
µm. After annealing at 850 C for 30 min, the 10 µm spherical cells collapsed into a
coral-like structure.
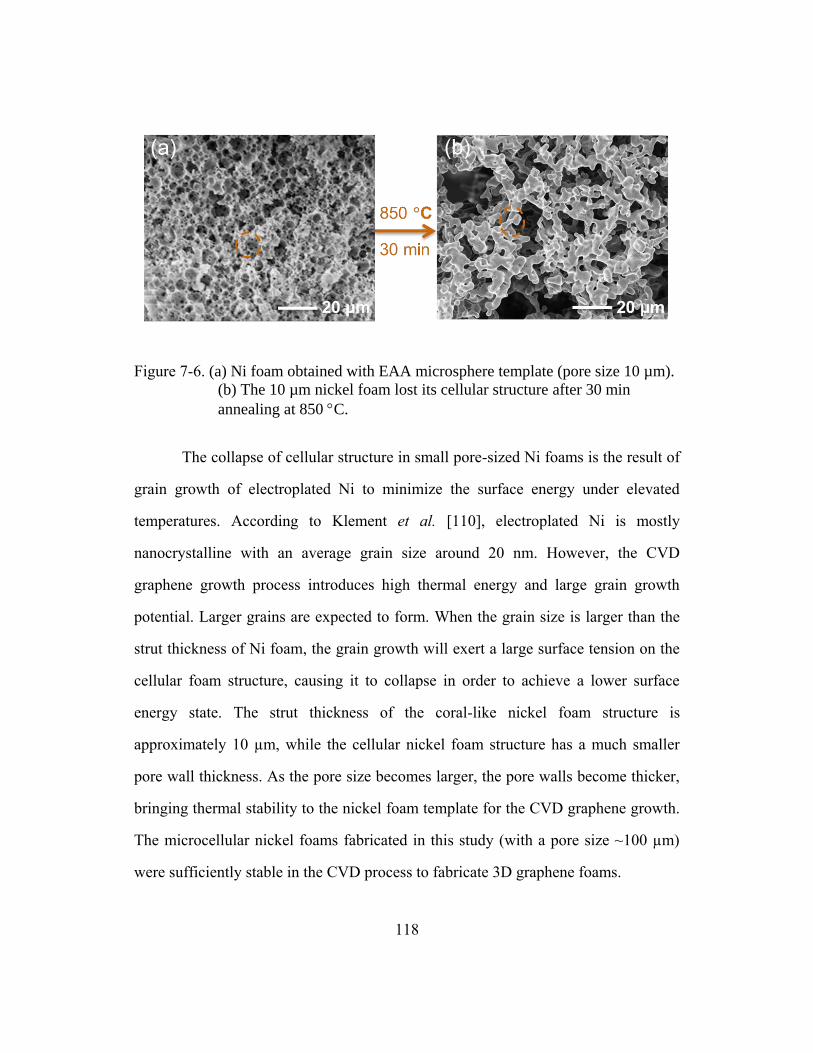
118
Figure 7-6. (a) Ni foam obtained with EAA microsphere template (pore size 10 µm).
(b) The 10 µm nickel foam lost its cellular structure after 30 min
annealing at 850 C.
The collapse of cellular structure in small pore-sized Ni foams is the result of
grain growth of electroplated Ni to minimize the surface energy under elevated
temperatures. According to Klement et al. [110], electroplated Ni is mostly
nanocrystalline with an average grain size around 20 nm. However, the CVD
graphene growth process introduces high thermal energy and large grain growth
potential. Larger grains are expected to form. When the grain size is larger than the
strut thickness of Ni foam, the grain growth will exert a large surface tension on the
cellular foam structure, causing it to collapse in order to achieve a lower surface
energy state. The strut thickness of the coral-like nickel foam structure is
approximately 10 µm, while the cellular nickel foam structure has a much smaller
pore wall thickness. As the pore size becomes larger, the pore walls become thicker,
bringing thermal stability to the nickel foam template for the CVD graphene growth.
The microcellular nickel foams fabricated in this study (with a pore size ~100 µm)
were sufficiently stable in the CVD process to fabricate 3D graphene foams.
119
7.4 CONCLUSIONS
A fabrication process for microcellular 3D graphene foams is demonstrated
with ambient pressure chemical vapor deposition of Ni foam templates. The
microcellular Ni foam templates introduced in Chapter 5 exhibited sufficient thermal
stability for few layer graphene growth in the APCVD process, yielding graphene
foams with a pore size less than 100 µm, density of 0.0020 g·cm-3, and pore wall
thickness of 5 nm. The 3D graphene foam has a cellular morphology with surface-to-
volume ratio of 2.5×10⁵ m2·m-3 and is expected to find applications in energy storage
devices for balanced high loading and fast charging and discharging rates.

120
Chapter 8. Summary and Future Work
8.1 SUMMARY
Hydrophilic polymer microsphere templates and hydrophilic polymer foams
with micro and nano-sized open cells were fabricated in this study. PMMA, paraffin,
and EAA templates were fabricated via assembly of hydrophilic microspheres.
Hydrophilic PEG/BPS polymer foams with two levels of pore size (micro and
nanometers) were fabricated via solid state foaming. The sphere assembled templates
were used to fabricate nickel foams via a novel electropolishing assisted electroless
plating method. An ethanol based electroless plating solution was used to enhance
the diffusion coefficient of electrolyte in the porous structure. A finite difference
model was developed to explore mechanisms of the newly developed nickel foam
plating method. The model was also used to determine suitable plating conditions for
nickel foams with different cell sizes. The fabricated nickel foams were employed as
a template for producing 3D few layer graphene foams. As a special application, the
fabricated PEG/BPS foams were tested for water and air diffusivities.
The major contributions of this work are summarized below.
Hydrophilic polymer micro templates were fabricated with
microspheres featuring different size ranges. Hydrophilic paraffin
spheres were fabricated using a simple water/oil emulsion approach.
Hydrolyzed PMMA and EAA spheres were selected because of their
low cost. The parameters for fabricating paraffin spheres and
hydrolyzing PMMA spheres were determined. The conditions of
assembling spheres were identified. Sintering temperature and time
121
were the two major parameters affecting the porosity of the assembled
samples.
Hydrophilic PEG/BPS foams with micro and nano-sized open cells
were fabricated via solid state foaming, and the foams’ applicability
as fuel cell humidification membrane was investigated. BPS was
selected as the polymer matrix because it is highly hydrophilic, fully
amorphous, and mechanically strong. However, PEG was applied as a
plasticizer to BPS because BPS is brittle at a low humidity. The
parameters of saturation and foaming were investigated. Foaming
temperature and blend composition determined the porosity and pore
size of foamed samples. PEG200 containing blends have a low gas
concentration and low porosity after foaming. Testing results
indicated that PEG600 containing foams had a significant increase in
both humidification rate and the maximum relative humidity that can
be achieved, comparing to the corresponding solid membranes. The
PEG200 containing foams had almost no changes from the unfoamed
sample. High porosity levels and nano pores connecting the micro
cells in foamed PEG600/BPS membranes are the main reason for the
increase in humidification performance of the foamed membranes.
The humidification performance of foamed PEG600-20/BPS
membrane is comparable with Nafion 212 membrane under the
applied test conditions. Unfoamed PEG/BPS membranes would crack
under low humidity conditions, while foamed membranes remained
an integral piece under those conditions. Air leak test results indicate
122
that foamed PEG/BPS membranes have an air leak rate much lower
than the DOE requirement for a humidification membrane.
Furthermore, the high Tg (> 130 ºC) of PEG600-20/BPS allows an
operation temperature higher than that of Nafion. In addition, the
price of PEG/BPS membranes (both foamed and solid) is (< $300/m2)
much lower than ~$1000/m2 for Nafion (50 µm). The foamed
PEG/BPS membranes showed potential as an alternative for fuel cell
humidification applications.
The fabricated microsphere templates were used for plating nickel
foams. The electroplating approach was shown not suitable for
fabricating bulk nickel foams due to the limitation of ion diffusion in
the porous structure. A novel electropolishing assisted electroless
plating approach was developed to fabricate microcellular nickel
foams. Ethanol based electroless plating solutions were used to
further reduce the surface tension of polymer microspheres. The
results indicate that the developed approach could deposit nickel
thoroughly and evenly across PMMA and paraffin microsphere
templates up to 2.5 mm thick (equivalent to 25 layers of spheres),
while the eletroless plating process alone could only plate nickel on a
few layers of spheres with the same amount of plating time. Even
given plenty of time, thoroughly plated microsphere templates could
not be obtained due to the limitation to ion diffusion.
A finite difference model was developed to study mechanisms of the
developed bulk nickel foam fabrication approach and determine
123
suitable conditions for nickel foams with different cell sizes. When
only electroless plating was applied, plated nickel thickness on near
surface layers were much thicker than that on interior layers. The
thick near surface nickel coating reduced the porosity and increased
the tortuosity of the microsphere template, thus leading to reduced
diffusivity of ion into the template interior. As a result, uneven nickel
plating happened. When electropolishing was introduced, the near
surface nickel was polished off faster than the interior nickel due to an
uneven polishing current distribution resulted from the uneven nickel
thickness from the former electroless plating process. Hence, a
relatively constant ion diffusion rate toward the interior was
maintained. Finally, a relatively evenly distributed nickel thickness
was formed. Suitable conditions for electropolishing assisted
electroless plating process for templates with different sphere sizes
were determined with the model.
3D few layer graphene foams were fabricated using the obtained
nickel foam as a template. The microcellular Ni foam templates
exhibited sufficient thermal stability for few layer graphene growth in
the APCVD process, yielding graphene foams with a pore size less
than 100 µm, density of 0.0020 g·cm-3, and pore wall thickness of 5
nm. The 3D graphene foam has a cellular morphology with surface-
to-volume ratio of 2.5×10⁵ m2·m-3 and is expected to find applications
in energy storage devices for balanced high loading and fast charging
and discharging rates.
124
8.2 FUTURE WORK
The current work has paved way for further study, which could include the
following.
8.3.1 Extending applications of hydrophilic polymer nanofoams
Hydrophilic polymer foams with micro and nano-sized open cells could be
used as templates for fabricating nano pore-sized nickel foam and as water treatment
membranes. Comparing with the existing methods for fabricating nano-sized Ni
foams, which are electrodeposition of costly polymer nano-sphere templates (> $100
per 10 mL water suspension) and electroless deposition of nanoporous polymer
foams from chemical degradation of block copolymers, the as developed hydrophilic
polymer foams are at a much lower cost and require a simple and environmentally
friendly fabrication process. The challenge will be the removal of the solid skin
layers. The developed hydrophilic foams are a possible candidate for water treatment
membrane owing to its higher water permeability resulted from its open nano-sized
pores, compared with the solid membranes. Foaming may reduce the amount of
material needed and thus lower cost as well. The fabrication of Ni nanofoams with
hydrophilic polymer nanofoams as templates could be investigated. The application
of hydrophilic polymer nanofoams as water treatment membrane could be addressed.
New foaming conditions need to be developed to realize those potentials.
8.3.2 Improvement on the process model
The current finite difference model was validated with the measured nickel
thickness on different microsphere layers. However, the current measurements were
based on freeze-fractured SEM samples, where accurate measurements of nickel
125
coating thickness have been challenging. A better sample preparation method could
be developed to allow more accurate coating thickness measurements.
8.3.3 Application of nickel/graphene microcellular foams in energy storage
applications
Fabricated nickel foams and graphene foams could be used as a scaffold for
energy storage electrodes. Suitable active materials with high energy density and
compatibility with the scaffold could be developed or selected. Potential candidate
active materials could include electrically conductive polymer and nano silicon
blends, metal oxides, and lithium ion electrode materials such as LiFePO4. Devices
and infiltration approaches need to be developed to test this electrode design concept.
126
References
[1]. Li, S., Y. Wang, Y. Liu, and W. Sun, Estimation of Thermal Conductivity of
Porous Material with FEM and Fractal Geometry. International Journal of
Modern Physics C, 2009. 20(4): p. 513-526.
[2]. Wang, M. and N. Pan, Modeling and Prediction of the Effective Thermal
Conductivity of Random Open-Cell Porous Foams. International Journal of
Heat and Mass Transfer, 2008. 51(5-6): p. 1325-1331.
[3]. Chen, Y., X. Zhang, P. Yu, and Y. Ma, Electrophoretic deposition of
graphene nanosheets on nickel foams for electrochemical capacitors. Journal
of Power Sources, 2010. 195(9): p. 3031-3035.
[4]. Zhang, H.Y., D. Pinjala, Y.K. Joshi, T.N. Wong, and K.C. Toh, Development
and Characterization of Thermal Enhancement Structures for Single-Phase
Liquid Cooling in Microelectronics Systems. Heat Transfer Engineering,
2007. 28(12): p. 997-1007.
[5]. Apprill, J.M., D.R. Poirier, M.C. Maguire, and T.C. Gutsch, porous metals
process control. MRS Online Proceedings Library, 1998. 521: p. 291-296.
[6]. Banhart, J., Manufacture, characterisation and application of cellular metals
and metal foams. Progress in materials Science, 2001. 46(6): p. 559-632.
[7]. Bram, M., C. Stiller, H.P. Buchkremer, D. Stöver, and H. Baur, High-
porosity titanium, stainless steel, and superalloy parts. Advanced
Engineering Materials, 2000. 2(4): p. 196-199.
[8]. Clancy, R.B., J.K. Cochran, and T.H. Sanders, Fabrication and properties of
hollow sphere nickel foams. MRS Online Proceedings Library, 1994. 372: p.
155-165.
[9]. Salehi, P., P. Sarazin, and B.D. Favis, Porous Devices Derived from Co-
Continuous Polymer Blends as a Route for Controlled Drug Release.
Biomacromolecules, 2008. 9(4): p. 1131-1138.
[10]. Sarazin, P., X. Roy, and B.D. Favis, Controlled Preparation and Properties
of Porous Poly(l-lactide) Obtained from a Co-continuous Blend of Two
Biodegradable Polymers. Biomaterials, 2004. 25(28): p. 5965-5978.
[11]. Wadley, H.N.G., Cellular metals manufacturing: an overview of stochastic
and periodic concepts. in Cellular Metals and Metal Foaming Technology.
2001. Verlag-MIT.
127
[12]. Yamada, Y., T. Banno, Y. Li, and C. E. Wen., Anisotropic mechanical
properties of nickel foams fabricated by powder metallurgy. 2008. Trans
Tech Publications Ltd.
[13]. Ghanem, M.A., P.N. Bartlett, P. De Groot, and A. Zhu, A double templated
electrodeposition method for the fabrication of arrays of metal nanodots.
Electrochemistry communications, 2004. 6(5): p. 447-453.
[14]. Hao, Y., F. Zhu, C. Chien, and P.C. Searson, Fabrication and magnetic
properties of ordered macroporous nickel structures. Journal of the
Electrochemical Society, 2007. 154(2): p. D65-D69.
[15]. Dong, X., Y. Ma, G. Zhu, Y. Huang, J. Wang, M.B. Chan-Park, et al.,
Synthesis of graphene–carbon nanotube hybrid foam and its use as a novel
three-dimensional electrode for electrochemical sensing. Journal of Materials
Chemistry, 2012. 22(33): p. 17044-17048.
[16]. Ning, J., X. Xu, C. Liu, and D. Fan, Three-dimensional multilevel porous thin
graphite nanosuperstructures for Ni (OH) 2-based energy storage devices.
Journal of Materials Chemistry A, 2014. 2(38): p. 15768-15773.
[17]. Singh, E., Z. Chen, F. Houshmand, W. Ren, Y. Peles, H.M. Cheng, et al.,
Superhydrophobic graphene foams. small, 2013. 9(1): p. 75-80.
[18]. Xiao, X., T.E. Beechem, M.T. Brumbach, T.N. Lambert, D.J. Davis, J.R.
Michael, et al., Lithographically defined three-dimensional graphene
structures. ACS nano, 2012. 6(4): p. 3573-3579.
[19]. Braun, P.V., Materials Chemistry in 3D Templates for Functional Photonics.
Chemistry of Materials, 2013. 26(1): p. 277-286.
[20]. Jiang, P. and M.J. McFarland, Large-scale fabrication of wafer-size colloidal
crystals, macroporous polymers and nanocomposites by spin-coating. Journal
of the American Chemical Society, 2004. 126(42): p. 13778-13786.
[21]. Yu, A., F. Meiser, T. Cassagneau, and F. Caruso, Fabrication of polymer-
nanoparticle composite inverse opals by a one-step electrochemical co-
deposition process. Nano Letters, 2004. 4(1): p. 177-181.
[22]. Wang, D. and F. Caruso, Fabrication of polyaniline inverse opals via
templating ordered colloidal assemblies. Advanced materials, 2001. 13(5): p.
350-354.
128
[23]. Eaves, D., Polymer Foams-Trends in Use and Technology1996, Shawbury,
UK: Smithers Rapra Press. 152.
[24]. Cui, Z., B. Nelson, Y. Peng, K. Li, S. Pilla, W.-J. Li, et al., Fabrication and
characterization of injection molded poly (ε-caprolactone) and poly (ε-
caprolactone)/hydroxyapatite scaffolds for tissue engineering. Materials
Science and Engineering: C, 2012. 32(6): p. 1674-1681.
[25]. Kang, J., The synthesis of nanoporous hydrogels using sacrificial block
copolymers, 2006, Massachusetts Institute of Technology.
[26]. Hua, Y., S. Zhang, Y. Zhu, Y. Chu, and J. Chen, Hydrophilic polymer foams
with well‐defined open‐cell structure prepared from pickering high
internal phase emulsions. Journal of Polymer Science Part A: Polymer
Chemistry, 2013. 51(10): p. 2181-2187.
[27]. Zhao, Y.-H., Y.-Y. Xu, and B.-K. Zhu, In situ crosslinking of hyperbranched
polyglycerol in casting solutions and its effect on the structure and properties
of porous PVDF membranes. Journal of Applied Polymer Science, 2010.
117(1): p. 548-556.
[28]. Virgilio, N., P. Sarazin, and B.D. Favis, Towards ultraporous poly(l-lactide)
scaffolds from quaternary immiscible polymer blends. Biomaterials, 2010.
31(22): p. 5719-5728.
[29]. Sundarram, S.S., W. Jiang, and W. Li, Fabrication of Small Pore-Size Nickel
Foams using Electroless Plating of Solid-state Foamed Immiscible Polymer
Blends. Journal of Manufacturing Science and Engineering, 2013. Submitted.
[30]. Miller, D., P. Chatchaisucha, and V. Kumar, Microcellular and nanocellular
solid-state polyetherimide (PEI) foams using sub-critical carbon dioxide I.
processing and structure. Polymer, 2009. 50(23): p. 5576-5584.
[31]. Wang, X., Solvent-free fabrication of porous polymer for tissure engineering
applications, 2007, University of Washington: Seattle, WA, USA.
[32]. Zhou, C., N. Vaccaro, S.S. Sundarram, and W. Li, Fabrication and
characterization of polyetherimide nanofoams using supercritical CO2.
Journal of Cellular Plastics, 2012. 48(3): p. 239-255.
[33]. Aher, B., N.M. Olson, and V. Kumar, Production of bulk solid-state PEI
nanofoams using supercritical CO2. Journal of Materials Research, 2013.
FirstView: p. 1-8.
129
[34]. Krause, B., K. Diekmann, N.F.A. van der Vegt, and M. Wessling, Open
Nanoporous Morphologies from Polymeric Blends by Carbon Dioxide
Foaming. Macromolecules, 2002. 35(5): p. 1738-1745.
[35]. Krause, B., H.J.P. Sijbesma, P. Münüklü, N.F.A. van der Vegt, and M.
Wessling, Bicontinuous Nanoporous Polymers by Carbon Dioxide Foaming.
Macromolecules, 2001. 34(25): p. 8792-8801.
[36]. Tappan, B.C., S.A. Steiner Iii, and E.P. Luther, Nanoporous Metal Foams.
Angewandte Chemie International Edition, 2010. 49(27): p. 4544-4565.
[37]. Vukovic, I., S. Punzhin, Z. Vukovic, P. Onck, J.T.M. De Hosson, G. ten
Brinke, et al., Supramolecular route to well-ordered metal nanofoams. ACS
Nano, 2011. 5(8): p. 6339-6348.
[38]. Lefebvre, L.P., J. Banhart, and D. Dunand, Porous metals and metallic
foams: current status and recent developments. Advanced Engineering
Materials, 2008. 10(9): p. 775-787.
[39]. Liu, P. and K. Liang, Preparation and corresponding structure of nickel
foam. Materials science and technology, 2000. 16(5): p. 575-578.
[40]. Ye, S., J. Feng, and P. Wu, Deposition of Three-Dimensional Graphene
Aerogel on Nickel Foam as a Binder-Free Supercapacitor Electrode. ACS
applied materials & interfaces, 2013.
[41]. Wang, Z.-L., D. Xu, H.-G. Wang, Z. Wu, and X.-B. Zhang, In Situ
Fabrication of Porous Graphene Electrodes for High-Performance Energy
Storage. ACS nano, 2013. 7(3): p. 2422-2430.
[42]. Chen, J., C. Li, and G. Shi, Graphene Materials for Electrochemical
Capacitors. The Journal of Physical Chemistry Letters, 2013. 4(8): p. 1244-
1253.
[43]. Chen, Z., W. Ren, L. Gao, B. Liu, S. Pei, and H.-M. Cheng, Three-
dimensional flexible and conductive interconnected graphene networks
grown by chemical vapour deposition. Nature materials, 2011. 10(6): p. 424-
428.
[44]. Baumeister, J. and J. Weise, Manufacturing Processes for Metal Foams.
Metal Foams: Fundamentals and Applications, 2012: p. 1.
130
[45]. Brown, I., D. Clift, and S. Sotiropoulos, Preparation of microporous nickel
electrodeposits using a polymer matrix. Materials research bulletin, 1999.
34(7): p. 1055-1064
[46]. Jinghuai, Z., H. Zhilin, X. Huiping, F. Zhengqiu, and Y. Chengzhou, Study
on Electroless Nickel on Foam Polyurethane [J]. Chinese Journal of Rare
Metals, 2001. 4: p. 011.
[47]. Kuphal, J.A., L.M. Robeson, and J.J. Weber, Blends of poly (propylene
carbonate) and poly (methyl methacrylate) and their use in decomposition
molding, 1989, Google Patents.
[48]. LI, K., J. LUO, Y. LIU, and Y. TANG, Electroless plating in synthesizing
nickel foams [J]. High Power Laser and Particle Beams, 2007. 7: p. 023.
[49]. Liu, P. and K. Liang, Review Functional materials of porous metals made by
P/M, electroplating and some other techniques. Journal of materials science,
2001. 36(21): p. 5059-5072.
[50]. Paserin, V., S. Marcuson, J. Shu, and D.S. Wilkinson, The chemical vapor
deposition technique for Inco nickel foam production–manufacturing benefits
and potential applications. in Proc. of the conf. metfoam. 2003.
[51]. Smorygo, O., V. Mikutski, A. Marukovich, A. Ilyushchanka, V. Sadykov,
and A. Smirnova, An inverted spherical model of an open-cell foam
structure. Acta Materialia, 2011. 59(7): p. 2669-2678.
[52]. Stein, A., Sphere templating methods for periodic porous solids. Microporous
and Mesoporous Materials, 2001. 44: p. 227-239.
[53]. Yang, S., Z. He, X. Huang, and Z. Liu, A research on the electroless nickel
plating on polycarbonate. Electroplating and Pollution Control, 2005. 25(4):
p. 32.
[54]. Zhang, H., X. Yu, and P.V. Braun, Three-dimensional bicontinuous ultrafast-
charge and-discharge bulk battery electrodes. Nature Nanotechnology, 2011.
6(5): p. 277-281.
[55]. Zhao, X., F. Su, Q. Yan, W. Guo, X.Y. Bao, L. Lv, et al., Templating
methods for preparation of porous structures. Journal of Materials
Chemistry, 2006. 16(7): p. 637-648.
131
[56]. Apprill, J., D. Poirier, M. Maguire, and T. G. Gasar, porous metals process
control. in Materials Research Society Symposium Proceedings. 1998.
Cambridge Univ Press.
[57]. Clancy, R., J. Cochran, and T. Sanders, Fabrication and Properties of
Hollow Sphere Nickel Foams. in MRS Proceedings. 1994. Cambridge Univ
Press.
[58]. Banno, T., C.E. Wen, Y. Yamada, and Y.C. Li, Anisotropic mechanical
properties of nickel foams fabricated by powder metallurgy. in Materials
science forum. 2008. Trans Tech Publ.
[59]. Hsueh, H.Y., Y.C. Huang, R.M. Ho, C.H. Lai, T. Makida, and H. Hasegawa,
Nanoporous gyroid nickel from block copolymer templates via electroless
plating. Advanced Materials, 2011. 23(27): p. 3041-3046.
[60]. Paserin, V., S. Marcuson, J. Shu, and D.S. Wilkinson, CVD technique for
Inco nickel foam production. Advanced Engineering Materials, 2004. 6(6): p.
454-459.
[61]. Brown, I. and S. Sotiropoulos, Electroplating and electroless plating of Ni
through/onto a porous polymer in a flow cell. Journal of applied
electrochemistry, 2001. 31(11): p. 1203-1212.
[62]. Boiko, L., Formation of Porous Structures in Metal–Hydrogen Systems.
Materials Science, 2002. 38(4): p. 544-549.
[63]. Wadley, H., Cellular metals manufacturing: an overview of stochastic and
periodic concepts. in International Conference on Cellular Metals and Metal
Foaming Technology. 2001.
[64]. Andersen, O., U. Waag, L. Schneider, G. Stephani, and B. Kieback, Novel
metallic hollow sphere structures. Advanced Engineering Materials, 2000.
2(4): p. 192-195.
[65]. Eaves, D., Handbook of polymer foams. polimeri, 2004. 25: p. 1-2.
[66]. Krishnan, S., J.Y. Murthy, and S.V. Garimella, A two-temperature model for
solid-liquid phase change in metal foams. Journal of heat transfer, 2005.
127(9): p. 995-1004.
[67]. Chung, C.-K. and W. Chang, Effect of pulse frequency on the morphology
and nanoindentation property of electroplated nickel films. Microsystem
technologies, 2007. 13(5-6): p. 537-541.
132
[68]. Chung, C.-K. and W.-T. Chang, Deep nickel metal deposition on multiscale
feature sizes of a small hole and large sector cavities using electroforming.
Journal of Micro/Nanolithography, MEMS, and MOEMS, 2009. 8(2): p.
021111-021111-6.
[69]. Mallory, G.O. and J.B. Hajdu, Electroless plating fundamentals and
applications1990, Orlando, FL: William Andrew. 539.
[70]. Dullien, F.A., Porous media: fluid transport and pore structure2012:
Academic press.
[71]. Stein, A. and R.C. Schroden, Colloidal crystal templating of three-
dimensionally ordered macroporous solids: materials for photonics and
beyond. Current Opinion in Solid State and Materials Science, 2001. 5(6): p.
553-564.
[72]. Velev, O.D. and A.M. Lenhoff, Colloidal crystals as templates for porous
materials. Current opinion in colloid & interface science, 2000. 5(1): p. 56-
63.
[73]. Kemsheadl, J. and J. Ugelstad, Magnetic separation techniques: their
application to medicine. Molecular and cellular Biochemistry, 1985. 67(1): p.
11-18.
[74]. Akbulut, O., C.R. Mace, R.V. Martinez, A.A. Kumar, Z. Nie, M.R. Patton, et
al., Separation of nanoparticles in aqueous multiphase systems through
centrifugation. Nano letters, 2012. 12(8): p. 4060-4064.
[75]. Goddard, J.M. and J. Hotchkiss, Polymer surface modification for the
attachment of bioactive compounds. Progress in polymer science, 2007.
32(7): p. 698-725.
[76]. Chen, D., W. Li, and H. Peng, An experimental study and model validation of
a membrane humidifier for PEM fuel cell humidification control. Journal of
Power Sources, 2008. 180(1): p. 461-467.
[77]. Koo, J.H., Polymer nanocomposites: processing, characterization, and
applications2006: McGraw-Hill New York.
[78]. Vaia, R.A., G. Price, P.N. Ruth, H.T. Nguyen, and J. Lichtenhan,
Polymer/layered silicate nanocomposites as high performance ablative
materials. Applied Clay Science, 1999. 15(1): p. 67-92.
133
[79]. Oh, H.J., B.D. Freeman, J.E. McGrath, C.H. Lee, and D.R. Paul, Thermal
analysis of disulfonated poly (arylene ether sulfone) plasticized with poly
(ethylene glycol) for membrane formation. Polymer, 2014. 55(1): p. 235-247.
[80]. Lee, C.H., D. VanHouten, O. Lane, J.E. McGrath, J. Hou, L.A. Madsen, et
al., Disulfonated poly (arylene ether sulfone) random copolymer blends tuned
for rapid water permeation via cation complexation with poly (ethylene
glycol) oligomers. Chemistry of materials, 2011. 23(4): p. 1039-1049.
[81]. Jacobs, M. Carbon dioxide pressure-temperature phase diagram. 2005;
Available from: http://en.wikipedia.org/wiki/File:Carbon_dioxide_pressure-
temperature_phase_diagram.svg.
[82]. ASTM, Standard Test Methods for Density and Specific Gravity (Relative
Density) of Plastics by Displacement, in D792,2008.
[83]. Michler, G.H. and F. Baltá-Calleja, Mechanical properties of polymers based
on nanostructure and morphology. Vol. 71. 2005: CRC Press.
[84]. Garland, N., T. Benjamin, and J. Kopasz, DOE fuel cell program: durability
technical targets and testing protocols. ECS Transactions, 2007. 11(1): p.
923-931.
[85]. Yu, Y., C.H. Chen, J.L. Shui, and S. Xie, Nickel‐Foam‐Supported
Reticular CoO–Li2O Composite Anode Materials for Lithium Ion Batteries.
Angewandte Chemie International Edition, 2005. 44(43): p. 7085-7089.
[86]. Huang, X., J. Tu, X. Xia, X. Wang, and J. Xiang, Nickel foam-supported
porous NiO/polyaniline film as anode for lithium ion batteries.
Electrochemistry communications, 2008. 10(9): p. 1288-1290.
[87]. Yang, C., D. Zhang, Y. Zhao, Y. Lu, L. Wang, and J.B. Goodenough, Nickel
foam supported Sn–Co alloy film as anode for lithium ion batteries. Journal
of Power Sources, 2011. 196(24): p. 10673-10678.
[88]. Li, J., Q.M. Yang, and I. Zhitomirsky, Nickel foam-based manganese
dioxide–carbon nanotube composite electrodes for electrochemical
supercapacitors. Journal of Power Sources, 2008. 185(2): p. 1569-1574.
[89]. Wang, G., J. Huang, S. Chen, Y. Gao, and D. Cao, Preparation and
supercapacitance of CuO nanosheet arrays grown on nickel foam. Journal of
Power Sources, 2011. 196(13): p. 5756-5760.
134
[90]. Wang, Y.-L., Y.-Q. Zhao, and C.-L. Xu, May 3D nickel foam electrode be the
promising choice for supercapacitors. Journal of Solid State
Electrochemistry, 2012. 16(3): p. 829-834.
[91]. Oya, T., T. Nomura, N. Okinaka, and T. Akiyama, Phase change composite
based on porous nickel and erythritol. Applied Thermal Engineering, 2012.
40: p. 373-377.
[92]. Li, S.S.S.a.W., The Effect of Pore Size and Porosity on Thermal Management
Performance of Phase Change Material Infiltrated Microcellular Metal
Foams. Applied Thermal Engineering, 2013. Accepted.
[93]. Sundarram, S.S. and W. Li, On thermal conductivity of micro‐ and
nanocellular polymer foams. Polymer Engineering & Science, 2013.
[94]. Yan, H., C.F. Blanford, J.C. Lytle, C.B. Carter, W.H. Smyrl, and A. Stein,
Influence of processing conditions on structures of 3D ordered macroporous
metals prepared by colloidal crystal templating. Chemistry of materials,
2001. 13(11): p. 4314-4321.
[95]. Bulasara, V.K., R. Uppaluri, and M.K. Purkait, Effect of ultrasound on the
performance of nickel hydrazine electroless plating baths. Materials and
Manufacturing Processes, 2012. 27(2): p. 201-206.
[96]. Wong, K., K. Chan, and T. Yue, A study of surface finishing in pulse current
electroforming of nickel by utilizing different shaped waveforms. Surface and
Coatings Technology, 1999. 115(2): p. 132-139.
[97]. Mallory G O, H.J.B., Electroless plating-fundamentals and Applications, in
American Electroplaters and Surface Finishers Society.
[98]. Bo-Ming, Y. and L. Jian-Hua, A geometry model for tortuosity of flow path in
porous media. Chinese Physics Letters, 2004. 21(8): p. 1569.
[99]. Jun, J.B., M.S. Seo, S.H. Cho, J.G. Park, J.H. Ryu, and K.D. Suh, Synthesis
of monodisperse nickel‐coated polymer particles by electroless plating
method utilizing functional polymeric ligands. Journal of Applied Polymer
Science, 2006. 100(5): p. 3801-3808.
[100]. Cao, X., Y. Shi, W. Shi, G. Lu, X. Huang, Q. Yan, et al., Preparation of
novel 3D graphene networks for supercapacitor applications. Small, 2011.
7(22): p. 3163-3168.

135
[101]. Maiyalagan, T., X. Dong, P. Chen, and X. Wang, Electrodeposited Pt on
three-dimensional interconnected graphene as a free-standing electrode for
fuel cell application. Journal of Materials Chemistry, 2012. 22(12): p. 5286-
5290.
[102]. Sundarram, S.S. and W. Li, The effect of pore size and porosity on thermal
management performance of phase change material infiltrated microcellular
metal foams. Applied Thermal Engineering, 2014. 64(1): p. 147-154.
[103]. Wei, W., S. Yang, H. Zhou, I. Lieberwirth, X. Feng, and K. Müllen, 3D
graphene foams cross‐linked with pre‐encapsulated Fe3O4 nanospheres
for enhanced lithium storage. Advanced materials, 2013. 25(21): p. 2909-
2914.
[104]. Choi, B.G., M. Yang, W.H. Hong, J.W. Choi, and Y.S. Huh, 3D
macroporous graphene frameworks for supercapacitors with high energy and
power densities. ACS nano, 2012. 6(5): p. 4020-4028.
[105]. Lee, J.-S., H.-J. Ahn, J.-C. Yoon, and J.-H. Jang, Three-dimensional nano-
foam of few-layer graphene grown by CVD for DSSC. Physical Chemistry
Chemical Physics, 2012. 14(22): p. 7938-7943.
[106]. Ji, H., L. Zhang, M.T. Pettes, H. Li, S. Chen, L. Shi, et al., Ultrathin graphite
foam: a three-dimensional conductive network for battery electrodes. Nano
Letters, 2012. 12(5): p. 2446-2451.
[107]. J. Kim, H. K. Jung, S. H. Kim, and H. W. Lee, The effect of various
parameters for few-layered graphene synthesis using methane and acetylene
Journal of Ceramic Processing Research, 2012. 13: p. 42-46.
[108]. Yu, X., Y.J. Lee, R. Furstenberg, J.O. White, and P.V. Braun, Filling fraction
dependent properties of inverse opal metallic photonic crystals. Advanced
materials, 2007. 19(13): p. 1689-1692.
[109]. Jiang, W., S.S. Sundarram, and W. Li, Fabrication of microcellular metal
foams with sphere template electrodeposition. Manufacturing Letters, 2014.
2(4): p. 118-121.
[110]. Klement, U., U. Erb, A. El-Sherik, and K. Aust, Thermal stability of
nanocrystalline Ni. Materials Science and Engineering: A, 1995. 203(1): p.
177-186.
136
Vita
Wei Jiang was born in Yantai in China. He got his Bachelor of Engineering
in Polymer Science & Engineering from College of Engineering, Qingdao University
of Science and Technology, China in 2006. In fall 2006 he joined East China
University of Science and Technology for his Master of Science in Polymer Science
& Engineering and received his degree in 2009. He started his master program at The
University of Texas at Austin in fall 2009 and started his doctorate program in fall
2011. He started working under the supervision of Dr. Wei Li in spring 2012. His
areas of interest are micro and nano manufacturing for energy and thermal
management applications.
Email: [email protected]
This dissertation was typed by the author.