Embed Size (px)
Citation preview


Copyright 2010 Gemcom Software International Inc. (Gemcom).
This software and documentation is proprietary to Gemcom and, except where expressly providedotherwise, does not form part of any contract. Changes may bemade in products or services atany timewithout notice.
Gemcom publishes this documentation for the sole use of Gemcom licensees. Without writtenpermission you may not sell, reproduce, store in a retrieval system, or transmit any part of thedocumentation. For such permission, or to obtain extra copies please contact your local Gemcomoffice or visit www.gemcomsoftware.com.
While every precaution has been taken in the preparation of this manual, we assume noresponsibility for errors or omissions. Neither is any liability assumed for damage resulting from theuse of the information contained herein.
Gemcom Software International Inc. Gemcom, the Gemcom logo, combinations thereof, andWhittle, Surpac, GEMS, Minex, Gemcom InSite and PCBC are trademarks of Gemcom SoftwareInternational Inc. or its wholly-owned subsidiaries.
ProductGemcom Surpac v6.1

Table of Contents
Introduction 9
Overview 9
Requirements 9
Document Conventions 9
Typographical Conventions 9
Keyboard Conventions 9
Menu Conventions 10
Mouse Conventions 10
Forms 11
Elements of Forms 12
Getting Started 13
Installing Surpac v6.2 from a CD 13
Activity: Install Surpac 13
Starting Surpac 14
Activity: Start Surpac 14
Licencing Surpac 14
Activity: Licence Surpac 14
Setting theWork Directory 16
Activity: Set theWork Directory (Windows XP) 16
Activity: Set theWork Directory (Windows Vista or Windows 7) 17
Exiting Surpac 17
Activity: Exit Surpac 17
Modifying the Surpac Desktop Icon 18
Activity: Modify the Surpac Icon to Set theWork Directory Automatically 18
Switches 19
Review 21
Questions 21
Exercises 21
Surpac Concepts 22
Overview 22
Surpac Data Types 22
Function-centric vs Data-centric Operations 23
Function-centric 23
Data-centric 23
Review 24
Questions 24
Exercises 24
The Surpac Interface 26

Menus 27
Activity: Open a File Using theMenu 27
Toolbars 28
Activity: Use the Reset Graphics Button from the Toolbar 28
Navigator 28
Activity: Open a File from the Navigator 28
Preview Pane 30
Activity: Display a String File in the Preview Pane 30
Legend Pane 30
Graphics 31
Activity: Display and ViewData in Graphics 31
Properties Pane 31
Layers Pane 32
Status Bar 32
Activity: View Changes to the Status Area 32
MessageWindow 32
Activity: Clear theMessageWindow 32
Multiple Viewports 33
Activity: Work with Multiple Viewports 33
Using and Creating Profiles 37
Activity: Select the geology_database Profile 37
Activity: Saving your Customisations to a Profile 38
Activity: Restoring the Default Profile 39
Review 39
Questions 39
Exercises 39
Advanced Interface Operations 41
Menu Bars, Menus and Commands 41
Displaying and Customising Menu Bars 41
Activity: Create a Customised Menu Bar 42
Customising Toolbars and Buttons 44
Activity: Display Toolbars and Create a Customised Toolbar 44
Activity: Creating a Custom Button to Put on a Toolbar 46
Using the Function Chooser 47
Activity: Run Two Functions from the Function Chooser 47
Working with Forms 47
Last value if blank 49
Last value 49
Constant.. 49
Application 49

Configuring Windows and Panes in the Interface 49
Toggle floating 49
Toggle auto-hide 49
Close 50
Default Preferences 51
Task: Changing setting in Defaults Preferences 52
Review 54
Questions 54
Exercises 54
Getting Help 55
Field Help and Form Help 55
Activity: Access Field Help and Form Help 55
Online Help 57
Activity: Access Online Help from a Form 57
Activity: Access Help from the Help Menu 58
Activity: Use the Index to Search for Information 59
Activity: Search the Online help 60
Tutorials 62
Activity: Access the Tutorials Profile 63
Support 64
Activity: Find Support Office Contact Details 64
Software Request 65
Activity: Log a software request 65
Review 67
Questions 67
Exercises 68
Managing Data in Layers 69
Layers and the SurpacWork Area 69
Creating Layers 69
Activity: Create Layers 69
Appending Data to a Layer 75
Activity: Append Data to a Layer with the Navigator 75
Activity: Append Data to a Layer with the Open File Command 77
Replacing Data in a Layer 80
Activity: Replace Data in a Layer with the Navigator 80
Activity: Replace Data in a Layer Using the Open File Command 82
Saving Workspace Settings 84
Activity: Save aWorkspace 84
Review 87
Questions 87

Exercises 87
Strings 89
String Data Hierarchy 89
Types of Strings 90
Description Fields 90
Data Numbering 90
Data Ranges 90
String File Names 91
String Directions 91
Viewing String Data 92
Activity: View String Data 92
String File Structure 95
Activity: View String Data in a Text Editor 95
Review 96
Questions 96
Exercises 96
Viewing and Saving Data 98
Attributes and Styles Files 98
Activity: Change Display Style 98
Activity: View Point Properties 104
Activity: View Segment Properties 105
Activity: Determine Bearing and Distance Between Two Points 106
Saving Data 108
Activity: Save a File 108
The Display Menu 109
Task: Using the Display Menu 111
Viewing and Saving Data Review 112
Questions 112
Exercises 112
Editing Data 114
Orbit Mode 114
Activity: Use Orbit Mode to Rotate Data 114
Selection Modes 114
Activity: Change Selection Modes 114
Activity: Use Point/TriangleMode to Delete Points 116
Activity: Use Segment/Trisolation Mode to Reverse Segments 117
Activity: Use Select Mode to Break, Join, and Renumber Segments 119
Activity: Use String/Object Mode to Delete and Clean Strings 127
TheMove Tool 129
Activity: Move Data Along an Axis 129

Activity: Move Data in a Plane 131
Activity: Move Data in Three Dimensions 132
The Edit Menu 134
String Maths 135
Activity: Convert Ore Zone Interpretations from Section Coordinates to Plan (Real-World)Coordinates 136
Activity: Move a Pit 200Metres North to Correct Survey Station Error 139
Activity: Create a Cut Off Grade 140
Further Examples of String maths functions 146
Review 147
Questions 147
Exercises 147
Creating Data 148
The CreateMenu 148
Snap Mode 148
Simple Underground Mine Design 151
Task: To Create an Underground decline centreline with cross-cuts 151
Create a Simple Pit Design 153
Activity: Create a Simple Pit Design 153
Review 165
Questions 165
Exercises 165
File Tools 167
Applying a Boundary String 167
Activity: Apply a Boundary String to a Soil Sampling File 167
Classifying Strings 169
Activity: Display Soil Samples using String Classification 169
Transforming data 173
2D Transformations 173
Activity: Transform a Pit to a Different Coordinate System 173
Polygon Intersection 176
Activity: Intersect Polygons to Calculate the Area of an Ore Body within a Pit Boundary 176
Activity: Clip Ore Blocks Inside a Pit 180
Review 182
Questions 182
Exercises 182
Triangulated Surfaces 184
SurfaceModelling Concepts 184
Naming Conventions 185
DTM Conventions 185

Breaklines and Spot Heights 185
DTM Data Preparation 186
Cleaning Data 186
Normalising Data 187
Smoothing Data 187
Graphical vs File-based options 188
Creating a DTM Surface 189
Activity: Create a DTM—Graphics based Method 189
Activity: Create a DTM—File Based Method 191
Viewing a DTM Surface 194
Activity: View a DTM in Graphics 194
Viewing Transparent Surfaces 195
Calculate The Volume Between Two DTMs. 197
Creating a Boundary String Between Two DTM Surfaces 202
Activity: Create a Boundary String - File-based Method 202
Activity: Create a Boundary String - Graphics-based Method 204
Calculating Cut and Fill Volume Using DTM Surfaces 205
Activity: Calculate Cut and Fill Volumes Between Two DTMs 205
Solids 206
Activity: View a Solid Model 206
Activity: Create and Validate a Solid Model 207
Activity: Calculate a Volume for a Solid Model 216
Review 218
Questions 218
Exercises 219
Plotting with Autoplot 220
Activity: Produce a Plot of a Pit Using Autoplot 220
Review 222
Questions 222
Exercises 223
More Surpac Functions 224
Drillhole Database 224
Activity: Open a Database, Display the Drill Holes and Create Sections 224
Block Models 228
Activity: Display, Constrain, and Report a Block Model 228
References 237
Introduction TypographicalConventions
Introduction
OverviewThis document is designed to help new or prospective users install Surpac and start using thesoftware. More detailed training information is available within the software and from your localsupport office.
RequirementsBefore proceeding with this tutorial, ensure you have the following items:
1. A copy of Surpac v6.1 for installation.This is usually installed from a CD, but you can also download the software from thehttp://www.gemcomsupport.com web site.
2. A suitable computer with a CD ROM drive.Minimum Recommended
Windows XP Professional XP Professional or VistaRAM 512 Mbytes 1-4 GbytesProcessor P4 >1.75 gigahertz (GHz) P4 Duo >2.5 GHz
Graphics cardA graphics adapter with 256 MBmemory, from a majormanufacturer such as NVIDIA or ATI.
An NVIDIA or ATI graphics card,separate from the motherboard, with512 MB memory.
3. The data set accompanying this tutorial.
Document Conventions
Typographical ConventionsSome text in this manual has special formatting to identify it as a particular element of information.The following list describes the different formats and their meanings:
Text Format Meaning
<Bold Italic>
Text or data that varies with each input is shown in italic font and enclosed in angle brackets.Some examples are installation directories, dates, names and passwords. When you substitutethe text for the variable, do not include the brackets. For example: <password> requires you tosubstitute a password in place of ‘<password>’.
ItalicsA word or phrase to which the author wants to give emphasis. For example: youmust select anitem from the list to continue.
Bold
This typeface indicates one of the following:
l A file name, path or URL.l Strongly emphasized text. For example, “It is very important to save the data
[…]”.l Text that a procedure has instructed you to type.l A menu option, tab, button, check box, list, option button, text box or icon.
For example: Drag and drop the file pit1.str into graphics.
Keyboard ConventionsKey Combination Meaning
<key>+<key>Press and hold down the first key, then press the second key. For example: CTRL+Zmeans hold the CTRL key down, then press Z.
™ Page 9 of 237
Introduction MenuConventions
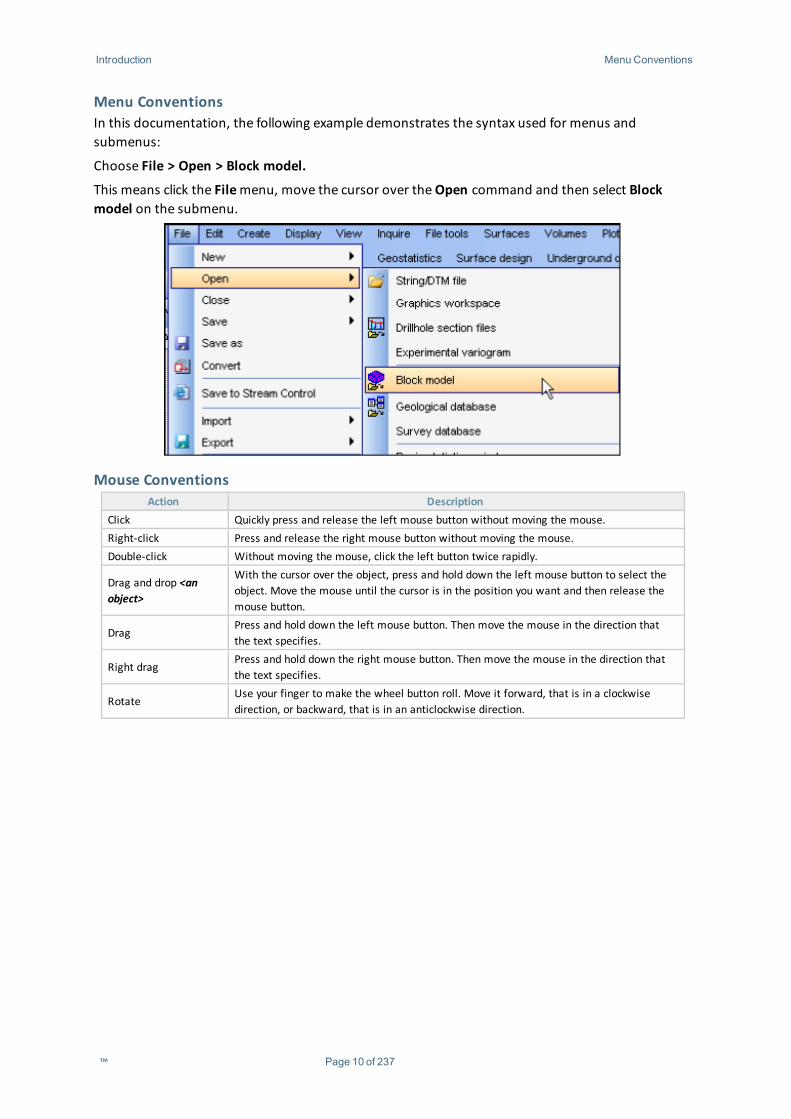
Menu ConventionsIn this documentation, the following example demonstrates the syntax used for menus andsubmenus:
Choose File > Open > Block model.
This means click the Filemenu, move the cursor over theOpen command and then select Blockmodel on the submenu.
Mouse ConventionsAction Description
Click Quickly press and release the left mouse button without moving the mouse.Right-click Press and release the right mouse button without moving the mouse.Double-click Without moving the mouse, click the left button twice rapidly.
Drag and drop <anobject>
With the cursor over the object, press and hold down the left mouse button to select theobject. Move the mouse until the cursor is in the position you want and then release themouse button.
DragPress and hold down the left mouse button. Then move the mouse in the direction thatthe text specifies.
Right dragPress and hold down the right mouse button. Then move the mouse in the direction thatthe text specifies.
RotateUse your finger to make the wheel button roll. Move it forward, that is in a clockwisedirection, or backward, that is in an anticlockwise direction.
™ Page 10 of 237
Introduction Forms
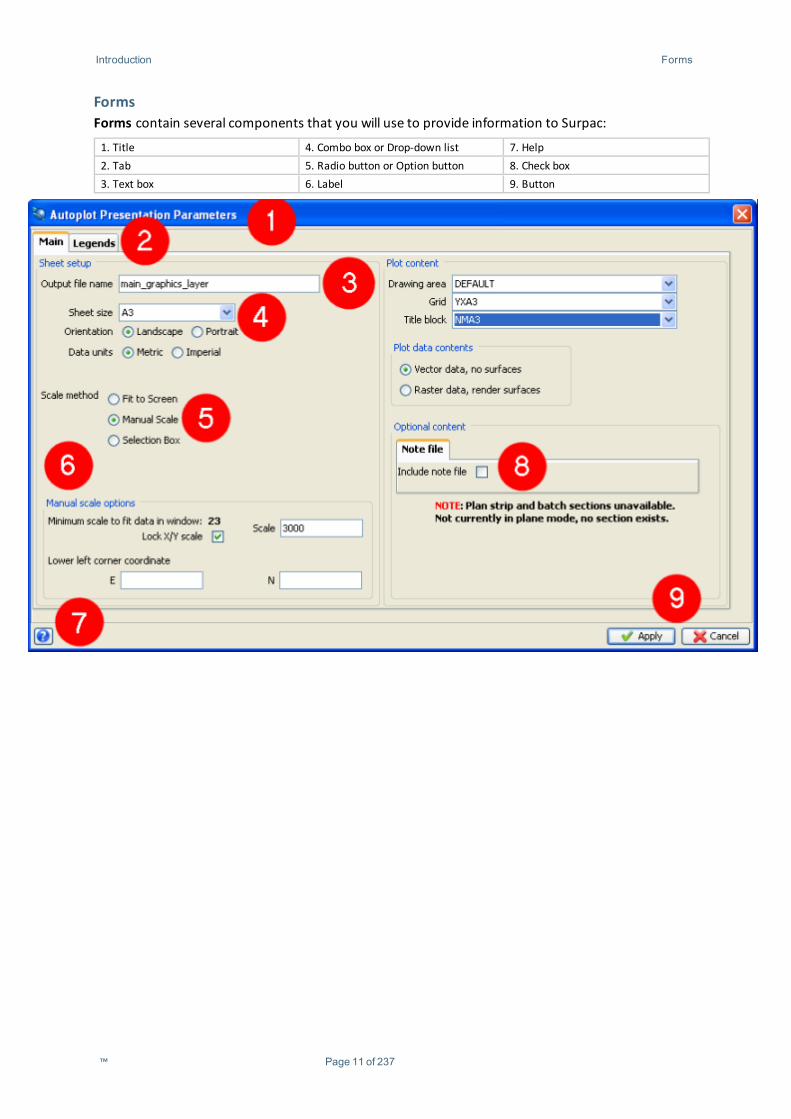
FormsForms contain several components that you will use to provide information to Surpac:
1. Title 4. Combo box or Drop-down list 7. Help2. Tab 5. Radio button or Option button 8. Check box3. Text box 6. Label 9. Button
™ Page 11 of 237
Introduction Elements of Forms
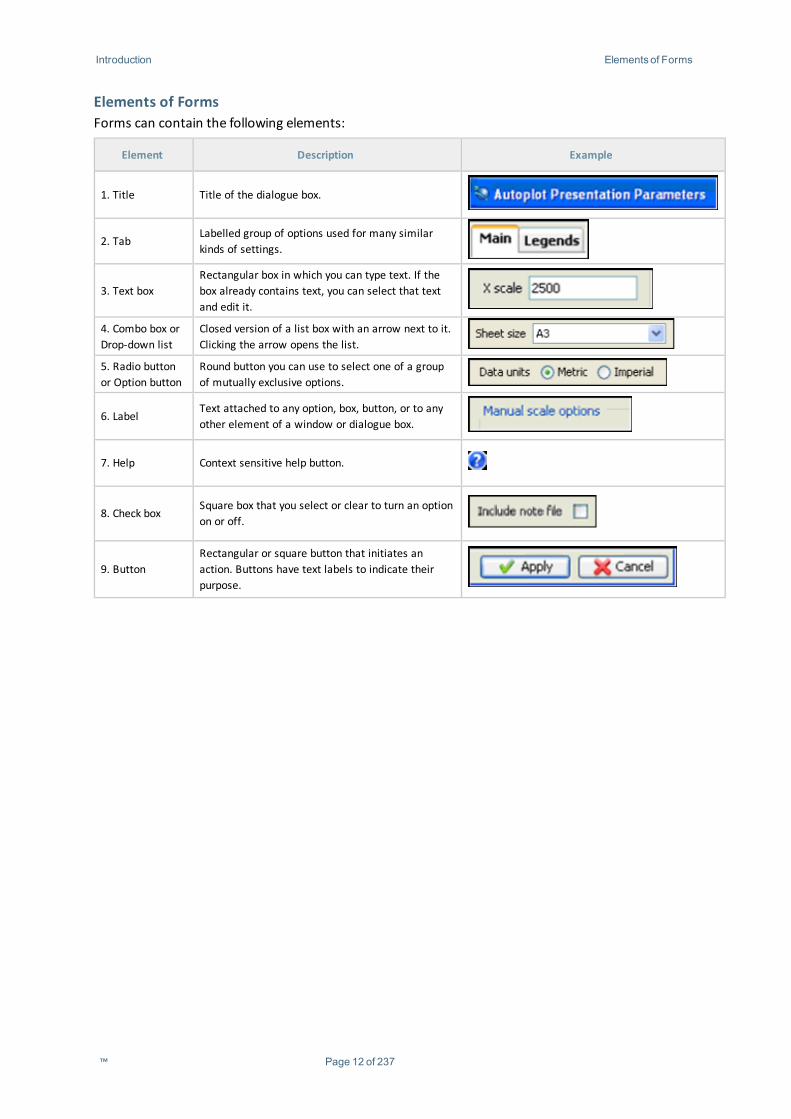
Elements of FormsForms can contain the following elements:
Element Description Example
1. Title Title of the dialogue box.
2. TabLabelled group of options used for many similarkinds of settings.
3. Text boxRectangular box in which you can type text. If thebox already contains text, you can select that textand edit it.
4. Combo box orDrop-down list
Closed version of a list box with an arrow next to it.Clicking the arrow opens the list.
5. Radio buttonor Option button
Round button you can use to select one of a groupof mutually exclusive options.
6. LabelText attached to any option, box, button, or to anyother element of a window or dialogue box.
7. Help Context sensitive help button.
8. Check boxSquare box that you select or clear to turn an optionon or off.
9. ButtonRectangular or square button that initiates anaction. Buttons have text labels to indicate theirpurpose.
™ Page 12 of 237
Getting Started Activity: Install Surpac
Getting Started
Installing Surpac v6.2 from a CD
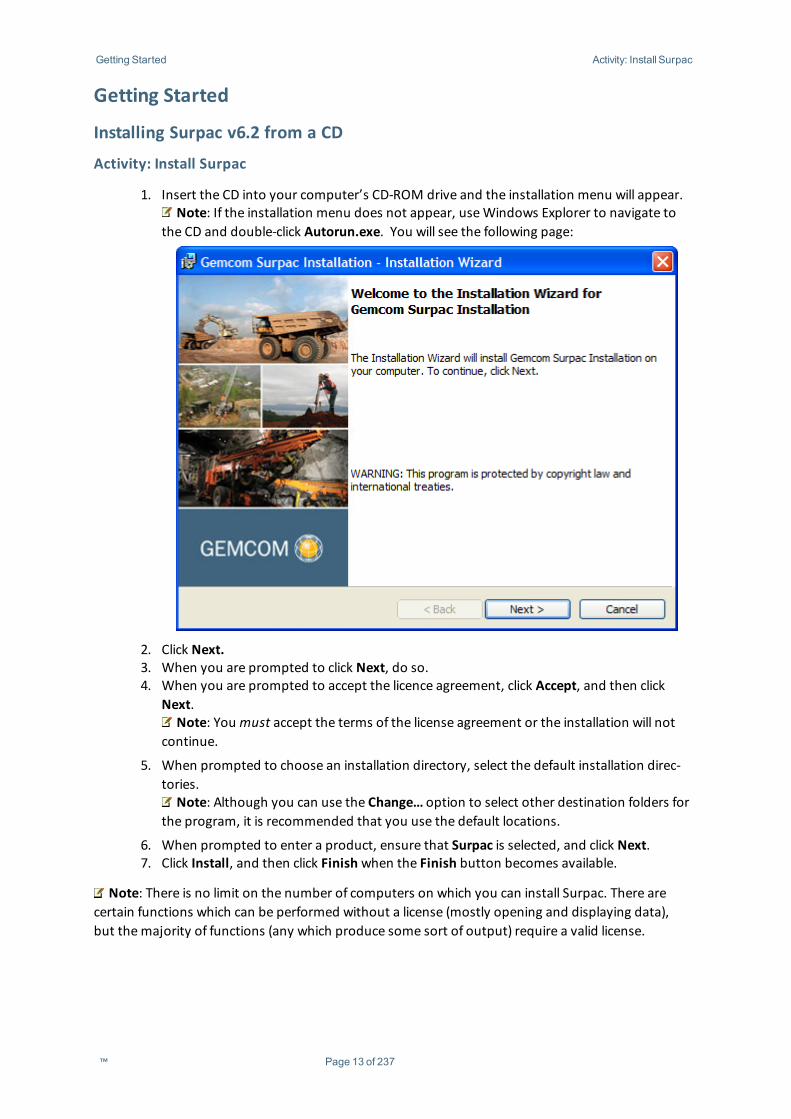
Activity: Install Surpac
1. Insert the CD into your computer’s CD-ROM drive and the installation menu will appear.Note: If the installation menu does not appear, useWindows Explorer to navigate to
the CD and double-click Autorun.exe. You will see the following page:
2. Click Next.3. When you are prompted to click Next, do so.4. When you are prompted to accept the licence agreement, click Accept, and then click
Next.Note: Youmust accept the terms of the license agreement or the installation will not
continue.
5. When prompted to choose an installation directory, select the default installation direc-tories.
Note: Although you can use the Change… option to select other destination folders forthe program, it is recommended that you use the default locations.
6. When prompted to enter a product, ensure that Surpac is selected, and click Next.7. Click Install, and then click Finishwhen the Finish button becomes available.
Note: There is no limit on the number of computers on which you can install Surpac. There arecertain functions which can be performed without a license (mostly opening and displaying data),but themajority of functions (any which produce some sort of output) require a valid license.
™ Page 13 of 237
Getting Started Activity: Start Surpac
Starting Surpac
Activity: Start Surpac
Start Surpac, using either of thesemethods:
l Double-click the Surpac icon on your desktop.l Click Start, select All Programs, and then Gemcom Software, and then Surpac 6.1.
Licencing SurpacThe instructions below are for installing a single user licence. In order to proceed, you will need:
l Surpac v6.2 installed, as previously described.l AUSB or parallel sentinel.l A valid token number.
If you do not have all of these, please contact your local support office.
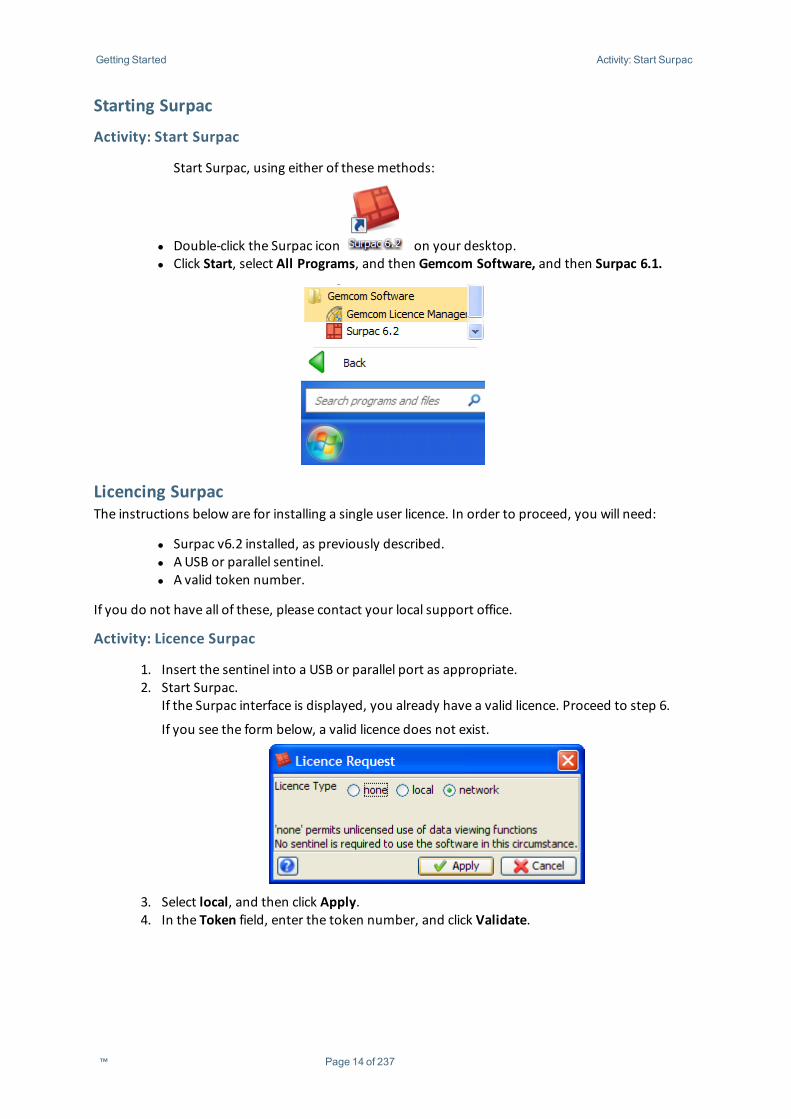
Activity: Licence Surpac
1. Insert the sentinel into a USB or parallel port as appropriate.2. Start Surpac.
If the Surpac interface is displayed, you already have a valid licence. Proceed to step 6.
If you see the form below, a valid licence does not exist.
3. Select local, and then click Apply.4. In the Token field, enter the token number, and click Validate.
™ Page 14 of 237
Getting Started Activity: Licence Surpac
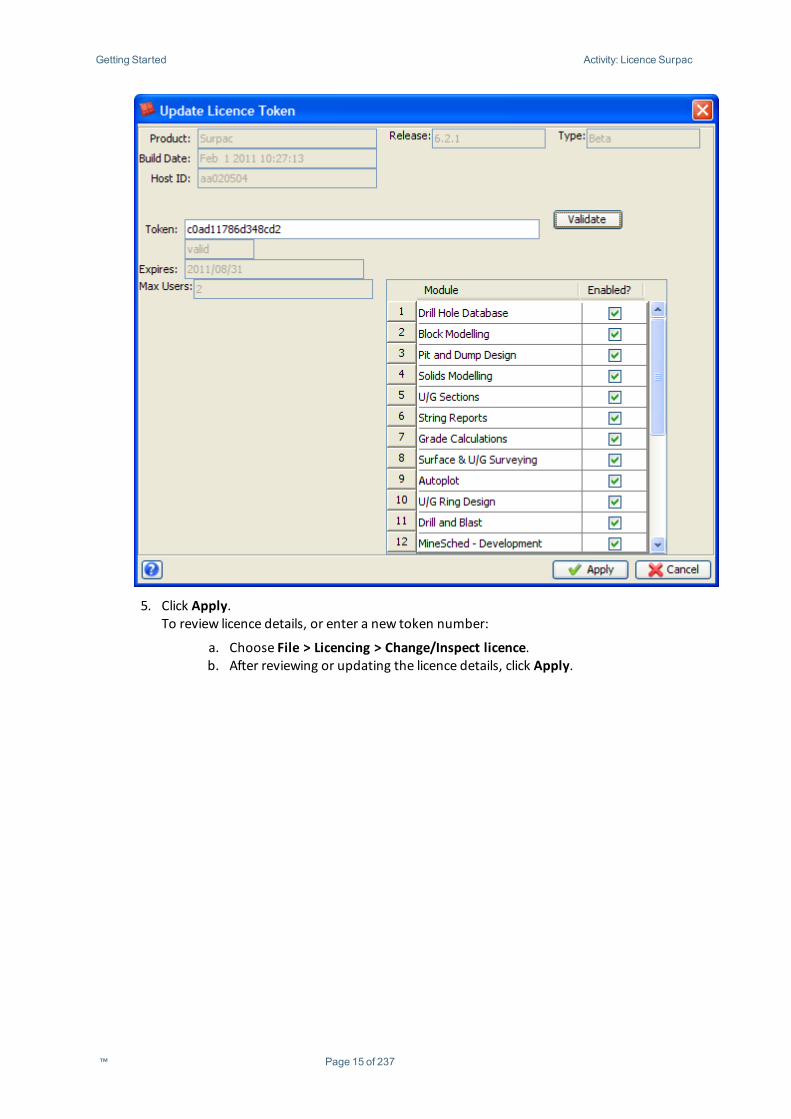
5. Click Apply.To review licence details, or enter a new token number:
a. Choose File > Licencing > Change/Inspect licence.b. After reviewing or updating the licence details, click Apply.
™ Page 15 of 237
Getting Started Activity: Set theWorkDirectory (WindowsXP)
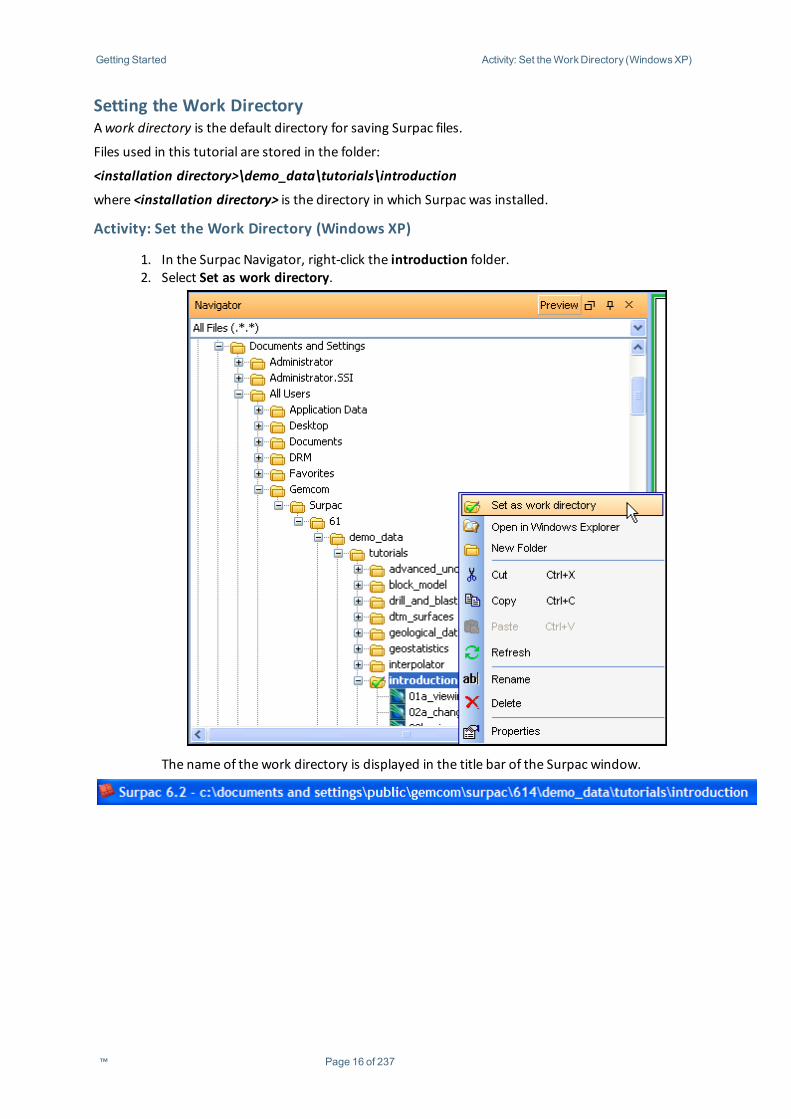
Setting the Work DirectoryAwork directory is the default directory for saving Surpac files.
Files used in this tutorial are stored in the folder:
<installation directory>\demo_data\tutorials\introduction
where <installation directory> is the directory in which Surpac was installed.
Activity: Set the Work Directory (Windows XP)
1. In the Surpac Navigator, right-click the introduction folder.2. Select Set as work directory.
The name of the work directory is displayed in the title bar of the Surpac window.
™ Page 16 of 237
Getting Started Activity: Set theWorkDirectory (WindowsVista or Windows7)
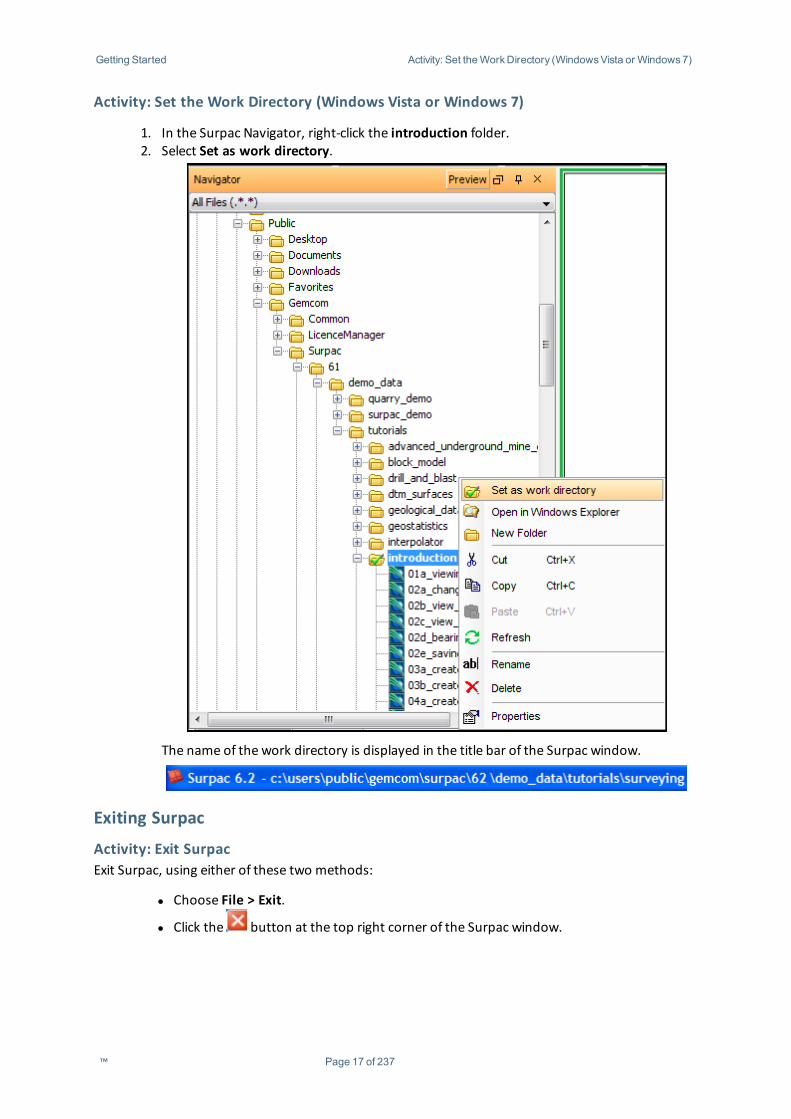
Activity: Set the Work Directory (Windows Vista or Windows 7)
1. In the Surpac Navigator, right-click the introduction folder.2. Select Set as work directory.
The name of the work directory is displayed in the title bar of the Surpac window.
Exiting Surpac
Activity: Exit SurpacExit Surpac, using either of these two methods:
l Choose File > Exit.
l Click the button at the top right corner of the Surpac window.
™ Page 17 of 237
Getting Started Activity: Modify the Surpac Icon to Set theWorkDirectoryAutomatically
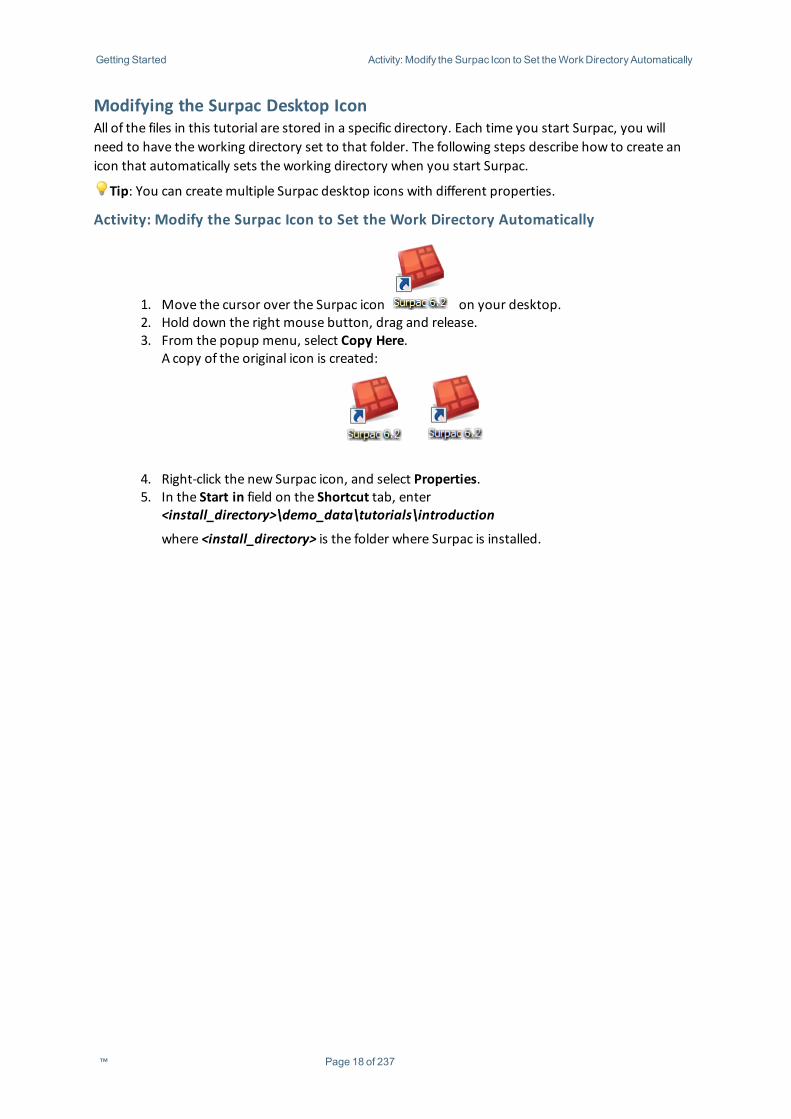
Modifying the Surpac Desktop IconAll of the files in this tutorial are stored in a specific directory. Each time you start Surpac, you willneed to have the working directory set to that folder. The following steps describe how to create anicon that automatically sets the working directory when you start Surpac.
Tip: You can createmultiple Surpac desktop icons with different properties.
Activity: Modify the Surpac Icon to Set the Work Directory Automatically
1. Move the cursor over the Surpac icon on your desktop.2. Hold down the right mouse button, drag and release.3. From the popup menu, select Copy Here.
A copy of the original icon is created:
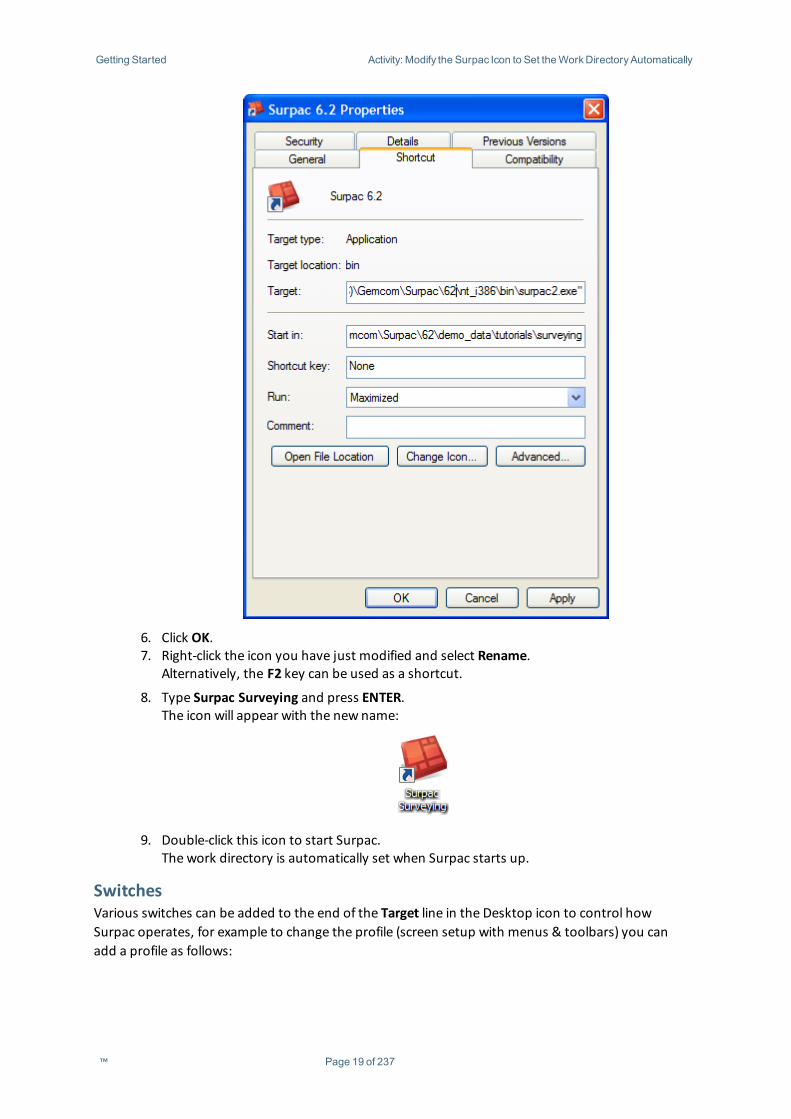
4. Right-click the new Surpac icon, and select Properties.5. In the Start in field on the Shortcut tab, enter
<install_directory>\demo_data\tutorials\introduction
where <install_directory> is the folder where Surpac is installed.
™ Page 18 of 237
Getting Started Activity: Modify the Surpac Icon to Set theWorkDirectoryAutomatically
6. Click OK.7. Right-click the icon you have just modified and select Rename.
Alternatively, the F2 key can be used as a shortcut.
8. Type Surpac Surveying and press ENTER.The icon will appear with the new name:
9. Double-click this icon to start Surpac.The work directory is automatically set when Surpac starts up.
SwitchesVarious switches can be added to the end of the Target line in the Desktop icon to control howSurpac operates, for example to change the profile (screen setup with menus & toolbars) you canadd a profile as follows:
™ Page 19 of 237
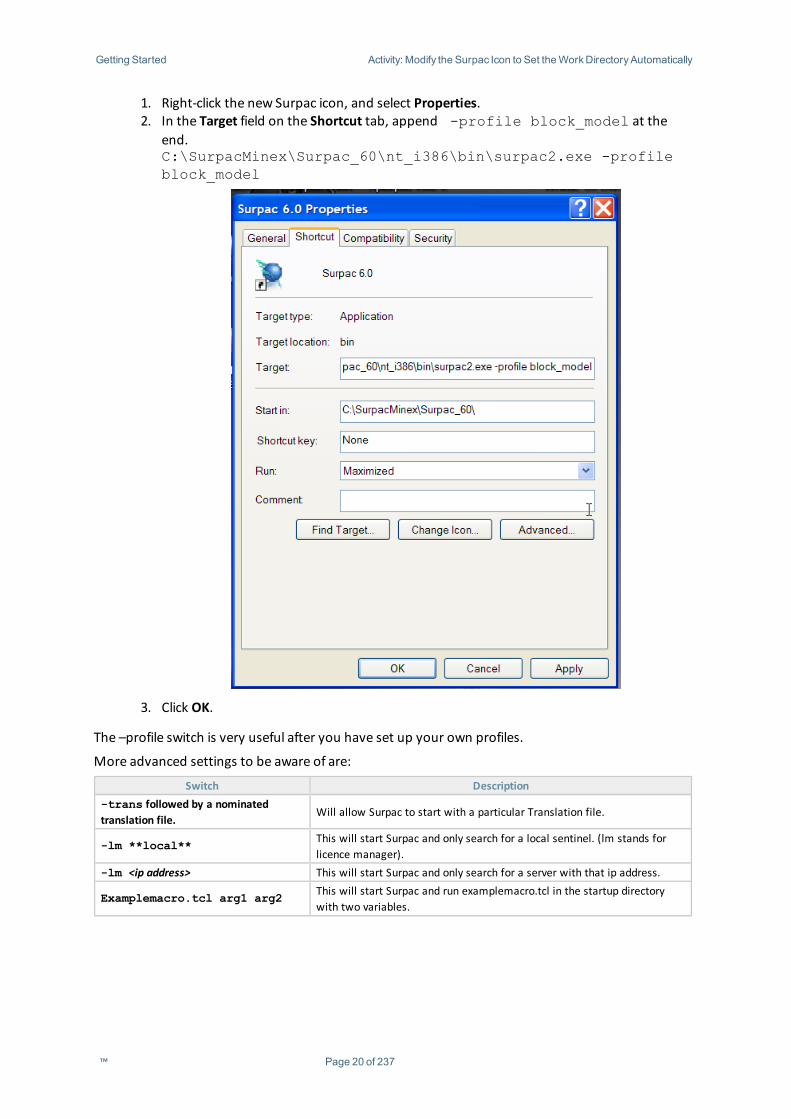
Getting Started Activity: Modify the Surpac Icon to Set theWorkDirectoryAutomatically
1. Right-click the new Surpac icon, and select Properties.2. In the Target field on the Shortcut tab, append -profile block_model at the
end.C:\SurpacMinex\Surpac_60\nt_i386\bin\surpac2.exe -profileblock_model
3. Click OK.
The –profile switch is very useful after you have set up your own profiles.
More advanced settings to be aware of are:
Switch Description-trans followed by a nominatedtranslation file.
Will allow Surpac to start with a particular Translation file.
-lm **local** This will start Surpac and only search for a local sentinel. (lm stands forlicence manager).
-lm <ip address> This will start Surpac and only search for a server with that ip address.
Examplemacro.tcl arg1 arg2 This will start Surpac and run examplemacro.tcl in the startup directorywith two variables.
™ Page 20 of 237

Getting Started Questions
Review
Questions
1. What is a working directory?2. What does modifing the 'Start in:' line in the Surpac icon properties do?3. Why would you want to havemultiple desktop icons for the same version of Surpac?4. Does Surpac need a valid surpac dongle/network license to run?5. On howmany computers can Surpac be installed?6. What is needed to run a licensed copy of Surpac?
Exercises
1. Determine if your copy of Surpac is licensed for a particular module.A. Start Surpac.B. Choose File>Licencing>Change /Inspect Licence.C. View the current licensing details.
Question:
i. Is your copy of Surpac licensed to use the Autoplot module?2. Run Surpac without a license.
A. Start Surpac.B. Choose File>Licencing>Change /Inspect Licence.C. When the License Request form is displayed, select none.D. In the function chooser, type: FUNCTION LIST, and press Enter.E. In the current working directory, open the file surpac2.txt.
All of the functions available without a licence are listed under the nonemod-ule.
Questions:
Use the file surpac2.txt to answer the following questions.
i. Can you display a 2D grid without a Surpac license?ii. Can you run Autoplot without a license?
3. Start Surpac in a specific folder from a desktop icon.A. Exit Surpac.B. Using Windows Explorer, create a new folder (for example: C:\MyData).C. Create a new icon on the desktop by copying and pasting an existing icon.D. Right click on the new icon and choose Properties.E. Edit the Properties so that Surpac automatically starts in theMyData folder.F. Change the name on the icon to Surpac _MyData.G. Double-click the icon.
Question:
i. Does Surpac start up in the correct folder?ii. Setup the Surpac icon to look for a local licence only.A. Exit Surpac.B. Right click on the Surpac icon and choose Properties.C. Edit the Target line, by appending the LicenceManager "local" switch.D. Start up Surpac.
Question:
i. Under what circumstances would you need to use the licenseManager "local"switch?
™ Page 21 of 237
SurpacConcepts Exercises
Surpac Concepts
OverviewIn this chapter, you will learn about:
l Surpac data types.l Function-centric vs data-centric operations.
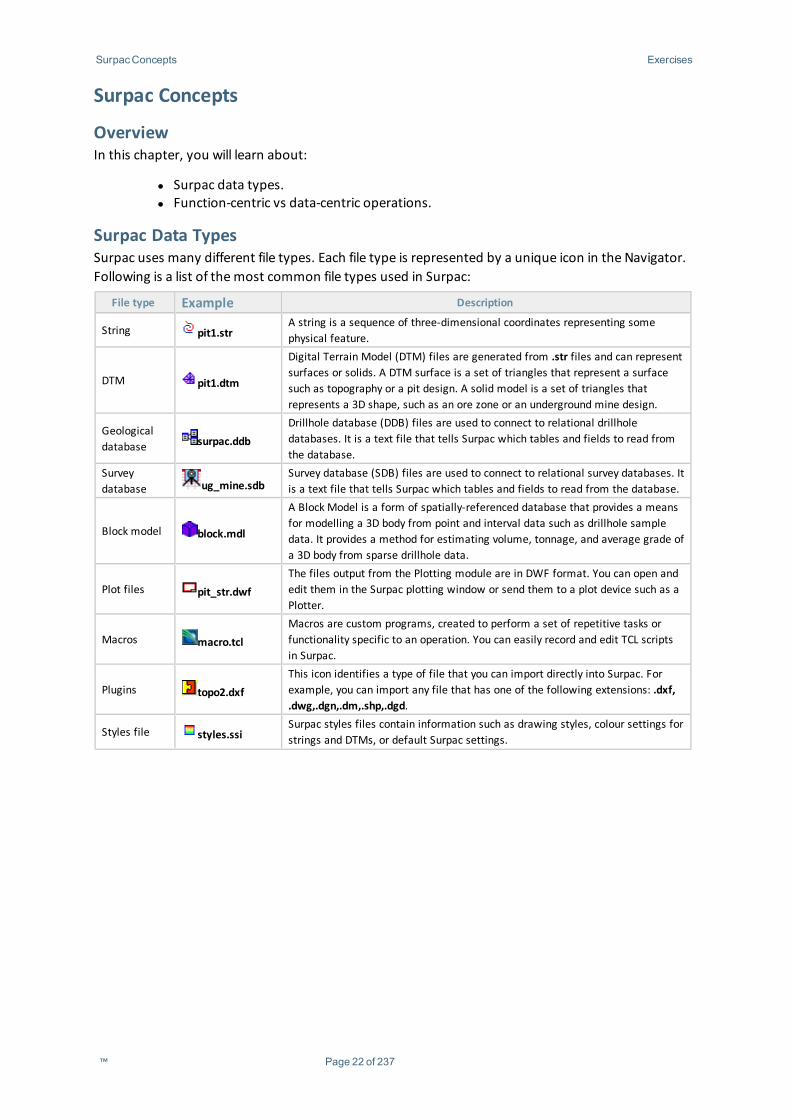
Surpac Data TypesSurpac uses many different file types. Each file type is represented by a unique icon in the Navigator.Following is a list of themost common file types used in Surpac:
File type Example Description
String pit1.strA string is a sequence of three-dimensional coordinates representing somephysical feature.
DTM pit1.dtm
Digital Terrain Model (DTM) files are generated from .str files and can representsurfaces or solids. A DTM surface is a set of triangles that represent a surfacesuch as topography or a pit design. A solid model is a set of triangles thatrepresents a 3D shape, such as an ore zone or an underground mine design.
Geologicaldatabase surpac.ddb
Drillhole database (DDB) files are used to connect to relational drillholedatabases. It is a text file that tells Surpac which tables and fields to read fromthe database.
Surveydatabase ug_mine.sdb
Survey database (SDB) files are used to connect to relational survey databases. Itis a text file that tells Surpac which tables and fields to read from the database.
Block model block.mdl
A Block Model is a form of spatially-referenced database that provides a meansfor modelling a 3D body from point and interval data such as drillhole sampledata. It provides a method for estimating volume, tonnage, and average grade ofa 3D body from sparse drillhole data.
Plot files pit_str.dwfThe files output from the Plotting module are in DWF format. You can open andedit them in the Surpac plotting window or send them to a plot device such as aPlotter.
Macros macro.tclMacros are custom programs, created to perform a set of repetitive tasks orfunctionality specific to an operation. You can easily record and edit TCL scriptsin Surpac.
Plugins topo2.dxfThis icon identifies a type of file that you can import directly into Surpac. Forexample, you can import any file that has one of the following extensions: .dxf,.dwg,.dgn,.dm,.shp,.dgd.
Styles file styles.ssiSurpac styles files contain information such as drawing styles, colour settings forstrings and DTMs, or default Surpac settings.
™ Page 22 of 237
SurpacConcepts Function-centric
Function-centric vs Data-centric OperationsMany graphical operations in Surpac can be performed more quickly via a data-centric approach - byselecting the data first, then specifying an operation to be performed on the data.
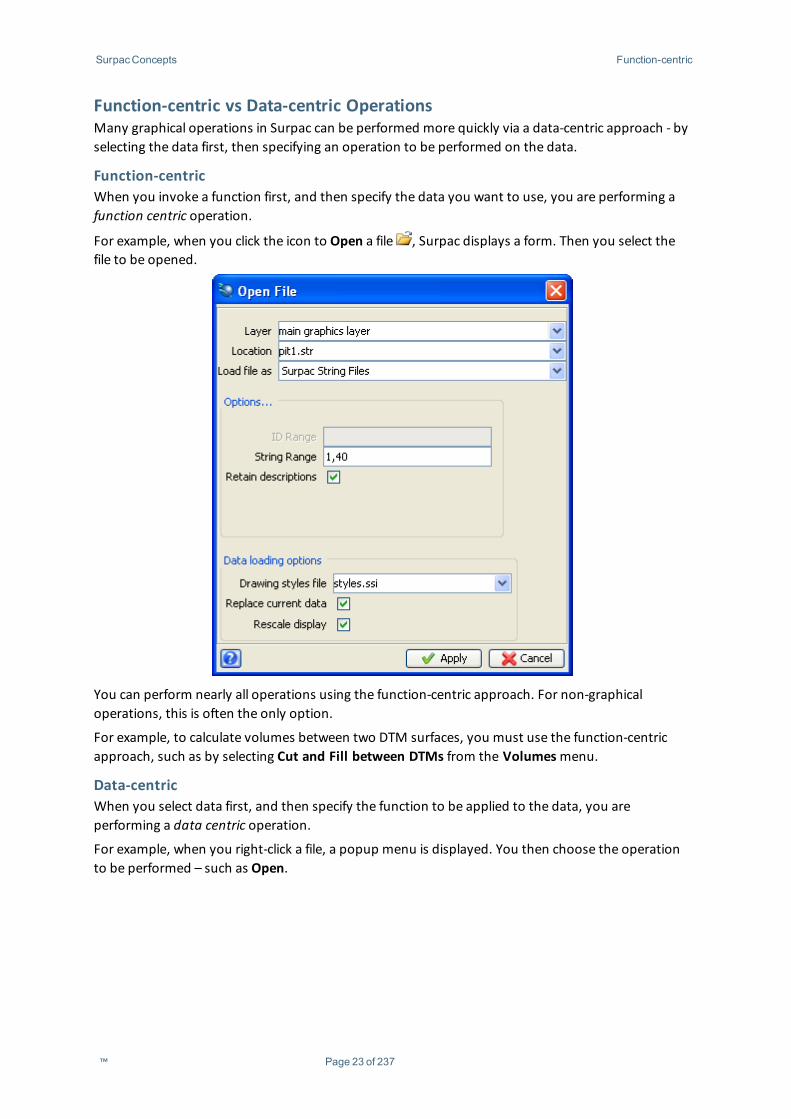
Function-centricWhen you invoke a function first, and then specify the data you want to use, you are performing afunction centric operation.
For example, when you click the icon to Open a file , Surpac displays a form. Then you select thefile to be opened.
You can perform nearly all operations using the function-centric approach. For non-graphicaloperations, this is often the only option.
For example, to calculate volumes between two DTM surfaces, you must use the function-centricapproach, such as by selecting Cut and Fill between DTMs from the Volumesmenu.
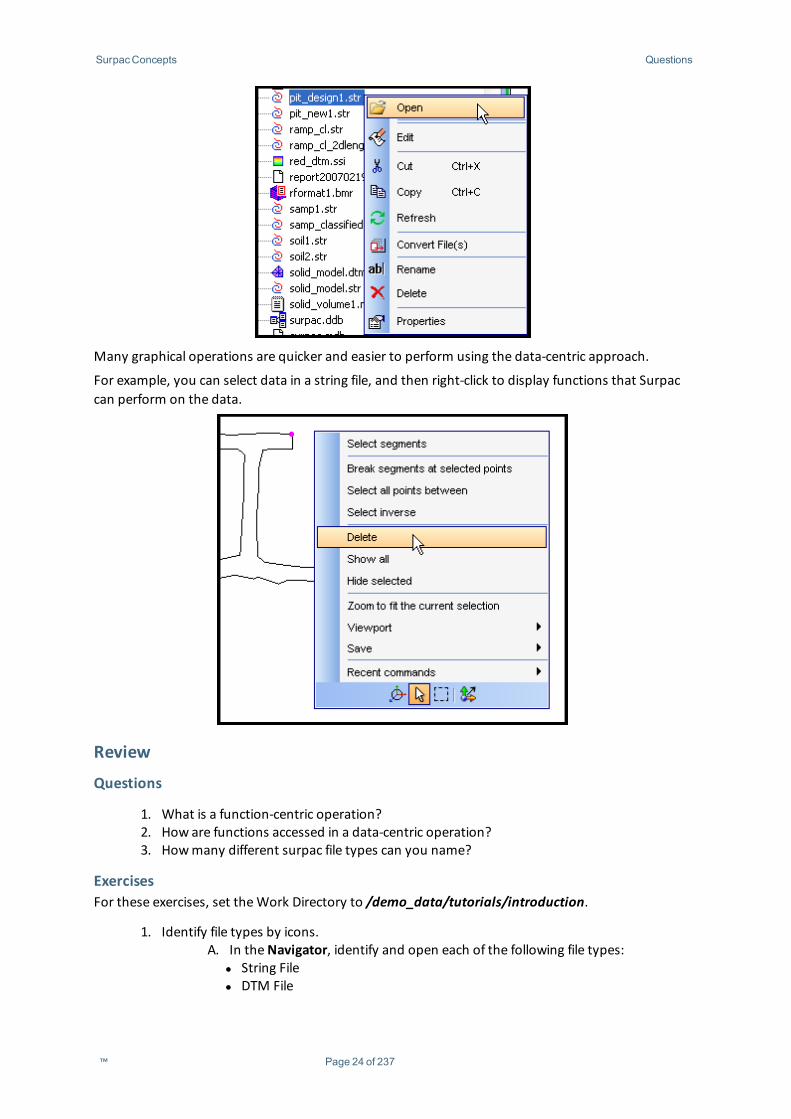
Data-centricWhen you select data first, and then specify the function to be applied to the data, you areperforming a data centric operation.
For example, when you right-click a file, a popup menu is displayed. You then choose the operationto be performed – such as Open.
™ Page 23 of 237
SurpacConcepts Questions
Many graphical operations are quicker and easier to perform using the data-centric approach.
For example, you can select data in a string file, and then right-click to display functions that Surpaccan perform on the data.
Review
Questions
1. What is a function-centric operation?2. How are functions accessed in a data-centric operation?3. Howmany different surpac file types can you name?
ExercisesFor these exercises, set theWork Directory to /demo_data/tutorials/introduction.
1. Identify file types by icons.A. In theNavigator, identify and open each of the following file types:
l String Filel DTM File
™ Page 24 of 237

SurpacConcepts Exercises
l Block Modell Geological Database.
2. Selecting data in graphics.A. Open bench105.str into Graphics.B. Using the select tool, select a segment.C. Right click in Graphics.
Question:
i. What happens to the way a segment is displayed when it is selected?3. More selecting.
A. Using the same data in Graphics.B. Using the select tool, select a point.C. Right click in Graphics.
Question:
i. Are the data-centric options the same for selecting a point or a segment?
™ Page 25 of 237
The Surpac Interface Exercises
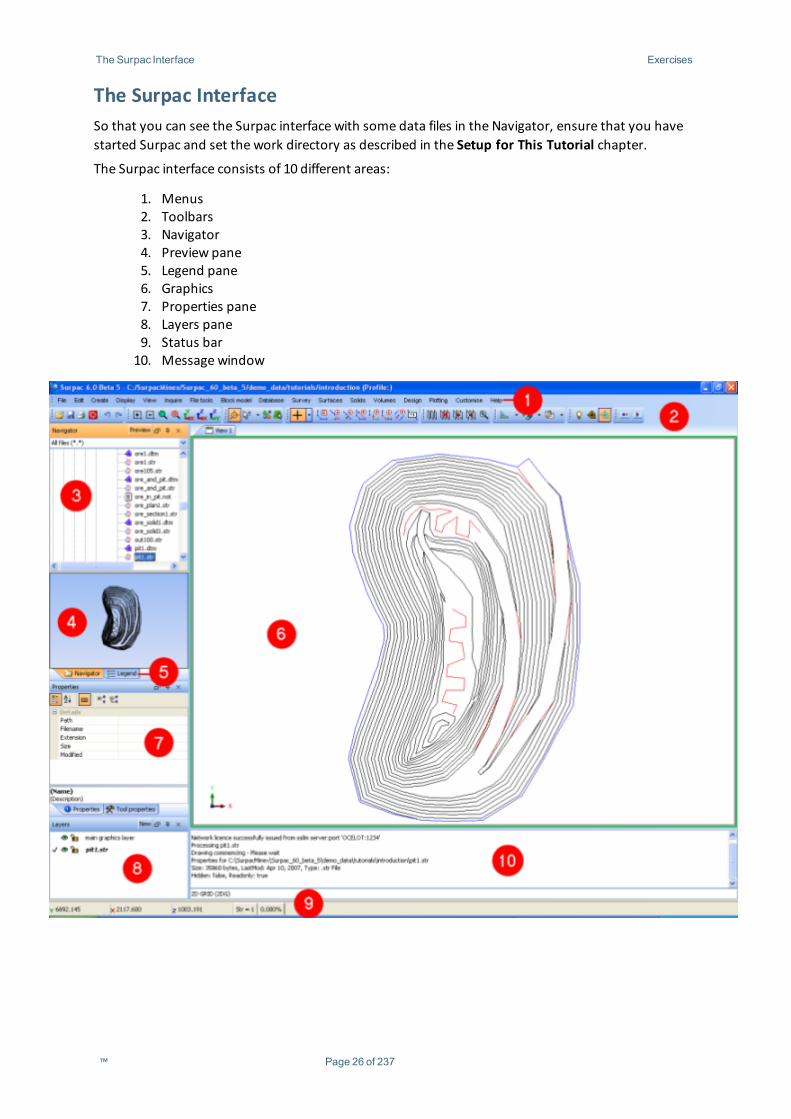
The Surpac InterfaceSo that you can see the Surpac interface with some data files in the Navigator, ensure that you havestarted Surpac and set the work directory as described in the Setup for This Tutorial chapter.
The Surpac interface consists of 10 different areas:
1. Menus2. Toolbars3. Navigator4. Preview pane5. Legend pane6. Graphics7. Properties pane8. Layers pane9. Status bar10. Message window
™ Page 26 of 237
The Surpac Interface Activity: Open a File Using theMenu
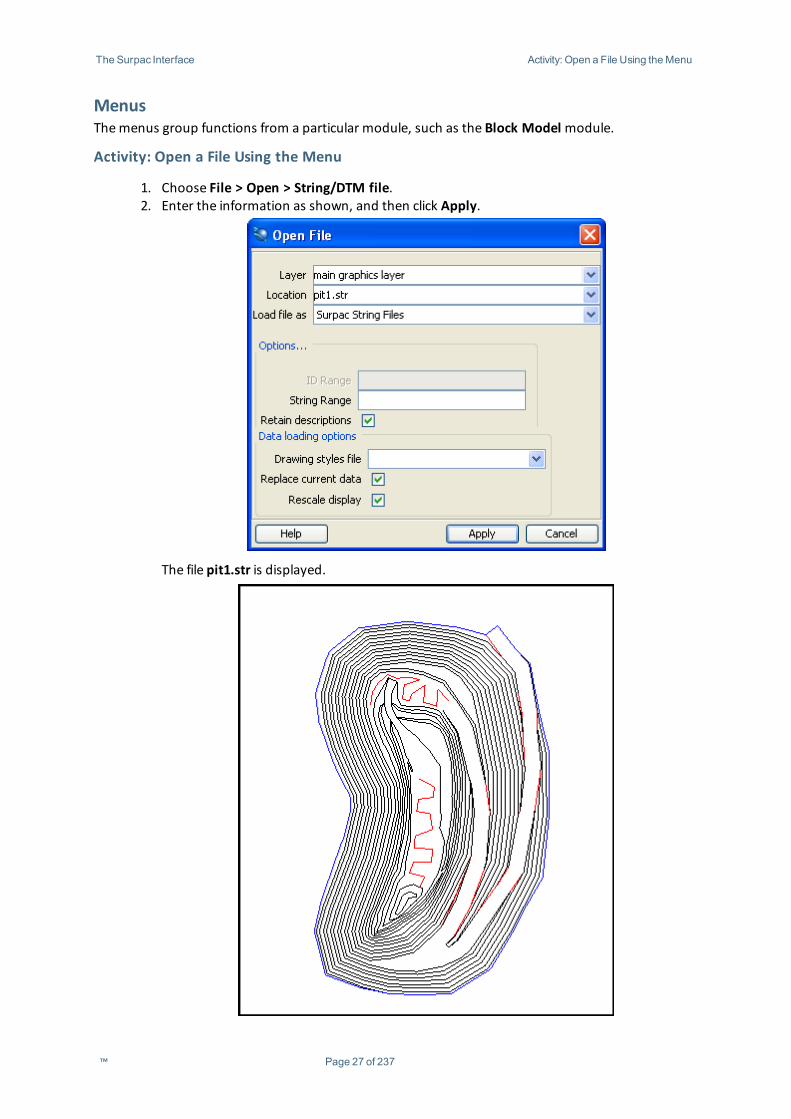
MenusThemenus group functions from a particular module, such as the Block Modelmodule.
Activity: Open a File Using the Menu
1. Choose File > Open > String/DTM file.2. Enter the information as shown, and then click Apply.
The file pit1.str is displayed.
™ Page 27 of 237
The Surpac Interface Activity: Use the Reset GraphicsButton from the Toolbar
ToolbarsA toolbar is a collection of icons that have related functions. Toolbars allow you to access commonlyused functions directly, without the need to search through themenus.
Activity: Use the Reset Graphics Button from the Toolbar
1. Open pit1.str in graphics.2. Click the Reset graphics icon .
This function removes all the data that is displayed in graphics.
If data has been modified, Surpac will display a form to allow you to save the file. This isdescribed in detail in the chapter Viewing and Saving Data.
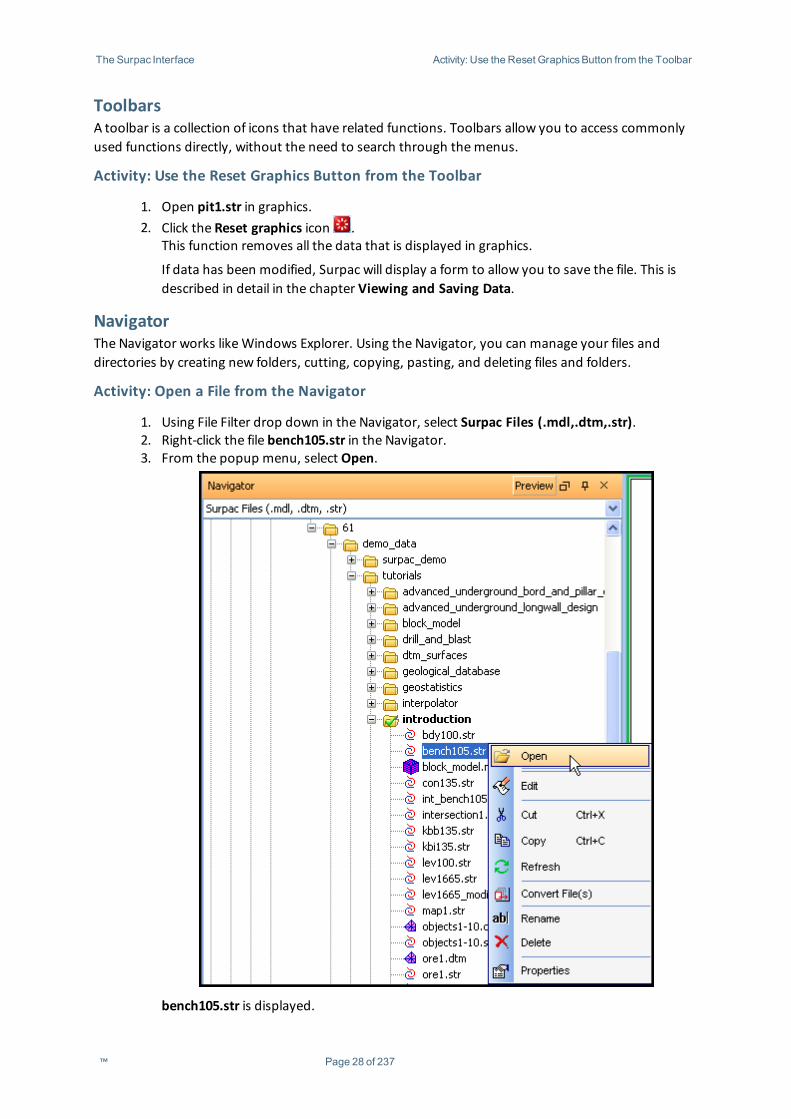
NavigatorThe Navigator works likeWindows Explorer. Using the Navigator, you can manage your files anddirectories by creating new folders, cutting, copying, pasting, and deleting files and folders.
Activity: Open a File from the Navigator
1. Using File Filter drop down in the Navigator, select Surpac Files (.mdl,.dtm,.str).2. Right-click the file bench105.str in the Navigator.3. From the popup menu, select Open.
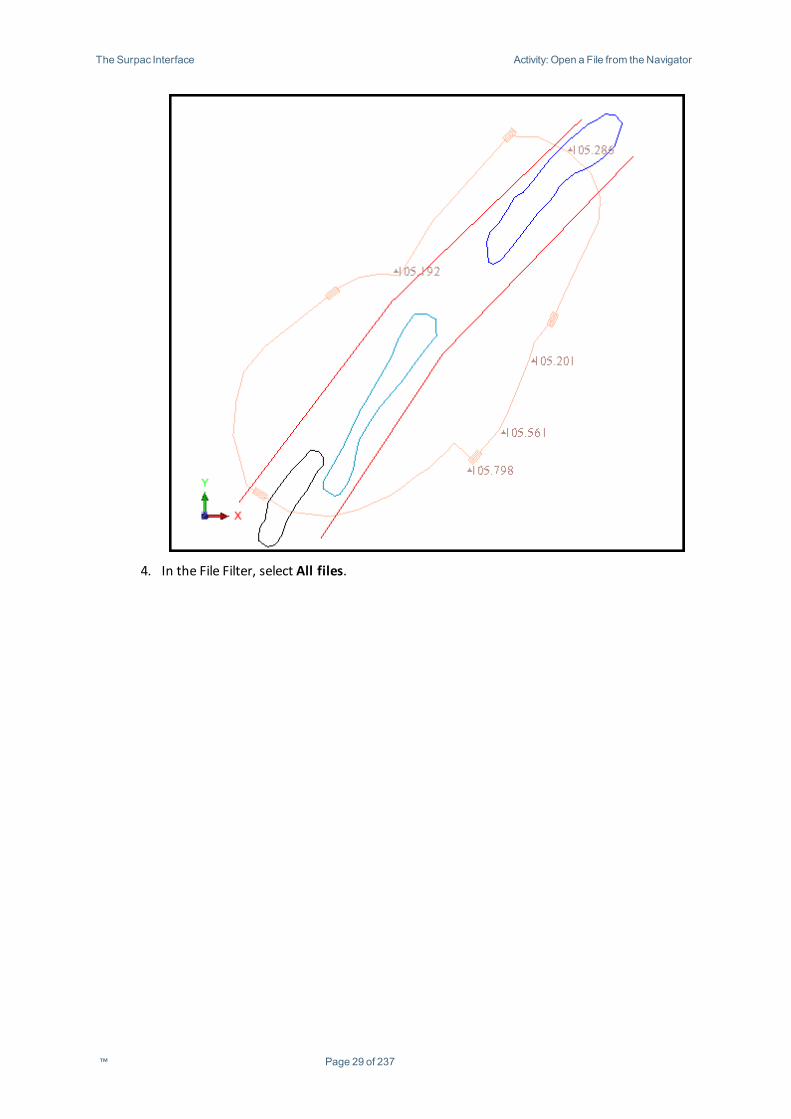
bench105.str is displayed.
™ Page 28 of 237
The Surpac Interface Activity: Open a File from the Navigator
4. In the File Filter, select All files.
™ Page 29 of 237
The Surpac Interface Activity: Displaya String File in the Preview Pane
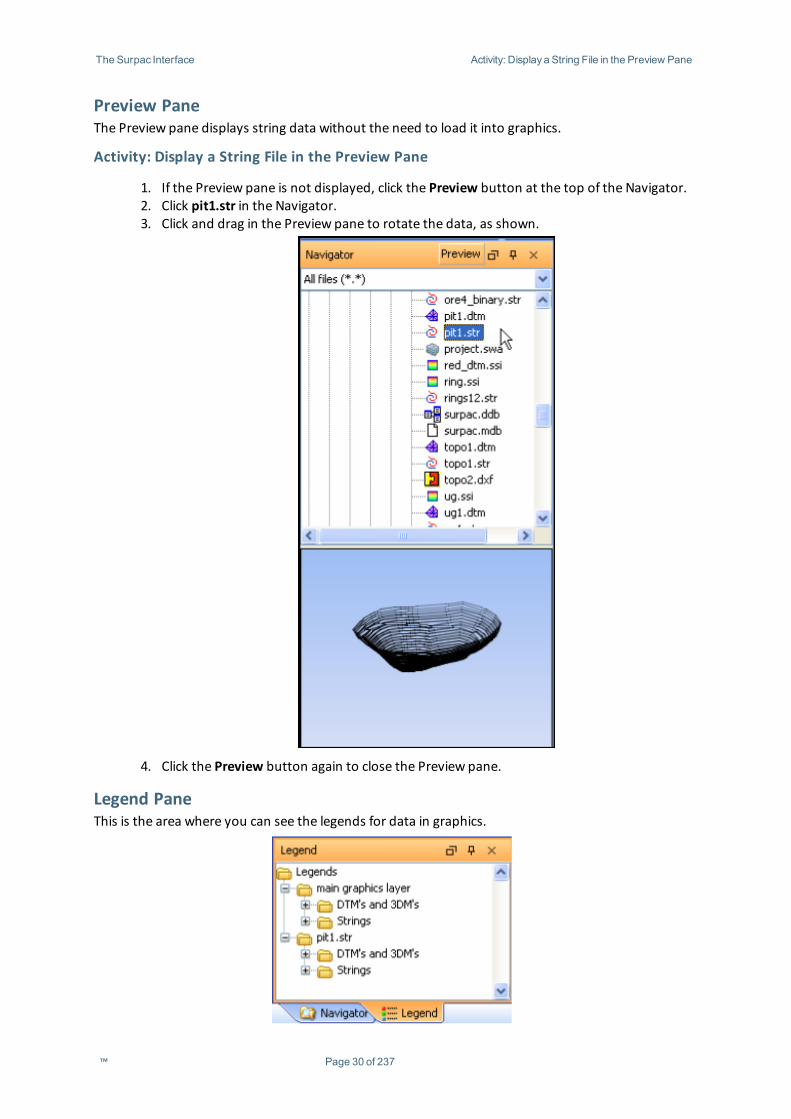
Preview PaneThe Preview pane displays string data without the need to load it into graphics.
Activity: Display a String File in the Preview Pane
1. If the Preview pane is not displayed, click the Preview button at the top of the Navigator.2. Click pit1.str in the Navigator.3. Click and drag in the Preview pane to rotate the data, as shown.
4. Click the Preview button again to close the Preview pane.
Legend PaneThis is the area where you can see the legends for data in graphics.
™ Page 30 of 237
The Surpac Interface Activity: Displayand View Data in Graphics
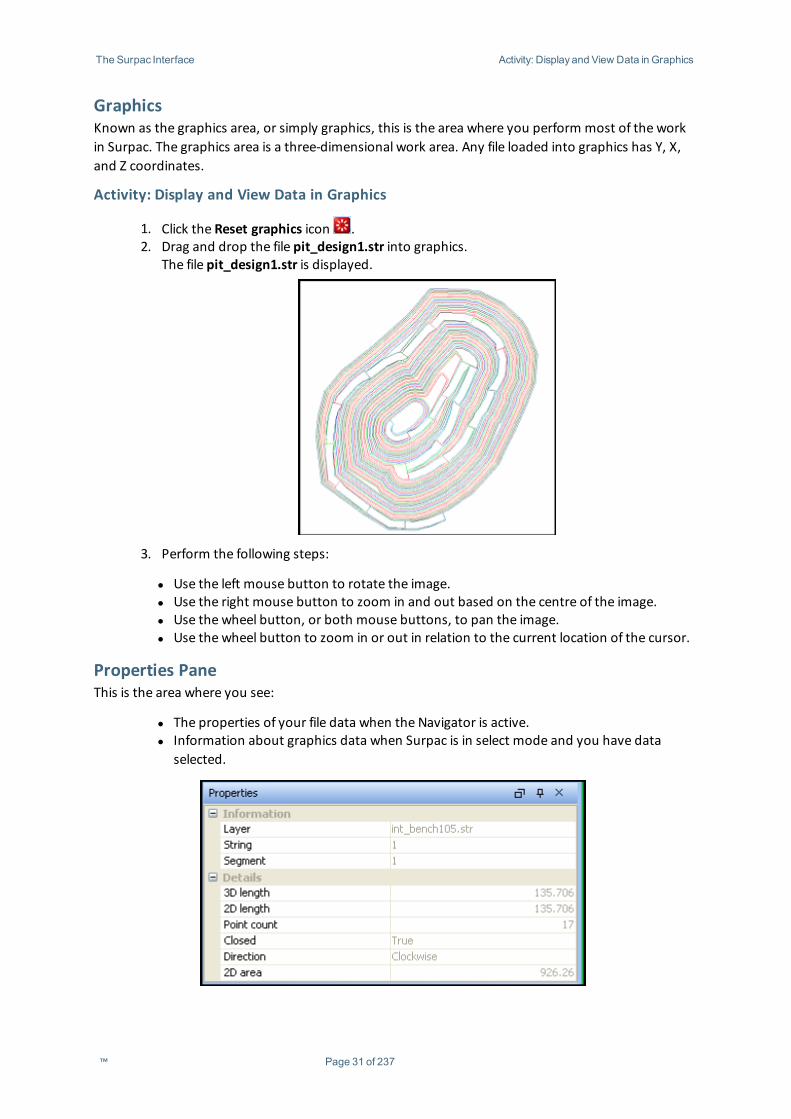
GraphicsKnown as the graphics area, or simply graphics, this is the area where you perform most of the workin Surpac. The graphics area is a three-dimensional work area. Any file loaded into graphics has Y, X,and Z coordinates.
Activity: Display and View Data in Graphics
1. Click the Reset graphics icon .2. Drag and drop the file pit_design1.str into graphics.
The file pit_design1.str is displayed.
3. Perform the following steps:
l Use the left mouse button to rotate the image.l Use the right mouse button to zoom in and out based on the centre of the image.l Use the wheel button, or both mouse buttons, to pan the image.l Use the wheel button to zoom in or out in relation to the current location of the cursor.
Properties PaneThis is the area where you see:
l The properties of your file data when the Navigator is active.l Information about graphics data when Surpac is in select mode and you have data
selected.
™ Page 31 of 237
The Surpac Interface Activity: View Changes to the StatusArea
Layers PaneThis is the area where you manage your data in layers. This is described in detail in the chapterManaging Data in Layers.
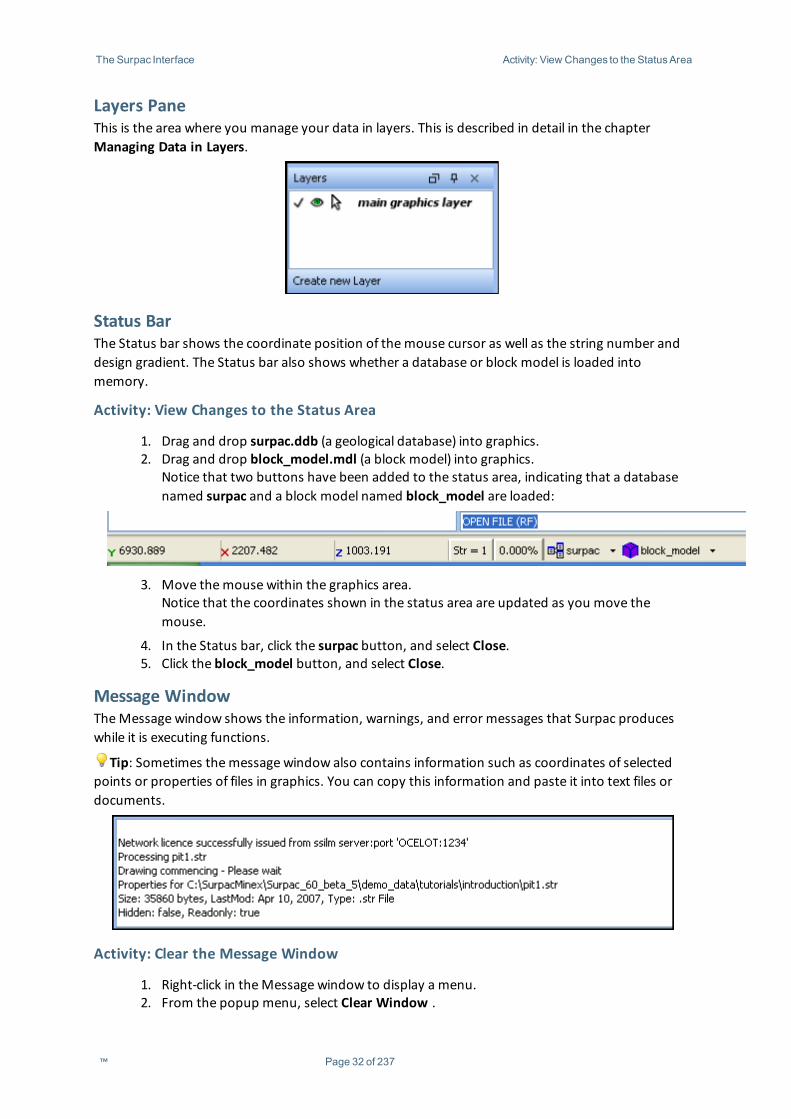
Status BarThe Status bar shows the coordinate position of themouse cursor as well as the string number anddesign gradient. The Status bar also shows whether a database or block model is loaded intomemory.
Activity: View Changes to the Status Area
1. Drag and drop surpac.ddb (a geological database) into graphics.2. Drag and drop block_model.mdl (a block model) into graphics.
Notice that two buttons have been added to the status area, indicating that a databasenamed surpac and a block model named block_model are loaded:
3. Move themouse within the graphics area.Notice that the coordinates shown in the status area are updated as you move themouse.
4. In the Status bar, click the surpac button, and select Close.5. Click the block_model button, and select Close.
Message WindowTheMessage window shows the information, warnings, and error messages that Surpac produceswhile it is executing functions.
Tip: Sometimes themessage window also contains information such as coordinates of selectedpoints or properties of files in graphics. You can copy this information and paste it into text files ordocuments.
Activity: Clear the Message Window
1. Right-click in theMessage window to display a menu.2. From the popup menu, select Clear Window .
™ Page 32 of 237
The Surpac Interface Activity:Workwith Multiple Viewports
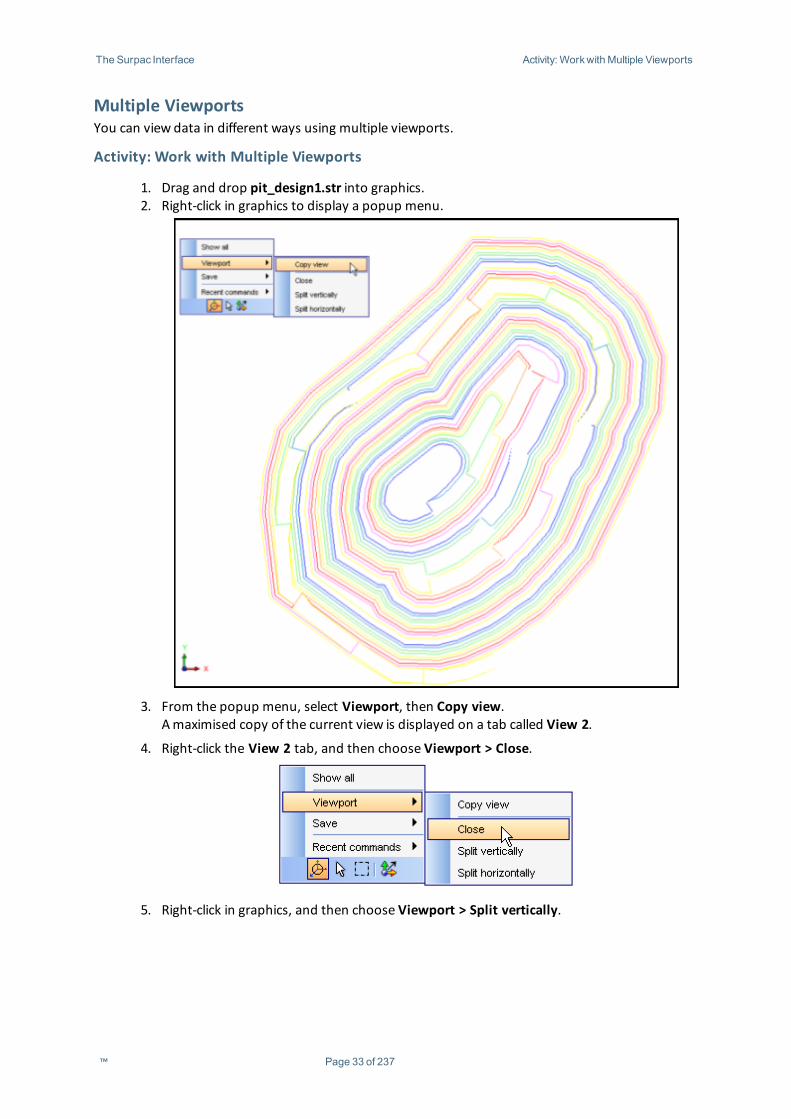
Multiple ViewportsYou can view data in different ways using multiple viewports.
Activity: Work with Multiple Viewports
1. Drag and drop pit_design1.str into graphics.2. Right-click in graphics to display a popup menu.
3. From the popup menu, select Viewport, then Copy view.Amaximised copy of the current view is displayed on a tab called View 2.
4. Right-click the View 2 tab, and then choose Viewport > Close.
5. Right-click in graphics, and then choose Viewport > Split vertically.
™ Page 33 of 237
The Surpac Interface Activity:Workwith Multiple Viewports
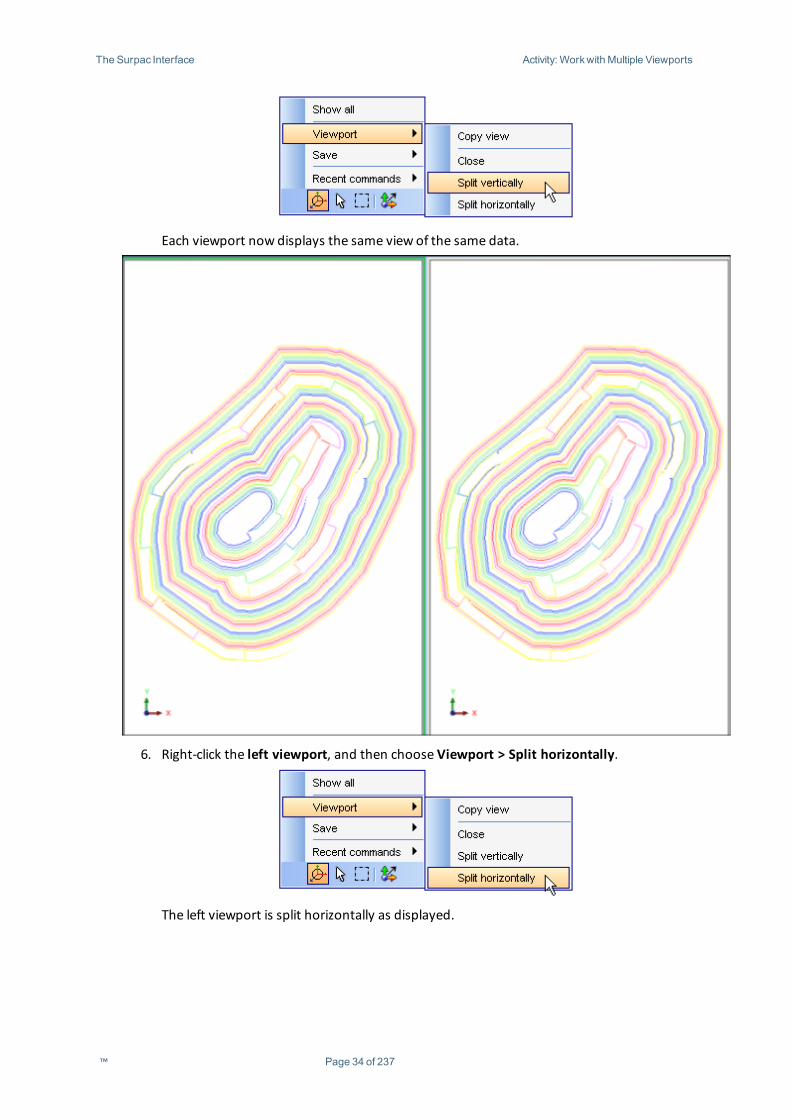
Each viewport now displays the same view of the same data.
6. Right-click the left viewport, and then choose Viewport > Split horizontally.
The left viewport is split horizontally as displayed.
™ Page 34 of 237
The Surpac Interface Activity:Workwith Multiple Viewports
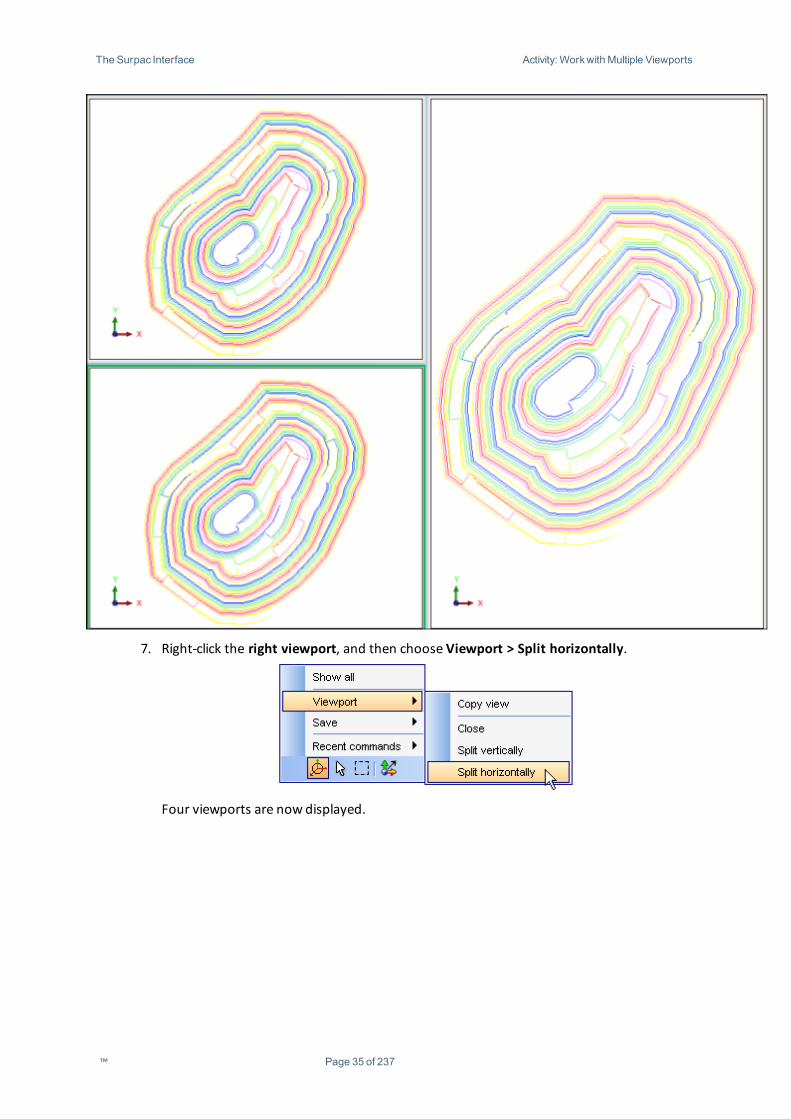
7. Right-click the right viewport, and then choose Viewport > Split horizontally.
Four viewports are now displayed.
™ Page 35 of 237
The Surpac Interface Activity:Workwith Multiple Viewports
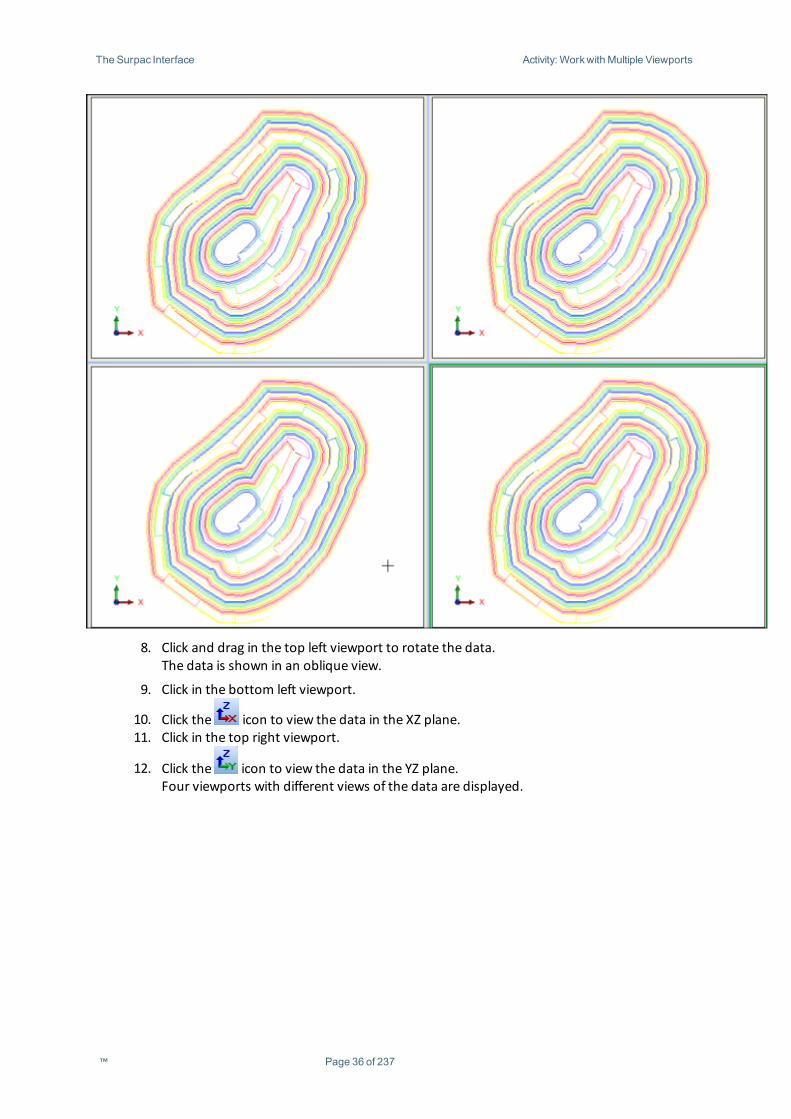
8. Click and drag in the top left viewport to rotate the data.The data is shown in an oblique view.
9. Click in the bottom left viewport.
10. Click the icon to view the data in the XZ plane.11. Click in the top right viewport.
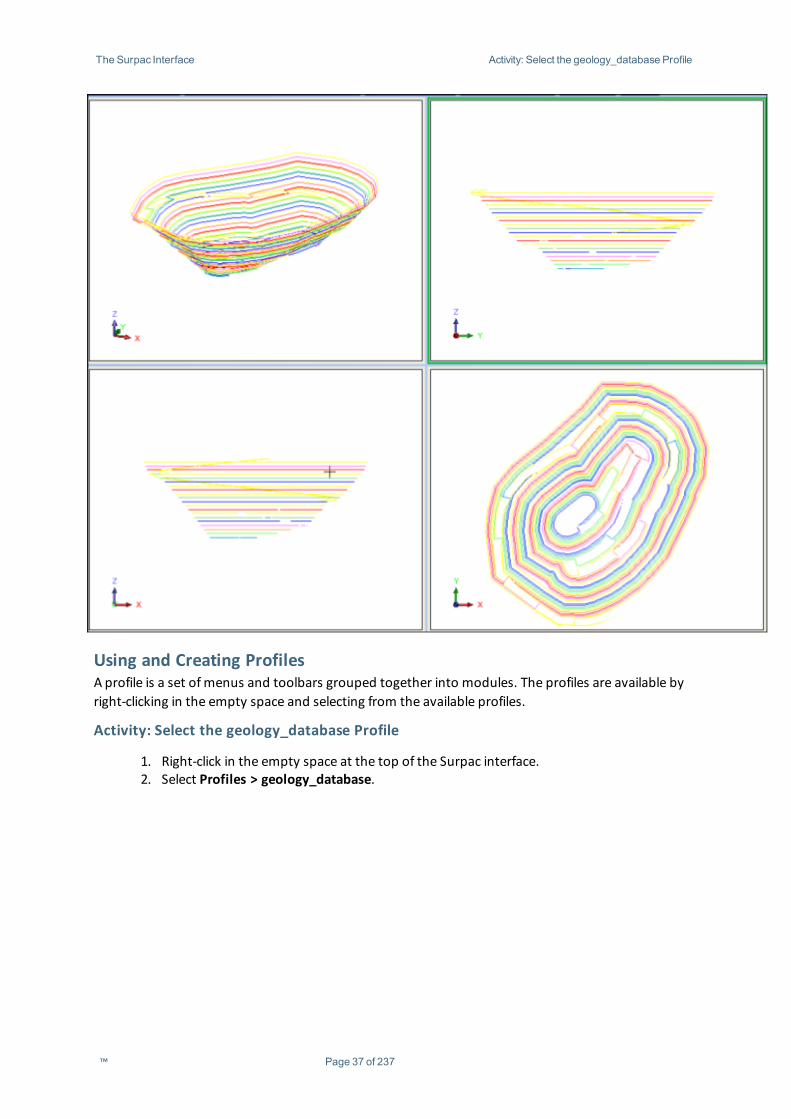
12. Click the icon to view the data in the YZ plane.Four viewports with different views of the data are displayed.
™ Page 36 of 237
The Surpac Interface Activity: Select the geology_database Profile
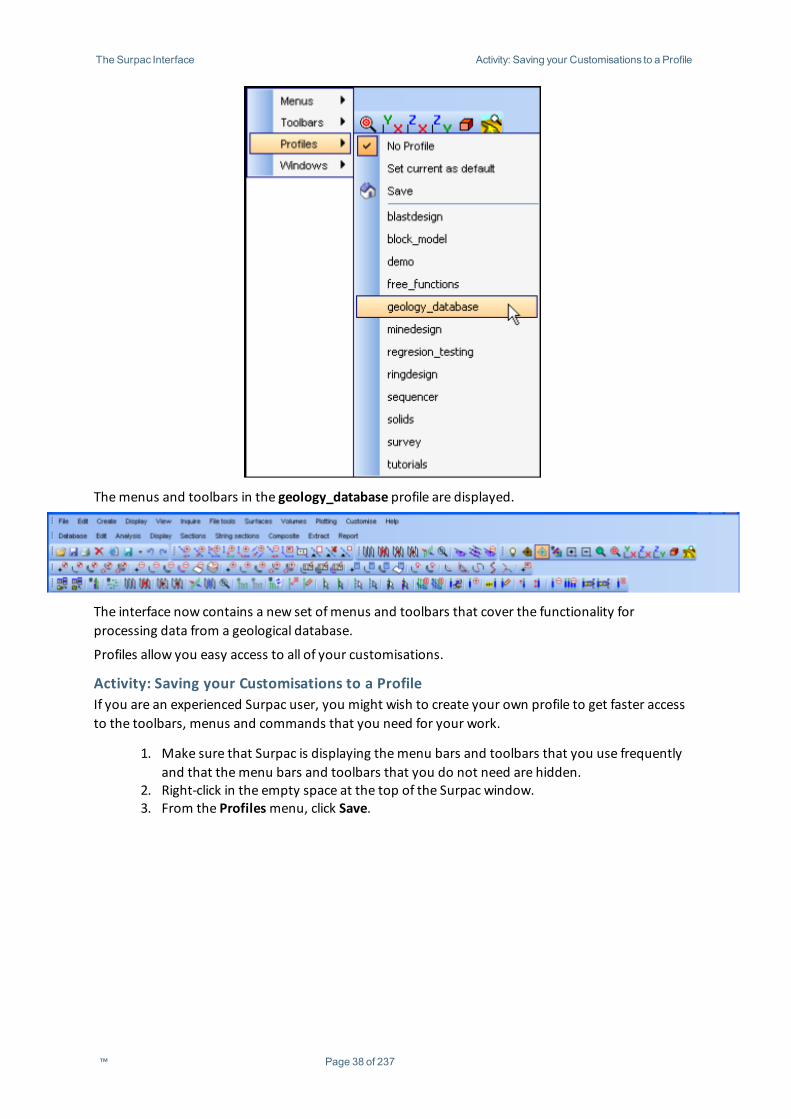
Using and Creating ProfilesA profile is a set ofmenus and toolbars grouped together into modules. The profiles are available byright-clicking in the empty space and selecting from the available profiles.
Activity: Select the geology_database Profile
1. Right-click in the empty space at the top of the Surpac interface.2. Select Profiles > geology_database.
™ Page 37 of 237
The Surpac Interface Activity: Saving your Customisations to a Profile
Themenus and toolbars in the geology_database profile are displayed.
The interface now contains a new set ofmenus and toolbars that cover the functionality forprocessing data from a geological database.
Profiles allow you easy access to all of your customisations.
Activity: Saving your Customisations to a ProfileIf you are an experienced Surpac user, you might wish to create your own profile to get faster accessto the toolbars, menus and commands that you need for your work.
1. Make sure that Surpac is displaying themenu bars and toolbars that you use frequentlyand that themenu bars and toolbars that you do not need are hidden.
2. Right-click in the empty space at the top of the Surpac window.3. From the Profilesmenu, click Save.
™ Page 38 of 237
The Surpac Interface Activity: Restoring the Default Profile
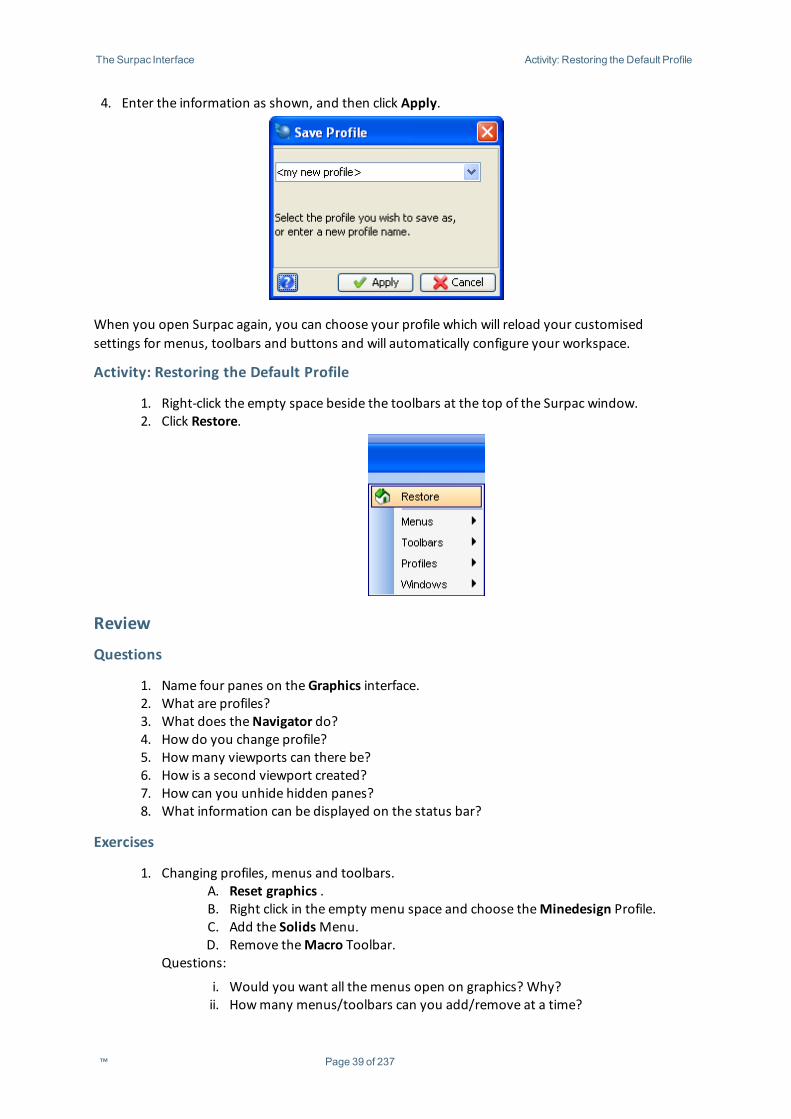
4. Enter the information as shown, and then click Apply.
When you open Surpac again, you can choose your profile which will reload your customisedsettings for menus, toolbars and buttons and will automatically configure your workspace.
Activity: Restoring the Default Profile
1. Right-click the empty space beside the toolbars at the top of the Surpac window.2. Click Restore.
Review
Questions
1. Name four panes on theGraphics interface.2. What are profiles?3. What does theNavigator do?4. How do you change profile?5. Howmany viewports can there be?6. How is a second viewport created?7. How can you unhide hidden panes?8. What information can be displayed on the status bar?
Exercises
1. Changing profiles, menus and toolbars.A. Reset graphics .B. Right click in the empty menu space and choose theMinedesign Profile.C. Add the SolidsMenu.D. Remove theMacro Toolbar.
Questions:
i. Would you want all themenus open on graphics? Why?ii. Howmany menus/toolbars can you add/remove at a time?
™ Page 39 of 237

The Surpac Interface Exercises
2. Changing the screen layout.A. Move the Layer Pane to the right of theMessageWindow.B. Delete the Properties Pane.C. Choose Customise > Auto Save window layout.
Question:
i. What would be an advantage of setting the screen up like this?3. Creating and using personalised profiles
A. ChooseNo Profile.B. Move the Layer Pane to the left side of theMessageWindow.C. Move the Properties Pane to the right side of theMessageWindow.D. Add theDatabaseMenu.E. Add the Scale and Transparency Toolbar.F. Re arrangemenus and toolbars for maximum graphics space.G. Save profile to a new personal name.
Questions:
i. When you bring up the list of available profiles, what has changed?ii. How do you ensure that every time you open Surpac, your personal profile
appears?4. Using viewports.
A. Make //tutorials/introduction the working directory.B. Open pit_design1.str in Graphics.C. Right click in Graphics, choose Viewport>Split vertically.D. Click in each viewport and rotate the string file.E. Open topo1.str into Graphics.
Question:
i. When one viewport is rotated, what happens in the other?
™ Page 40 of 237
Advanced InterfaceOperations Exercises
Advanced Interface Operations
Menu Bars, Menus and CommandsIf you do not understand themeaning of the termsmenu bar, menu and command, you couldeasily become confused when you try to create a customised menu bar.
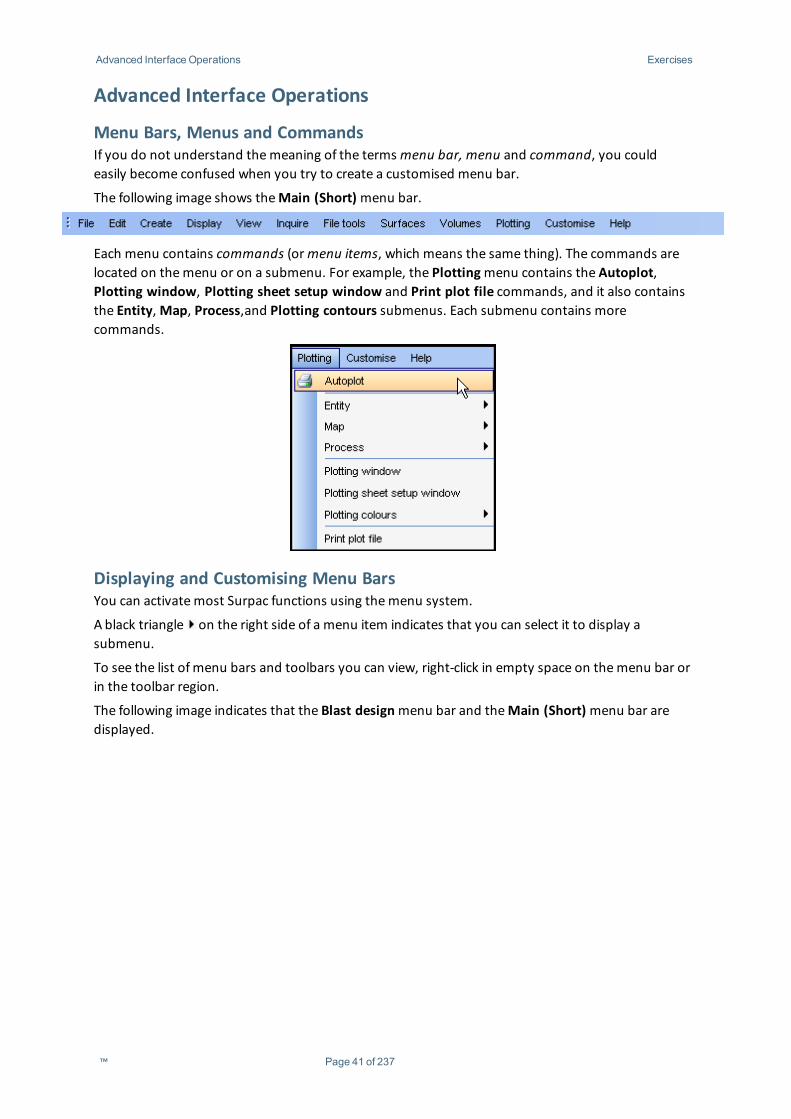
The following image shows theMain (Short)menu bar.
Each menu contains commands (ormenu items, which means the same thing). The commands arelocated on themenu or on a submenu. For example, the Plottingmenu contains the Autoplot,Plotting window, Plotting sheet setup window and Print plot file commands, and it also containsthe Entity,Map, Process,and Plotting contours submenus. Each submenu contains morecommands.
Displaying and Customising Menu BarsYou can activatemost Surpac functions using themenu system.
A black triangle on the right side of a menu item indicates that you can select it to display asubmenu.
To see the list ofmenu bars and toolbars you can view, right-click in empty space on themenu bar orin the toolbar region.
The following image indicates that the Blast designmenu bar and theMain (Short)menu bar aredisplayed.
™ Page 41 of 237
Advanced InterfaceOperations Activity: Create a CustomisedMenu Bar
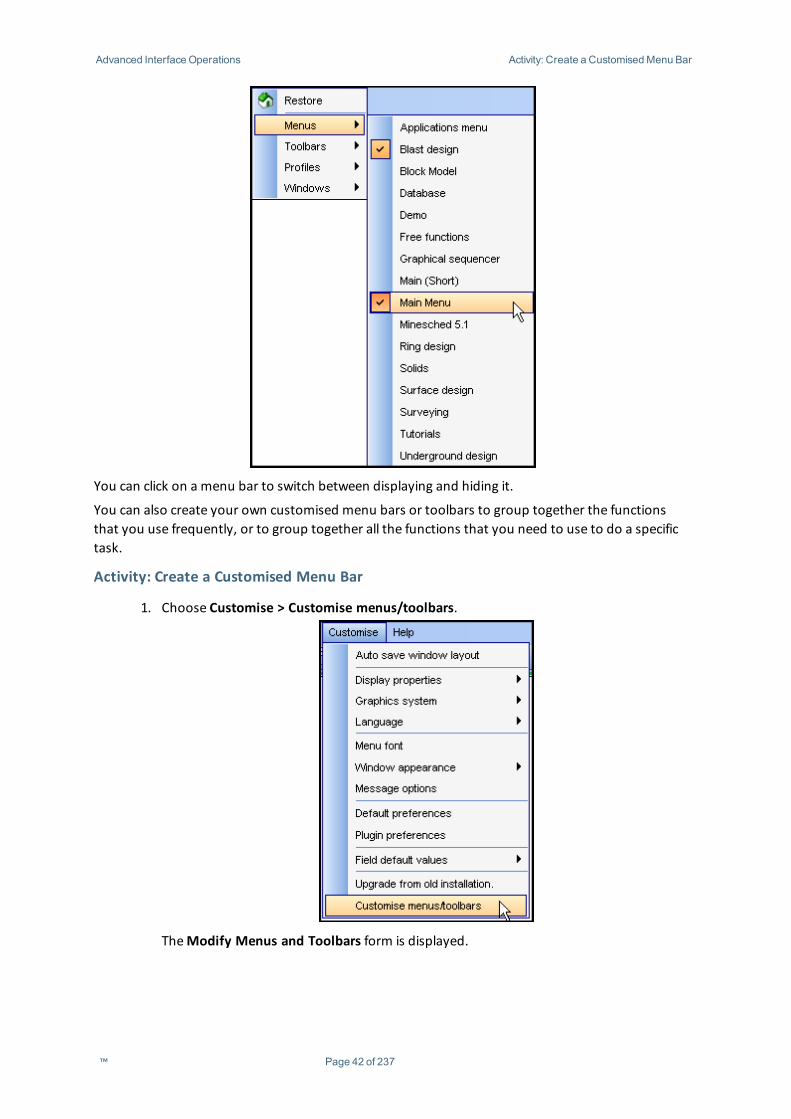
You can click on a menu bar to switch between displaying and hiding it.
You can also create your own customised menu bars or toolbars to group together the functionsthat you use frequently, or to group together all the functions that you need to use to do a specifictask.
Activity: Create a Customised Menu Bar
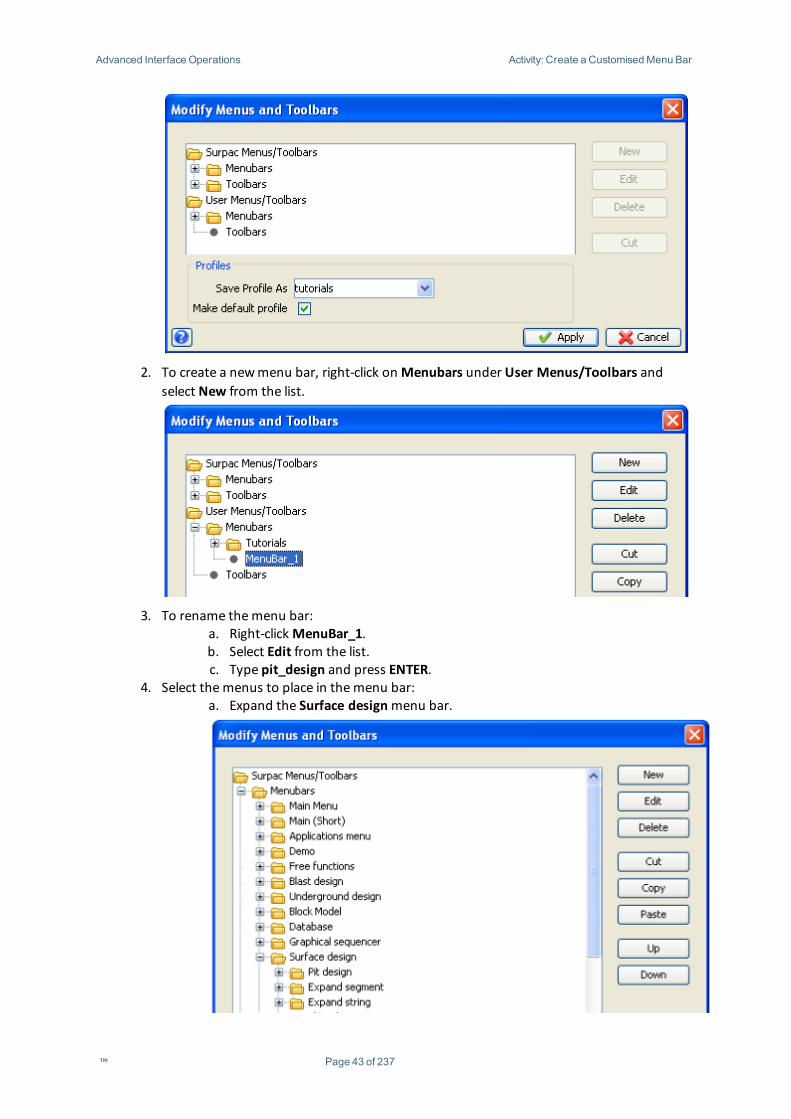
1. Choose Customise > Customise menus/toolbars.
TheModify Menus and Toolbars form is displayed.
™ Page 42 of 237
Advanced InterfaceOperations Activity: Create a CustomisedMenu Bar
2. To create a newmenu bar, right-click onMenubars under User Menus/Toolbars andselect New from the list.
3. To rename themenu bar:a. Right-clickMenuBar_1.b. Select Edit from the list.c. Type pit_design and press ENTER.
4. Select themenus to place in themenu bar:a. Expand the Surface designmenu bar.
™ Page 43 of 237
Advanced InterfaceOperations Activity: DisplayToolbars and Create a Customised Toolbar
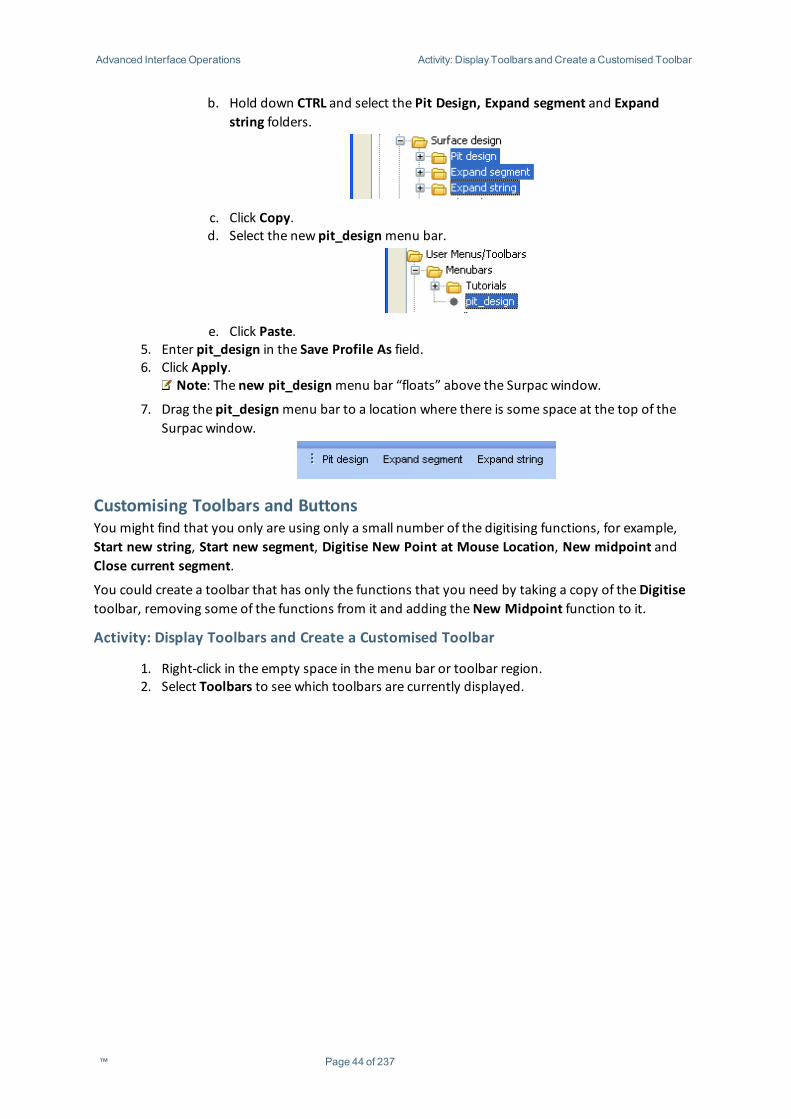
b. Hold down CTRL and select the Pit Design, Expand segment and Expandstring folders.
c. Click Copy.d. Select the new pit_designmenu bar.
e. Click Paste.5. Enter pit_design in the Save Profile As field.6. Click Apply.
Note: The new pit_designmenu bar “floats” above the Surpac window.
7. Drag the pit_designmenu bar to a location where there is some space at the top of theSurpac window.
Customising Toolbars and ButtonsYou might find that you only are using only a small number of the digitising functions, for example,Start new string, Start new segment, Digitise New Point at Mouse Location, New midpoint andClose current segment.
You could create a toolbar that has only the functions that you need by taking a copy of theDigitisetoolbar, removing some of the functions from it and adding theNew Midpoint function to it.
Activity: Display Toolbars and Create a Customised Toolbar
1. Right-click in the empty space in themenu bar or toolbar region.2. Select Toolbars to see which toolbars are currently displayed.
™ Page 44 of 237
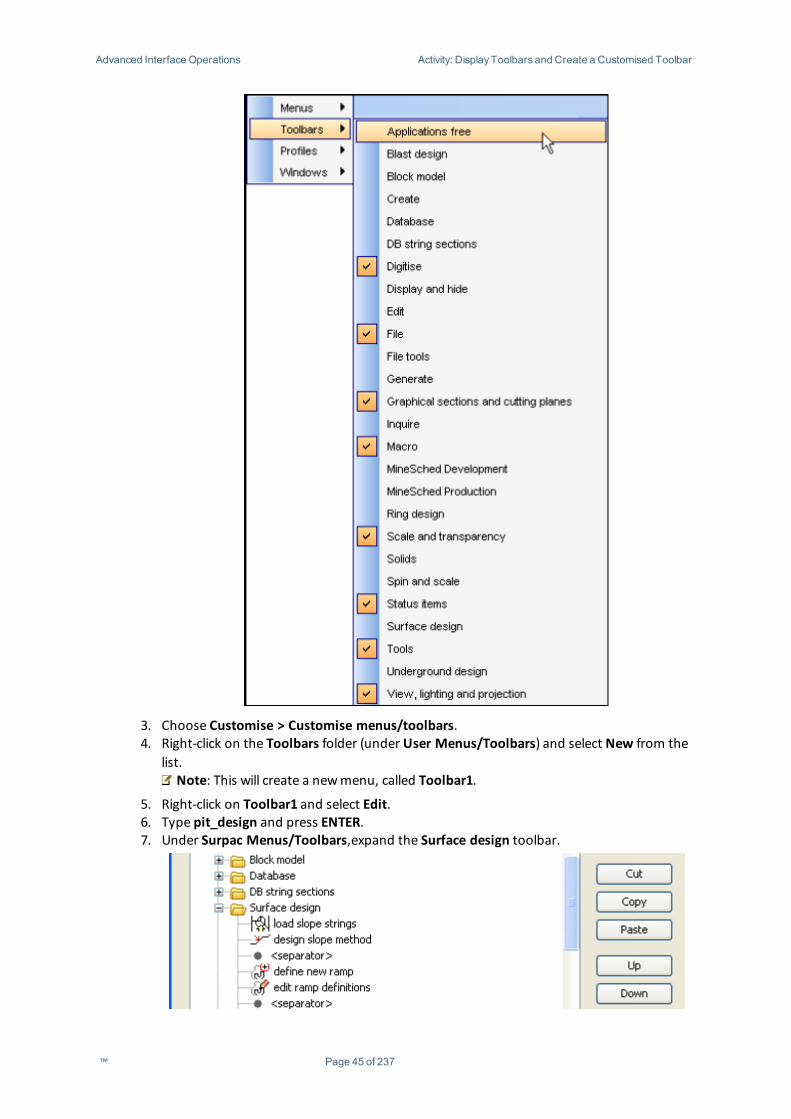
Advanced InterfaceOperations Activity: DisplayToolbars and Create a Customised Toolbar
3. Choose Customise > Customise menus/toolbars.4. Right-click on the Toolbars folder (under User Menus/Toolbars) and select New from the
list.Note: This will create a newmenu, called Toolbar1.
5. Right-click on Toolbar1 and select Edit.6. Type pit_design and press ENTER.7. Under Surpac Menus/Toolbars,expand the Surface design toolbar.
™ Page 45 of 237
Advanced InterfaceOperations Activity: Creating a CustomButton to Put on a Toolbar
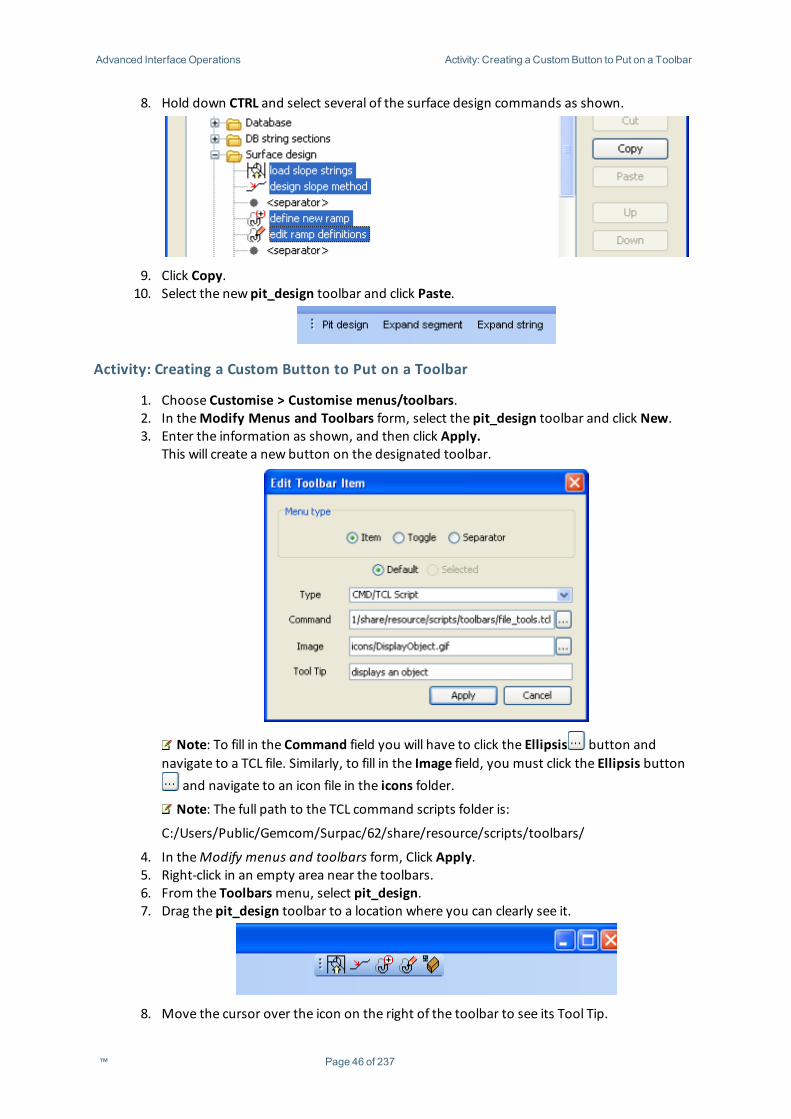
8. Hold down CTRL and select several of the surface design commands as shown.
9. Click Copy.10. Select the new pit_design toolbar and click Paste.
Activity: Creating a Custom Button to Put on a Toolbar
1. Choose Customise > Customise menus/toolbars.2. In theModify Menus and Toolbars form, select the pit_design toolbar and click New.3. Enter the information as shown, and then click Apply.
This will create a new button on the designated toolbar.
Note: To fill in the Command field you will have to click the Ellipsis button andnavigate to a TCL file. Similarly, to fill in the Image field, you must click the Ellipsis button
and navigate to an icon file in the icons folder.
Note: The full path to the TCL command scripts folder is:
C:/Users/Public/Gemcom/Surpac/62/share/resource/scripts/toolbars/
4. In theModify menus and toolbars form, Click Apply.5. Right-click in an empty area near the toolbars.6. From the Toolbarsmenu, select pit_design.7. Drag the pit_design toolbar to a location where you can clearly see it.
8. Move the cursor over the icon on the right of the toolbar to see its Tool Tip.
™ Page 46 of 237
Advanced InterfaceOperations Activity: Run Two Functions from the Function Chooser
Using the Function ChooserA quick way for you to run a function is to use the function chooser. You can type an “alias” into thefunction chooser to run a function. An alias is an abbreviation of the function name.
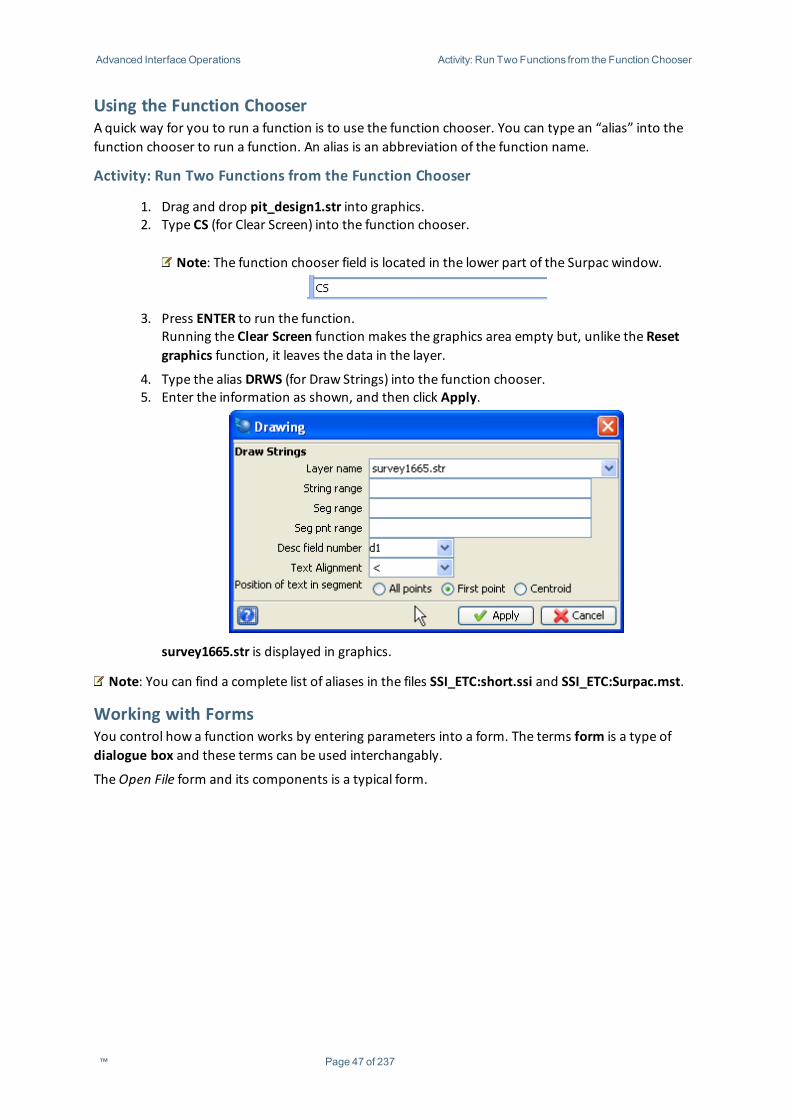
Activity: Run Two Functions from the Function Chooser
1. Drag and drop pit_design1.str into graphics.2. Type CS (for Clear Screen) into the function chooser.
Note: The function chooser field is located in the lower part of the Surpac window.
3. Press ENTER to run the function.Running the Clear Screen function makes the graphics area empty but, unlike the Resetgraphics function, it leaves the data in the layer.
4. Type the alias DRWS (for Draw Strings) into the function chooser.5. Enter the information as shown, and then click Apply.
survey1665.str is displayed in graphics.
Note: You can find a complete list of aliases in the files SSI_ETC:short.ssi and SSI_ETC:Surpac.mst.
Working with FormsYou control how a function works by entering parameters into a form. The terms form is a type ofdialogue box and these terms can be used interchangably.
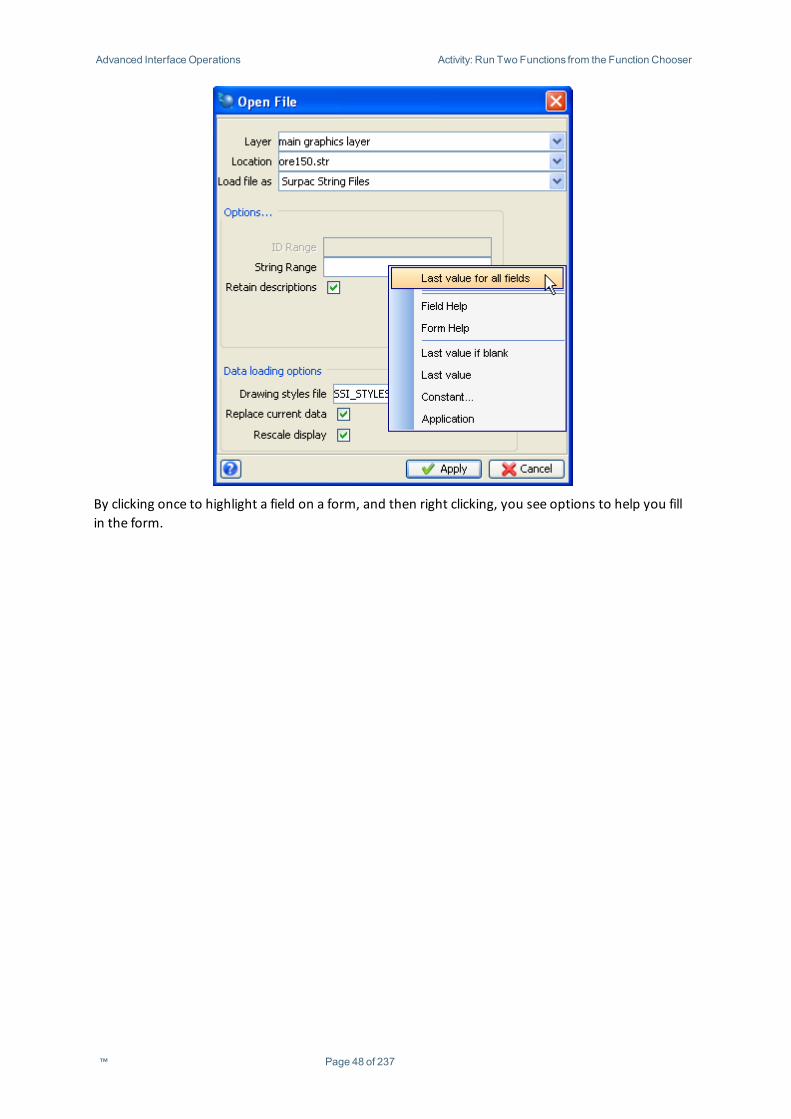
TheOpen File form and its components is a typical form.
™ Page 47 of 237
Advanced InterfaceOperations Activity: Run Two Functions from the Function Chooser
By clicking once to highlight a field on a form, and then right clicking, you see options to help you fillin the form.
™ Page 48 of 237
Advanced InterfaceOperations Activity: Run Two Functions from the Function Chooser
Last value if blankSelecting this command causes the field to keep the last value you entered when the applicationdoes not supply a value. For example, if you select Last value if blank for the Layer field of theOpenFile form, the text in the Layer field does not change, but if you select Last value if blank for theLocation field, the last file name used is shown.
Last valueSelecting this item causes the field to keep the last value regardless of the value that Surpac inserts.For example, if you select Last value in the Layer field of theOpen File form, the Layer field displaysthe name of the layer that you used on the last occasion you used this form.
Constant..Selecting this item allows you to enter a value to use for this field every time you use the form.
ApplicationSelecting this item causes the field to display the value supplied by Surpac. This is the way thatSurpac worked in previous versions.
Configuring Windows and Panes in the InterfaceYou can modify panes in the interface using the three buttons on the top right side of the pane:
l Toggle floating.l Toggle auto-hide.l Close.
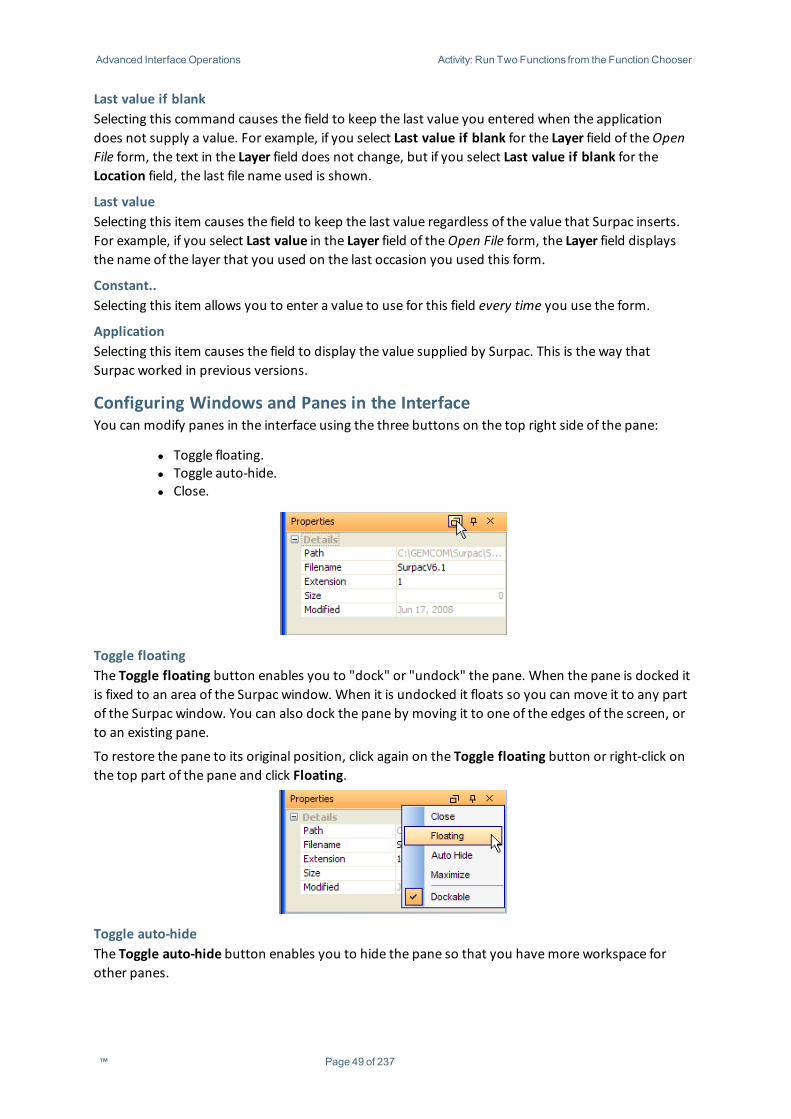
Toggle floatingThe Toggle floating button enables you to "dock" or "undock" the pane. When the pane is docked itis fixed to an area of the Surpac window. When it is undocked it floats so you can move it to any partof the Surpac window. You can also dock the pane by moving it to one of the edges of the screen, orto an existing pane.
To restore the pane to its original position, click again on the Toggle floating button or right-click onthe top part of the pane and click Floating.
Toggle auto-hideThe Toggle auto-hide button enables you to hide the pane so that you havemore workspace forother panes.
™ Page 49 of 237
Advanced InterfaceOperations Activity: Run Two Functions from the Function Chooser
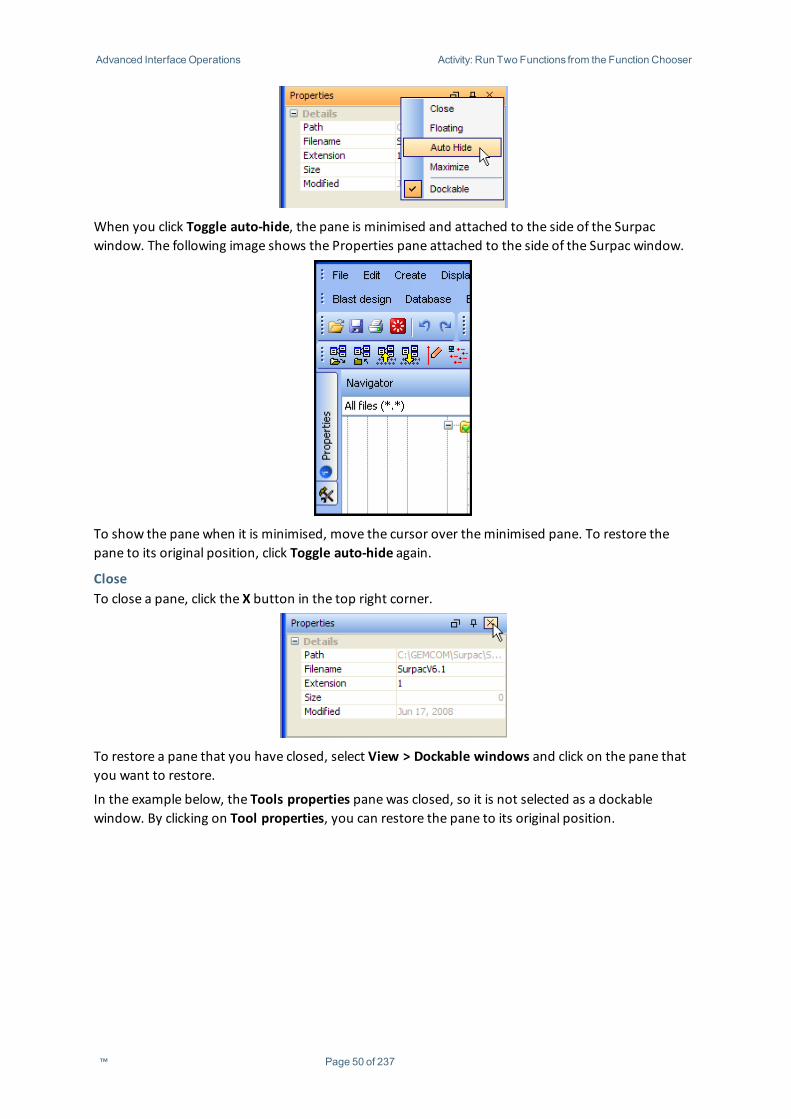
When you click Toggle auto-hide, the pane is minimised and attached to the side of the Surpacwindow. The following image shows the Properties pane attached to the side of the Surpac window.
To show the pane when it is minimised, move the cursor over theminimised pane. To restore thepane to its original position, click Toggle auto-hide again.
CloseTo close a pane, click the X button in the top right corner.
To restore a pane that you have closed, select View > Dockable windows and click on the pane thatyou want to restore.
In the example below, the Tools properties pane was closed, so it is not selected as a dockablewindow. By clicking on Tool properties, you can restore the pane to its original position.
™ Page 50 of 237
Advanced InterfaceOperations Activity: Run Two Functions from the Function Chooser
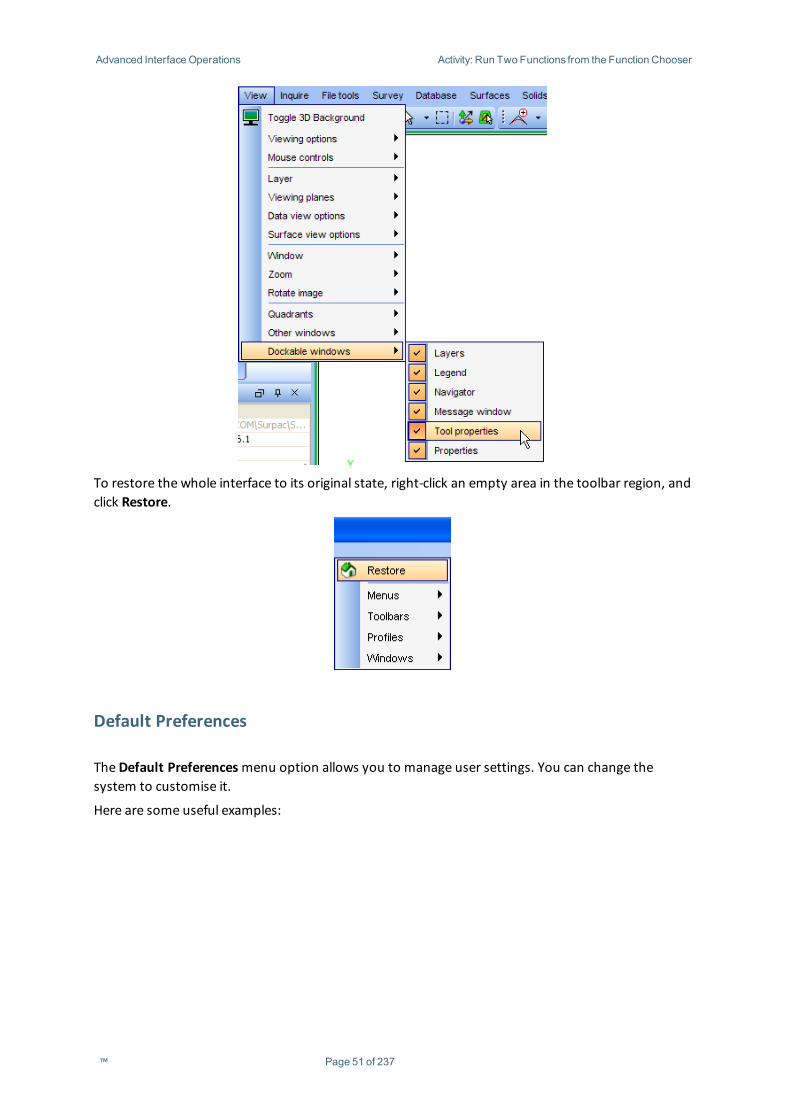
To restore the whole interface to its original state, right-click an empty area in the toolbar region, andclick Restore.
Default Preferences
TheDefault Preferencesmenu option allows you to manage user settings. You can change thesystem to customise it.
Here are some useful examples:
™ Page 51 of 237
Advanced InterfaceOperations Task: Changing setting in DefaultsPreferences
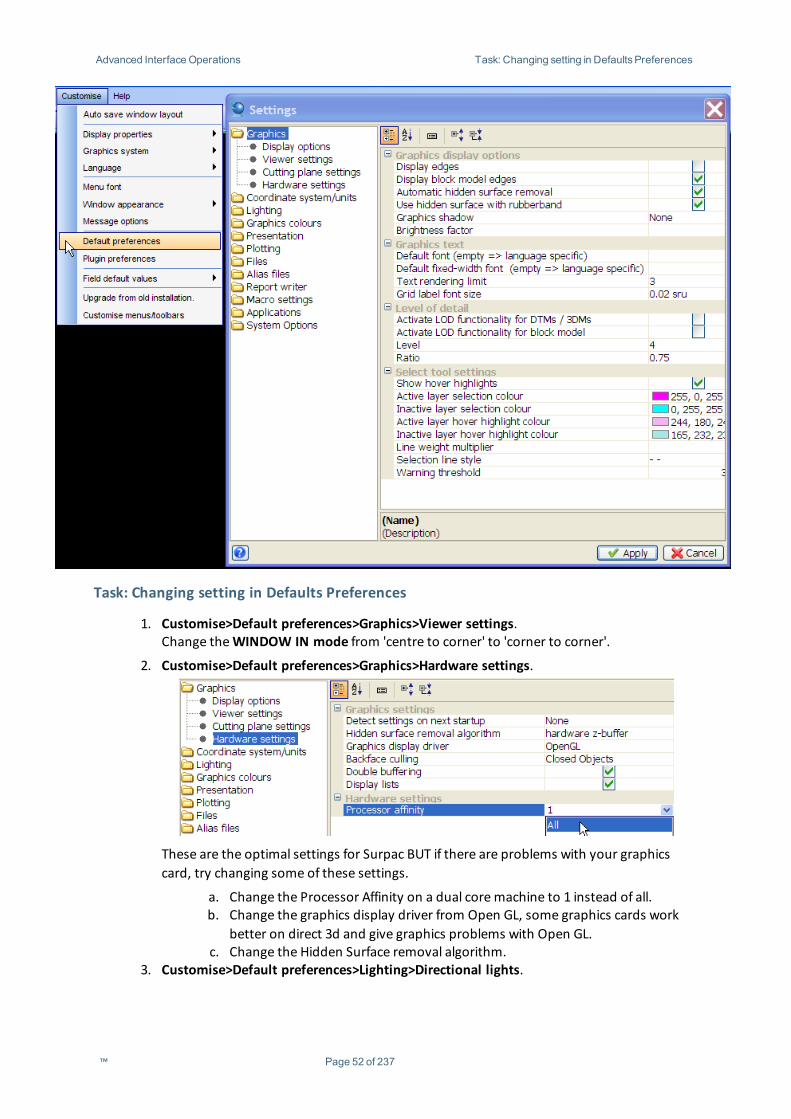
Task: Changing setting in Defaults Preferences
1. Customise>Default preferences>Graphics>Viewer settings.Change theWINDOW IN mode from 'centre to corner' to 'corner to corner'.
2. Customise>Default preferences>Graphics>Hardware settings.
These are the optimal settings for Surpac BUT if there are problems with your graphicscard, try changing some of these settings.
a. Change the Processor Affinity on a dual coremachine to 1 instead of all.b. Change the graphics display driver from Open GL, some graphics cards work
better on direct 3d and give graphics problems with Open GL.c. Change the Hidden Surface removal algorithm.
3. Customise>Default preferences>Lighting>Directional lights.
™ Page 52 of 237
Advanced InterfaceOperations Task: Changing setting in DefaultsPreferences
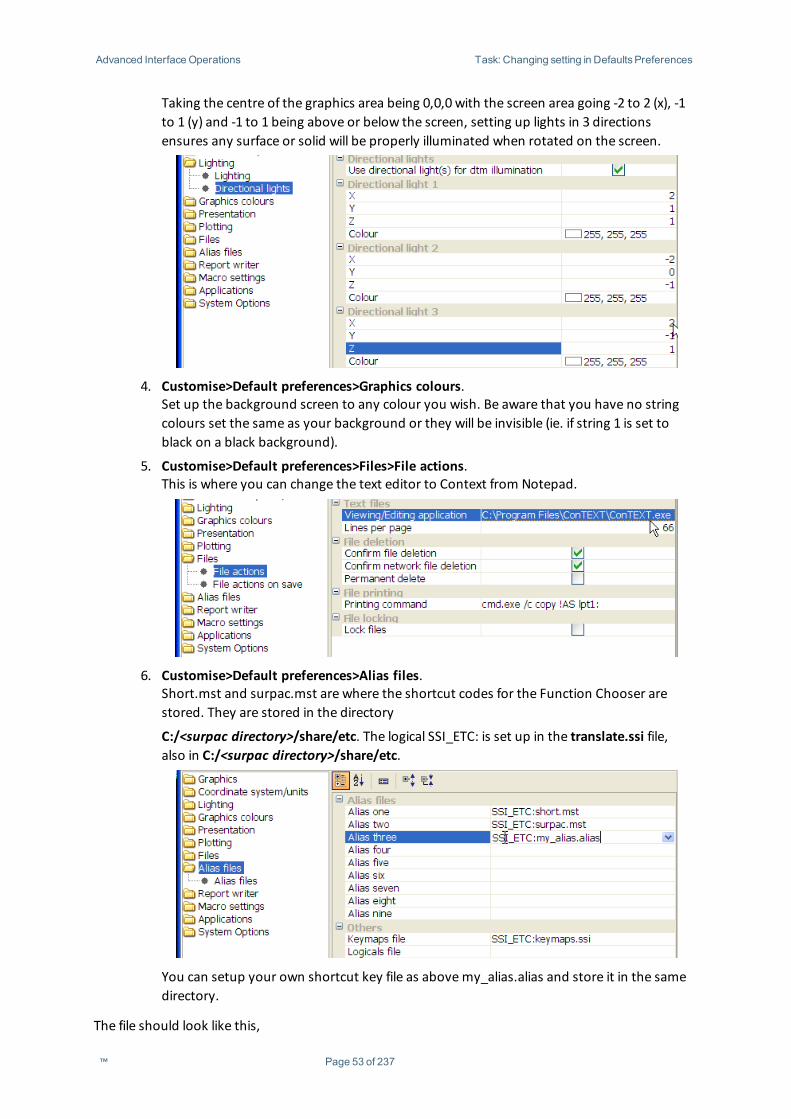
Taking the centre of the graphics area being 0,0,0 with the screen area going -2 to 2 (x), -1to 1 (y) and -1 to 1 being above or below the screen, setting up lights in 3 directionsensures any surface or solid will be properly illuminated when rotated on the screen.
4. Customise>Default preferences>Graphics colours.Set up the background screen to any colour you wish. Be aware that you have no stringcolours set the same as your background or they will be invisible (ie. if string 1 is set toblack on a black background).
5. Customise>Default preferences>Files>File actions.This is where you can change the text editor to Context from Notepad.
6. Customise>Default preferences>Alias files.Short.mst and surpac.mst are where the shortcut codes for the Function Chooser arestored. They are stored in the directory
C:/<surpac directory>/share/etc. The logical SSI_ETC: is set up in the translate.ssi file,also in C:/<surpac directory>/share/etc.
You can setup your own shortcut key file as abovemy_alias.alias and store it in the samedirectory.
The file should look like this,
™ Page 53 of 237

Advanced InterfaceOperations Questions
shortcut in double quoted followed by white space followed by the full command name in doublequotes.
You can use an existing shortcut as well as the full command name.
If an existing shortcut is used, that last to be loaded will overwrite the function of the first ( ie.Alias 3will overwrite alias 1 and 2), so check that you are creating a NEW shortcut.
form is to click the icon in the toolbar.
Review
Questions
1. Where is the option to create a personalised toolbar?2. Name three ways to run a function in Surpac.3. What are the two files which contain function chooser shortcuts, and where are they
stored?4. How can hidden panes be redisplayed?5. Where can the graphics settings for Surpac be found?6. Where can the paths for the customisable directories Surpac is pointing to, be found?
Exercises
1. Setting form defaults.A. Choose File>Open>String/DTM file.B. Click Rescale display.C. Right click, choose Constant.D. Clear, and then clickApply.
Question:
i. What different behaviour can be seen in opening a file between dragging itinto graphics or using this form to open the file?
2. Create a personalised toolbar.A. Choose Customise>Customise menus/toolbars.B. Create a new toolbar named 'TEST'.C. Copy and pasteOpen file and Undo functions from the Surpac toolbar to the
user toolbar TEST.D. Add the following new item to the toolbar:
The Type is Script, the Command is 02a_change_display_styles.tcl, the Imageand Tool Tip is whatever you wish.
E. Run this script from the new toolbar.3. Change the screen colour.
A. Choose Customise>Defaults preferences>Graphics colours.B. Set the background to pale yellow.C. Set the text to dark blue.D. View the results in Graphics.
™ Page 54 of 237
Getting Help Activity: AccessField Help and FormHelp
Getting HelpThere are a number of resources to assist you whether you are trying to solve a problem, tounderstand how a function works, or to enter data into a form.
Field Help and Form HelpWhen Surpac prompts you to enter information, it displays a form. The components on the formwhere you enter information are known as fields.
You can get helpful information about each field by accessing Field help. Helpful information aboutthe entire form, and concepts related to the function, are available by accessing Form help.
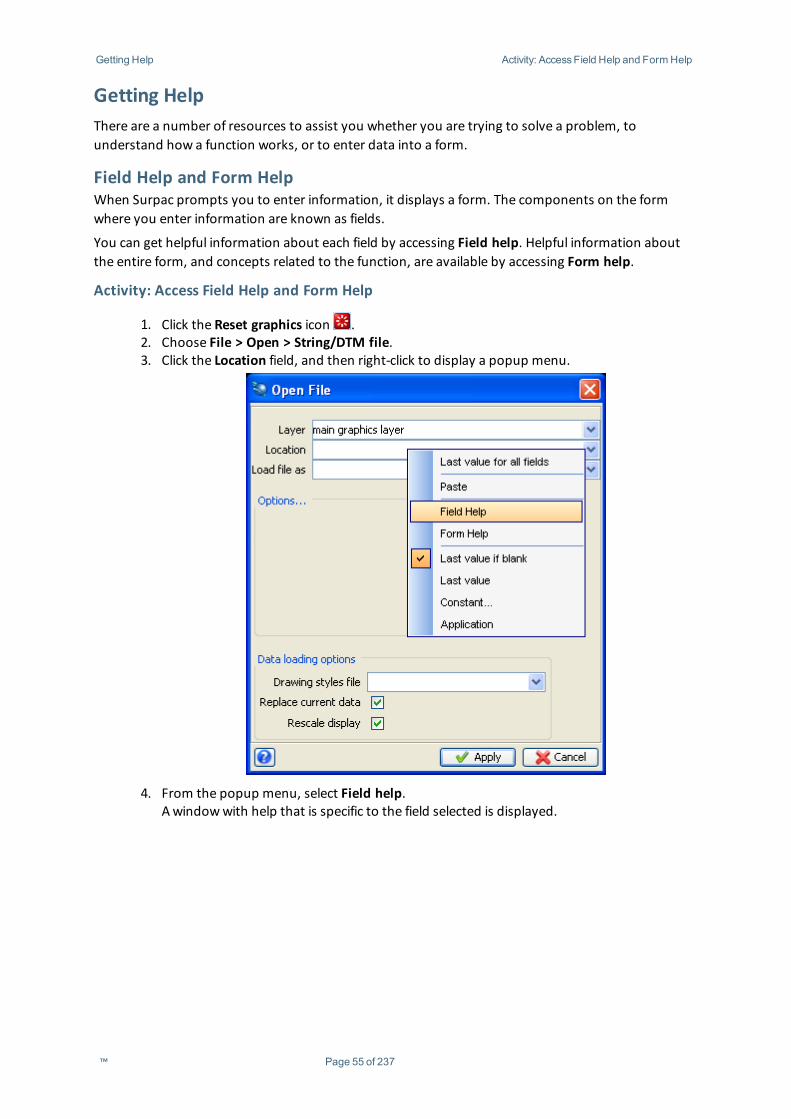
Activity: Access Field Help and Form Help
1. Click the Reset graphics icon .2. Choose File > Open > String/DTM file.3. Click the Location field, and then right-click to display a popup menu.
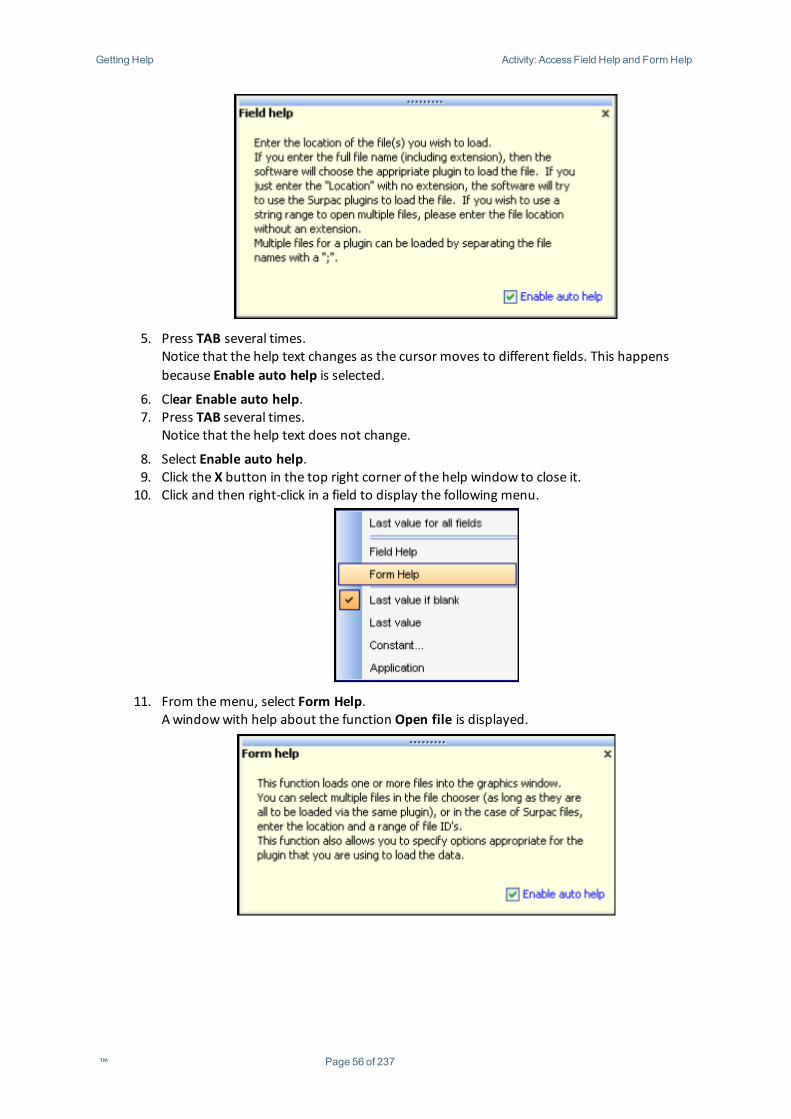
4. From the popup menu, select Field help.A windowwith help that is specific to the field selected is displayed.
™ Page 55 of 237
Getting Help Activity: AccessField Help and FormHelp
5. Press TAB several times.Notice that the help text changes as the cursor moves to different fields. This happensbecause Enable auto help is selected.
6. Clear Enable auto help.7. Press TAB several times.
Notice that the help text does not change.
8. Select Enable auto help.9. Click the X button in the top right corner of the help window to close it.10. Click and then right-click in a field to display the following menu.
11. From themenu, select Form Help.A windowwith help about the function Open file is displayed.
™ Page 56 of 237
Getting Help Activity: AccessOnline Help from a Form
Online HelpOnline help contains more detailed information than form help and field help, as well as examplesand troubleshooting assistance.
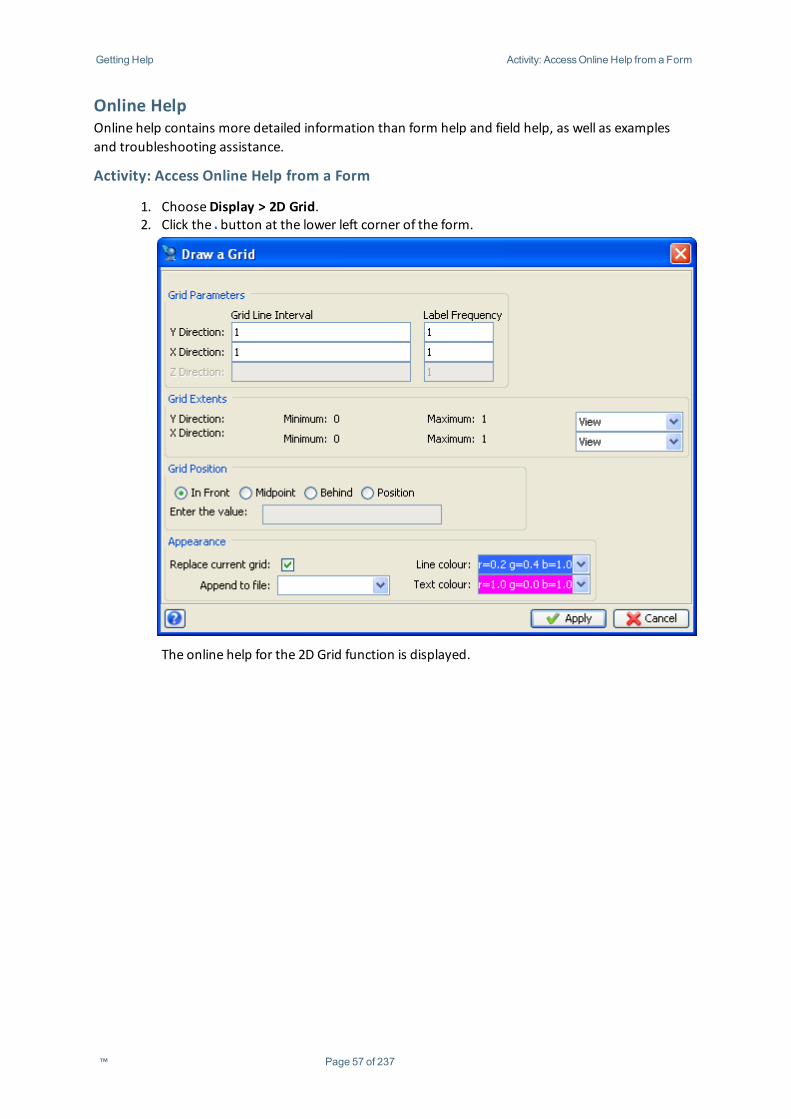
Activity: Access Online Help from a Form
1. ChooseDisplay > 2D Grid.2. Click the button at the lower left corner of the form.
The online help for the 2D Grid function is displayed.
™ Page 57 of 237
Getting Help Activity: AccessHelp from the HelpMenu
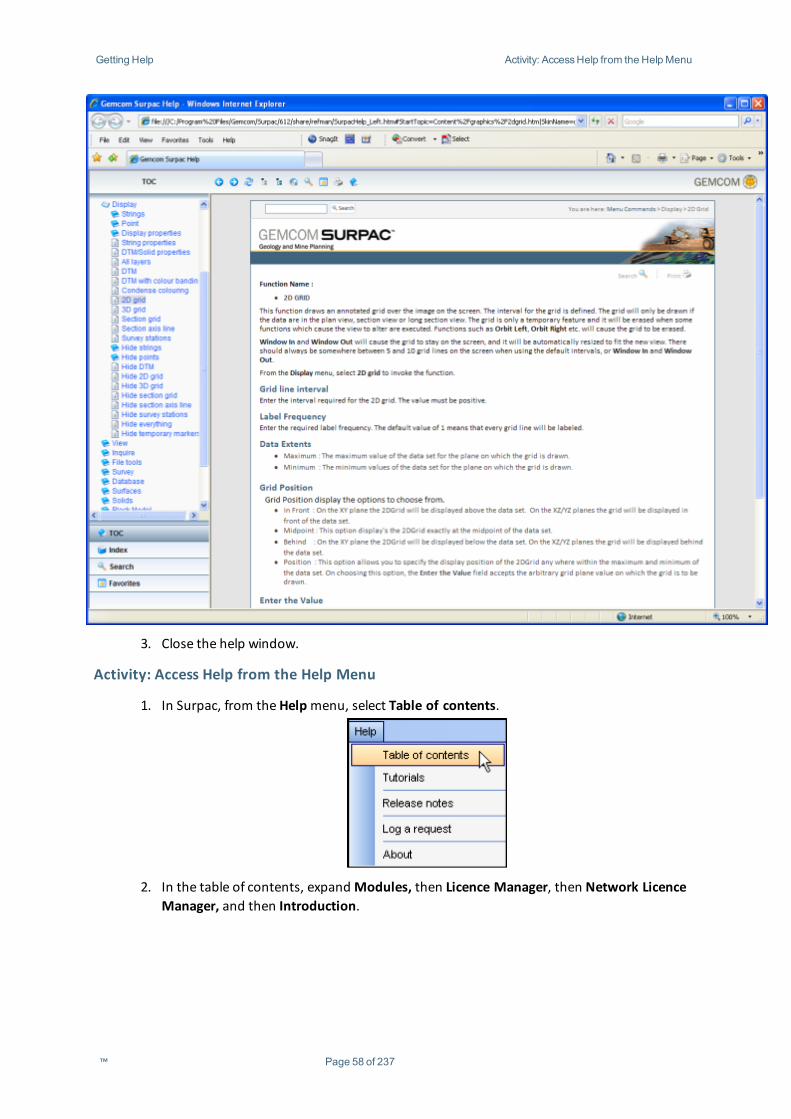
3. Close the help window.
Activity: Access Help from the Help Menu
1. In Surpac, from theHelpmenu, select Table of contents.
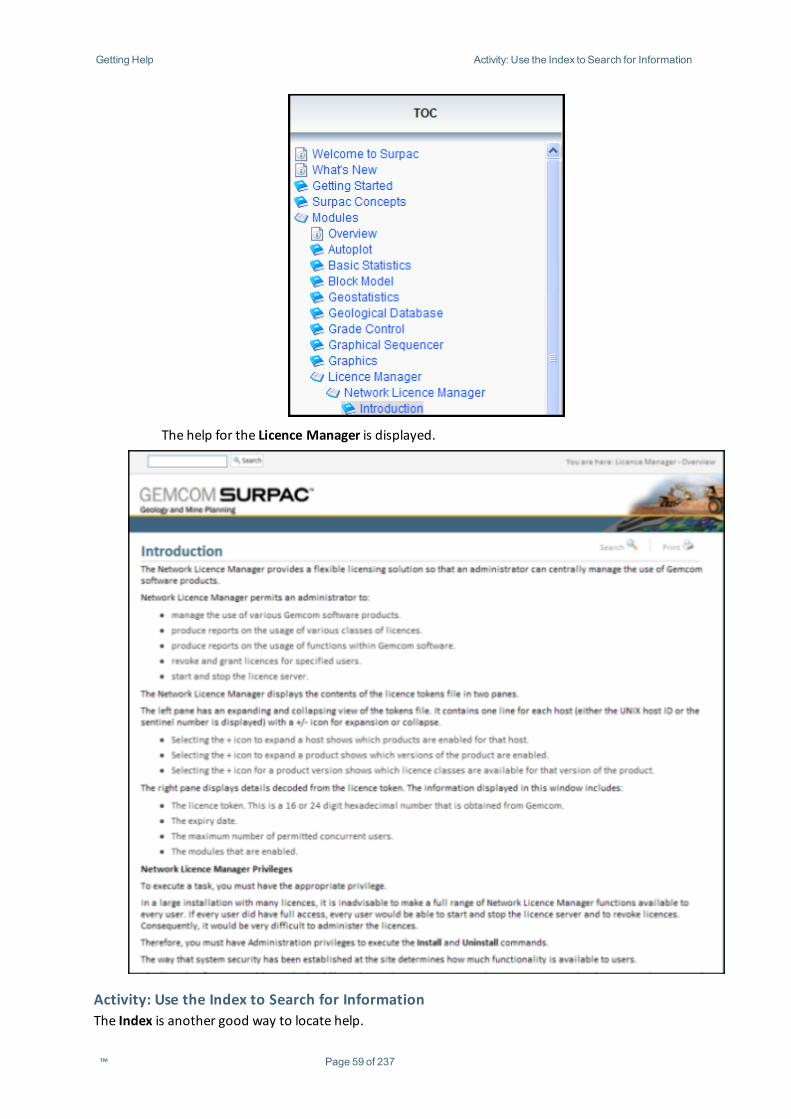
2. In the table of contents, expandModules, then Licence Manager, then Network LicenceManager, and then Introduction.
™ Page 58 of 237
Getting Help Activity: Use the Index to Search for Information
The help for the Licence Manager is displayed.
Activity: Use the Index to Search for InformationThe Index is another good way to locate help.
™ Page 59 of 237
Getting Help Activity: Search theOnline help
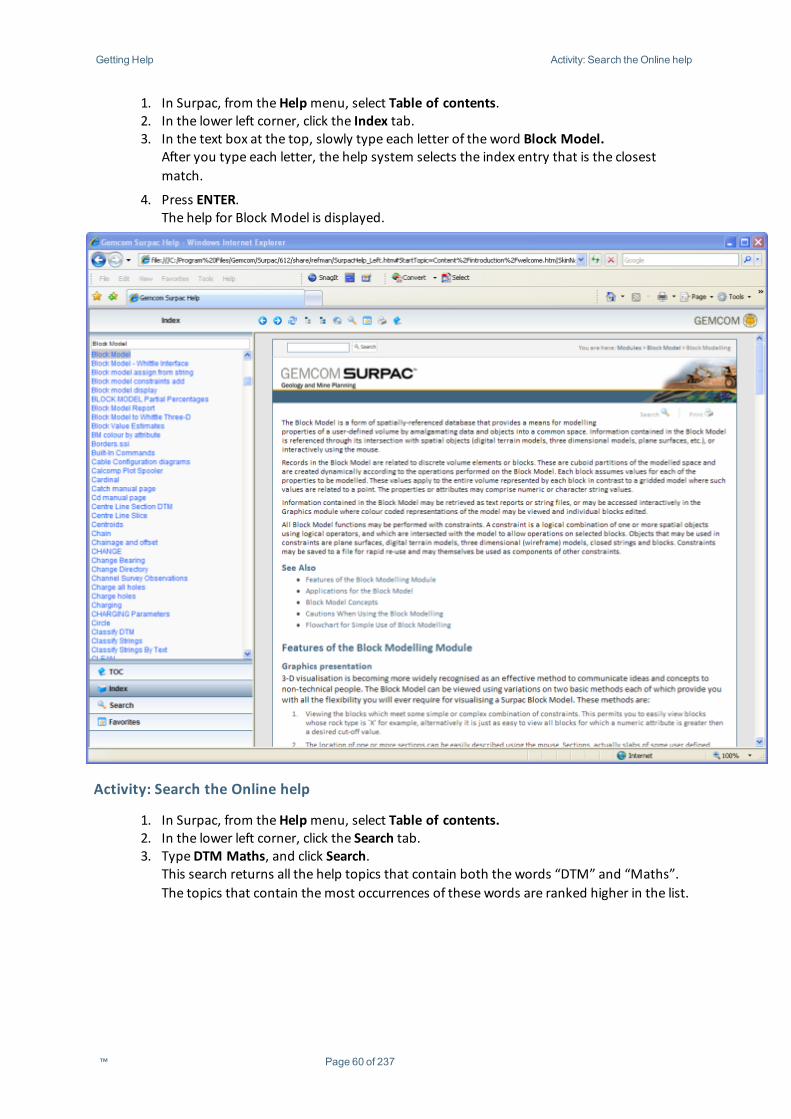
1. In Surpac, from theHelpmenu, select Table of contents.2. In the lower left corner, click the Index tab.3. In the text box at the top, slowly type each letter of the word Block Model.
After you type each letter, the help system selects the index entry that is the closestmatch.
4. Press ENTER.The help for Block Model is displayed.
Activity: Search the Online help
1. In Surpac, from theHelpmenu, select Table of contents.2. In the lower left corner, click the Search tab.3. TypeDTM Maths, and click Search.
This search returns all the help topics that contain both the words “DTM” and “Maths”.The topics that contain themost occurrences of these words are ranked higher in the list.
™ Page 60 of 237
Getting Help Activity: Search theOnline help
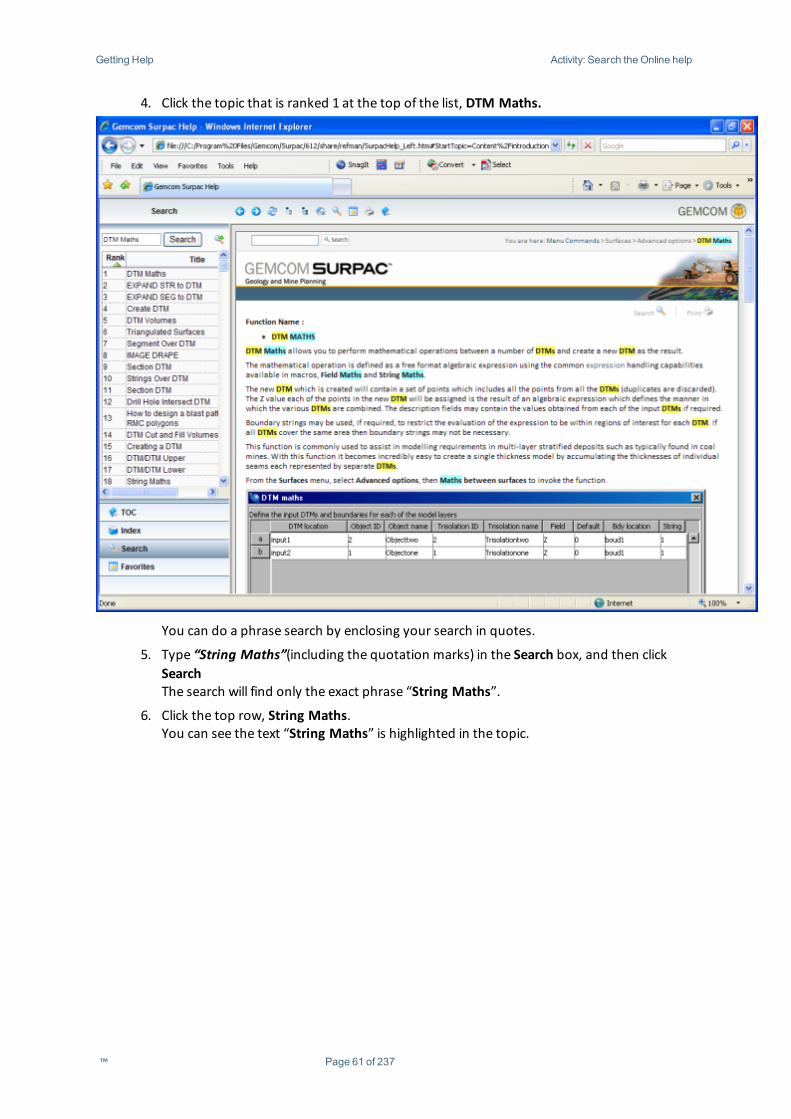
4. Click the topic that is ranked 1 at the top of the list, DTM Maths.
You can do a phrase search by enclosing your search in quotes.
5. Type “String Maths”(including the quotation marks) in the Search box, and then clickSearchThe search will find only the exact phrase “String Maths”.
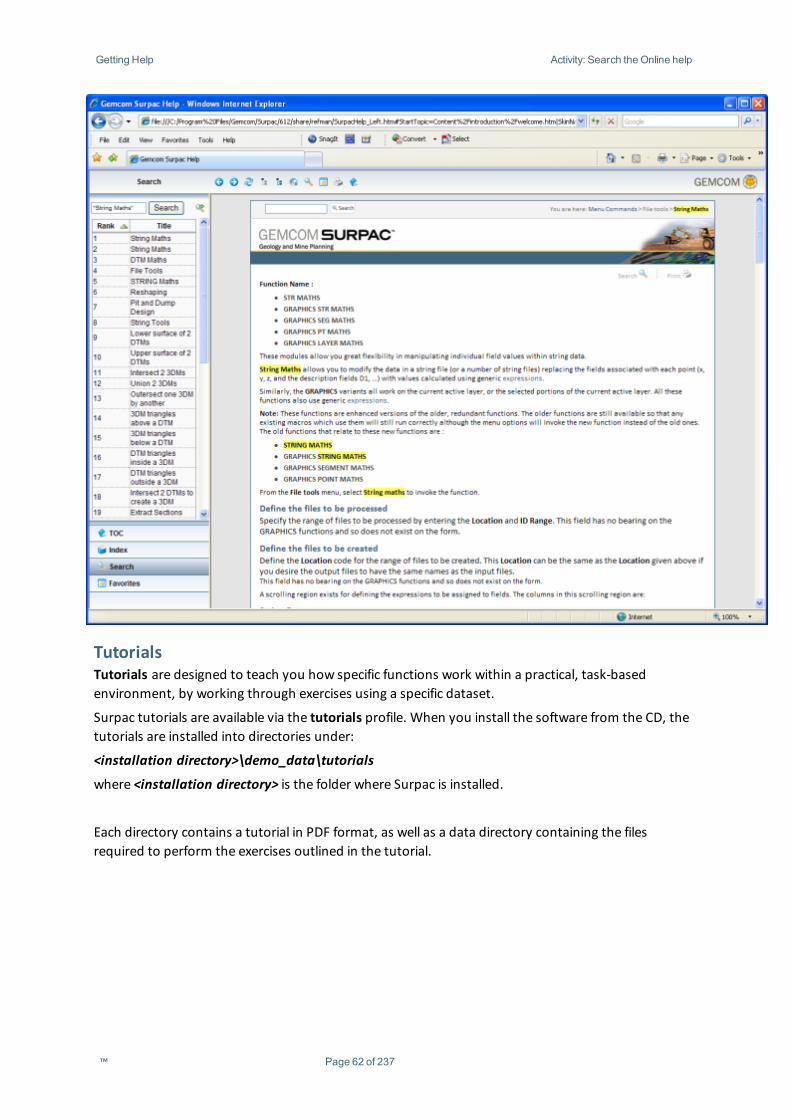
6. Click the top row, String Maths.You can see the text “String Maths” is highlighted in the topic.
™ Page 61 of 237
Getting Help Activity: Search theOnline help
TutorialsTutorials are designed to teach you how specific functions work within a practical, task-basedenvironment, by working through exercises using a specific dataset.
Surpac tutorials are available via the tutorials profile. When you install the software from the CD, thetutorials are installed into directories under:
<installation directory>\demo_data\tutorials
where <installation directory> is the folder where Surpac is installed.
Each directory contains a tutorial in PDF format, as well as a data directory containing the filesrequired to perform the exercises outlined in the tutorial.
™ Page 62 of 237
Getting Help Activity: Access the TutorialsProfile
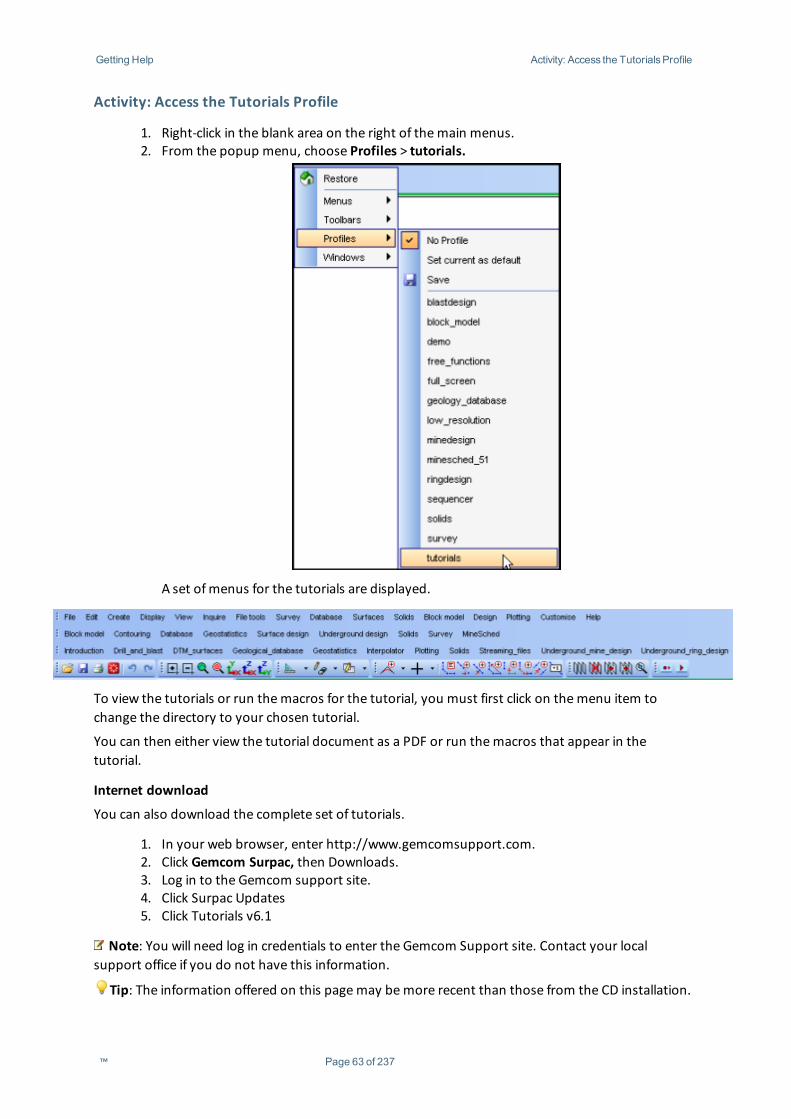
Activity: Access the Tutorials Profile
1. Right-click in the blank area on the right of themain menus.2. From the popup menu, choose Profiles > tutorials.
A set ofmenus for the tutorials are displayed.
To view the tutorials or run themacros for the tutorial, you must first click on themenu item tochange the directory to your chosen tutorial.
You can then either view the tutorial document as a PDF or run themacros that appear in thetutorial.
Internet download
You can also download the complete set of tutorials.
1. In your web browser, enter http://www.gemcomsupport.com.2. Click Gemcom Surpac, then Downloads.3. Log in to the Gemcom support site.4. Click Surpac Updates5. Click Tutorials v6.1
Note: You will need log in credentials to enter the Gemcom Support site. Contact your localsupport office if you do not have this information.
Tip: The information offered on this pagemay bemore recent than those from the CD installation.
™ Page 63 of 237
Getting Help Activity: Find Support Office Contact Details
SupportYou can contact your local support office by phone or email.
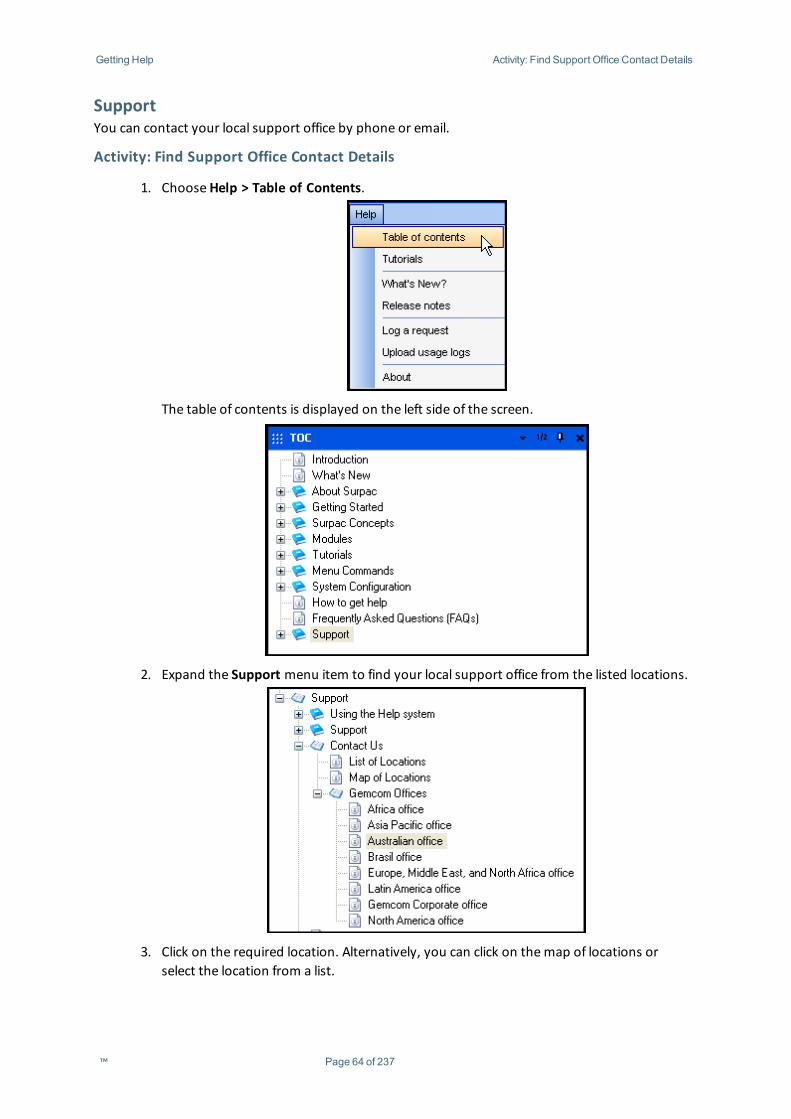
Activity: Find Support Office Contact Details
1. ChooseHelp > Table of Contents.
The table of contents is displayed on the left side of the screen.
2. Expand the Support menu item to find your local support office from the listed locations.
3. Click on the required location. Alternatively, you can click on themap of locations orselect the location from a list.
™ Page 64 of 237
Getting Help Activity: Log a software request
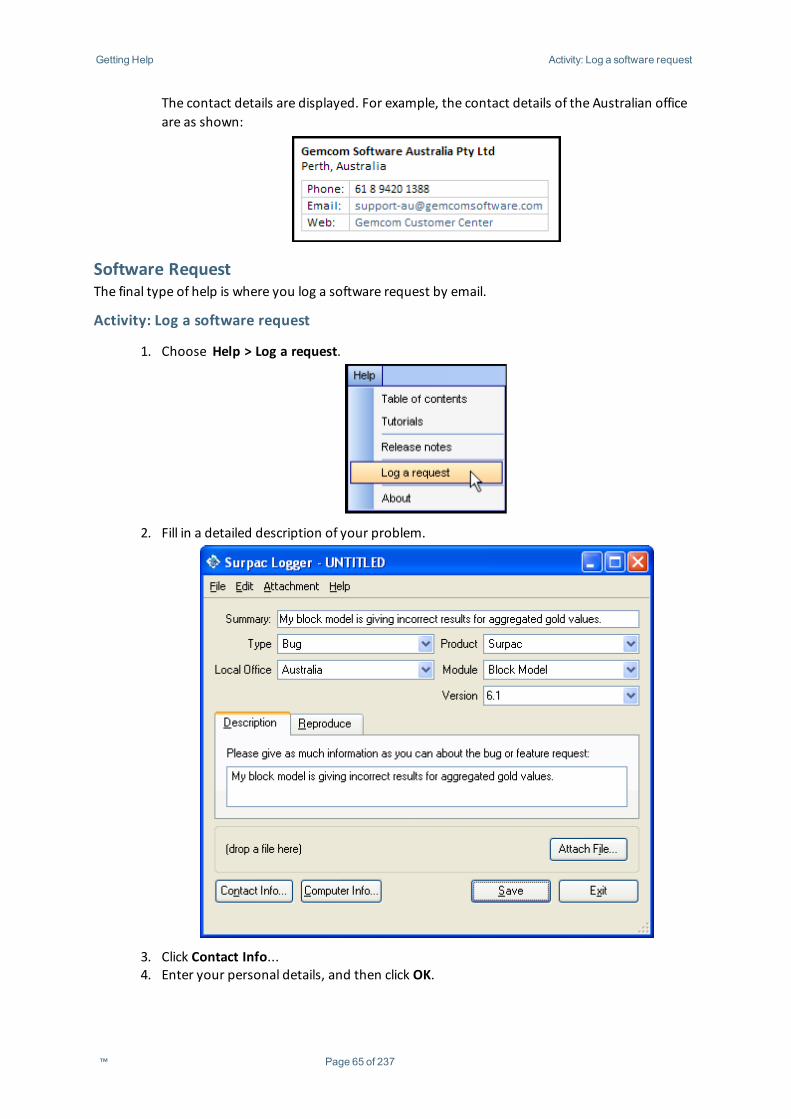
The contact details are displayed. For example, the contact details of the Australian officeare as shown:
Software RequestThe final type of help is where you log a software request by email.
Activity: Log a software request
1. Choose Help > Log a request.
2. Fill in a detailed description of your problem.
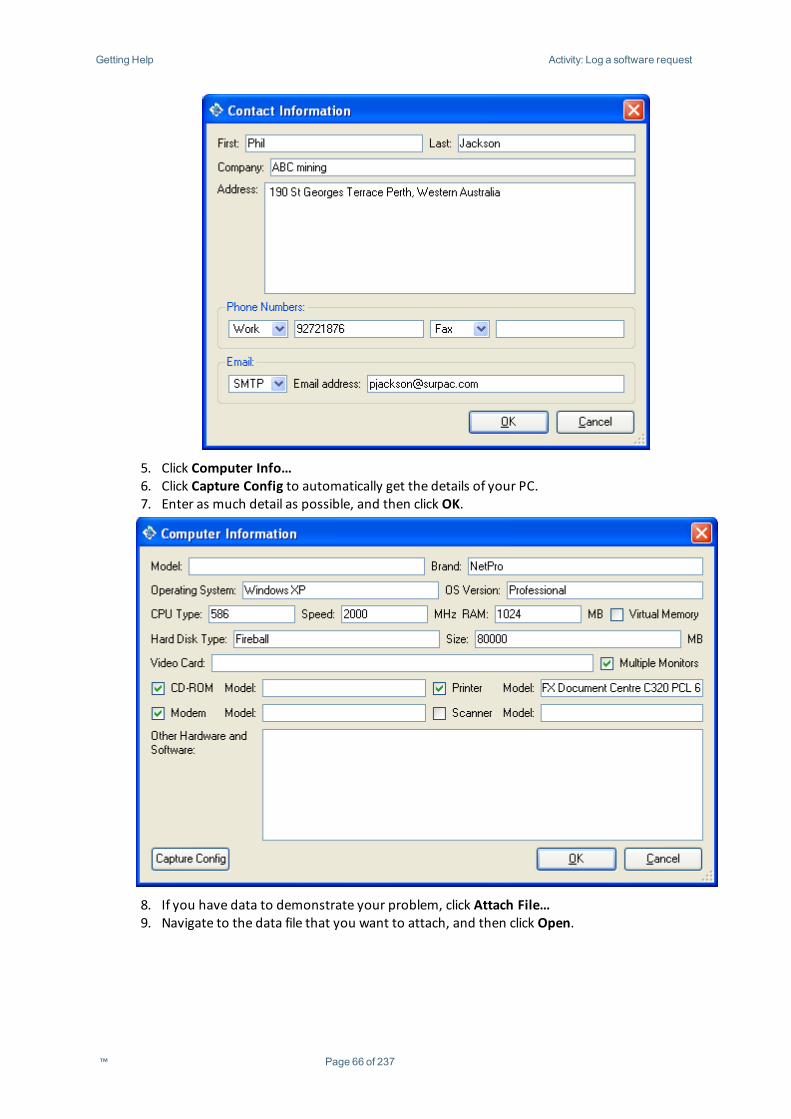
3. Click Contact Info...4. Enter your personal details, and then click OK.
™ Page 65 of 237
Getting Help Activity: Log a software request
5. Click Computer Info…6. Click Capture Config to automatically get the details of your PC.7. Enter as much detail as possible, and then click OK.
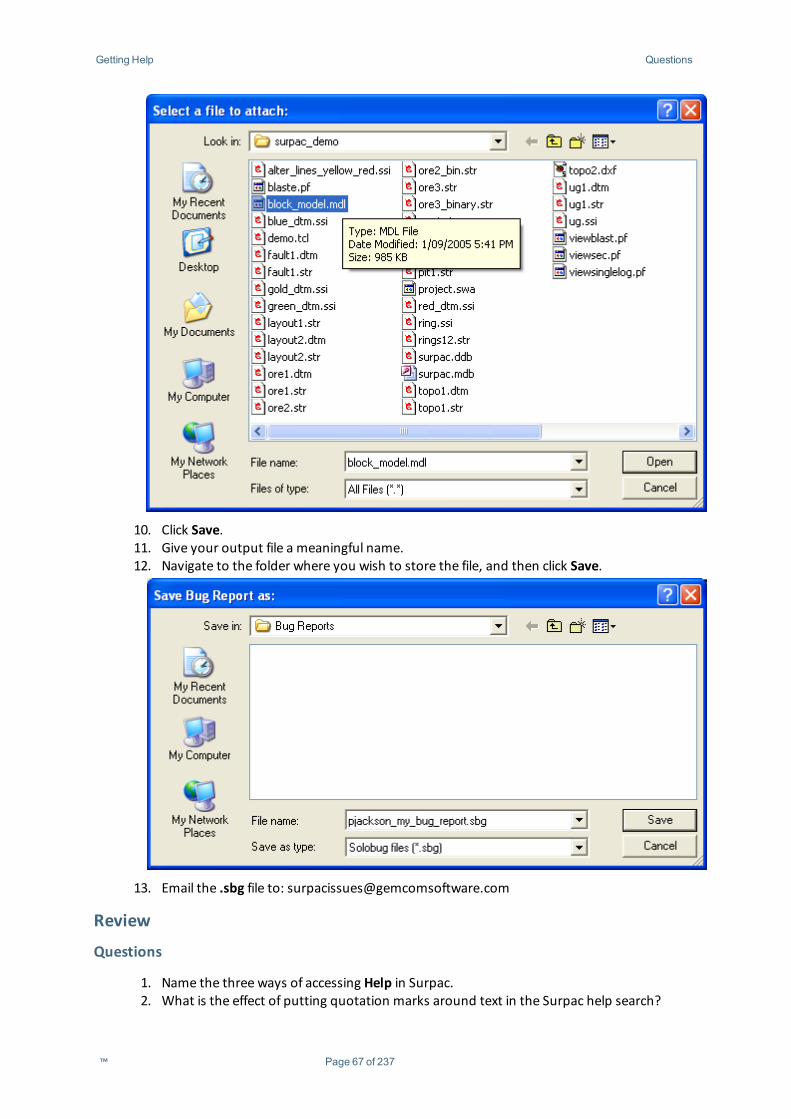
8. If you have data to demonstrate your problem, click Attach File…9. Navigate to the data file that you want to attach, and then click Open.
™ Page 66 of 237
Getting Help Questions
10. Click Save.11. Give your output file a meaningful name.12. Navigate to the folder where you wish to store the file, and then click Save.
13. Email the .sbg file to: [email protected]
Review
Questions
1. Name the three ways of accessing Help in Surpac.2. What is the effect of putting quotation marks around text in the Surpac help search?
™ Page 67 of 237

Getting Help Exercises
3. How is a bug report logged with Gemcom?4. Where would a support email be sent to?5. What is the difference between "Field help" and "Form help"?, How can they be accessed
?
Exercises
1. Accessing the Help while in Graphics.A. Choose Edit>Layer>Maths.B. Click on any field, then right click and choose field help.C. Move from field to field and read the field help.D. Click the question mark in the lower left of the form.
Questions:
i. What happens next?ii. How does this help differ from the field help?
2. Using the Surpac Help.A. ChooseHelp>Table of Contents.B. In the Search pane type, including quotation marks, "desktop icon".
Questions:
i. Howmany titles appear?ii. Now remove the quotation marks and see howmany titles appear.iii. What is the effect of using quotation marks?
3. Log Request.A. ChooseHelp>Log a RequestB. Fill out an enhancement request that more than onemenu/toolbar can be
activated /deactivated at a time.Questions:
i. What is the name of the file produced?ii. Where should this file be sent?
™ Page 68 of 237
Managing Data in Layers Activity: Create Layers
Managing Data in LayersMany computer-aided design (CAD) packages use the term “layer” to define a set of informationcontained within one file. In this sense, a Surpac string number is the same as a CAD package “layer”.However, in Surpac, a layer is an area in memory which contains data displayed in graphics. Layerscan contain strings from one or more string files. In this sense, you can append data from differentfiles into one layer, and create a new file. All layers are contained within the SurpacWork Area (SWA).
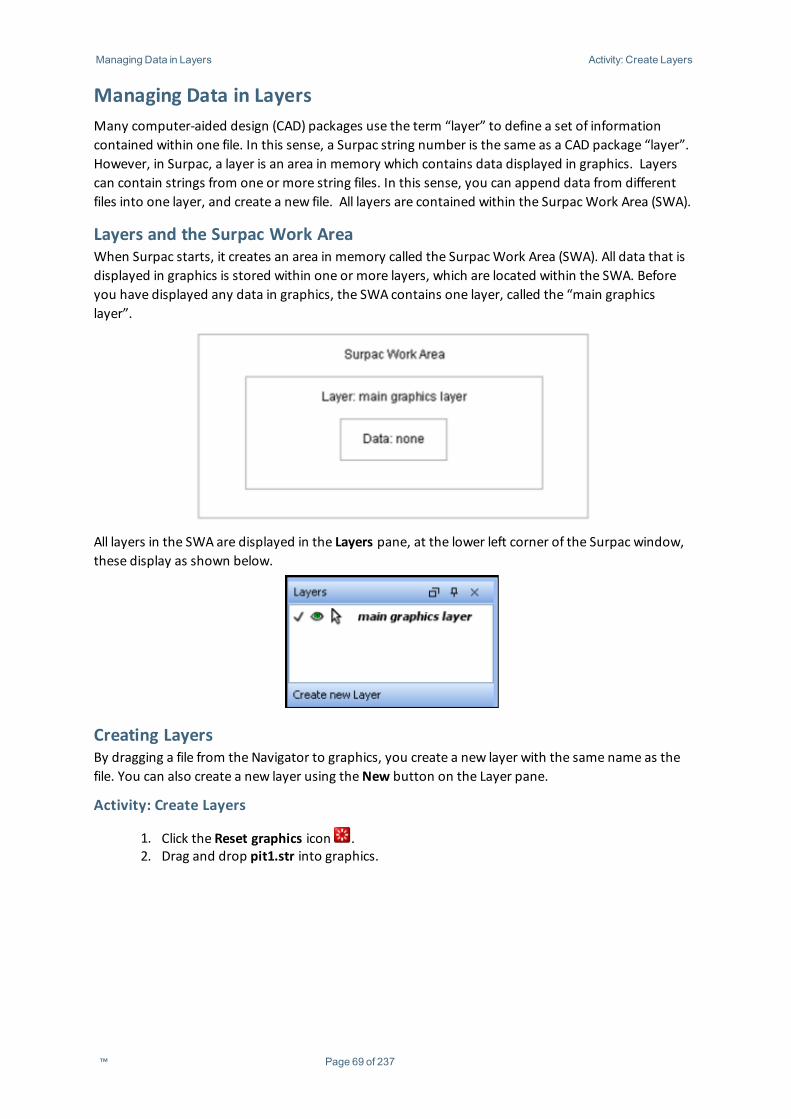
Layers and the Surpac Work AreaWhen Surpac starts, it creates an area in memory called the SurpacWork Area (SWA). All data that isdisplayed in graphics is stored within one or more layers, which are located within the SWA. Beforeyou have displayed any data in graphics, the SWA contains one layer, called the “main graphicslayer”.
All layers in the SWA are displayed in the Layers pane, at the lower left corner of the Surpac window,these display as shown below.
Creating LayersBy dragging a file from the Navigator to graphics, you create a new layer with the same name as thefile. You can also create a new layer using theNew button on the Layer pane.
Activity: Create Layers
1. Click the Reset graphics icon .2. Drag and drop pit1.str into graphics.
™ Page 69 of 237
Managing Data in Layers Activity: Create Layers
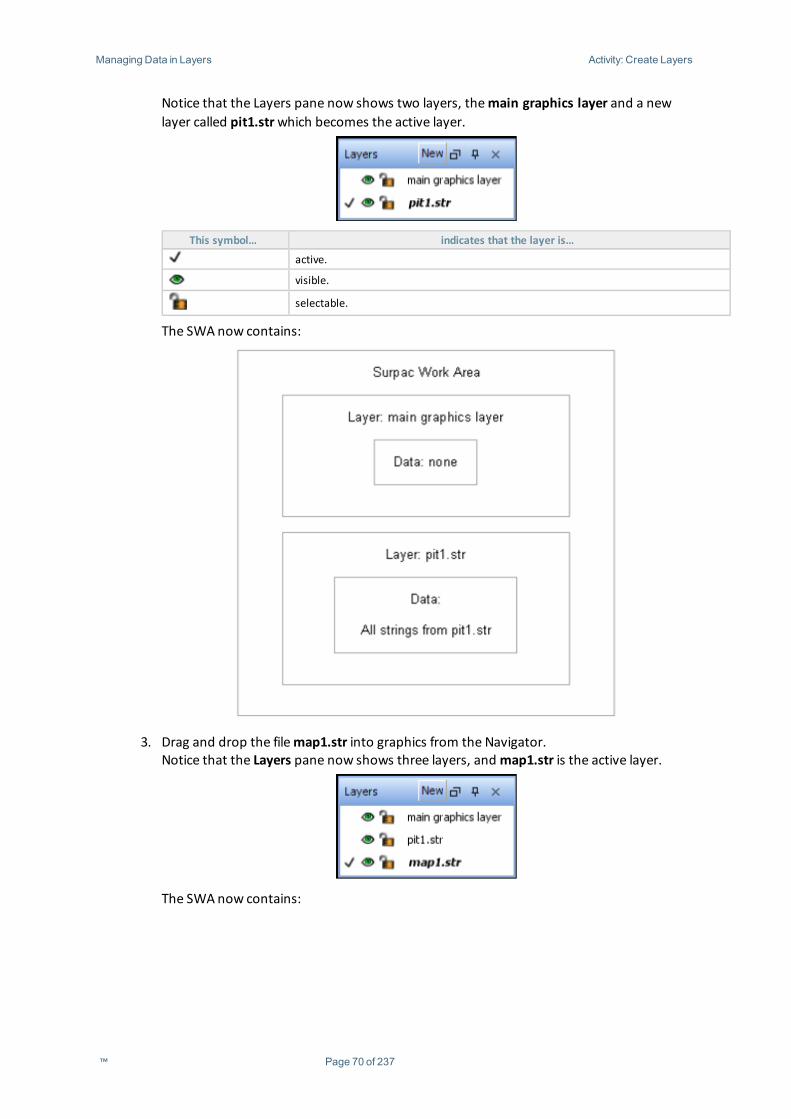
Notice that the Layers pane now shows two layers, themain graphics layer and a newlayer called pit1.strwhich becomes the active layer.
This symbol… indicates that the layer is…
active.
visible.
selectable.
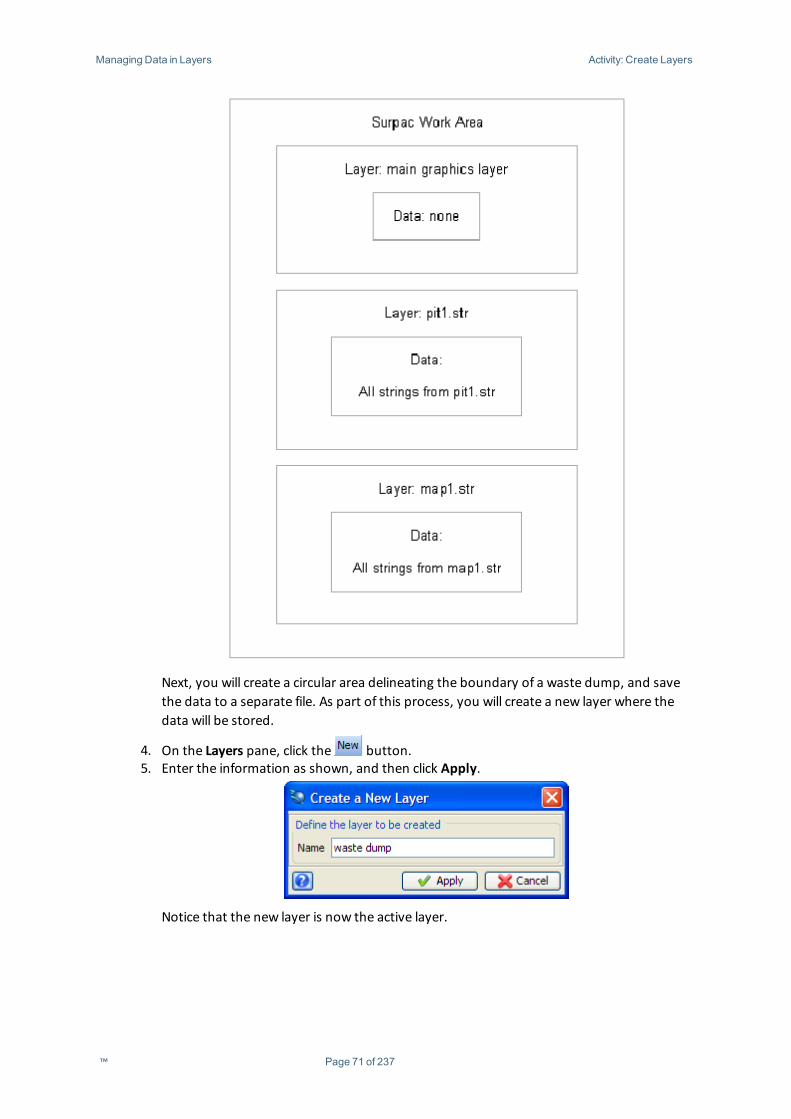
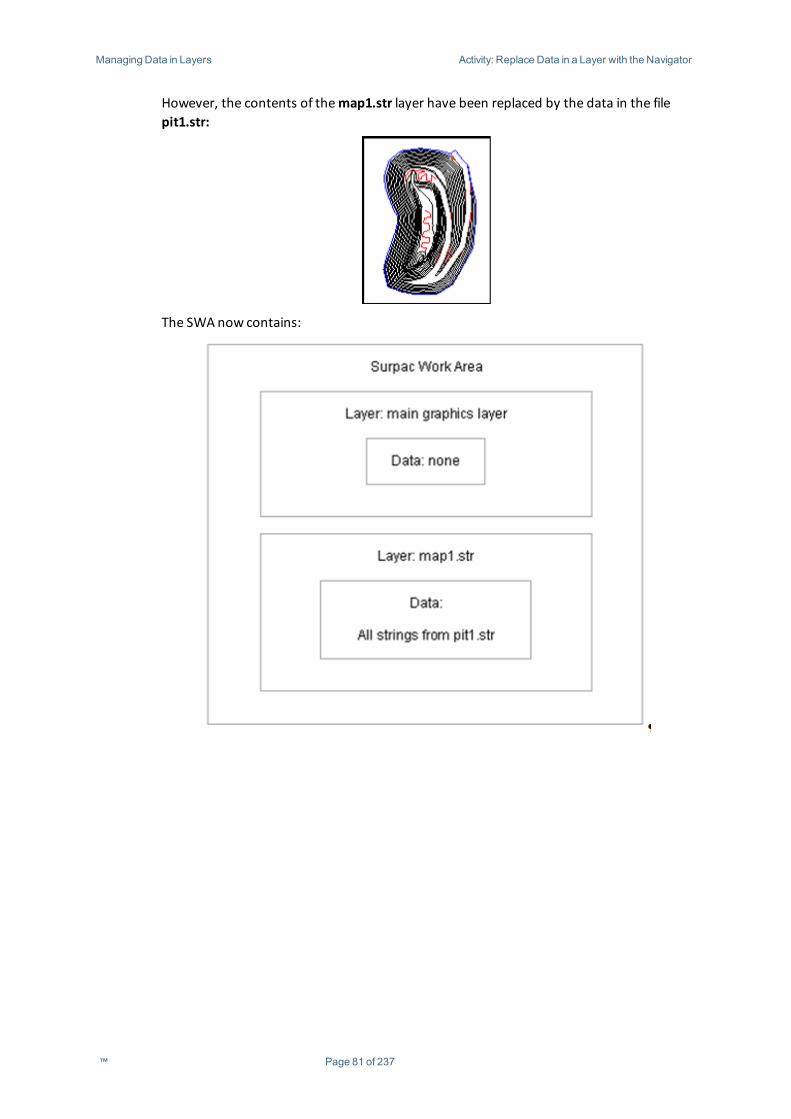
The SWAnow contains:
3. Drag and drop the filemap1.str into graphics from the Navigator.Notice that the Layers pane now shows three layers, andmap1.str is the active layer.
The SWAnow contains:
™ Page 70 of 237
Managing Data in Layers Activity: Create Layers
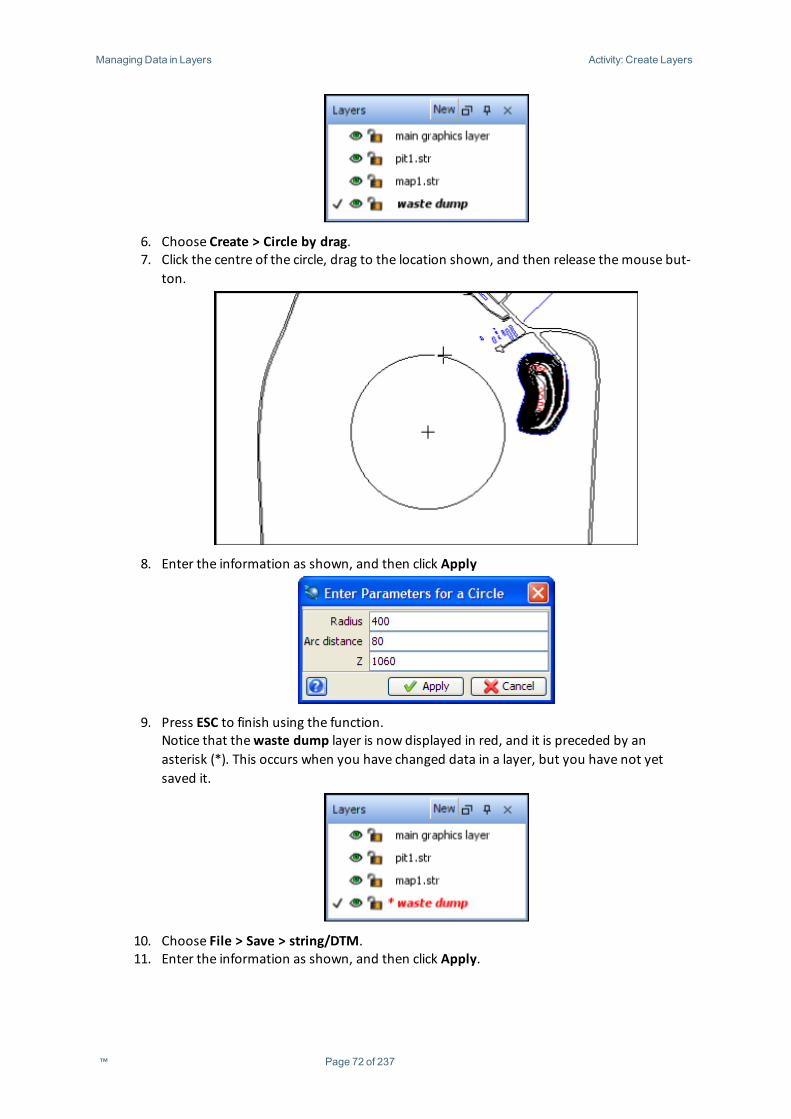
Next, you will create a circular area delineating the boundary of a waste dump, and savethe data to a separate file. As part of this process, you will create a new layer where thedata will be stored.
4. On the Layers pane, click the button.5. Enter the information as shown, and then click Apply.
Notice that the new layer is now the active layer.
™ Page 71 of 237
Managing Data in Layers Activity: Create Layers
6. Choose Create > Circle by drag.7. Click the centre of the circle, drag to the location shown, and then release themouse but-
ton.
8. Enter the information as shown, and then click Apply
9. Press ESC to finish using the function.Notice that thewaste dump layer is now displayed in red, and it is preceded by anasterisk (*). This occurs when you have changed data in a layer, but you have not yetsaved it.
10. Choose File > Save > string/DTM.11. Enter the information as shown, and then click Apply.
™ Page 72 of 237
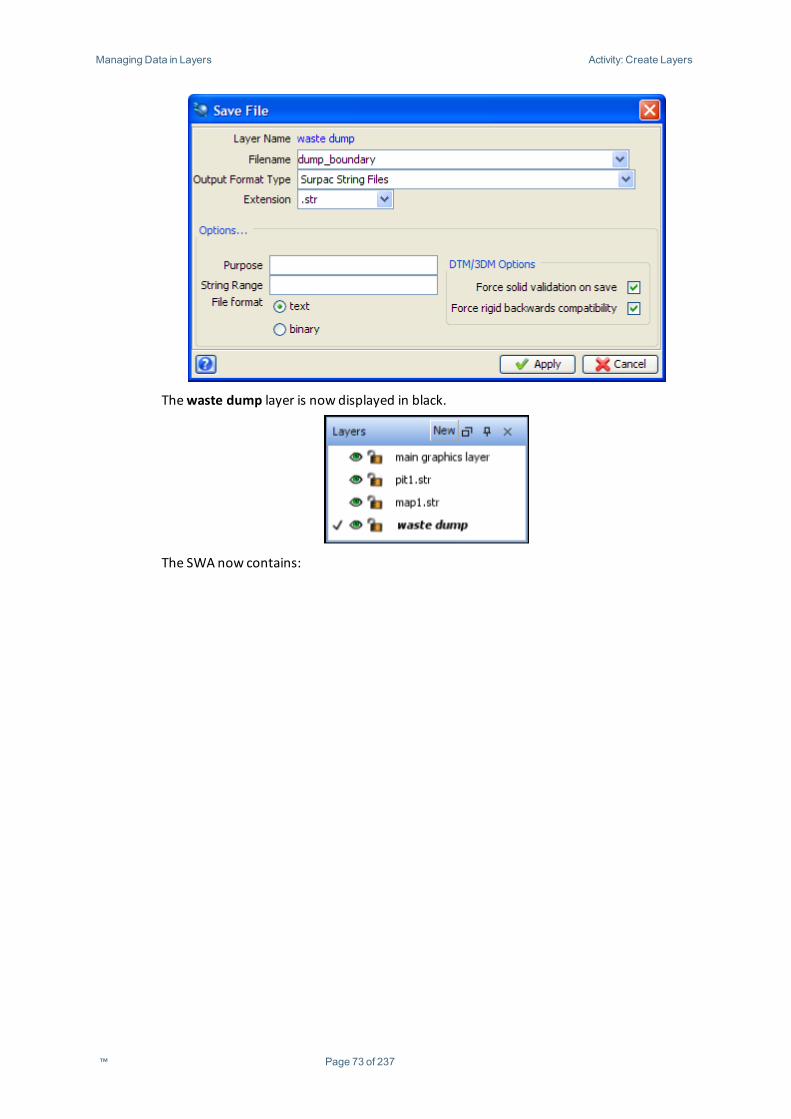
Managing Data in Layers Activity: Create Layers
Thewaste dump layer is now displayed in black.
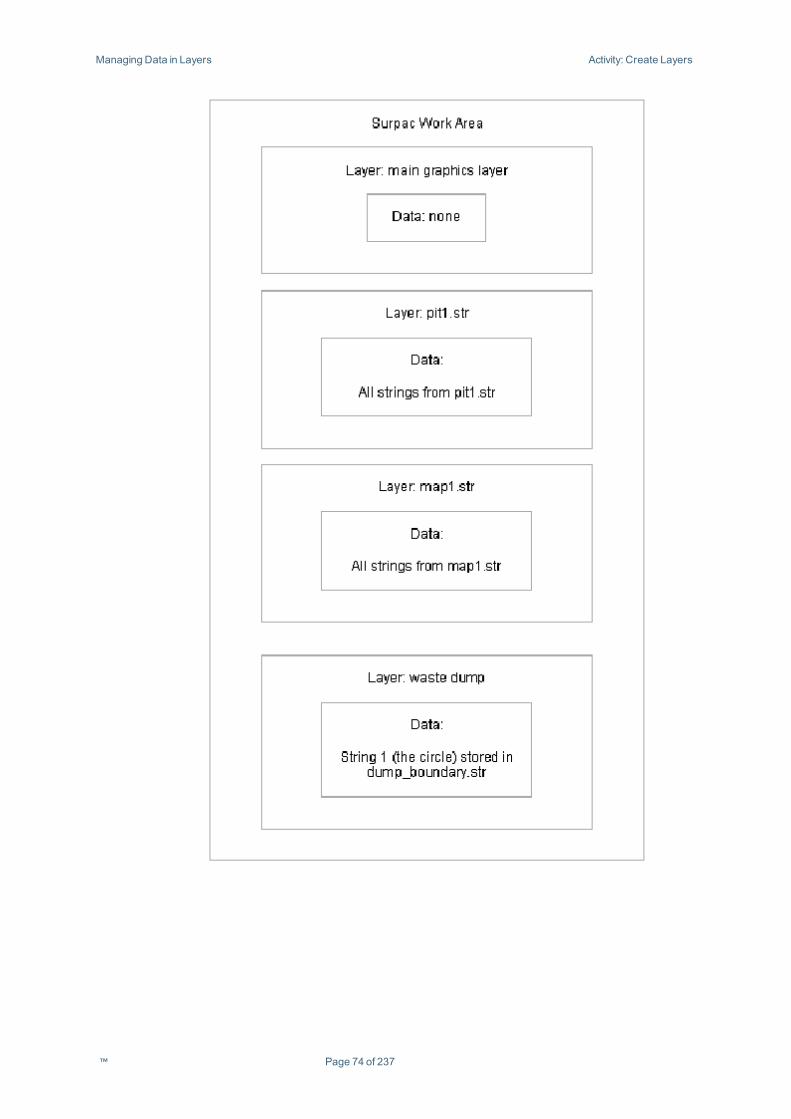
The SWAnow contains:
™ Page 73 of 237
Managing Data in Layers Activity: Create Layers
™ Page 74 of 237
Managing Data in Layers Activity: Append Data to a Layer with the Navigator
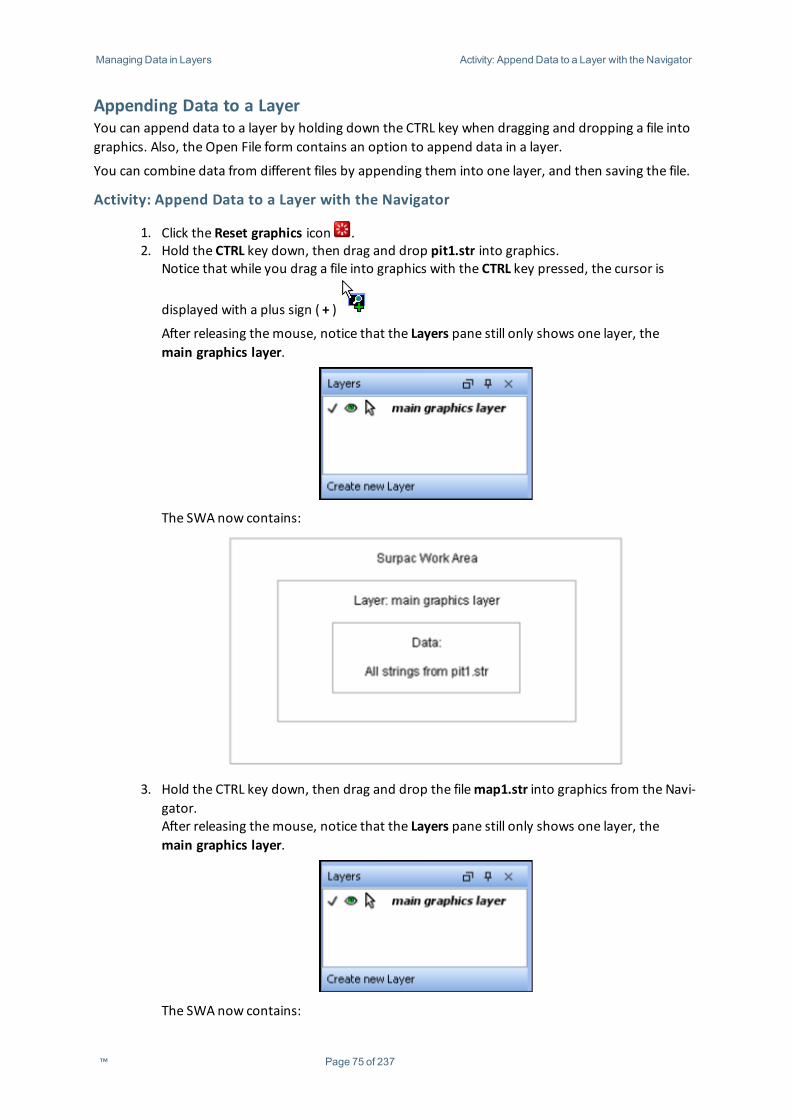
Appending Data to a LayerYou can append data to a layer by holding down the CTRL key when dragging and dropping a file intographics. Also, the Open File form contains an option to append data in a layer.
You can combine data from different files by appending them into one layer, and then saving the file.
Activity: Append Data to a Layer with the Navigator
1. Click the Reset graphics icon .2. Hold the CTRL key down, then drag and drop pit1.str into graphics.
Notice that while you drag a file into graphics with the CTRL key pressed, the cursor is
displayed with a plus sign ( + )
After releasing themouse, notice that the Layers pane still only shows one layer, themain graphics layer.
The SWAnow contains:
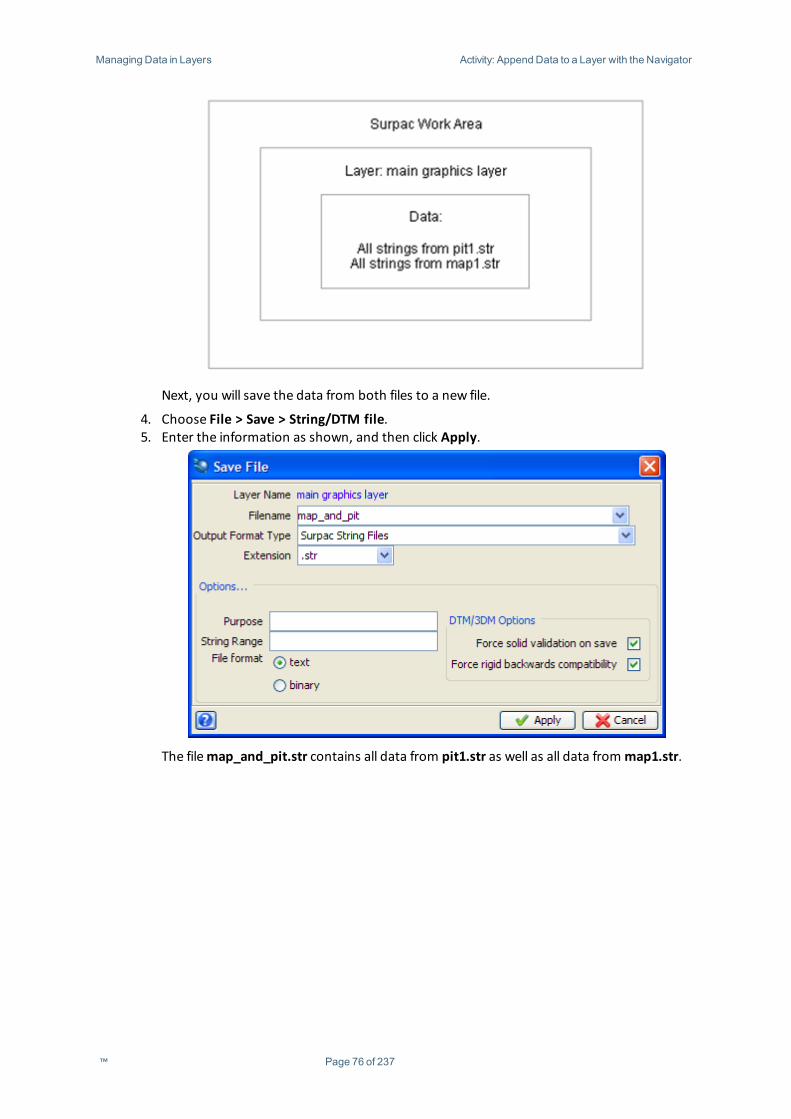
3. Hold the CTRL key down, then drag and drop the filemap1.str into graphics from the Navi-gator.After releasing themouse, notice that the Layers pane still only shows one layer, themain graphics layer.
The SWAnow contains:
™ Page 75 of 237
Managing Data in Layers Activity: Append Data to a Layer with the Navigator
Next, you will save the data from both files to a new file.
4. Choose File > Save > String/DTM file.5. Enter the information as shown, and then click Apply.
The filemap_and_pit.str contains all data from pit1.str as well as all data frommap1.str.
™ Page 76 of 237
Managing Data in Layers Activity: Append Data to a Layer with the Open File Command
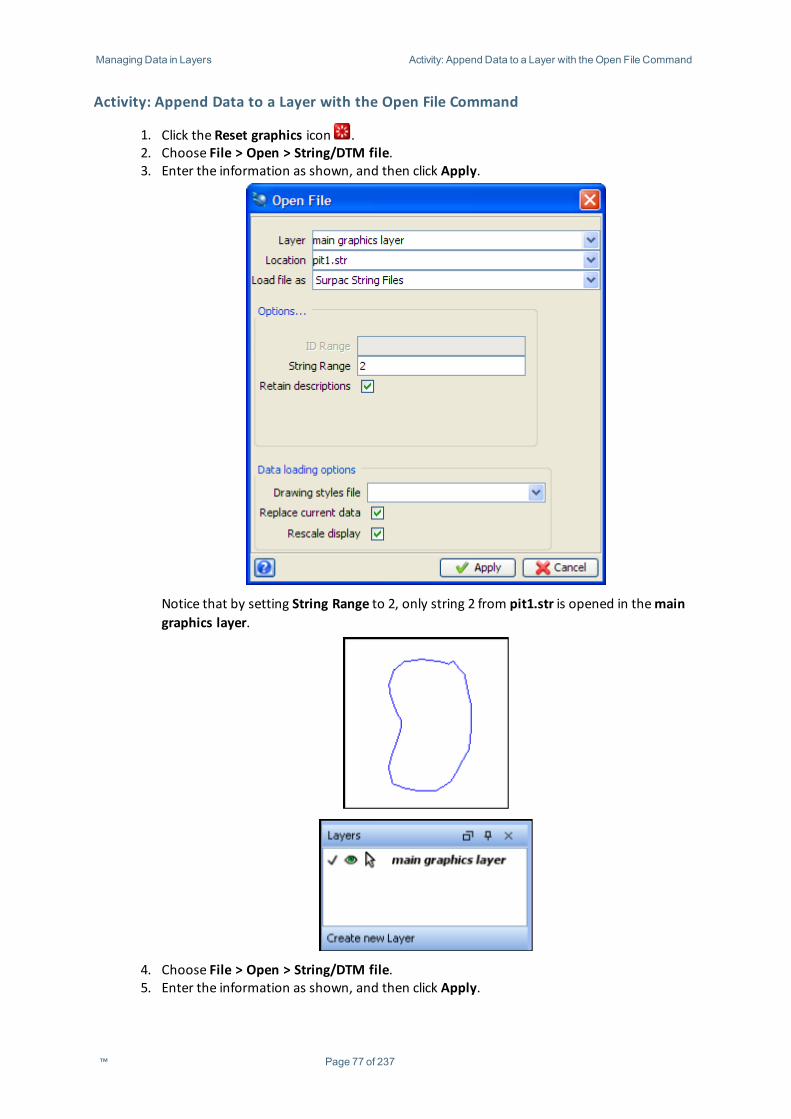
Activity: Append Data to a Layer with the Open File Command
1. Click the Reset graphics icon .2. Choose File > Open > String/DTM file.3. Enter the information as shown, and then click Apply.
Notice that by setting String Range to 2, only string 2 from pit1.str is opened in themaingraphics layer.
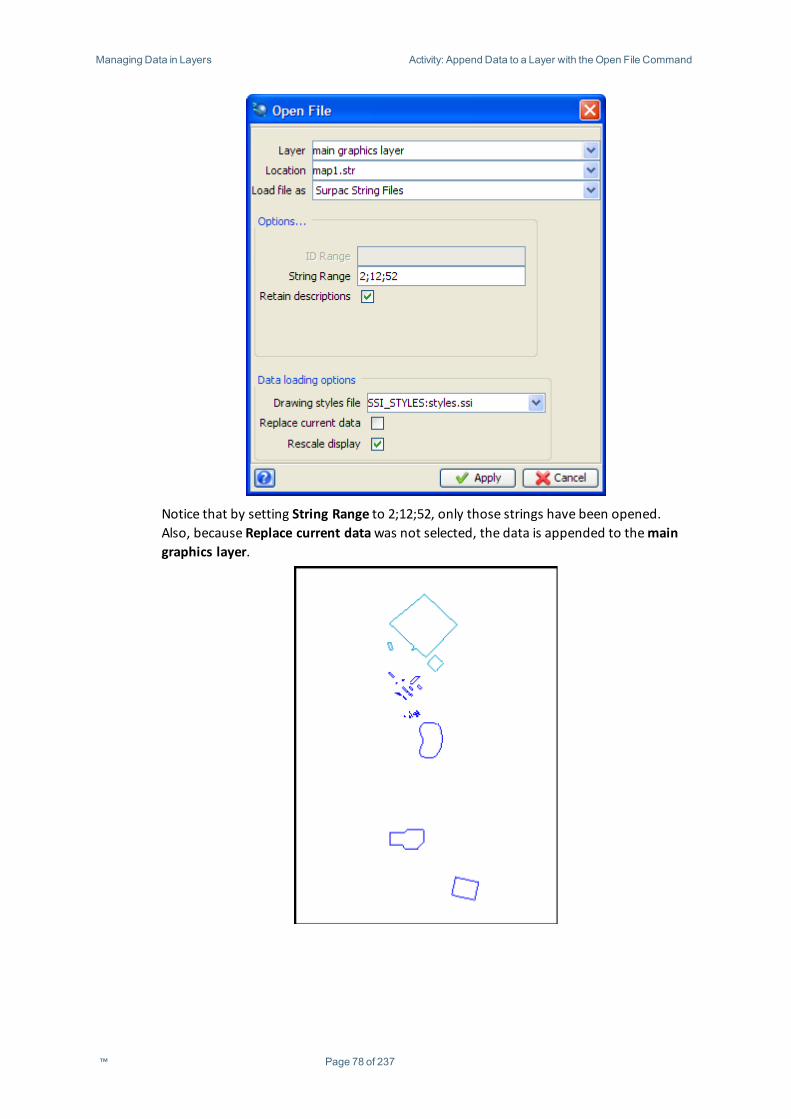
4. Choose File > Open > String/DTM file.5. Enter the information as shown, and then click Apply.
™ Page 77 of 237
Managing Data in Layers Activity: Append Data to a Layer with the Open File Command
Notice that by setting String Range to 2;12;52, only those strings have been opened. Also, because Replace current datawas not selected, the data is appended to themaingraphics layer.
™ Page 78 of 237
Managing Data in Layers Activity: Append Data to a Layer with the Open File Command
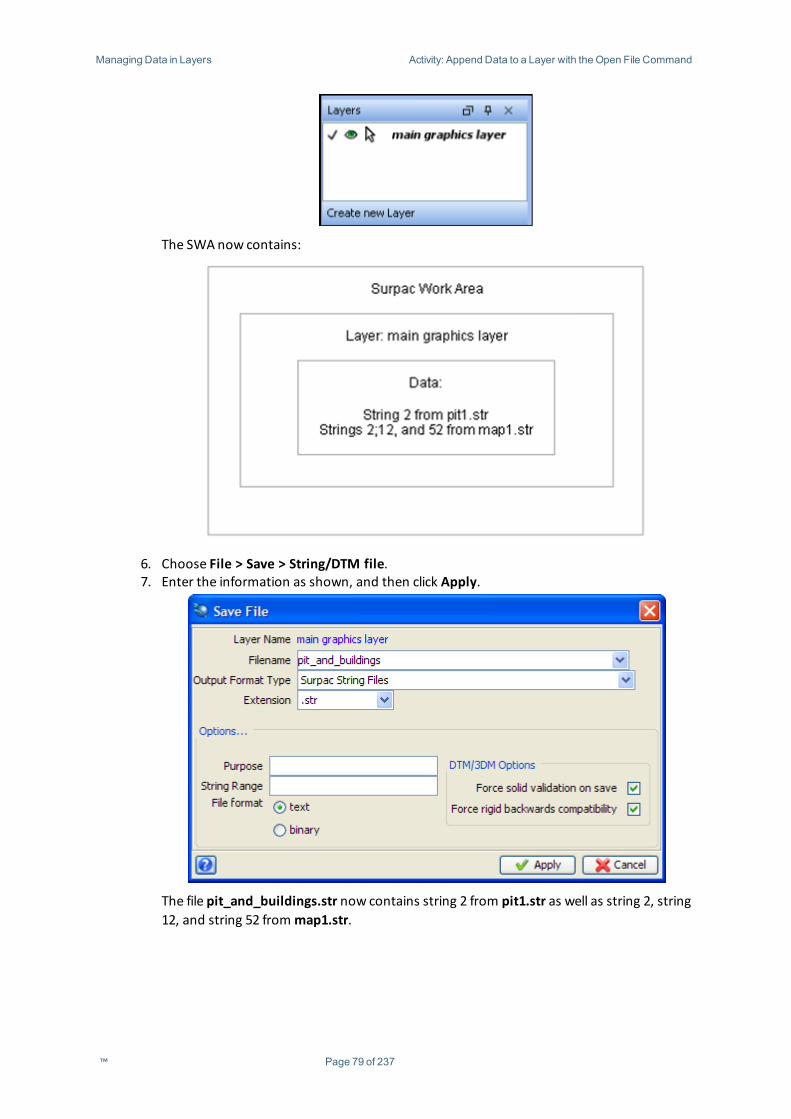
The SWAnow contains:
6. Choose File > Save > String/DTM file.7. Enter the information as shown, and then click Apply.
The file pit_and_buildings.str now contains string 2 from pit1.str as well as string 2, string12, and string 52 frommap1.str.
™ Page 79 of 237
Managing Data in Layers Activity: Replace Data in a Layer with the Navigator
Replacing Data in a LayerYou can replace data in a layer with the SHIFT key modifier when dragging and dropping a file intographics. Also, theOpen File form contains an option to replace data in a layer.
Activity: Replace Data in a Layer with the Navigator
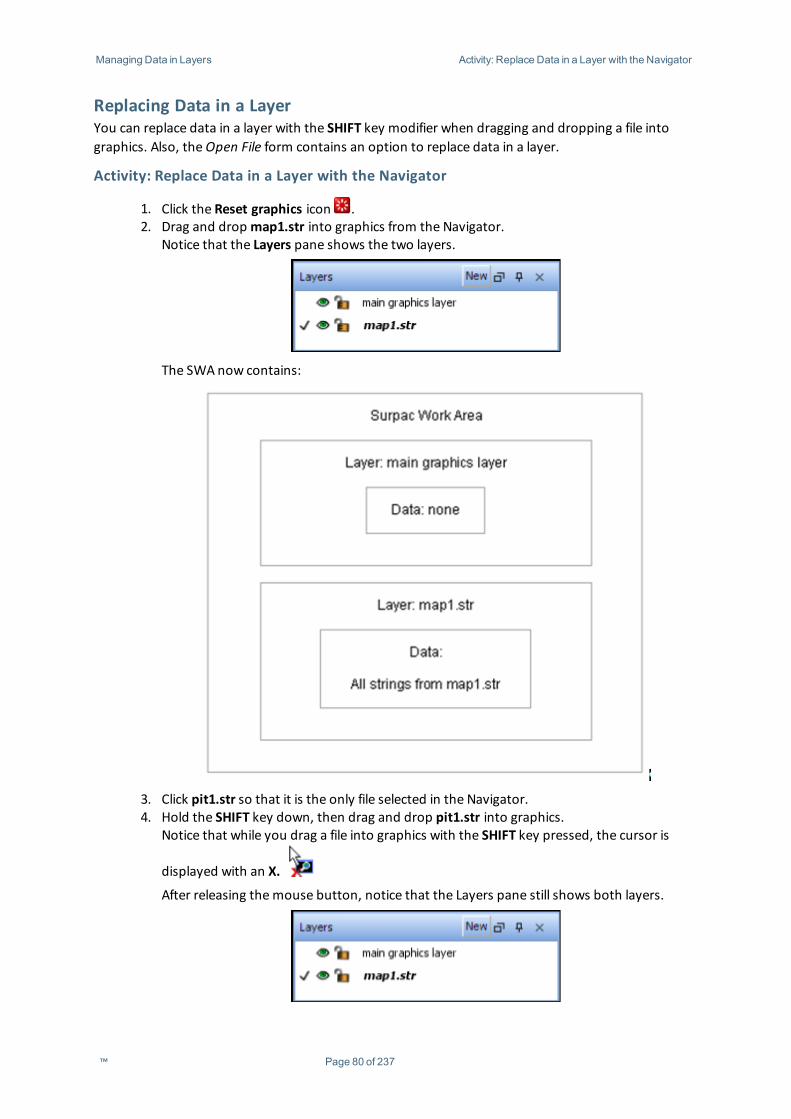
1. Click the Reset graphics icon .2. Drag and dropmap1.str into graphics from the Navigator.
Notice that the Layers pane shows the two layers.
The SWAnow contains:
3. Click pit1.str so that it is the only file selected in the Navigator.4. Hold the SHIFT key down, then drag and drop pit1.str into graphics.
Notice that while you drag a file into graphics with the SHIFT key pressed, the cursor is
displayed with an X.
After releasing themouse button, notice that the Layers pane still shows both layers.
™ Page 80 of 237
Managing Data in Layers Activity: Replace Data in a Layer with the Navigator
However, the contents of themap1.str layer have been replaced by the data in the filepit1.str:
The SWAnow contains:
™ Page 81 of 237
Managing Data in Layers Activity: Replace Data in a Layer Using theOpen File Command
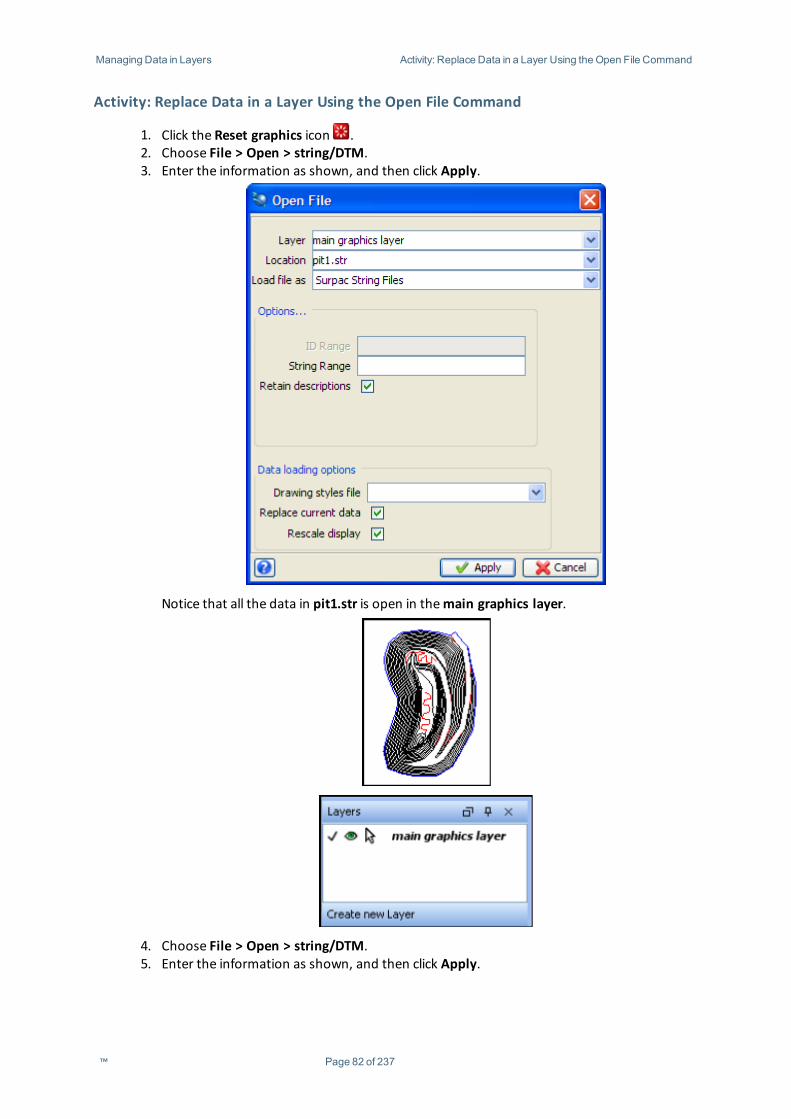
Activity: Replace Data in a Layer Using the Open File Command
1. Click the Reset graphics icon .2. Choose File > Open > string/DTM.3. Enter the information as shown, and then click Apply.
Notice that all the data in pit1.str is open in themain graphics layer.
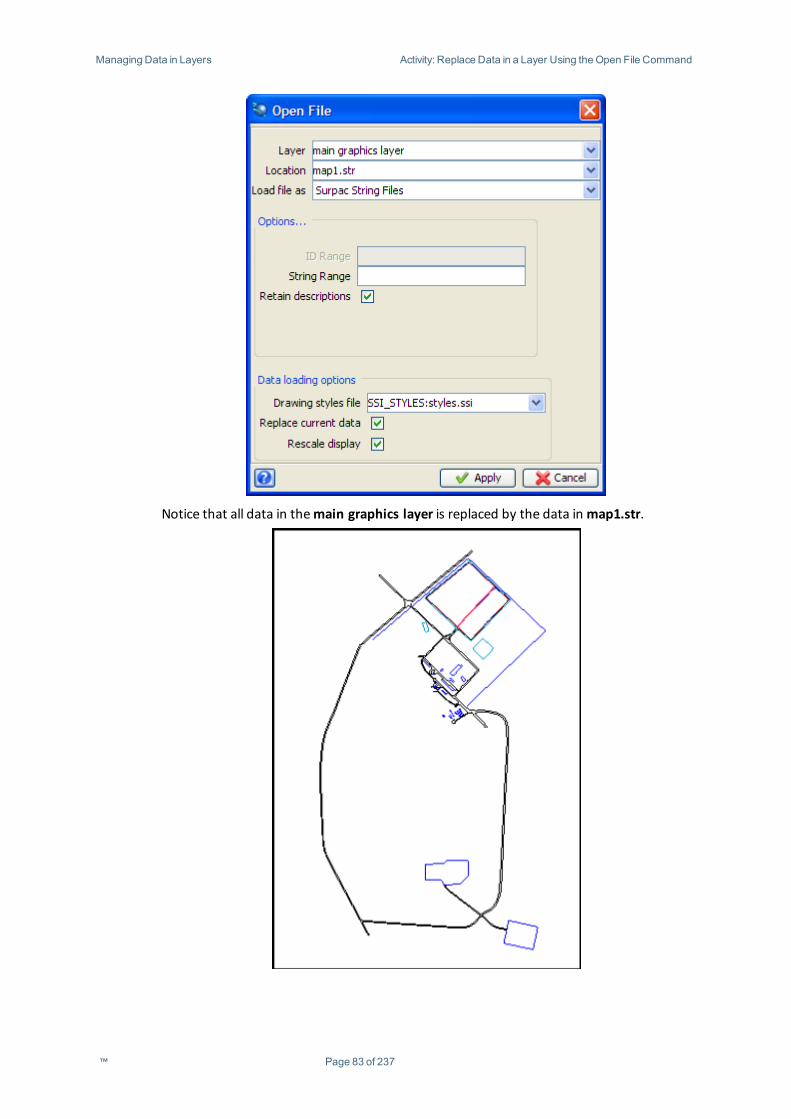
4. Choose File > Open > string/DTM.5. Enter the information as shown, and then click Apply.
™ Page 82 of 237
Managing Data in Layers Activity: Replace Data in a Layer Using theOpen File Command
Notice that all data in themain graphics layer is replaced by the data inmap1.str.
™ Page 83 of 237
Managing Data in Layers Activity: Save aWorkspace
Saving Workspace SettingsYou can save all the data, layers, and settings in a SurpacWork Area (SWA) file. You can restore allthis information by opening the SWA file.
Activity: Save a Workspace
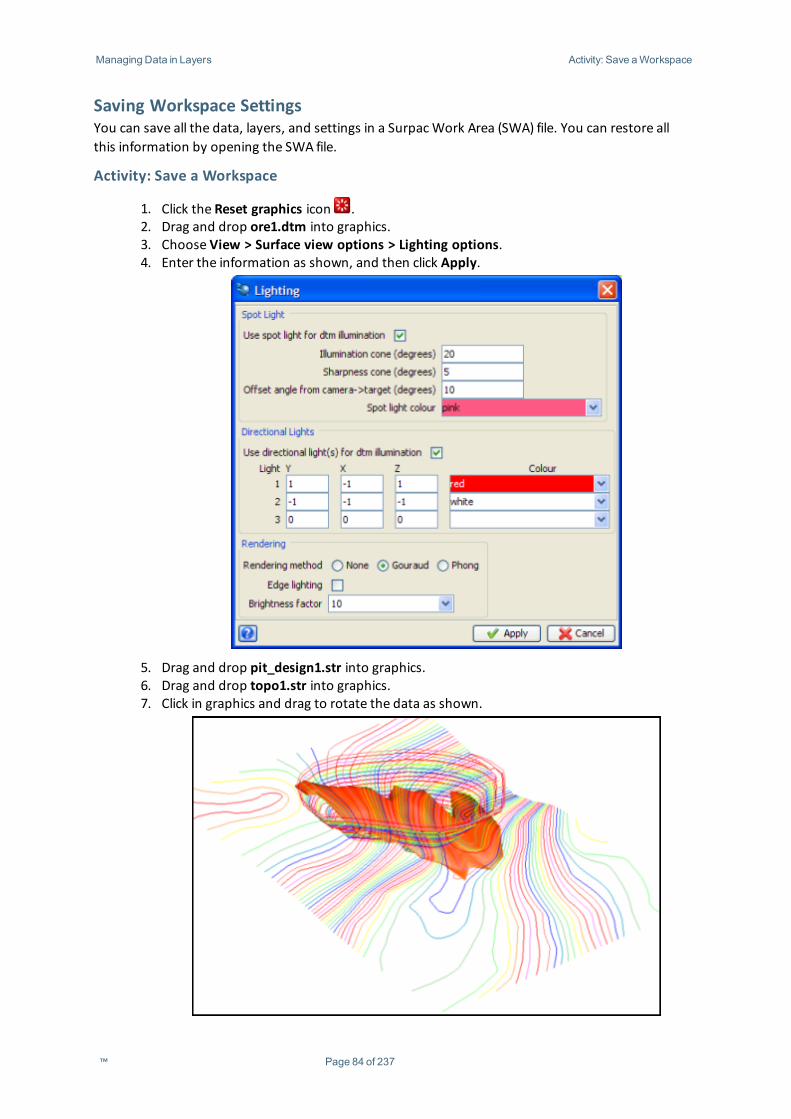
1. Click the Reset graphics icon .2. Drag and drop ore1.dtm into graphics.3. Choose View > Surface view options > Lighting options.4. Enter the information as shown, and then click Apply.
5. Drag and drop pit_design1.str into graphics.6. Drag and drop topo1.str into graphics.7. Click in graphics and drag to rotate the data as shown.
™ Page 84 of 237
Managing Data in Layers Activity: Save aWorkspace
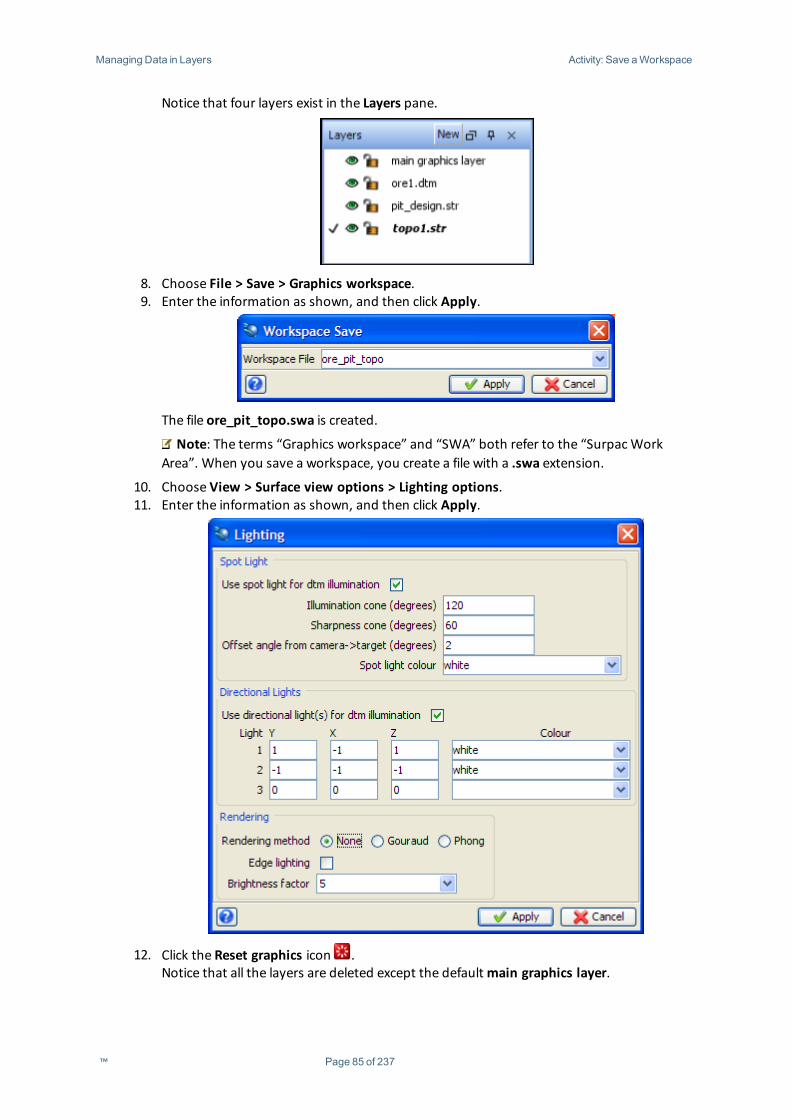
Notice that four layers exist in the Layers pane.
8. Choose File > Save > Graphics workspace.9. Enter the information as shown, and then click Apply.
The file ore_pit_topo.swa is created.
Note: The terms “Graphics workspace” and “SWA” both refer to the “SurpacWorkArea”. When you save a workspace, you create a file with a .swa extension.
10. Choose View > Surface view options > Lighting options.11. Enter the information as shown, and then click Apply.
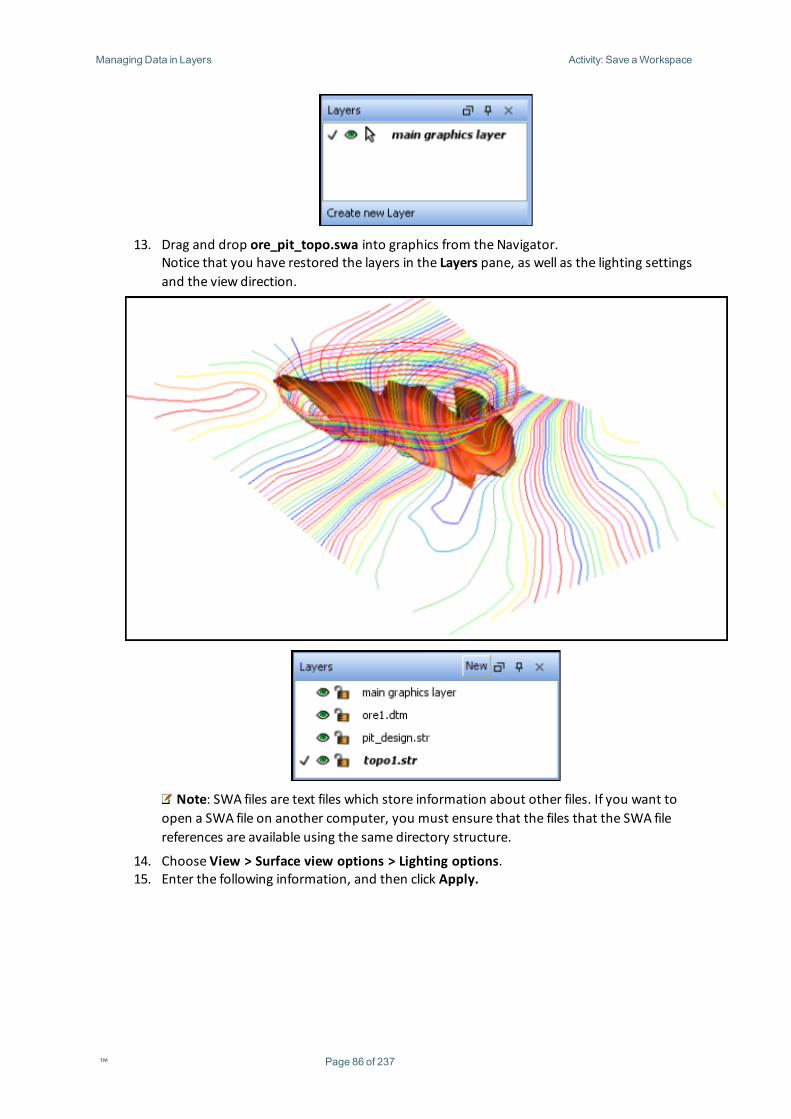
12. Click the Reset graphics icon .Notice that all the layers are deleted except the defaultmain graphics layer.
™ Page 85 of 237
Managing Data in Layers Activity: Save aWorkspace
13. Drag and drop ore_pit_topo.swa into graphics from the Navigator.Notice that you have restored the layers in the Layers pane, as well as the lighting settingsand the view direction.
Note: SWA files are text files which store information about other files. If you want toopen a SWA file on another computer, you must ensure that the files that the SWA filereferences are available using the same directory structure.
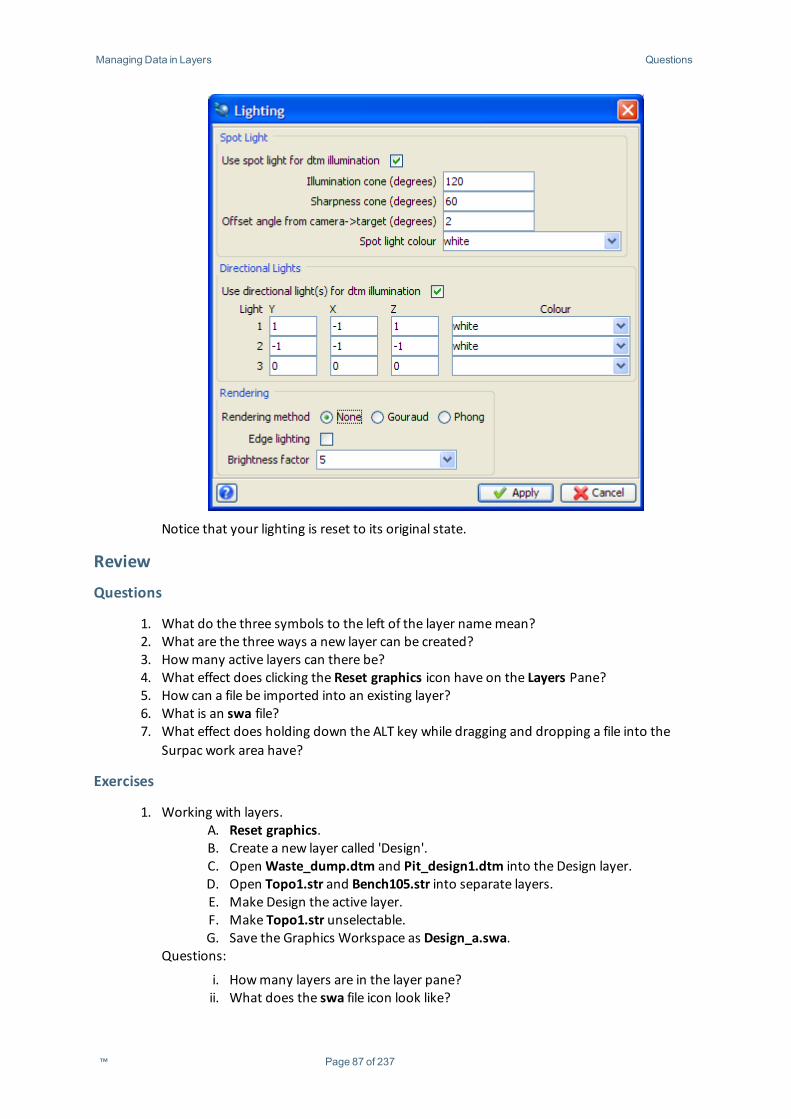
14. Choose View > Surface view options > Lighting options.15. Enter the following information, and then click Apply.
™ Page 86 of 237
Managing Data in Layers Questions
Notice that your lighting is reset to its original state.
Review
Questions
1. What do the three symbols to the left of the layer namemean?2. What are the three ways a new layer can be created?3. Howmany active layers can there be?4. What effect does clicking the Reset graphics icon have on the Layers Pane?5. How can a file be imported into an existing layer?6. What is an swa file?7. What effect does holding down the ALT key while dragging and dropping a file into the
Surpac work area have?
Exercises
1. Working with layers.A. Reset graphics.B. Create a new layer called 'Design'.C. OpenWaste_dump.dtm and Pit_design1.dtm into the Design layer.D. Open Topo1.str and Bench105.str into separate layers.E. Make Design the active layer.F. Make Topo1.str unselectable.G. Save the Graphics Workspace as Design_a.swa.
Questions:
i. Howmany layers are in the layer pane?ii. What does the swa file icon look like?
™ Page 87 of 237

Managing Data in Layers Exercises
2. Working with layers (exercise 2).A. Reset graphics.B. Open Pit_design1.str, Topo1.str and ore1.dtm into separate layers.C. Display in section view.D. Make Pit_design1.str invisible.E. Make Topo1.str the active layer.F. Save the Graphics Workspace as View.swa.G. Reset graphics.H. Create a new layer called 'View'.I. Recall the same files into the View layer.J. Save the data as View.str.
Question:
i. What is the difference between View.str and View.swa ?
™ Page 88 of 237
Strings Exercises
StringsThemost common file format used for storing information in Surpac is a string file. A string filecontains coordinate information for one or more points, as well as optional descriptive informationfor each point. It is important to understand how Surpac organises and uses data stored within astring file; this will enable you to work more efficiently with strings.
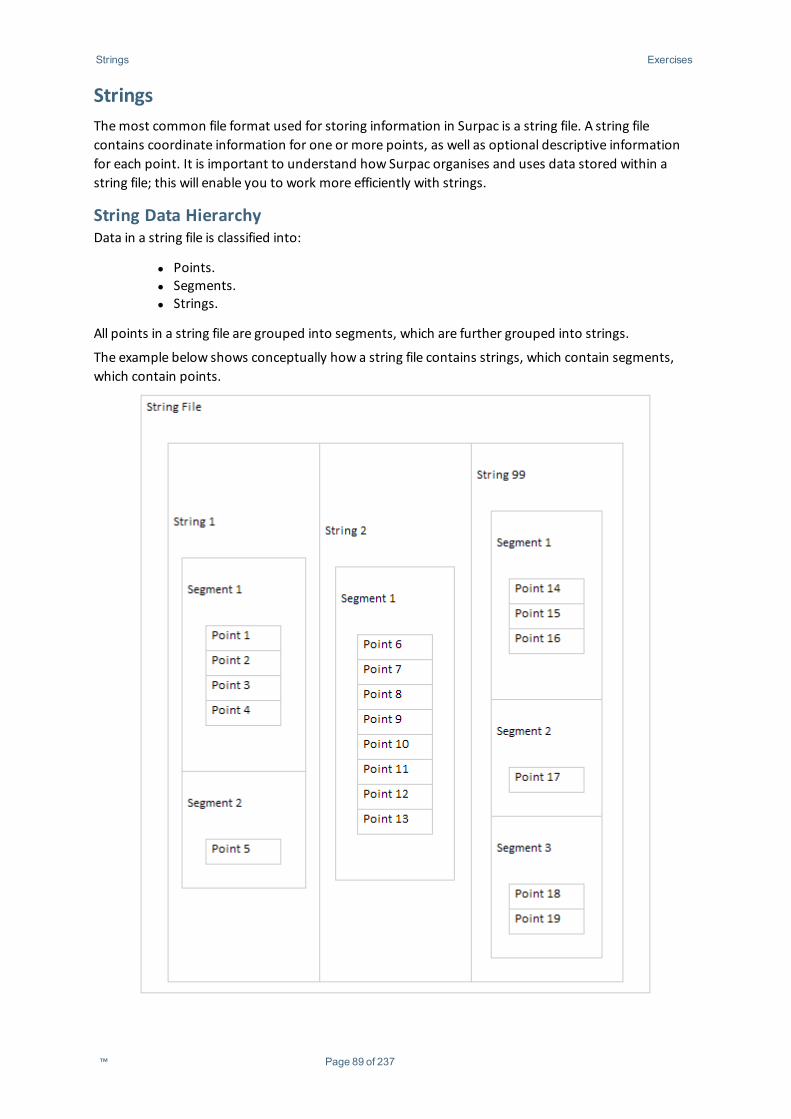
String Data HierarchyData in a string file is classified into:
l Points.l Segments.l Strings.
All points in a string file are grouped into segments, which are further grouped into strings.
The example below shows conceptually how a string file contains strings, which contain segments,which contain points.
™ Page 89 of 237
Strings Exercises
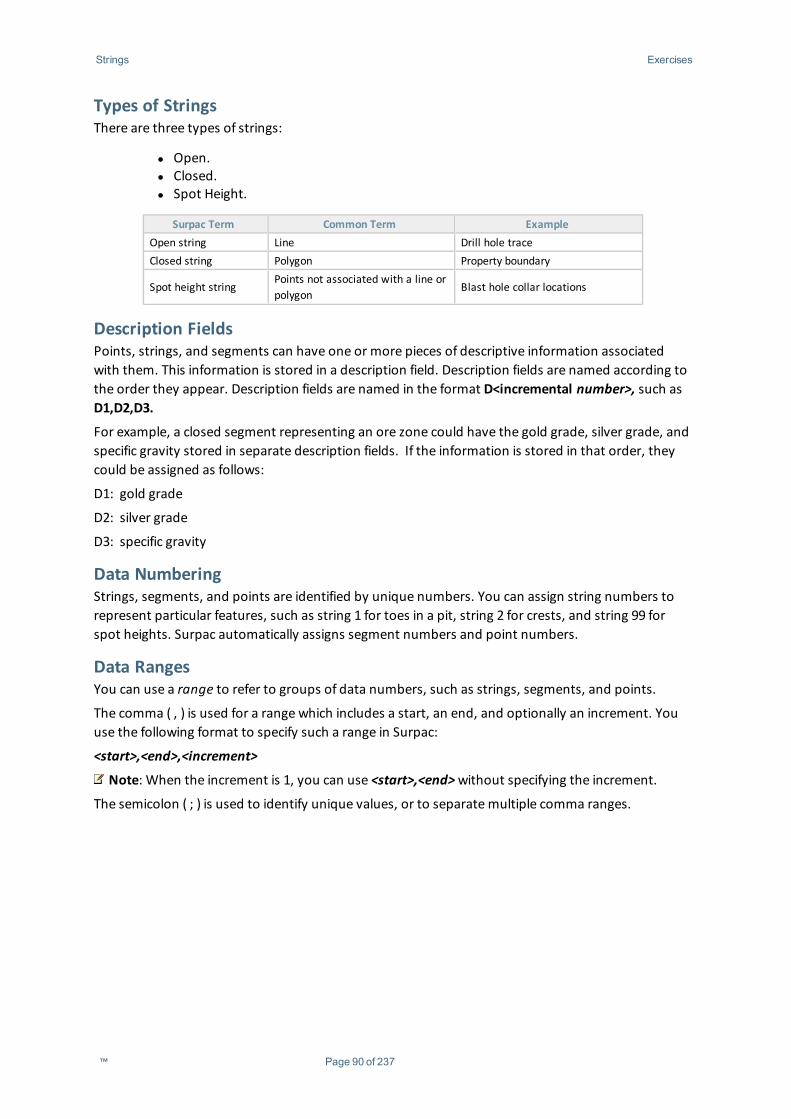
Types of StringsThere are three types of strings:
l Open.l Closed.l Spot Height.
Surpac Term Common Term ExampleOpen string Line Drill hole traceClosed string Polygon Property boundary
Spot height stringPoints not associated with a line orpolygon
Blast hole collar locations
Description FieldsPoints, strings, and segments can have one or more pieces of descriptive information associatedwith them. This information is stored in a description field. Description fields are named according tothe order they appear. Description fields are named in the format D<incremental number>, such asD1,D2,D3.
For example, a closed segment representing an ore zone could have the gold grade, silver grade, andspecific gravity stored in separate description fields. If the information is stored in that order, theycould be assigned as follows:
D1: gold grade
D2: silver grade
D3: specific gravity
Data NumberingStrings, segments, and points are identified by unique numbers. You can assign string numbers torepresent particular features, such as string 1 for toes in a pit, string 2 for crests, and string 99 forspot heights. Surpac automatically assigns segment numbers and point numbers.
Data RangesYou can use a range to refer to groups of data numbers, such as strings, segments, and points.
The comma ( , ) is used for a range which includes a start, an end, and optionally an increment. Youuse the following format to specify such a range in Surpac:
<start>,<end>,<increment>
Note: When the increment is 1, you can use <start>,<end>without specifying the increment.
The semicolon ( ; ) is used to identify unique values, or to separatemultiple comma ranges.
™ Page 90 of 237
Strings Exercises
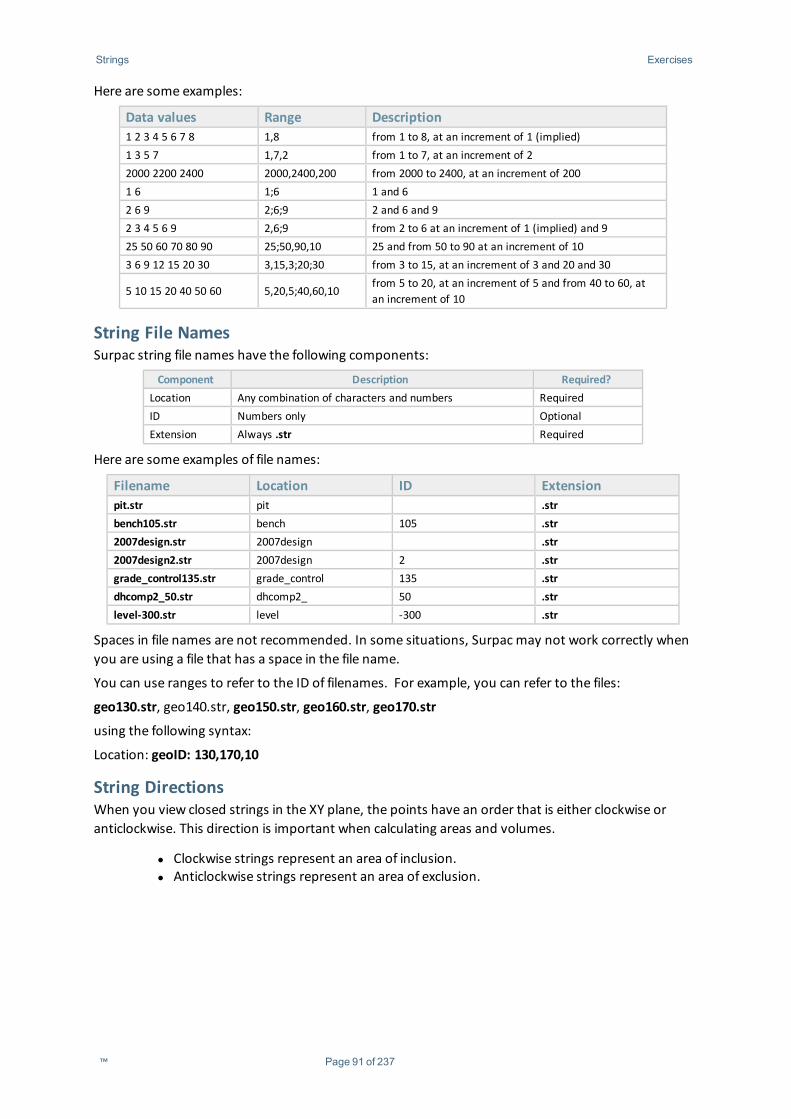
Here are some examples:
Data values Range Description1 2 3 4 5 6 7 8 1,8 from 1 to 8, at an increment of 1 (implied)1 3 5 7 1,7,2 from 1 to 7, at an increment of 22000 2200 2400 2000,2400,200 from 2000 to 2400, at an increment of 2001 6 1;6 1 and 62 6 9 2;6;9 2 and 6 and 92 3 4 5 6 9 2,6;9 from 2 to 6 at an increment of 1 (implied) and 925 50 60 70 80 90 25;50,90,10 25 and from 50 to 90 at an increment of 103 6 9 12 15 20 30 3,15,3;20;30 from 3 to 15, at an increment of 3 and 20 and 30
5 10 15 20 40 50 60 5,20,5;40,60,10from 5 to 20, at an increment of 5 and from 40 to 60, atan increment of 10
String File NamesSurpac string file names have the following components:
Component Description Required?Location Any combination of characters and numbers RequiredID Numbers only OptionalExtension Always .str Required
Here are some examples of file names:
Filename Location ID Extensionpit.str pit .strbench105.str bench 105 .str2007design.str 2007design .str2007design2.str 2007design 2 .strgrade_control135.str grade_control 135 .strdhcomp2_50.str dhcomp2_ 50 .strlevel-300.str level -300 .str
Spaces in file names are not recommended. In some situations, Surpac may not work correctly whenyou are using a file that has a space in the file name.
You can use ranges to refer to the ID of filenames. For example, you can refer to the files:
geo130.str, geo140.str, geo150.str, geo160.str, geo170.str
using the following syntax:
Location: geoID: 130,170,10
String DirectionsWhen you view closed strings in the XY plane, the points have an order that is either clockwise oranticlockwise. This direction is important when calculating areas and volumes.
l Clockwise strings represent an area of inclusion.l Anticlockwise strings represent an area of exclusion.
™ Page 91 of 237
Strings Activity: View String Data
Viewing String DataHere is an example which demonstrates the previous concepts.
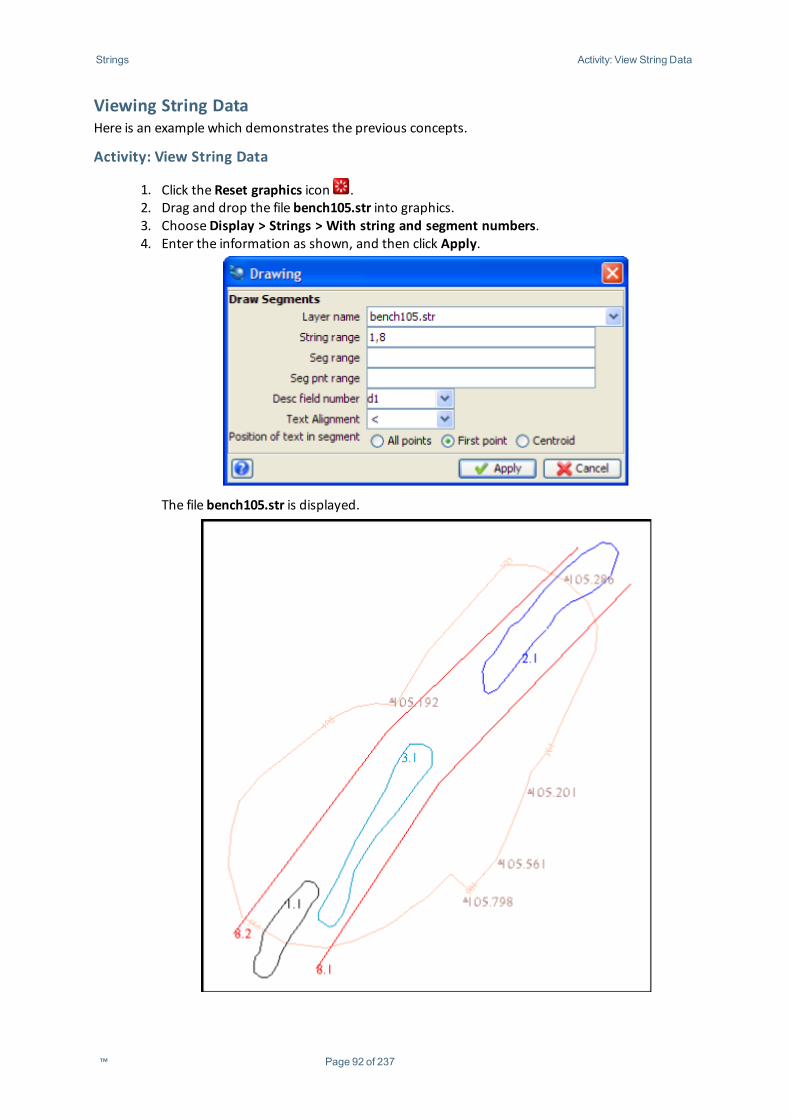
Activity: View String Data
1. Click the Reset graphics icon .2. Drag and drop the file bench105.str into graphics.3. ChooseDisplay > Strings > With string and segment numbers.4. Enter the information as shown, and then click Apply.
The file bench105.str is displayed.
™ Page 92 of 237
Strings Activity: View String Data
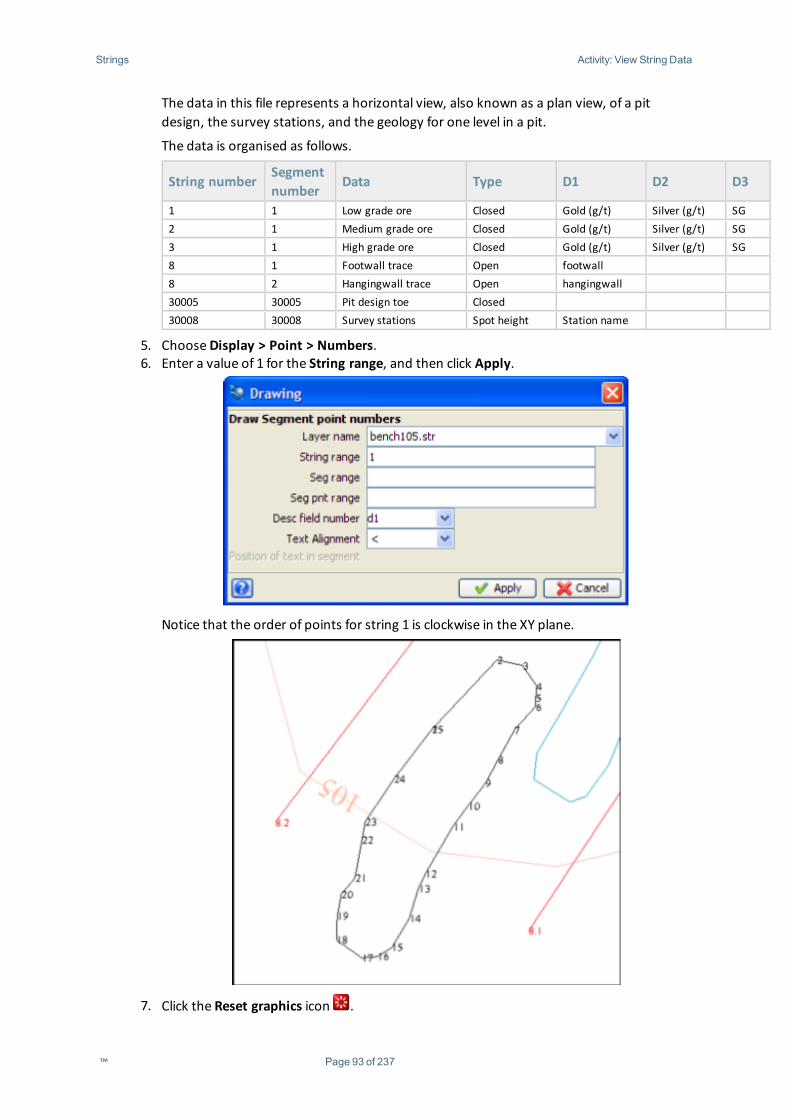
The data in this file represents a horizontal view, also known as a plan view, of a pitdesign, the survey stations, and the geology for one level in a pit.
The data is organised as follows.
String numberSegmentnumber
Data Type D1 D2 D3
1 1 Low grade ore Closed Gold (g/t) Silver (g/t) SG2 1 Medium grade ore Closed Gold (g/t) Silver (g/t) SG3 1 High grade ore Closed Gold (g/t) Silver (g/t) SG8 1 Footwall trace Open footwall8 2 Hangingwall trace Open hangingwall30005 30005 Pit design toe Closed30008 30008 Survey stations Spot height Station name
5. ChooseDisplay > Point > Numbers.6. Enter a value of 1 for the String range, and then click Apply.
Notice that the order of points for string 1 is clockwise in the XY plane.
7. Click the Reset graphics icon .
™ Page 93 of 237

Strings Activity: View String Data
Note: To see all of the steps performed in this task, run 01a_viewing_string_data.tcl. You will needto click Apply on any forms presented.
™ Page 94 of 237
Strings Activity: View String Data in a Text Editor
String File StructureSometimes it is helpful to view the contents of a string file in a text editor.
Activity: View String Data in a Text Editor
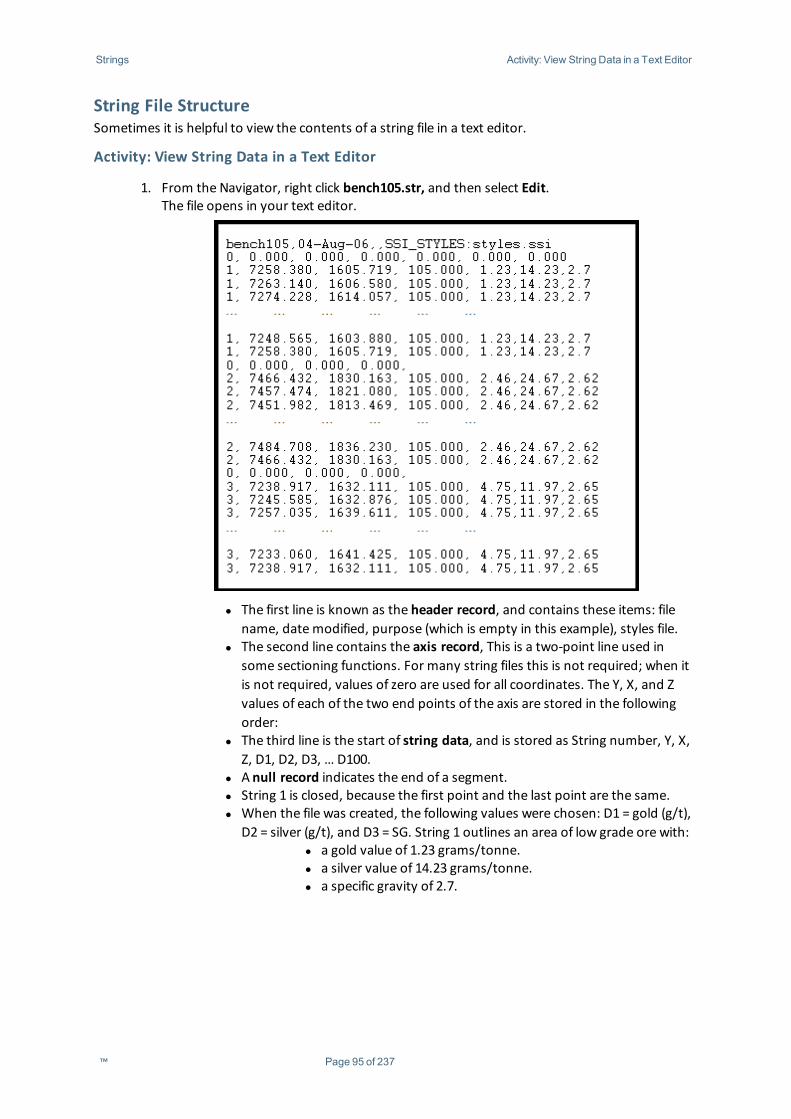
1. From the Navigator, right click bench105.str, and then select Edit.The file opens in your text editor.
l The first line is known as the header record, and contains these items: filename, datemodified, purpose (which is empty in this example), styles file.
l The second line contains the axis record, This is a two-point line used insome sectioning functions. For many string files this is not required; when itis not required, values of zero are used for all coordinates. The Y, X, and Zvalues of each of the two end points of the axis are stored in the followingorder:
l The third line is the start of string data, and is stored as String number, Y, X,Z, D1, D2, D3, … D100.
l A null record indicates the end of a segment.l String 1 is closed, because the first point and the last point are the same.l When the file was created, the following values were chosen: D1 = gold (g/t),
D2 = silver (g/t), and D3 = SG. String 1 outlines an area of low grade ore with:l a gold value of 1.23 grams/tonne.l a silver value of 14.23 grams/tonne.l a specific gravity of 2.7.
™ Page 95 of 237
Strings Questions
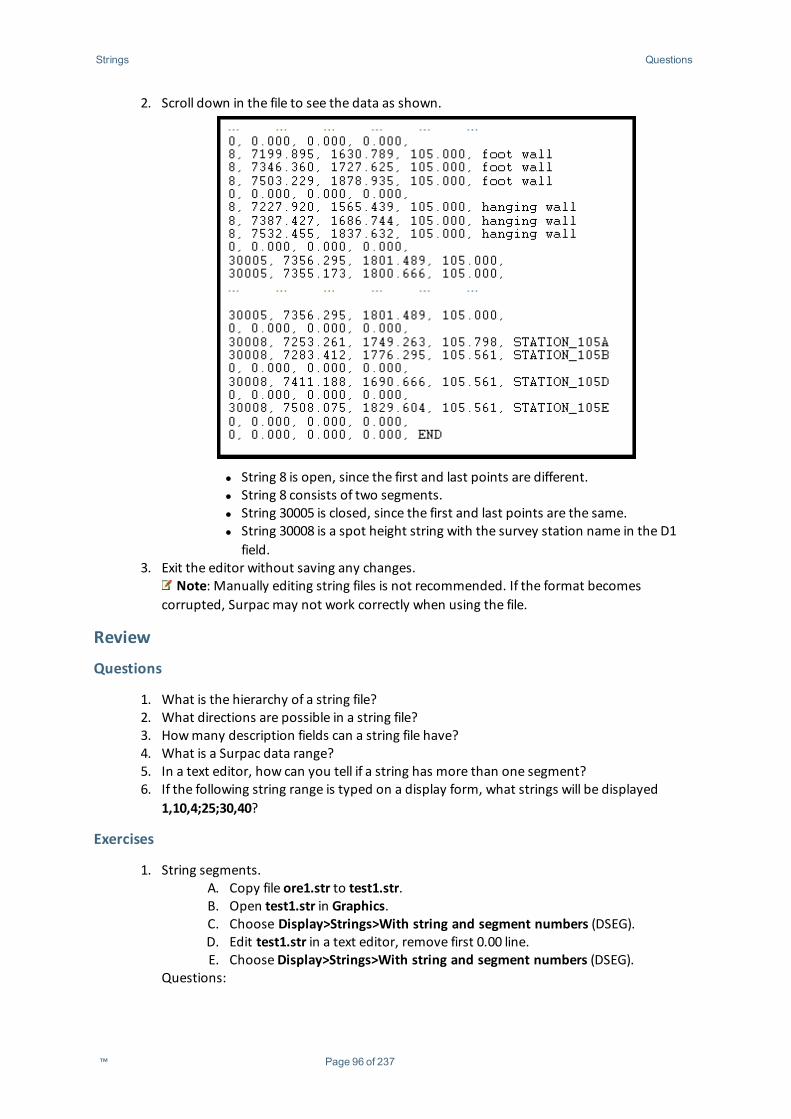
2. Scroll down in the file to see the data as shown.
l String 8 is open, since the first and last points are different.l String 8 consists of two segments.l String 30005 is closed, since the first and last points are the same.l String 30008 is a spot height string with the survey station name in the D1
field.3. Exit the editor without saving any changes.
Note: Manually editing string files is not recommended. If the format becomescorrupted, Surpac may not work correctly when using the file.
Review
Questions
1. What is the hierarchy of a string file?2. What directions are possible in a string file?3. Howmany description fields can a string file have?4. What is a Surpac data range?5. In a text editor, how can you tell if a string has more than one segment?6. If the following string range is typed on a display form, what strings will be displayed
1,10,4;25;30,40?
Exercises
1. String segments.A. Copy file ore1.str to test1.str.B. Open test1.str in Graphics.C. Choose Display>Strings>With string and segment numbers (DSEG).D. Edit test1.str in a text editor, remove first 0.00 line.E. ChooseDisplay>Strings>With string and segment numbers (DSEG).
Questions:
™ Page 96 of 237

Strings Exercises
i. What do the numbers displayed signify?ii. In what way did the string/segment numbering change between C. and E.?
Why/Why not?2. Point attributes.
A. Open ramp_cl_2dlength.str into Graphics.B. Choose Display>Point>Numbers (PN), and apply the form.C. Choose Display>Point>Attributes (PD), and apply the form.
Questions:
i. What information is displayed in graphics?ii. How could this information be useful?
3. Point descriptions.A. Right click on bench105.str.B. View it in a text editor.
Questions:
i. Howmany description fields are in string 1? How are they denoted?ii. Paging down through the file, what kind of information can be stored in a
description field?
™ Page 97 of 237
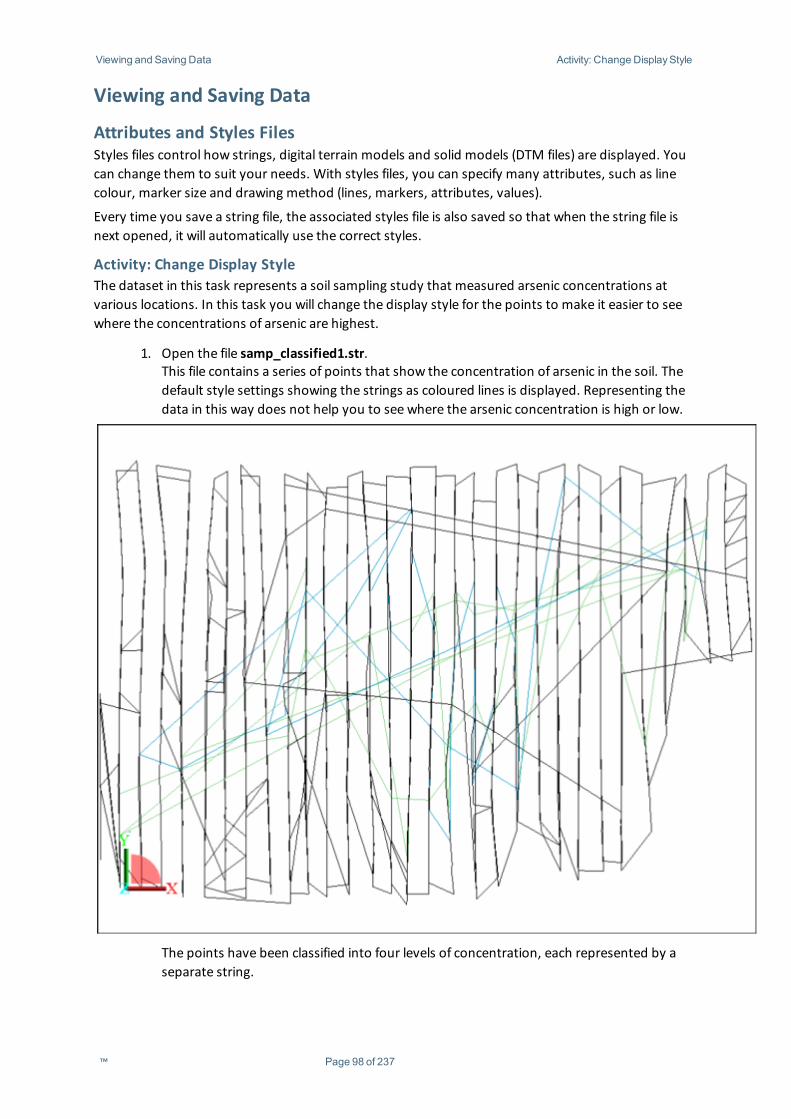
Viewing and Saving Data Activity: Change DisplayStyle
Viewing and Saving Data
Attributes and Styles FilesStyles files control how strings, digital terrain models and solid models (DTM files) are displayed. Youcan change them to suit your needs. With styles files, you can specify many attributes, such as linecolour, marker size and drawing method (lines, markers, attributes, values).
Every time you save a string file, the associated styles file is also saved so that when the string file isnext opened, it will automatically use the correct styles.
Activity: Change Display StyleThe dataset in this task represents a soil sampling study that measured arsenic concentrations atvarious locations. In this task you will change the display style for the points to make it easier to seewhere the concentrations of arsenic are highest.
1. Open the file samp_classified1.str.This file contains a series of points that show the concentration of arsenic in the soil. Thedefault style settings showing the strings as coloured lines is displayed. Representing thedata in this way does not help you to see where the arsenic concentration is high or low.
The points have been classified into four levels of concentration, each represented by aseparate string.
™ Page 98 of 237
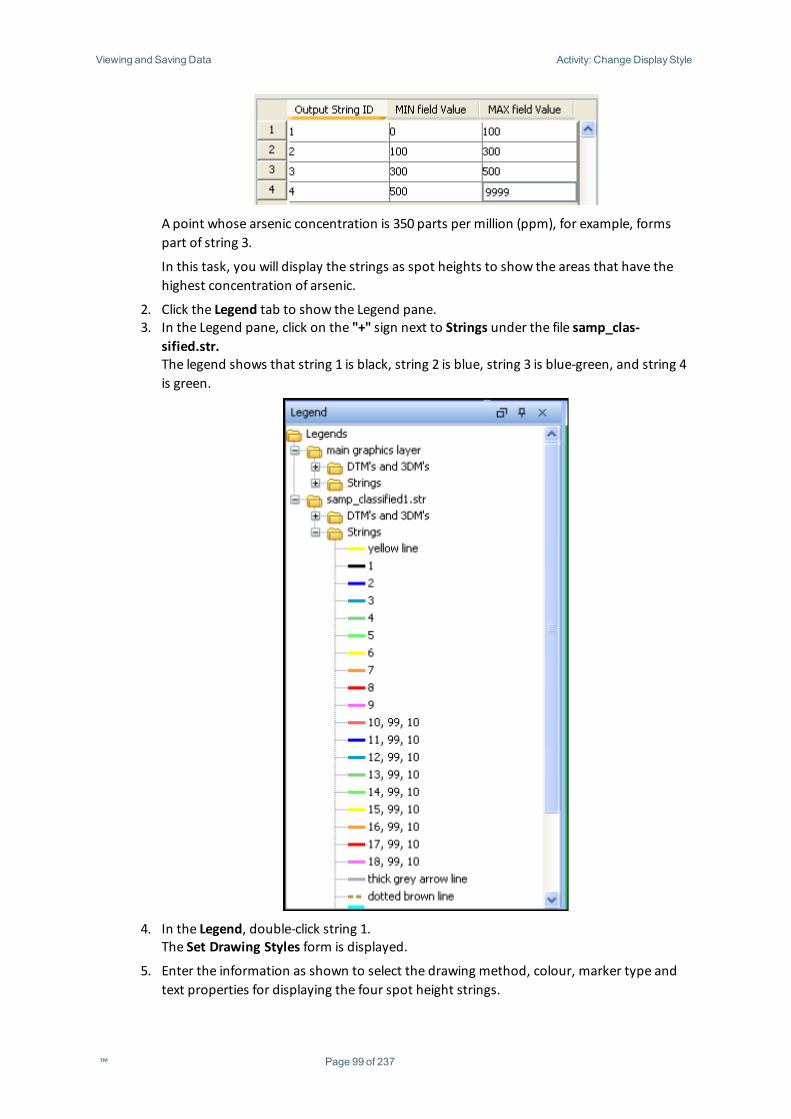
Viewing and Saving Data Activity: Change DisplayStyle
A point whose arsenic concentration is 350 parts per million (ppm), for example, formspart of string 3.
In this task, you will display the strings as spot heights to show the areas that have thehighest concentration of arsenic.
2. Click the Legend tab to show the Legend pane.3. In the Legend pane, click on the "+" sign next to Strings under the file samp_clas-
sified.str.The legend shows that string 1 is black, string 2 is blue, string 3 is blue-green, and string 4is green.
4. In the Legend, double-click string 1.The Set Drawing Styles form is displayed.
5. Enter the information as shown to select the drawing method, colour, marker type andtext properties for displaying the four spot height strings.
™ Page 99 of 237
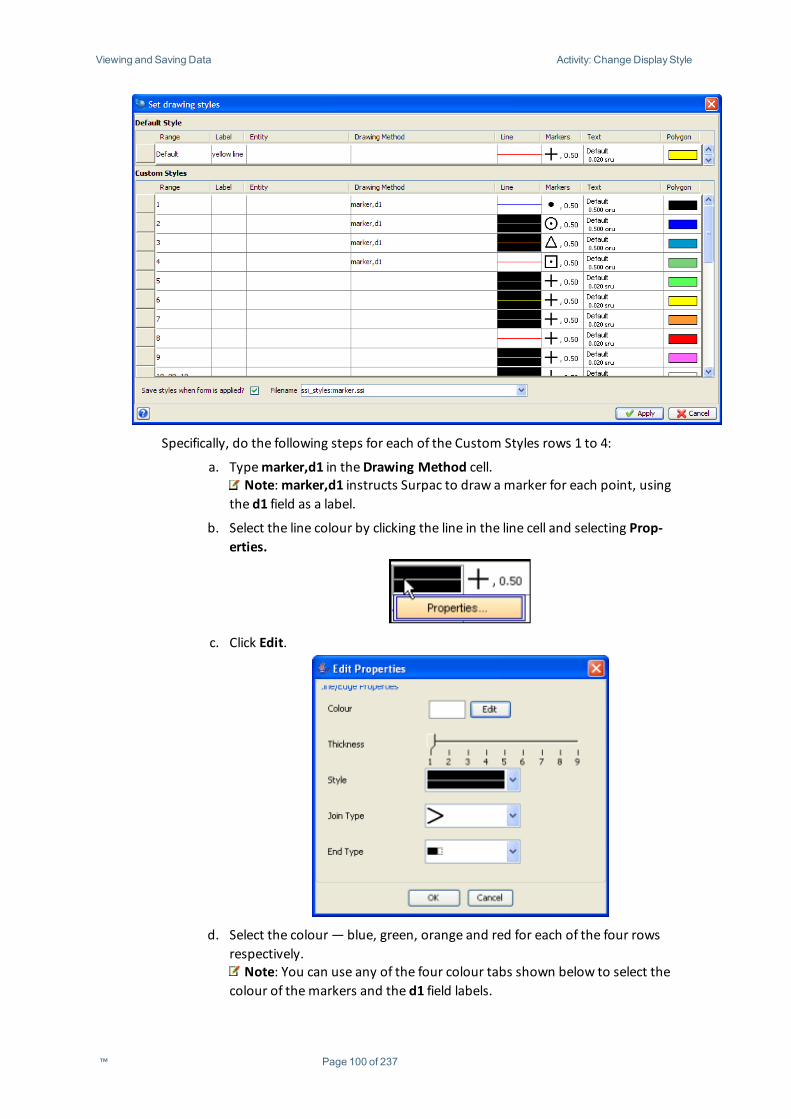
Viewing and Saving Data Activity: Change DisplayStyle
Specifically, do the following steps for each of the Custom Styles rows 1 to 4:
a. Typemarker,d1 in theDrawing Method cell.Note:marker,d1 instructs Surpac to draw a marker for each point, using
the d1 field as a label.
b. Select the line colour by clicking the line in the line cell and selecting Prop-erties.
c. Click Edit.
d. Select the colour— blue, green, orange and red for each of the four rowsrespectively.
Note: You can use any of the four colour tabs shown below to select thecolour of themarkers and the d1 field labels.
™ Page 100 of 237
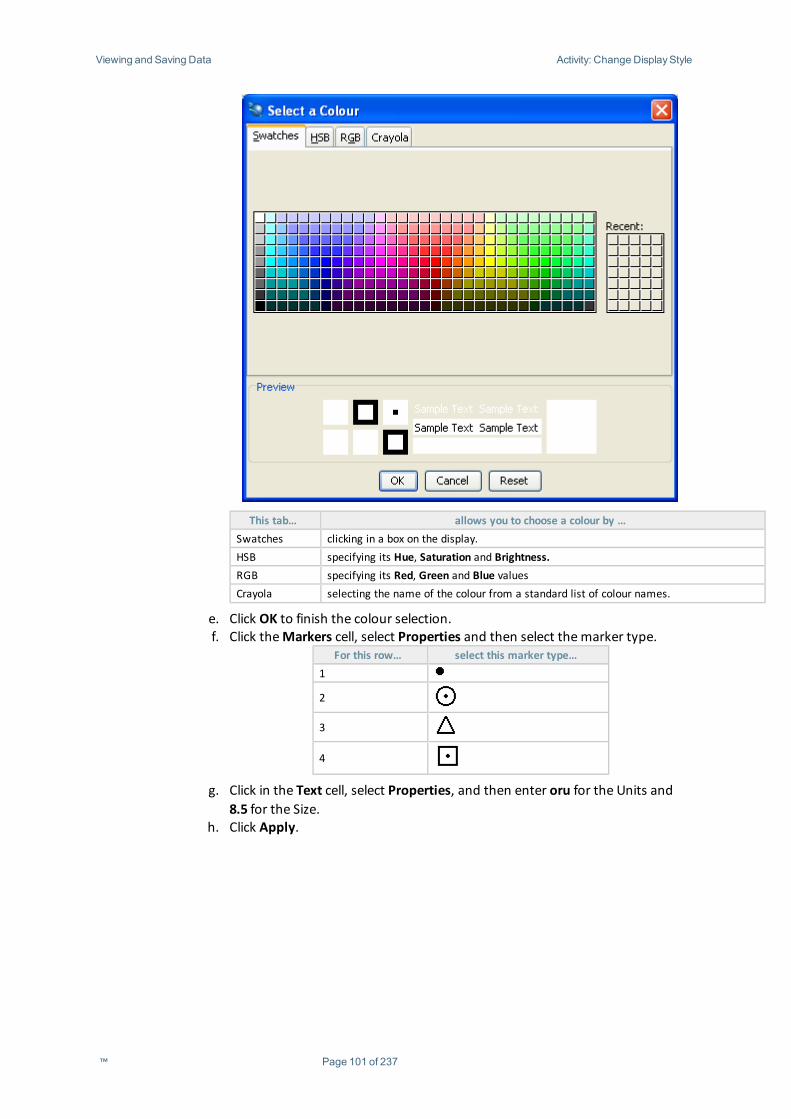
Viewing and Saving Data Activity: Change DisplayStyle
This tab… allows you to choose a colour by …Swatches clicking in a box on the display.HSB specifying its Hue, Saturation and Brightness.RGB specifying its Red, Green and Blue valuesCrayola selecting the name of the colour from a standard list of colour names.
e. Click OK to finish the colour selection.f. Click theMarkers cell, select Properties and then select themarker type.
For this row… select this marker type…1
2
3
4
g. Click in the Text cell, select Properties, and then enter oru for the Units and8.5 for the Size.
h. Click Apply.
™ Page 101 of 237
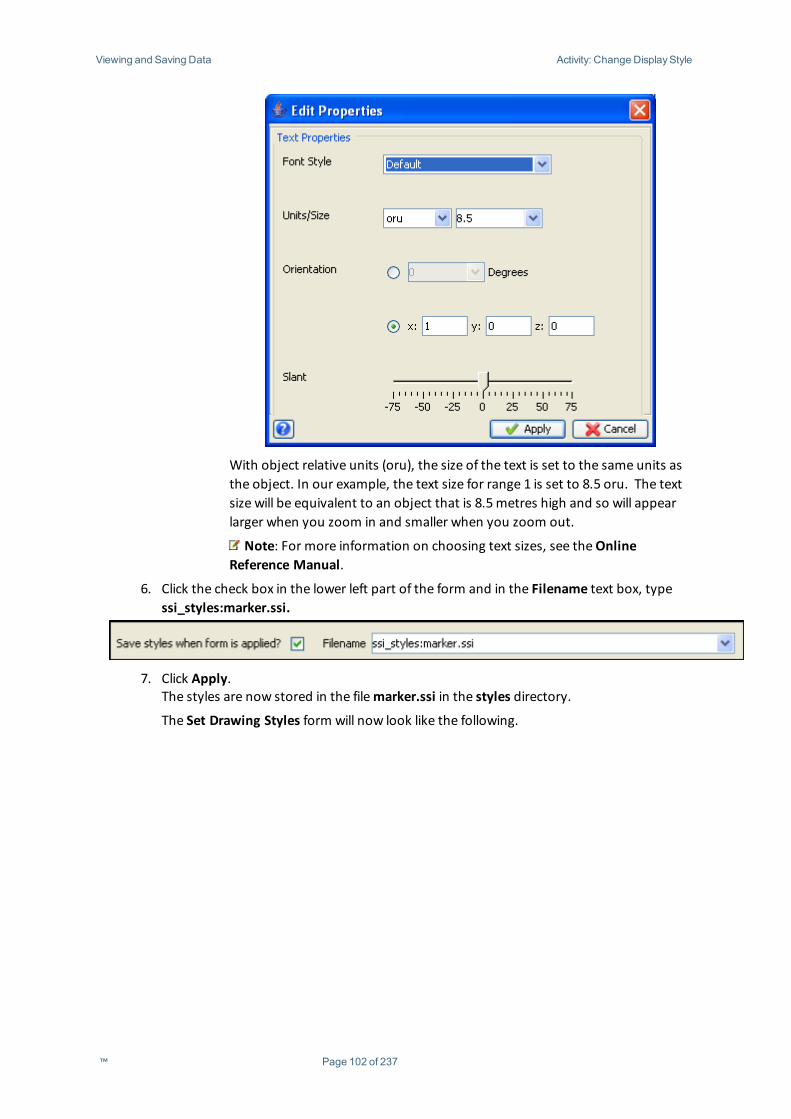
Viewing and Saving Data Activity: Change DisplayStyle
With object relative units (oru), the size of the text is set to the same units asthe object. In our example, the text size for range 1 is set to 8.5 oru. The textsize will be equivalent to an object that is 8.5metres high and so will appearlarger when you zoom in and smaller when you zoom out.
Note: For more information on choosing text sizes, see theOnlineReference Manual.
6. Click the check box in the lower left part of the form and in the Filename text box, typessi_styles:marker.ssi.
7. Click Apply.The styles are now stored in the filemarker.ssi in the styles directory.
The Set Drawing Styles form will now look like the following.
™ Page 102 of 237
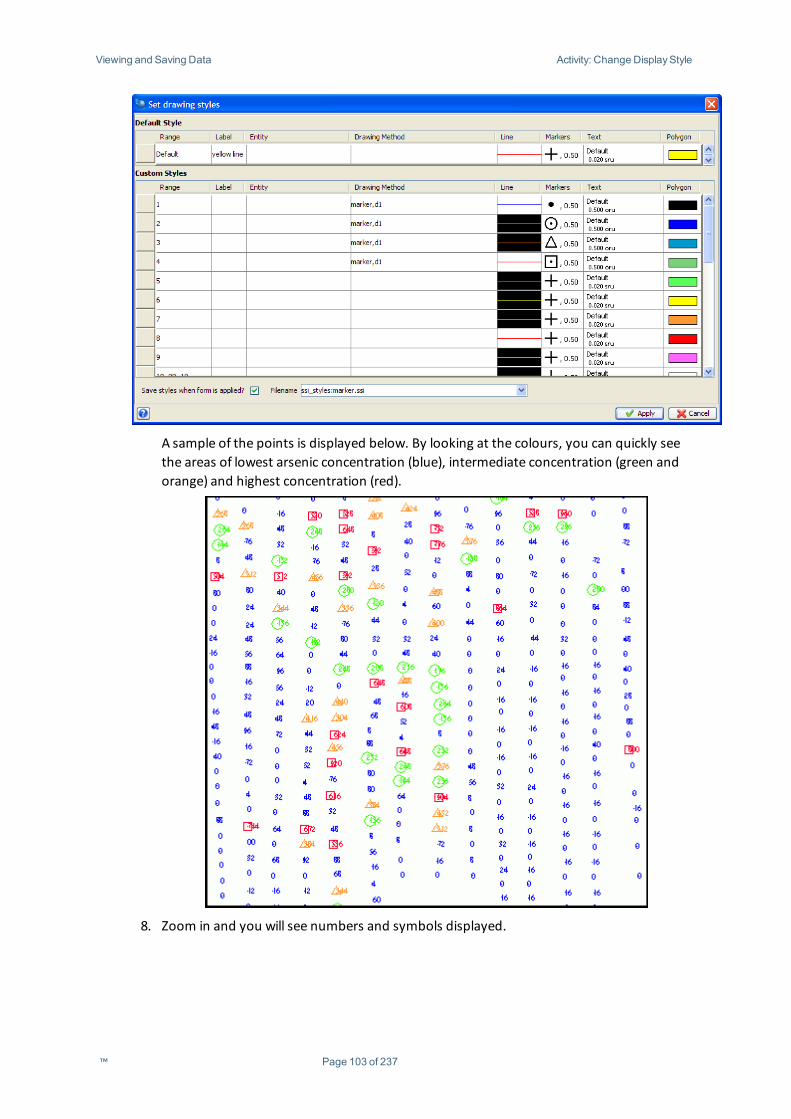
Viewing and Saving Data Activity: Change DisplayStyle
A sample of the points is displayed below. By looking at the colours, you can quickly seethe areas of lowest arsenic concentration (blue), intermediate concentration (green andorange) and highest concentration (red).
8. Zoom in and you will see numbers and symbols displayed.
™ Page 103 of 237
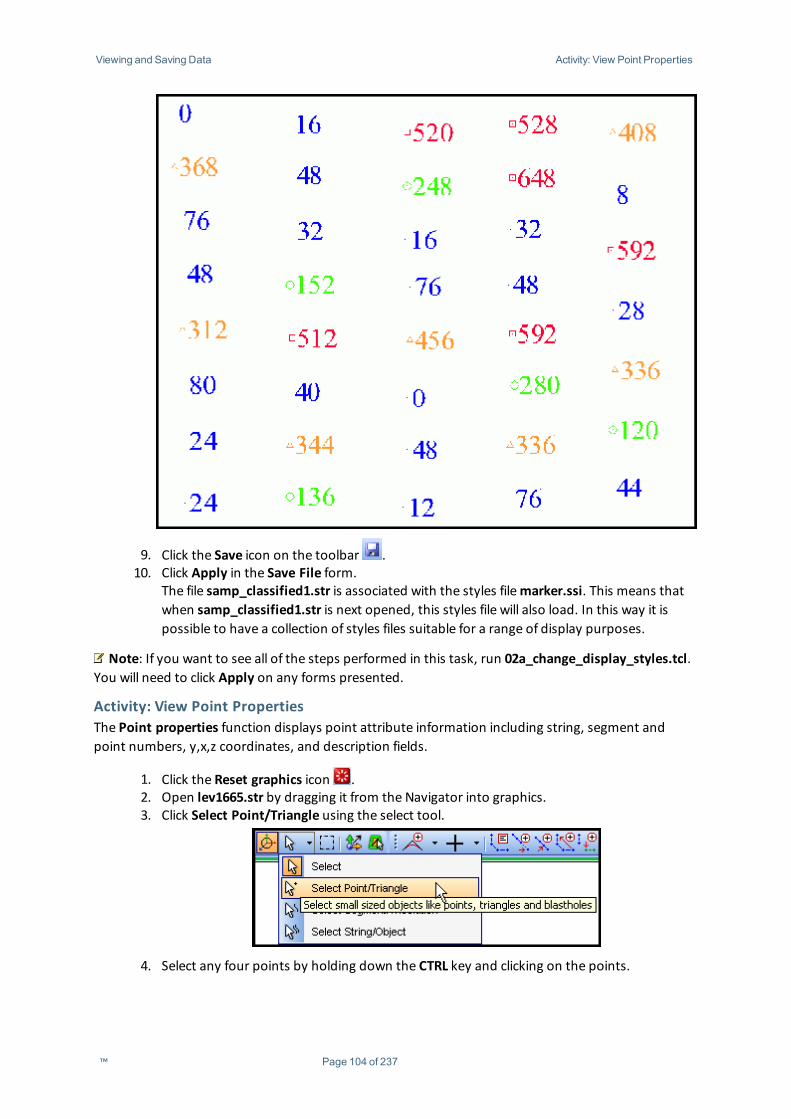
Viewing and Saving Data Activity: View Point Properties
9. Click the Save icon on the toolbar .10. Click Apply in the Save File form.
The file samp_classified1.str is associated with the styles filemarker.ssi. This means thatwhen samp_classified1.str is next opened, this styles file will also load. In this way it ispossible to have a collection of styles files suitable for a range of display purposes.
Note: If you want to see all of the steps performed in this task, run 02a_change_display_styles.tcl.You will need to click Apply on any forms presented.
Activity: View Point PropertiesThe Point properties function displays point attribute information including string, segment andpoint numbers, y,x,z coordinates, and description fields.
1. Click the Reset graphics icon .2. Open lev1665.str by dragging it from the Navigator into graphics.3. Click Select Point/Triangle using the select tool.
4. Select any four points by holding down the CTRL key and clicking on the points.
™ Page 104 of 237
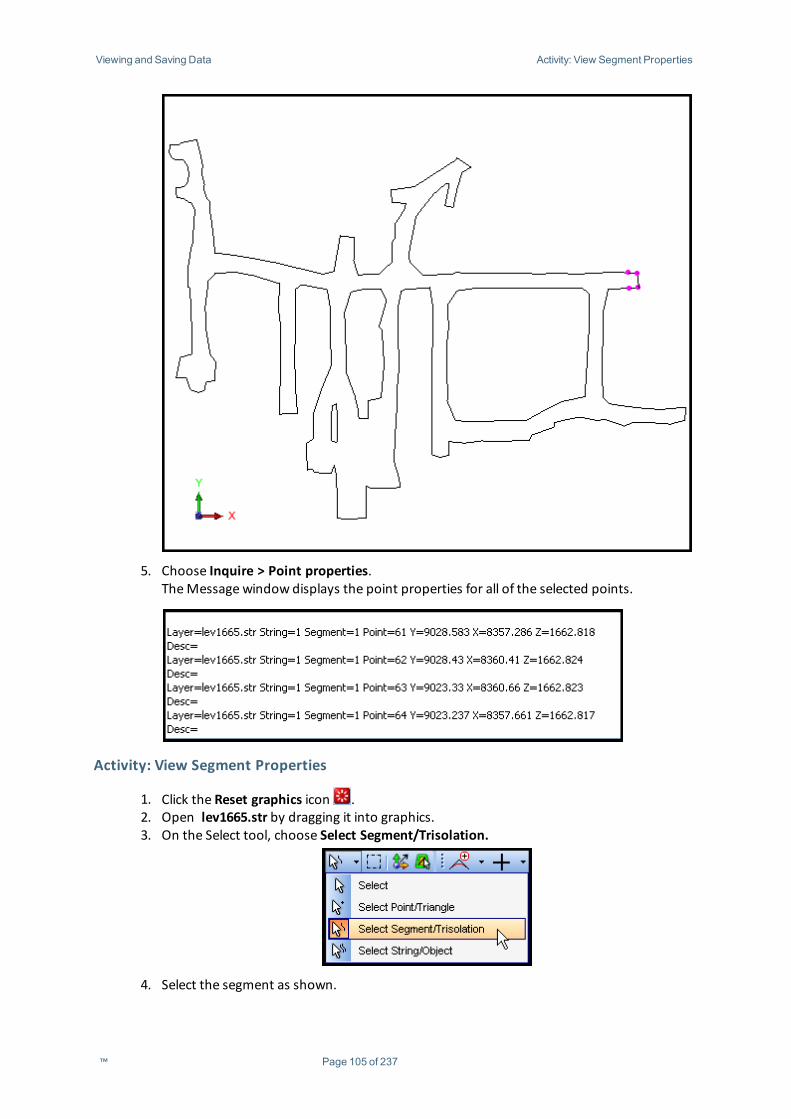
Viewing and Saving Data Activity: View Segment Properties
5. Choose Inquire > Point properties.TheMessage window displays the point properties for all of the selected points.
Activity: View Segment Properties
1. Click the Reset graphics icon .2. Open lev1665.str by dragging it into graphics.3. On the Select tool, choose Select Segment/Trisolation.
4. Select the segment as shown.
™ Page 105 of 237
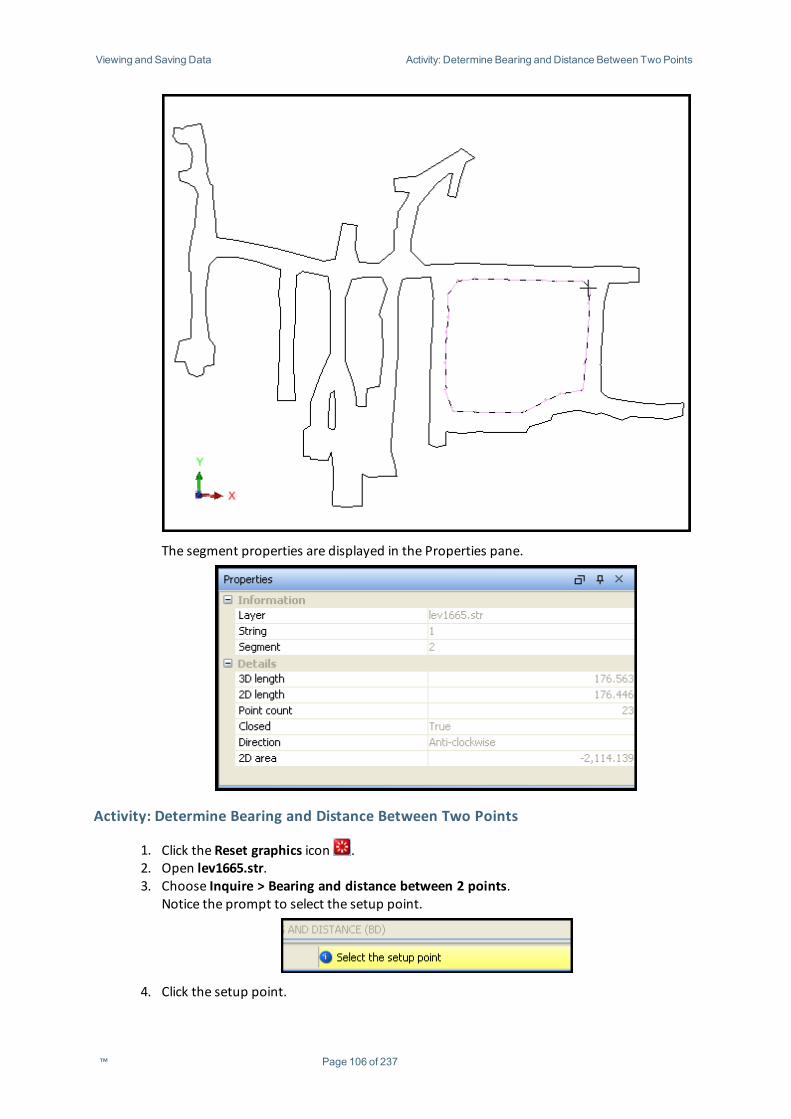
Viewing and Saving Data Activity: Determine Bearing and Distance Between Two Points
The segment properties are displayed in the Properties pane.
Activity: Determine Bearing and Distance Between Two Points
1. Click the Reset graphics icon .2. Open lev1665.str.3. Choose Inquire > Bearing and distance between 2 points.
Notice the prompt to select the setup point.
4. Click the setup point.
™ Page 106 of 237
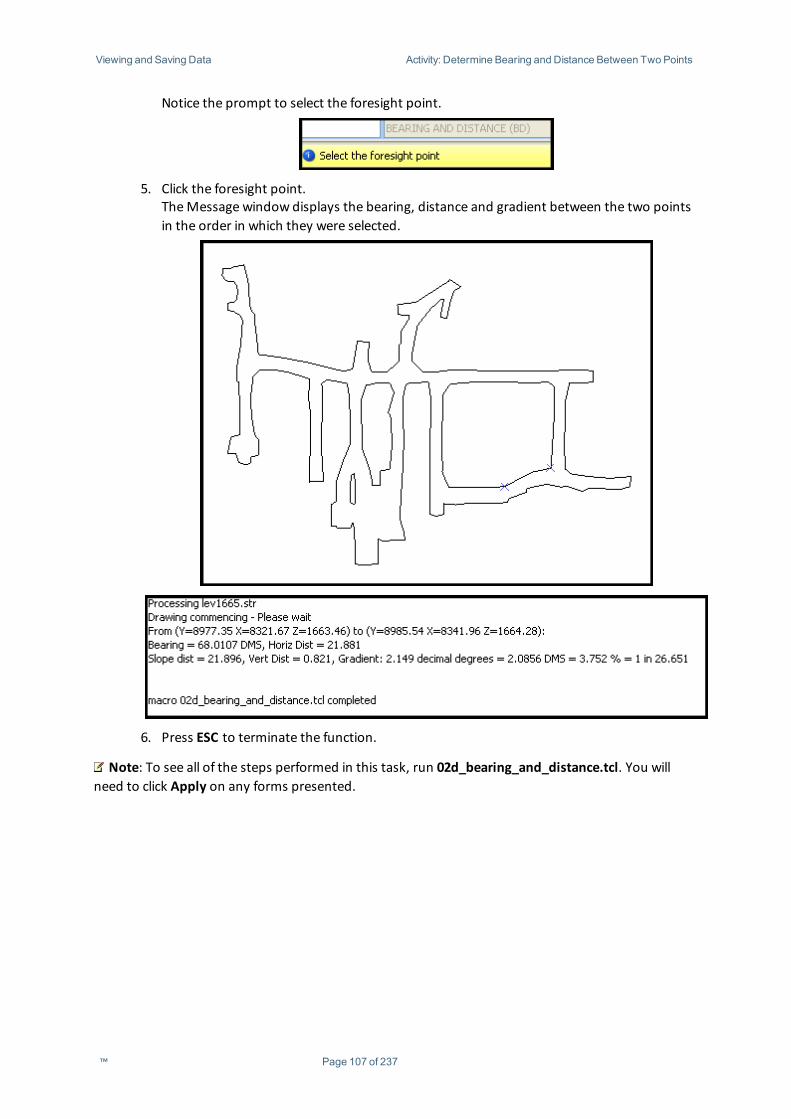
Viewing and Saving Data Activity: Determine Bearing and Distance Between Two Points
Notice the prompt to select the foresight point.
5. Click the foresight point.TheMessage window displays the bearing, distance and gradient between the two pointsin the order in which they were selected.
6. Press ESC to terminate the function.
Note: To see all of the steps performed in this task, run 02d_bearing_and_distance.tcl. You willneed to click Apply on any forms presented.
™ Page 107 of 237
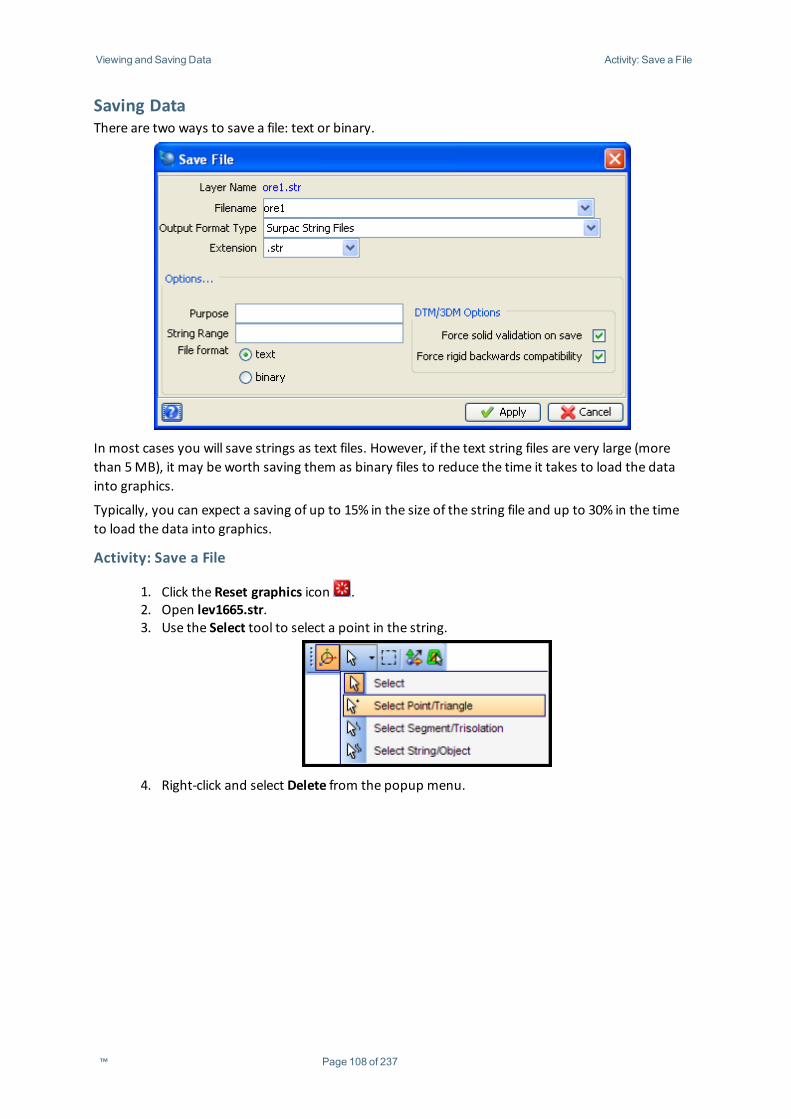
Viewing and Saving Data Activity: Save a File
Saving DataThere are two ways to save a file: text or binary.
In most cases you will save strings as text files. However, if the text string files are very large (morethan 5MB), it may be worth saving them as binary files to reduce the time it takes to load the datainto graphics.
Typically, you can expect a saving of up to 15% in the size of the string file and up to 30% in the timeto load the data into graphics.
Activity: Save a File
1. Click the Reset graphics icon .2. Open lev1665.str.3. Use the Select tool to select a point in the string.
4. Right-click and select Delete from the popup menu.
™ Page 108 of 237
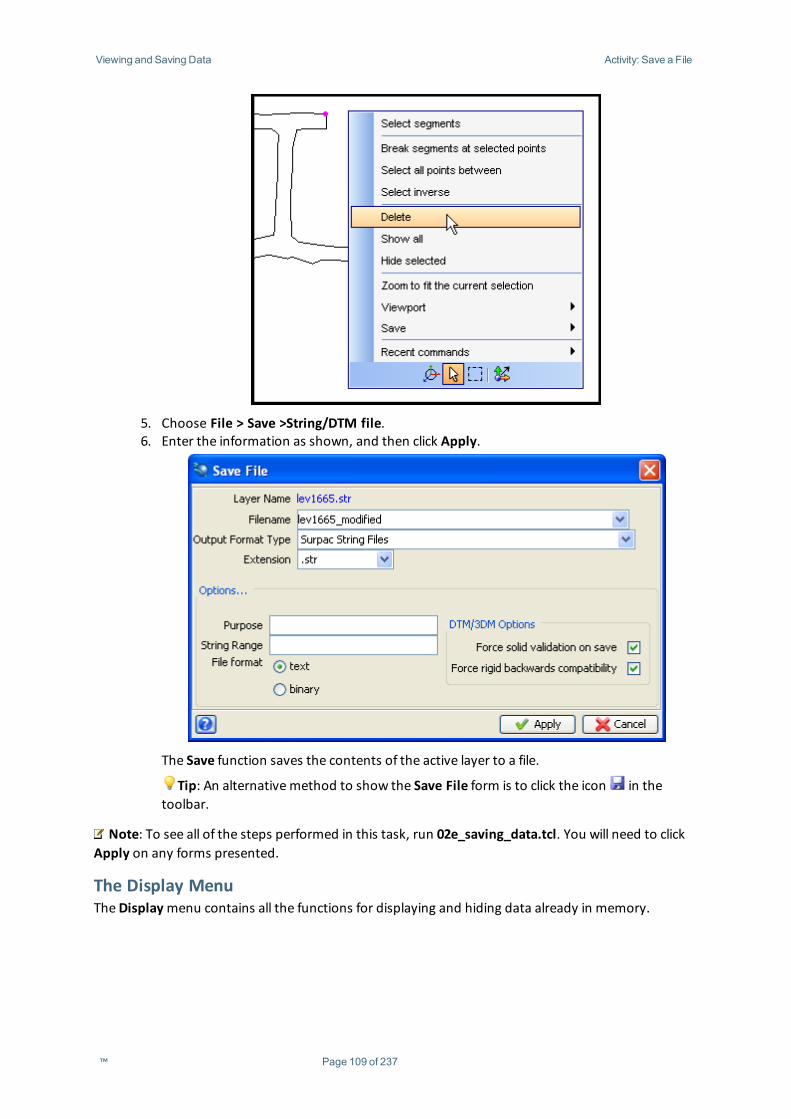
Viewing and Saving Data Activity: Save a File
5. Choose File > Save >String/DTM file.6. Enter the information as shown, and then click Apply.
The Save function saves the contents of the active layer to a file.
Tip: An alternativemethod to show the Save File form is to click the icon in thetoolbar.
Note: To see all of the steps performed in this task, run 02e_saving_data.tcl. You will need to clickApply on any forms presented.
The Display MenuTheDisplaymenu contains all the functions for displaying and hiding data already in memory.
™ Page 109 of 237
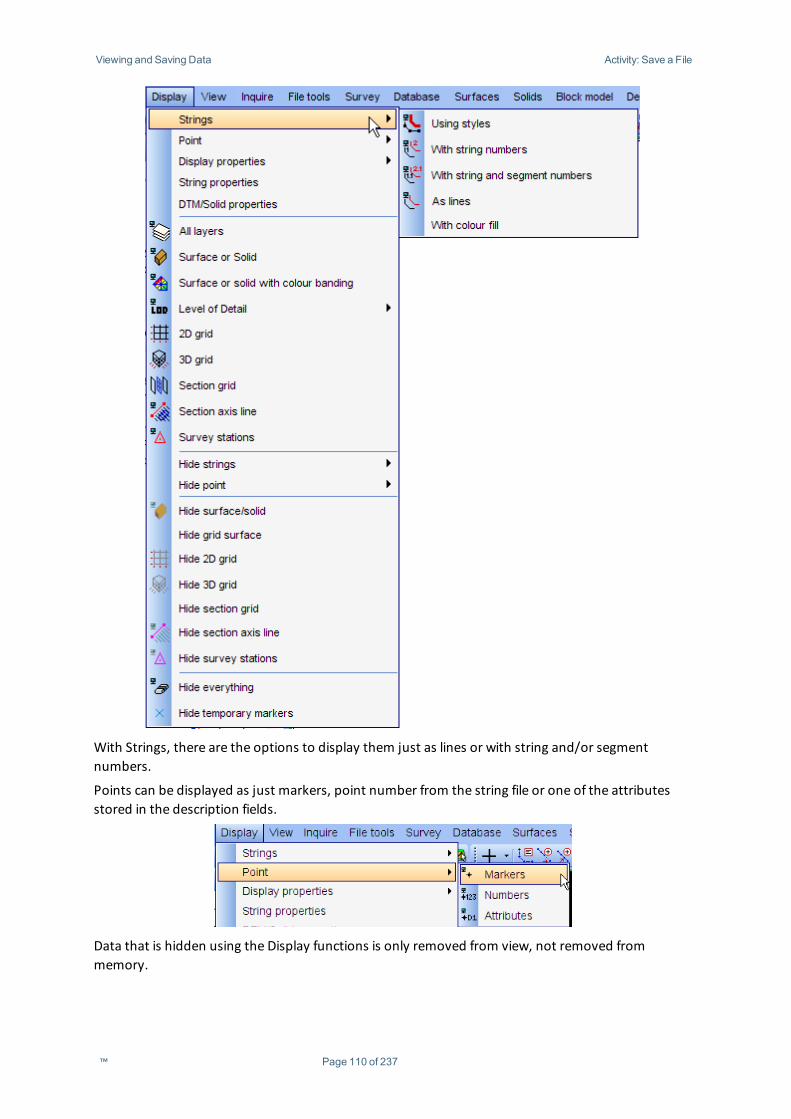
Viewing and Saving Data Activity: Save a File
With Strings, there are the options to display them just as lines or with string and/or segmentnumbers.
Points can be displayed as just markers, point number from the string file or one of the attributesstored in the description fields.
Data that is hidden using the Display functions is only removed from view, not removed frommemory.
™ Page 110 of 237
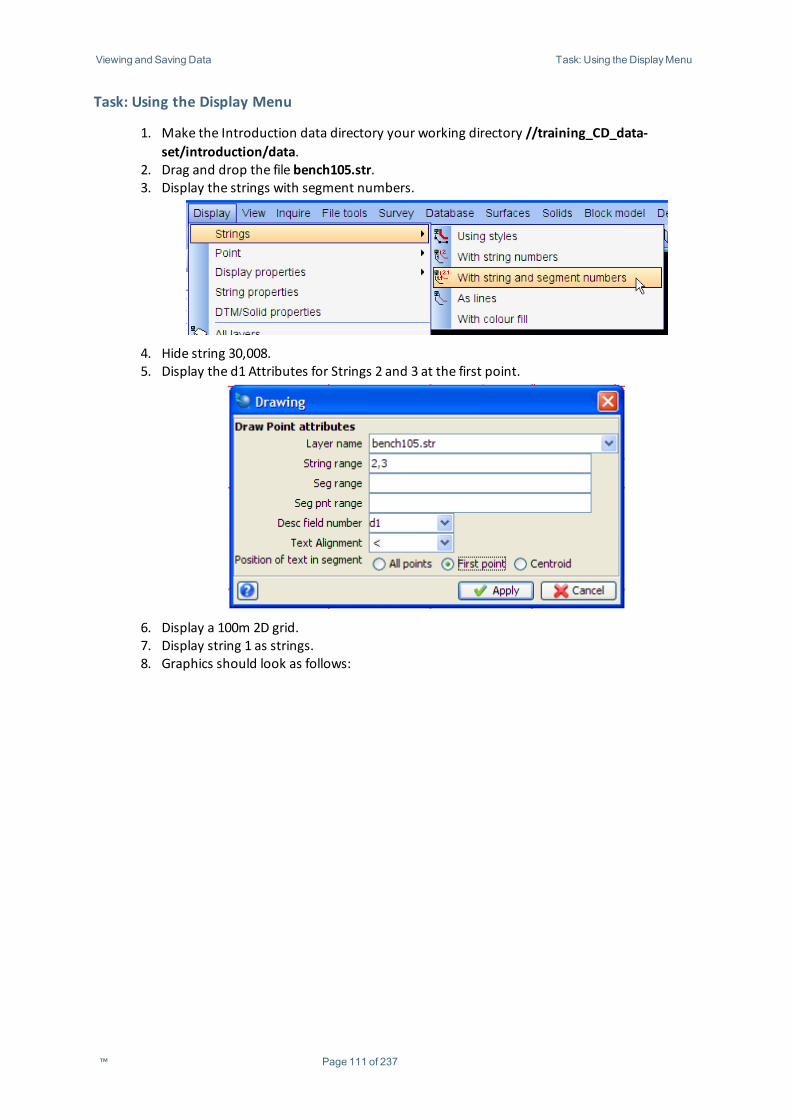
Viewing and Saving Data Task: Using the DisplayMenu
Task: Using the Display Menu
1. Make the Introduction data directory your working directory //training_CD_data-set/introduction/data.
2. Drag and drop the file bench105.str.3. Display the strings with segment numbers.
4. Hide string 30,008.5. Display the d1 Attributes for Strings 2 and 3 at the first point.
6. Display a 100m 2D grid.7. Display string 1 as strings.8. Graphics should look as follows:
™ Page 111 of 237
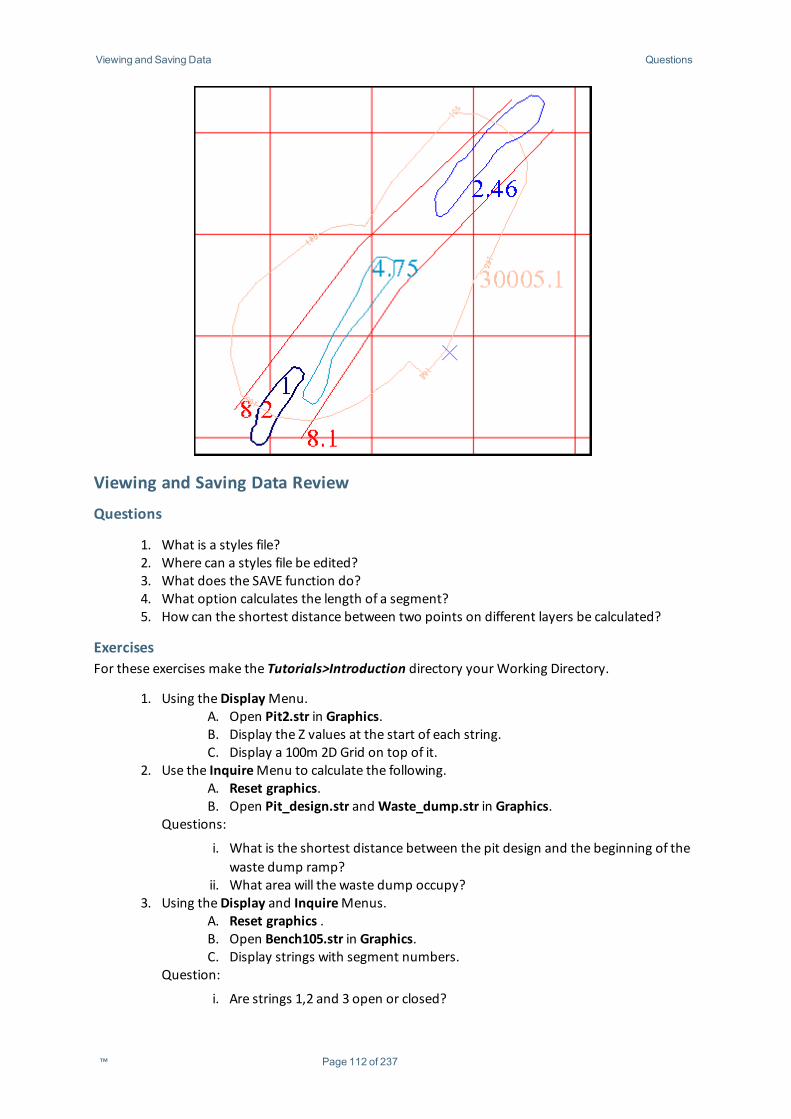
Viewing and Saving Data Questions
Viewing and Saving Data Review
Questions
1. What is a styles file?2. Where can a styles file be edited?3. What does the SAVE function do?4. What option calculates the length of a segment?5. How can the shortest distance between two points on different layers be calculated?
ExercisesFor these exercises make the Tutorials>Introduction directory yourWorking Directory.
1. Using theDisplayMenu.A. Open Pit2.str in Graphics.B. Display the Z values at the start of each string.C. Display a 100m 2D Grid on top of it.
2. Use the InquireMenu to calculate the following.A. Reset graphics.B. Open Pit_design.str andWaste_dump.str in Graphics.
Questions:
i. What is the shortest distance between the pit design and the beginning of thewaste dump ramp?
ii. What area will the waste dump occupy?3. Using theDisplay and InquireMenus.
A. Reset graphics .B. Open Bench105.str in Graphics.C. Display strings with segment numbers.
Question:
i. Are strings 1,2 and 3 open or closed?
™ Page 112 of 237

Viewing and Saving Data Exercises
D. Display point descriptions for all points.E. Display D1 for strings 1,2 and 3 as centroids.
Question:
i. What is the length of the footwall?4. Using the display properties.
A. Reset graphics.B. Open Topo1.str in Graphics.C. Display String numbers at the start of the segment, to the left.D. Display the Z values for each segment, at the start to the right.E. Display the contours as yellow, except display every z value that is a multiple
of 10, in white(black) with the Z value displayed every 500m, with a size of10mm.
F. Plot every multiple of 50m in thick Red with the z value at the start.
™ Page 113 of 237
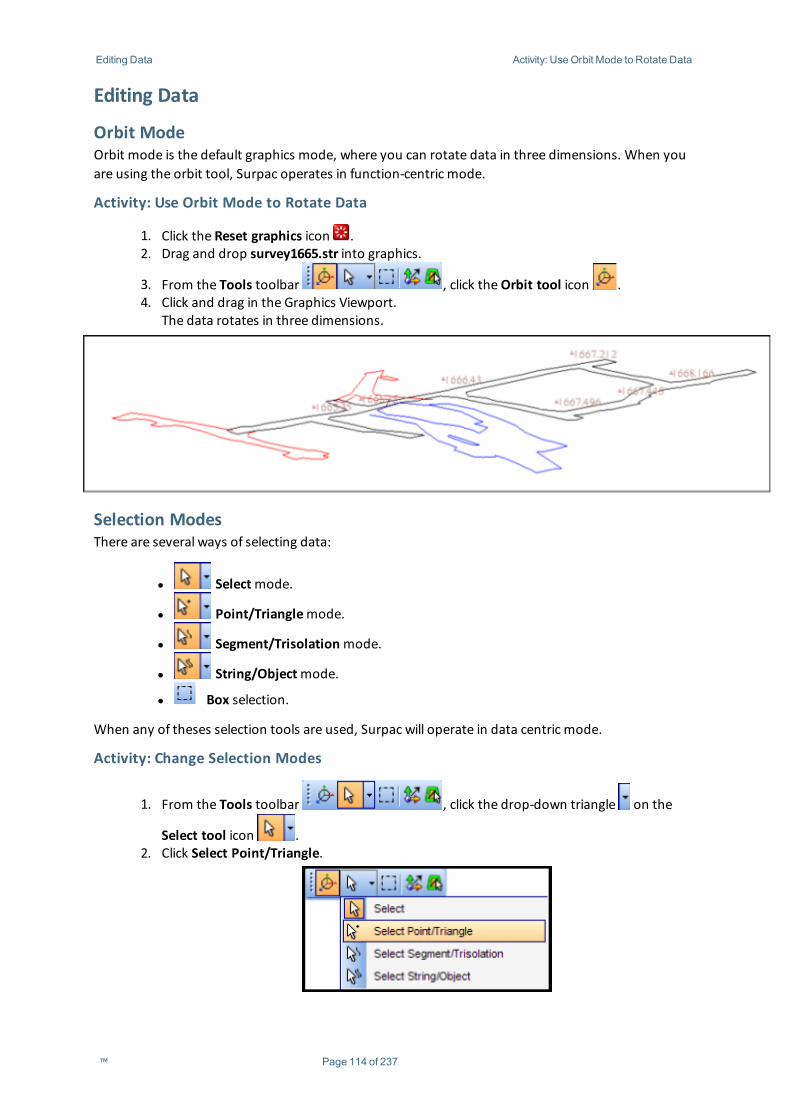
Editing Data Activity: UseOrbit Mode to Rotate Data
Editing Data
Orbit ModeOrbit mode is the default graphics mode, where you can rotate data in three dimensions. When youare using the orbit tool, Surpac operates in function-centric mode.
Activity: Use Orbit Mode to Rotate Data
1. Click the Reset graphics icon .2. Drag and drop survey1665.str into graphics.
3. From the Tools toolbar , click theOrbit tool icon .4. Click and drag in the Graphics Viewport.
The data rotates in three dimensions.
Selection ModesThere are several ways of selecting data:
l Selectmode.
l Point/Trianglemode.
l Segment/Trisolationmode.
l String/Objectmode.
l Box selection.
When any of theses selection tools are used, Surpac will operate in data centric mode.
Activity: Change Selection Modes
1. From the Tools toolbar , click the drop-down triangle on the
Select tool icon .2. Click Select Point/Triangle.
™ Page 114 of 237
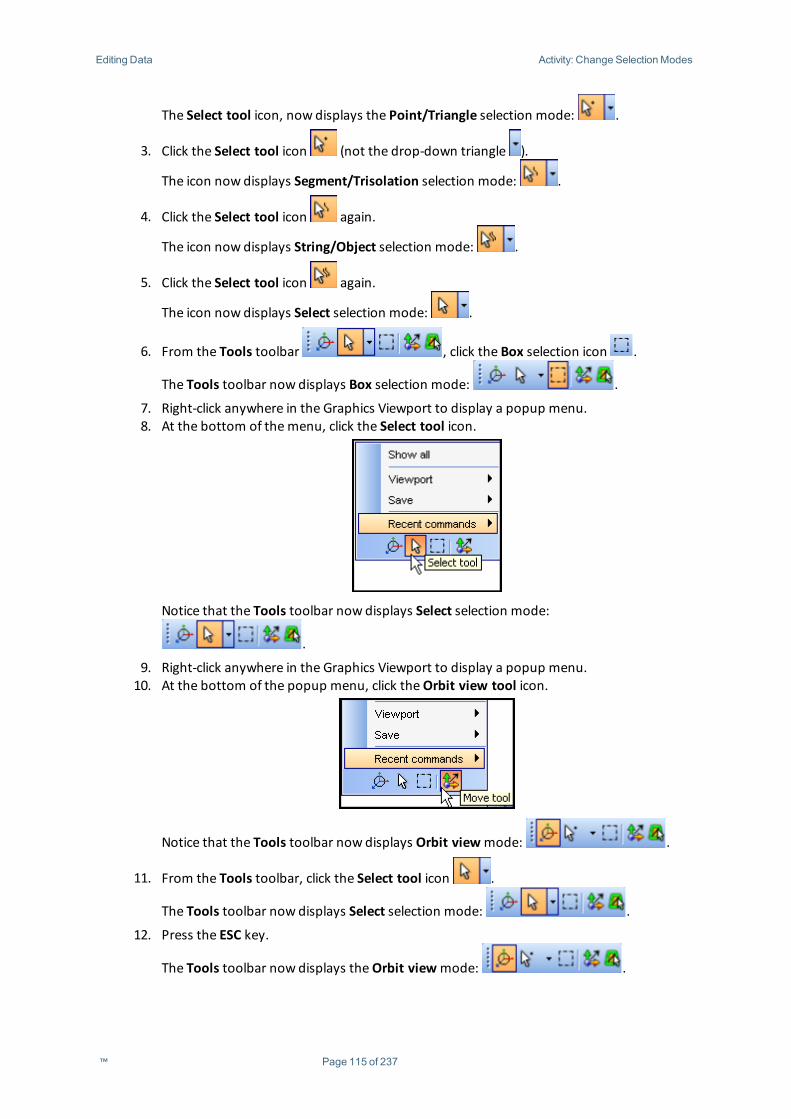
Editing Data Activity: Change SelectionModes
The Select tool icon, now displays the Point/Triangle selection mode: .
3. Click the Select tool icon (not the drop-down triangle ).
The icon now displays Segment/Trisolation selection mode: .
4. Click the Select tool icon again.
The icon now displays String/Object selection mode: .
5. Click the Select tool icon again.
The icon now displays Select selection mode: .
6. From the Tools toolbar , click the Box selection icon .
The Tools toolbar now displays Box selection mode: .
7. Right-click anywhere in the Graphics Viewport to display a popup menu.8. At the bottom of themenu, click the Select tool icon.
Notice that the Tools toolbar now displays Select selection mode:
.
9. Right-click anywhere in the Graphics Viewport to display a popup menu.10. At the bottom of the popup menu, click theOrbit view tool icon.
Notice that the Tools toolbar now displays Orbit viewmode: .
11. From the Tools toolbar, click the Select tool icon .
The Tools toolbar now displays Select selection mode: .
12. Press the ESC key.
The Tools toolbar now displays theOrbit viewmode: .
™ Page 115 of 237
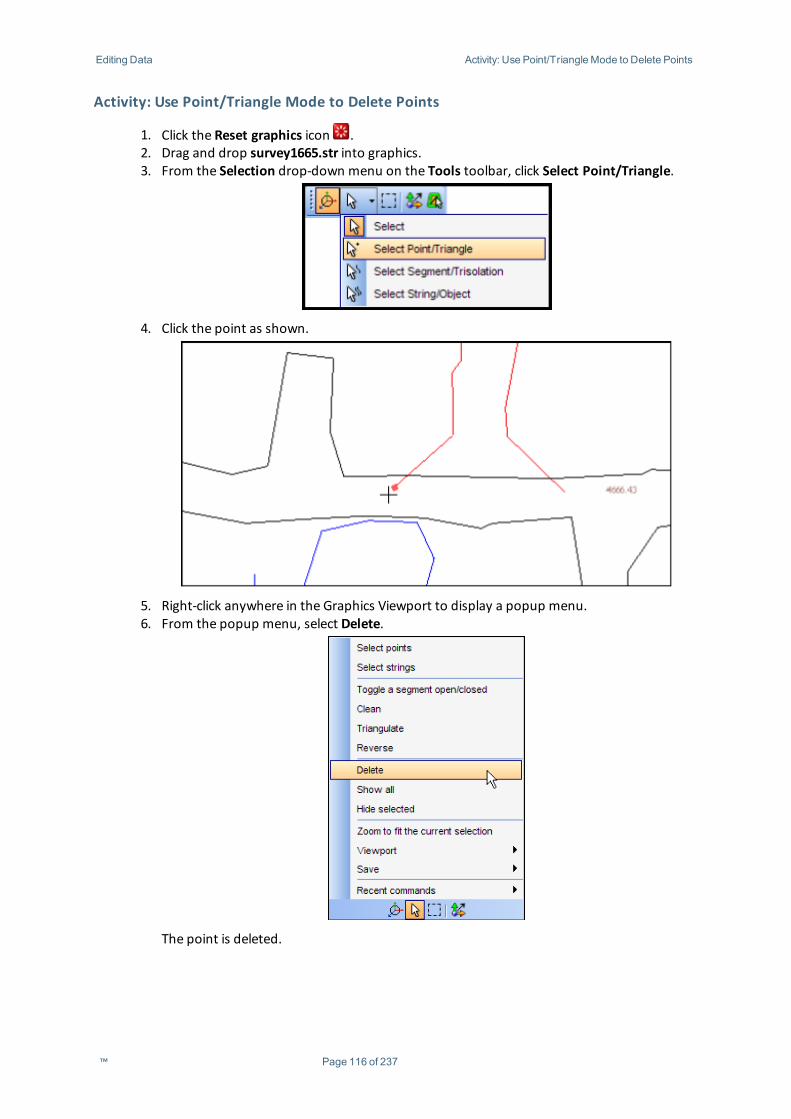
Editing Data Activity: Use Point/TriangleMode to Delete Points
Activity: Use Point/Triangle Mode to Delete Points
1. Click the Reset graphics icon .2. Drag and drop survey1665.str into graphics.3. From the Selection drop-down menu on the Tools toolbar, click Select Point/Triangle.
4. Click the point as shown.
5. Right-click anywhere in the Graphics Viewport to display a popup menu.6. From the popup menu, select Delete.
The point is deleted.
™ Page 116 of 237
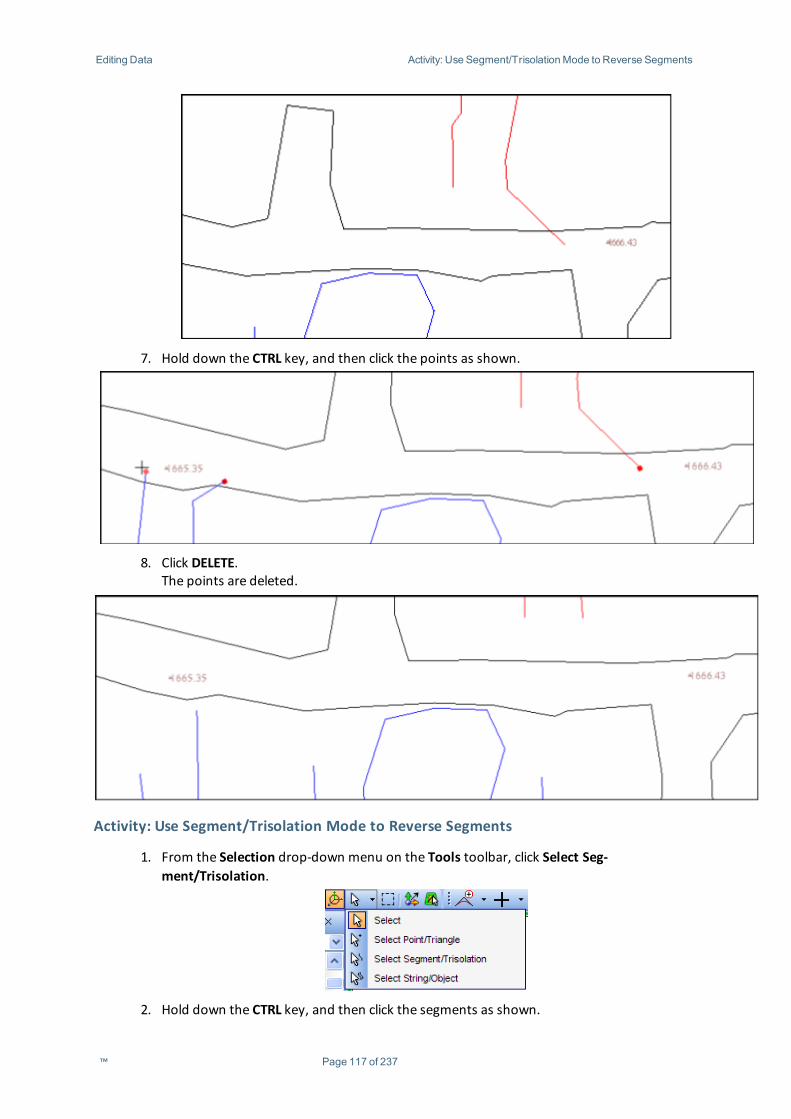
Editing Data Activity: Use Segment/TrisolationMode to Reverse Segments
7. Hold down the CTRL key, and then click the points as shown.
8. Click DELETE.The points are deleted.
Activity: Use Segment/Trisolation Mode to Reverse Segments
1. From the Selection drop-down menu on the Tools toolbar, click Select Seg-ment/Trisolation.
2. Hold down the CTRL key, and then click the segments as shown.
™ Page 117 of 237
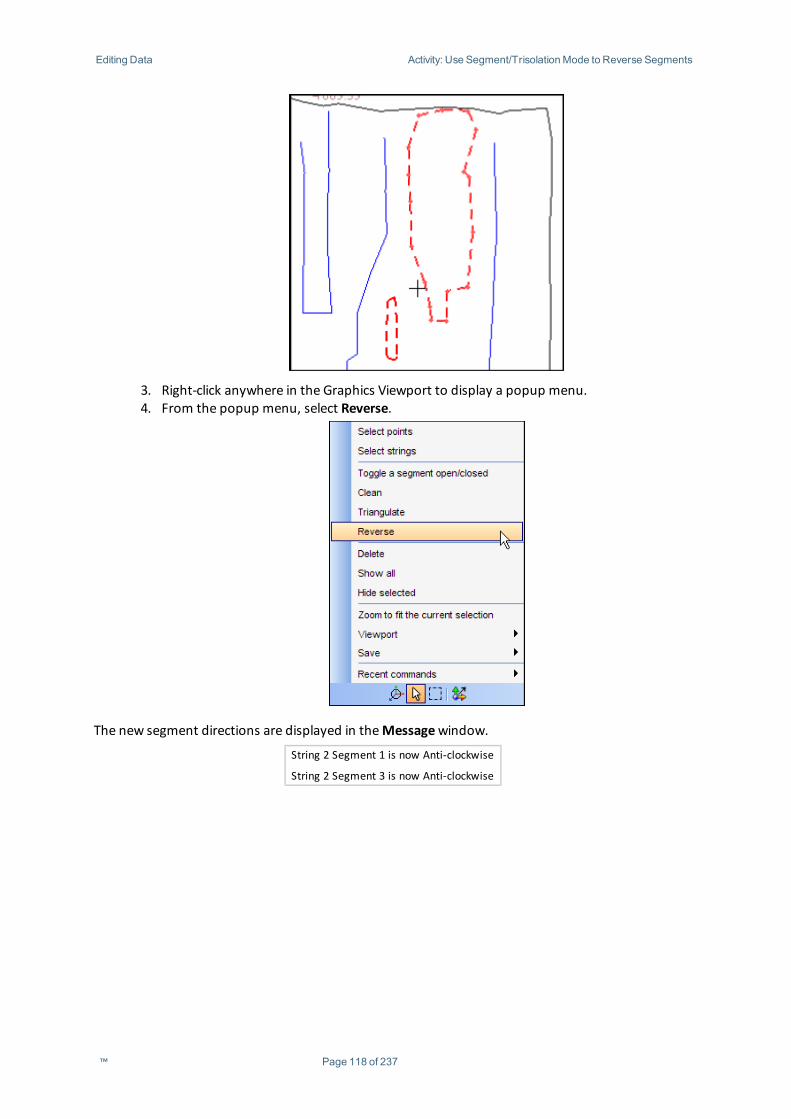
Editing Data Activity: Use Segment/TrisolationMode to Reverse Segments
3. Right-click anywhere in the Graphics Viewport to display a popup menu.4. From the popup menu, select Reverse.
The new segment directions are displayed in theMessagewindow.
String 2 Segment 1 is now Anti-clockwise
String 2 Segment 3 is now Anti-clockwise
™ Page 118 of 237
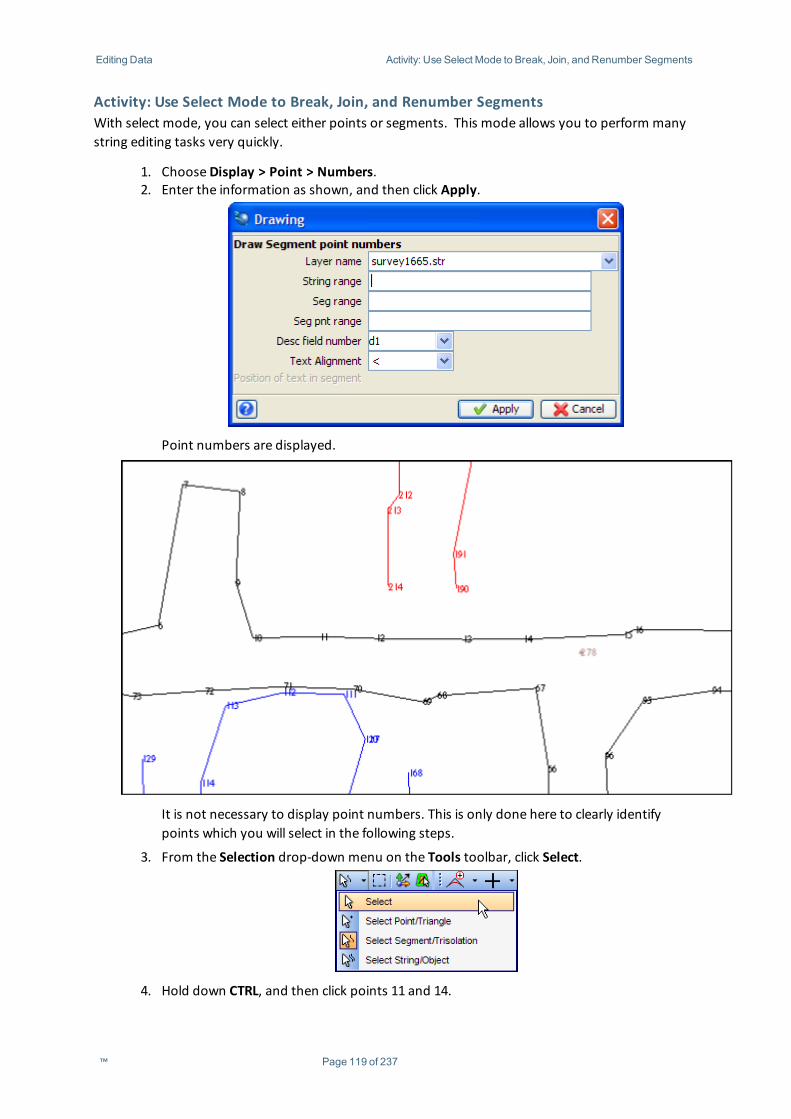
Editing Data Activity: Use Select Mode to Break, Join, and Renumber Segments
Activity: Use Select Mode to Break, Join, and Renumber SegmentsWith select mode, you can select either points or segments. This mode allows you to perform manystring editing tasks very quickly.
1. ChooseDisplay > Point > Numbers.2. Enter the information as shown, and then click Apply.
Point numbers are displayed.
It is not necessary to display point numbers. This is only done here to clearly identifypoints which you will select in the following steps.
3. From the Selection drop-down menu on the Tools toolbar, click Select.
4. Hold down CTRL, and then click points 11 and 14.
™ Page 119 of 237
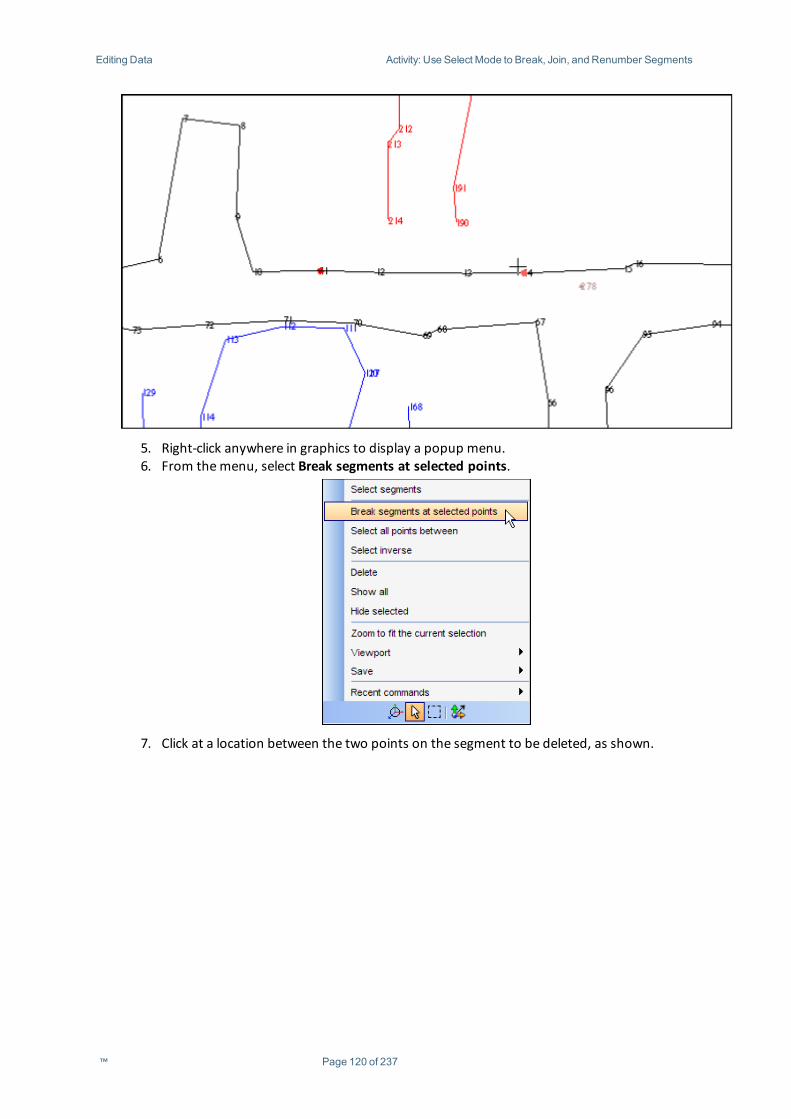
Editing Data Activity: Use Select Mode to Break, Join, and Renumber Segments
5. Right-click anywhere in graphics to display a popup menu.6. From themenu, select Break segments at selected points.
7. Click at a location between the two points on the segment to be deleted, as shown.
™ Page 120 of 237
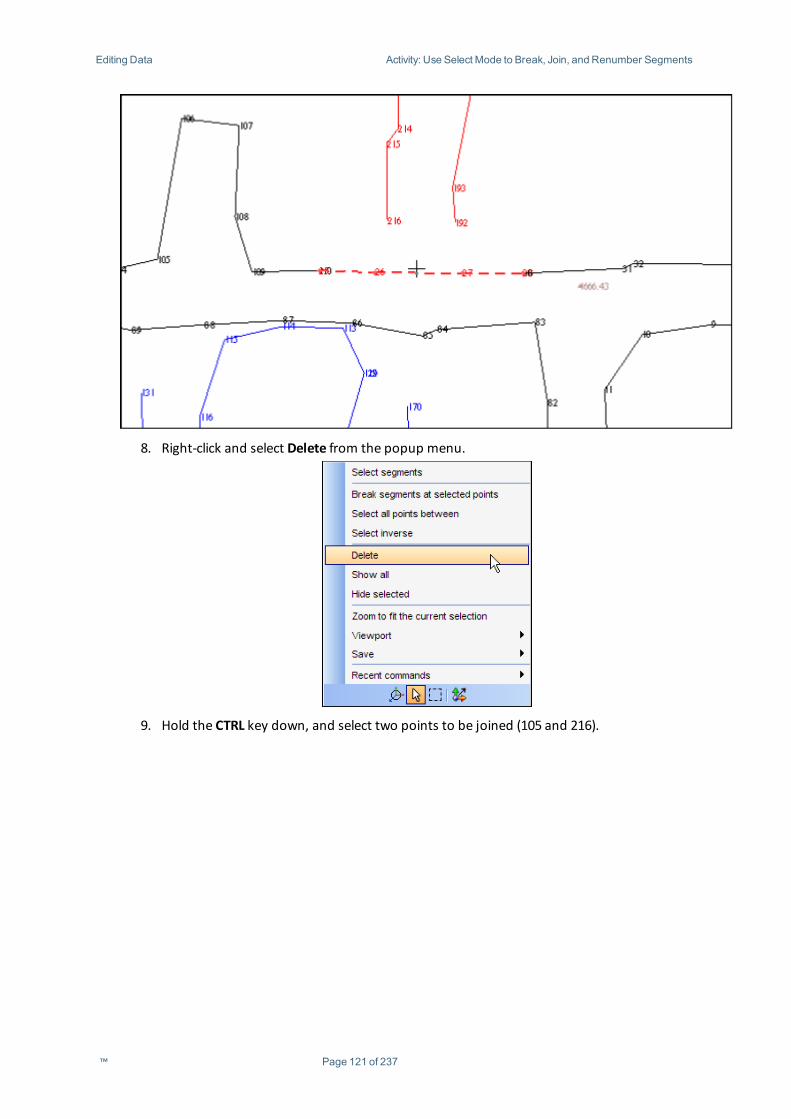
Editing Data Activity: Use Select Mode to Break, Join, and Renumber Segments
8. Right-click and select Delete from the popup menu.
9. Hold the CTRL key down, and select two points to be joined (105 and 216).
™ Page 121 of 237
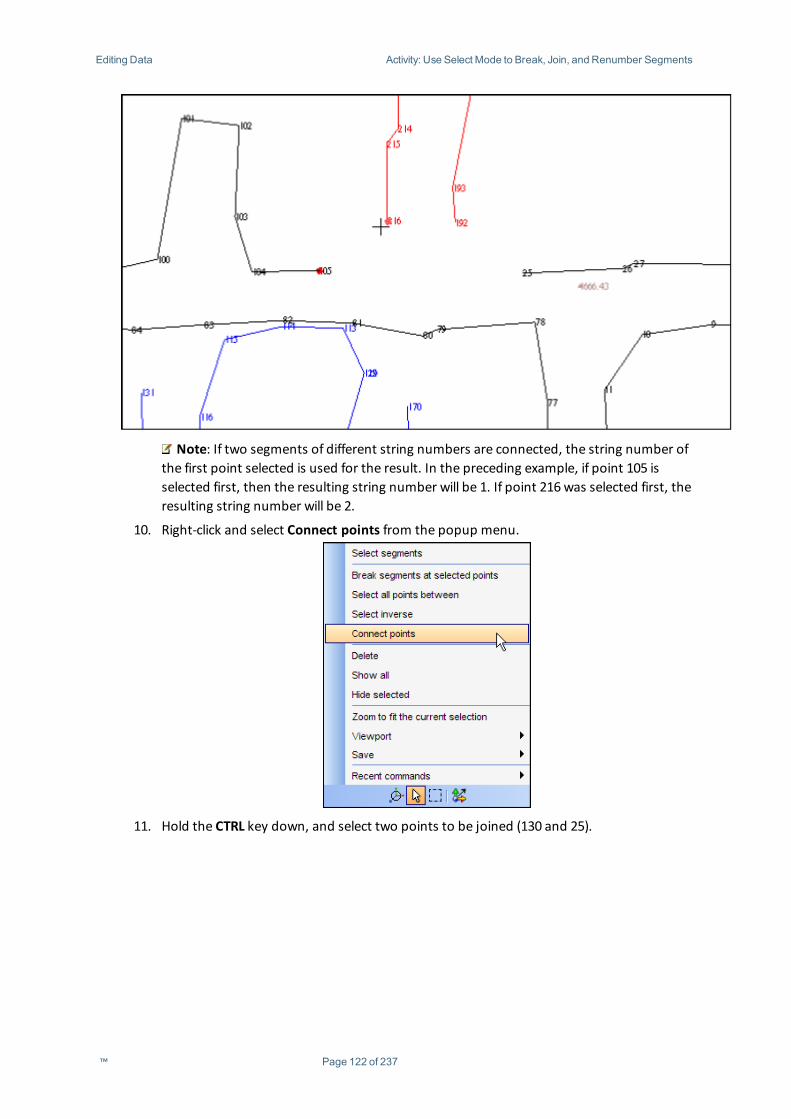
Editing Data Activity: Use Select Mode to Break, Join, and Renumber Segments
Note: If two segments of different string numbers are connected, the string number ofthe first point selected is used for the result. In the preceding example, if point 105 isselected first, then the resulting string number will be 1. If point 216was selected first, theresulting string number will be 2.
10. Right-click and select Connect points from the popup menu.
11. Hold the CTRL key down, and select two points to be joined (130 and 25).
™ Page 122 of 237
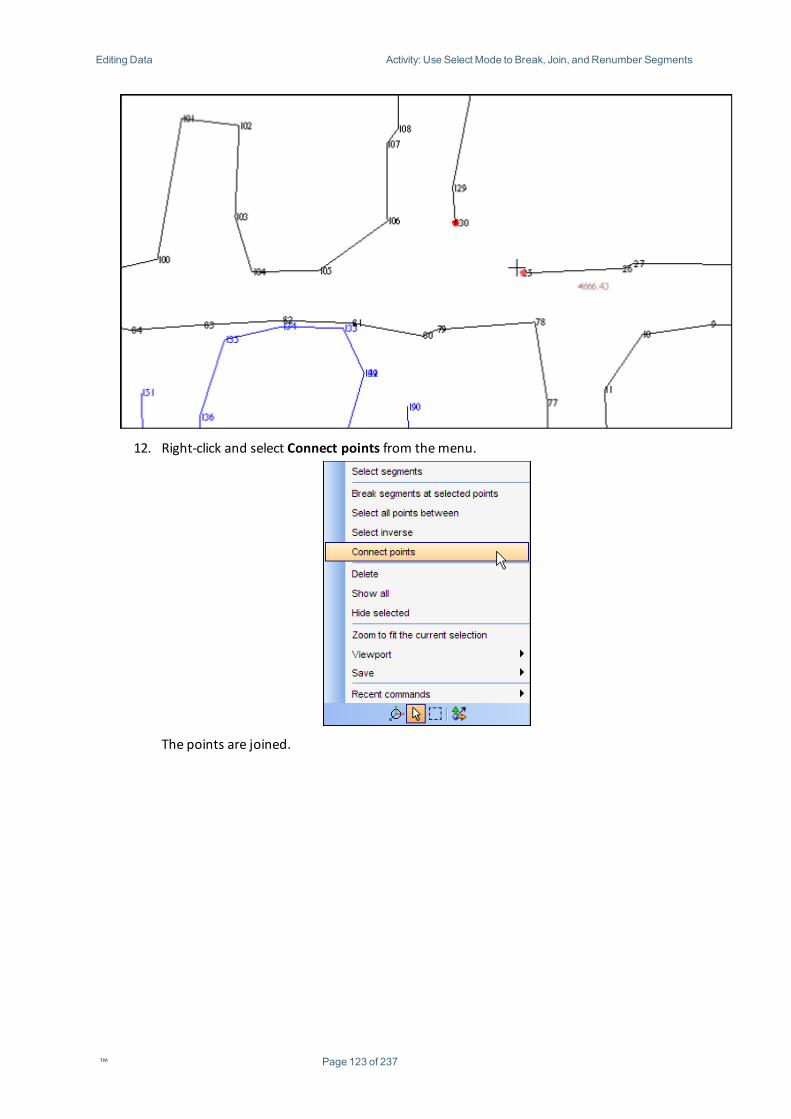
Editing Data Activity: Use Select Mode to Break, Join, and Renumber Segments
12. Right-click and select Connect points from themenu.
The points are joined.
™ Page 123 of 237
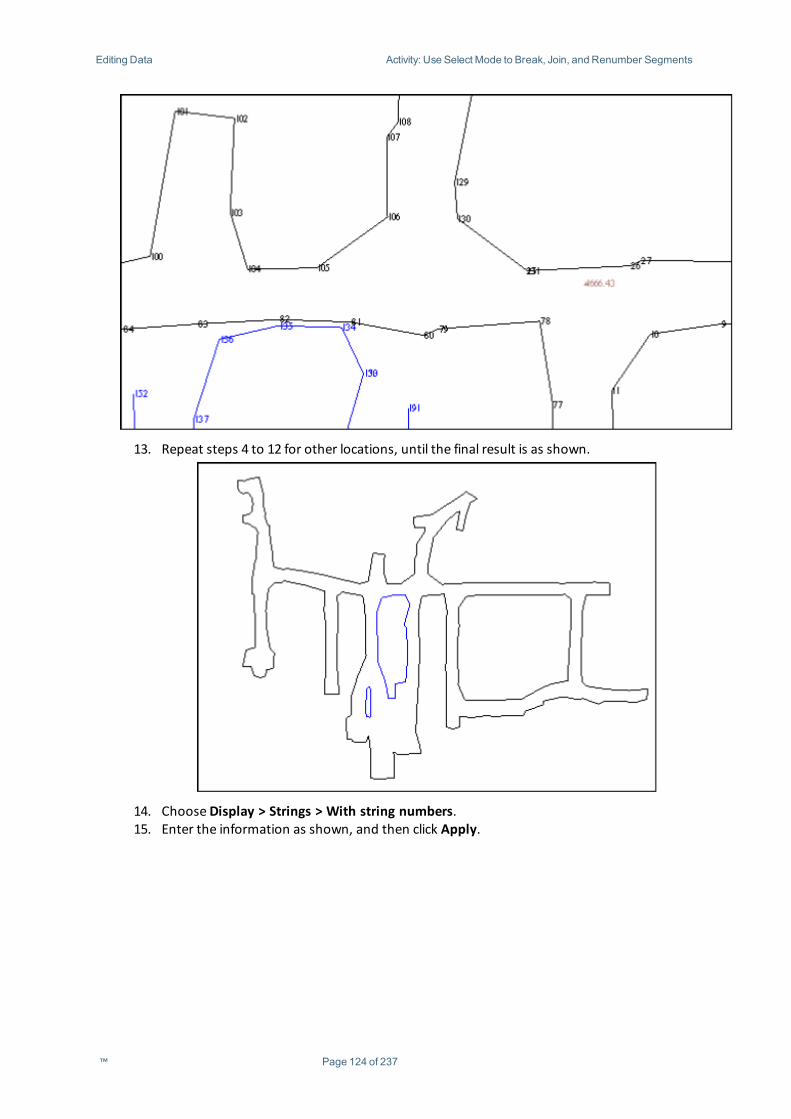
Editing Data Activity: Use Select Mode to Break, Join, and Renumber Segments
13. Repeat steps 4 to 12 for other locations, until the final result is as shown.
14. ChooseDisplay > Strings > With string numbers.15. Enter the information as shown, and then click Apply.
™ Page 124 of 237
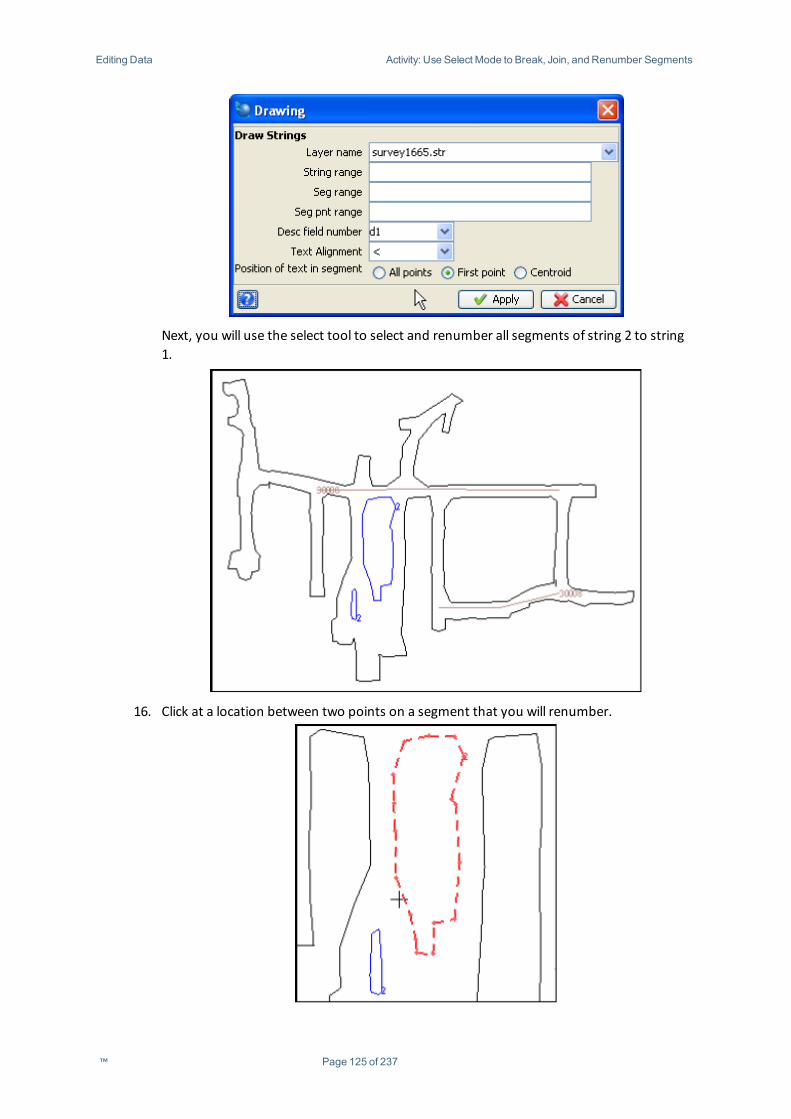
Editing Data Activity: Use Select Mode to Break, Join, and Renumber Segments
Next, you will use the select tool to select and renumber all segments of string 2 to string1.
16. Click at a location between two points on a segment that you will renumber.
™ Page 125 of 237
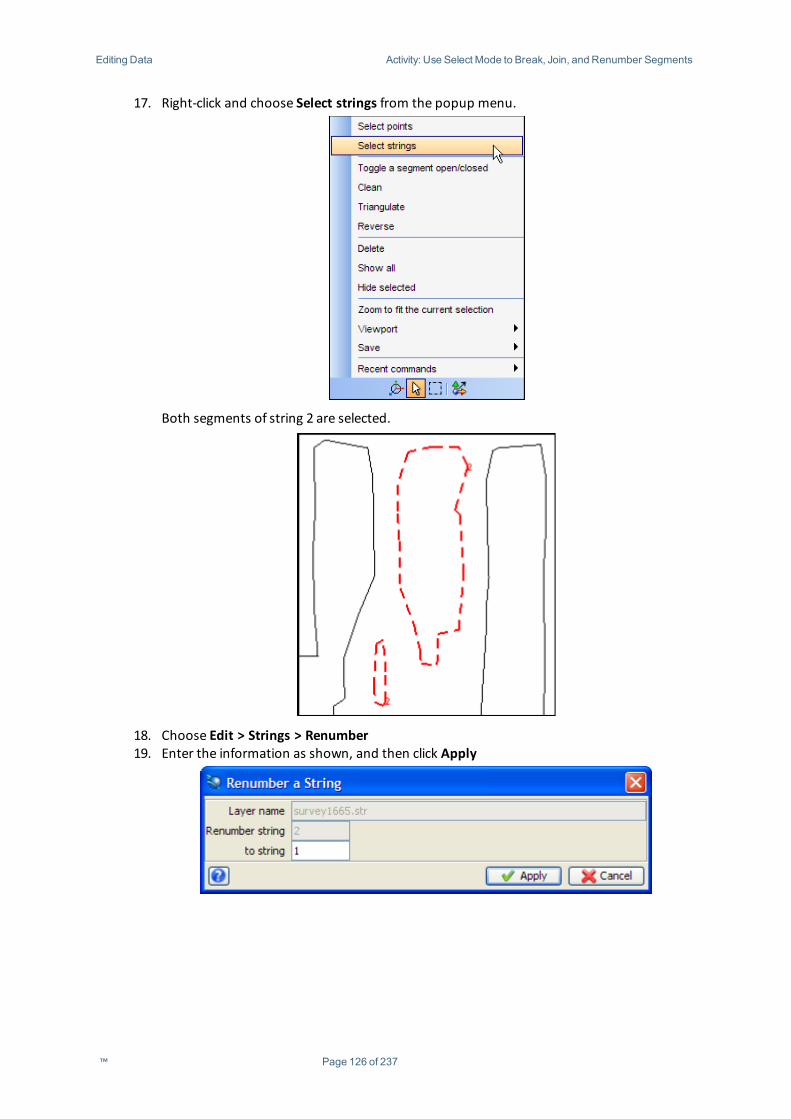
Editing Data Activity: Use Select Mode to Break, Join, and Renumber Segments
17. Right-click and choose Select strings from the popup menu.
Both segments of string 2 are selected.
18. Choose Edit > Strings > Renumber19. Enter the information as shown, and then click Apply
™ Page 126 of 237
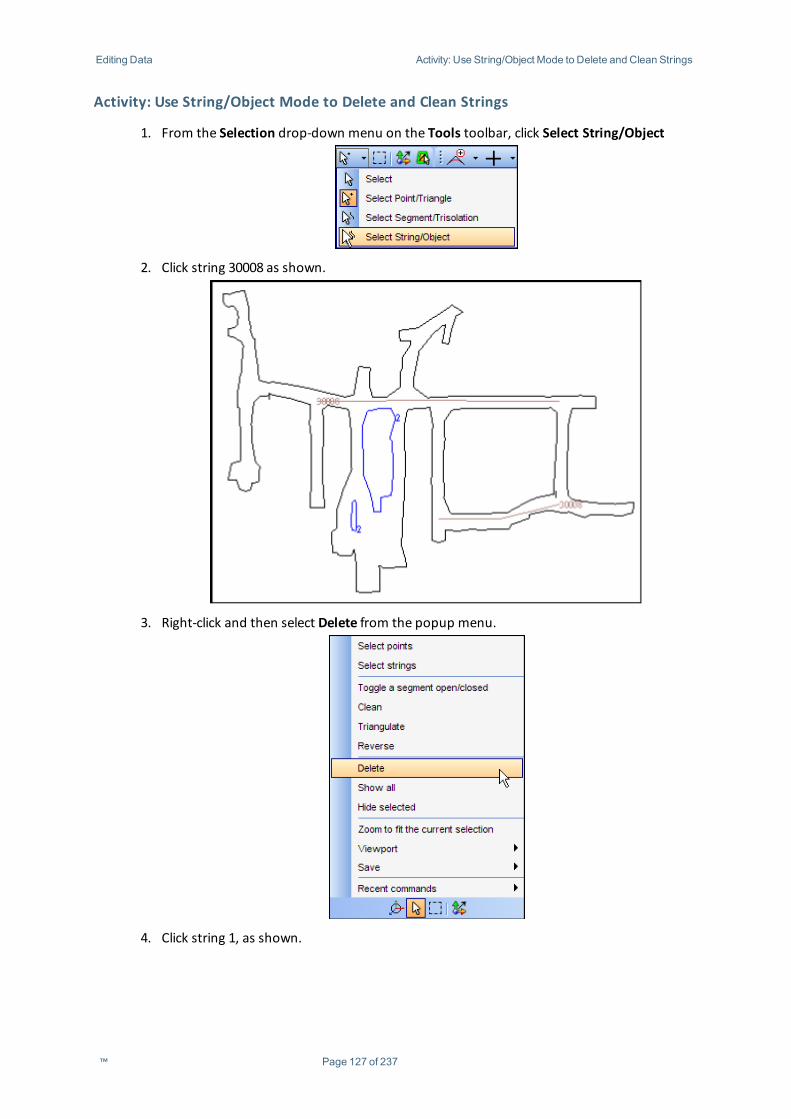
Editing Data Activity: Use String/Object Mode to Delete and Clean Strings
Activity: Use String/Object Mode to Delete and Clean Strings
1. From the Selection drop-down menu on the Tools toolbar, click Select String/Object
2. Click string 30008 as shown.
3. Right-click and then select Delete from the popup menu.
4. Click string 1, as shown.
™ Page 127 of 237
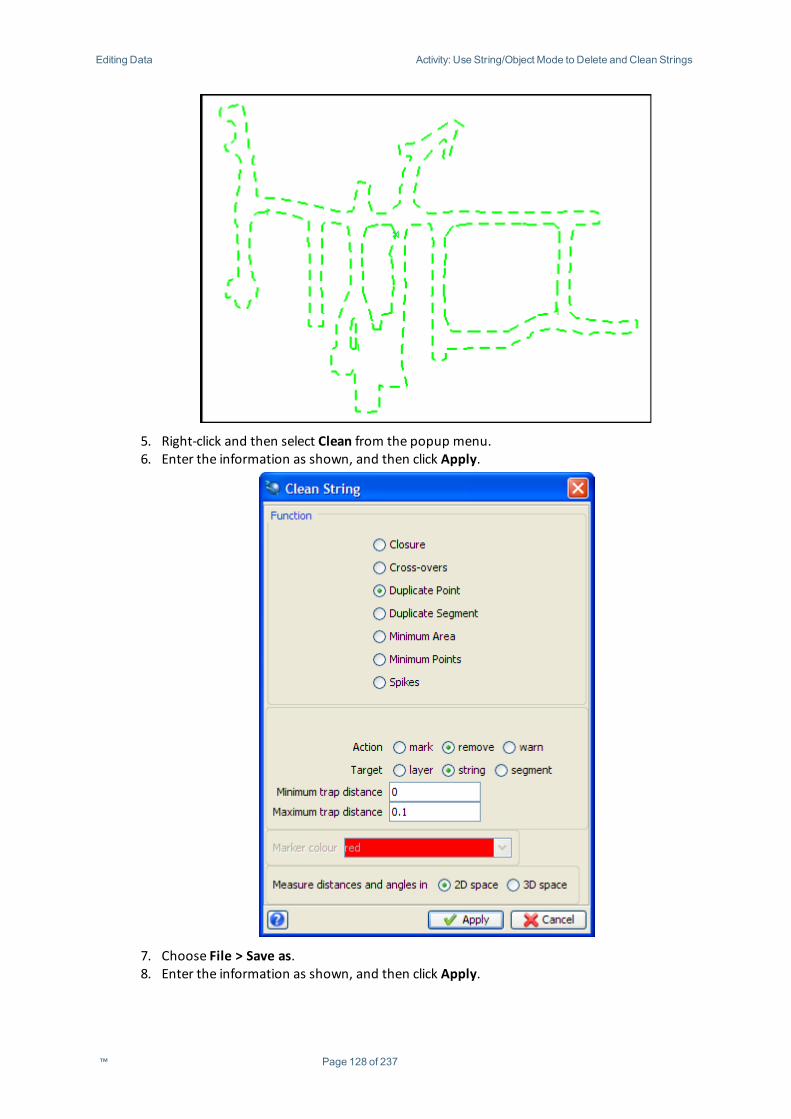
Editing Data Activity: Use String/Object Mode to Delete and Clean Strings
5. Right-click and then select Clean from the popup menu.6. Enter the information as shown, and then click Apply.
7. Choose File > Save as.8. Enter the information as shown, and then click Apply.
™ Page 128 of 237
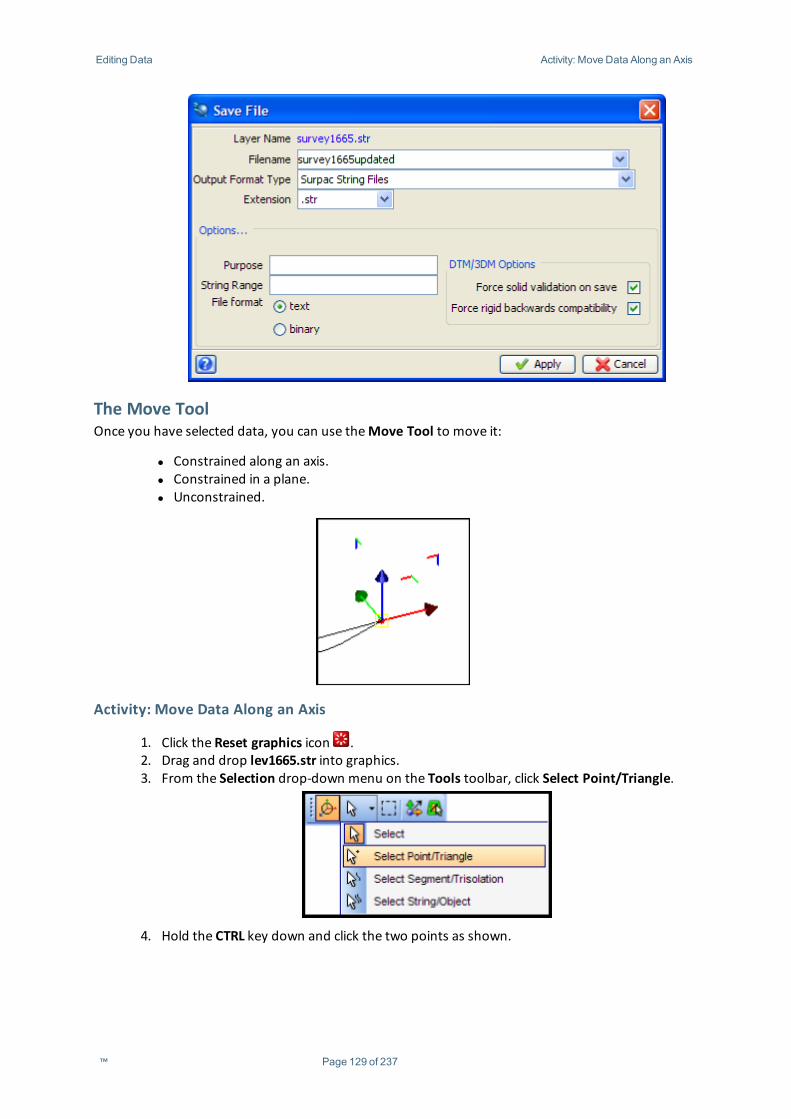
Editing Data Activity: Move Data Along an Axis
The Move ToolOnce you have selected data, you can use theMove Tool to move it:
l Constrained along an axis.l Constrained in a plane.l Unconstrained.
Activity: Move Data Along an Axis
1. Click the Reset graphics icon .2. Drag and drop lev1665.str into graphics.3. From the Selection drop-down menu on the Tools toolbar, click Select Point/Triangle.
4. Hold the CTRL key down and click the two points as shown.
™ Page 129 of 237
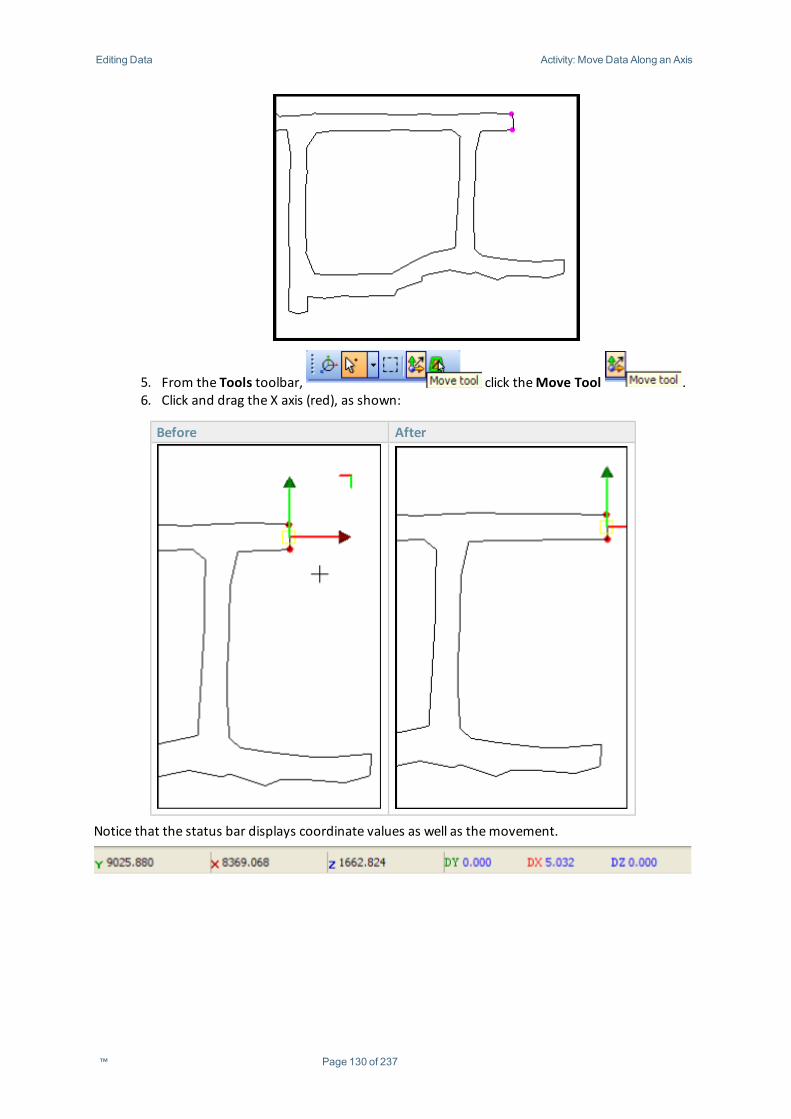
Editing Data Activity: Move Data Along an Axis
5. From the Tools toolbar, click theMove Tool .6. Click and drag the X axis (red), as shown:
Before After
Notice that the status bar displays coordinate values as well as themovement.
™ Page 130 of 237
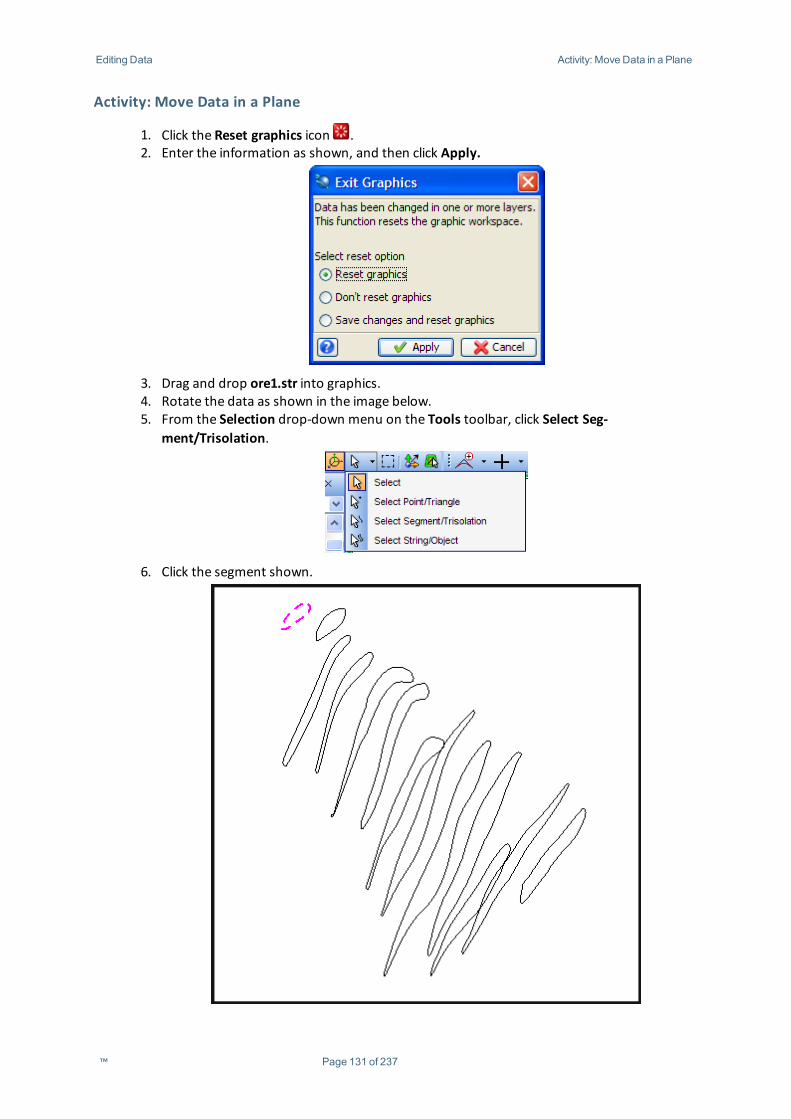
Editing Data Activity: Move Data in a Plane
Activity: Move Data in a Plane
1. Click the Reset graphics icon .2. Enter the information as shown, and then click Apply.
3. Drag and drop ore1.str into graphics.4. Rotate the data as shown in the image below.5. From the Selection drop-down menu on the Tools toolbar, click Select Seg-
ment/Trisolation.
6. Click the segment shown.
™ Page 131 of 237
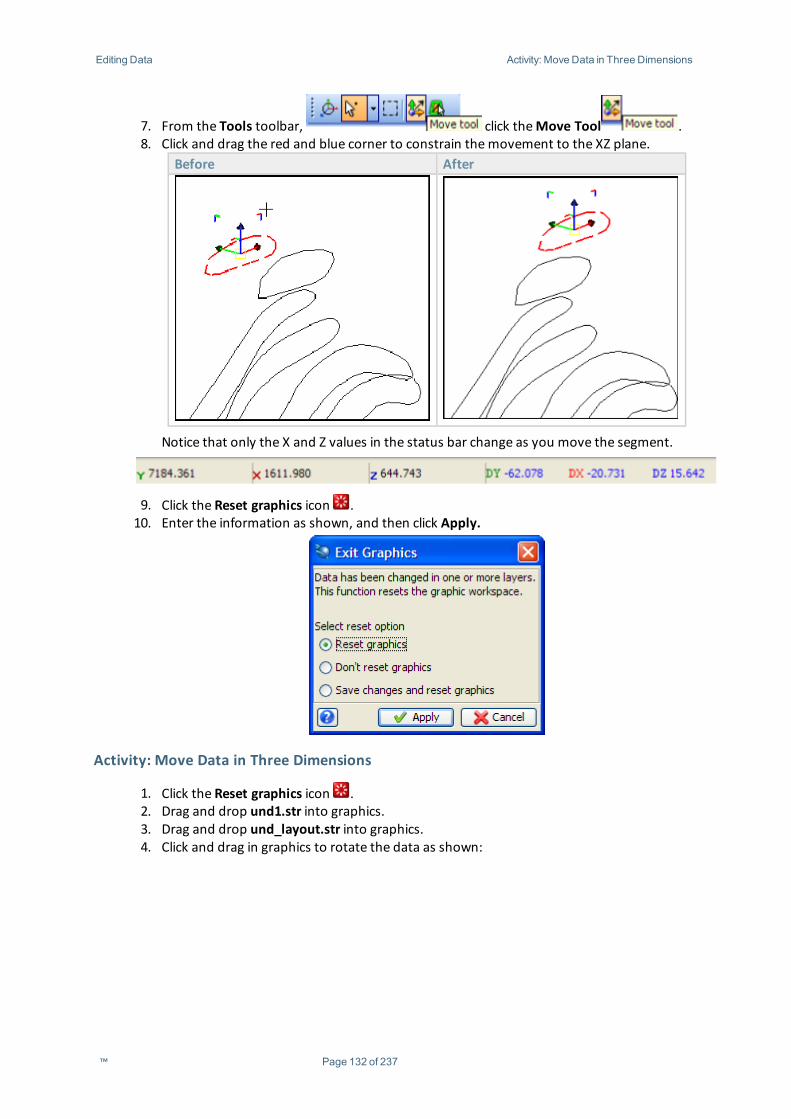
Editing Data Activity: Move Data in Three Dimensions
7. From the Tools toolbar, click theMove Tool .8. Click and drag the red and blue corner to constrain themovement to the XZ plane.
Before After
Notice that only the X and Z values in the status bar change as you move the segment.
9. Click the Reset graphics icon .10. Enter the information as shown, and then click Apply.
Activity: Move Data in Three Dimensions
1. Click the Reset graphics icon .2. Drag and drop und1.str into graphics.3. Drag and drop und_layout.str into graphics.4. Click and drag in graphics to rotate the data as shown:
™ Page 132 of 237
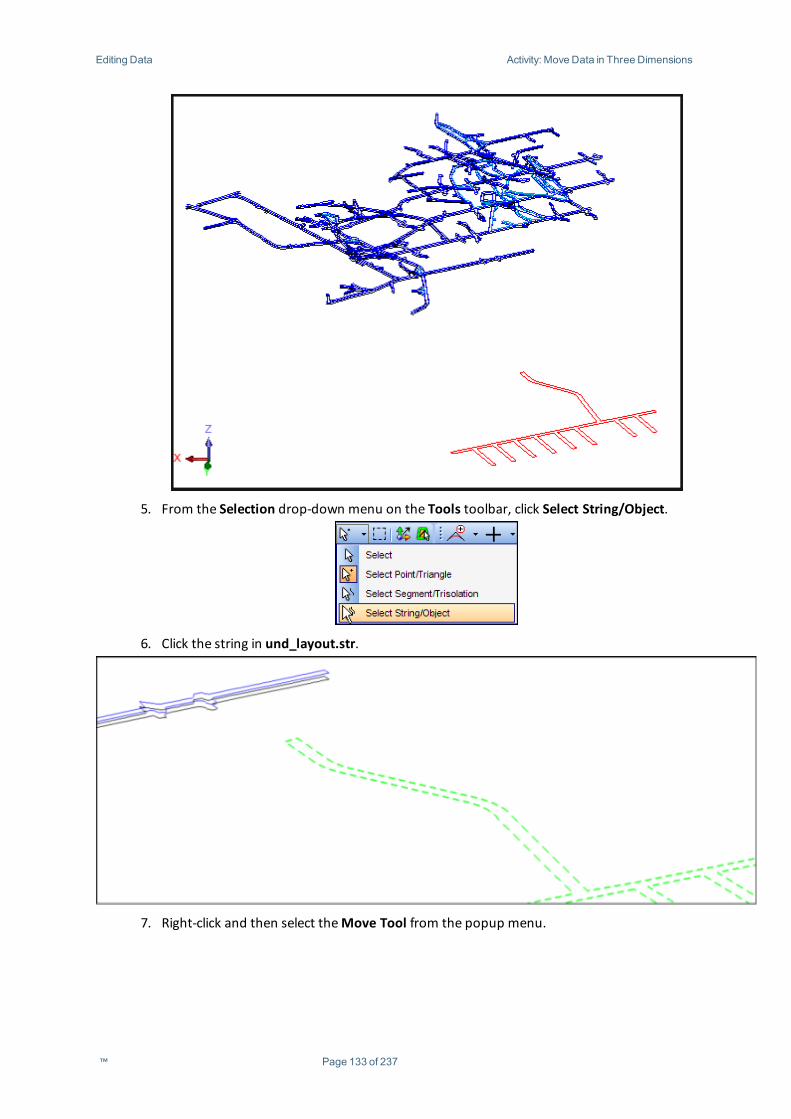
Editing Data Activity: Move Data in Three Dimensions
5. From the Selection drop-down menu on the Tools toolbar, click Select String/Object.
6. Click the string in und_layout.str.
7. Right-click and then select theMove Tool from the popup menu.
™ Page 133 of 237
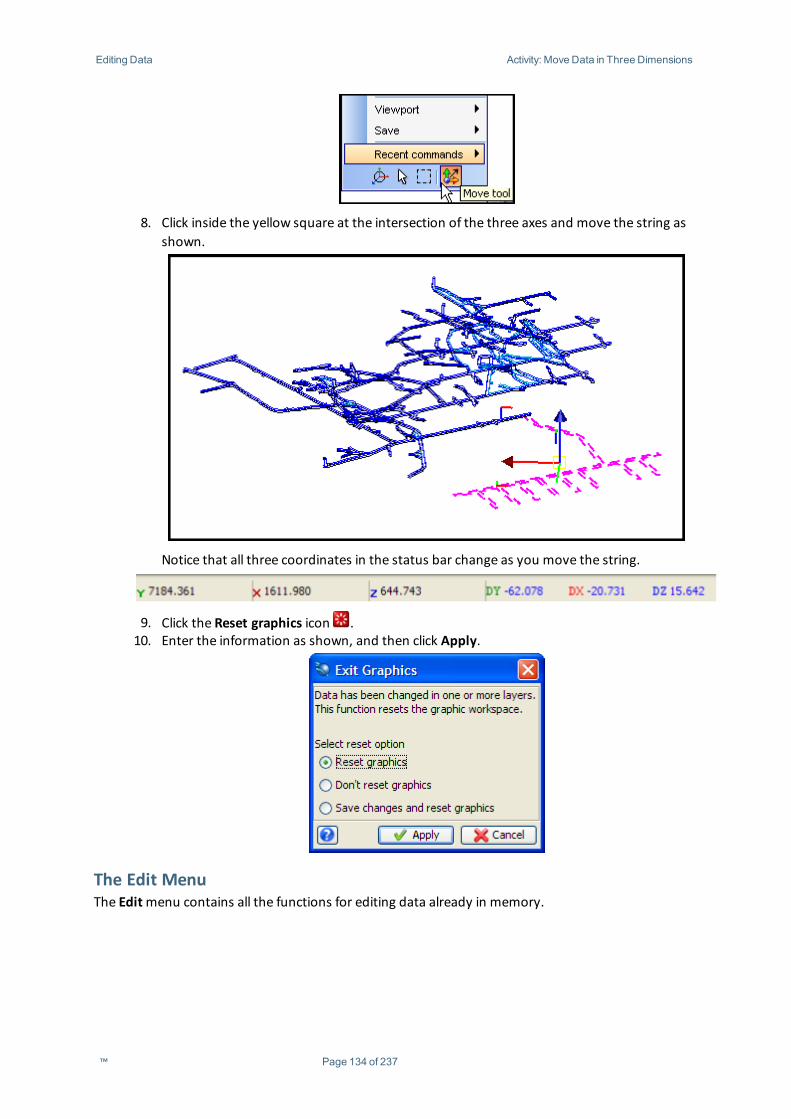
Editing Data Activity: Move Data in Three Dimensions
8. Click inside the yellow square at the intersection of the three axes and move the string asshown.
Notice that all three coordinates in the status bar change as you move the string.
9. Click the Reset graphics icon .10. Enter the information as shown, and then click Apply.
The Edit MenuThe Editmenu contains all the functions for editing data already in memory.
™ Page 134 of 237
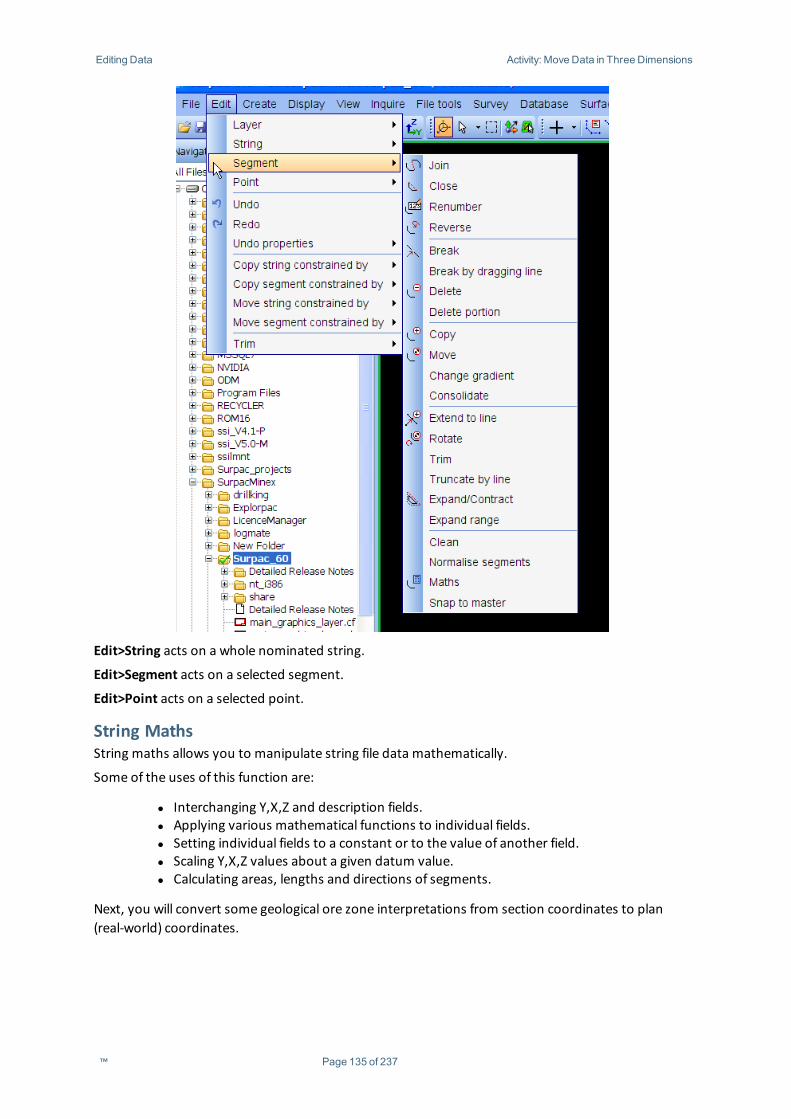
Editing Data Activity: Move Data in Three Dimensions
Edit>String acts on a whole nominated string.
Edit>Segment acts on a selected segment.
Edit>Point acts on a selected point.
String MathsString maths allows you to manipulate string file data mathematically.
Some of the uses of this function are:
l Interchanging Y,X,Z and description fields.l Applying various mathematical functions to individual fields.l Setting individual fields to a constant or to the value of another field.l Scaling Y,X,Z values about a given datum value.l Calculating areas, lengths and directions of segments.
Next, you will convert some geological ore zone interpretations from section coordinates to plan(real-world) coordinates.
™ Page 135 of 237
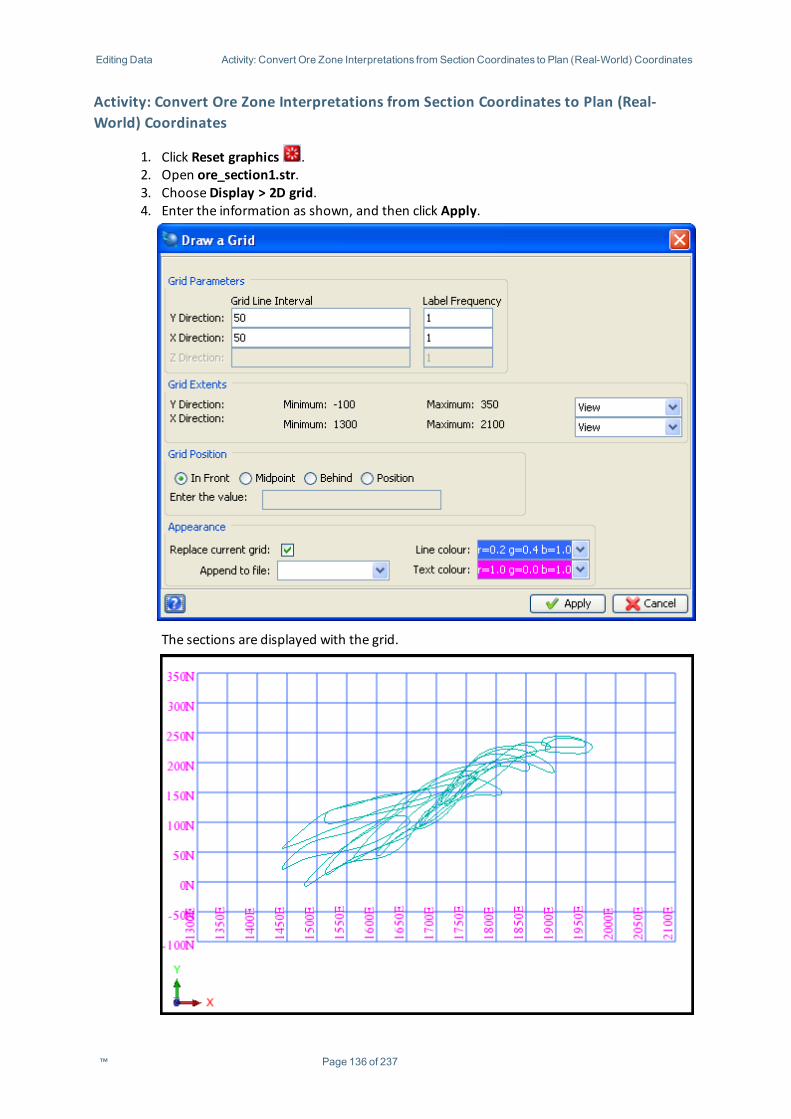
Editing Data Activity: Convert Ore Zone Interpretations from Section Coordinates to Plan (Real-World) Coordinates
Activity: Convert Ore Zone Interpretations from Section Coordinates to Plan (Real-World) Coordinates
1. Click Reset graphics .2. Open ore_section1.str.3. ChooseDisplay > 2D grid.4. Enter the information as shown, and then click Apply.
The sections are displayed with the grid.
™ Page 136 of 237
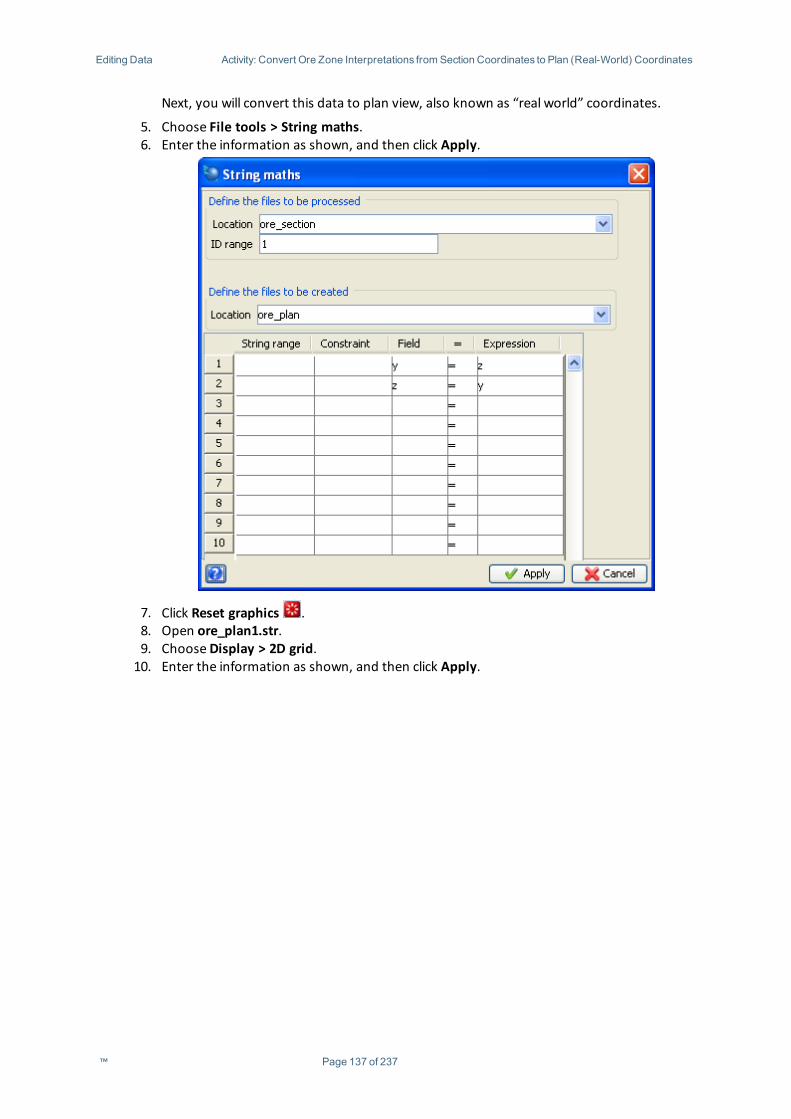
Editing Data Activity: Convert Ore Zone Interpretations from Section Coordinates to Plan (Real-World) Coordinates
Next, you will convert this data to plan view, also known as “real world” coordinates.
5. Choose File tools > String maths.6. Enter the information as shown, and then click Apply.
7. Click Reset graphics .8. Open ore_plan1.str.9. ChooseDisplay > 2D grid.10. Enter the information as shown, and then click Apply.
™ Page 137 of 237
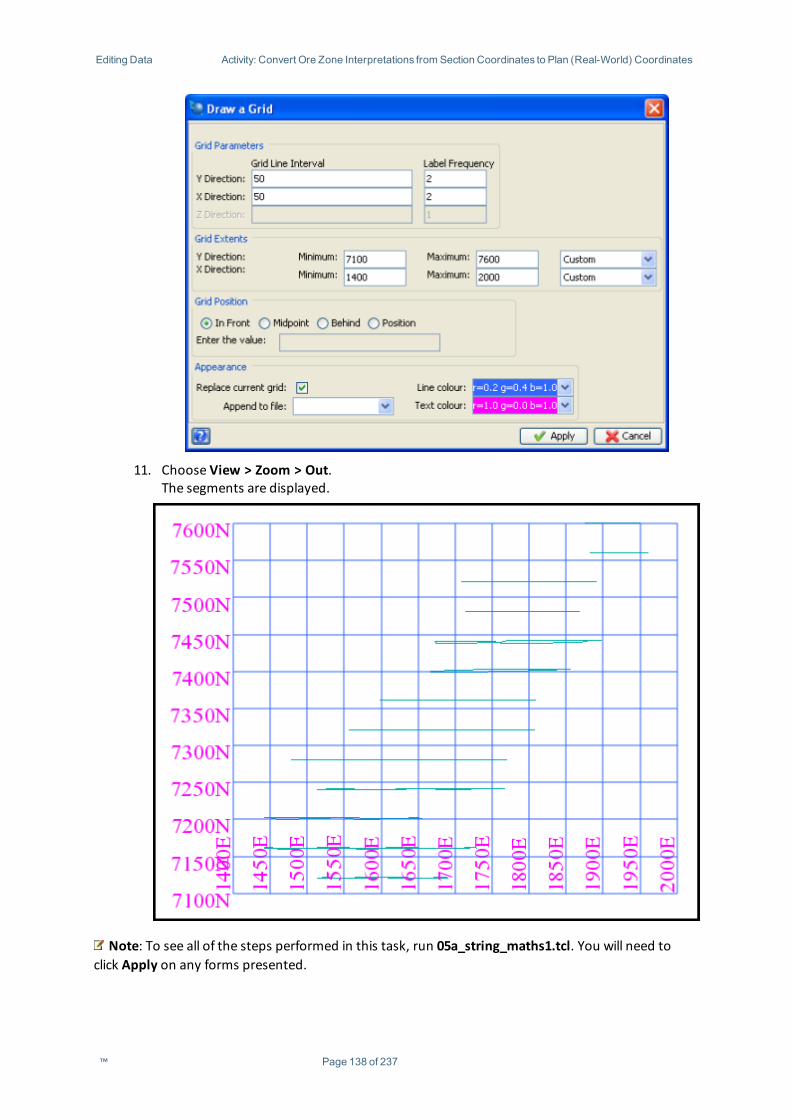
Editing Data Activity: Convert Ore Zone Interpretations from Section Coordinates to Plan (Real-World) Coordinates
11. Choose View > Zoom > Out.The segments are displayed.
Note: To see all of the steps performed in this task, run 05a_string_maths1.tcl. You will need toclick Apply on any forms presented.
™ Page 138 of 237
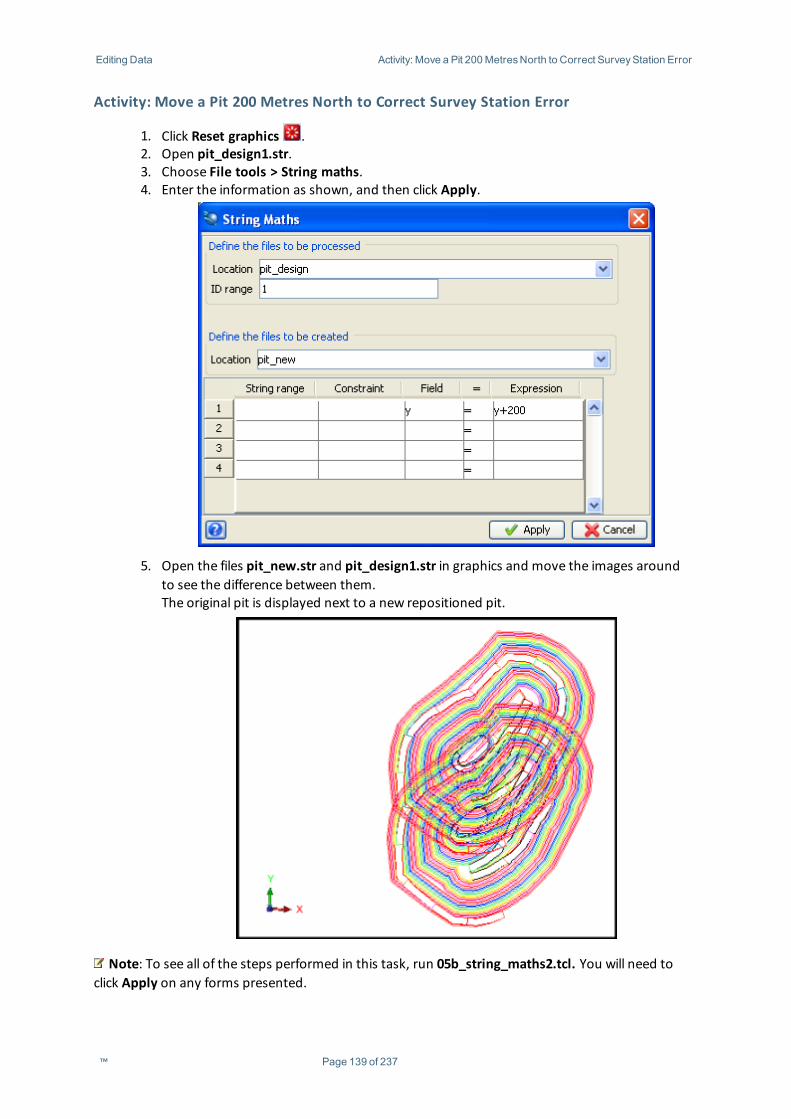
Editing Data Activity: Move a Pit 200MetresNorth to Correct SurveyStation Error
Activity: Move a Pit 200 Metres North to Correct Survey Station Error
1. Click Reset graphics .2. Open pit_design1.str.3. Choose File tools > String maths.4. Enter the information as shown, and then click Apply.
5. Open the files pit_new.str and pit_design1.str in graphics and move the images aroundto see the difference between them.The original pit is displayed next to a new repositioned pit.
Note: To see all of the steps performed in this task, run 05b_string_maths2.tcl. You will need toclick Apply on any forms presented.
™ Page 139 of 237
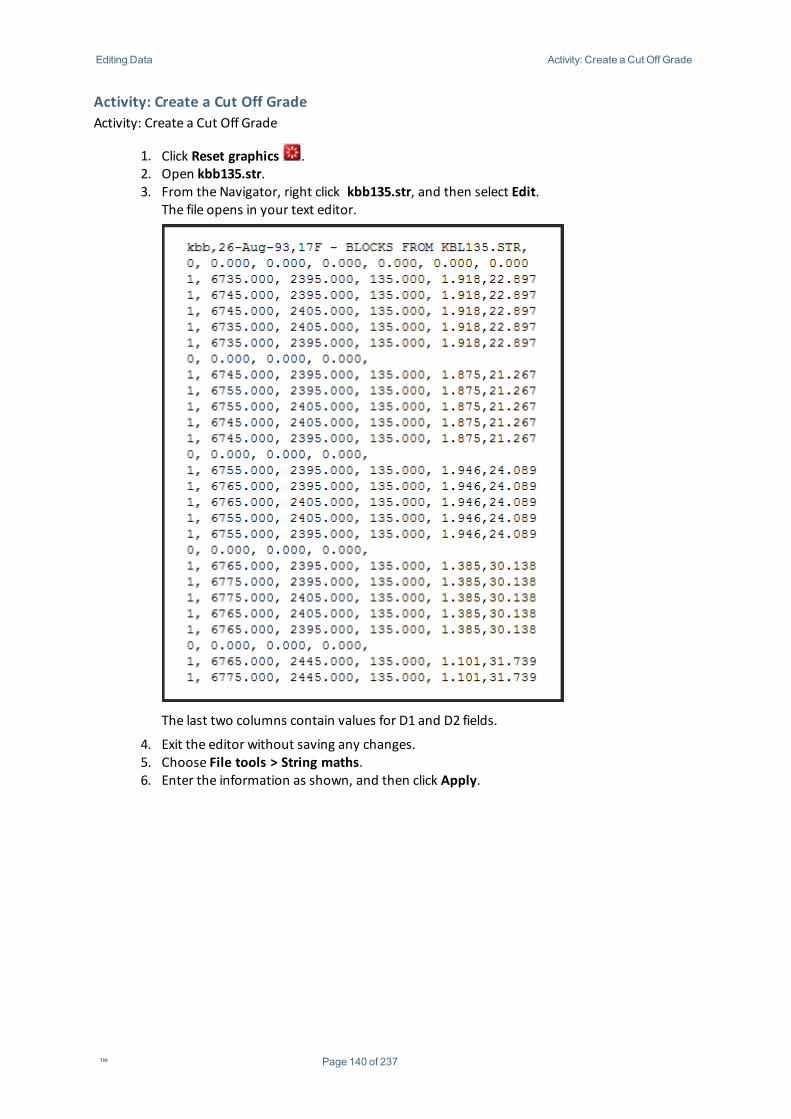
Editing Data Activity: Create a Cut Off Grade
Activity: Create a Cut Off GradeActivity: Create a Cut Off Grade
1. Click Reset graphics .2. Open kbb135.str.3. From the Navigator, right click kbb135.str, and then select Edit.
The file opens in your text editor.
The last two columns contain values for D1 and D2 fields.
4. Exit the editor without saving any changes.5. Choose File tools > String maths.6. Enter the information as shown, and then click Apply.
™ Page 140 of 237
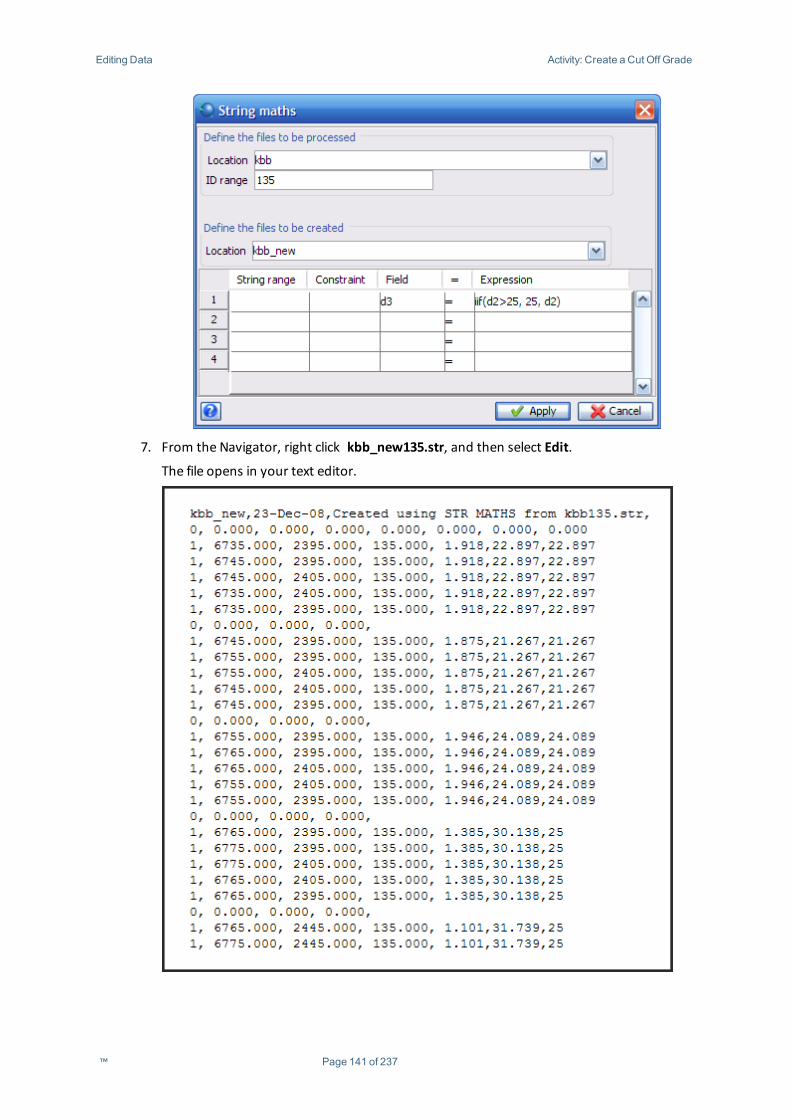
Editing Data Activity: Create a Cut Off Grade
7. From the Navigator, right click kbb_new135.str, and then select Edit.
The file opens in your text editor.
™ Page 141 of 237
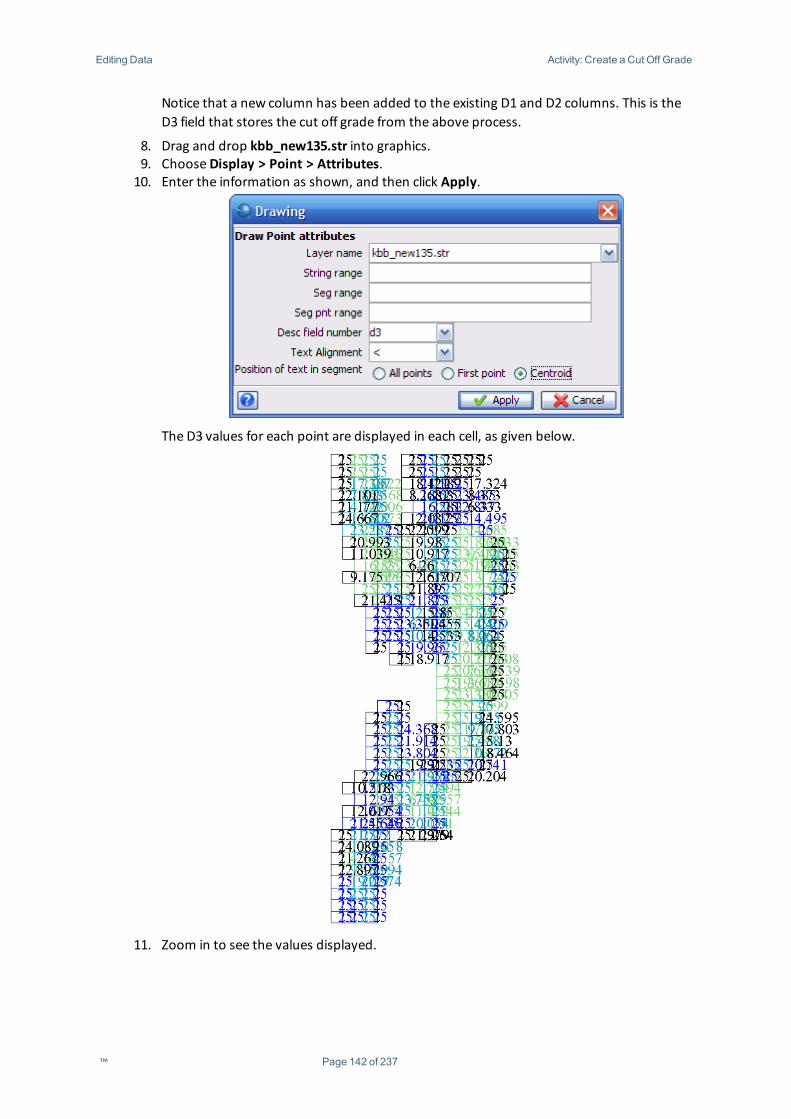
Editing Data Activity: Create a Cut Off Grade
Notice that a new column has been added to the existing D1 and D2 columns. This is theD3 field that stores the cut off grade from the above process.
8. Drag and drop kbb_new135.str into graphics.9. ChooseDisplay > Point > Attributes.10. Enter the information as shown, and then click Apply.
The D3 values for each point are displayed in each cell, as given below.
11. Zoom in to see the values displayed.
™ Page 142 of 237
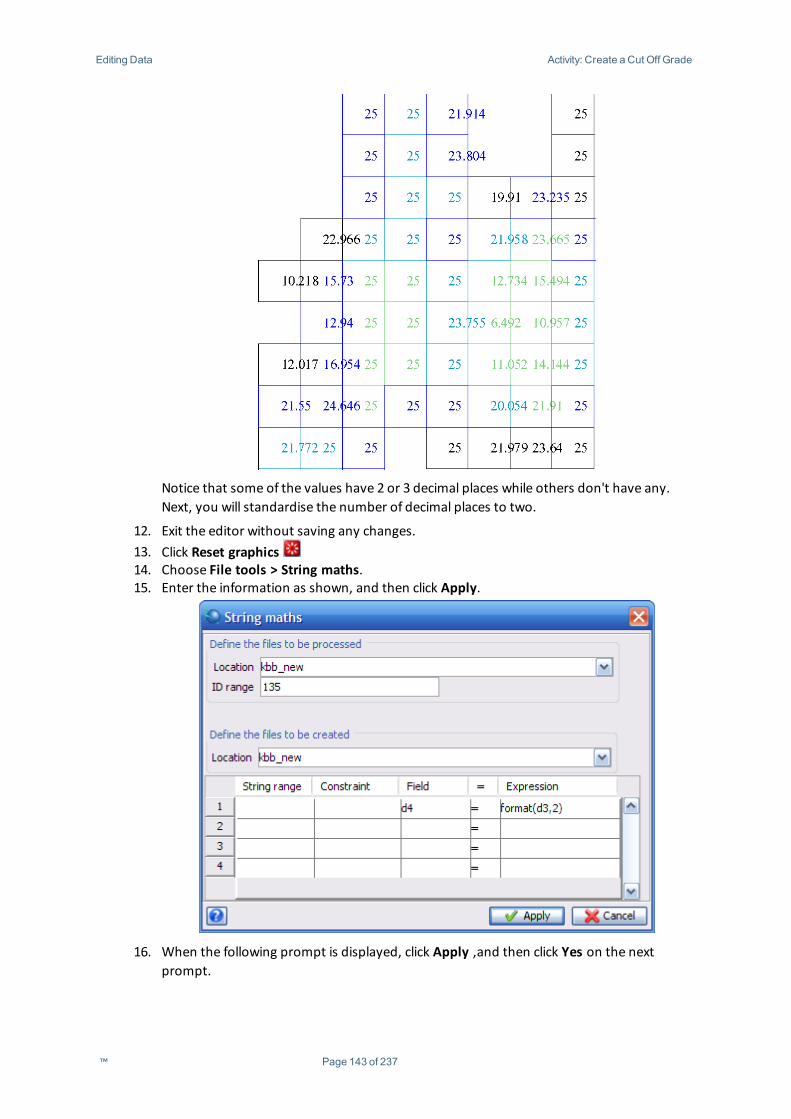
Editing Data Activity: Create a Cut Off Grade
Notice that some of the values have 2 or 3 decimal places while others don't have any.Next, you will standardise the number of decimal places to two.
12. Exit the editor without saving any changes.13. Click Reset graphics14. Choose File tools > String maths.15. Enter the information as shown, and then click Apply.
16. When the following prompt is displayed, click Apply ,and then click Yes on the nextprompt.
™ Page 143 of 237
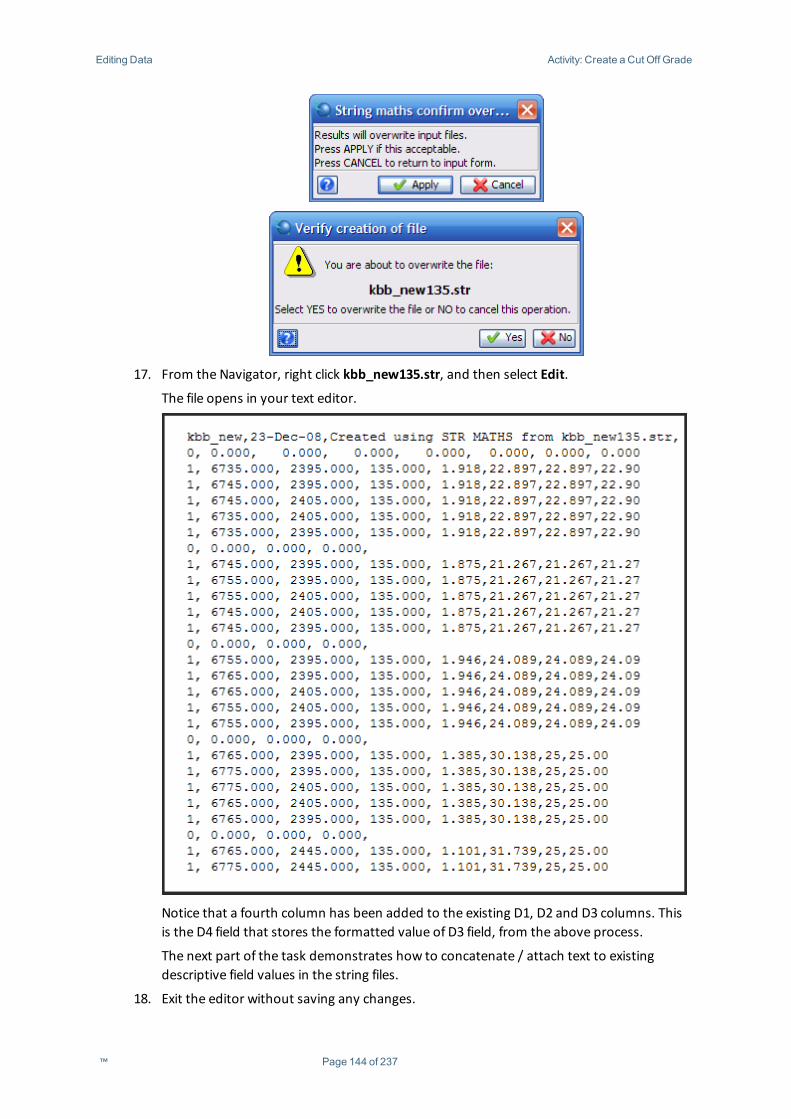
Editing Data Activity: Create a Cut Off Grade
17. From the Navigator, right click kbb_new135.str, and then select Edit.
The file opens in your text editor.
Notice that a fourth column has been added to the existing D1, D2 and D3 columns. Thisis the D4 field that stores the formatted value of D3 field, from the above process.
The next part of the task demonstrates how to concatenate / attach text to existingdescriptive field values in the string files.
18. Exit the editor without saving any changes.
™ Page 144 of 237
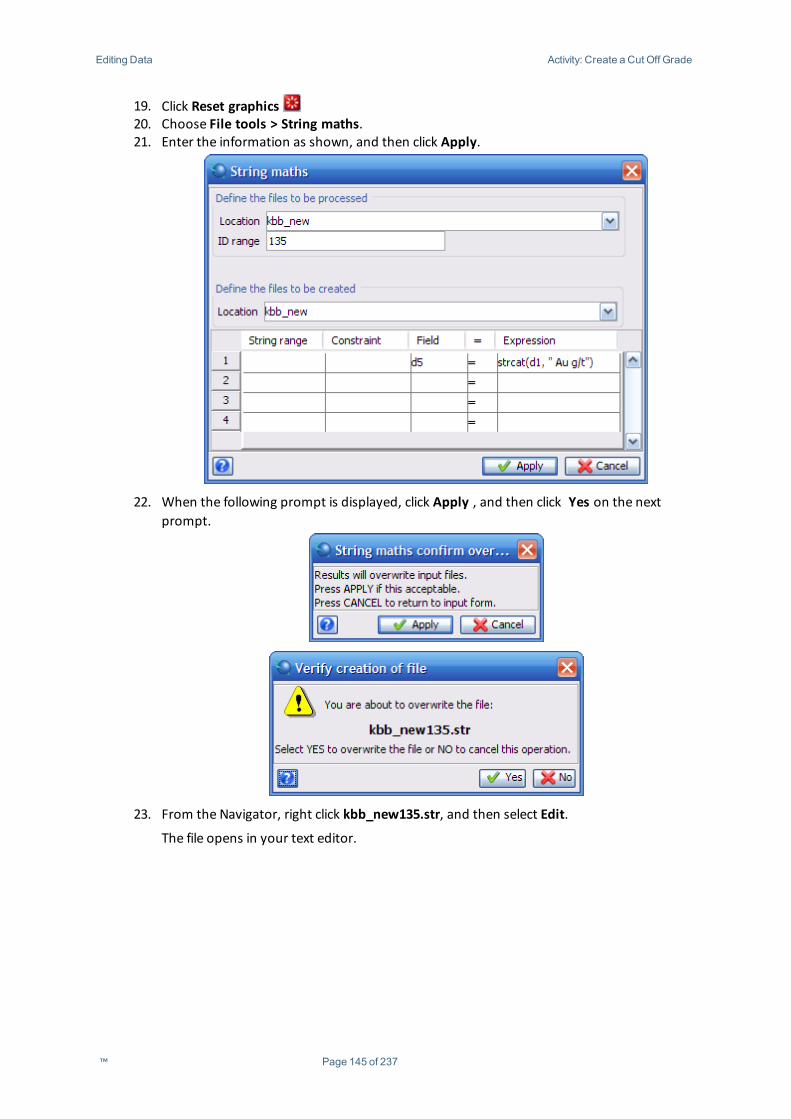
Editing Data Activity: Create a Cut Off Grade
19. Click Reset graphics20. Choose File tools > String maths.21. Enter the information as shown, and then click Apply.
22. When the following prompt is displayed, click Apply , and then click Yes on the nextprompt.
23. From the Navigator, right click kbb_new135.str, and then select Edit.
The file opens in your text editor.
™ Page 145 of 237
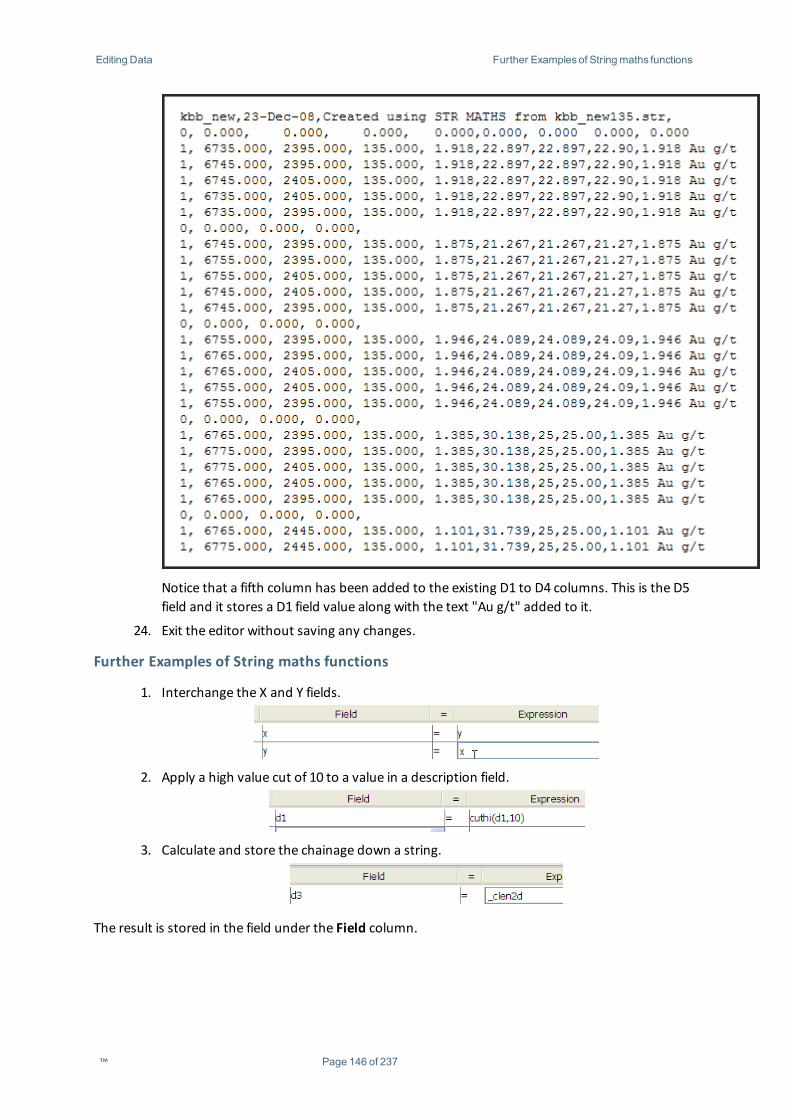
Editing Data Further Examplesof Stringmaths functions
Notice that a fifth column has been added to the existing D1 to D4 columns. This is the D5field and it stores a D1 field value along with the text "Au g/t" added to it.
24. Exit the editor without saving any changes.
Further Examples of String maths functions
1. Interchange the X and Y fields.
2. Apply a high value cut of 10 to a value in a description field.
3. Calculate and store the chainage down a string.
The result is stored in the field under the Field column.
™ Page 146 of 237

Editing Data Questions
Review
Questions
1. What is the default graphics mode?2. Using a selection mode, what are the five different ways to select data?3. How does themove tool work?4. Having selected data, how is a data centric menu displayed?5. How can all the expressions that can be used for theMATHS function be found?
Exercises
1. Using editing tools.A. Opn Ore150.str and Pit150b.str in separate graphics layers.B. Make Pit150b.str the active layer.C. Smooth the pit contour string.D. Remove duplicate points within 3m.E. Make the Z value 145m.F. Renumber the string to 145.G. Move points to create a ramp access onto the ore.
2. The clip/trim function.A. Reset graphics.B. Open soil1.str into Graphics.C. Open bdy100.str into Graphics.D. Make soil1.str the active layer.E. Display point markers(pm).F. Choose Edit>Trim>Clip by selected segment.G. Select the bdy100 string.
Question:
i. What effect does this function have?
H. Undo .I. Choose Edit>Trim>Trim by selected segment, delete partially inside segment.
Questions:
i. What effect does this function have?ii. Give an example of how one of these functions might be used.
4. String editing using menus / toolbars.A. Open LEV100.str.B. Display strings with segment numbers.C. Using Segment>Join, join segment 1.1 to 1.2.D. Close segment 1.1.E. Move the first point on string 2 to the other side of string 1, using
Edit>Point>Move.F. Renumber string 2 to string 1.G. Using theDisplay functions, choose Edit>Display>Point>Numbers.H. Using Edit>Segment>Break, break the string after point 12.I. Display strings with segment numbers.J. Using Edit>Segment>Join, join string 1.1 to 1.6, then 1.1 to 1.2.K. Now display point numbers again and see how they have been re-numbered
to reflect the new order of the string.
™ Page 147 of 237
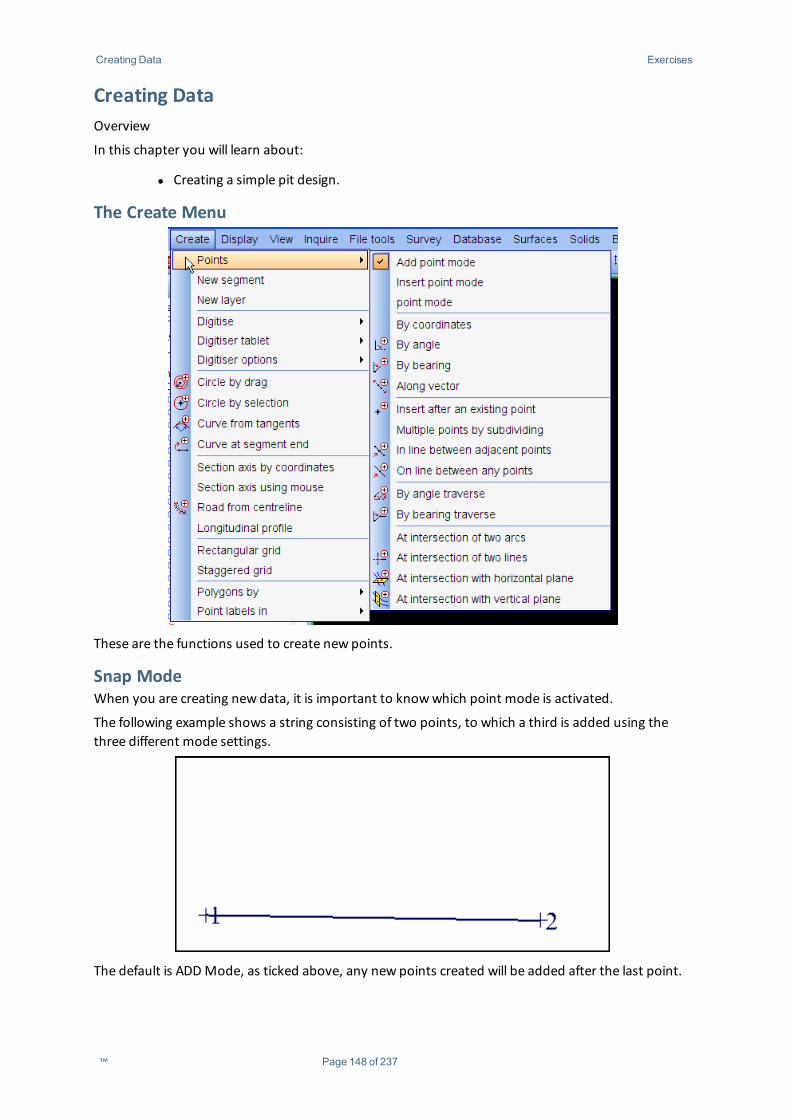
Creating Data Exercises
Creating DataOverview
In this chapter you will learn about:
l Creating a simple pit design.
The Create Menu
These are the functions used to create new points.
Snap ModeWhen you are creating new data, it is important to knowwhich point mode is activated.
The following example shows a string consisting of two points, to which a third is added using thethree different mode settings.
The default is ADDMode, as ticked above, any new points created will be added after the last point.
™ Page 148 of 237
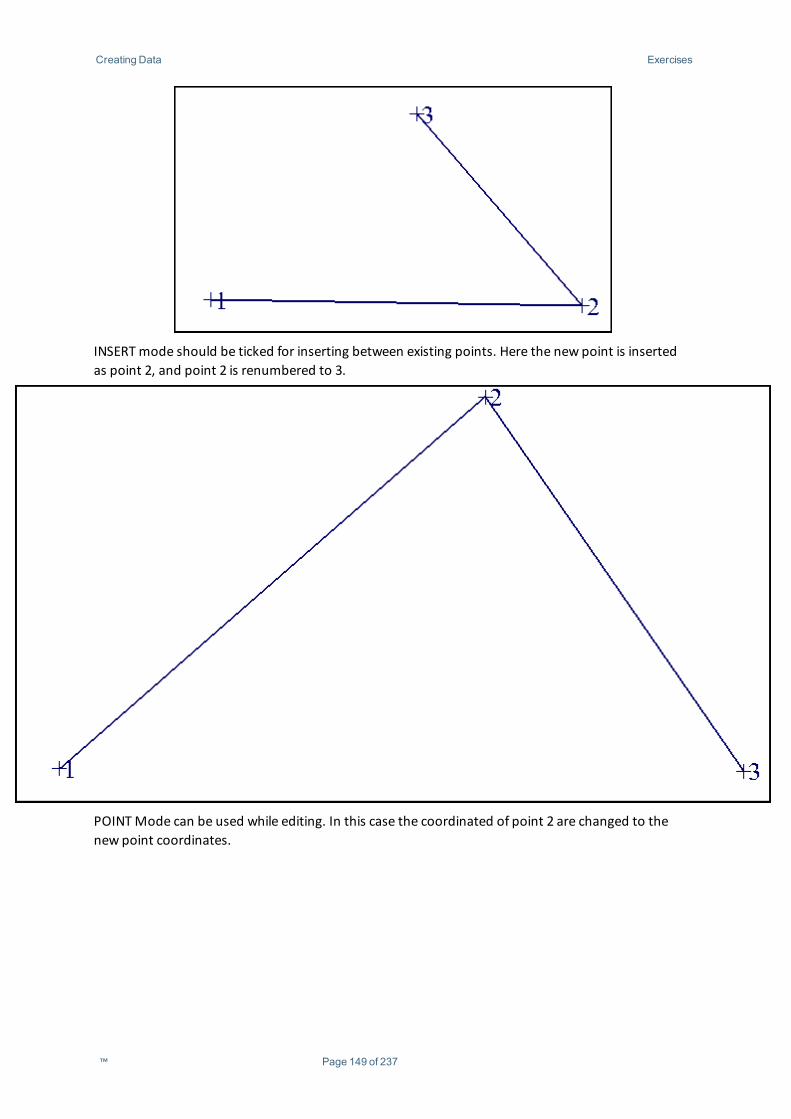
Creating Data Exercises
INSERTmode should be ticked for inserting between existing points. Here the new point is insertedas point 2, and point 2 is renumbered to 3.
POINTMode can be used while editing. In this case the coordinated of point 2 are changed to thenew point coordinates.
™ Page 149 of 237
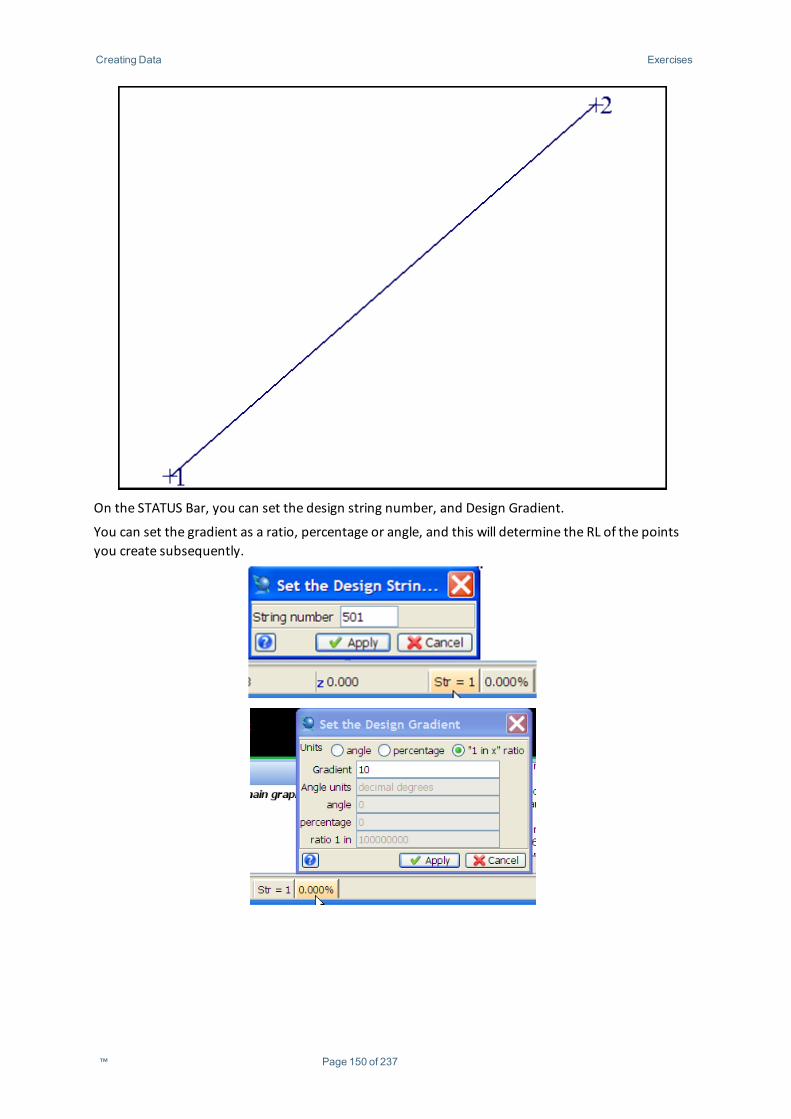
Creating Data Exercises
On the STATUS Bar, you can set the design string number, and Design Gradient.
You can set the gradient as a ratio, percentage or angle, and this will determine the RL of the pointsyou create subsequently.
™ Page 150 of 237
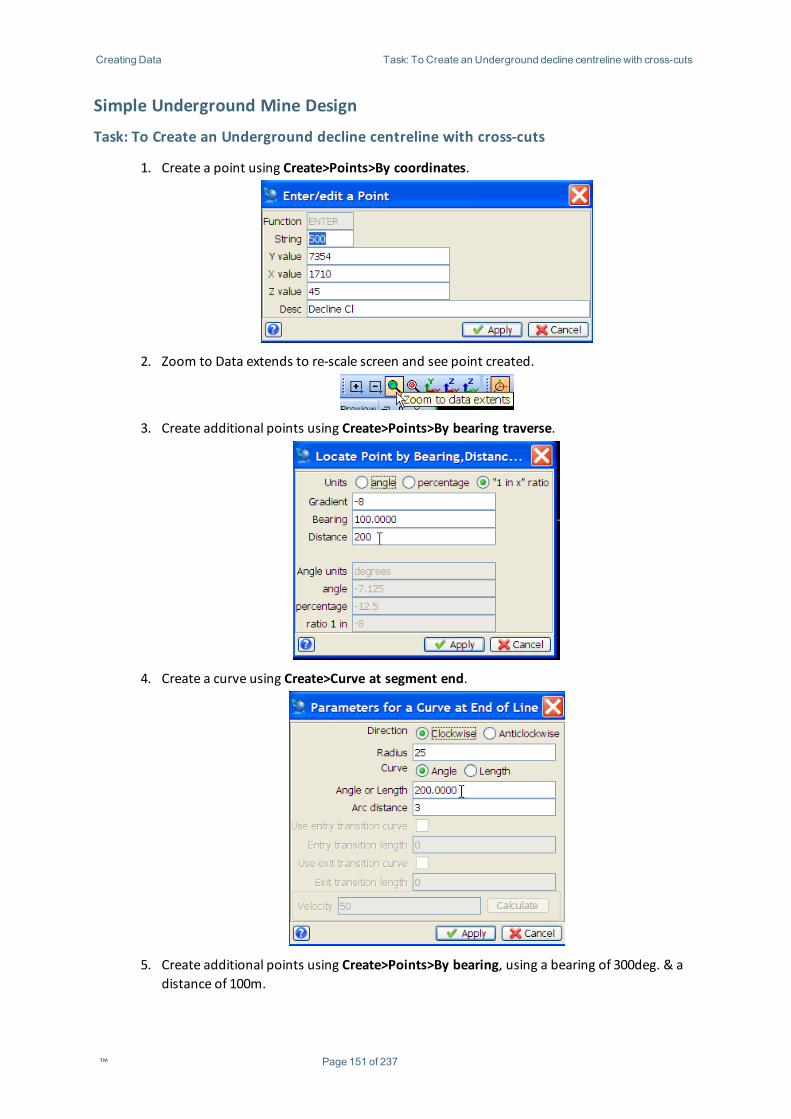
Creating Data Task: To Create an Underground decline centreline with cross-cuts
Simple Underground Mine Design
Task: To Create an Underground decline centreline with cross-cuts
1. Create a point using Create>Points>By coordinates.
2. Zoom to Data extends to re-scale screen and see point created.
3. Create additional points using Create>Points>By bearing traverse.
4. Create a curve using Create>Curve at segment end.
5. Create additional points using Create>Points>By bearing, using a bearing of 300deg. & adistance of 100m.
™ Page 151 of 237
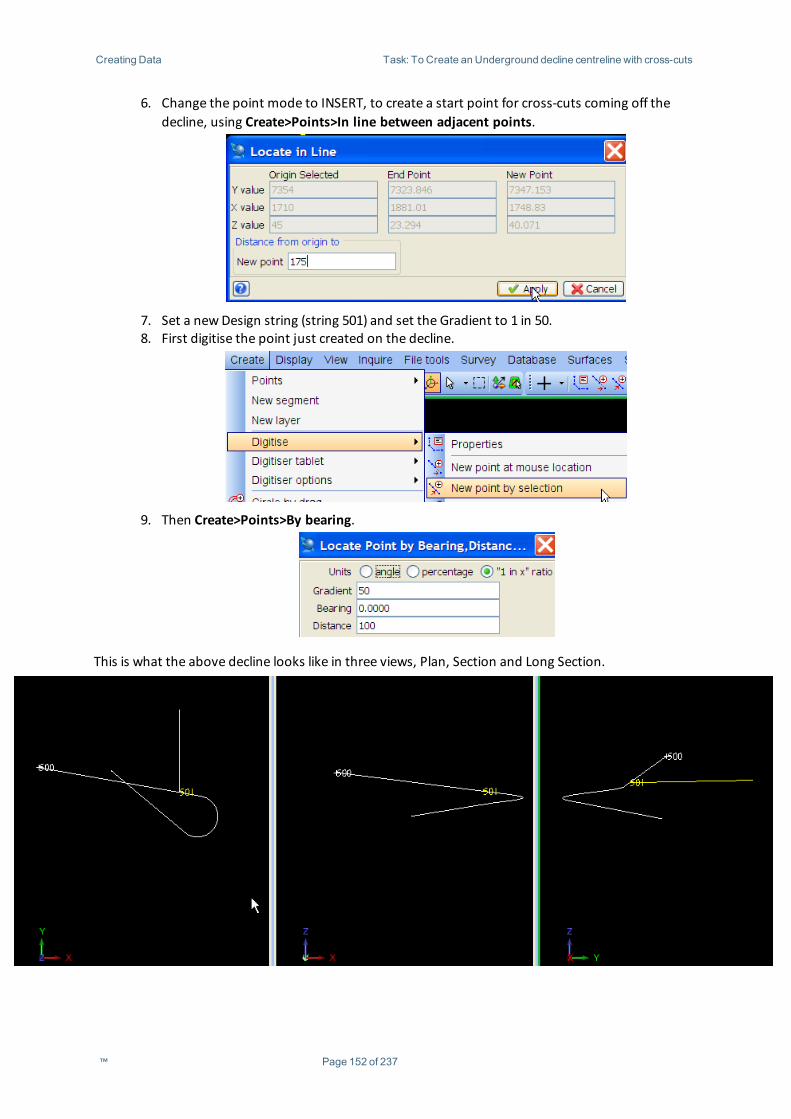
Creating Data Task: To Create an Underground decline centreline with cross-cuts
6. Change the point mode to INSERT, to create a start point for cross-cuts coming off thedecline, using Create>Points>In line between adjacent points.
7. Set a newDesign string (string 501) and set the Gradient to 1 in 50.8. First digitise the point just created on the decline.
9. Then Create>Points>By bearing.
This is what the above decline looks like in three views, Plan, Section and Long Section.
™ Page 152 of 237
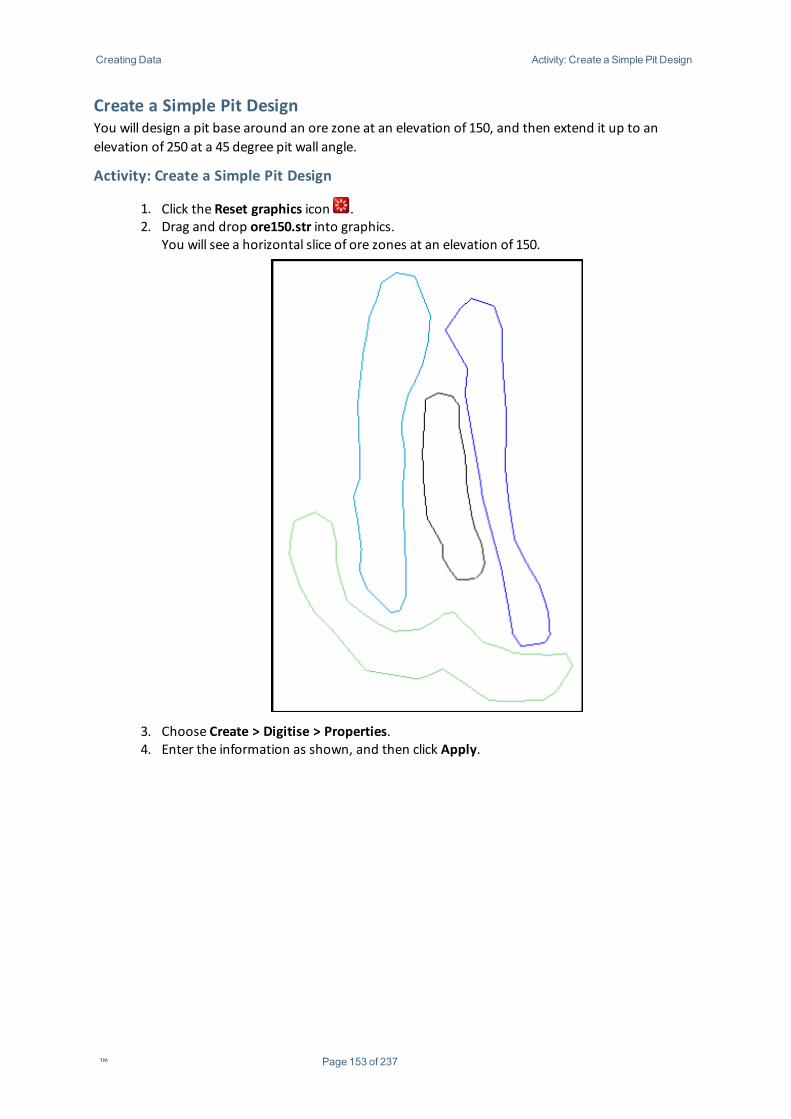
Creating Data Activity: Create a Simple Pit Design
Create a Simple Pit DesignYou will design a pit base around an ore zone at an elevation of 150, and then extend it up to anelevation of 250 at a 45 degree pit wall angle.
Activity: Create a Simple Pit Design
1. Click the Reset graphics icon .2. Drag and drop ore150.str into graphics.
You will see a horizontal slice of ore zones at an elevation of 150.
3. Choose Create > Digitise > Properties.4. Enter the information as shown, and then click Apply.
™ Page 153 of 237
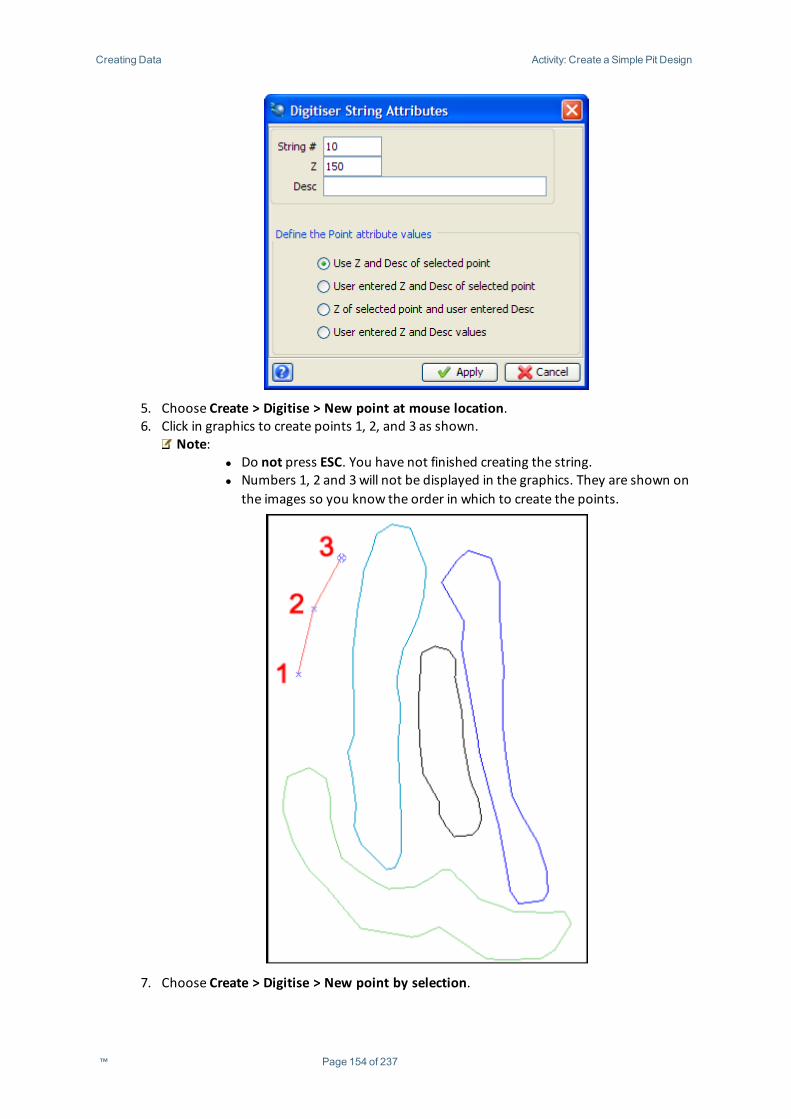
Creating Data Activity: Create a Simple Pit Design
5. Choose Create > Digitise > New point at mouse location.6. Click in graphics to create points 1, 2, and 3 as shown.
Note:l Do not press ESC. You have not finished creating the string.l Numbers 1, 2 and 3will not be displayed in the graphics. They are shown on
the images so you know the order in which to create the points.
7. Choose Create > Digitise > New point by selection.
™ Page 154 of 237
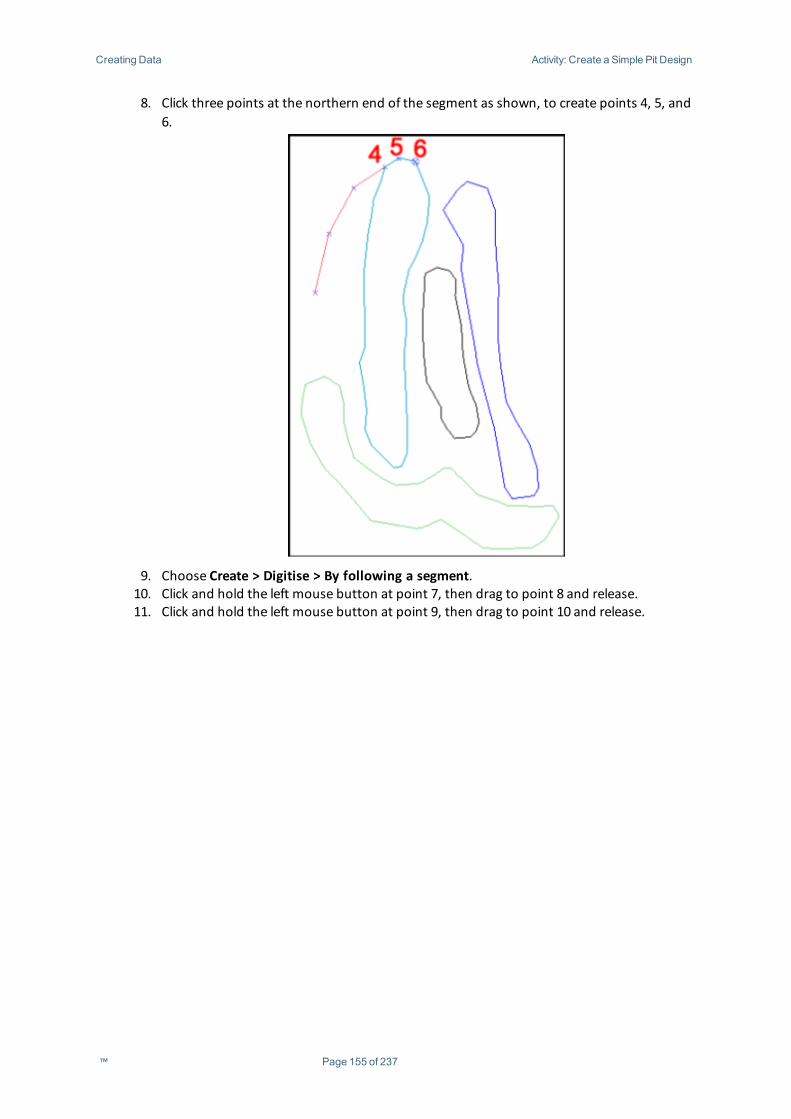
Creating Data Activity: Create a Simple Pit Design
8. Click three points at the northern end of the segment as shown, to create points 4, 5, and6.
9. Choose Create > Digitise > By following a segment.10. Click and hold the left mouse button at point 7, then drag to point 8 and release.11. Click and hold the left mouse button at point 9, then drag to point 10 and release.
™ Page 155 of 237
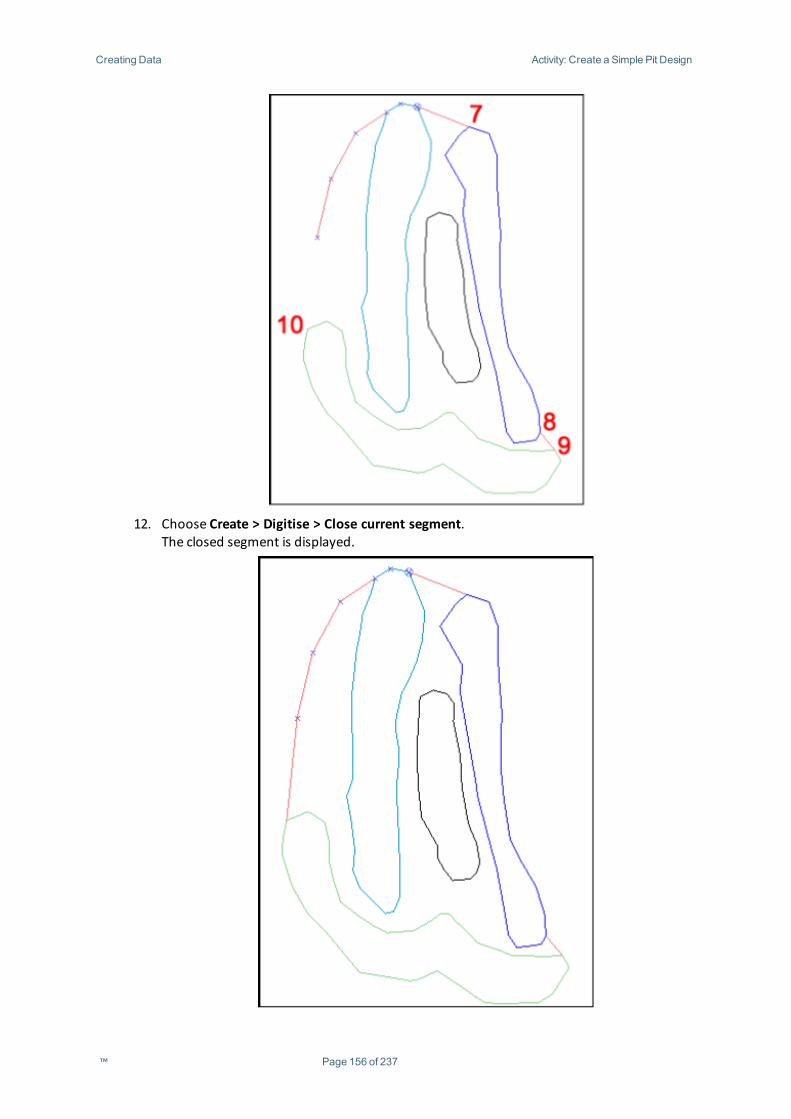
Creating Data Activity: Create a Simple Pit Design
12. Choose Create > Digitise > Close current segment.The closed segment is displayed.
™ Page 156 of 237
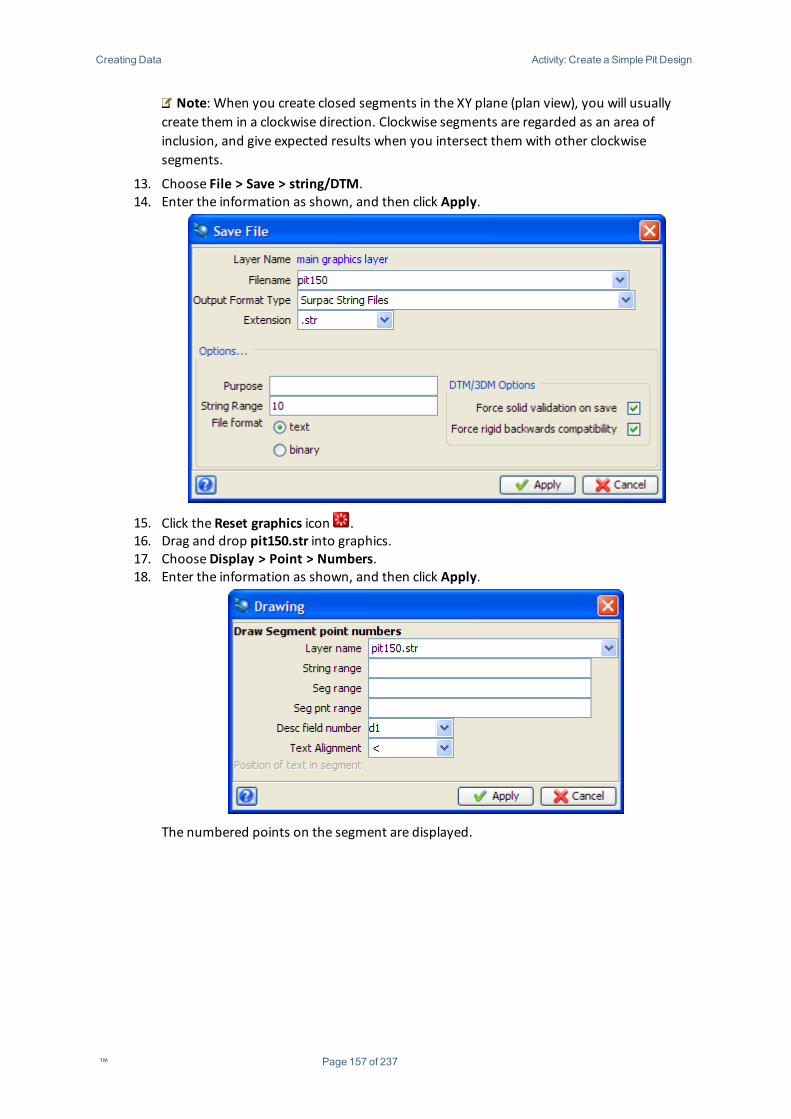
Creating Data Activity: Create a Simple Pit Design
Note: When you create closed segments in the XY plane (plan view), you will usuallycreate them in a clockwise direction. Clockwise segments are regarded as an area ofinclusion, and give expected results when you intersect them with other clockwisesegments.
13. Choose File > Save > string/DTM.14. Enter the information as shown, and then click Apply.
15. Click the Reset graphics icon .16. Drag and drop pit150.str into graphics.17. ChooseDisplay > Point > Numbers.18. Enter the information as shown, and then click Apply.
The numbered points on the segment are displayed.
™ Page 157 of 237
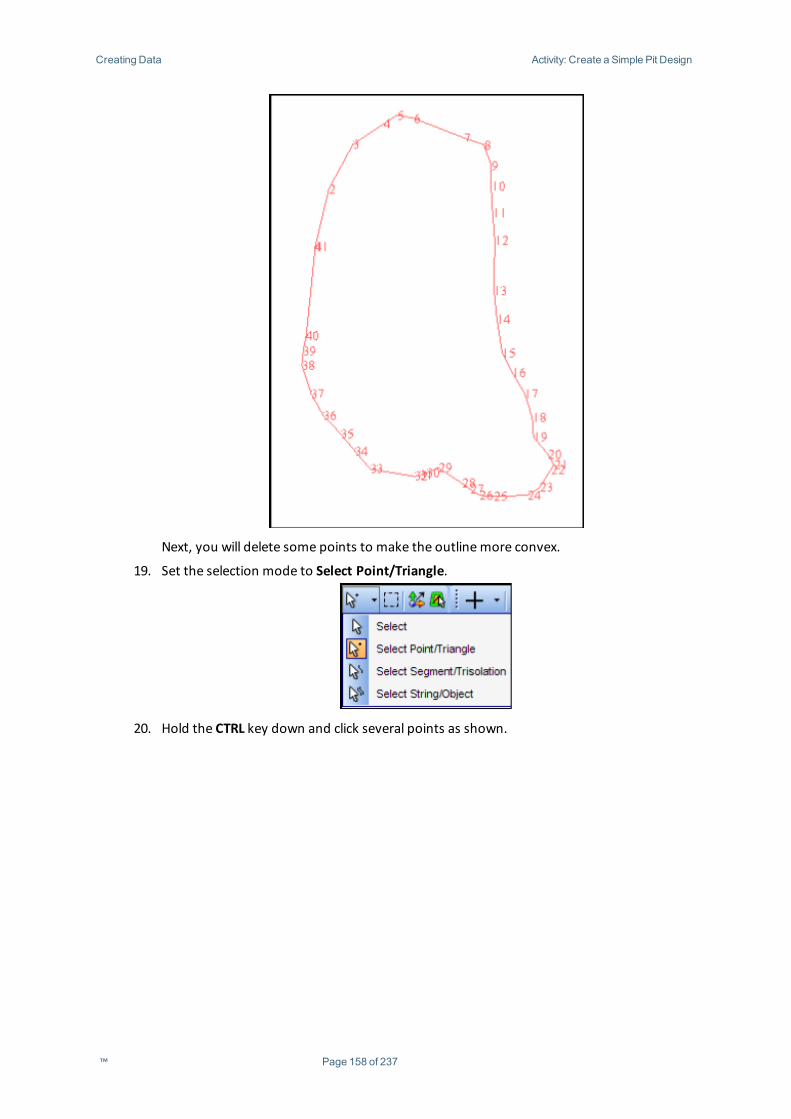
Creating Data Activity: Create a Simple Pit Design
Next, you will delete some points to make the outlinemore convex.
19. Set the selection mode to Select Point/Triangle.
20. Hold the CTRL key down and click several points as shown.
™ Page 158 of 237
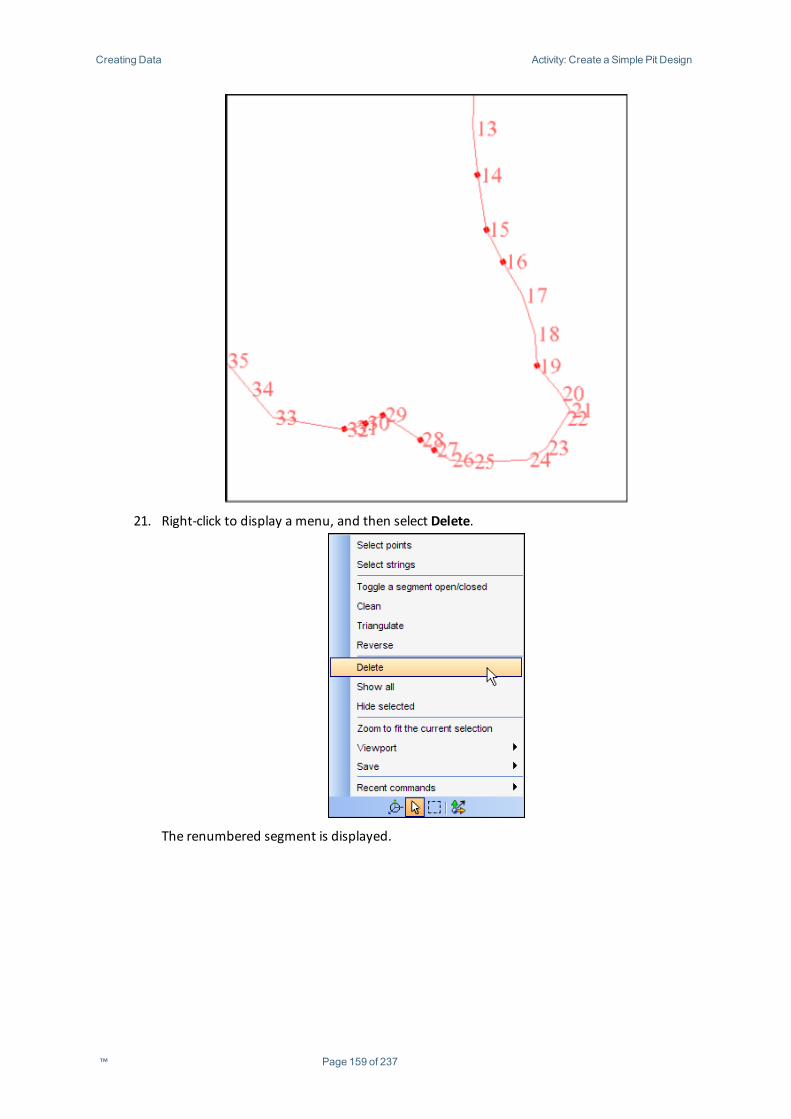
Creating Data Activity: Create a Simple Pit Design
21. Right-click to display a menu, and then select Delete.
The renumbered segment is displayed.
™ Page 159 of 237
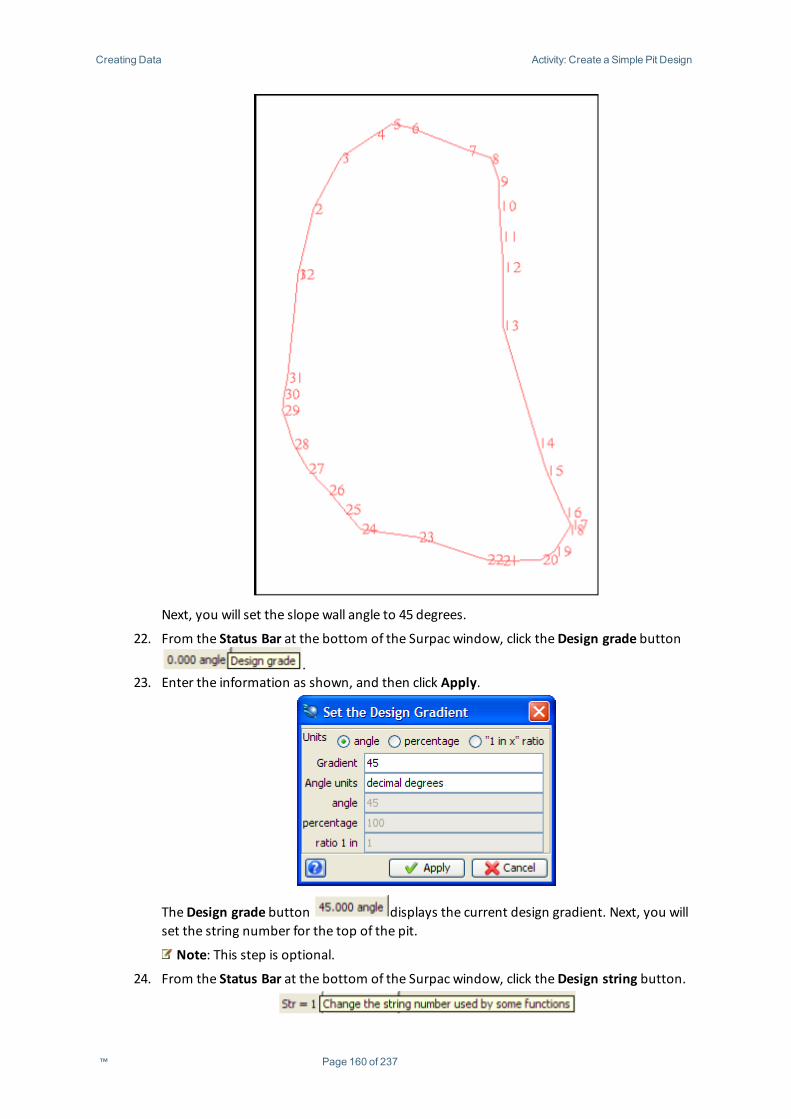
Creating Data Activity: Create a Simple Pit Design
Next, you will set the slope wall angle to 45 degrees.
22. From the Status Bar at the bottom of the Surpac window, click theDesign grade button
.23. Enter the information as shown, and then click Apply.
TheDesign grade button displays the current design gradient. Next, you willset the string number for the top of the pit.
Note: This step is optional.
24. From the Status Bar at the bottom of the Surpac window, click theDesign string button.
™ Page 160 of 237
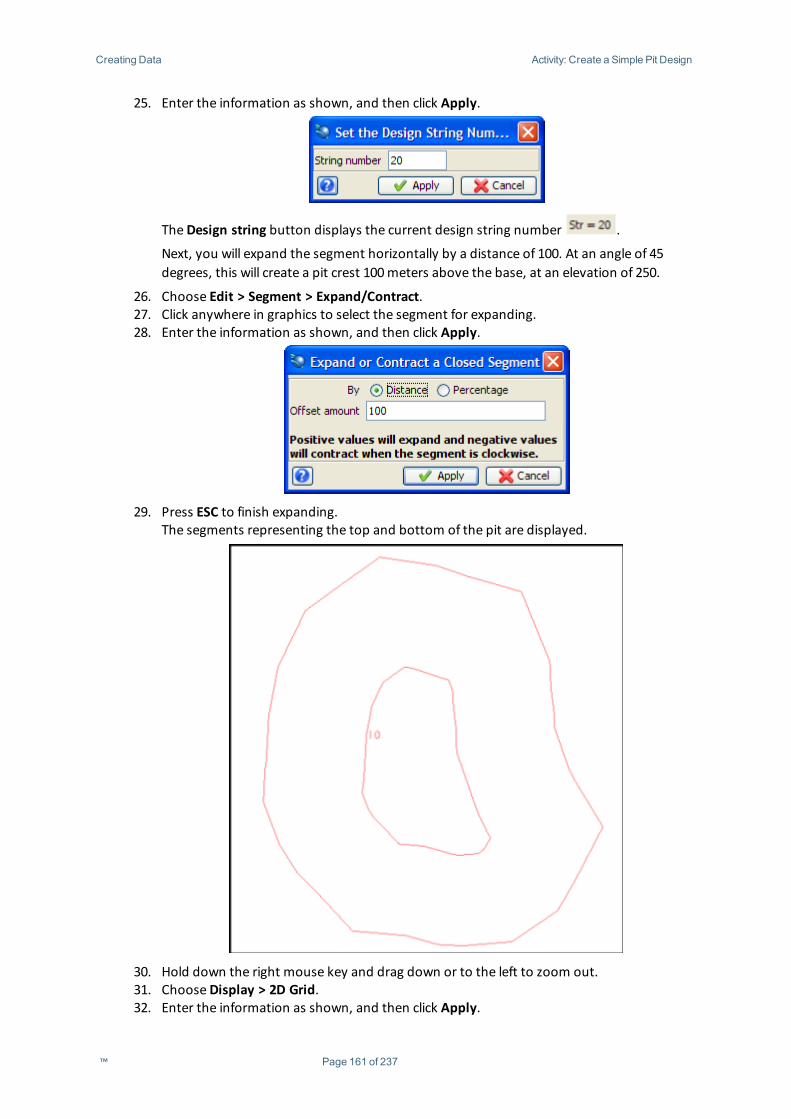
Creating Data Activity: Create a Simple Pit Design
25. Enter the information as shown, and then click Apply.
TheDesign string button displays the current design string number .
Next, you will expand the segment horizontally by a distance of 100. At an angle of 45degrees, this will create a pit crest 100meters above the base, at an elevation of 250.
26. Choose Edit > Segment > Expand/Contract.27. Click anywhere in graphics to select the segment for expanding.28. Enter the information as shown, and then click Apply.
29. Press ESC to finish expanding.The segments representing the top and bottom of the pit are displayed.
30. Hold down the right mouse key and drag down or to the left to zoom out.31. ChooseDisplay > 2D Grid.32. Enter the information as shown, and then click Apply.
™ Page 161 of 237
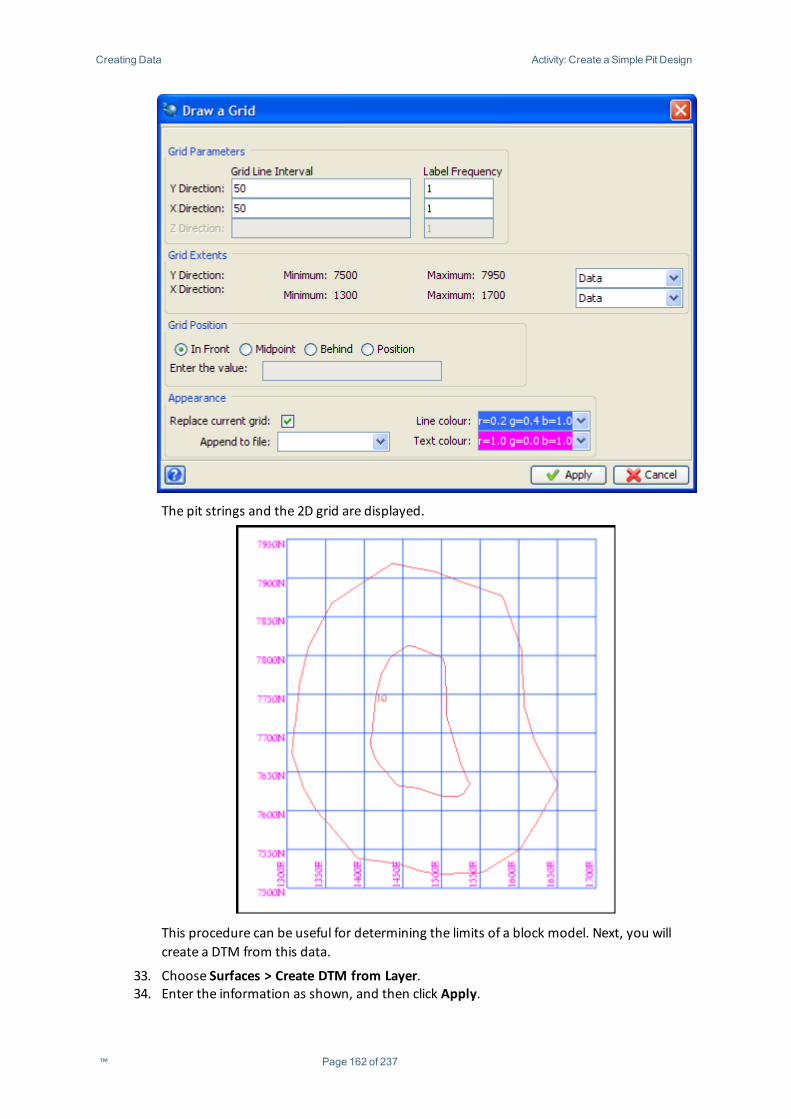
Creating Data Activity: Create a Simple Pit Design
The pit strings and the 2D grid are displayed.
This procedure can be useful for determining the limits of a block model. Next, you willcreate a DTM from this data.
33. Choose Surfaces > Create DTM from Layer.34. Enter the information as shown, and then click Apply.
™ Page 162 of 237
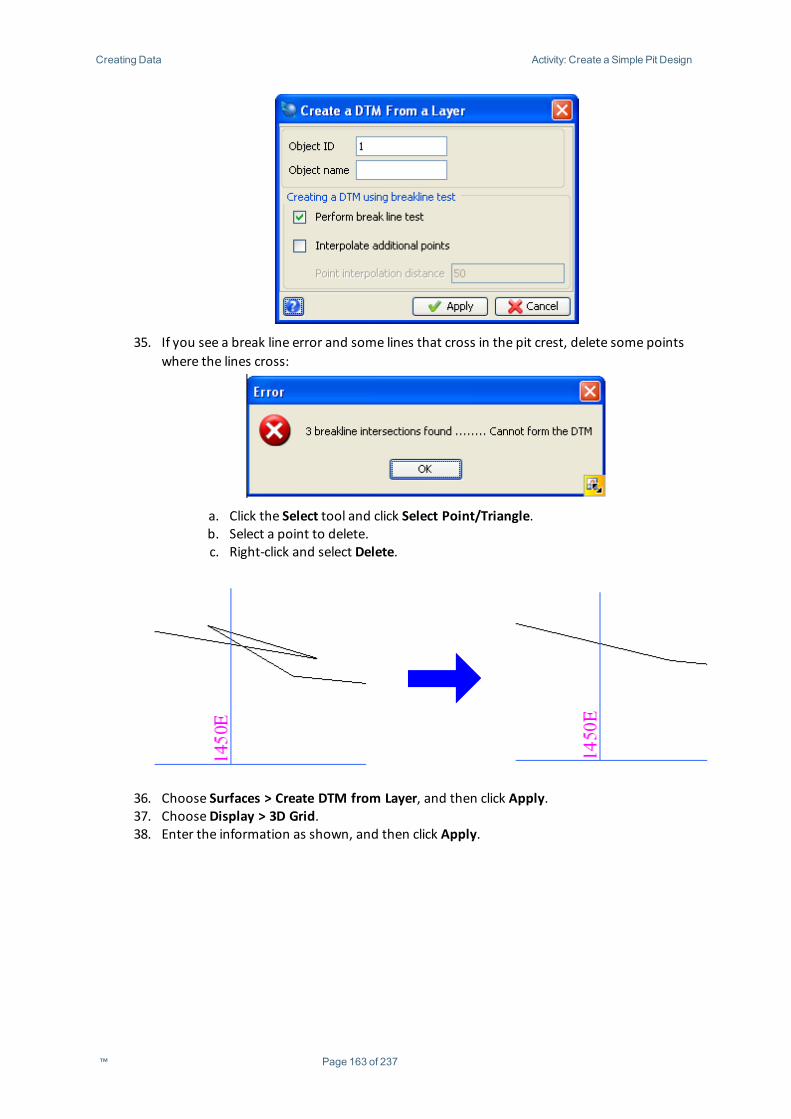
Creating Data Activity: Create a Simple Pit Design
35. If you see a break line error and some lines that cross in the pit crest, delete some pointswhere the lines cross:
a. Click the Select tool and click Select Point/Triangle.b. Select a point to delete.c. Right-click and select Delete.
36. Choose Surfaces > Create DTM from Layer, and then click Apply.37. ChooseDisplay > 3D Grid.38. Enter the information as shown, and then click Apply.
™ Page 163 of 237
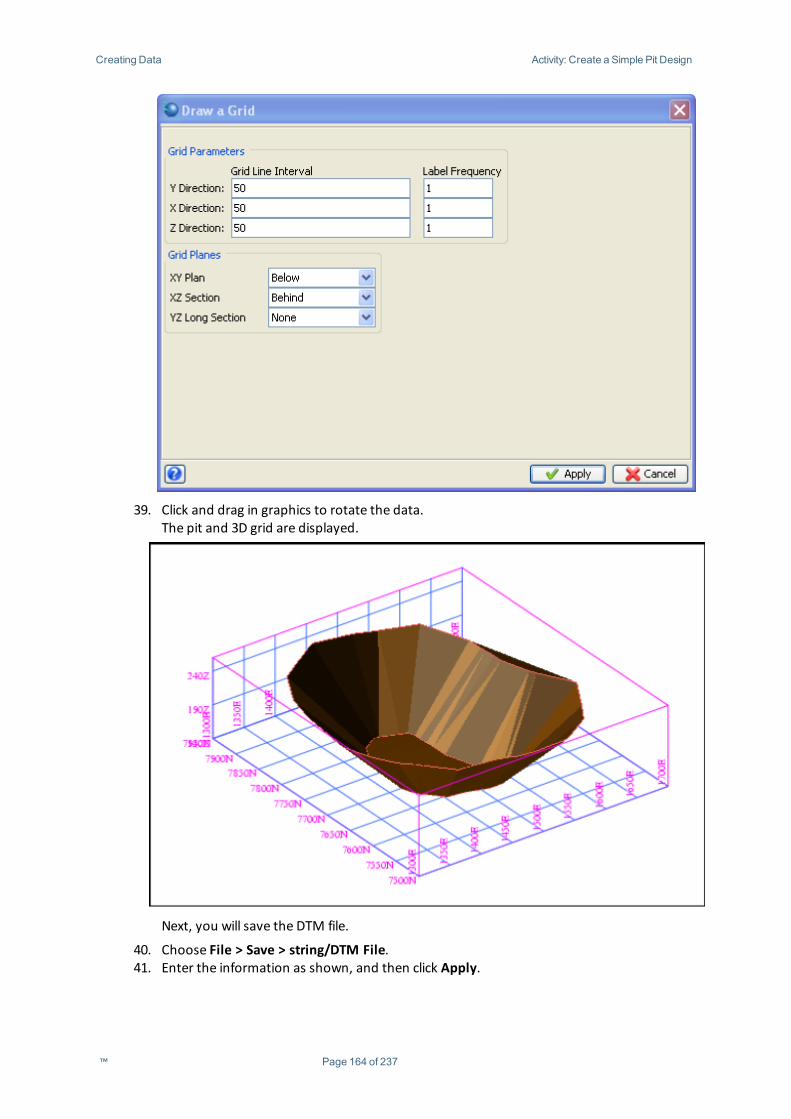
Creating Data Activity: Create a Simple Pit Design
39. Click and drag in graphics to rotate the data.The pit and 3D grid are displayed.
Next, you will save the DTM file.
40. Choose File > Save > string/DTM File.41. Enter the information as shown, and then click Apply.
™ Page 164 of 237
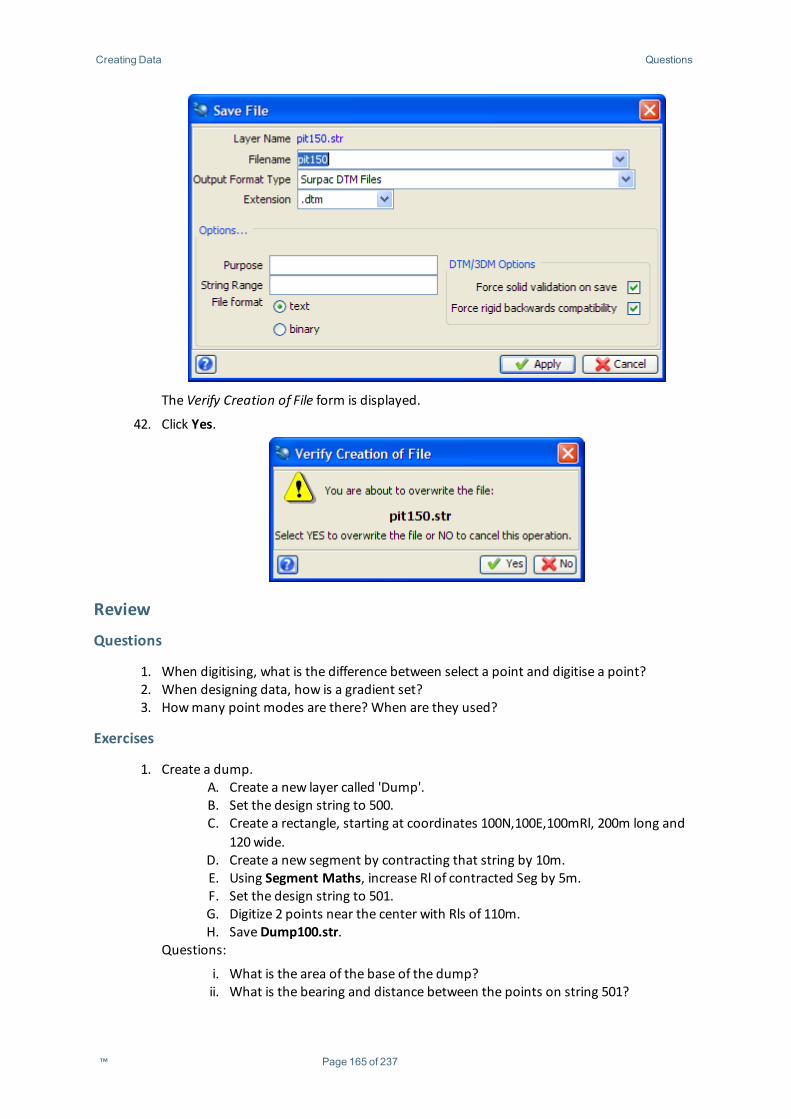
Creating Data Questions
The Verify Creation of File form is displayed.
42. Click Yes.
Review
Questions
1. When digitising, what is the difference between select a point and digitise a point?2. When designing data, how is a gradient set?3. Howmany point modes are there? When are they used?
Exercises
1. Create a dump.A. Create a new layer called 'Dump'.B. Set the design string to 500.C. Create a rectangle, starting at coordinates 100N,100E,100mRl, 200m long and
120wide.D. Create a new segment by contracting that string by 10m.E. Using Segment Maths, increase Rl of contracted Seg by 5m.F. Set the design string to 501.G. Digitize 2 points near the center with Rls of 110m.H. SaveDump100.str.
Questions:
i. What is the area of the base of the dump?ii. What is the bearing and distance between the points on string 501?
™ Page 165 of 237

Creating Data Exercises
2. Underground Design using Create Tools.A. Create a new layer called 'UG Design'.B. Set the design string to 500.C. Set the design gradient to 1 in -8.D. Create a point at coordinates 100N,100E,100mRl.E. Create Point by bearing 100o at 200m.F. Create Curve at Segment end with Radius 25m, Angle 230o and Arc 3m.G. Create Point by Bearing 330 degrees at 100m.
Now you have created the decline, check it in section view to see that the gradient hasbeen set properly.
The Edit>Segment>Change gradient function can be used to fix it if necessary. Now createstockpiles coming off the decline.
A. Changemode to INSERT.B. Insert a point every 40m down the decline.C. Set Design string to 501, and Gradient to 1 in 50.D. Digitise a point on theDecline by Selection.E. Create a point by bearing 20o at 20m.F. Start new segment.G. Repeat the last 3 steps (D-E-F) until all the stockpiles have been created.H. Save the file as UG_Design.str.
™ Page 166 of 237
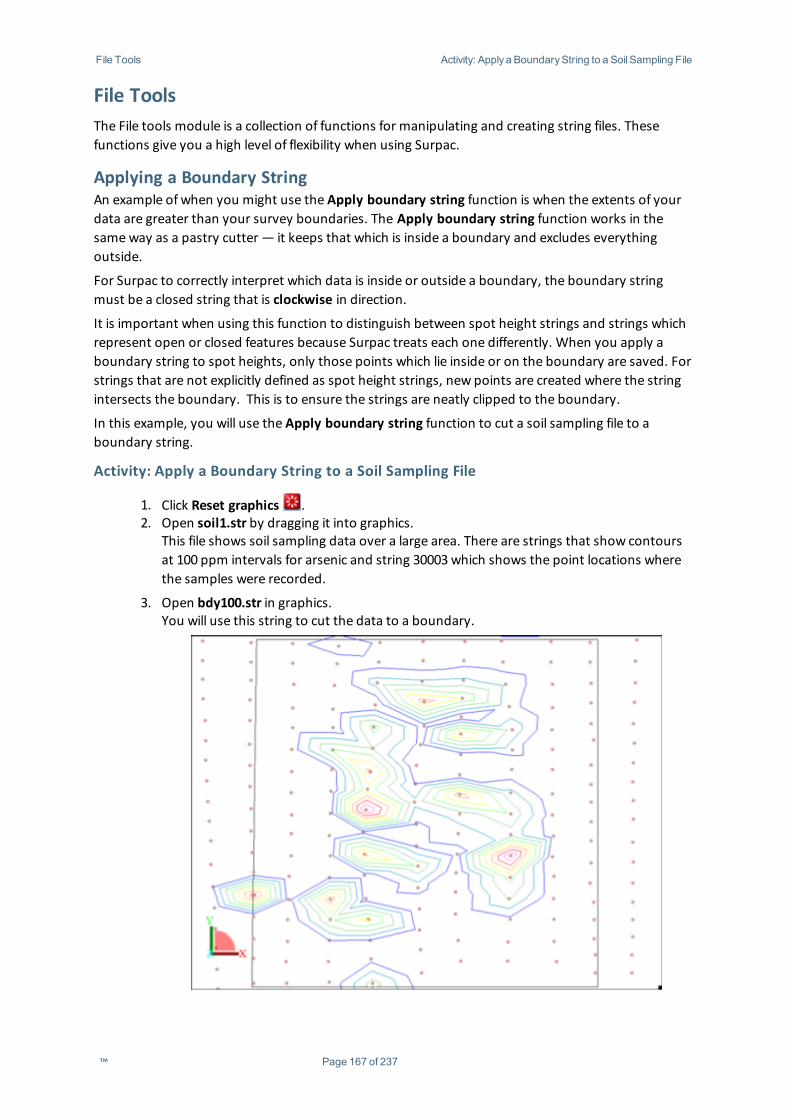
File Tools Activity: Apply a BoundaryString to a Soil Sampling File
File ToolsThe File tools module is a collection of functions for manipulating and creating string files. Thesefunctions give you a high level of flexibility when using Surpac.
Applying a Boundary StringAn example of when you might use the Apply boundary string function is when the extents of yourdata are greater than your survey boundaries. The Apply boundary string function works in thesameway as a pastry cutter — it keeps that which is inside a boundary and excludes everythingoutside.
For Surpac to correctly interpret which data is inside or outside a boundary, the boundary stringmust be a closed string that is clockwise in direction.
It is important when using this function to distinguish between spot height strings and strings whichrepresent open or closed features because Surpac treats each one differently. When you apply aboundary string to spot heights, only those points which lie inside or on the boundary are saved. Forstrings that are not explicitly defined as spot height strings, new points are created where the stringintersects the boundary. This is to ensure the strings are neatly clipped to the boundary.
In this example, you will use the Apply boundary string function to cut a soil sampling file to aboundary string.
Activity: Apply a Boundary String to a Soil Sampling File
1. Click Reset graphics .2. Open soil1.str by dragging it into graphics.
This file shows soil sampling data over a large area. There are strings that show contoursat 100 ppm intervals for arsenic and string 30003which shows the point locations wherethe samples were recorded.
3. Open bdy100.str in graphics.You will use this string to cut the data to a boundary.
™ Page 167 of 237
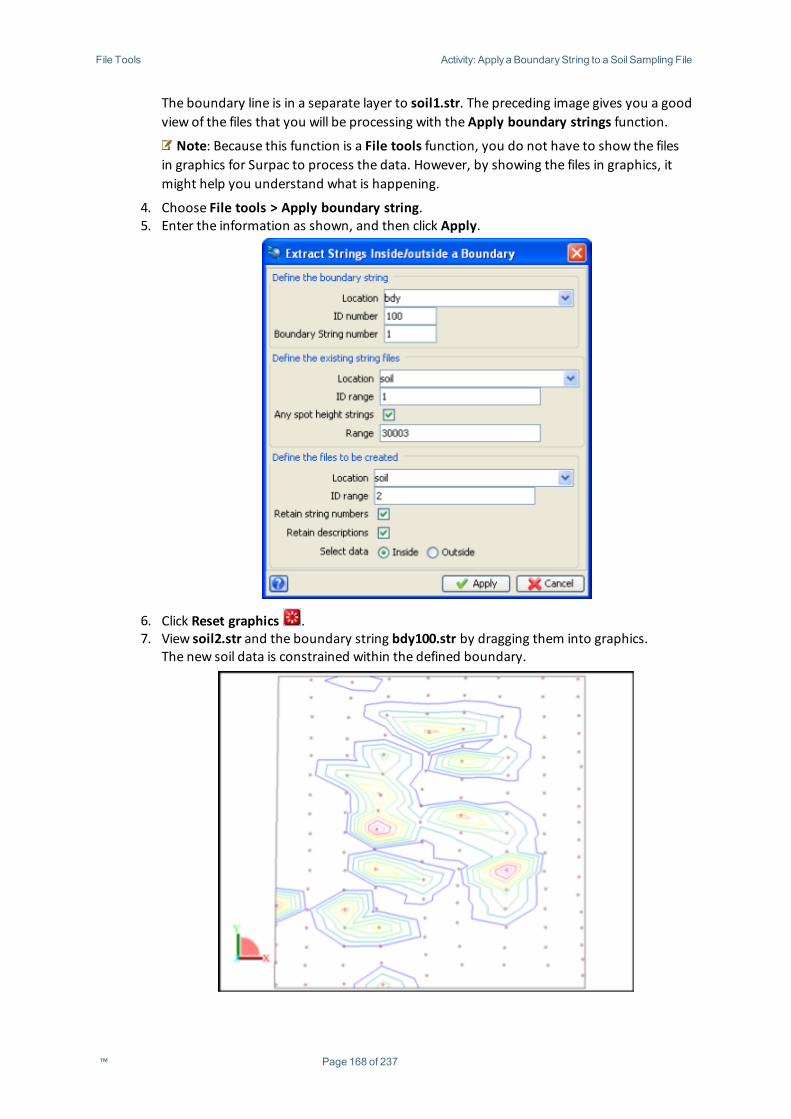
File Tools Activity: Apply a BoundaryString to a Soil Sampling File
The boundary line is in a separate layer to soil1.str. The preceding image gives you a goodview of the files that you will be processing with the Apply boundary strings function.
Note: Because this function is a File tools function, you do not have to show the filesin graphics for Surpac to process the data. However, by showing the files in graphics, itmight help you understand what is happening.
4. Choose File tools > Apply boundary string.5. Enter the information as shown, and then click Apply.
6. Click Reset graphics .7. View soil2.str and the boundary string bdy100.str by dragging them into graphics.
The new soil data is constrained within the defined boundary.
™ Page 168 of 237
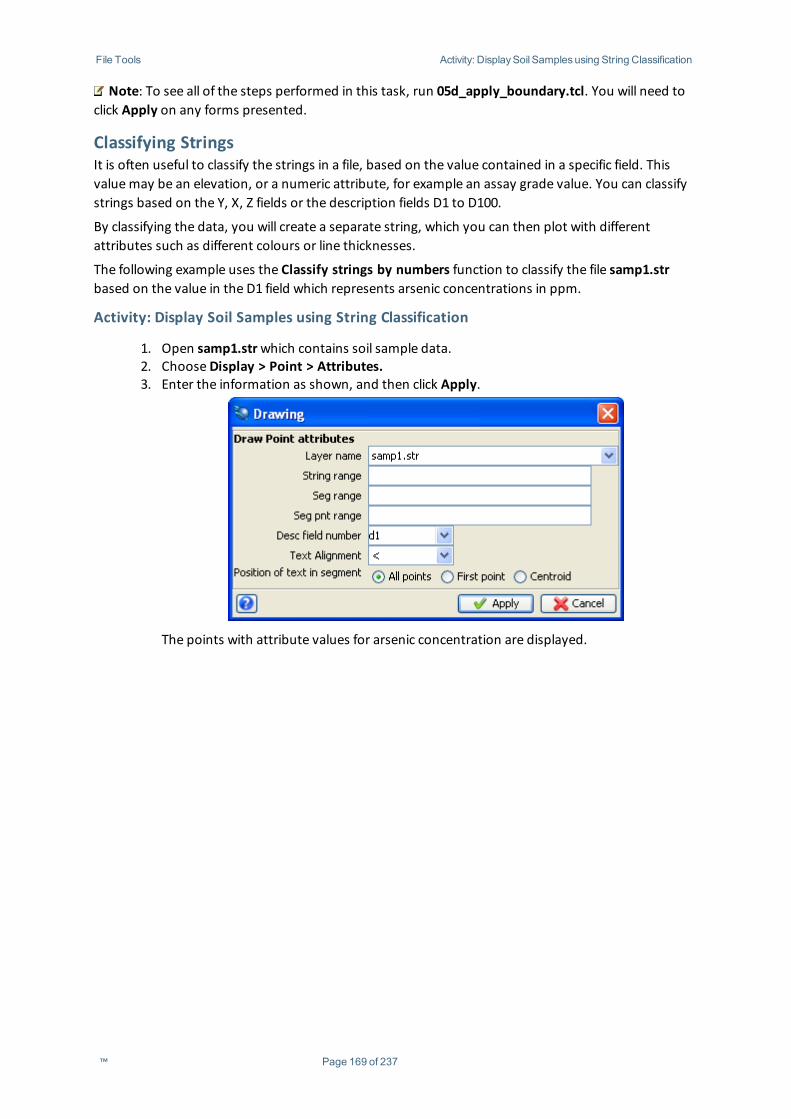
File Tools Activity: DisplaySoil Samplesusing String Classification
Note: To see all of the steps performed in this task, run 05d_apply_boundary.tcl. You will need toclick Apply on any forms presented.
Classifying StringsIt is often useful to classify the strings in a file, based on the value contained in a specific field. Thisvaluemay be an elevation, or a numeric attribute, for example an assay grade value. You can classifystrings based on the Y, X, Z fields or the description fields D1 to D100.
By classifying the data, you will create a separate string, which you can then plot with differentattributes such as different colours or line thicknesses.
The following example uses the Classify strings by numbers function to classify the file samp1.strbased on the value in the D1 field which represents arsenic concentrations in ppm.
Activity: Display Soil Samples using String Classification
1. Open samp1.strwhich contains soil sample data.2. ChooseDisplay > Point > Attributes.3. Enter the information as shown, and then click Apply.
The points with attribute values for arsenic concentration are displayed.
™ Page 169 of 237
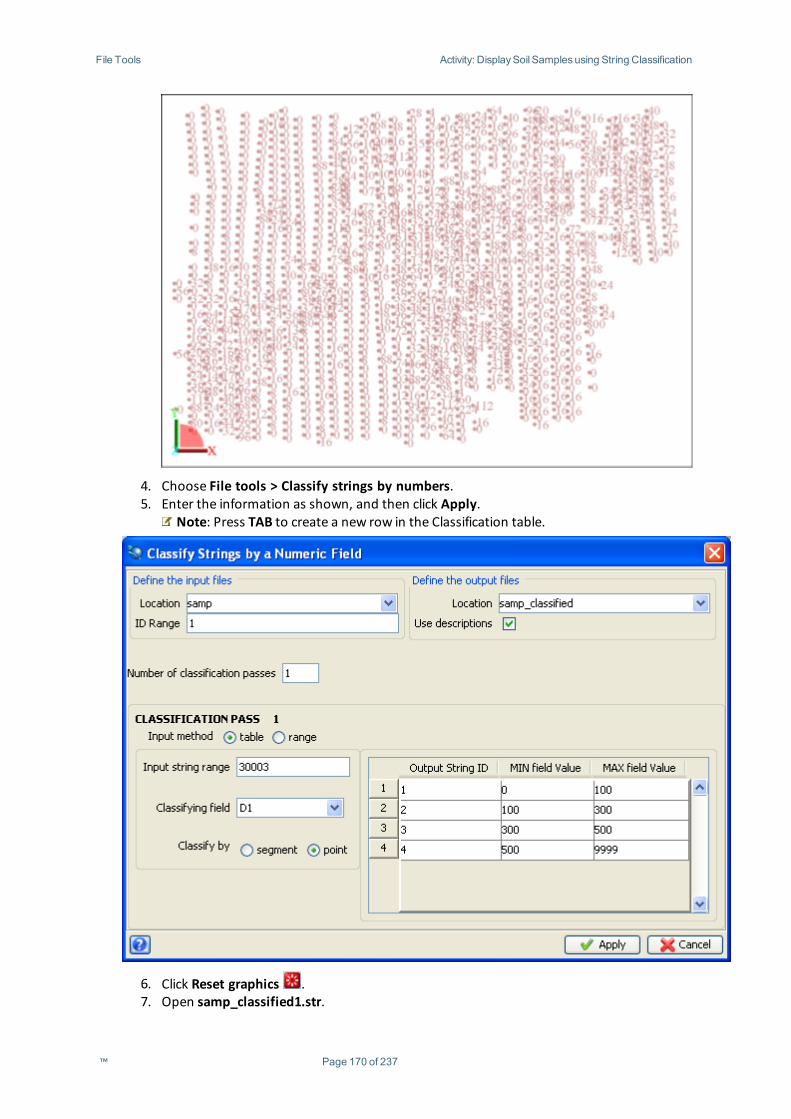
File Tools Activity: DisplaySoil Samplesusing String Classification
4. Choose File tools > Classify strings by numbers.5. Enter the information as shown, and then click Apply.
Note: Press TAB to create a new row in the Classification table.
6. Click Reset graphics .7. Open samp_classified1.str.
™ Page 170 of 237
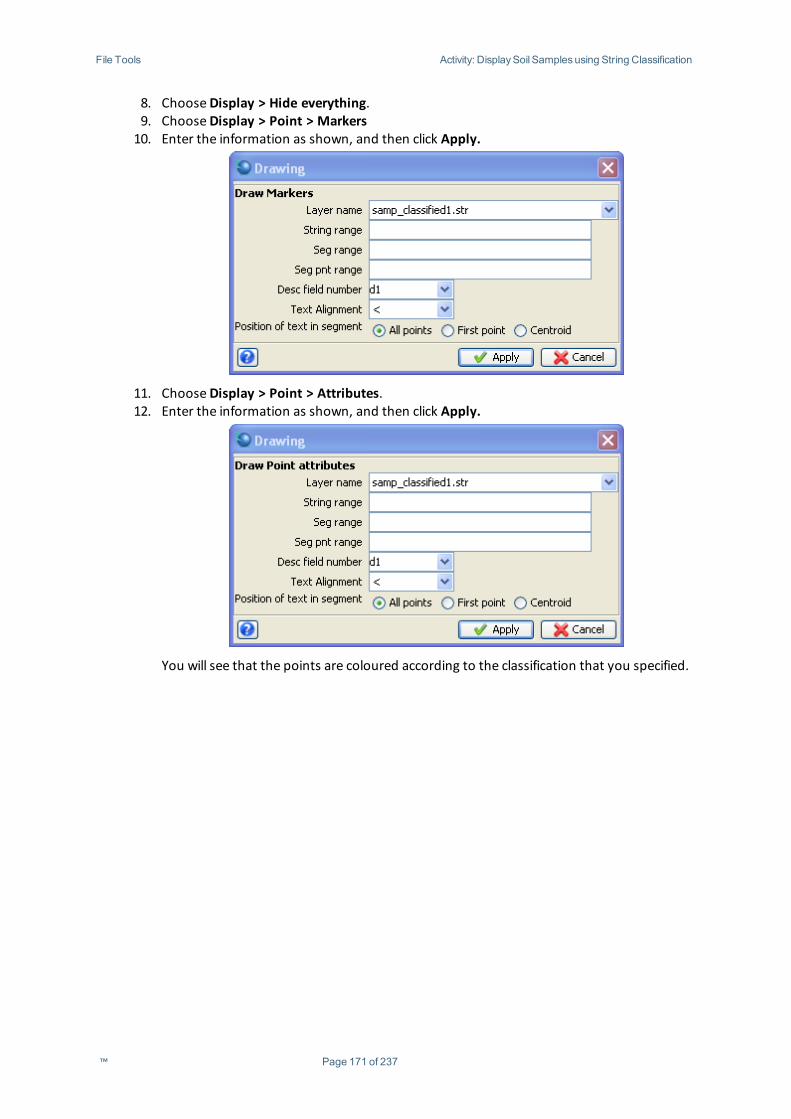
File Tools Activity: DisplaySoil Samplesusing String Classification
8. ChooseDisplay > Hide everything.9. ChooseDisplay > Point > Markers10. Enter the information as shown, and then click Apply.
11. ChooseDisplay > Point > Attributes.12. Enter the information as shown, and then click Apply.
You will see that the points are coloured according to the classification that you specified.
™ Page 171 of 237
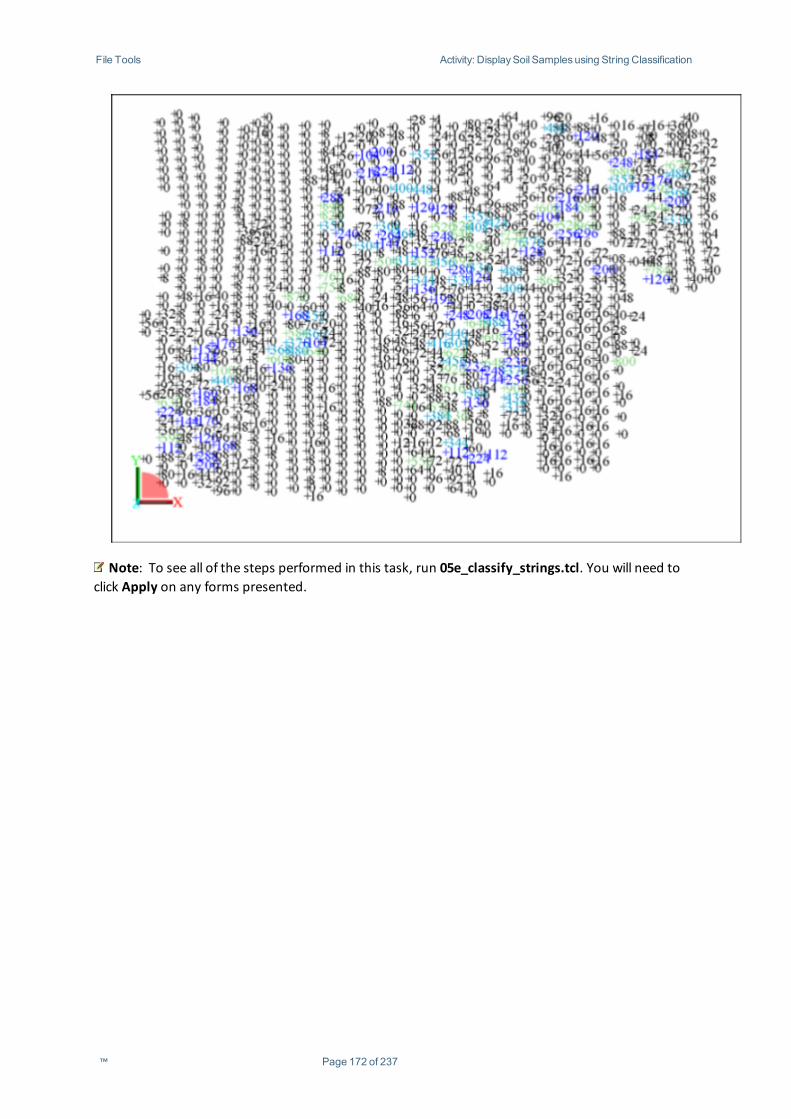
File Tools Activity: DisplaySoil Samplesusing String Classification
Note: To see all of the steps performed in this task, run 05e_classify_strings.tcl. You will need toclick Apply on any forms presented.
™ Page 172 of 237
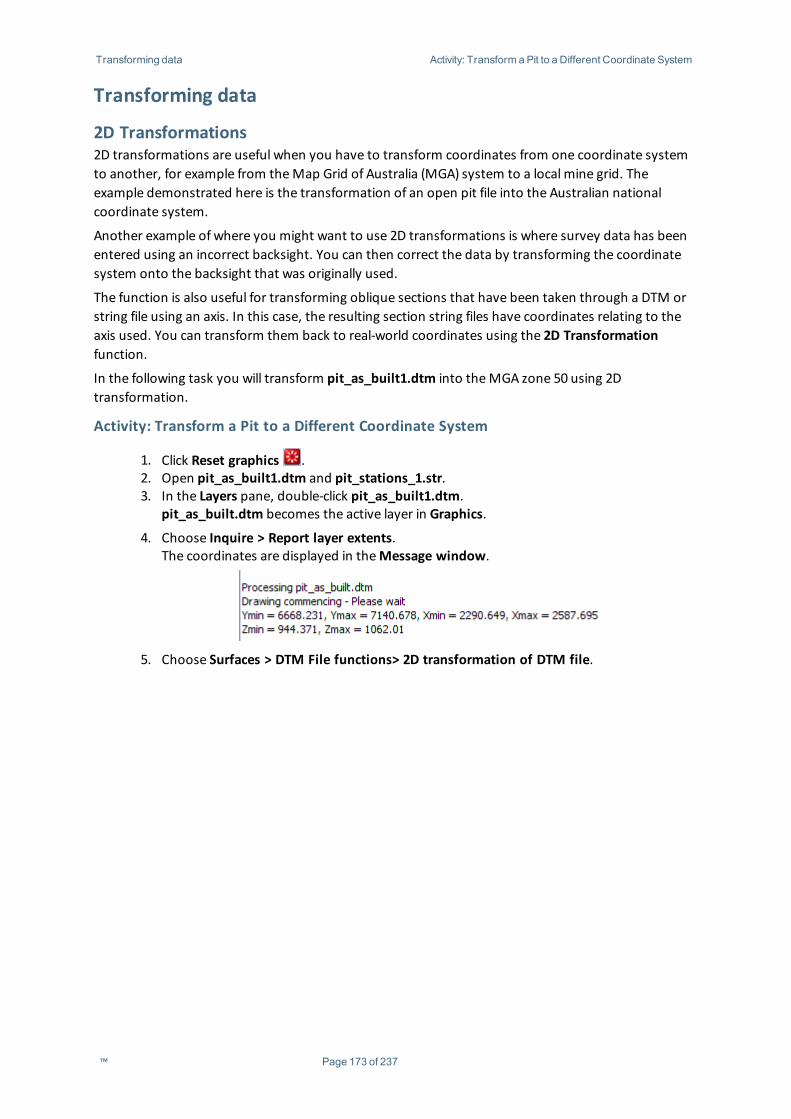
Transforming data Activity: Transform a Pit to a Different Coordinate System
Transforming data
2D Transformations2D transformations are useful when you have to transform coordinates from one coordinate systemto another, for example from theMap Grid of Australia (MGA) system to a local mine grid. Theexample demonstrated here is the transformation of an open pit file into the Australian nationalcoordinate system.
Another example of where you might want to use 2D transformations is where survey data has beenentered using an incorrect backsight. You can then correct the data by transforming the coordinatesystem onto the backsight that was originally used.
The function is also useful for transforming oblique sections that have been taken through a DTM orstring file using an axis. In this case, the resulting section string files have coordinates relating to theaxis used. You can transform them back to real-world coordinates using the 2D Transformationfunction.
In the following task you will transform pit_as_built1.dtm into theMGA zone 50 using 2Dtransformation.
Activity: Transform a Pit to a Different Coordinate System
1. Click Reset graphics .2. Open pit_as_built1.dtm and pit_stations_1.str.3. In the Layers pane, double-click pit_as_built1.dtm.
pit_as_built.dtm becomes the active layer in Graphics.
4. Choose Inquire > Report layer extents.The coordinates are displayed in theMessage window.
5. Choose Surfaces > DTM File functions> 2D transformation of DTM file.
™ Page 173 of 237
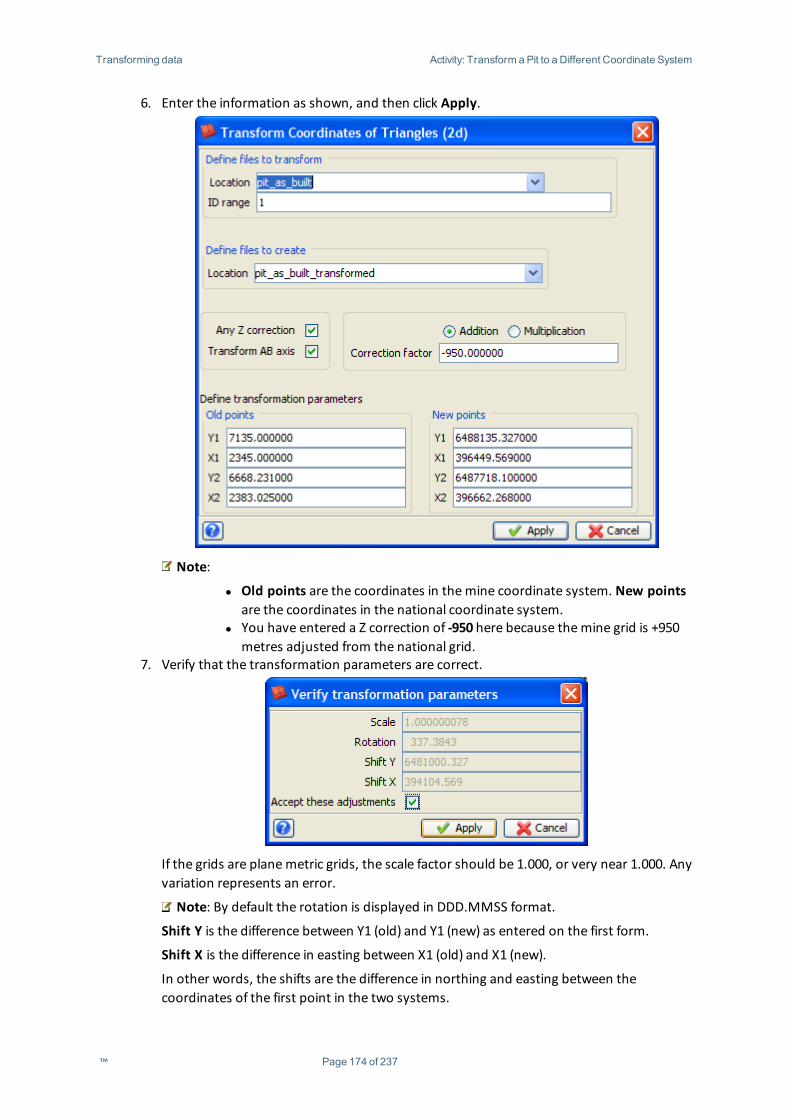
Transforming data Activity: Transform a Pit to a Different Coordinate System
6. Enter the information as shown, and then click Apply.
Note:
l Old points are the coordinates in themine coordinate system. New pointsare the coordinates in the national coordinate system.
l You have entered a Z correction of -950 here because themine grid is +950metres adjusted from the national grid.
7. Verify that the transformation parameters are correct.
If the grids are planemetric grids, the scale factor should be 1.000, or very near 1.000. Anyvariation represents an error.
Note: By default the rotation is displayed in DDD.MMSS format.
Shift Y is the difference between Y1 (old) and Y1 (new) as entered on the first form.
Shift X is the difference in easting between X1 (old) and X1 (new).
In other words, the shifts are the difference in northing and easting between thecoordinates of the first point in the two systems.
™ Page 174 of 237
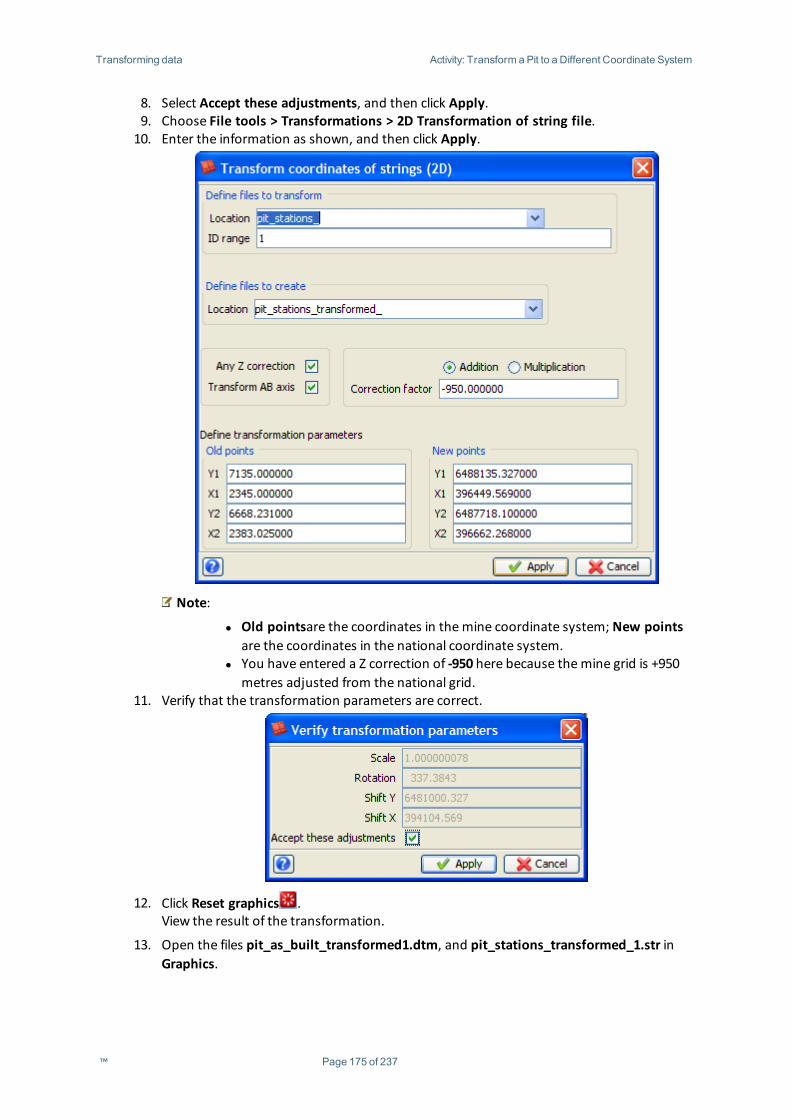
Transforming data Activity: Transform a Pit to a Different Coordinate System
8. Select Accept these adjustments, and then click Apply.9. Choose File tools > Transformations > 2D Transformation of string file.10. Enter the information as shown, and then click Apply.
Note:
l Old pointsare the coordinates in themine coordinate system; New pointsare the coordinates in the national coordinate system.
l You have entered a Z correction of -950 here because themine grid is +950metres adjusted from the national grid.
11. Verify that the transformation parameters are correct.
12. Click Reset graphics .View the result of the transformation.
13. Open the files pit_as_built_transformed1.dtm, and pit_stations_transformed_1.str inGraphics.
™ Page 175 of 237
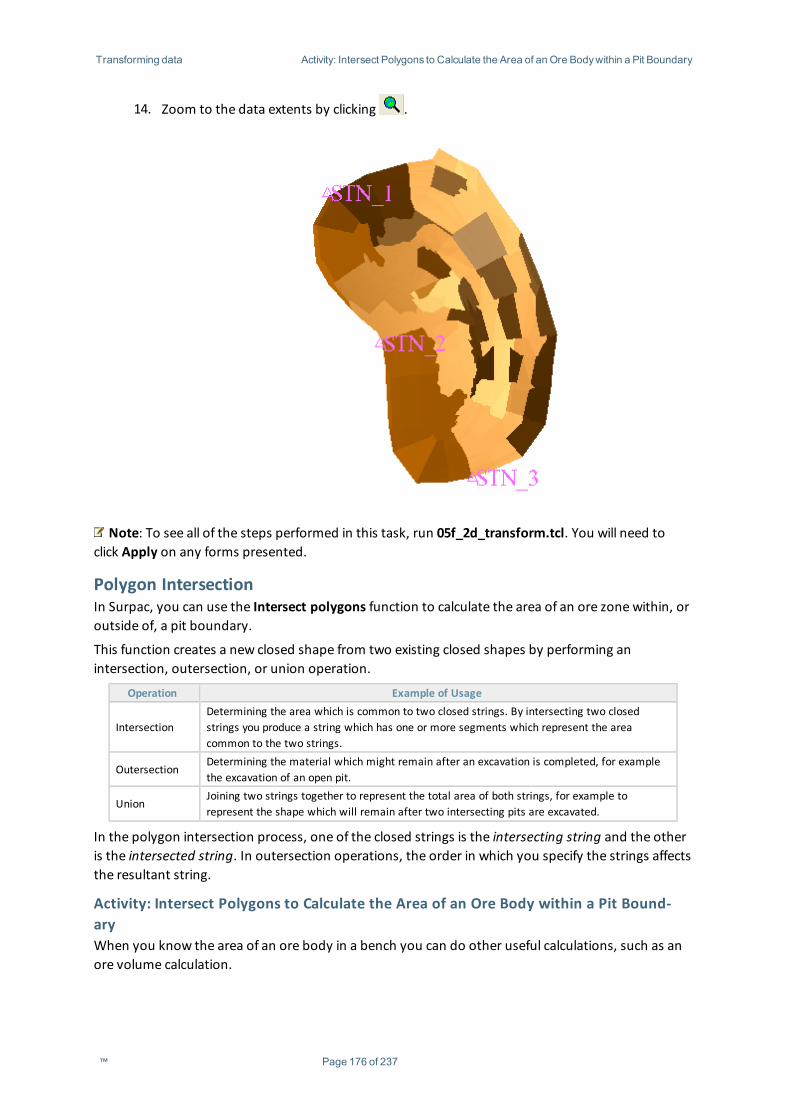
Transforming data Activity: Intersect Polygons to Calculate the Area of anOre Bodywithin a Pit Boundary
14. Zoom to the data extents by clicking .
Note: To see all of the steps performed in this task, run 05f_2d_transform.tcl. You will need toclick Apply on any forms presented.
Polygon IntersectionIn Surpac, you can use the Intersect polygons function to calculate the area of an ore zone within, oroutside of, a pit boundary.
This function creates a new closed shape from two existing closed shapes by performing anintersection, outersection, or union operation.
Operation Example of Usage
IntersectionDetermining the area which is common to two closed strings. By intersecting two closedstrings you produce a string which has one or more segments which represent the areacommon to the two strings.
OutersectionDetermining the material which might remain after an excavation is completed, for examplethe excavation of an open pit.
UnionJoining two strings together to represent the total area of both strings, for example torepresent the shape which will remain after two intersecting pits are excavated.
In the polygon intersection process, one of the closed strings is the intersecting string and the otheris the intersected string. In outersection operations, the order in which you specify the strings affectsthe resultant string.
Activity: Intersect Polygons to Calculate the Area of an Ore Body within a Pit Bound-aryWhen you know the area of an ore body in a bench you can do other useful calculations, such as anore volume calculation.
™ Page 176 of 237
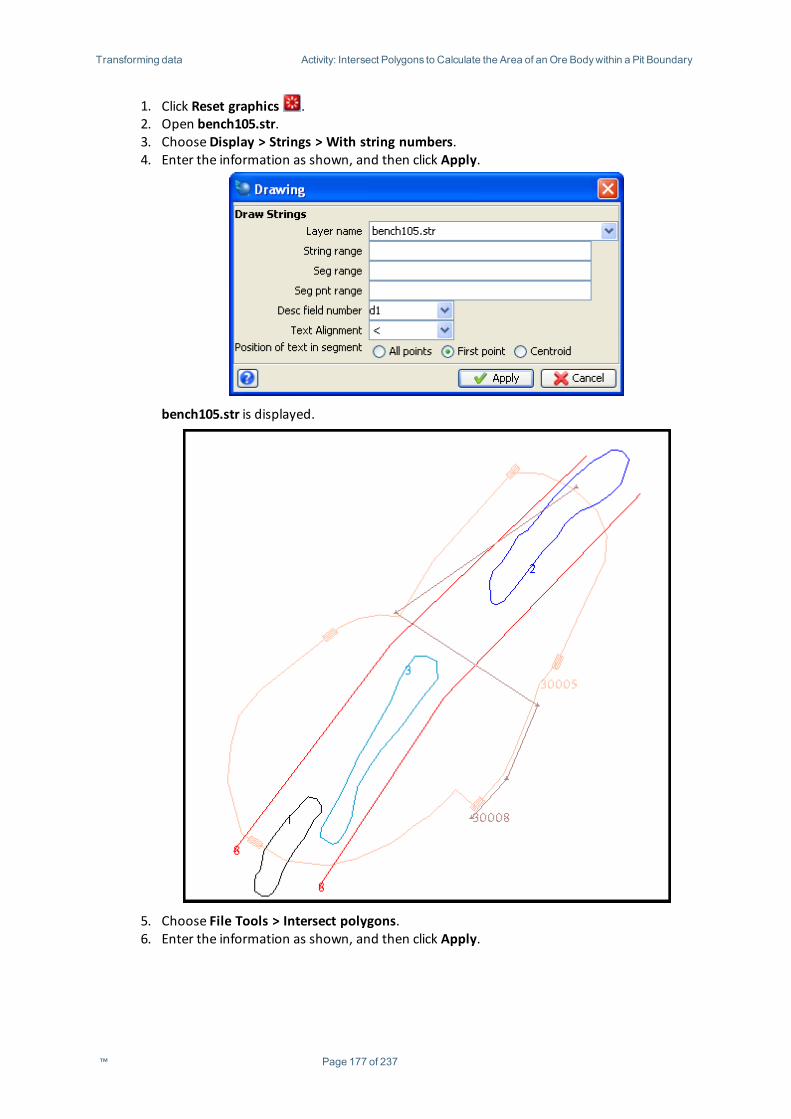
Transforming data Activity: Intersect Polygons to Calculate the Area of anOre Bodywithin a Pit Boundary
1. Click Reset graphics .2. Open bench105.str.3. ChooseDisplay > Strings > With string numbers.4. Enter the information as shown, and then click Apply.
bench105.str is displayed.
5. Choose File Tools > Intersect polygons.6. Enter the information as shown, and then click Apply.
™ Page 177 of 237
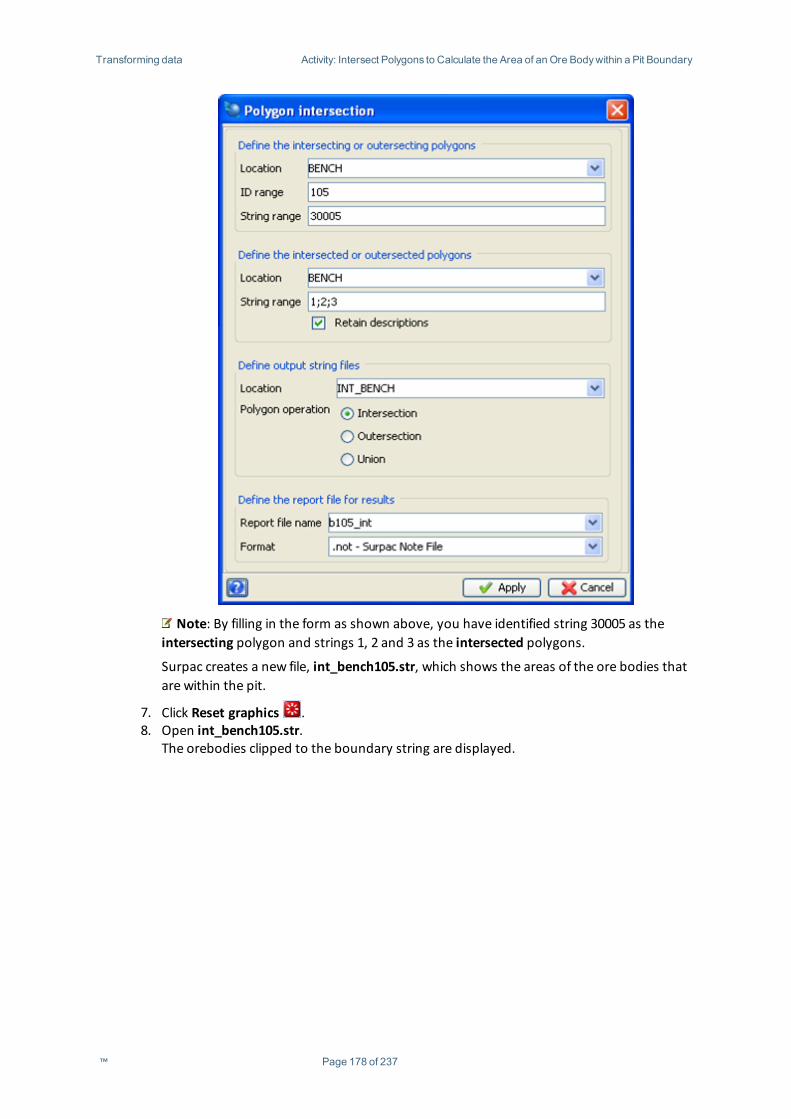
Transforming data Activity: Intersect Polygons to Calculate the Area of anOre Bodywithin a Pit Boundary
Note: By filling in the form as shown above, you have identified string 30005 as theintersecting polygon and strings 1, 2 and 3 as the intersected polygons.
Surpac creates a new file, int_bench105.str, which shows the areas of the ore bodies thatare within the pit.
7. Click Reset graphics .8. Open int_bench105.str.
The orebodies clipped to the boundary string are displayed.
™ Page 178 of 237
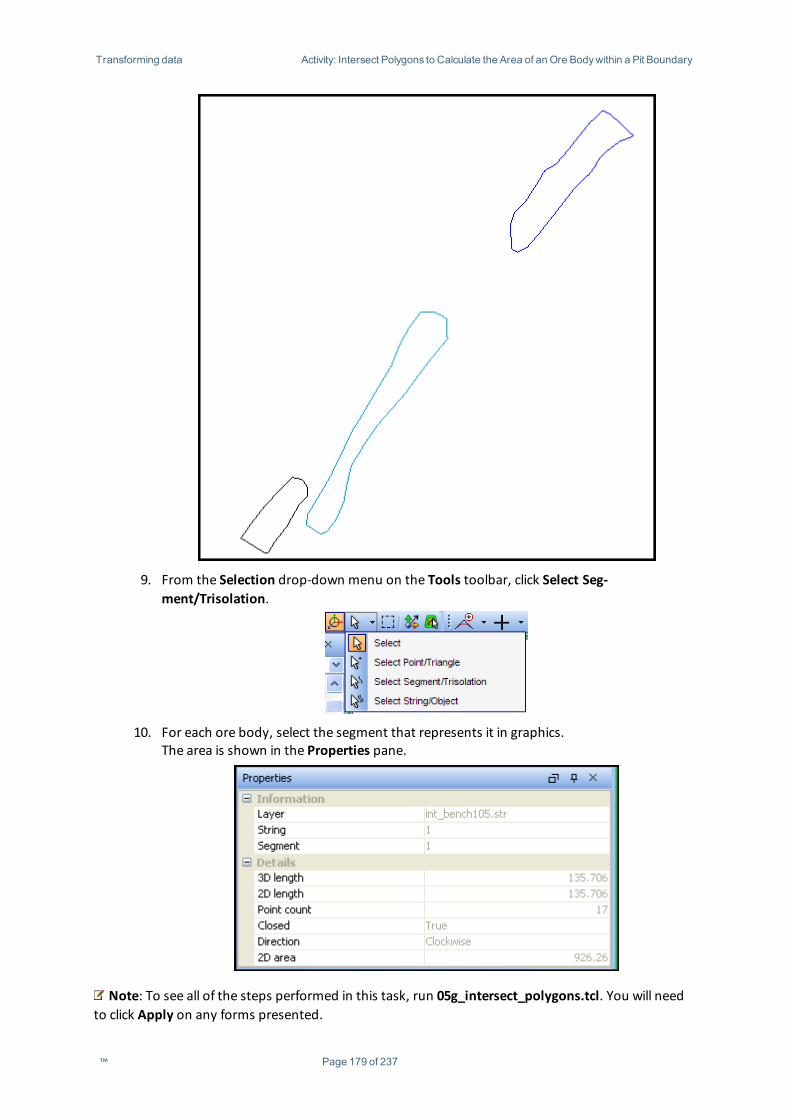
Transforming data Activity: Intersect Polygons to Calculate the Area of anOre Bodywithin a Pit Boundary
9. From the Selection drop-down menu on the Tools toolbar, click Select Seg-ment/Trisolation.
10. For each ore body, select the segment that represents it in graphics.The area is shown in the Properties pane.
Note: To see all of the steps performed in this task, run 05g_intersect_polygons.tcl. You will needto click Apply on any forms presented.
™ Page 179 of 237
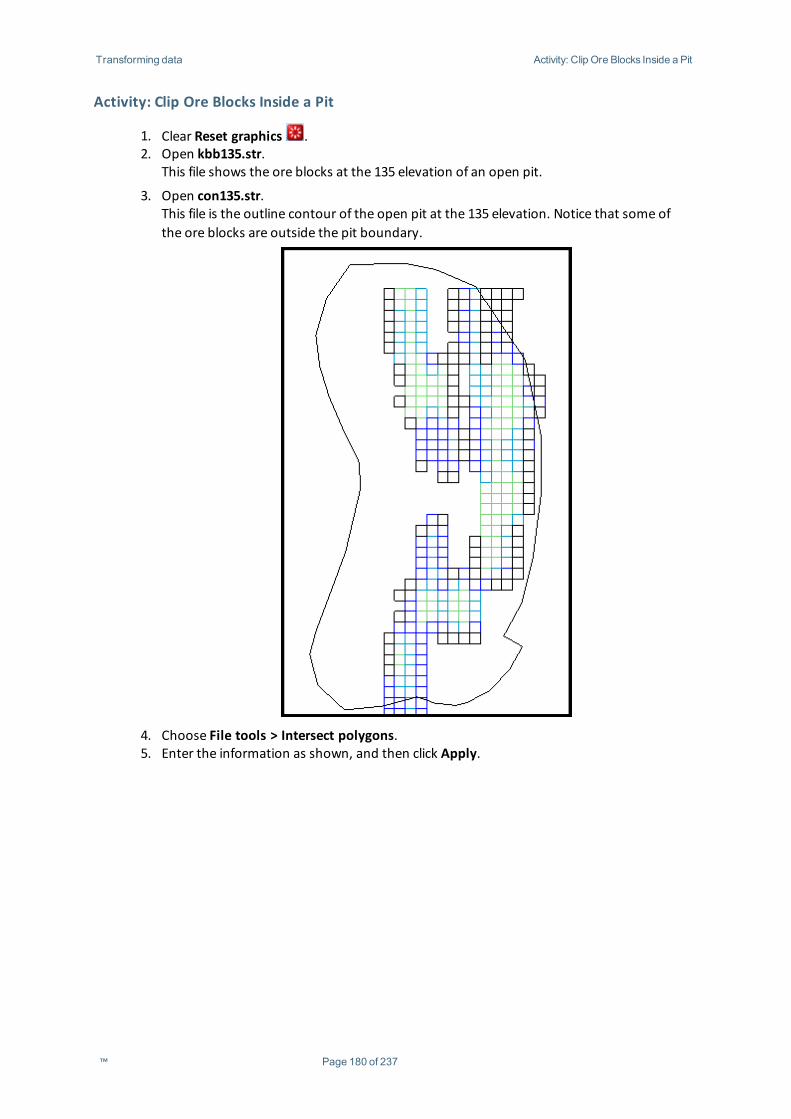
Transforming data Activity: Clip Ore Blocks Inside a Pit
Activity: Clip Ore Blocks Inside a Pit
1. Clear Reset graphics .2. Open kbb135.str.
This file shows the ore blocks at the 135 elevation of an open pit.
3. Open con135.str.This file is the outline contour of the open pit at the 135 elevation. Notice that some ofthe ore blocks are outside the pit boundary.
4. Choose File tools > Intersect polygons.5. Enter the information as shown, and then click Apply.
™ Page 180 of 237
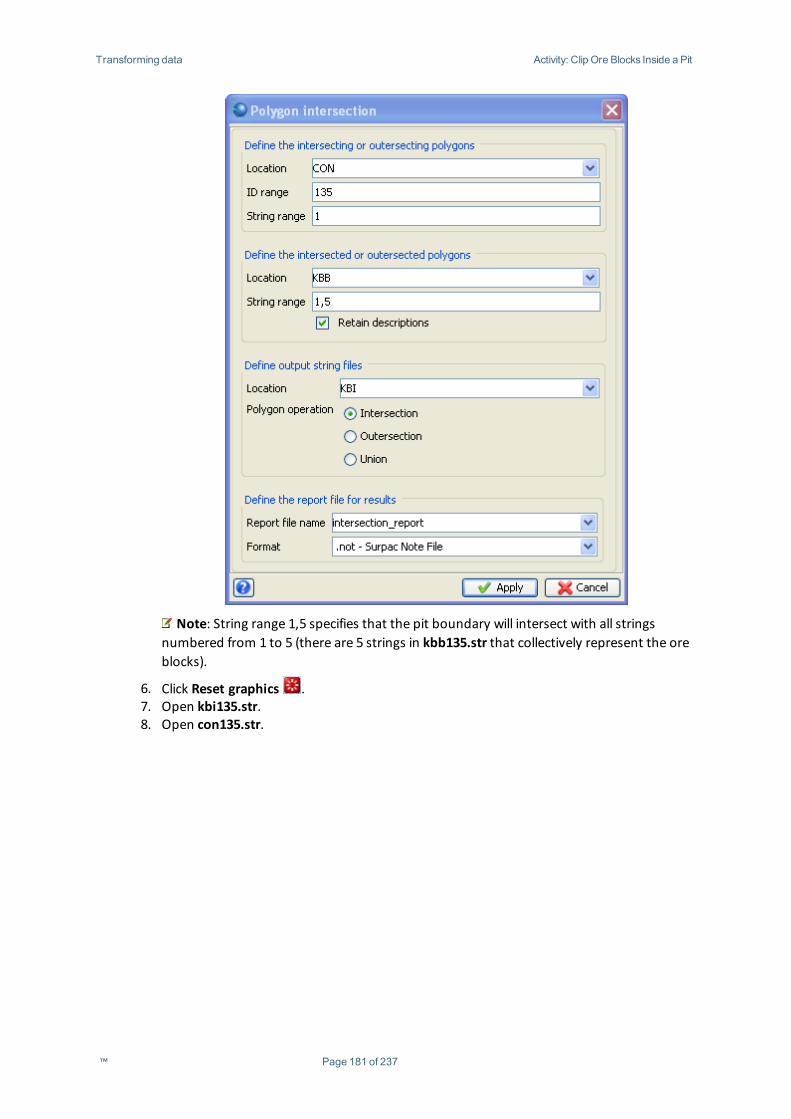
Transforming data Activity: Clip Ore Blocks Inside a Pit
Note: String range 1,5 specifies that the pit boundary will intersect with all stringsnumbered from 1 to 5 (there are 5 strings in kbb135.str that collectively represent the oreblocks).
6. Click Reset graphics .7. Open kbi135.str.8. Open con135.str.
™ Page 181 of 237
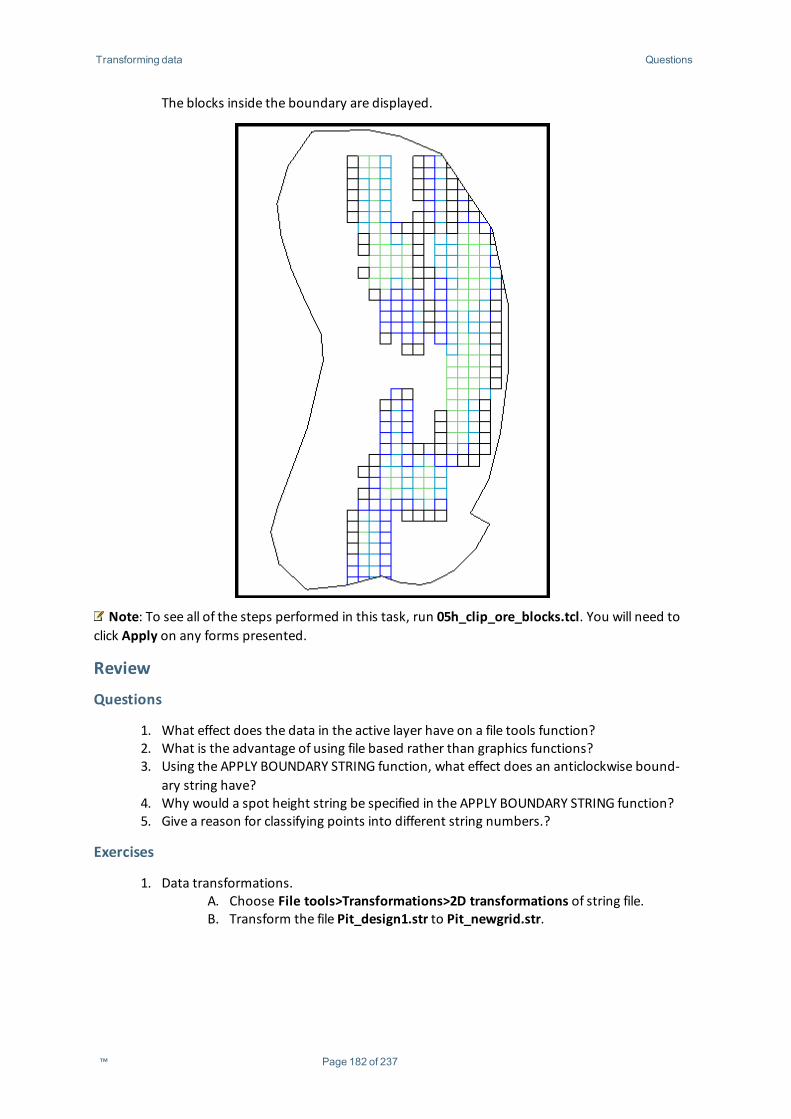
Transforming data Questions
The blocks inside the boundary are displayed.
Note: To see all of the steps performed in this task, run 05h_clip_ore_blocks.tcl. You will need toclick Apply on any forms presented.
Review
Questions
1. What effect does the data in the active layer have on a file tools function?2. What is the advantage of using file based rather than graphics functions?3. Using the APPLY BOUNDARY STRING function, what effect does an anticlockwise bound-
ary string have?4. Why would a spot height string be specified in the APPLY BOUNDARY STRING function?5. Give a reason for classifying points into different string numbers.?
Exercises
1. Data transformations.A. Choose File tools>Transformations>2D transformations of string file.B. Transform the file Pit_design1.str to Pit_newgrid.str.
™ Page 182 of 237

Transforming data Exercises
C. Using the following points from both grids add an elevation correction of800m.
Questions:
i. What is the rotation?ii. What is the Scale adjustment?
™ Page 183 of 237
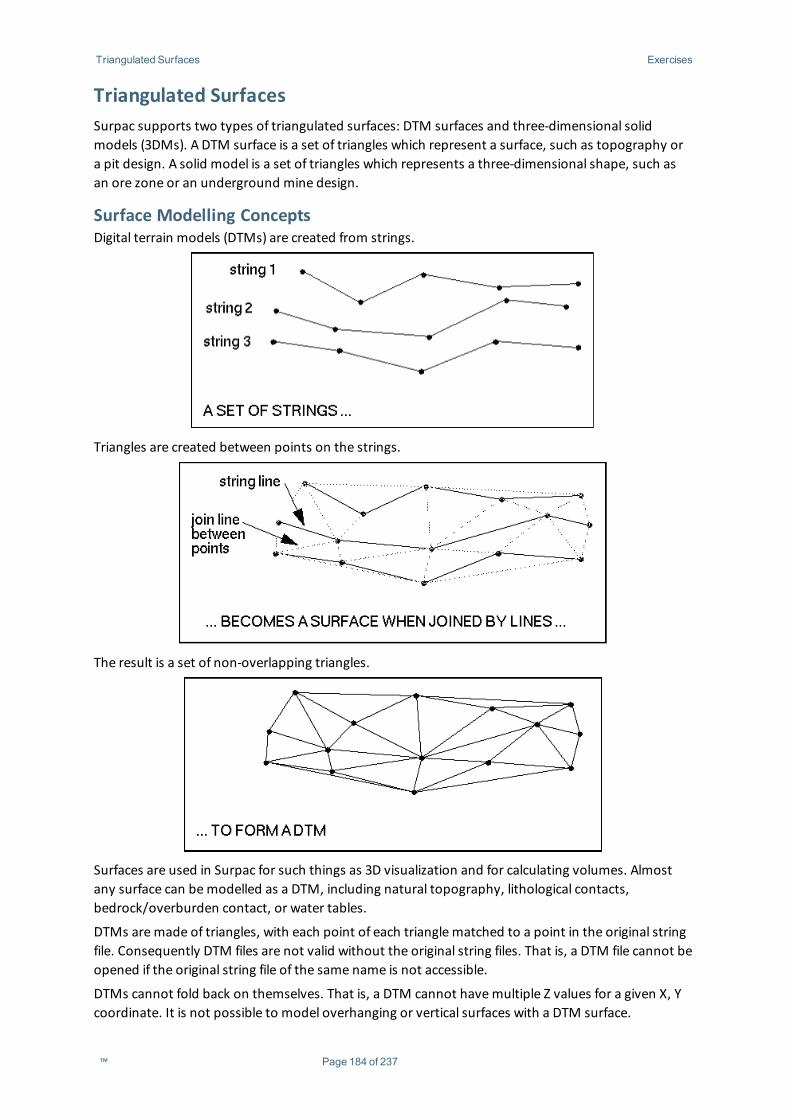
Triangulated Surfaces Exercises
Triangulated SurfacesSurpac supports two types of triangulated surfaces: DTM surfaces and three-dimensional solidmodels (3DMs). A DTM surface is a set of triangles which represent a surface, such as topography ora pit design. A solid model is a set of triangles which represents a three-dimensional shape, such asan ore zone or an underground mine design.
Surface Modelling ConceptsDigital terrain models (DTMs) are created from strings.
Triangles are created between points on the strings.
The result is a set of non-overlapping triangles.
Surfaces are used in Surpac for such things as 3D visualization and for calculating volumes. Almostany surface can bemodelled as a DTM, including natural topography, lithological contacts,bedrock/overburden contact, or water tables.
DTMs aremade of triangles, with each point of each triangle matched to a point in the original stringfile. Consequently DTM files are not valid without the original string files. That is, a DTM file cannot beopened if the original string file of the same name is not accessible.
DTMs cannot fold back on themselves. That is, a DTM cannot havemultiple Z values for a given X, Ycoordinate. It is not possible to model overhanging or vertical surfaces with a DTM surface.
™ Page 184 of 237
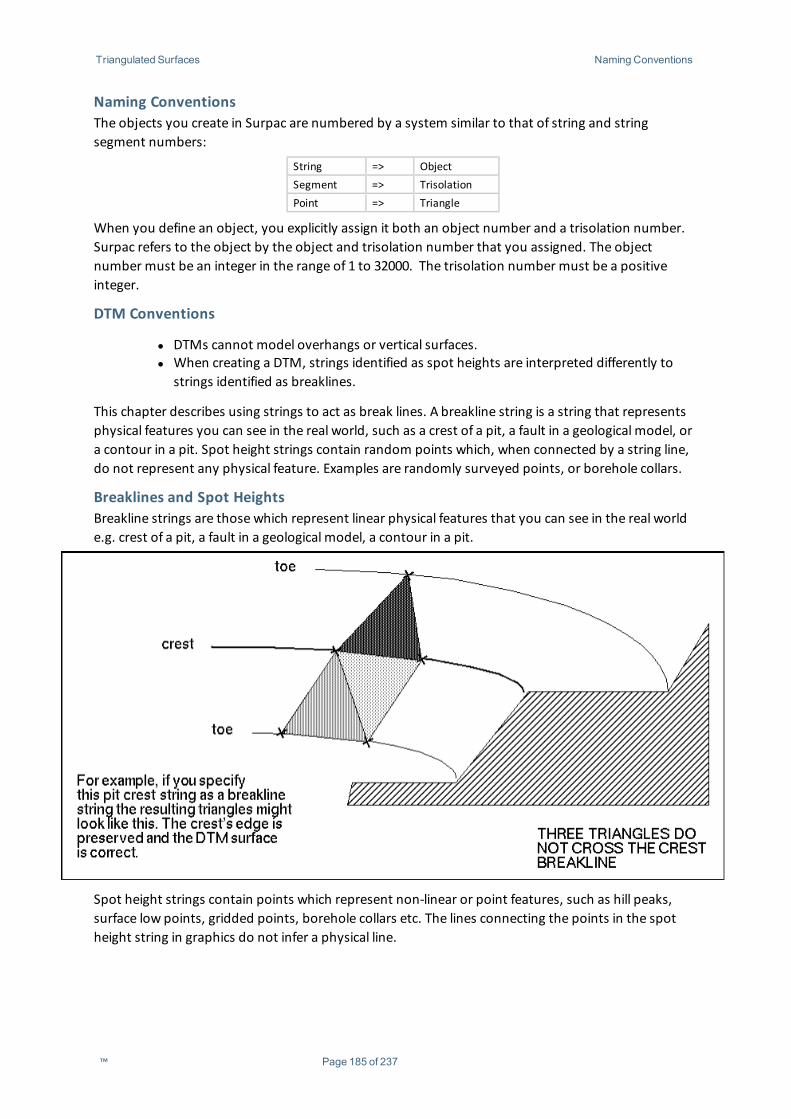
Triangulated Surfaces Naming Conventions
Naming ConventionsThe objects you create in Surpac are numbered by a system similar to that of string and stringsegment numbers:
String => ObjectSegment => TrisolationPoint => Triangle
When you define an object, you explicitly assign it both an object number and a trisolation number.Surpac refers to the object by the object and trisolation number that you assigned. The objectnumber must be an integer in the range of 1 to 32000. The trisolation number must be a positiveinteger.
DTM Conventions
l DTMs cannot model overhangs or vertical surfaces.l When creating a DTM, strings identified as spot heights are interpreted differently to
strings identified as breaklines.
This chapter describes using strings to act as break lines. A breakline string is a string that representsphysical features you can see in the real world, such as a crest of a pit, a fault in a geological model, ora contour in a pit. Spot height strings contain random points which, when connected by a string line,do not represent any physical feature. Examples are randomly surveyed points, or borehole collars.
Breaklines and Spot HeightsBreakline strings are those which represent linear physical features that you can see in the real worlde.g. crest of a pit, a fault in a geological model, a contour in a pit.
Spot height strings contain points which represent non-linear or point features, such as hill peaks,surface low points, gridded points, borehole collars etc. The lines connecting the points in the spotheight string in graphics do not infer a physical line.
™ Page 185 of 237
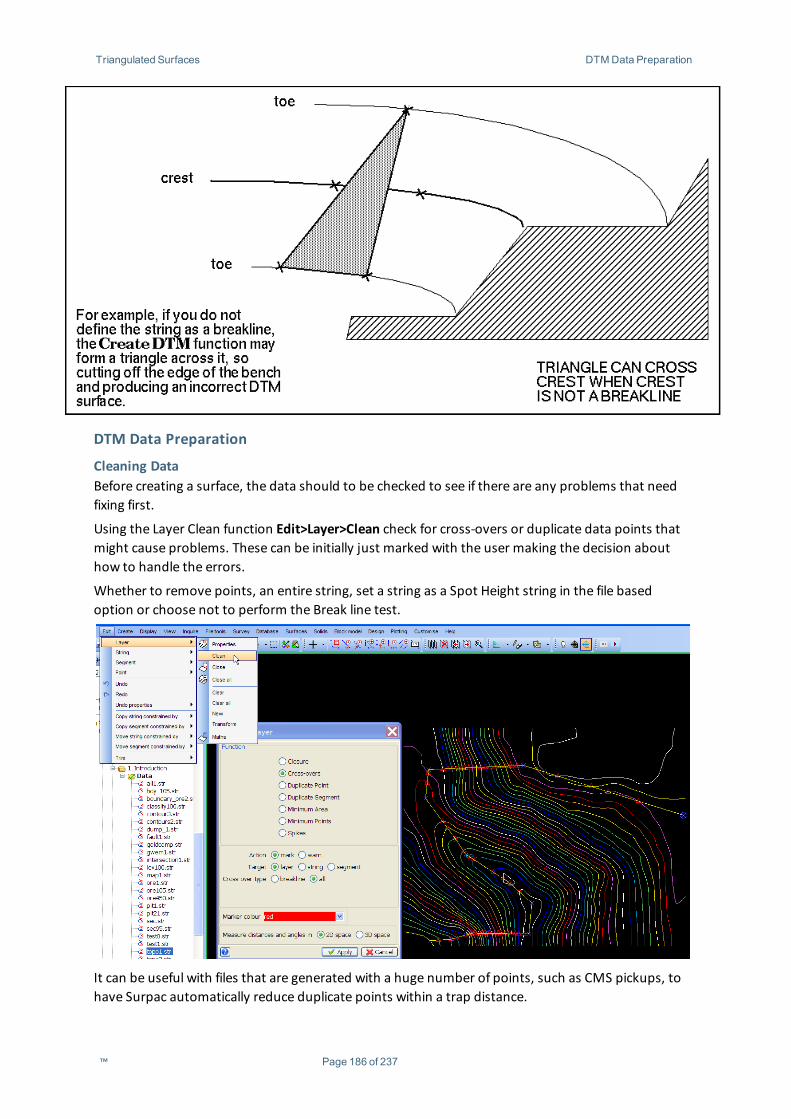
Triangulated Surfaces DTMData Preparation
DTM Data Preparation
Cleaning DataBefore creating a surface, the data should to be checked to see if there are any problems that needfixing first.
Using the Layer Clean function Edit>Layer>Clean check for cross-overs or duplicate data points thatmight cause problems. These can be initially just marked with the user making the decision abouthow to handle the errors.
Whether to remove points, an entire string, set a string as a Spot Height string in the file basedoption or choose not to perform the Break line test.
It can be useful with files that are generated with a huge number of points, such as CMS pickups, tohave Surpac automatically reduce duplicate points within a trap distance.
™ Page 186 of 237
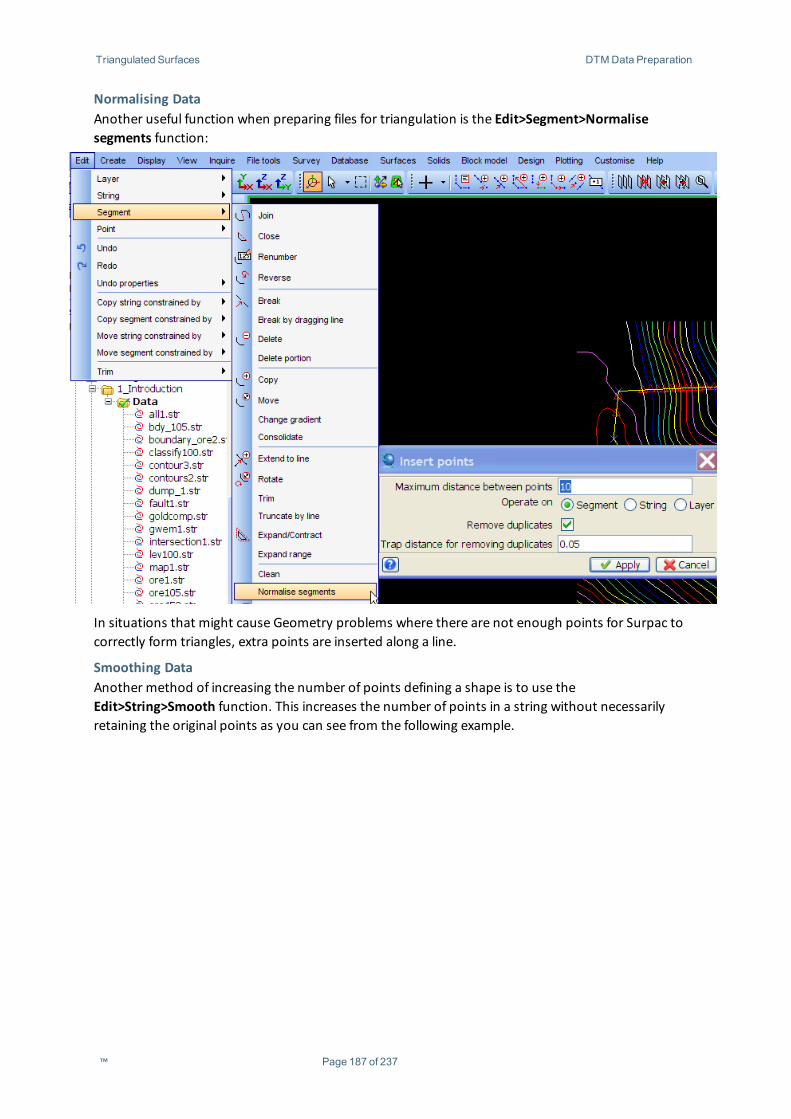
Triangulated Surfaces DTMData Preparation
Normalising DataAnother useful function when preparing files for triangulation is the Edit>Segment>Normalisesegments function:
In situations that might cause Geometry problems where there are not enough points for Surpac tocorrectly form triangles, extra points are inserted along a line.
Smoothing DataAnother method of increasing the number of points defining a shape is to use theEdit>String>Smooth function. This increases the number of points in a string without necessarilyretaining the original points as you can see from the following example.
™ Page 187 of 237
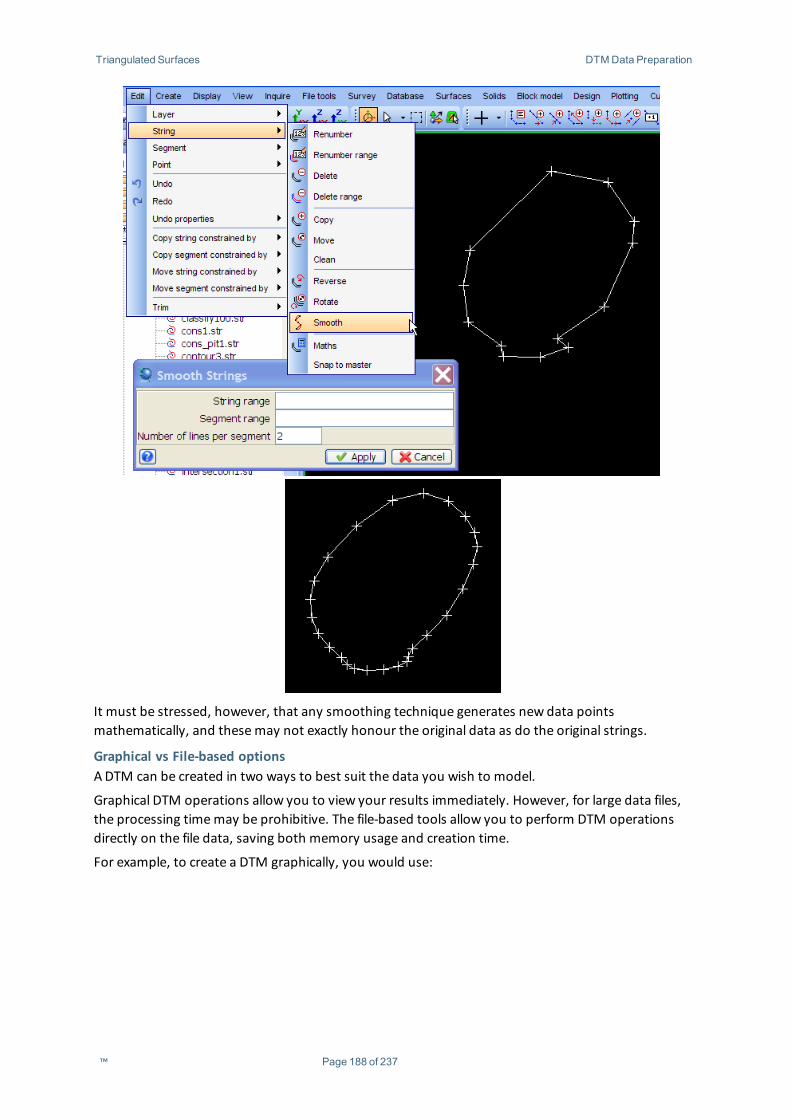
Triangulated Surfaces DTMData Preparation
It must be stressed, however, that any smoothing technique generates new data pointsmathematically, and thesemay not exactly honour the original data as do the original strings.
Graphical vs File-based optionsADTM can be created in two ways to best suit the data you wish to model.
Graphical DTM operations allow you to view your results immediately. However, for large data files,the processing timemay be prohibitive. The file-based tools allow you to perform DTM operationsdirectly on the file data, saving both memory usage and creation time.
For example, to create a DTM graphically, you would use:
™ Page 188 of 237
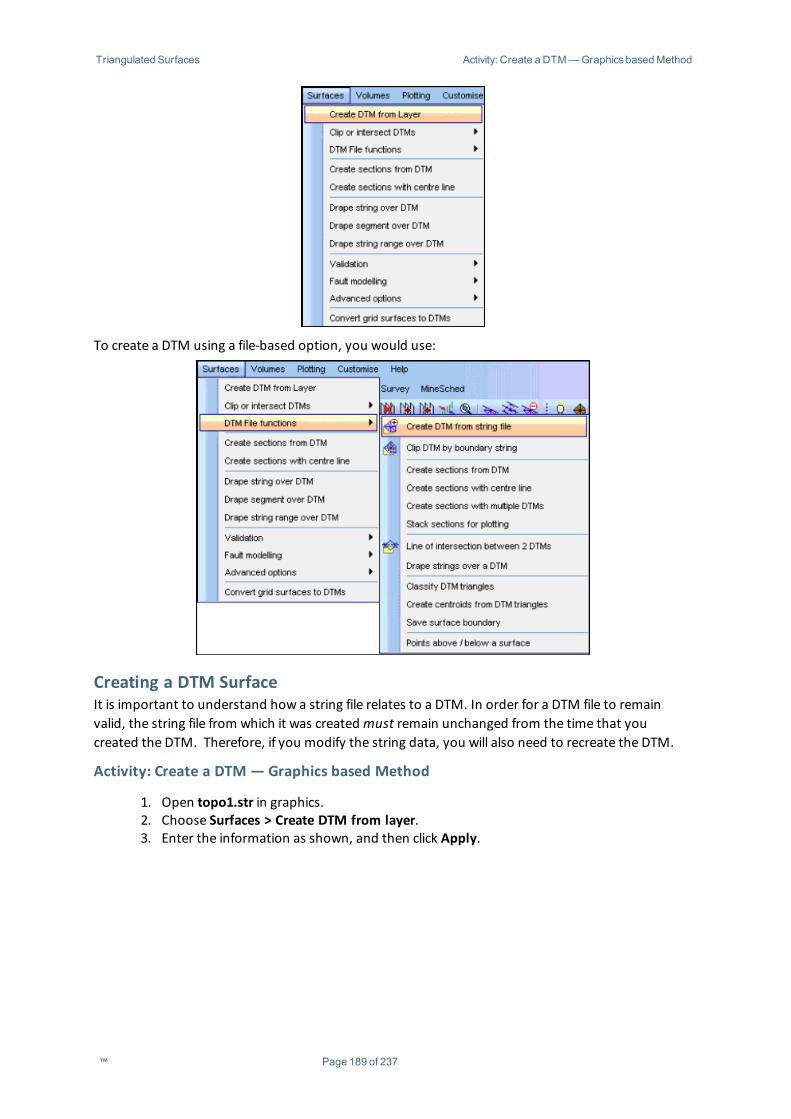
Triangulated Surfaces Activity: Create a DTM—Graphics basedMethod
To create a DTM using a file-based option, you would use:
Creating a DTM SurfaceIt is important to understand how a string file relates to a DTM. In order for a DTM file to remainvalid, the string file from which it was createdmust remain unchanged from the time that youcreated the DTM. Therefore, if you modify the string data, you will also need to recreate the DTM.
Activity: Create a DTM — Graphics based Method
1. Open topo1.str in graphics.2. Choose Surfaces > Create DTM from layer.3. Enter the information as shown, and then click Apply.
™ Page 189 of 237
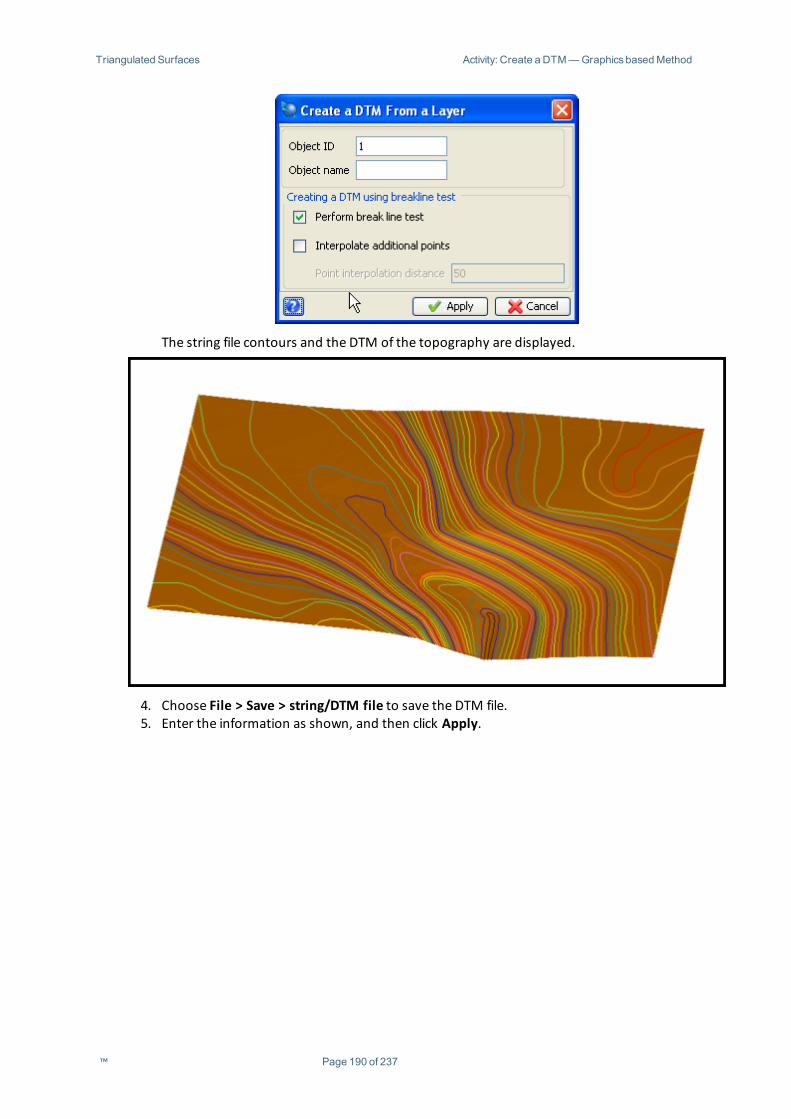
Triangulated Surfaces Activity: Create a DTM—Graphics basedMethod
The string file contours and the DTM of the topography are displayed.
4. Choose File > Save > string/DTM file to save the DTM file.5. Enter the information as shown, and then click Apply.
™ Page 190 of 237
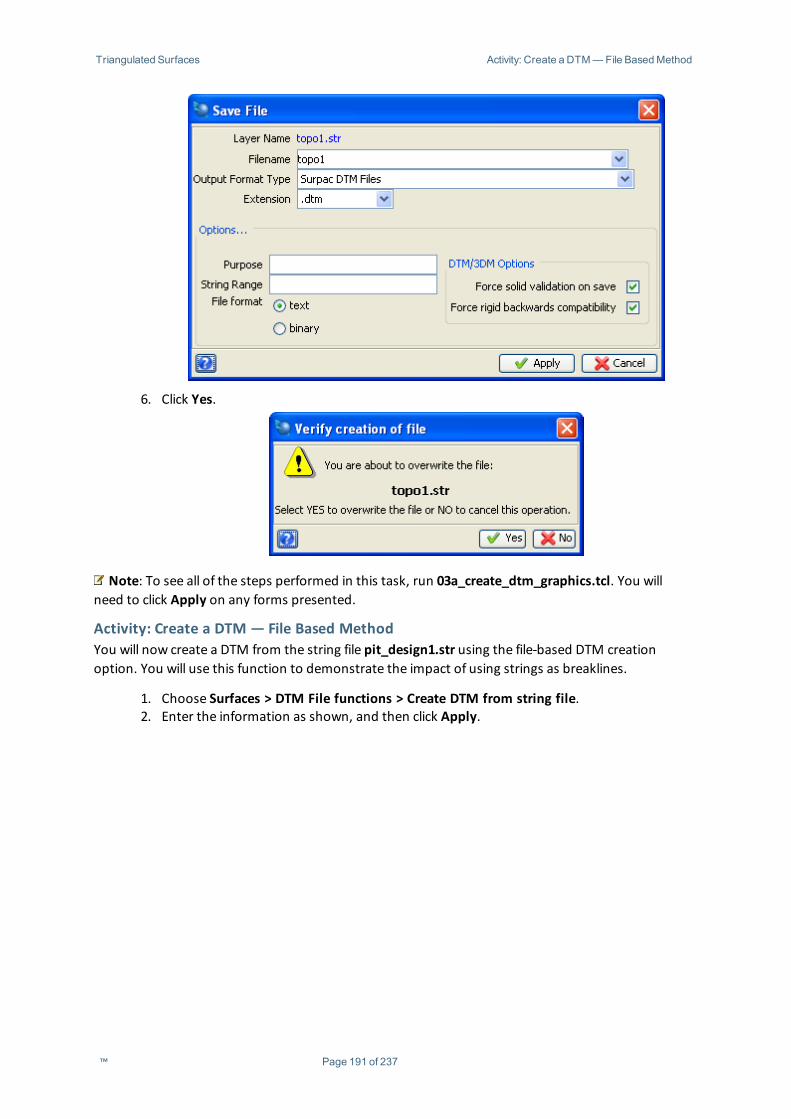
Triangulated Surfaces Activity: Create a DTM—File BasedMethod
6. Click Yes.
Note: To see all of the steps performed in this task, run 03a_create_dtm_graphics.tcl. You willneed to click Apply on any forms presented.
Activity: Create a DTM — File Based MethodYou will now create a DTM from the string file pit_design1.str using the file-based DTM creationoption. You will use this function to demonstrate the impact of using strings as breaklines.
1. Choose Surfaces > DTM File functions > Create DTM from string file.2. Enter the information as shown, and then click Apply.
™ Page 191 of 237
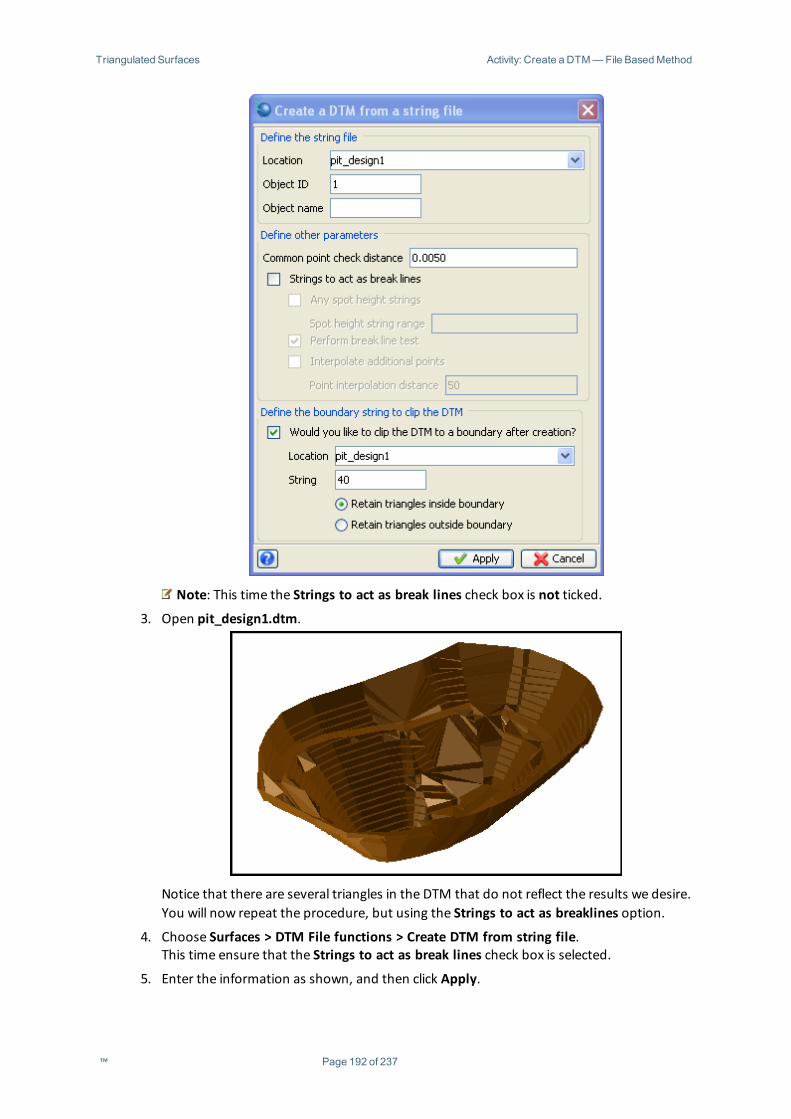
Triangulated Surfaces Activity: Create a DTM—File BasedMethod
Note: This time the Strings to act as break lines check box is not ticked.
3. Open pit_design1.dtm.
Notice that there are several triangles in the DTM that do not reflect the results we desire.You will now repeat the procedure, but using the Strings to act as breaklines option.
4. Choose Surfaces > DTM File functions > Create DTM from string file.This time ensure that the Strings to act as break lines check box is selected.
5. Enter the information as shown, and then click Apply.
™ Page 192 of 237
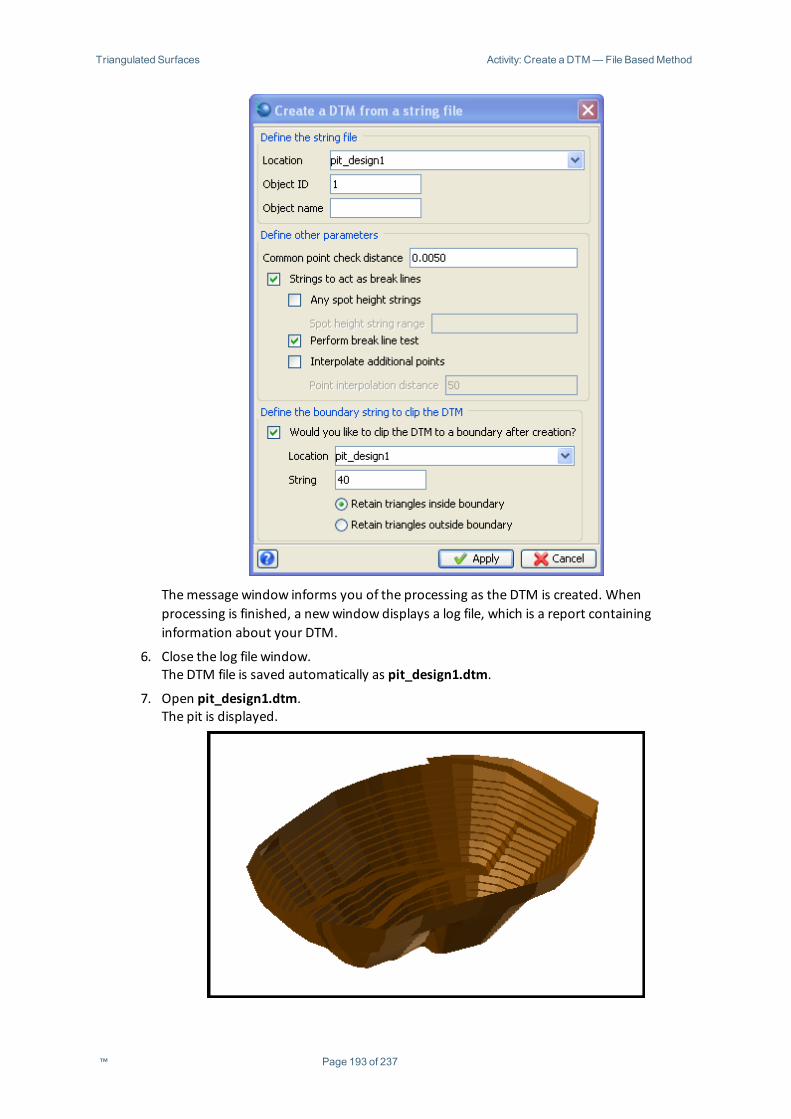
Triangulated Surfaces Activity: Create a DTM—File BasedMethod
Themessage window informs you of the processing as the DTM is created. Whenprocessing is finished, a newwindow displays a log file, which is a report containinginformation about your DTM.
6. Close the log file window.The DTM file is saved automatically as pit_design1.dtm.
7. Open pit_design1.dtm.The pit is displayed.
™ Page 193 of 237
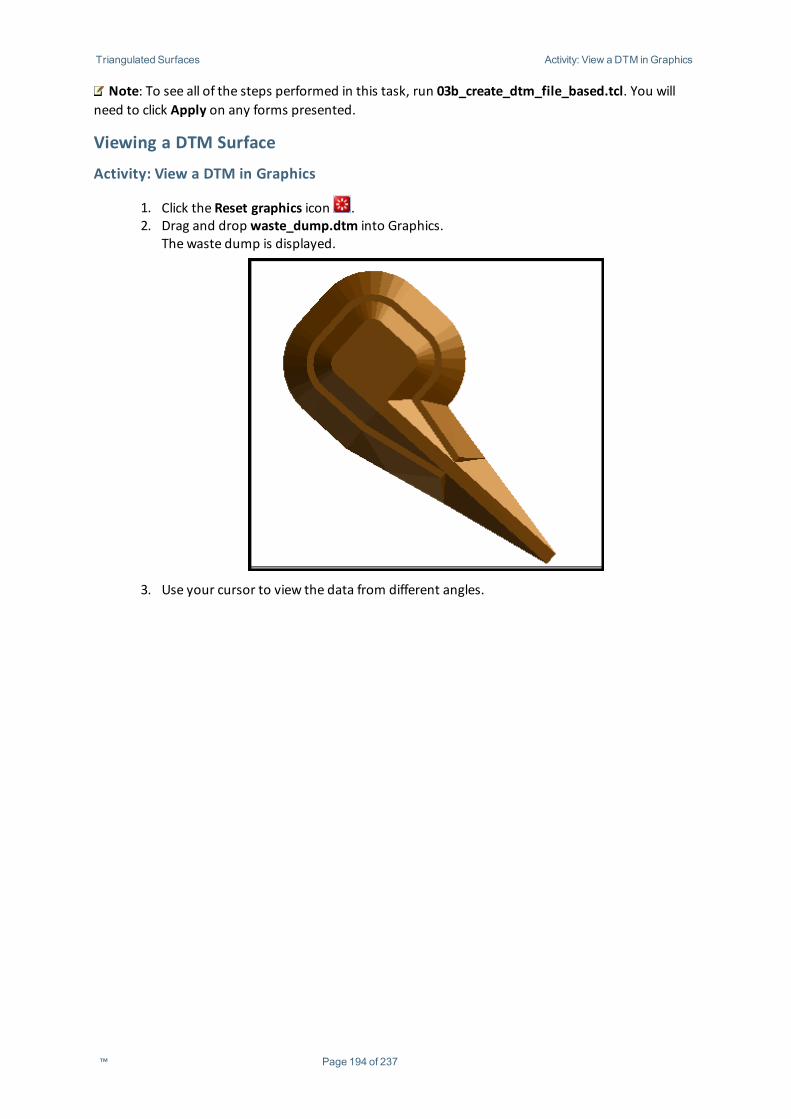
Triangulated Surfaces Activity: View aDTM inGraphics
Note: To see all of the steps performed in this task, run 03b_create_dtm_file_based.tcl. You willneed to click Apply on any forms presented.
Viewing a DTM Surface
Activity: View a DTM in Graphics
1. Click the Reset graphics icon .2. Drag and drop waste_dump.dtm into Graphics.
The waste dump is displayed.
3. Use your cursor to view the data from different angles.
™ Page 194 of 237
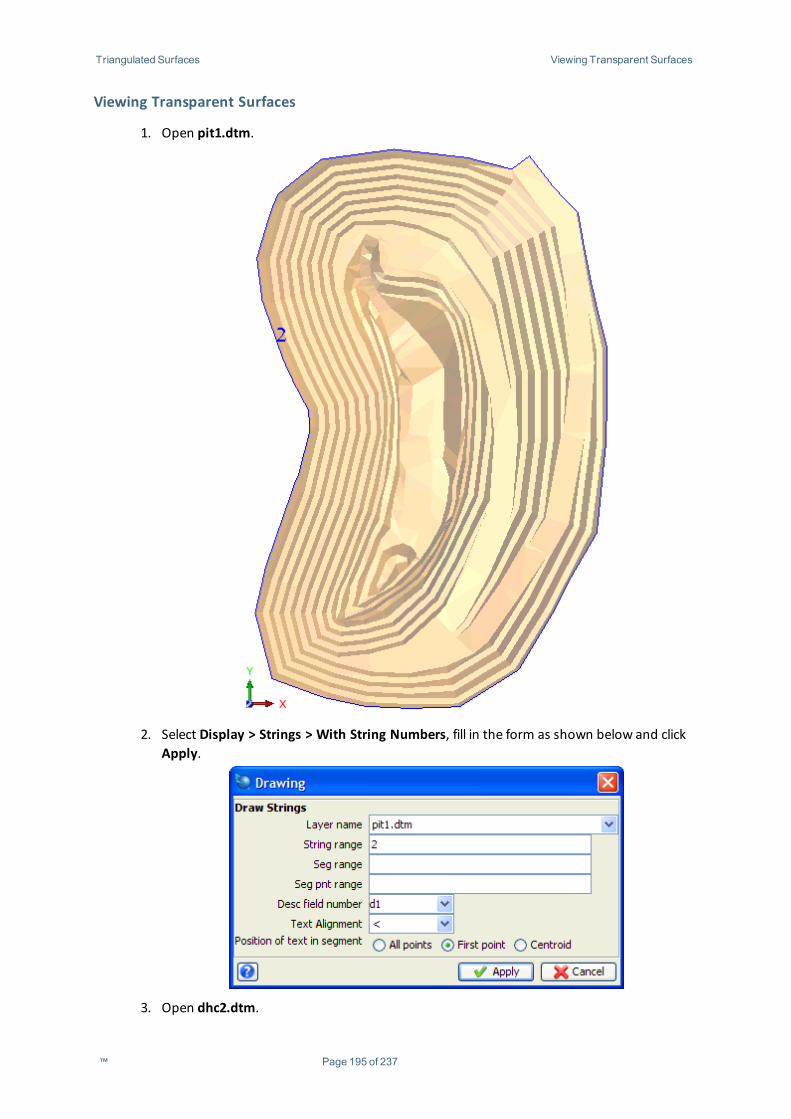
Triangulated Surfaces Viewing Transparent Surfaces
Viewing Transparent Surfaces
1. Open pit1.dtm.
2. Select Display > Strings > With String Numbers, fill in the form as shown below and clickApply.
3. Open dhc2.dtm.
™ Page 195 of 237
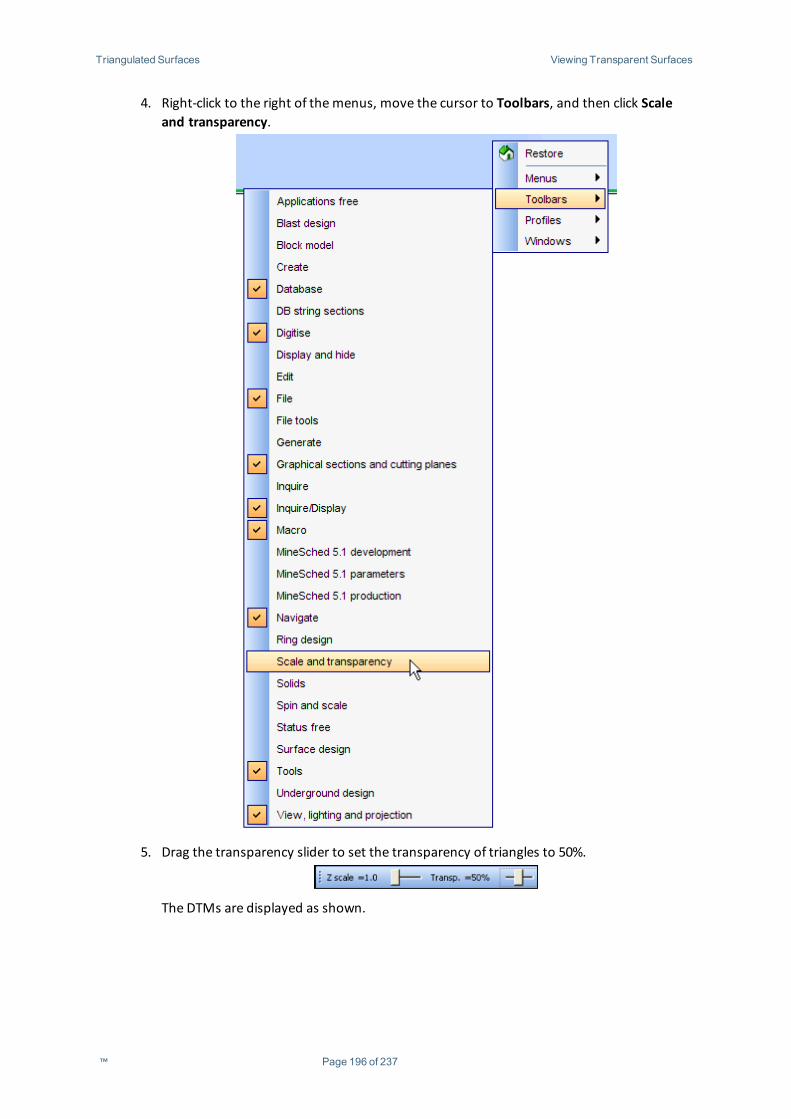
Triangulated Surfaces Viewing Transparent Surfaces
4. Right-click to the right of themenus, move the cursor to Toolbars, and then click Scaleand transparency.
5. Drag the transparency slider to set the transparency of triangles to 50%.
The DTMs are displayed as shown.
™ Page 196 of 237
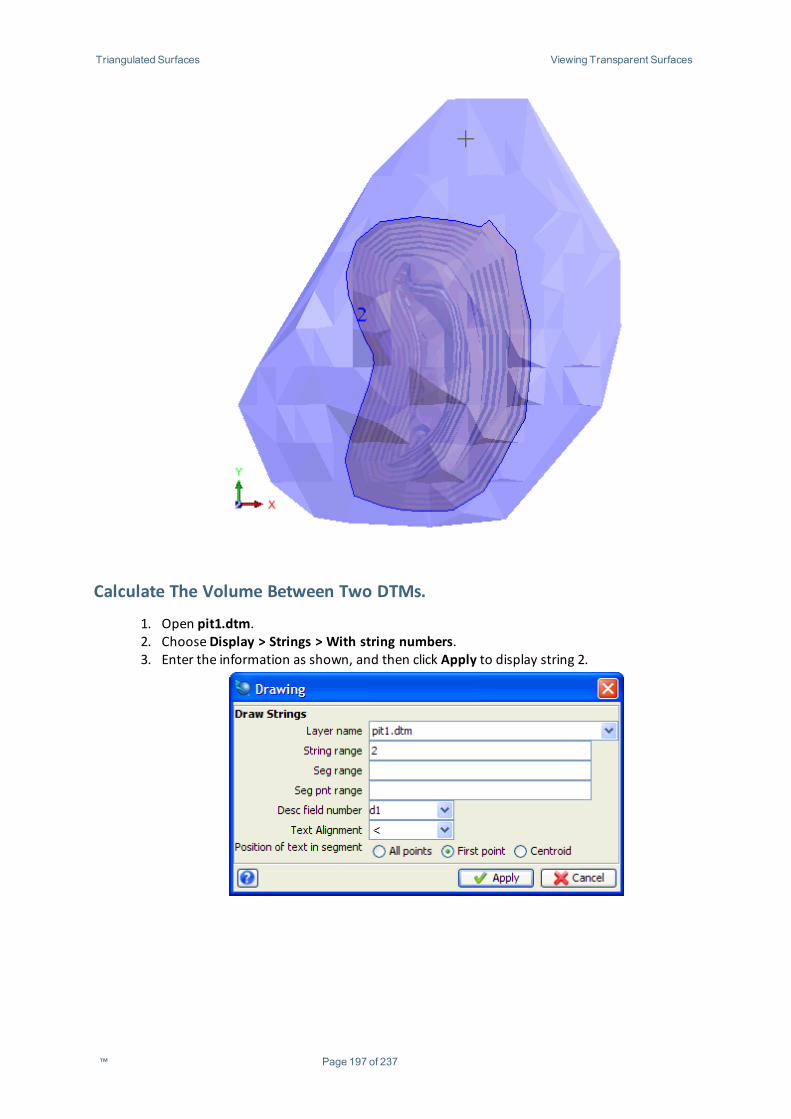
Triangulated Surfaces Viewing Transparent Surfaces
Calculate The Volume Between Two DTMs.
1. Open pit1.dtm.2. ChooseDisplay > Strings > With string numbers.3. Enter the information as shown, and then click Apply to display string 2.
™ Page 197 of 237
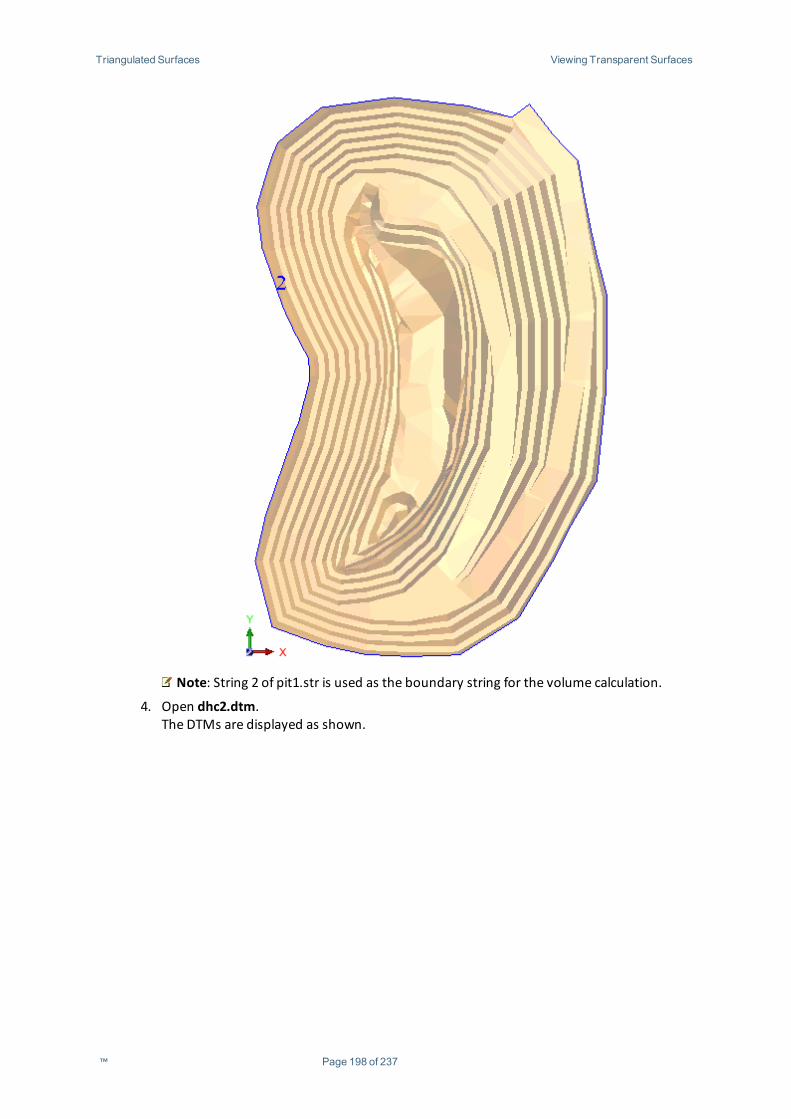
Triangulated Surfaces Viewing Transparent Surfaces
Note: String 2 of pit1.str is used as the boundary string for the volume calculation.
4. Open dhc2.dtm.The DTMs are displayed as shown.
™ Page 198 of 237
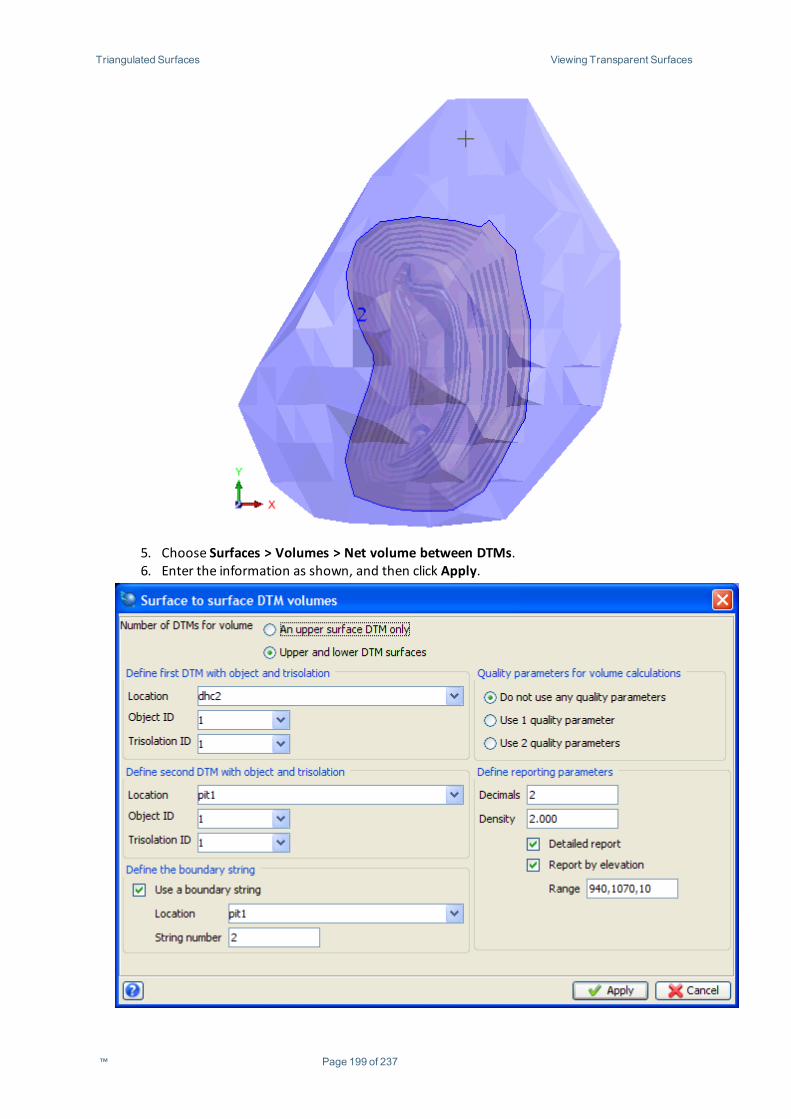
Triangulated Surfaces Viewing Transparent Surfaces
5. Choose Surfaces > Volumes > Net volume between DTMs.6. Enter the information as shown, and then click Apply.
™ Page 199 of 237
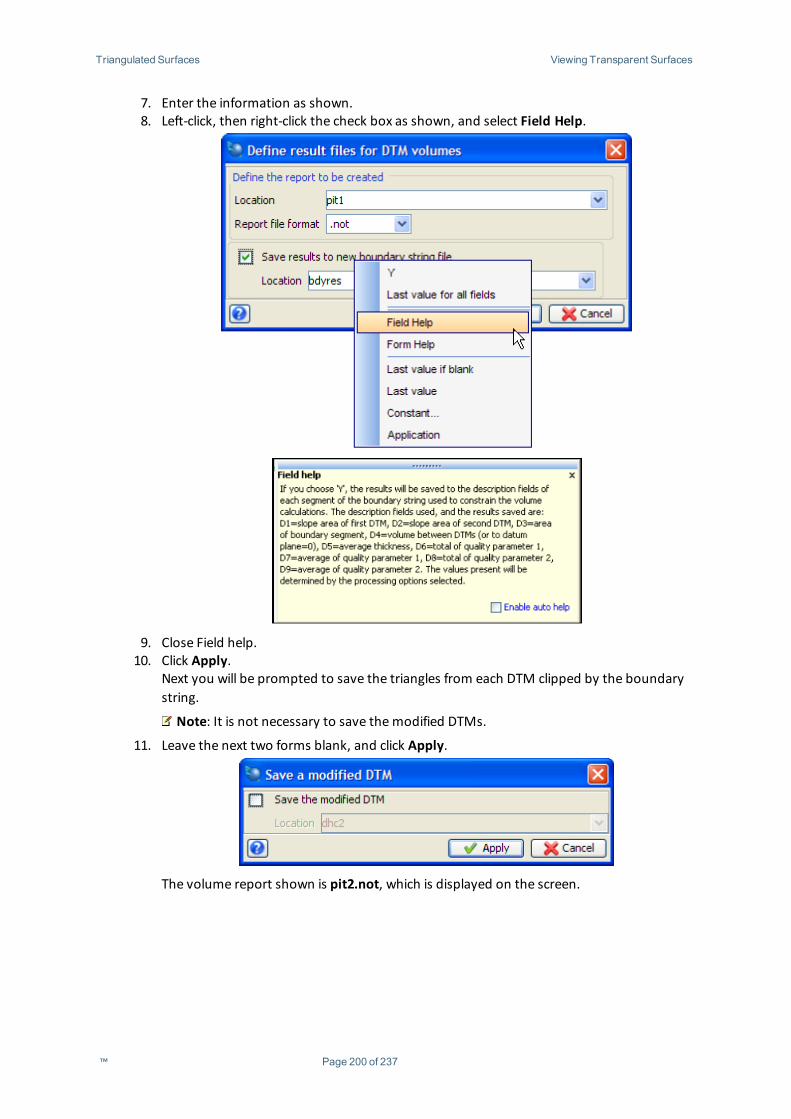
Triangulated Surfaces Viewing Transparent Surfaces
7. Enter the information as shown.8. Left-click, then right-click the check box as shown, and select Field Help.
9. Close Field help.10. Click Apply.
Next you will be prompted to save the triangles from each DTM clipped by the boundarystring.
Note: It is not necessary to save themodified DTMs.
11. Leave the next two forms blank, and click Apply.
The volume report shown is pit2.not, which is displayed on the screen.
™ Page 200 of 237
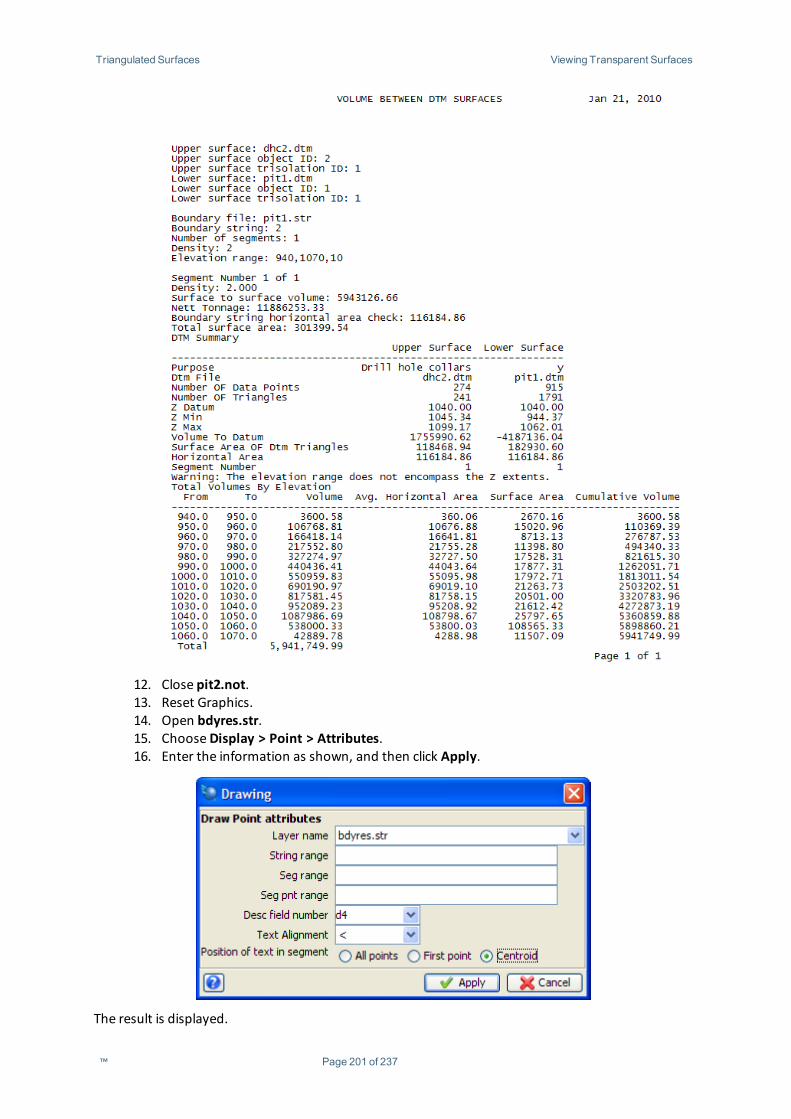
Triangulated Surfaces Viewing Transparent Surfaces
12. Close pit2.not.13. Reset Graphics.14. Open bdyres.str.15. ChooseDisplay > Point > Attributes.16. Enter the information as shown, and then click Apply.
The result is displayed.
™ Page 201 of 237
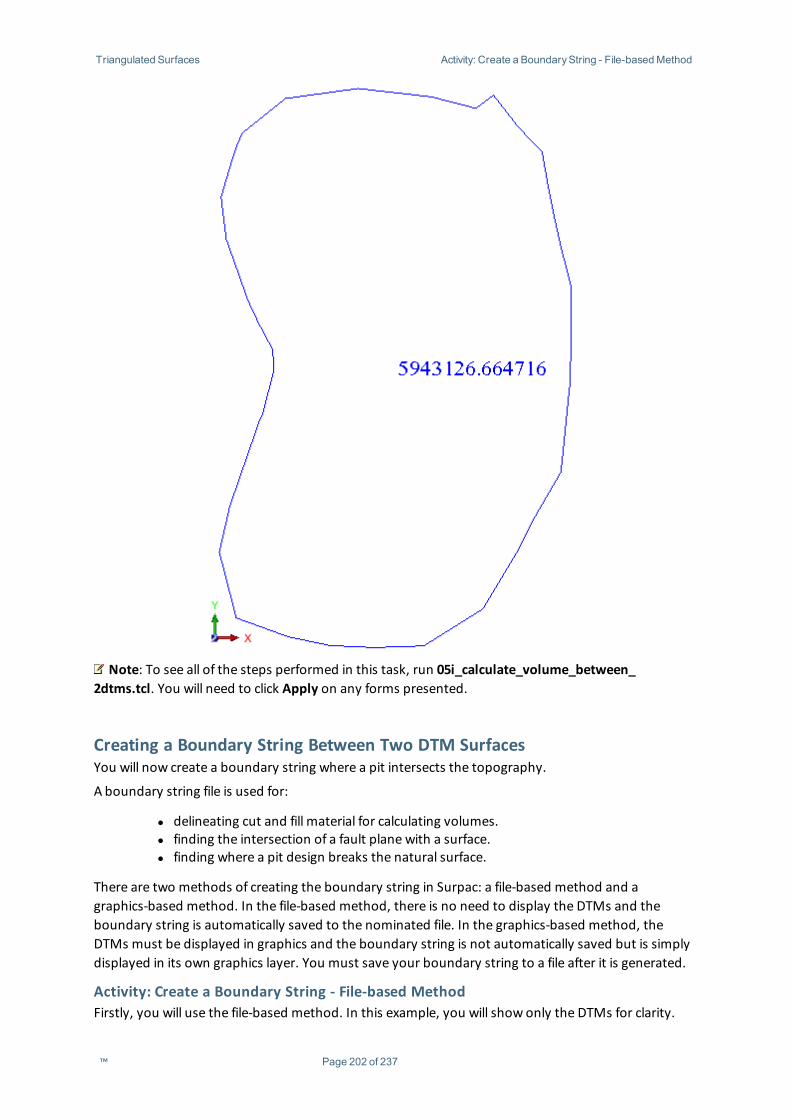
Triangulated Surfaces Activity: Create a BoundaryString - File-basedMethod
Note: To see all of the steps performed in this task, run 05i_calculate_volume_between_2dtms.tcl. You will need to click Apply on any forms presented.
Creating a Boundary String Between Two DTM SurfacesYou will now create a boundary string where a pit intersects the topography.
A boundary string file is used for:
l delineating cut and fill material for calculating volumes.l finding the intersection of a fault plane with a surface.l finding where a pit design breaks the natural surface.
There are two methods of creating the boundary string in Surpac: a file-based method and agraphics-based method. In the file-based method, there is no need to display the DTMs and theboundary string is automatically saved to the nominated file. In the graphics-based method, theDTMs must be displayed in graphics and the boundary string is not automatically saved but is simplydisplayed in its own graphics layer. You must save your boundary string to a file after it is generated.
Activity: Create a Boundary String - File-based MethodFirstly, you will use the file-based method. In this example, you will show only the DTMs for clarity.
™ Page 202 of 237
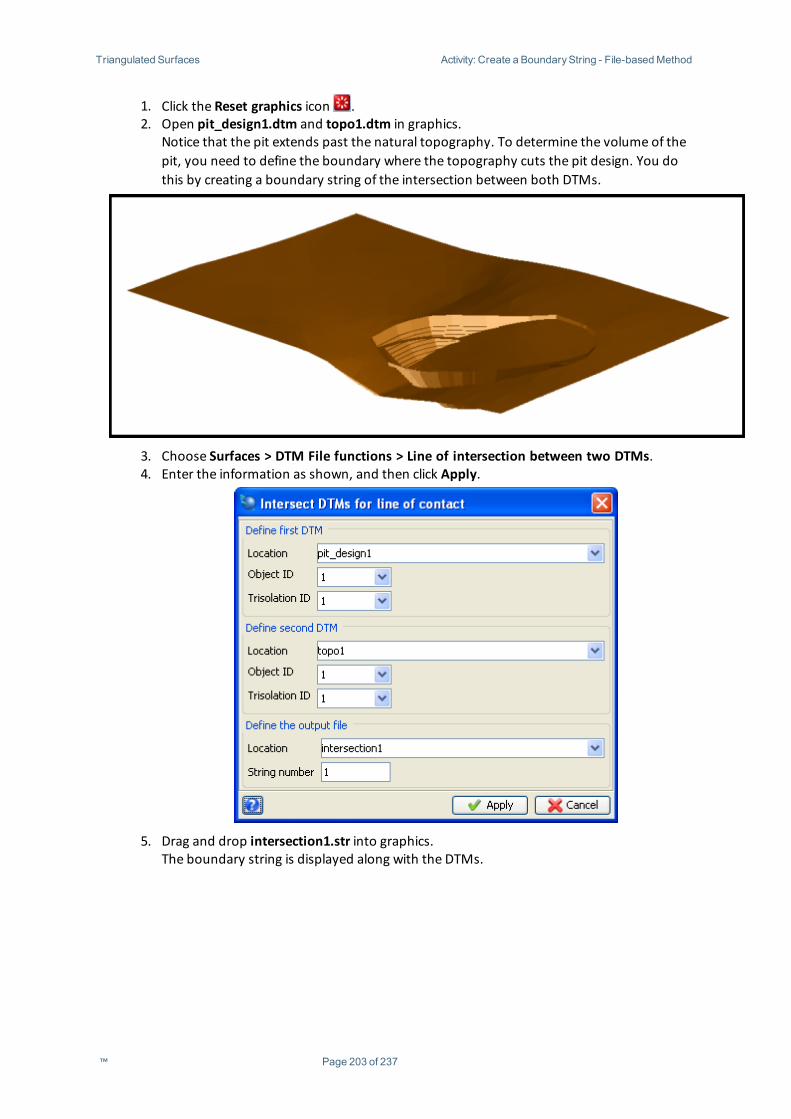
Triangulated Surfaces Activity: Create a BoundaryString - File-basedMethod
1. Click the Reset graphics icon .2. Open pit_design1.dtm and topo1.dtm in graphics.
Notice that the pit extends past the natural topography. To determine the volume of thepit, you need to define the boundary where the topography cuts the pit design. You dothis by creating a boundary string of the intersection between both DTMs.
3. Choose Surfaces > DTM File functions > Line of intersection between two DTMs.4. Enter the information as shown, and then click Apply.
5. Drag and drop intersection1.str into graphics.The boundary string is displayed along with the DTMs.
™ Page 203 of 237
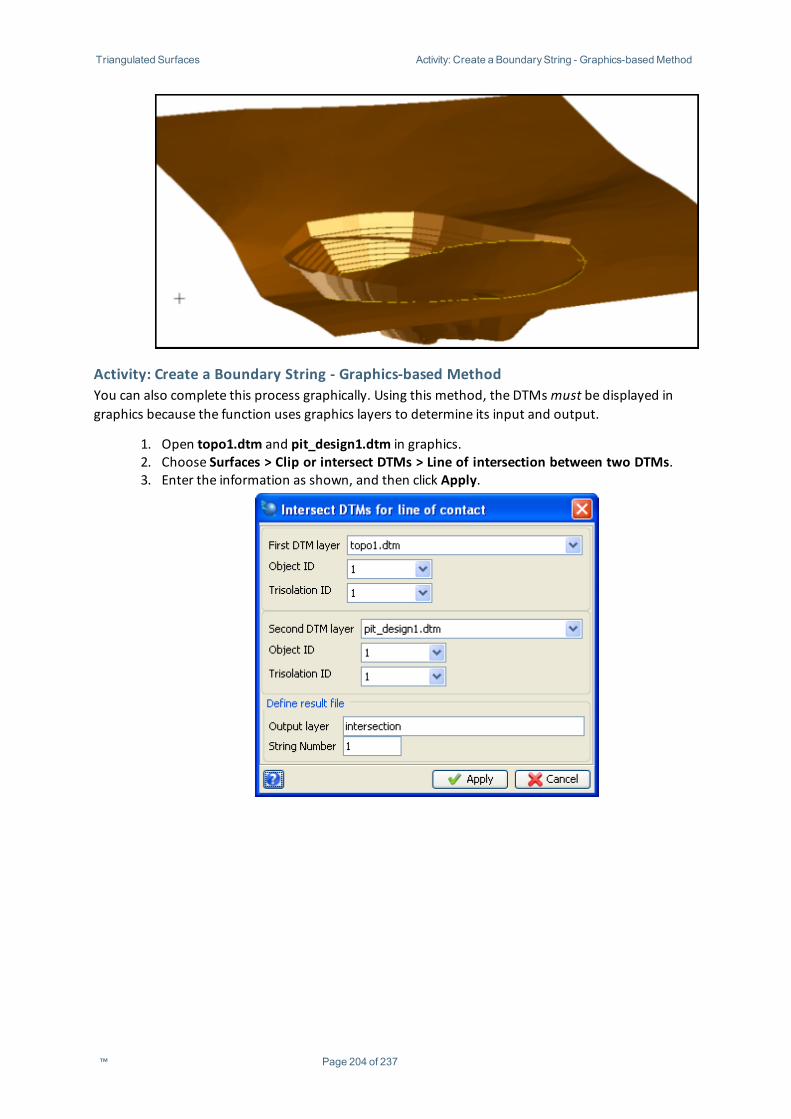
Triangulated Surfaces Activity: Create a BoundaryString - Graphics-basedMethod
Activity: Create a Boundary String - Graphics-based MethodYou can also complete this process graphically. Using this method, the DTMsmust be displayed ingraphics because the function uses graphics layers to determine its input and output.
1. Open topo1.dtm and pit_design1.dtm in graphics.2. Choose Surfaces > Clip or intersect DTMs > Line of intersection between two DTMs.3. Enter the information as shown, and then click Apply.
™ Page 204 of 237
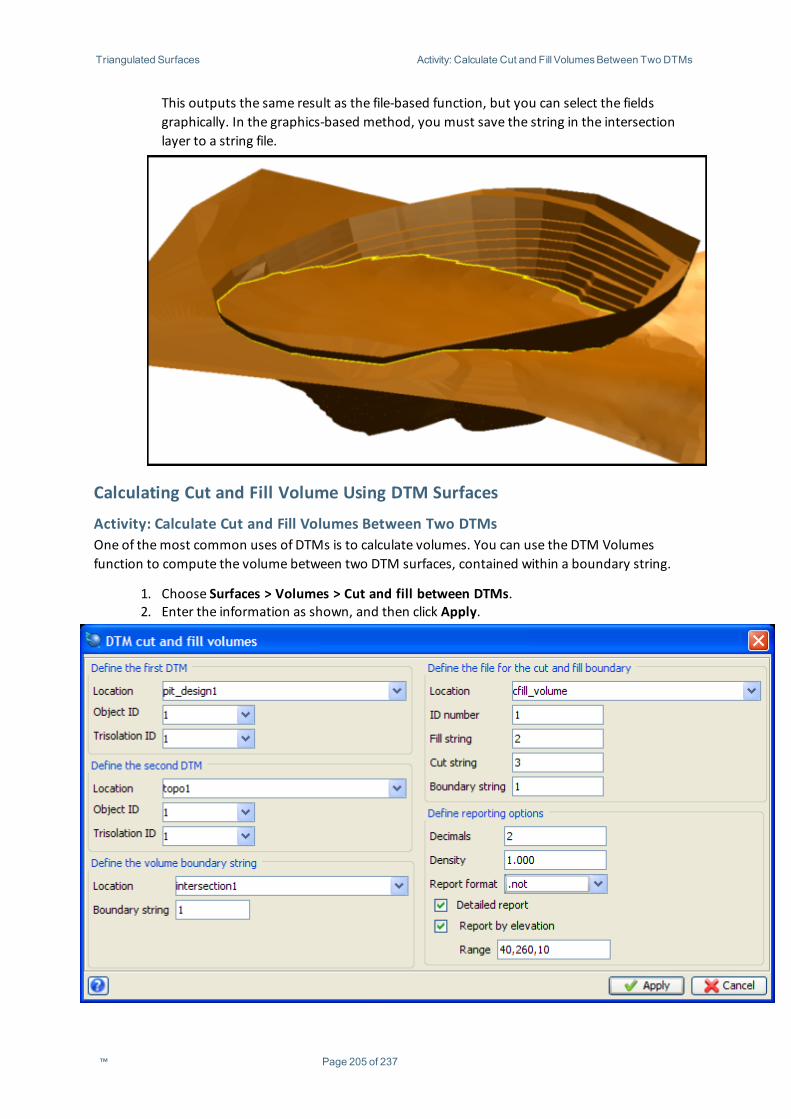
Triangulated Surfaces Activity: Calculate Cut and Fill VolumesBetween TwoDTMs
This outputs the same result as the file-based function, but you can select the fieldsgraphically. In the graphics-based method, you must save the string in the intersectionlayer to a string file.
Calculating Cut and Fill Volume Using DTM Surfaces
Activity: Calculate Cut and Fill Volumes Between Two DTMsOne of themost common uses of DTMs is to calculate volumes. You can use the DTM Volumesfunction to compute the volume between two DTM surfaces, contained within a boundary string.
1. Choose Surfaces > Volumes > Cut and fill between DTMs.2. Enter the information as shown, and then click Apply.
™ Page 205 of 237
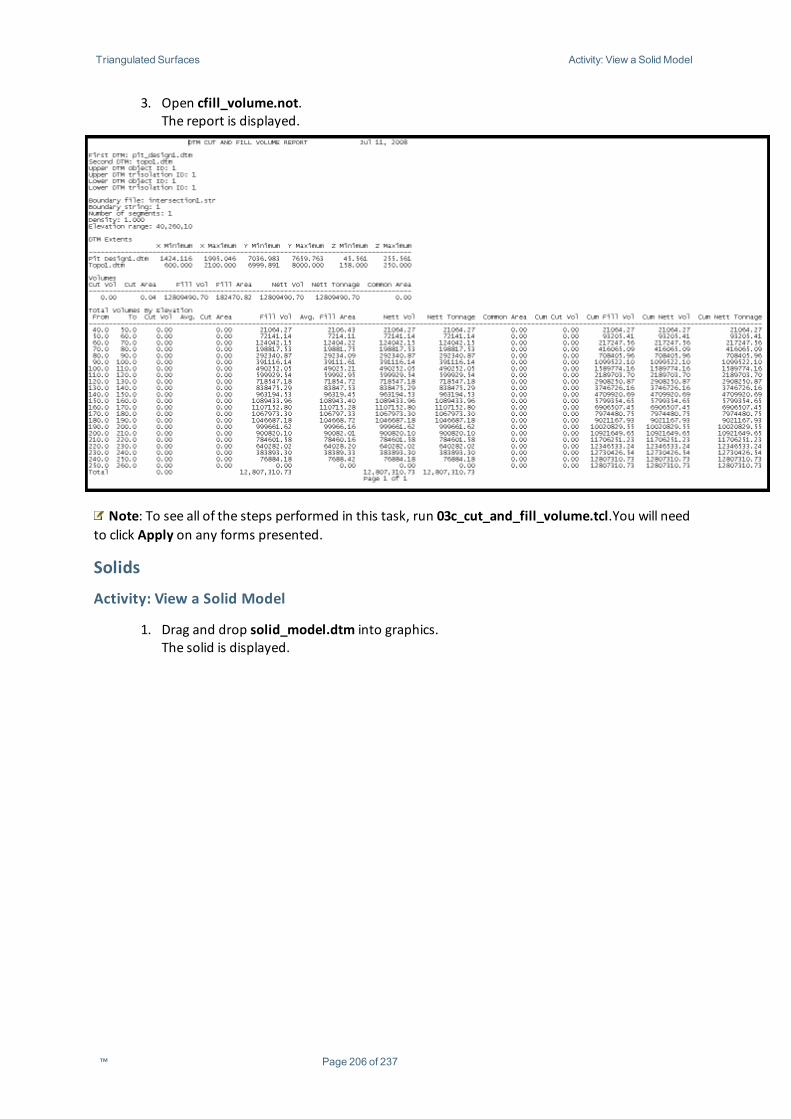
Triangulated Surfaces Activity: View a Solid Model
3. Open cfill_volume.not.The report is displayed.
Note: To see all of the steps performed in this task, run 03c_cut_and_fill_volume.tcl.You will needto click Apply on any forms presented.
Solids
Activity: View a Solid Model
1. Drag and drop solid_model.dtm into graphics.The solid is displayed.
™ Page 206 of 237
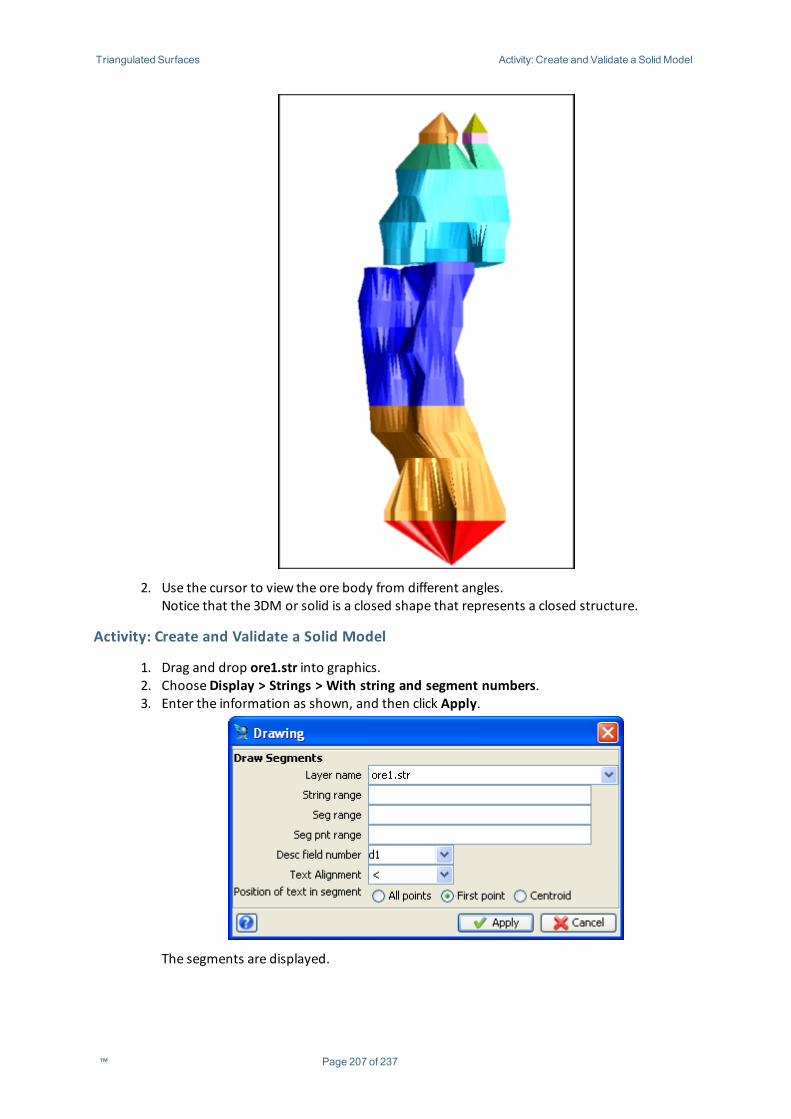
Triangulated Surfaces Activity: Create and Validate a Solid Model
2. Use the cursor to view the ore body from different angles.Notice that the 3DM or solid is a closed shape that represents a closed structure.
Activity: Create and Validate a Solid Model
1. Drag and drop ore1.str into graphics.2. ChooseDisplay > Strings > With string and segment numbers.3. Enter the information as shown, and then click Apply.
The segments are displayed.
™ Page 207 of 237
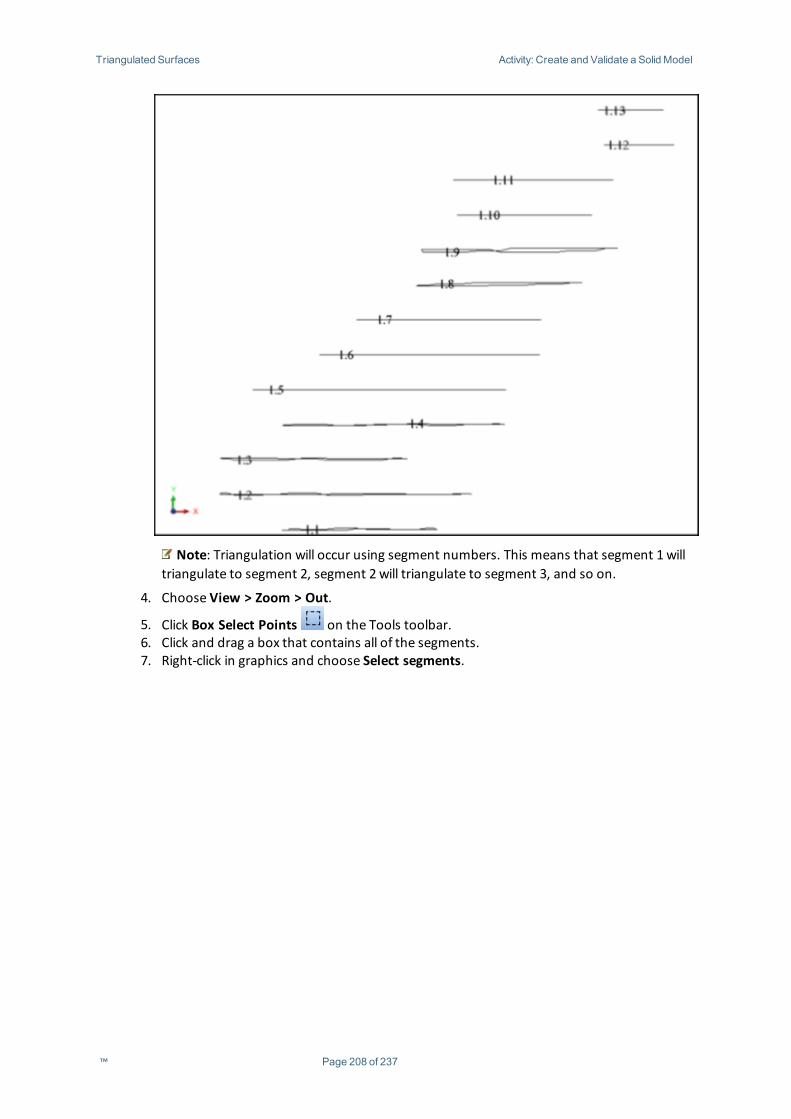
Triangulated Surfaces Activity: Create and Validate a Solid Model
Note: Triangulation will occur using segment numbers. This means that segment 1willtriangulate to segment 2, segment 2will triangulate to segment 3, and so on.
4. Choose View > Zoom > Out.
5. Click Box Select Points on the Tools toolbar.6. Click and drag a box that contains all of the segments.7. Right-click in graphics and choose Select segments.
™ Page 208 of 237
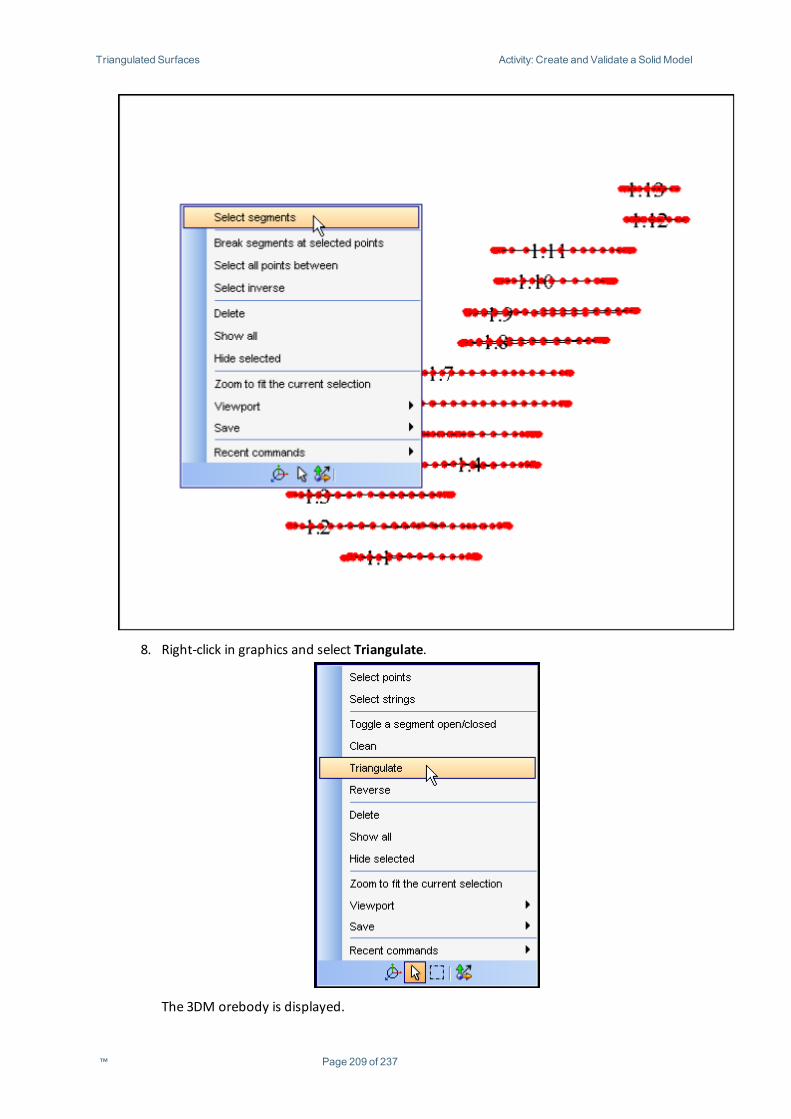
Triangulated Surfaces Activity: Create and Validate a Solid Model
8. Right-click in graphics and select Triangulate.
The 3DM orebody is displayed.
™ Page 209 of 237
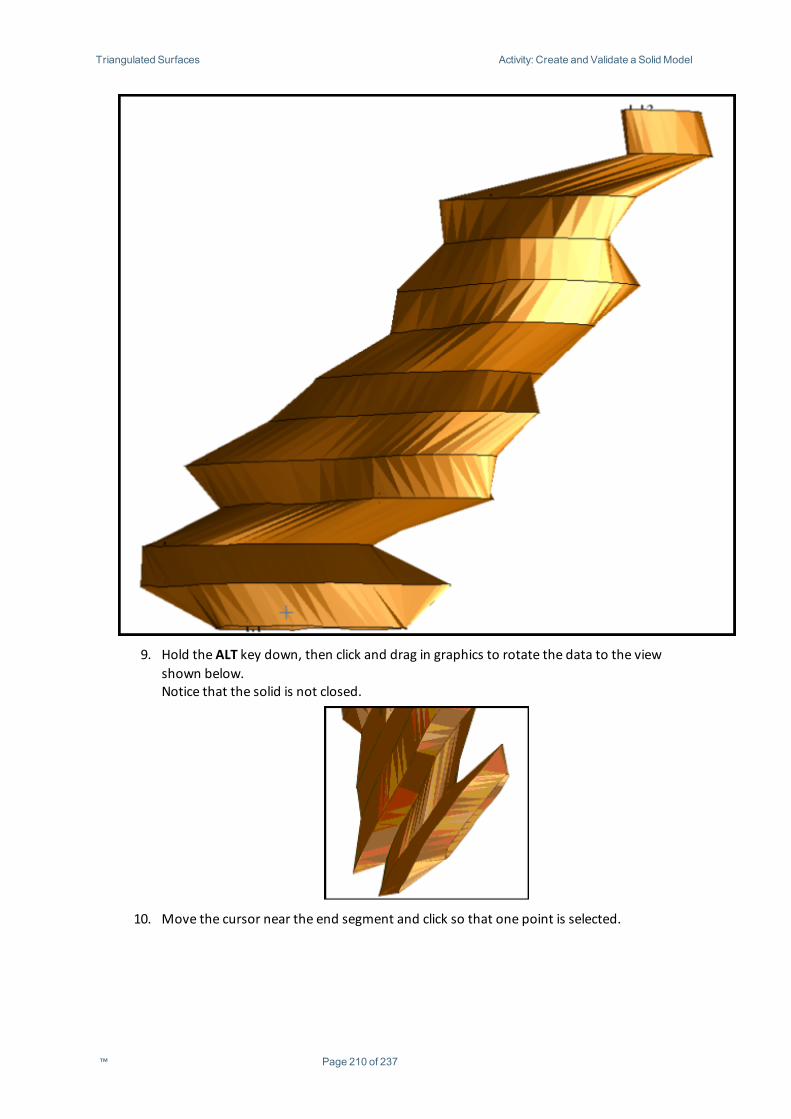
Triangulated Surfaces Activity: Create and Validate a Solid Model
9. Hold the ALT key down, then click and drag in graphics to rotate the data to the viewshown below.Notice that the solid is not closed.
10. Move the cursor near the end segment and click so that one point is selected.
™ Page 210 of 237
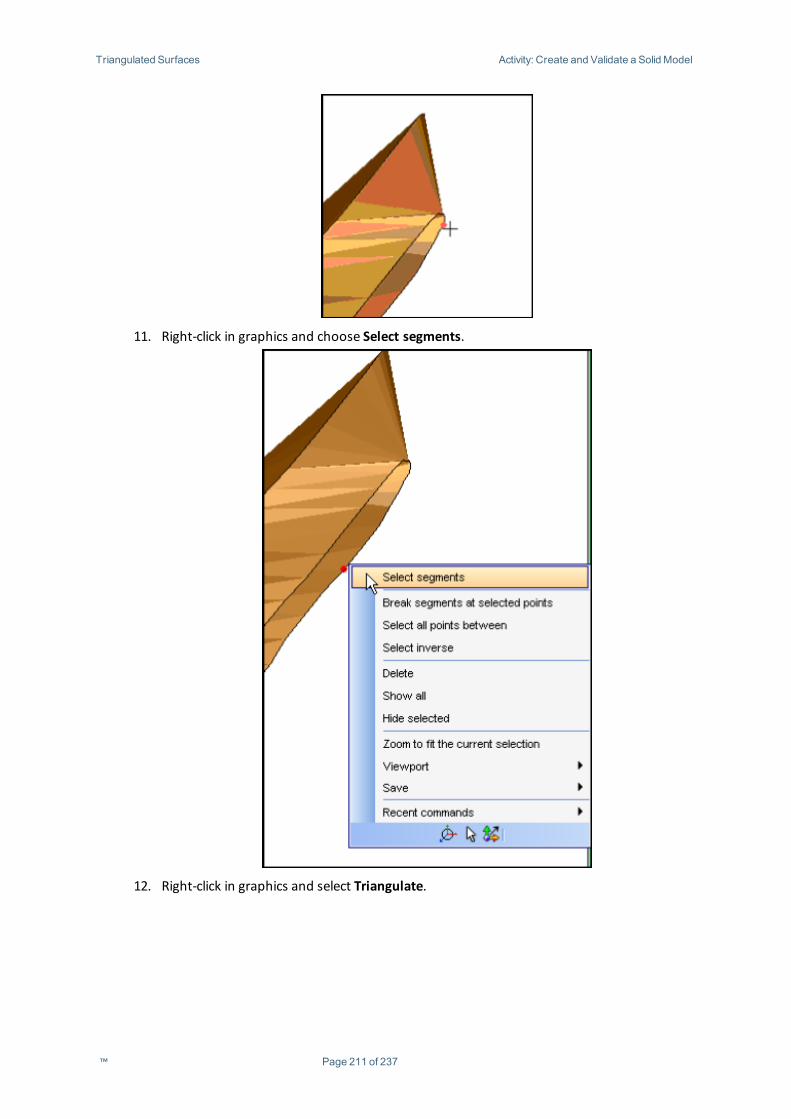
Triangulated Surfaces Activity: Create and Validate a Solid Model
11. Right-click in graphics and choose Select segments.
12. Right-click in graphics and select Triangulate.
™ Page 211 of 237
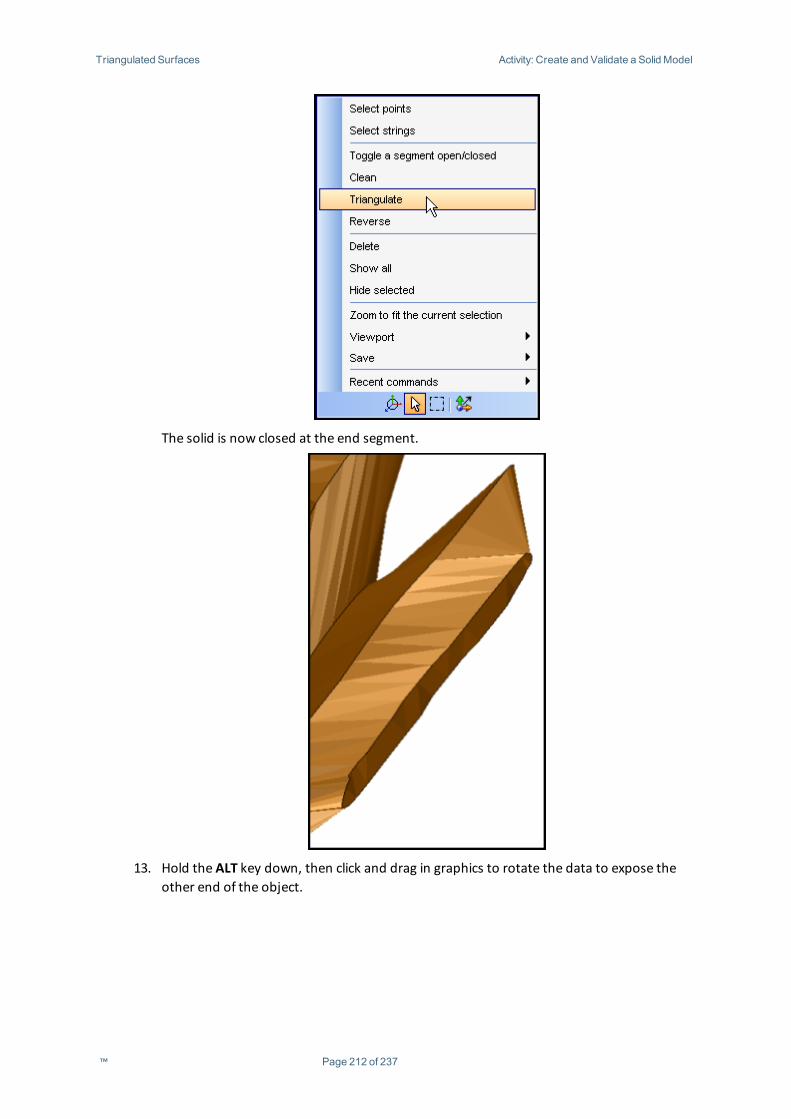
Triangulated Surfaces Activity: Create and Validate a Solid Model
The solid is now closed at the end segment.
13. Hold the ALT key down, then click and drag in graphics to rotate the data to expose theother end of the object.
™ Page 212 of 237
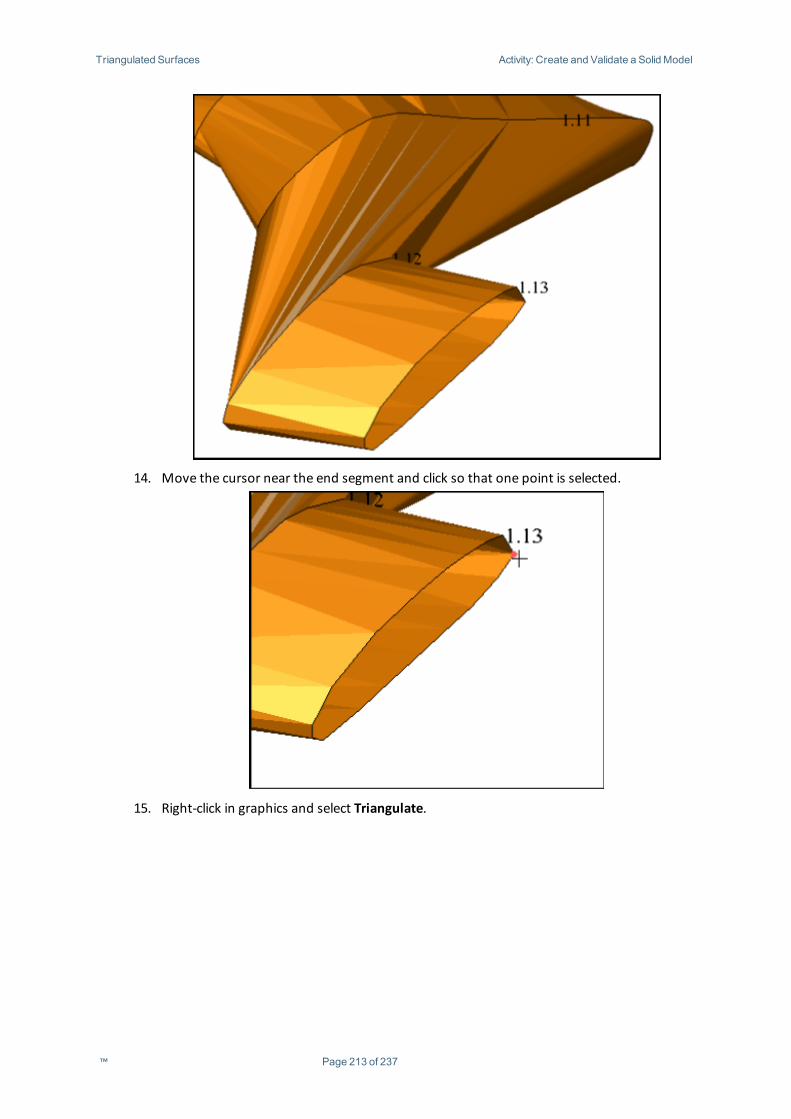
Triangulated Surfaces Activity: Create and Validate a Solid Model
14. Move the cursor near the end segment and click so that one point is selected.
15. Right-click in graphics and select Triangulate.
™ Page 213 of 237
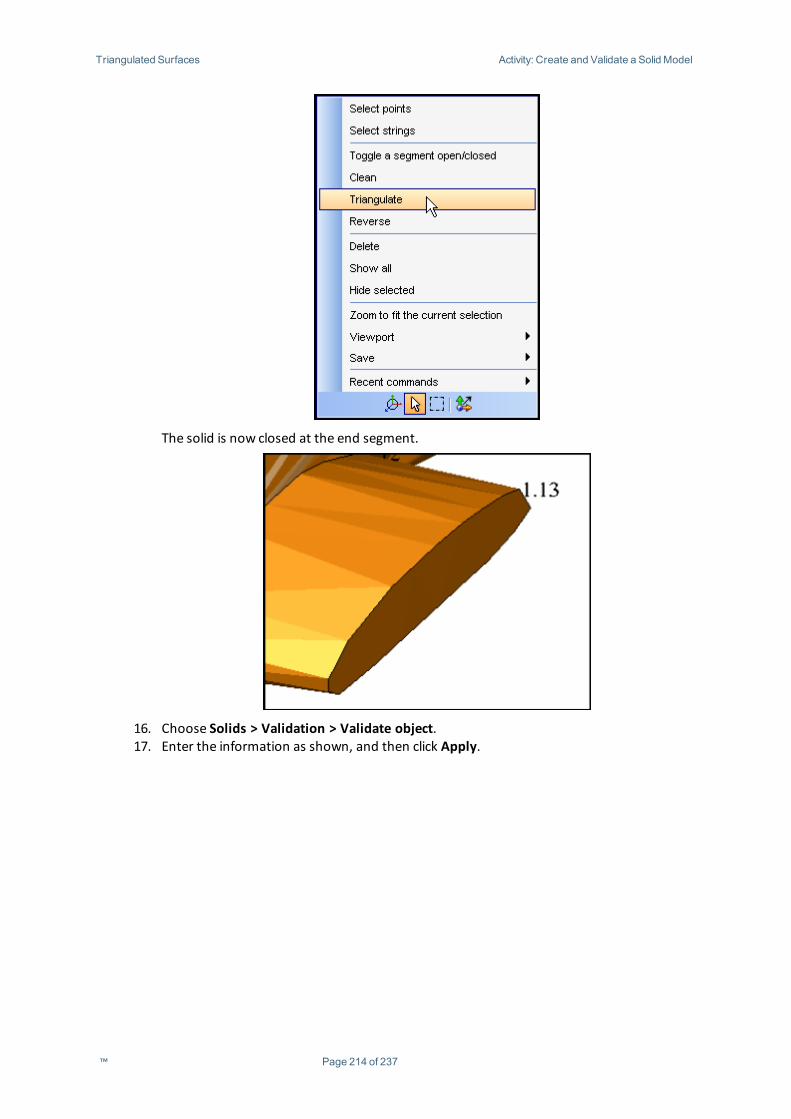
Triangulated Surfaces Activity: Create and Validate a Solid Model
The solid is now closed at the end segment.
16. Choose Solids > Validation > Validate object.17. Enter the information as shown, and then click Apply.
™ Page 214 of 237
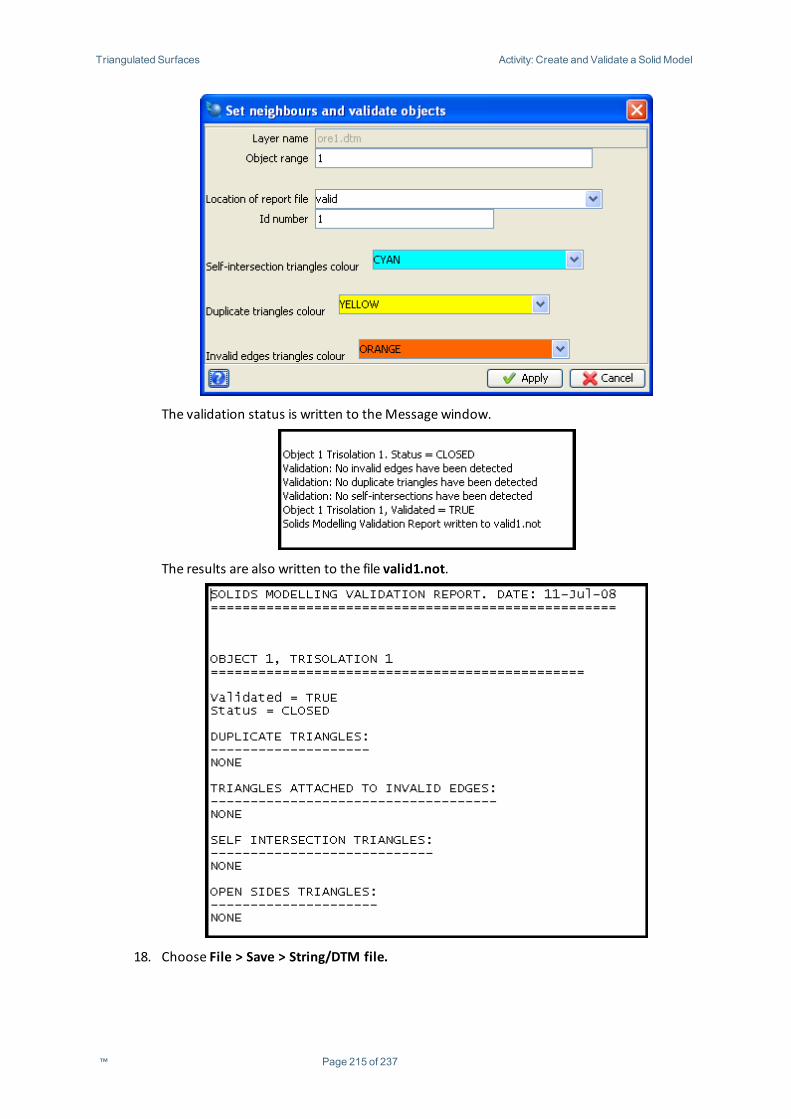
Triangulated Surfaces Activity: Create and Validate a Solid Model
The validation status is written to theMessage window.
The results are also written to the file valid1.not.
18. Choose File > Save > String/DTM file.
™ Page 215 of 237
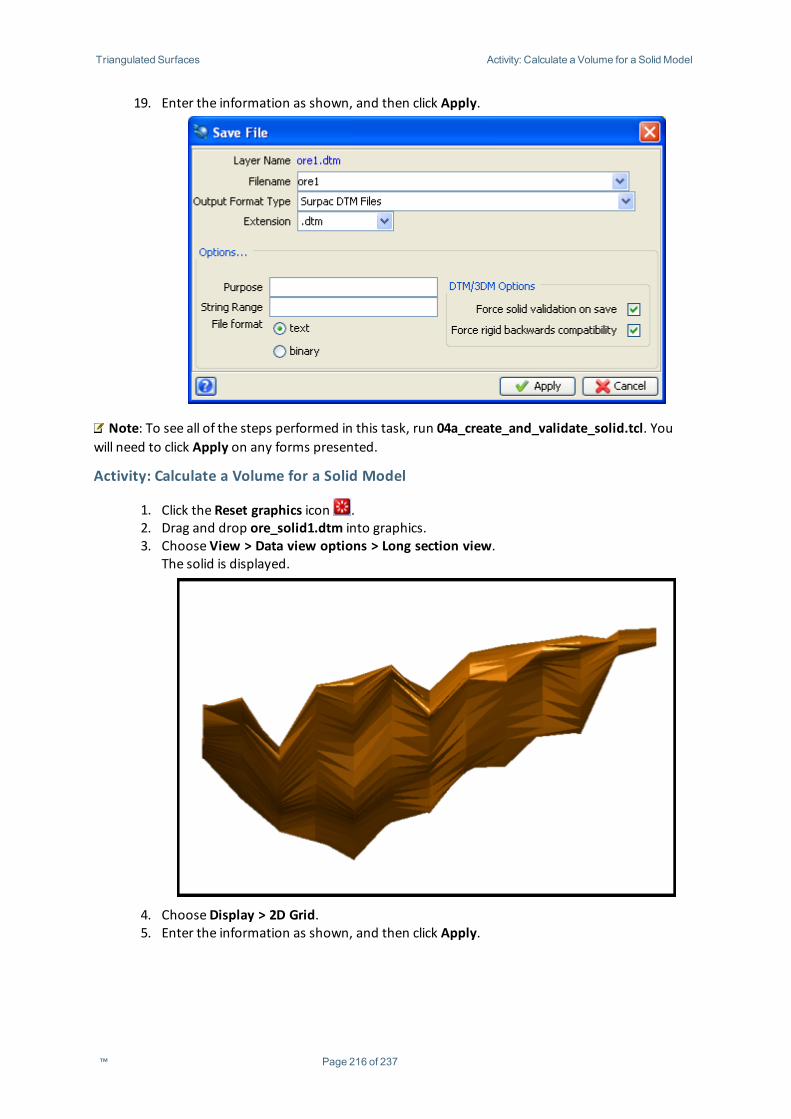
Triangulated Surfaces Activity: Calculate a Volume for a Solid Model
19. Enter the information as shown, and then click Apply.
Note: To see all of the steps performed in this task, run 04a_create_and_validate_solid.tcl. Youwill need to click Apply on any forms presented.
Activity: Calculate a Volume for a Solid Model
1. Click the Reset graphics icon .2. Drag and drop ore_solid1.dtm into graphics.3. Choose View > Data view options > Long section view.
The solid is displayed.
4. ChooseDisplay > 2D Grid.5. Enter the information as shown, and then click Apply.
™ Page 216 of 237
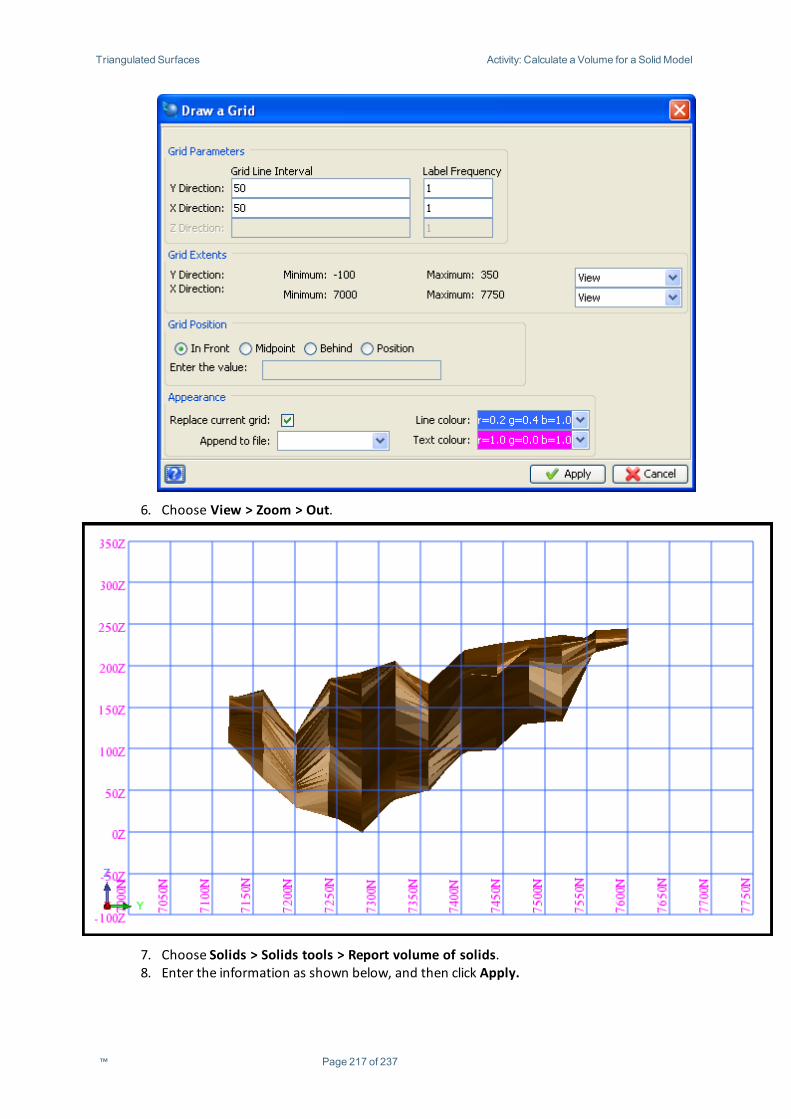
Triangulated Surfaces Activity: Calculate a Volume for a Solid Model
6. Choose View > Zoom > Out.
7. Choose Solids > Solids tools > Report volume of solids.8. Enter the information as shown below, and then click Apply.
™ Page 217 of 237
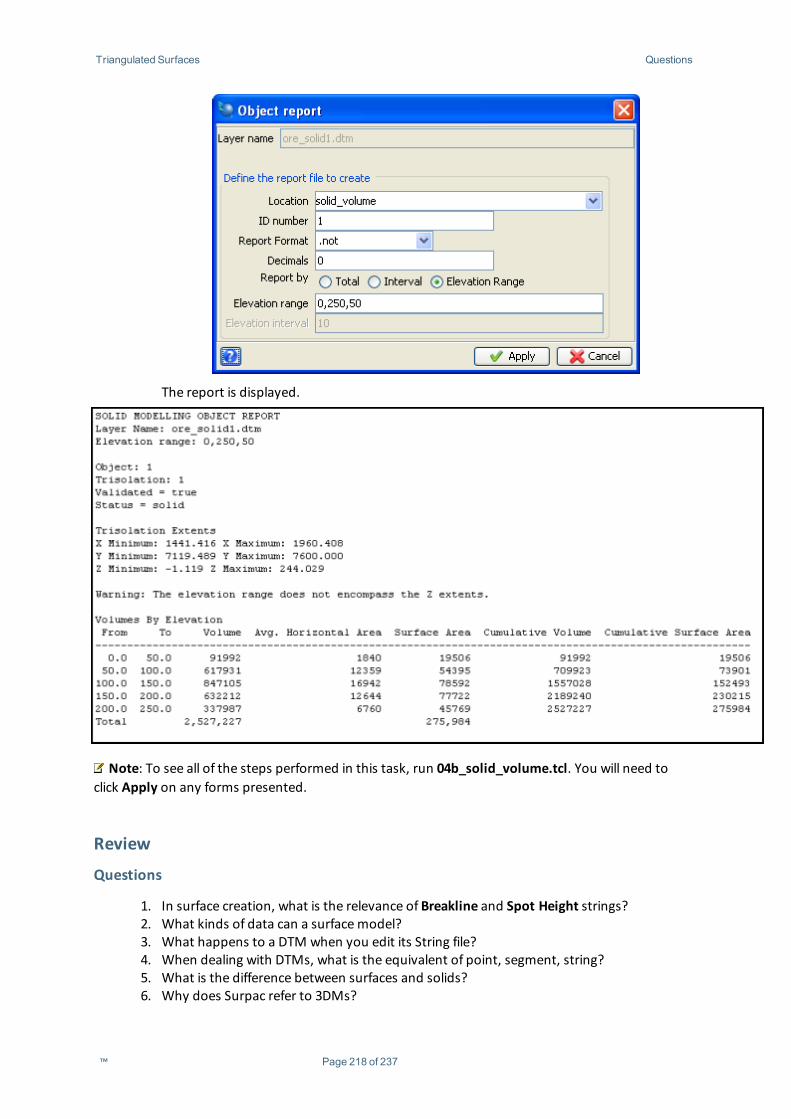
Triangulated Surfaces Questions
The report is displayed.
Note: To see all of the steps performed in this task, run 04b_solid_volume.tcl. You will need toclick Apply on any forms presented.
Review
Questions
1. In surface creation, what is the relevance of Breakline and Spot Height strings?2. What kinds of data can a surfacemodel?3. What happens to a DTM when you edit its String file?4. When dealing with DTMs, what is the equivalent of point, segment, string?5. What is the difference between surfaces and solids?6. Why does Surpac refer to 3DMs?
™ Page 218 of 237

Triangulated Surfaces Exercises
Exercises
1. Setting styles for DTMs.A. ChooseDisplay > Display properties > DTMs and 3DMs.B. Change the colour for object 1 to dark blue. Select the Transparency box and
set the colour to dark blue.C. Change the colour for object 2 to dark green. Select the Transparency box and
set the colour to dark green.D. Save the styles file when the form is applied.E. Open Topo_dump1.dtm in Graphics.F. Choose Surfaces > Object renumber, and renumber object to 2.G. Save file.H. Open Dump1.dtm in Graphics.
Questions:
i. Are the surfaces opaque?ii. Vary the transparency colour, what effects are seen?iii. When the topography .dtm file is saved, what warning appears and why?iv. What is the difference between setting transparency this way, or using the
Scale and Transparency toolbar?2. Merging DTMs.
A. Open Topo_dump1.dtm and Dump1.dtm in Graphics.B. Choose Surfaces > Clip or intersect DTMs > Upper triangles of 2 DTMs.C. Save the file asDump_in_topo.dtm.
Questions:
i. What kind of string file do you get from this function?ii. How useful is it?
3. Extracting contours from a surface.A. Open Dump_in_topo.dtm (or Topo_dump1.dtm) into Graphics.B. Choose Surfaces > Contouring > Contour DTM in layer.C. Extract contours every 5m from -175mRl ( or 10mRl ).
Question:
i. What happens to the contours you have just created if you Reset graphicsnow?
4. Draping data onto a surface.A. Open Topo1.dtm and Dhcollar1.str in Graphics.
Dhcollar1.strmust be the active layer.
B. Choose Surfaces > Drape string over DTM.C. Do not Interpolate new points.
Question:
i. What happens if Interpolate new points is selected?
™ Page 219 of 237
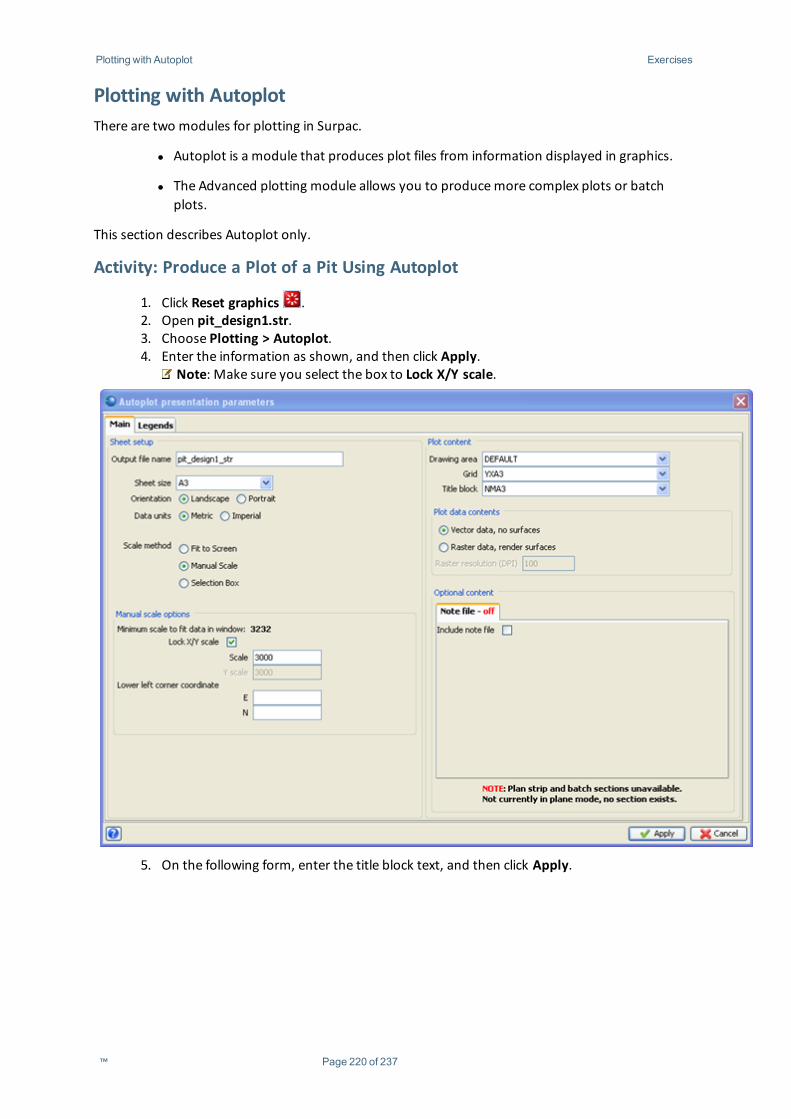
Plotting with Autoplot Exercises
Plotting with AutoplotThere are two modules for plotting in Surpac.
l Autoplot is a module that produces plot files from information displayed in graphics.
l The Advanced plotting module allows you to producemore complex plots or batchplots.
This section describes Autoplot only.
Activity: Produce a Plot of a Pit Using Autoplot
1. Click Reset graphics .2. Open pit_design1.str.3. Choose Plotting > Autoplot.4. Enter the information as shown, and then click Apply.
Note: Make sure you select the box to Lock X/Y scale.
5. On the following form, enter the title block text, and then click Apply.
™ Page 220 of 237
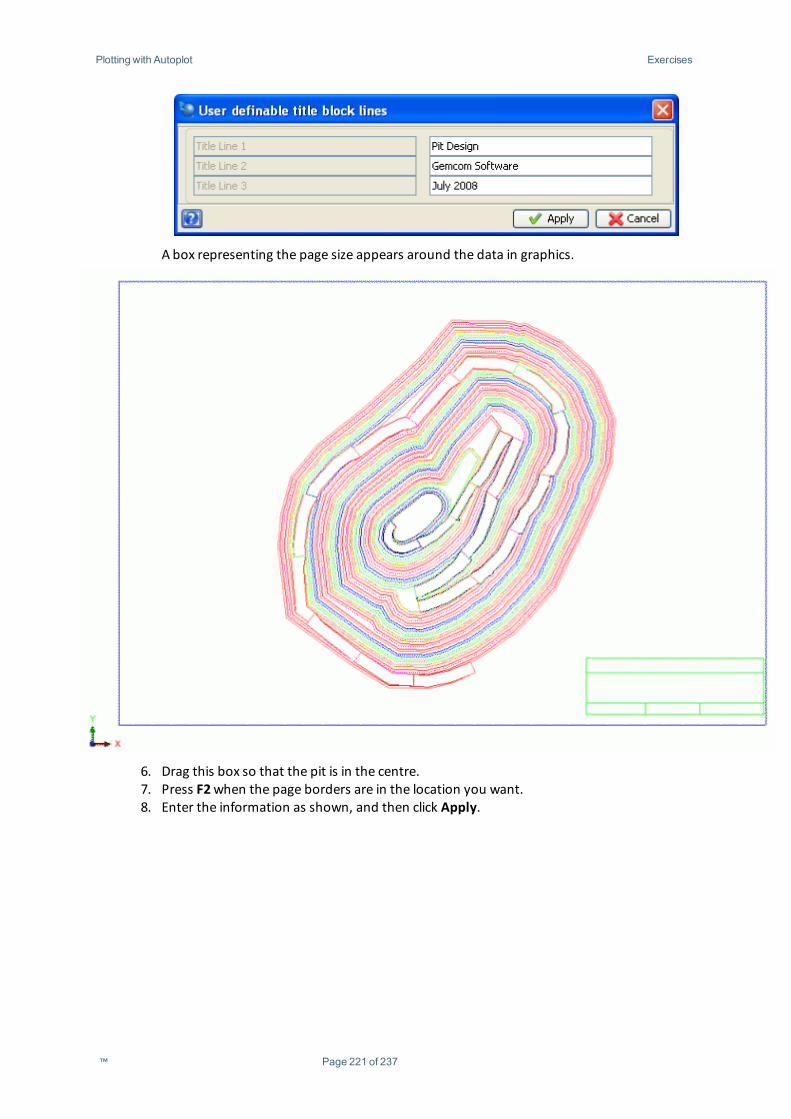
Plotting with Autoplot Exercises
A box representing the page size appears around the data in graphics.
6. Drag this box so that the pit is in the centre.7. Press F2when the page borders are in the location you want.8. Enter the information as shown, and then click Apply.
™ Page 221 of 237
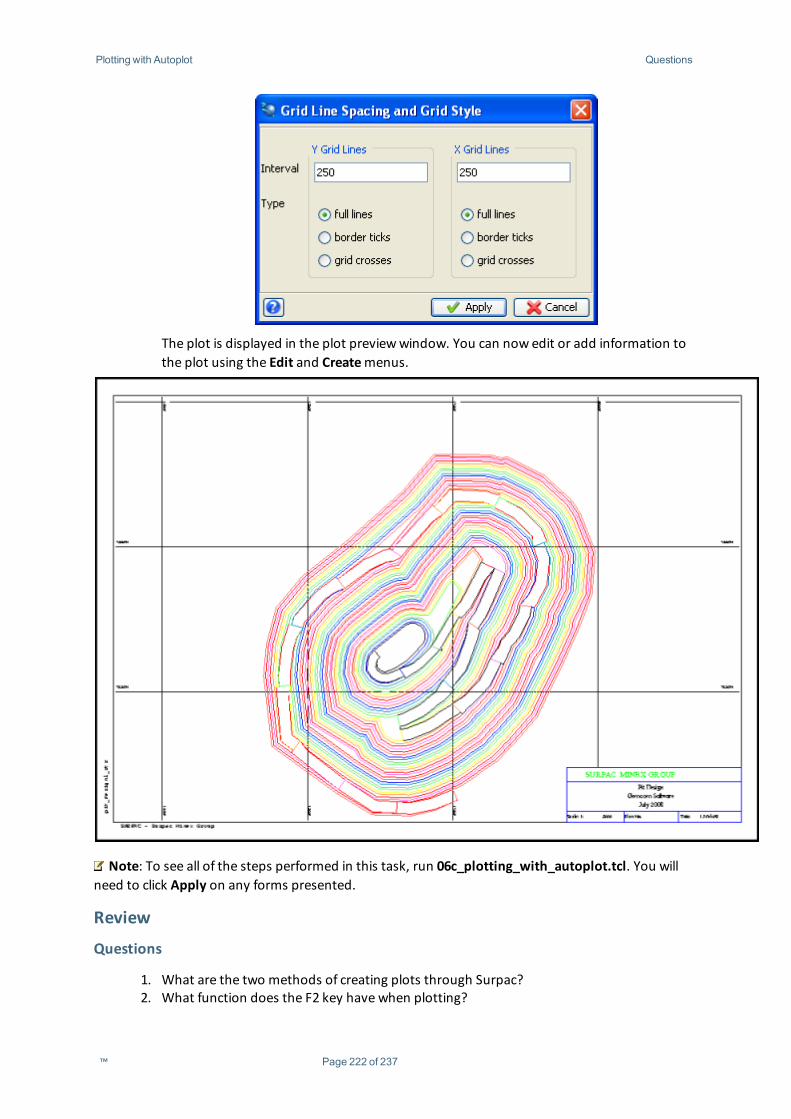
Plotting with Autoplot Questions
The plot is displayed in the plot previewwindow. You can now edit or add information tothe plot using the Edit and Createmenus.
Note: To see all of the steps performed in this task, run 06c_plotting_with_autoplot.tcl. You willneed to click Apply on any forms presented.
Review
Questions
1. What are the two methods of creating plots through Surpac?2. What function does the F2 key have when plotting?
™ Page 222 of 237

Plotting with Autoplot Exercises
3. What extension do plotfiles have?4. Where are plot files edited?
Exercises
1. Plotting rendered surfaces.A. Open topo1.dtm and Pit_design1.dtm in Graphics.B. Choose Plotting>Autoplot.C. Create a plotfile called Pit_topo.D. Use an A0 sheet at 1:1000 scale using Raster data with an XY Grid and no title
block.Questions:
i. What is theminimum scale to fit all the data on an A0 sheet?ii. What happens if vector data is chosen for this data?iii. What happens when the data is not on plane (plan / section)?
2. Create a PlotfileA. Reset Graphics.B. Open Pit_design1.str and Int_bench105.str in Graphics.C. ChooseDisplay>Display Properties>Strings and points.D. Display strings 1,2 and 3 as polygons.E. ChooseDisplay>Point>Attributes.F. Display theD1 field as a centroid.G. Autoplot on A1 at 1:500, XY grid every 100m with an NMA0 title block.H. Save the plot file asOre_105.dwf.
3. Edit a PlotfileA. Open Ore_105.dwf in Graphics.B. Use the selection tool to choose an item to edit. First that section of items
have to be ungrouped .C. Select the ore polygons and, using the selection properties box on the left,
change their colour to a light colour.D. Select the polygon centroids, change their colour and set them to bold.E. Use themove tool to move the centroids fully inside their polygon.F. Choose Create>Text to plot the text 'Ore in Pit' at 1.2cm high in the centre of
the plot.G. Save plot file asOre_105_edited.dwf.
™ Page 223 of 237
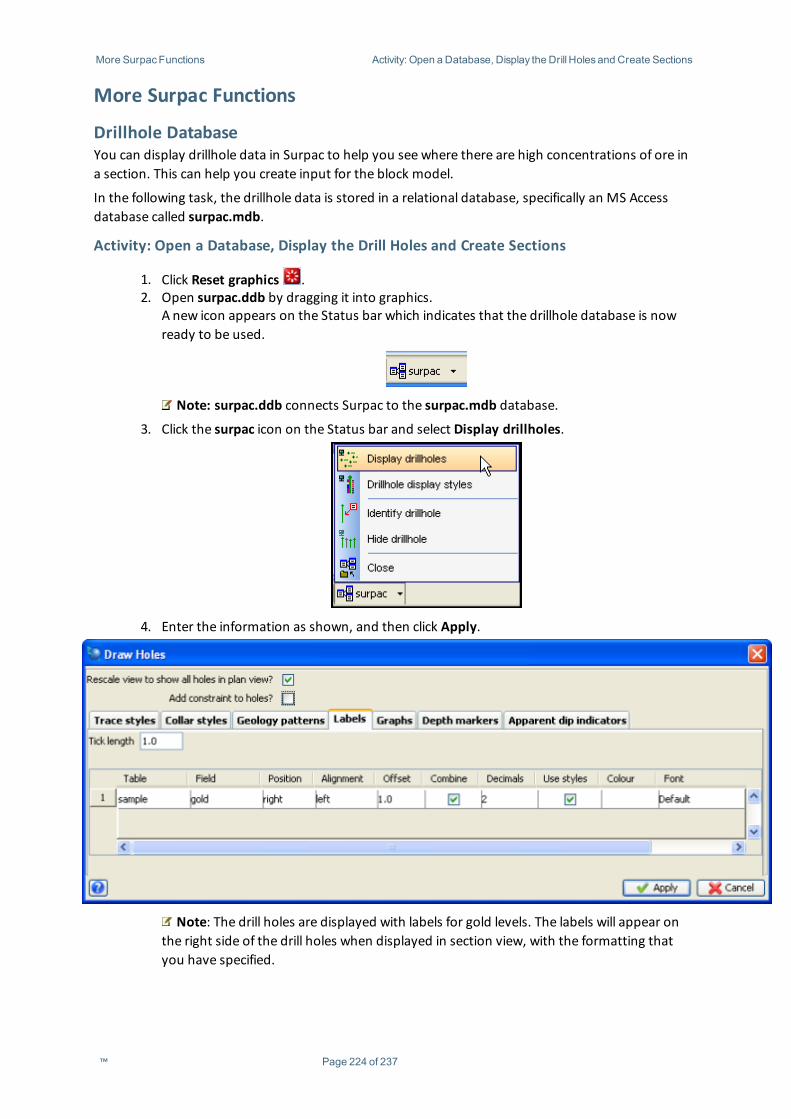
More SurpacFunctions Activity: Open a Database, Display the Drill Holesand Create Sections
More Surpac Functions
Drillhole DatabaseYou can display drillhole data in Surpac to help you see where there are high concentrations of ore ina section. This can help you create input for the block model.
In the following task, the drillhole data is stored in a relational database, specifically an MS Accessdatabase called surpac.mdb.
Activity: Open a Database, Display the Drill Holes and Create Sections
1. Click Reset graphics .2. Open surpac.ddb by dragging it into graphics.
A new icon appears on the Status bar which indicates that the drillhole database is nowready to be used.
Note: surpac.ddb connects Surpac to the surpac.mdb database.
3. Click the surpac icon on the Status bar and select Display drillholes.
4. Enter the information as shown, and then click Apply.
Note: The drill holes are displayed with labels for gold levels. The labels will appear onthe right side of the drill holes when displayed in section view, with the formatting thatyou have specified.
™ Page 224 of 237
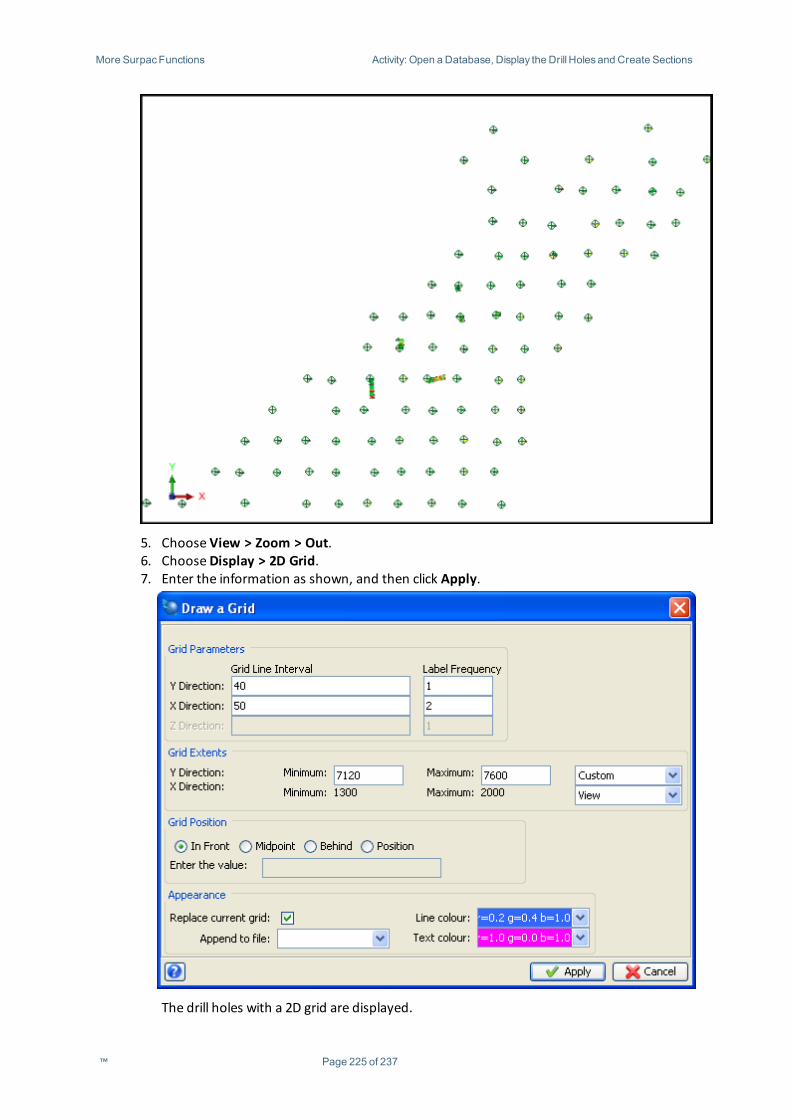
More SurpacFunctions Activity: Open a Database, Display the Drill Holesand Create Sections
5. Choose View > Zoom > Out.6. ChooseDisplay > 2D Grid.7. Enter the information as shown, and then click Apply.
The drill holes with a 2D grid are displayed.
™ Page 225 of 237
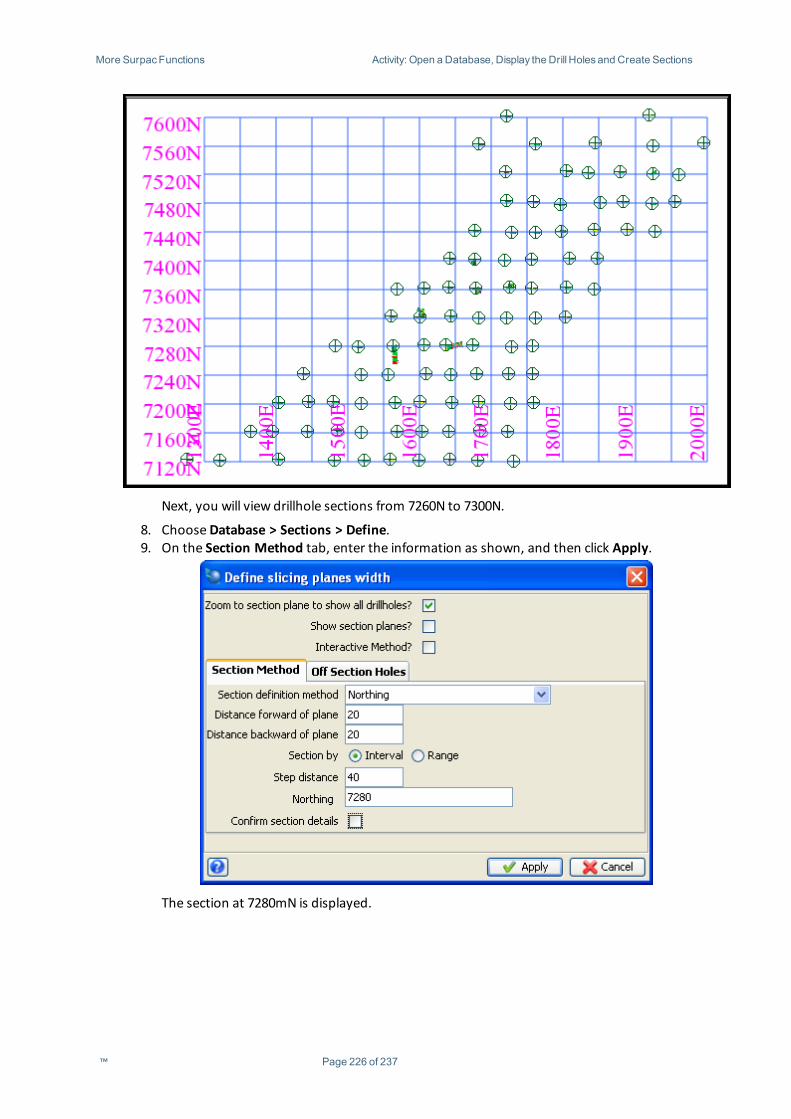
More SurpacFunctions Activity: Open a Database, Display the Drill Holesand Create Sections
Next, you will view drillhole sections from 7260N to 7300N.
8. ChooseDatabase > Sections > Define.9. On the Section Method tab, enter the information as shown, and then click Apply.
The section at 7280mN is displayed.
™ Page 226 of 237
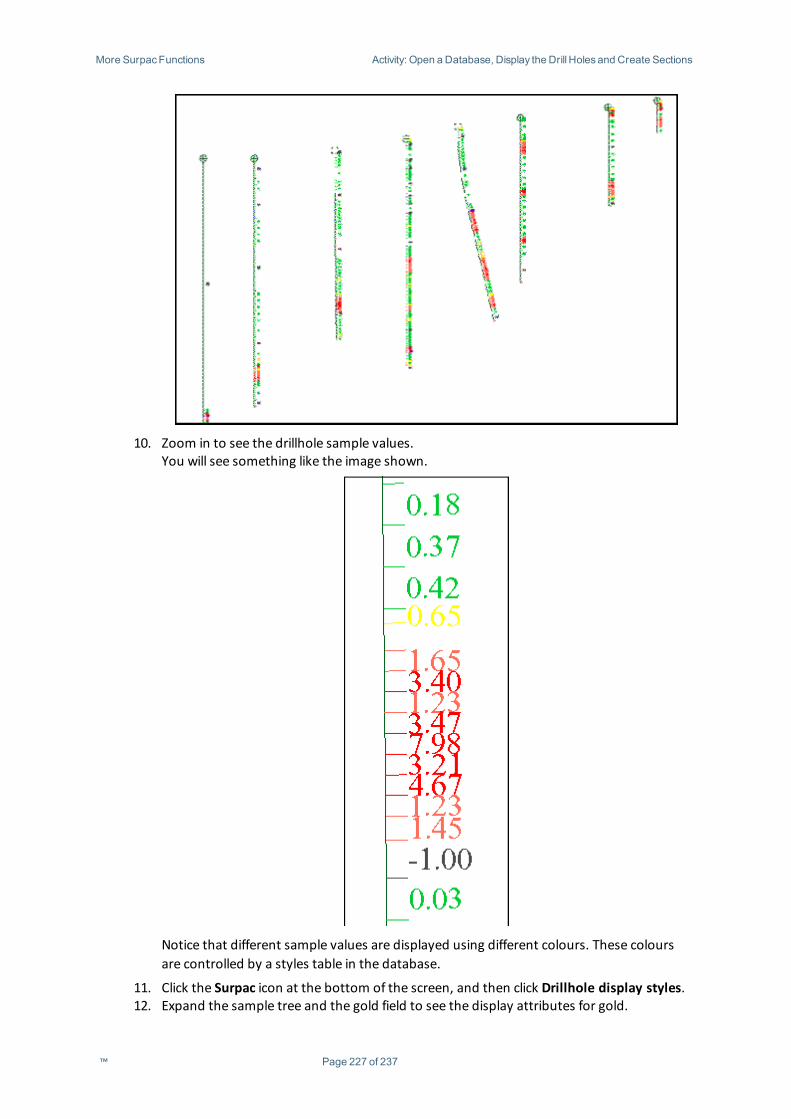
More SurpacFunctions Activity: Open a Database, Display the Drill Holesand Create Sections
10. Zoom in to see the drillhole sample values.You will see something like the image shown.
Notice that different sample values are displayed using different colours. These coloursare controlled by a styles table in the database.
11. Click the Surpac icon at the bottom of the screen, and then click Drillhole display styles.12. Expand the sample tree and the gold field to see the display attributes for gold.
™ Page 227 of 237
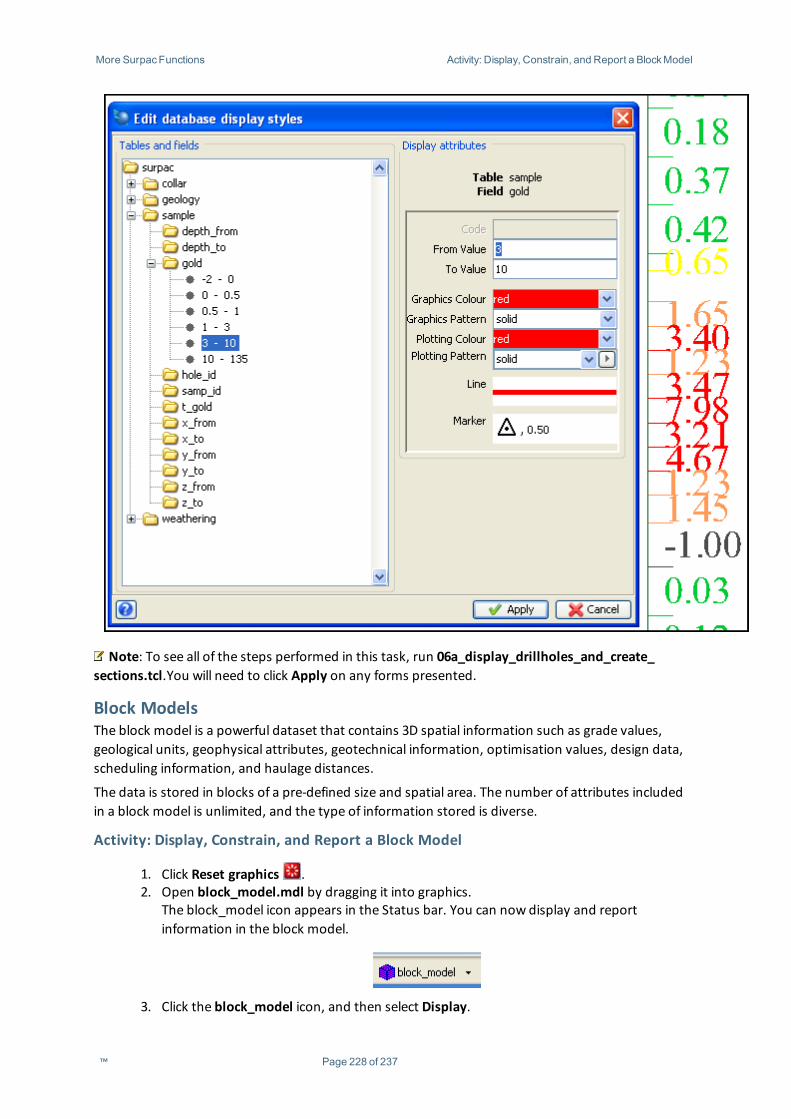
More SurpacFunctions Activity: Display, Constrain, and Report a BlockModel
Note: To see all of the steps performed in this task, run 06a_display_drillholes_and_create_sections.tcl.You will need to click Apply on any forms presented.
Block ModelsThe block model is a powerful dataset that contains 3D spatial information such as grade values,geological units, geophysical attributes, geotechnical information, optimisation values, design data,scheduling information, and haulage distances.
The data is stored in blocks of a pre-defined size and spatial area. The number of attributes includedin a block model is unlimited, and the type of information stored is diverse.
Activity: Display, Constrain, and Report a Block Model
1. Click Reset graphics .2. Open block_model.mdl by dragging it into graphics.
The block_model icon appears in the Status bar. You can now display and reportinformation in the block model.
3. Click the block_model icon, and then select Display.
™ Page 228 of 237
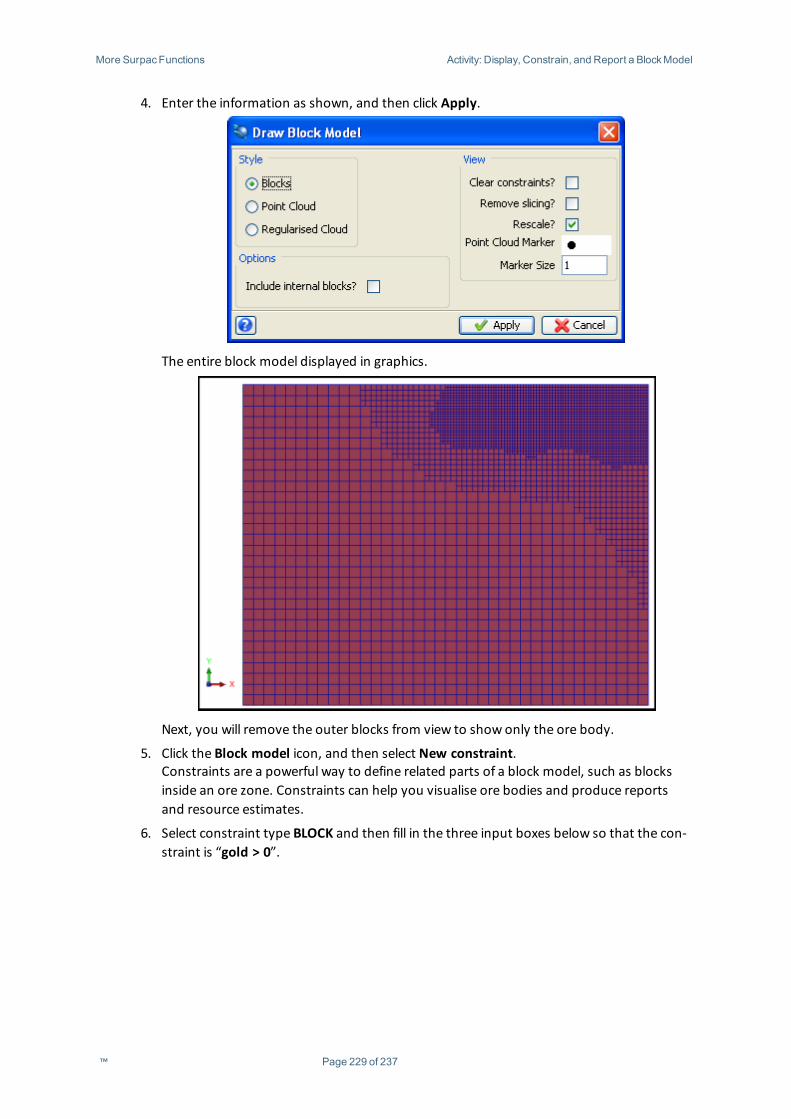
More SurpacFunctions Activity: Display, Constrain, and Report a BlockModel
4. Enter the information as shown, and then click Apply.
The entire block model displayed in graphics.
Next, you will remove the outer blocks from view to show only the ore body.
5. Click the Block model icon, and then select New constraint.Constraints are a powerful way to define related parts of a block model, such as blocksinside an ore zone. Constraints can help you visualise ore bodies and produce reportsand resource estimates.
6. Select constraint type BLOCK and then fill in the three input boxes below so that the con-straint is “gold > 0”.
™ Page 229 of 237
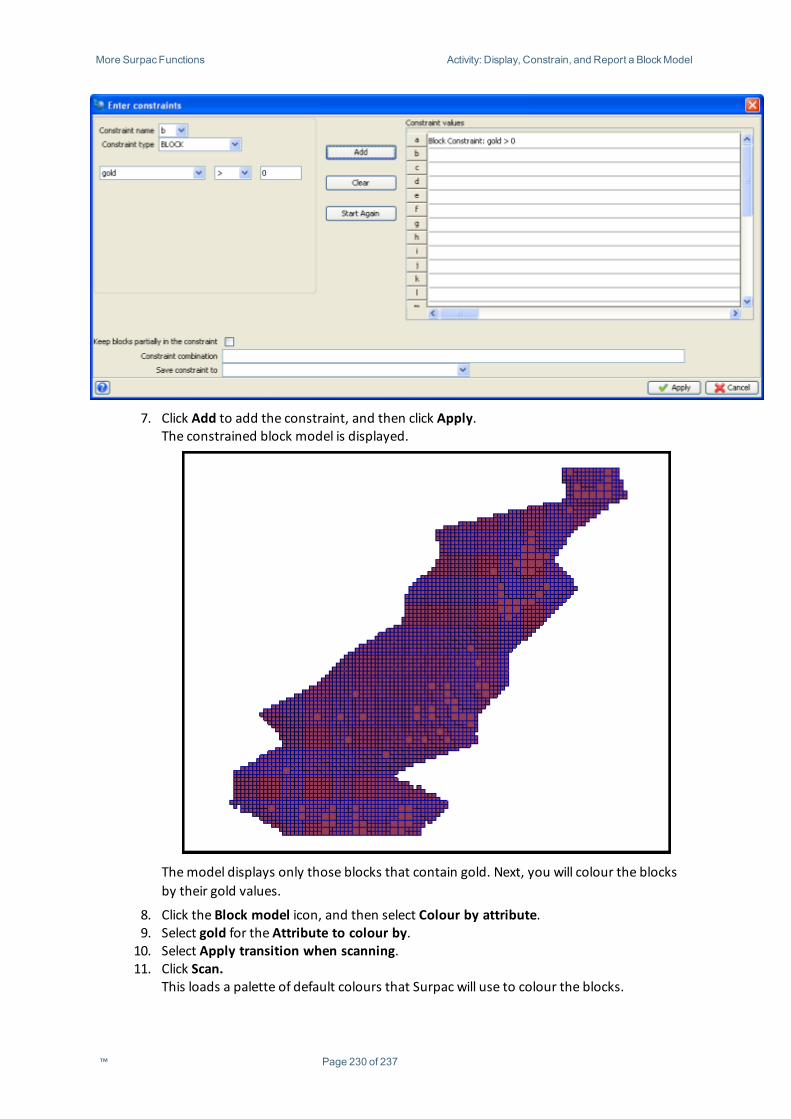
More SurpacFunctions Activity: Display, Constrain, and Report a BlockModel
7. Click Add to add the constraint, and then click Apply.The constrained block model is displayed.
Themodel displays only those blocks that contain gold. Next, you will colour the blocksby their gold values.
8. Click the Block model icon, and then select Colour by attribute.9. Select gold for the Attribute to colour by.10. Select Apply transition when scanning.11. Click Scan.
This loads a palette of default colours that Surpac will use to colour the blocks.
™ Page 230 of 237
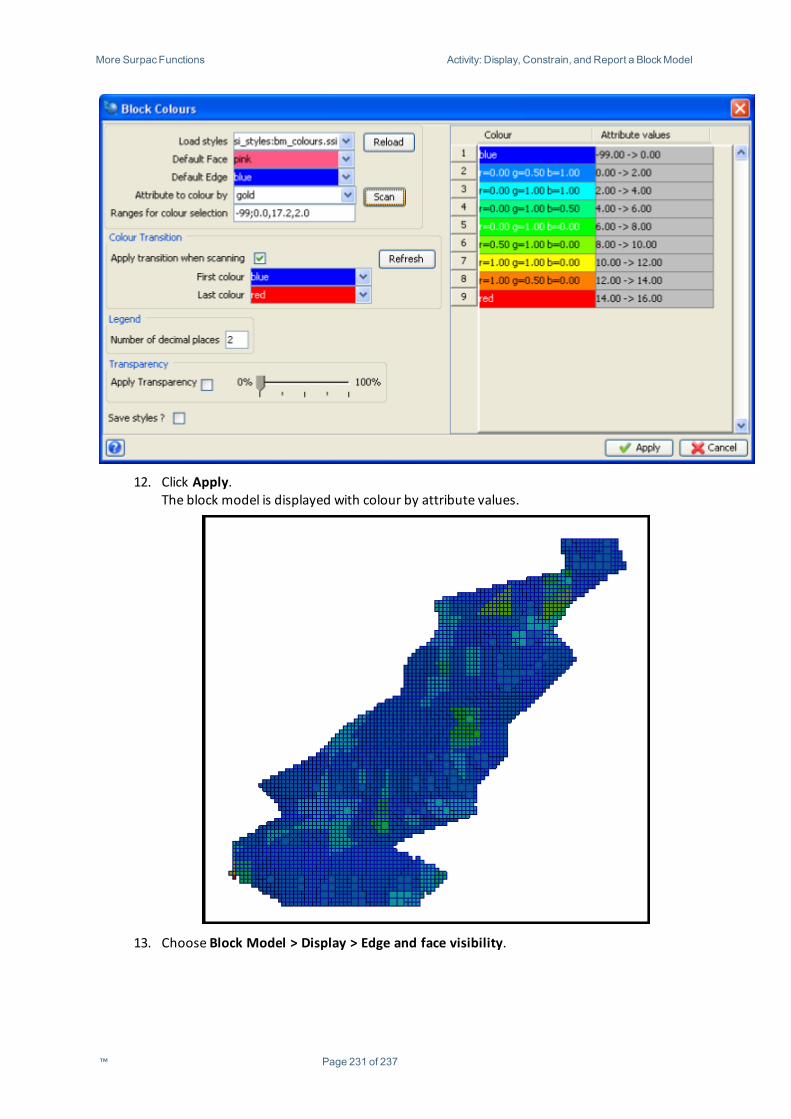
More SurpacFunctions Activity: Display, Constrain, and Report a BlockModel
12. Click Apply.The block model is displayed with colour by attribute values.
13. Choose Block Model > Display > Edge and face visibility.
™ Page 231 of 237
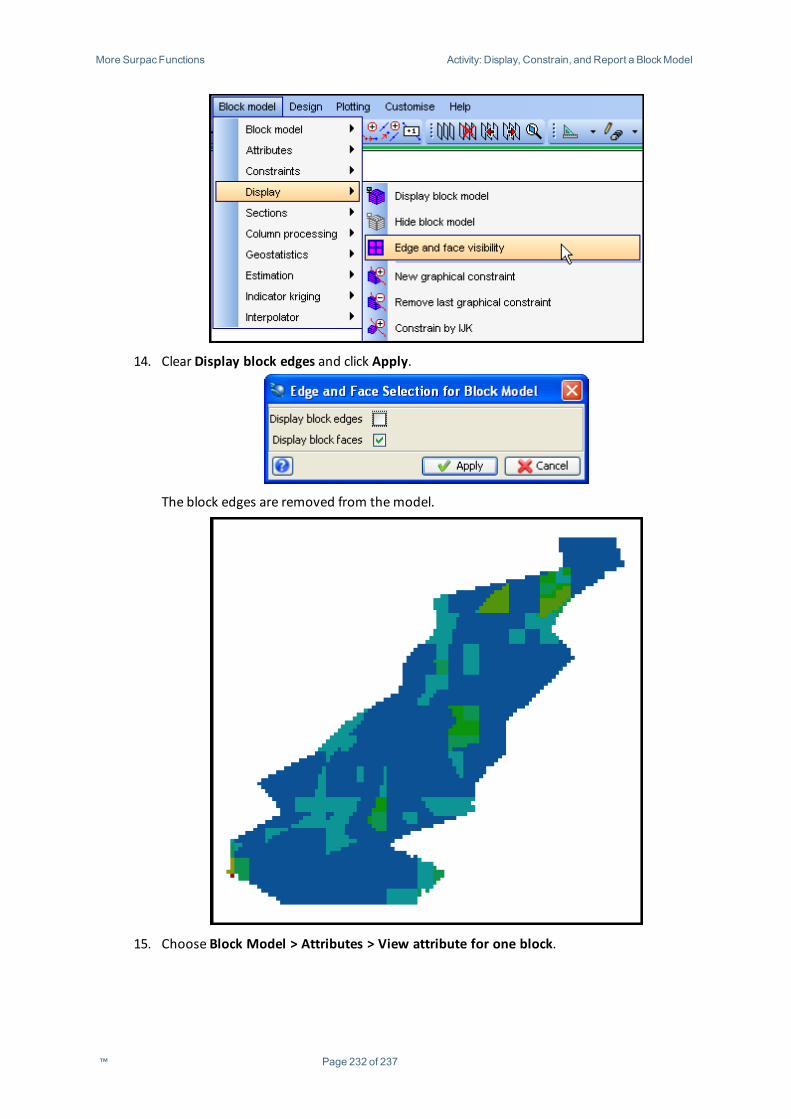
More SurpacFunctions Activity: Display, Constrain, and Report a BlockModel
14. Clear Display block edges and click Apply.
The block edges are removed from themodel.
15. Choose Block Model > Attributes > View attribute for one block.
™ Page 232 of 237
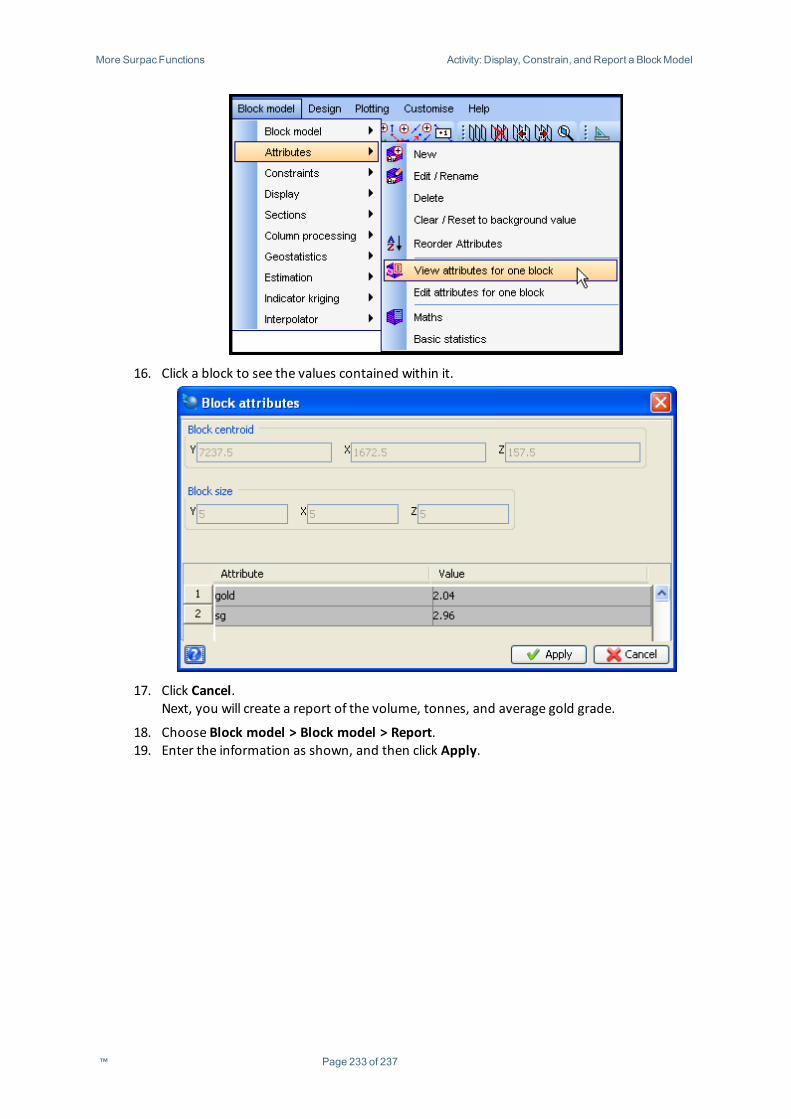
More SurpacFunctions Activity: Display, Constrain, and Report a BlockModel
16. Click a block to see the values contained within it.
17. Click Cancel.Next, you will create a report of the volume, tonnes, and average gold grade.
18. Choose Block model > Block model > Report.19. Enter the information as shown, and then click Apply.
™ Page 233 of 237
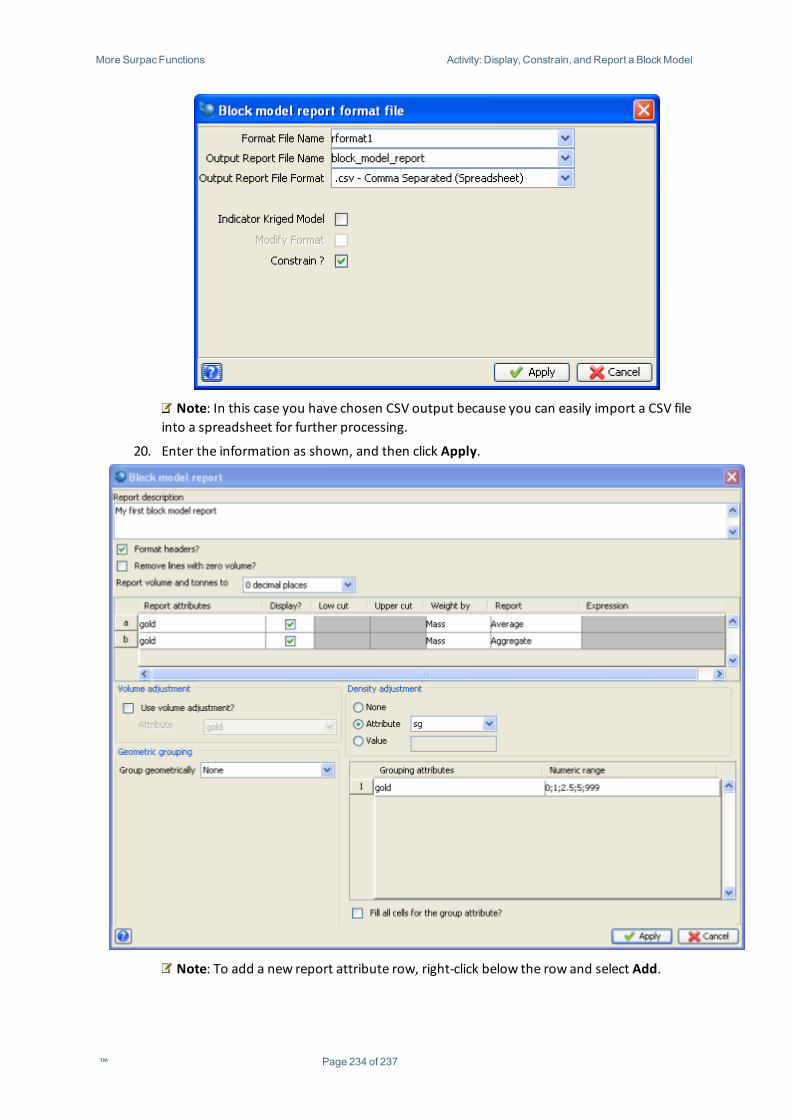
More SurpacFunctions Activity: Display, Constrain, and Report a BlockModel
Note: In this case you have chosen CSV output because you can easily import a CSV fileinto a spreadsheet for further processing.
20. Enter the information as shown, and then click Apply.
Note: To add a new report attribute row, right-click below the row and select Add.
™ Page 234 of 237
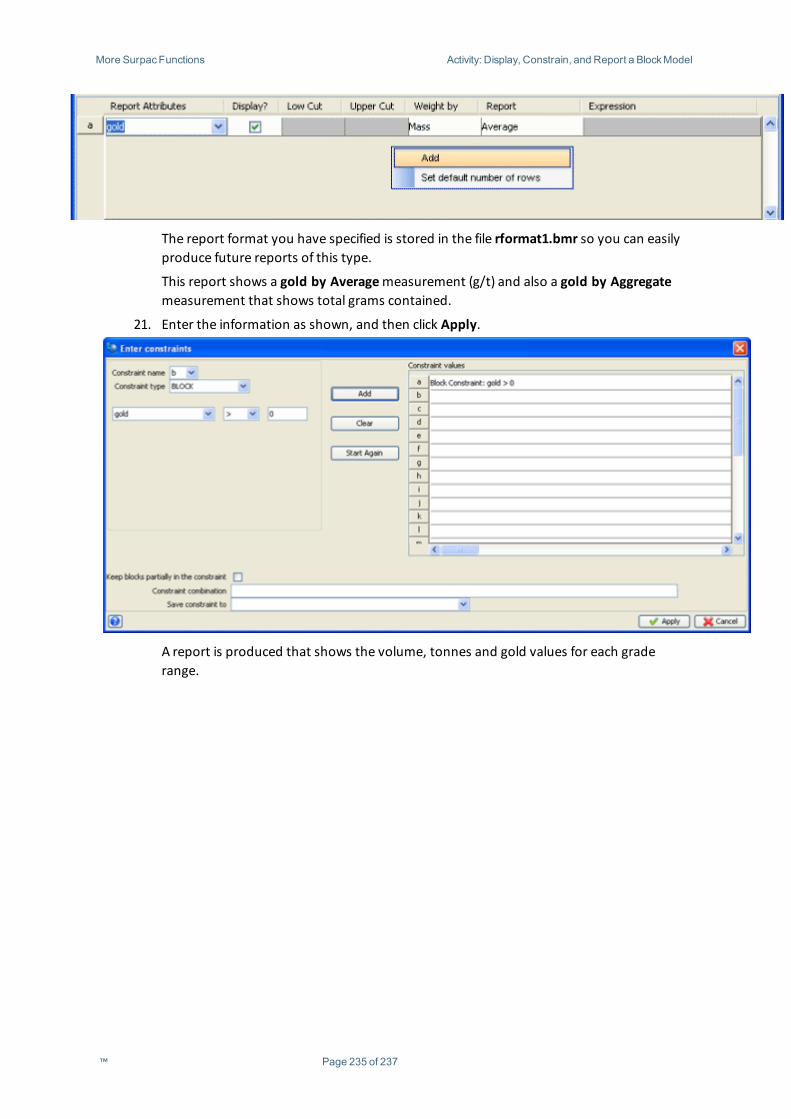
More SurpacFunctions Activity: Display, Constrain, and Report a BlockModel
The report format you have specified is stored in the file rformat1.bmr so you can easilyproduce future reports of this type.
This report shows a gold by Averagemeasurement (g/t) and also a gold by Aggregatemeasurement that shows total grams contained.
21. Enter the information as shown, and then click Apply.
A report is produced that shows the volume, tonnes and gold values for each graderange.
™ Page 235 of 237
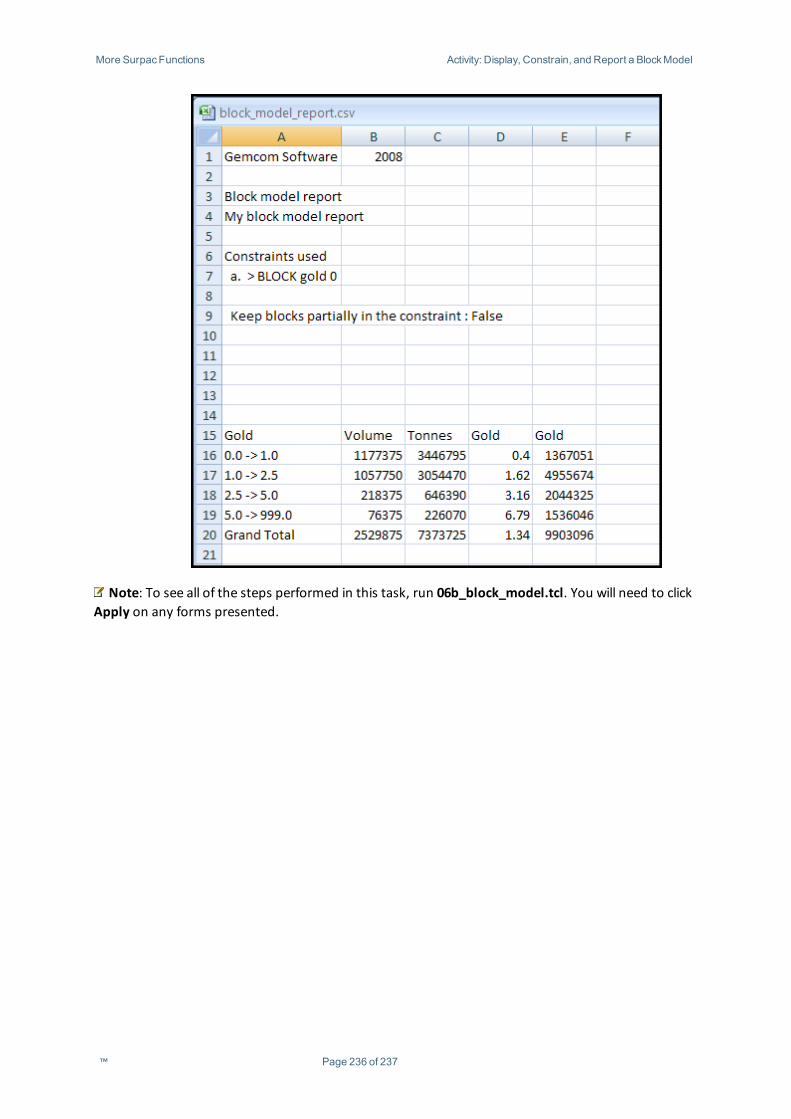
More SurpacFunctions Activity: Display, Constrain, and Report a BlockModel
Note: To see all of the steps performed in this task, run 06b_block_model.tcl. You will need to clickApply on any forms presented.
™ Page 236 of 237

References Activity: Display, Constrain, and Report a BlockModel
ReferencesFor more information, go to Gemcom's Customer Support website: www.gemcomsupport.com
™ Page 237 of 237