Embed Size (px)
Citation preview
Coral Reef Rugosity and Coral Biodiversity
Bunaken National Park, North Sulawesi, Indonesia
Mochamad Arif Zainul Fuad February, 2010

Coral reef Rugosity and Coral Biodiversity
Bunaken National Park- North Sulawesi, Indonesia
by Mochamad Arif Zainul Fuad
Thesis submitted to the International Institute for Geo-information Science and Earth Observation in partial fulfilment of the requirements for the degree of Master of Science in Geo-information Science and Earth Observation, Specialisation: Natural Resources Management Thesis Assessment Board Chair : Dr. A. Voinov (Department of Natural Resources, ITC) External Examiner : Dr. Bert W. Hoeksema (National Museum of Natural History, Leiden) First Supervisor : Drs. Eduard Westinga (Department of Natural Resources, ITC) Supervisors : Drs. Eduard Westinga (Department of Natural Resources, ITC) Dr. Martin Schlerf (Department of Natural Resources, ITC)
INTERNATIONAL INSTITUTE FOR GEO-INFORMATION SCIENCE AND EARTH OBSERVATION
ENSCHEDE, THE NETHERLANDS
Disclaimer This document describes work undertaken as part of a programme of study at the International Institute for Geo-information Science and Earth Observation. All views and opinions expressed therein remain the sole responsibility of the author, and do not necessarily represent those of the institute.
i
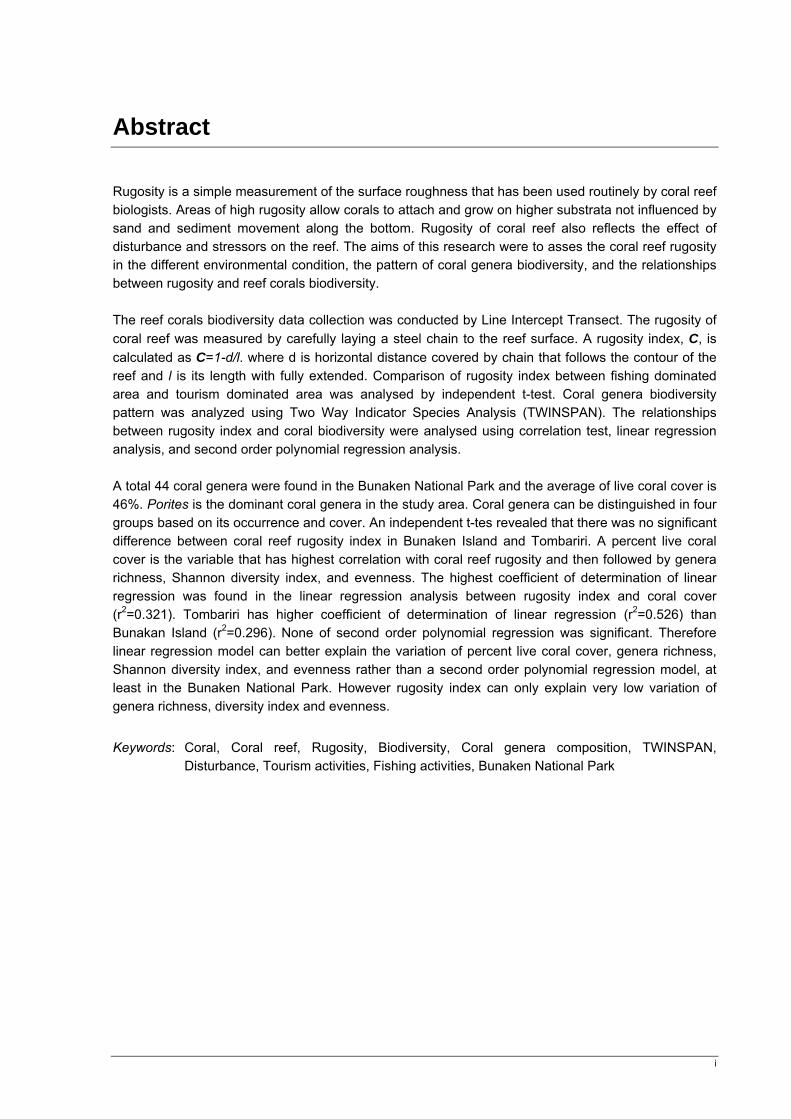
Abstract
Rugosity is a simple measurement of the surface roughness that has been used routinely by coral reef biologists. Areas of high rugosity allow corals to attach and grow on higher substrata not influenced by sand and sediment movement along the bottom. Rugosity of coral reef also reflects the effect of disturbance and stressors on the reef. The aims of this research were to asses the coral reef rugosity in the different environmental condition, the pattern of coral genera biodiversity, and the relationships between rugosity and reef corals biodiversity. The reef corals biodiversity data collection was conducted by Line Intercept Transect. The rugosity of coral reef was measured by carefully laying a steel chain to the reef surface. A rugosity index, C, is calculated as C=1-d/l. where d is horizontal distance covered by chain that follows the contour of the reef and l is its length with fully extended. Comparison of rugosity index between fishing dominated area and tourism dominated area was analysed by independent t-test. Coral genera biodiversity pattern was analyzed using Two Way Indicator Species Analysis (TWINSPAN). The relationships between rugosity index and coral biodiversity were analysed using correlation test, linear regression analysis, and second order polynomial regression analysis. A total 44 coral genera were found in the Bunaken National Park and the average of live coral cover is 46%. Porites is the dominant coral genera in the study area. Coral genera can be distinguished in four groups based on its occurrence and cover. An independent t-tes revealed that there was no significant difference between coral reef rugosity index in Bunaken Island and Tombariri. A percent live coral cover is the variable that has highest correlation with coral reef rugosity and then followed by genera richness, Shannon diversity index, and evenness. The highest coefficient of determination of linear regression was found in the linear regression analysis between rugosity index and coral cover (r2=0.321). Tombariri has higher coefficient of determination of linear regression (r2=0.526) than Bunakan Island (r2=0.296). None of second order polynomial regression was significant. Therefore linear regression model can better explain the variation of percent live coral cover, genera richness, Shannon diversity index, and evenness rather than a second order polynomial regression model, at least in the Bunaken National Park. However rugosity index can only explain very low variation of genera richness, diversity index and evenness.
Keywords: Coral, Coral reef, Rugosity, Biodiversity, Coral genera composition, TWINSPAN, Disturbance, Tourism activities, Fishing activities, Bunaken National Park
ii
Acknowledgements
Alhamdulilahi Rabbil Alamin, Praise to Allah SWT, the most gracious and merciful, who gave His guidance, will and strength so that I could finish my study in ITC. First and foremost, I would give many great full and appreciate to my first supervisor, Drs. Eduard Westinga. Thanks for inspiring discussion during research preparation, great and instructive field work and insightful comment during thesis writing; my second supervisor Dr. Martin Schlerf for valuable suggestion and critical comment during proposal defense and mid-term presentation. I would like to acknowledge the Directorate general of higher education, Indonesia (DIKTI) for giving me a great opportunity to study in the Netherlands, to Brawijaya University for study leave permission and support during my study in ITC. I would like also to give an appreciation to Dr. Michael Weir and Ms. Ceciel Wolters and all ITC-NRM staffs who gave me a good academic atmosphere to learn many new things about remote sensing and GIS. My sincere gratitude goes to Mas Winardi who always encourages and helps me during fieldwork and coral genera identifications. I’m grateful to my fieldwork mates Juan Pablo S Rojas; I hope we could fieldwork together in the next coral reef project. My cluster mates: Joon, Chia chi, Abel, Jones, Ngula, Brandon, Shirin, Simona; My Indonesian Fellows Mas Sigit, Arin, Yusi, Ledhy, Mbak Yanti, Bang Daniel, Dita, mbak Dewi, Mbak Lizda, mas Syarif, Bruggers, ST-16,Coppenstrates, and others whom I cannot mention one by one, Thank you being my family in the Netherlands. Finally, my deepest gratitude goes to my lovely wife Ririn F. for her remote encouragement, endless support that gave to me during the completion of my study in ITC. To my family, Bapak Ibu dan adik-adik that always praying for my success. M. Arif Zainul Fuad Enschede, the Netherlands February 2010
iii
Table of Contents 1. Introduction..................................................................................................................... 1
1.1. Background ..............................................................................................................................1 1.1.1. Coral Reef...........................................................................................................................2 1.1.2. Coral Reef Rugosity............................................................................................................3 1.1.3. Disturbance on Coral reef...................................................................................................4
1.2. Research Problems..................................................................................................................5 1.3. Research Objectives ................................................................................................................6
1.3.1. Main Objective ....................................................................................................................6 1.3.2. Specific Objectives .............................................................................................................6
1.4. Research Questions.................................................................................................................6 1.5. Research Hypotheses ..............................................................................................................6
2. Material and Methods..................................................................................................... 7
2.1. Study Area................................................................................................................................7 2.2. General Methodology ...............................................................................................................8 2.3. Sampling Design ......................................................................................................................9 2.4. Data Collection ...................................................................................................................... 10
2.4.1. Fieldwork Preparation...................................................................................................... 10 2.4.2. Benthic Cover Estimation ................................................................................................ 10 2.4.3. Coral Biodiversity Data Collection ................................................................................... 11 2.4.4. Coral Reef Rugosity Measurement ................................................................................. 12
2.5. Data Analysis......................................................................................................................... 13 2.5.1. Coral biodiversity Data..................................................................................................... 13 2.5.2. Coral Genera Composition .............................................................................................. 13 2.5.3. Coral Reef Rugosity......................................................................................................... 14 2.5.4. Relationship Between Rugosity and Coral biodiversity................................................... 14
3. Result............................................................................................................................. 17
3.1. Benthic Map........................................................................................................................... 17 3.1.1. Accuracy Assesment ....................................................................................................... 19 3.1.2. Comparison between Benthic Cover by Estimation and Measurement.......................... 19
3.2. Coral Cover in The Coral Zone ............................................................................................. 20 3.3. Coral Biodiversity in The Coral Zone..................................................................................... 21
3.3.1. Genera Richness ............................................................................................................. 22 3.3.2. Diversity Index ................................................................................................................. 23 3.3.3. Evenness ......................................................................................................................... 24 3.3.4. Dominant Genera ............................................................................................................ 25 3.3.5. Coral Genera Composition .............................................................................................. 26
3.4. Coral Reef Rugosity .............................................................................................................. 29 3.5. Relationships between Rugosity and Coral Cover................................................................ 30 3.6. Relationships between Rugosity and Coral Biodiversity....................................................... 31
3.6.1. Rugosity-Coral Genera Richness Relationship............................................................... 31 3.6.2. Rugosity-Diversity Index Relationship ............................................................................. 33 3.6.3. Rugosity-Genera Evenness Relationship........................................................................ 34
iv
4. Discussion..................................................................................................................... 35 4.1. Coral Cover in The Coral Zone.............................................................................................. 35 4.2. Coral Biodiversity................................................................................................................... 35 4.3. Comparing Coral Reef Rugosity In The Different Environmental Condition ......................... 36 4.4. Relationship between Rugosity-Coral Cover, and Coral Biodiversity ................................... 39 4.5. Limitation of The Research.................................................................................................... 40
5. Conclusions and Recommendation............................................................................ 41
5.1. Conclusions ........................................................................................................................... 41 5.2. Recommendation................................................................................................................... 41
Bibliography ......................................................................................................................... 43 Appendices........................................................................................................................... 47
Appendix A. Aerial Photograph of study area downloaded from Google Image............................... 47 Appendix B Benthic estimation sample points .................................................................................. 48 Appendix C.Coral genera found and Its percent Cover .................................................................... 52 Appendix D. Benthic cover and its Coverage.................................................................................... 55 Appendix E. Correlation test.............................................................................................................. 57 Appendix F. Independent t-test ......................................................................................................... 59 Appendix G. Dive sites map of Bunaken Island ................................................................................ 60
v
List of Figures Figure 1 The Diagrammatic Showing the Principal Types of Reef (Veron 1986) ....................................3 Figure 2 Study Area..................................................................................................................................8 Figure 3 Research Flowchart ...................................................................................................................9 Figure 4 Samplet Location: Tombariri ......................................................................................................9 Figure 5 Sample Location: Bunaken ..................................................................................................... 10 Figure 6 Line Intercepts Transect Method ............................................................................................ 12 Figure 7 Rugosity Measurement ........................................................................................................... 12 Figure 8.Coral biodiversity and Rugosity Measurement ....................................................................... 13 Figure 9 Bunaken Benthic Map............................................................................................................. 18 Figure 10 Tombariri Benthic map.......................................................................................................... 18 Figure 11 Linear Regression Analysis between Coral Cover by Estimation and Measurement .......... 20 Figure 12 Comparison of Percent Coral cover in Tombariri and Bunaken Island. ............................... 21 Figure 13 Coral Cover Map ................................................................................................................... 21 Figure 14 Comparison between Coral Genera Richness in Bunaken Island and Tombariri ................ 22 Figure 15 Coral Genera Richness Map................................................................................................. 22 Figure 16 Comparison of Diversity Index in Tombariri and Bunaken Island......................................... 23 Figure 17 Shannon Diversity Index Map ............................................................................................... 23 Figure 18 Comparison of Coral Genera Evennes in Tombariri and Bunaken Island............................ 24 Figure 19 Coral Genera Evenness Map................................................................................................ 24 Figure 20 Dominant Coral Genera in the Study Area ........................................................................... 25 Figure 21 Dominant Genus Map in Bunaken Island and Tombariri. ..................................................... 26 Figure 22 Coral Genera Composition Map ........................................................................................... 27 Figure 23 Comparison of Rugosity Index between Bunaken Island and Tombariri.............................. 29 Figure 24 Rugosity Index Map of Bunaken Island and Tombariri ......................................................... 30 Figure 25 Relationship between Rugosity and Coral Cover ................................................................. 31 Figure 26 Rugosity –Genera Richness Relationship ............................................................................ 32 Figure 27 Rugosity-Diversity Index Relationships ................................................................................ 33 Figure 28 Rugosity-Evenness Relationships ....................................................................................... 34
vi
List of Tables Table 1 List of Bottom Types................................................................................................................. 11 Table 2 List of Benthic Categories ........................................................................................................ 12 Table 3 Classification Scheme for Benthic Classess ............................................................................ 17 Table 4 Accuracy Assessment .............................................................................................................. 19 Table 5 Comparison between Coral Cover Estimation and Measurement........................................... 20 Table 6 Coral Genera Composition....................................................................................................... 28 Table 7 Classification and Proportion of Rugosity Index in Bunaken Marine National Park................. 29
CORAL REEF RUGOSITY AND CORAL BIODIVERSITY
1
1. Introduction
1.1. Background Coral reefs are highly dynamic and productive marine ecosystems. Coral reefs occur in tropical and
sub tropical regions (Wilkinson and Buddemeier 1994). They provide habitat for a number of marine
organisms including fish, algae, vertebrates, and invertebrates (Alquezar and Boyd 2007). Coral reefs
are not only one of the most spectacular marine ecosystems on the Earth, but also offering valuable
economic resources for the people living along the coast (Bertels et al. 2008).
Coral reefs ecosystems are endangered. It is generally caused by the unsustainable human
exploitation and pollution, also by global climate change. Anthropogenic disturbances have
threatened the coral reef biodiversity. The protection and management of the coral reefs are not only
important for the coral reef habitat itself, but also for local people that mainly depend on it as a natural
resource. The reefs represent substantial resources in the form of food or as tourist attraction for
humans (Wilkinson and Buddemeier 1994).
Reef coral biodiversity is influenced by its habitat and environmental conditions, including biotic
interactions. Environmental conditions that have a role in reef coral biodiversity are water temperature,
salinity, wave action, currents, sediment load, which some of it depend on the distance to the nearest
river mouth (Moll 1986; Veron 2000). Other habitat conditions that influence the reef coral biodiversity
are bottom structure (complexity/rugosity) (Aronson and Precht 1995),bottom substrate, depth, and
reef geomorphology (Moll 1986; Veron 2000; Andréfouët and Guzman 2005). All of these
environmental conditions may play a major responsibility in determining the structure and dynamics of
coral reef habitats and may be critical to the maintenance of biodiversity of the coral reef systems.
Biodiversity on coral reefs are routinely investigated using conventional field survey. Since the field
survey are usually time-consuming and expensive to conduct over a wide scale, alternative and more
feasible methods are needed to tackle this problem (Purkis et al. 2006). The only feasible way to
assess the life coral cover over large spatial and temporal scale is to use remote sensing. It offers
many advantages while field survey is complicated to do particularly in remote areas (Mumby et al.
2004).
Remote sensing generally provides many advantages in coral reef mapping. A routine method for the
analysis of earth observation data by means of remote sensing of the reef areas is by using spectral
feature space (Purkis et al. 2006). This technique is effective in the majority of cases since different
benthic bottom type of coral reefs frequently display separable optical signatures (Hochberg et al.
CORAL REEF RUGOSITY AND CORAL BIODIVERSITY
2
2003). However, spectral reflectance characteristic of features within a coral reef environment are
optically similar, so confusion can arise in identification of the coral reef (Holden and Ledrew 1999). An
alternative and complementary method for the coral reef biodiversity mapping is by the analysis of
rugosity derived from remote sensing imagery as coral reef biodiversity indicator (Brock et al. 2004;
Perez et al. 2004) It looks promising since a more complex habitat supports a greater variety of
species.
Based on the description above, this research will assess the relationship between rugosity and the
biodiversity of reef building corals. The study was conducted in Bunaken National Park, and done
together with colleagues Juan Pablo S Rojas.
1.1.1. Coral Reef
There are three types of reefs that proposed by Darwin that widely accepted today. The first type is a
fringing reef. Fringing reefs are characterized by their location which closed to the land, occurring in
shallow water area, border shorelines of continents and Islands in tropical seas. This type of reefs is
commonly found in the Indo-Pacific region, the South Pacific Hawaiian Islands, and parts of the
Caribbean (Veron 1986; Barnes 1999) Fringing reefs are formed closed to inshore on rocky coastlines
by the growth of corals and associated Hydrozoans (stinging corals), Alcyonarians (soft corals) and
calcareous algae.
The barrier reef is the second type of reef. This reef occurs farther on the offshore and separated from
the land by a lagoon or wide channel resulted from erosion and coastal subsidence(Barnes 1999).
Barrier reefs are common in the Caribbean and Indo-Pacific (Veron 1986). One of the well known
barrier reef is The Great Barrier Reef in northern Australia in the Indo-Pacific region which is
considered as the largest barrier reef in the world.
If the land mass is a relatively small Island, it may disappear below the ocean surface due to land
subsidence or sea level rise, and the reef becomes an atoll. This type of reefs is namely Atolls. They
typically placed surround a central shallow sandy lagoon. Atolls also commonly occur in the Indo-
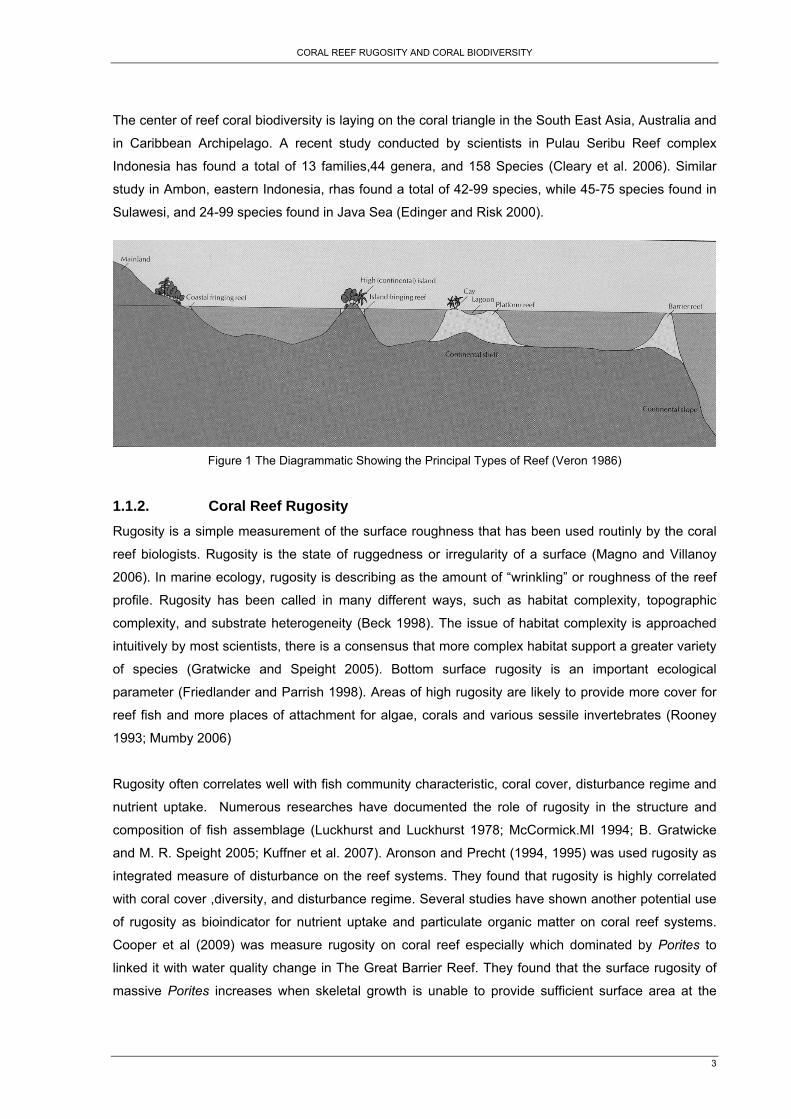
Pacific. Furthermore, Veron (1986) proposed the fourth type of reef namely Platform reef. The
diagrammatic showing the principal types of reef are presented in the Figure 1.
Reefs are built from coral species, but not all coral produce reefs. (Barnes 1999; Veron 2000) The
main reefs builders are the stony or hard corals namely a hermatypic corals which have a symbiotic
relationship of microscopic brown alga called Zooxanthellae .Corals are restricted in an area within 70
m of the surface in clear seas where the temperature remains above 20°C throughout the year. If the
water is colder, the reefs are poorly developed or nonexistent. Corals may still exist at the depths
below 70 m which is colder and or turbid waters in suitable hard substrata as long as there is sufficient
light for photosynthesis. But this condition will reduce the capabilities of corals to secrete limestone for
growth and built the reef although the symbiotic relationship with Zooxanthellae often persistent. Most
of coral reefs lies between the latitudes of 30 degrees north and south where the sea temperatures
are warmest (Barnes, 1999)
CORAL REEF RUGOSITY AND CORAL BIODIVERSITY
3
The center of reef coral biodiversity is laying on the coral triangle in the South East Asia, Australia and
in Caribbean Archipelago. A recent study conducted by scientists in Pulau Seribu Reef complex
Indonesia has found a total of 13 families,44 genera, and 158 Species (Cleary et al. 2006). Similar
study in Ambon, eastern Indonesia, rhas found a total of 42-99 species, while 45-75 species found in
Sulawesi, and 24-99 species found in Java Sea (Edinger and Risk 2000).
Figure 1 The Diagrammatic Showing the Principal Types of Reef (Veron 1986)
1.1.2. Coral Reef Rugosity Rugosity is a simple measurement of the surface roughness that has been used routinly by the coral
reef biologists. Rugosity is the state of ruggedness or irregularity of a surface (Magno and Villanoy
2006). In marine ecology, rugosity is describing as the amount of “wrinkling” or roughness of the reef
profile. Rugosity has been called in many different ways, such as habitat complexity, topographic
complexity, and substrate heterogeneity (Beck 1998). The issue of habitat complexity is approached
intuitively by most scientists, there is a consensus that more complex habitat support a greater variety
of species (Gratwicke and Speight 2005). Bottom surface rugosity is an important ecological
parameter (Friedlander and Parrish 1998). Areas of high rugosity are likely to provide more cover for
reef fish and more places of attachment for algae, corals and various sessile invertebrates (Rooney
1993; Mumby 2006)
Rugosity often correlates well with fish community characteristic, coral cover, disturbance regime and
nutrient uptake. Numerous researches have documented the role of rugosity in the structure and
composition of fish assemblage (Luckhurst and Luckhurst 1978; McCormick.MI 1994; B. Gratwicke
and M. R. Speight 2005; Kuffner et al. 2007). Aronson and Precht (1994, 1995) was used rugosity as
integrated measure of disturbance on the reef systems. They found that rugosity is highly correlated
with coral cover ,diversity, and disturbance regime. Several studies have shown another potential use
of rugosity as bioindicator for nutrient uptake and particulate organic matter on coral reef systems.
Cooper et al (2009) was measure rugosity on coral reef especially which dominated by Porites to
linked it with water quality change in The Great Barrier Reef. They found that the surface rugosity of
massive Porites increases when skeletal growth is unable to provide sufficient surface area at the
CORAL REEF RUGOSITY AND CORAL BIODIVERSITY
4
higher growth rate due to nutrient enrichment. However, it is likely to be of limited use for short-term
monitoring due to its slow response time (Cooper et al. 2009).
Rugosity has also been used to identity and classify the benthic habitat using light detection and
ranging (LIDAR) (Brock et al. 2006; Kuffner et al. 2007) and remote sensing based on satellite
imagery (Purkis et al. 2008). Recent research conducted by Dunn and Halpin (2009) was used
rugosity as an indicator for detecting the hard bottom habitat at regional scale in the Atlantic coast of
Florida-USA. They successfully predicted the presence or absence of the hard bottom habitat with
~70% accuracy (Dunn and Halpin 2009).
1.1.3. Disturbance on Coral reef Coastal marine habitats in particular are exposed to and appeared to be susceptible to a wide range of
natural and anthropogenic disturbances. The natural disturbances including rigorous tropical storms
and wave action, tidal exposure (Huston 1985) temperature fluctuations, terrestrial run-off, and
diseases are vary in their scale, intensity, and frequency (Connell et al. 1997). Man-induced physical
disturbances are numerous, including over-harvesting of reef organisms, coral mining and dredging ,
destructive fishing practices (Chabanet et al. 2005) and tourism activities including trampling and
diving-ship grounding (Zakai and Chadwick-Furman 2002; Chabanet et al. 2005; Fox and Caldwell
2006). Both anthropogenic and natural disturbance can resulting in similar effect on the reef (Fox and
Caldwell 2006). However, those communities susceptible to natural disturbances are even more
vulnerable to increasing pressure from anthropogenic factors (Wilson et al. 2006)
Disturbance can be acute or chronics (Connell 1997). Acute is a single disturbance that directly affects
the environment temporarily. Whereas chronics ones are longer-term disturbance. If a series of acute
disturbances that has occurred so frequently and gave only a short time in between to recover; this is
then regarded as a chronic disturbance. Chronic disturbances are more damaging than acute ones,
especially when considering coral reef recovery (Richmond 1993). It generally causes problems not
only by stimulating coral mortality, but also by affecting reproduction and recruitment. Thus corals
recovery would reduced by acute, short-term disturbances might recover faster or more complete than
those afflicted by the chronic, the long-term ones(Connell 1997).
Disturbance plays a role in maintaining the coral reef systems. It may plays a major responsibility in
determining the structure and dynamics of coral reef habitats and may be critical to the maintenance
of diversity in these species-rich systems (Connell 1978; Huston 1985). At low level of disturbances,
dominant competitors limit most other subordinate competitors. At intermediate level of disturbances,
Cornell (1978) introduces disturbance-diversity relationships known as an intermediate disturbances
hypothesis. It is suggestsed that diversity will be maximal at intermediate level of disturbances. This
level of disturbance in a reef system will removed the competitive dominant when the dominant one is
susceptible to disturbance. It did not allow more species to coexist as increase of the evenness among
species that were already present. This disturbance limited the cover of competitive dominant, thus
allow competitive subordinate to increased their growth, increase from low to intermediate level of
CORAL REEF RUGOSITY AND CORAL BIODIVERSITY
5
cover. However, there is a considerable debate that the intermediate hypothesis would be applicable
in all coral reef systems (Aronson and Precht 1995). In high level of disturbance, diversity may be
reduced significantly. Extremely frequent or severe disturbance will prevent coral species from
surviving (Huston 1985).
1.2. Research Problems The use of rugosity data derived from remote sensing as an alternative and complement method for
coral reef biodiversity assessment has been done by several scientists (Brock et al. 2004; Kuffner et
al. 2007). This method needs a justification that rugosity as an indicator of substrate complexity of
coral reef habitat has a strong relationship with coral biodiversity.
The structural complexity of habitats increases the heterogeneity. It will increase niches available for
different species to occupy. Therefore, increasing the rugosity of habitat generally resulted on the
increasing biodiversity of the assemblages that occur with them (Cranfield et al. 2004). Areas of high
rugosity allow the corals to attach and grow on higher substrata which not influenced by sand and
sediment movement along the bottom (Friedlander et al. 2003; Friedlander et al. 2005). Corals larvae
are preferentially recruited to vertical surfaces, this pattern also applied to the areas of higher rugosity.
(Rogers et al. 1984)
Rugosity of coral reef also reflects the effect of disturbance and stressors on the reef. Complete
historical records of disturbance and stress do not available for most coral reefs. Even where historical
records of disturbance are available, there is no obvious way to sum up each different disturbance to
reflect the total disturbance regime. In other words, one cannot simply give the specific score for
specific disturbance and sum it up to get the total disturbance that has been passed by the reef.
Arronson and Precth (1994; 1995) proved that rugosity is an indicator of large-scale and long-term
disturbance for coral reefs. They found that rugosity inversely related to total disturbance. The lower
rugosity means the flatter terrain and suggesting more frequent, more recent and or more intense
disturbance. Therefore improving our understanding on rugosity of coral reef does not only improve
our understanding about coral biodiversity itself, but also it gives insight in the disturbance and its
effect on coral reefs.
Even though there are many scientists who studied the rugosity, only a few have related it directly to
the reef coral biodiversity itself. Most of them were studied the relationships between coral reef
rugosity with reef fish diversity, benthic micro fauna, and macro fauna (Knudby and LeDrew 2007;
Knudby et al. 2007).
Since it is clear that rugosity plays a role in coral biodiversity, it also offers the possibility to use
rugosity as an indicator for coral biodiversity and disturbance on coral reef. Therefore understanding
the relationships between rugosity and coral diversity is very important. Biodiversity indices that used
are genera richness, Shannon index of diversity, evenness, and dominant species. In addition percent
CORAL REEF RUGOSITY AND CORAL BIODIVERSITY
6
of live coral cover is also analyzed. The result of this research will contribute to coral reef mapping
and monitoring, with the use of remote sensing technique.
1.3. Research Objectives
1.3.1. Main Objective The aims of this research are to asses the coral reef rugosity and its relation to reef coral biodiversity.
1.3.2. Specific Objectives 1. To analyze the pattern of reef corals biodiversity in the study area.
2. To analyze coral reef rugosity in the Bunaken National Park
3. To asses the relationship between coral reef rugosity and coral biodiversity.
1.4. Research Questions 1. How is the pattern of reef corals biodiversity in the study area?
2. Do the coral reefs in different environmental conditions (dominated by fishing practises and
recreational activities) have a different rugosity index?
3. Is there any relationship between rugosity index and investigated biodiversity indices and
coral cover? If so which are the biodiversity indices that are highly correlated with the rugosity
Index?
1.5. Research Hypotheses H1o : The coral reef rugosity index do not have a significant different between Tombariri
and Bunaken Island H11 : The coral reef rugosity index in Bunaken Island is higher than in Tombariri H2o : There is no relation between coral reef rugosity, coral cover, and investigated
biodiversity indices. H21 : There is a relation between rugosity , coral cover and investigated biodiversity
indices.
CORAL REEF RUGOSITY AND CORAL BIODIVERSITY
7
2. Material and Methods
2.1. Study Area Bunaken National Park (BNP), founded in 1991, is considered as one of the most strategically
important Marine Protected Areas in the world. Located near the centre of the 'coral triangle'(1’37’ N
124’ 45’ E), the reefs of North Sulawesi are of crucial conservation importance (Fava et al. 2009). The
Park covers approx. 90,000 ha of coral reefs, mangrove forests and a sea grass bed supports a local
population of some 22,000 villagers. In general, BNP divided in two sections; the northern section and
the southern section. The northern section of BNP consist five Islands (Bunaken, Siladen, Manado
Tua, Nain, and Mantehage) and the coastal area between Molas village to Tiwoho village so called
“Wolas-Wori” coast. Each Island is surrounded by fringing reefs and characterized by reef flats with
different extension and steep walls out of the edge (Fava et al. 2009).The other section of this national
park covers entirely area between Popoh coastal areas until Popareng village wich is known as the
“Arakan – Wowontulap “ coast.
Sea surface temperature in BNP is relatively stable throughout the year. It range from 27 to 29
degrees Celsius in the open water, but can be up to 30 degrees Celsius over the reef flat at low tide.
Tidal type in the BNP is semi diurnal which means there are two low tides and two high tides in one
day. The average range between high tides and low tides can be up to 2.6 meters. In general, there
are two season in the area, namely wet season and dry season. In the dry season, drier wind came
from southwest direction. It occurs between May until October and resulting on calm seas. On the
contrary, in the wet season heavy-cool wind blow from northwest, it caused some tropical storm and
high wave. As a result, the western and northern sides of the Islands and coast in BNP are exposed to
storms and large waves (Turak E and DeVantier 2003). This moment occurs from November until
February (Mehta 1999).
The coral reef in The Bunaken National Park that becomes focus in this research is the fringing reef
on Bunaken Island and Tombariri, represent of the northern and southern section respectively. The
coral reef communities in that area are threatened by natural and anthropogenic disturbances.
Recreation and diving activities are considered as major threats to the reef corals in Bunaken Island
(Turak E and DeVantier 2003). There are 18 dive sites and more than 41 diving clubs that operated in
this area. Type of reef in Bunaken Island is the Island fringing reef with higher degree of steepness. In
contrast, coral reef in Tombariri is the coastal fringing reef with lower degree of steepness. Coral reef
in Tombariri is severe form destructive fishing practises and sedimentation but there are less diving
activities and other recreational activities compared to Bunaken Island (DeVantier and Turak 2004;
DeVantier et al. 2006). There are two river mount which closed to Tombariri reef area. The first river is
located in the eastern part, while the second one is in the western section.
CORAL REEF RUGOSITY AND CORAL BIODIVERSITY
8
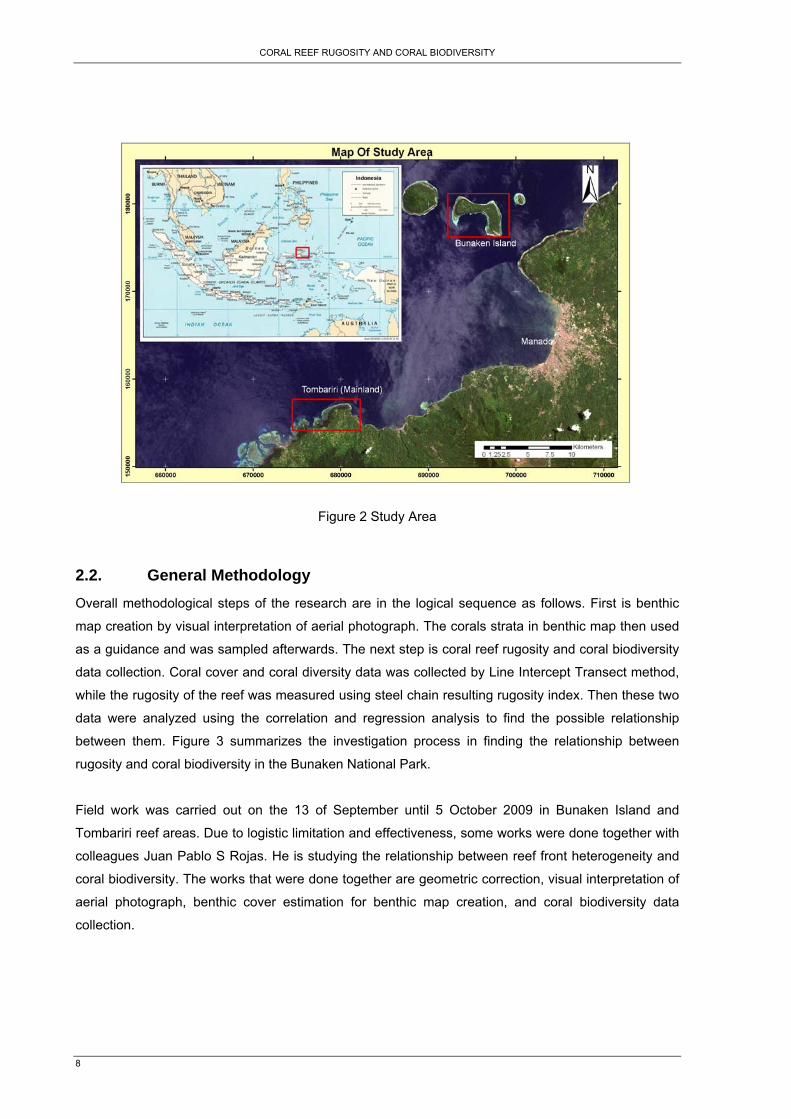
Figure 2 Study Area
2.2. General Methodology Overall methodological steps of the research are in the logical sequence as follows. First is benthic
map creation by visual interpretation of aerial photograph. The corals strata in benthic map then used
as a guidance and was sampled afterwards. The next step is coral reef rugosity and coral biodiversity
data collection. Coral cover and coral diversity data was collected by Line Intercept Transect method,
while the rugosity of the reef was measured using steel chain resulting rugosity index. Then these two
data were analyzed using the correlation and regression analysis to find the possible relationship
between them. Figure 3 summarizes the investigation process in finding the relationship between
rugosity and coral biodiversity in the Bunaken National Park.
Field work was carried out on the 13 of September until 5 October 2009 in Bunaken Island and
Tombariri reef areas. Due to logistic limitation and effectiveness, some works were done together with
colleagues Juan Pablo S Rojas. He is studying the relationship between reef front heterogeneity and
coral biodiversity. The works that were done together are geometric correction, visual interpretation of
aerial photograph, benthic cover estimation for benthic map creation, and coral biodiversity data
collection.
CORAL REEF RUGOSITY AND CORAL BIODIVERSITY
9
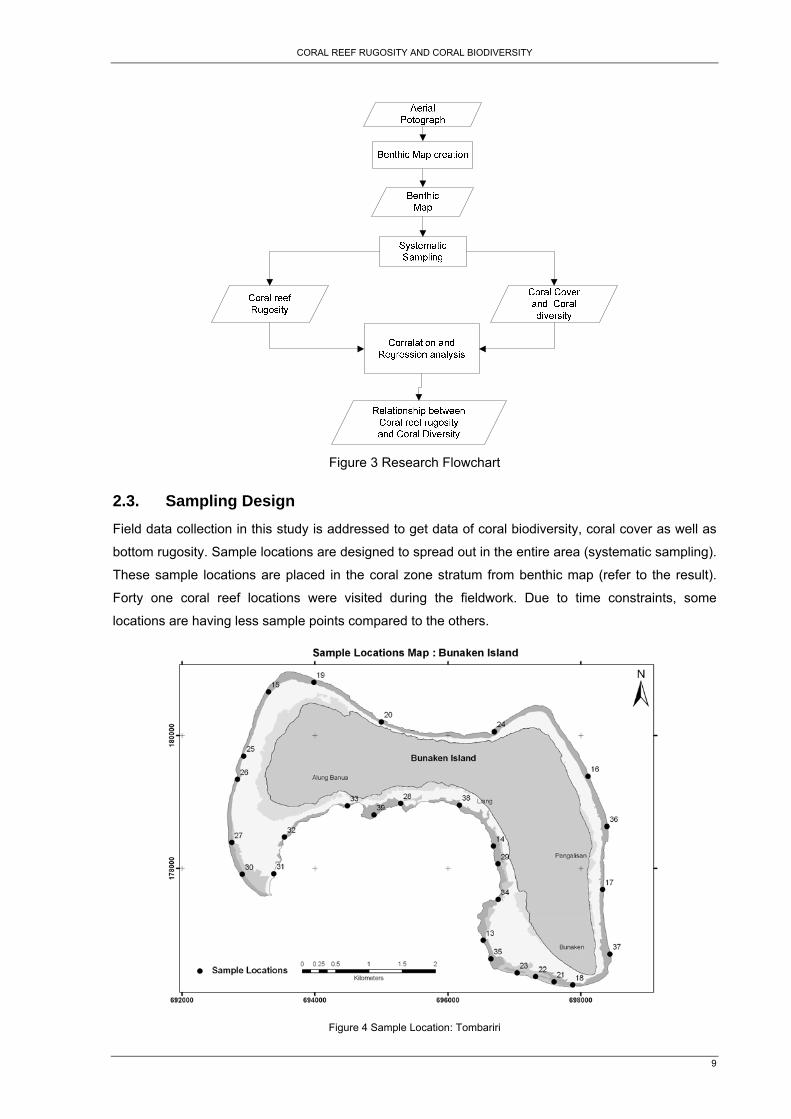
Figure 3 Research Flowchart
2.3. Sampling Design Field data collection in this study is addressed to get data of coral biodiversity, coral cover as well as
bottom rugosity. Sample locations are designed to spread out in the entire area (systematic sampling).
These sample locations are placed in the coral zone stratum from benthic map (refer to the result).
Forty one coral reef locations were visited during the fieldwork. Due to time constraints, some
locations are having less sample points compared to the others.
Figure 4 Sample Location: Tombariri
CORAL REEF RUGOSITY AND CORAL BIODIVERSITY
10
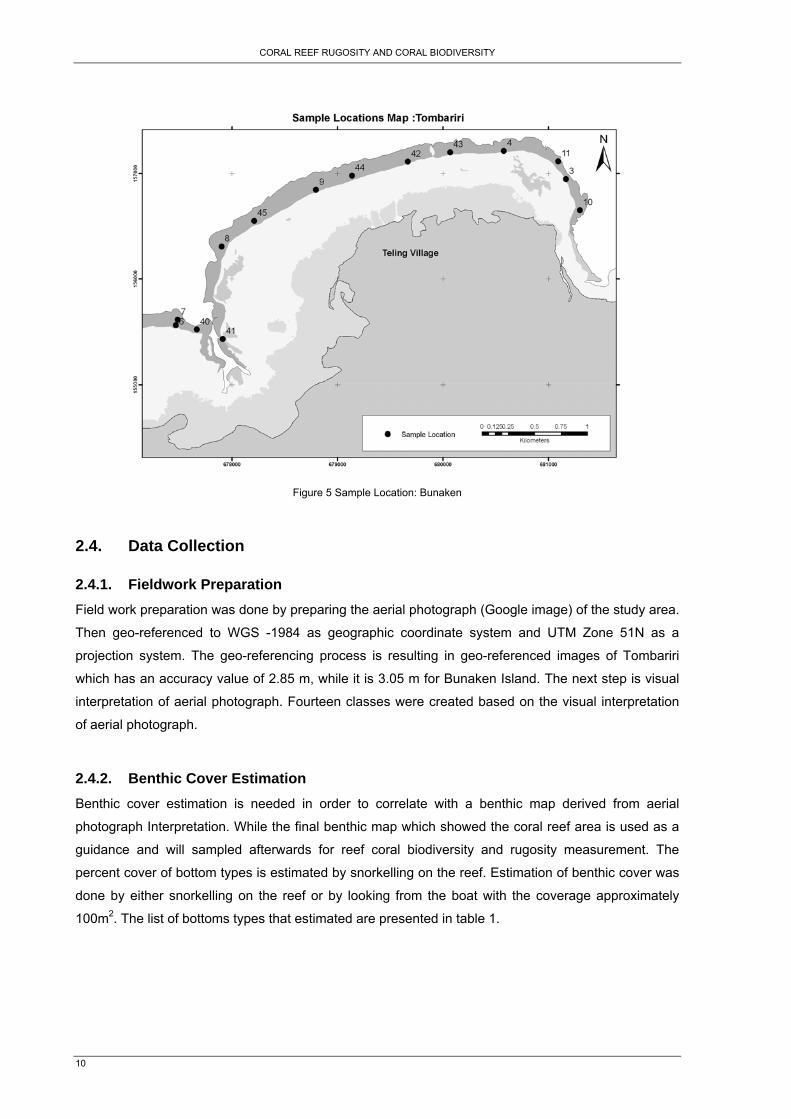
Figure 5 Sample Location: Bunaken
2.4. Data Collection
2.4.1. Fieldwork Preparation Field work preparation was done by preparing the aerial photograph (Google image) of the study area.
Then geo-referenced to WGS -1984 as geographic coordinate system and UTM Zone 51N as a
projection system. The geo-referencing process is resulting in geo-referenced images of Tombariri
which has an accuracy value of 2.85 m, while it is 3.05 m for Bunaken Island. The next step is visual
interpretation of aerial photograph. Fourteen classes were created based on the visual interpretation
of aerial photograph.
2.4.2. Benthic Cover Estimation Benthic cover estimation is needed in order to correlate with a benthic map derived from aerial
photograph Interpretation. While the final benthic map which showed the coral reef area is used as a
guidance and will sampled afterwards for reef coral biodiversity and rugosity measurement. The
percent cover of bottom types is estimated by snorkelling on the reef. Estimation of benthic cover was
done by either snorkelling on the reef or by looking from the boat with the coverage approximately
100m2. The list of bottoms types that estimated are presented in table 1.
CORAL REEF RUGOSITY AND CORAL BIODIVERSITY
11
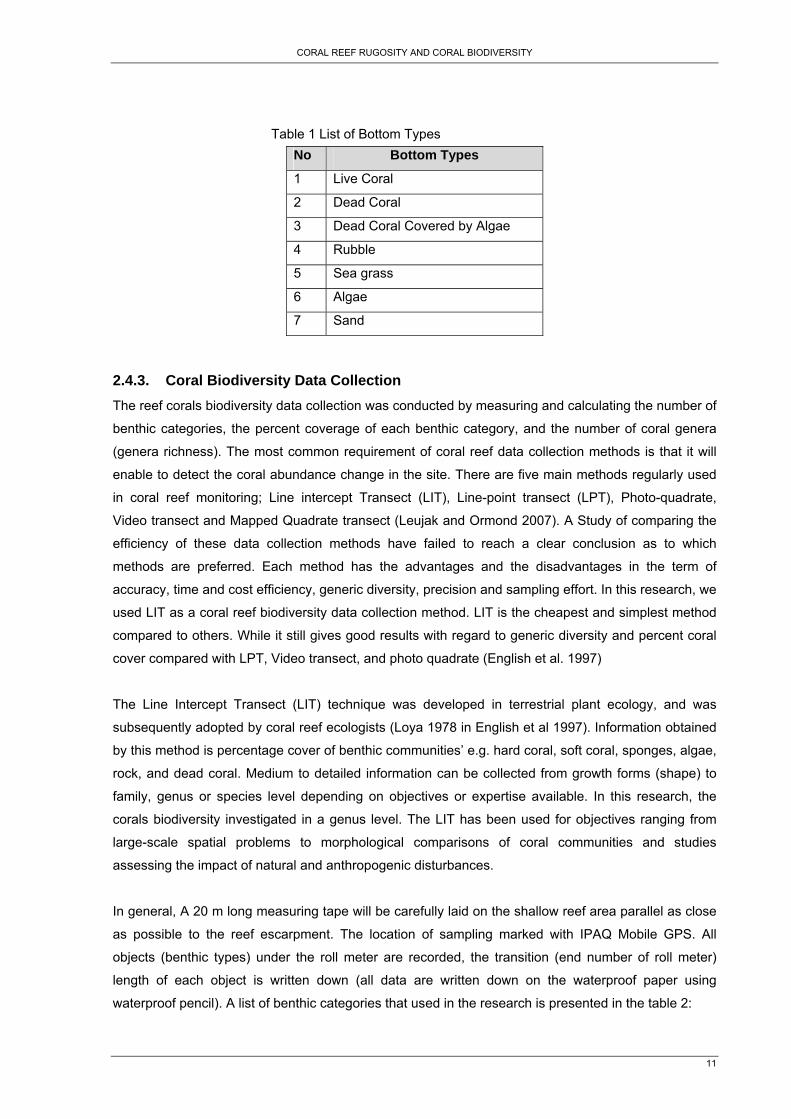
Table 1 List of Bottom Types
No Bottom Types
1 Live Coral
2 Dead Coral
3 Dead Coral Covered by Algae
4 Rubble
5 Sea grass
6 Algae
7 Sand
2.4.3. Coral Biodiversity Data Collection The reef corals biodiversity data collection was conducted by measuring and calculating the number of
benthic categories, the percent coverage of each benthic category, and the number of coral genera
(genera richness). The most common requirement of coral reef data collection methods is that it will
enable to detect the coral abundance change in the site. There are five main methods regularly used
in coral reef monitoring; Line intercept Transect (LIT), Line-point transect (LPT), Photo-quadrate,
Video transect and Mapped Quadrate transect (Leujak and Ormond 2007). A Study of comparing the
efficiency of these data collection methods have failed to reach a clear conclusion as to which
methods are preferred. Each method has the advantages and the disadvantages in the term of
accuracy, time and cost efficiency, generic diversity, precision and sampling effort. In this research, we
used LIT as a coral reef biodiversity data collection method. LIT is the cheapest and simplest method
compared to others. While it still gives good results with regard to generic diversity and percent coral
cover compared with LPT, Video transect, and photo quadrate (English et al. 1997)
The Line Intercept Transect (LIT) technique was developed in terrestrial plant ecology, and was
subsequently adopted by coral reef ecologists (Loya 1978 in English et al 1997). Information obtained
by this method is percentage cover of benthic communities’ e.g. hard coral, soft coral, sponges, algae,
rock, and dead coral. Medium to detailed information can be collected from growth forms (shape) to
family, genus or species level depending on objectives or expertise available. In this research, the
corals biodiversity investigated in a genus level. The LIT has been used for objectives ranging from
large-scale spatial problems to morphological comparisons of coral communities and studies
assessing the impact of natural and anthropogenic disturbances.
In general, A 20 m long measuring tape will be carefully laid on the shallow reef area parallel as close
as possible to the reef escarpment. The location of sampling marked with IPAQ Mobile GPS. All
objects (benthic types) under the roll meter are recorded, the transition (end number of roll meter)
length of each object is written down (all data are written down on the waterproof paper using
waterproof pencil). A list of benthic categories that used in the research is presented in the table 2:
CORAL REEF RUGOSITY AND CORAL BIODIVERSITY
12
20 m0 m
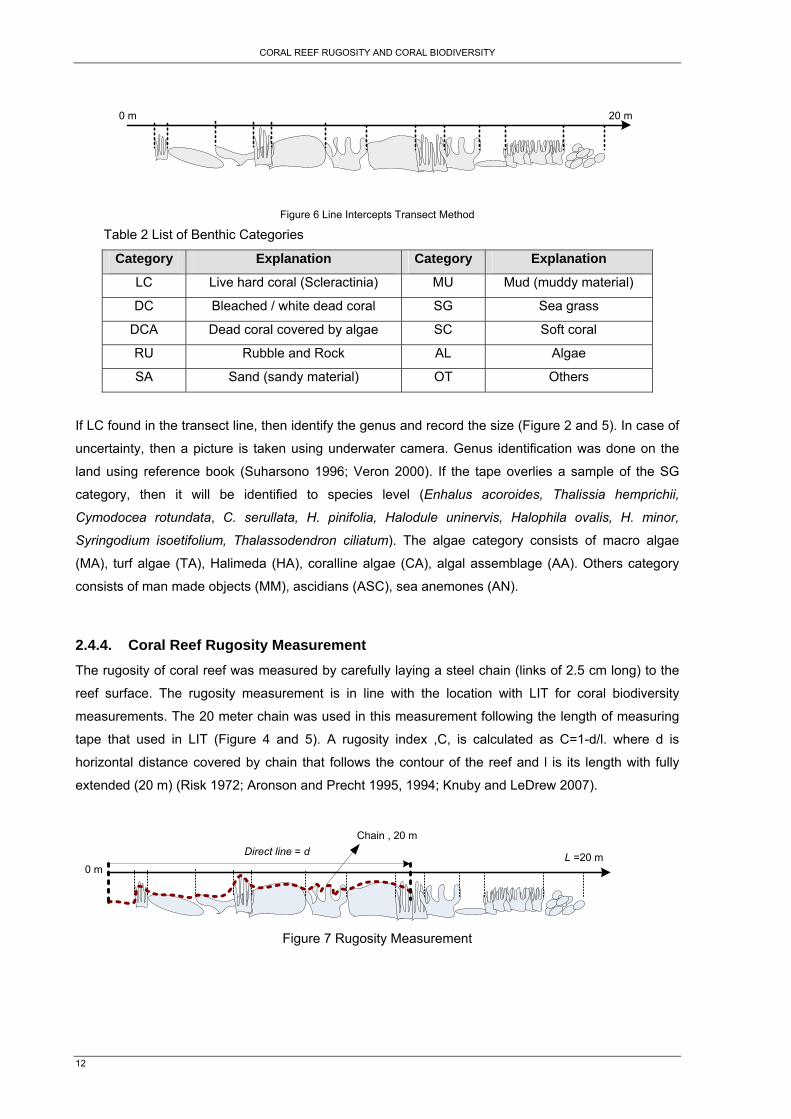
Figure 6 Line Intercepts Transect Method Table 2 List of Benthic Categories
Category Explanation Category Explanation
LC Live hard coral (Scleractinia) MU Mud (muddy material)
DC Bleached / white dead coral SG Sea grass
DCA Dead coral covered by algae SC Soft coral
RU Rubble and Rock AL Algae
SA Sand (sandy material) OT Others
If LC found in the transect line, then identify the genus and record the size (Figure 2 and 5). In case of
uncertainty, then a picture is taken using underwater camera. Genus identification was done on the
land using reference book (Suharsono 1996; Veron 2000). If the tape overlies a sample of the SG
category, then it will be identified to species level (Enhalus acoroides, Thalissia hemprichii,
Cymodocea rotundata, C. serullata, H. pinifolia, Halodule uninervis, Halophila ovalis, H. minor,
Syringodium isoetifolium, Thalassodendron ciliatum). The algae category consists of macro algae
(MA), turf algae (TA), Halimeda (HA), coralline algae (CA), algal assemblage (AA). Others category
consists of man made objects (MM), ascidians (ASC), sea anemones (AN).
2.4.4. Coral Reef Rugosity Measurement The rugosity of coral reef was measured by carefully laying a steel chain (links of 2.5 cm long) to the
reef surface. The rugosity measurement is in line with the location with LIT for coral biodiversity
measurements. The 20 meter chain was used in this measurement following the length of measuring
tape that used in LIT (Figure 4 and 5). A rugosity index ,C, is calculated as C=1-d/l. where d is
horizontal distance covered by chain that follows the contour of the reef and l is its length with fully
extended (20 m) (Risk 1972; Aronson and Precht 1995, 1994; Knuby and LeDrew 2007).
Chain , 20 m
L =20 m0 m
Direct line = d
Figure 7 Rugosity Measurement
CORAL REEF RUGOSITY AND CORAL BIODIVERSITY
13
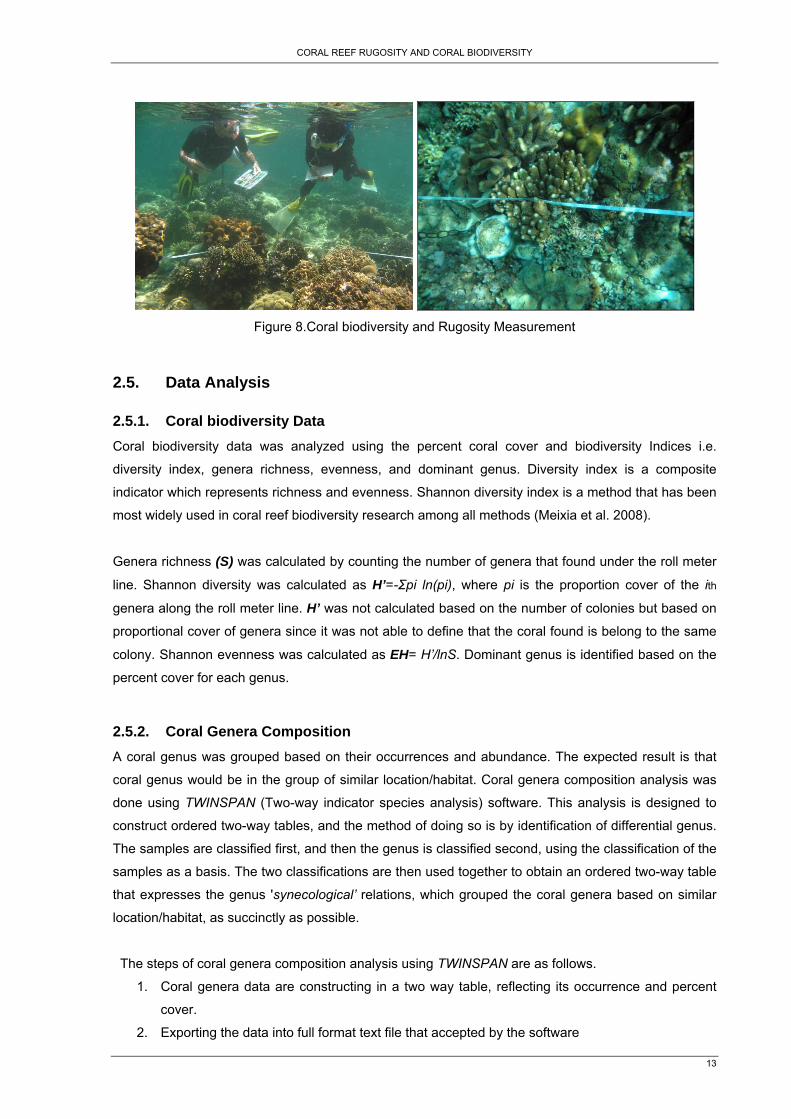
Figure 8.Coral biodiversity and Rugosity Measurement
2.5. Data Analysis
2.5.1. Coral biodiversity Data Coral biodiversity data was analyzed using the percent coral cover and biodiversity Indices i.e.
diversity index, genera richness, evenness, and dominant genus. Diversity index is a composite
indicator which represents richness and evenness. Shannon diversity index is a method that has been
most widely used in coral reef biodiversity research among all methods (Meixia et al. 2008).
Genera richness (S) was calculated by counting the number of genera that found under the roll meter
line. Shannon diversity was calculated as H’=-Σpi ln(pi), where pi is the proportion cover of the ith
genera along the roll meter line. H’ was not calculated based on the number of colonies but based on
proportional cover of genera since it was not able to define that the coral found is belong to the same
colony. Shannon evenness was calculated as EH= H’/lnS. Dominant genus is identified based on the
percent cover for each genus.
2.5.2. Coral Genera Composition A coral genus was grouped based on their occurrences and abundance. The expected result is that
coral genus would be in the group of similar location/habitat. Coral genera composition analysis was
done using TWINSPAN (Two-way indicator species analysis) software. This analysis is designed to
construct ordered two-way tables, and the method of doing so is by identification of differential genus.
The samples are classified first, and then the genus is classified second, using the classification of the
samples as a basis. The two classifications are then used together to obtain an ordered two-way table
that expresses the genus 'synecological’ relations, which grouped the coral genera based on similar
location/habitat, as succinctly as possible.
The steps of coral genera composition analysis using TWINSPAN are as follows.
1. Coral genera data are constructing in a two way table, reflecting its occurrence and percent
cover.
2. Exporting the data into full format text file that accepted by the software
CORAL REEF RUGOSITY AND CORAL BIODIVERSITY
14
3. Importing data and specify the type of analysis.
4. Define the cut level for percent cover value. The cut level is chosen to 0,10, 20,30, and 40
reflecting the abundance and cover of each coral genus.
5. Define the maximum number of division level (4), minimum number of group size that can be
further divided (5), and maximum number of division level (2).
In addition, the result table was exported to the GIS software in order to get insight of geographical
distribution of group member.
2.5.3. Coral Reef Rugosity Coral reef rugosity is indicated by an index that resulted from coral reef topography measurement. In
order to compare the rugosity index in Bunaken Island and in Tombariri area, an independent t-test
was performed. The independent t-test is used to asses the statistical significant different between the
means of two variable which are independent one from another and belong to continuous data (Moore
et al. 2009). The significant level of 95% is chosen as well as a rule of thumb in the natural resources.
The SPSS software was employed to do the t-test.
2.5.4. Relationship between Rugosity and Coral biodiversity The relationships between rugosity and coral biodiversity were tested using a correlation test. It is
usually written as r. The correlation measures the direction and strength of the linear relationships
between two quantitative variables. Correlation requires both variables to be quantitative. Therefore,
dominant genera indices were excluded in the correlation analysis.
The commonly used correlation test is a Pearson correlation (Moore et al. 2009). The correlation is
always a number between -1 and 1. Values of r near 0 indicate a very weak linear relationship. The
strength of relationship increases as r moves away from o toward either -1 or 1. The null hypothesis
most commonly tested with Pearson’s correlation coefficient is that the population correlation
coefficient equals zero. And then the significance of correlation was rested using a t statistic.
Correlations analyses were done using SPSS software. The null hypothesis in this case is there are
no relation between investigated biodiversity indices and coral reef rugosity index.
A relationship between rugosity and coral biodiversity also were explored using linear and second
order polynomial regression. Second order relationship was employed because there is an
intermediate disturbance hypothesis which stated that diversity will be maximal at intermediate level of
disturbances (Connell 1978). The coefficients of determination,r2, of these regressions are reported,
and an independent t-test was performed to check if the regression coefficients for linear regression or
second order coefficients for polynomial regression were significantly different from zero.
Data transformation is suggested for data that reflects to the percentage or proportional data before
statistical analysis, i.e. coral cover and Rugosity. The recommended data transformation for this case
CORAL REEF RUGOSITY AND CORAL BIODIVERSITY
15
is the arcsine-transformation. Species richness data which are in the form of counts data also require
transformation using logarithmic transformation. In contrast, Shannon diversity index data are normally
distributed therefore does not require any transformation (Magguran 1998). However, statistical
analysis of transformed and untransformed data yielded a similar result. Thus for the calculations
presented in the next chapter are based on the untransformed data.
CORAL REEF RUGOSITY AND CORAL BIODIVERSITY
16
CORAL REEF RUGOSITY AND CORAL BIODIVERSITY
17
3. Result
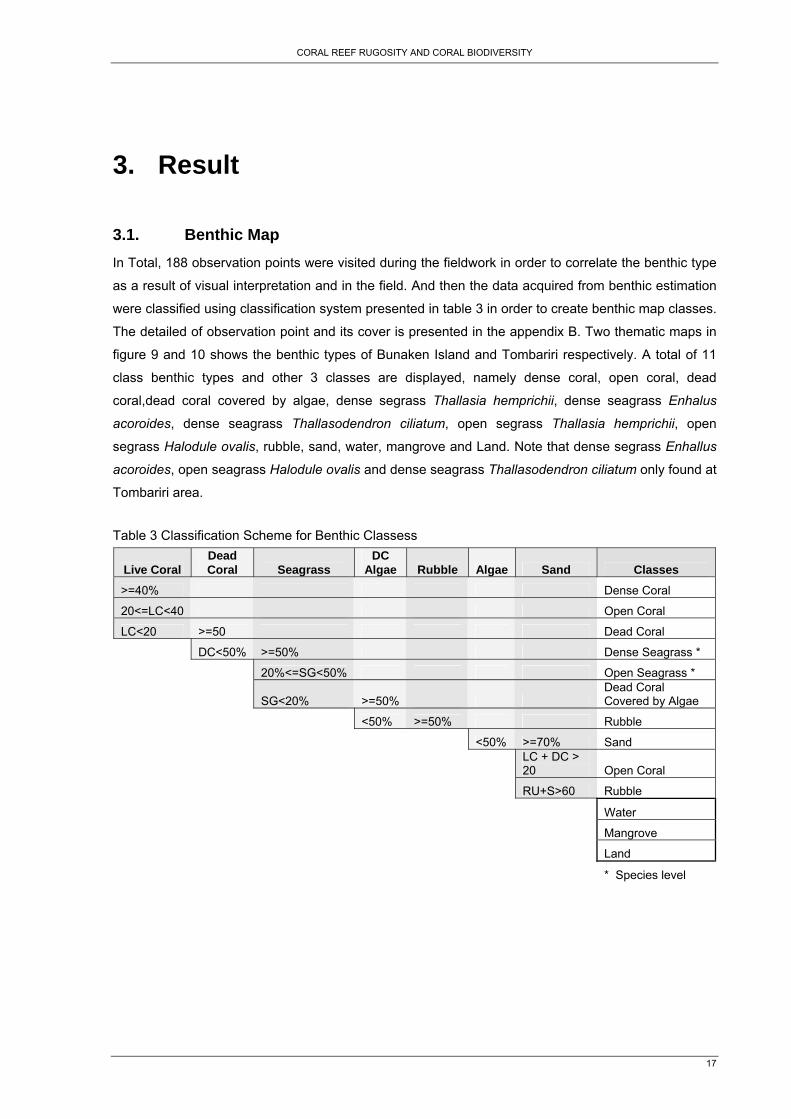
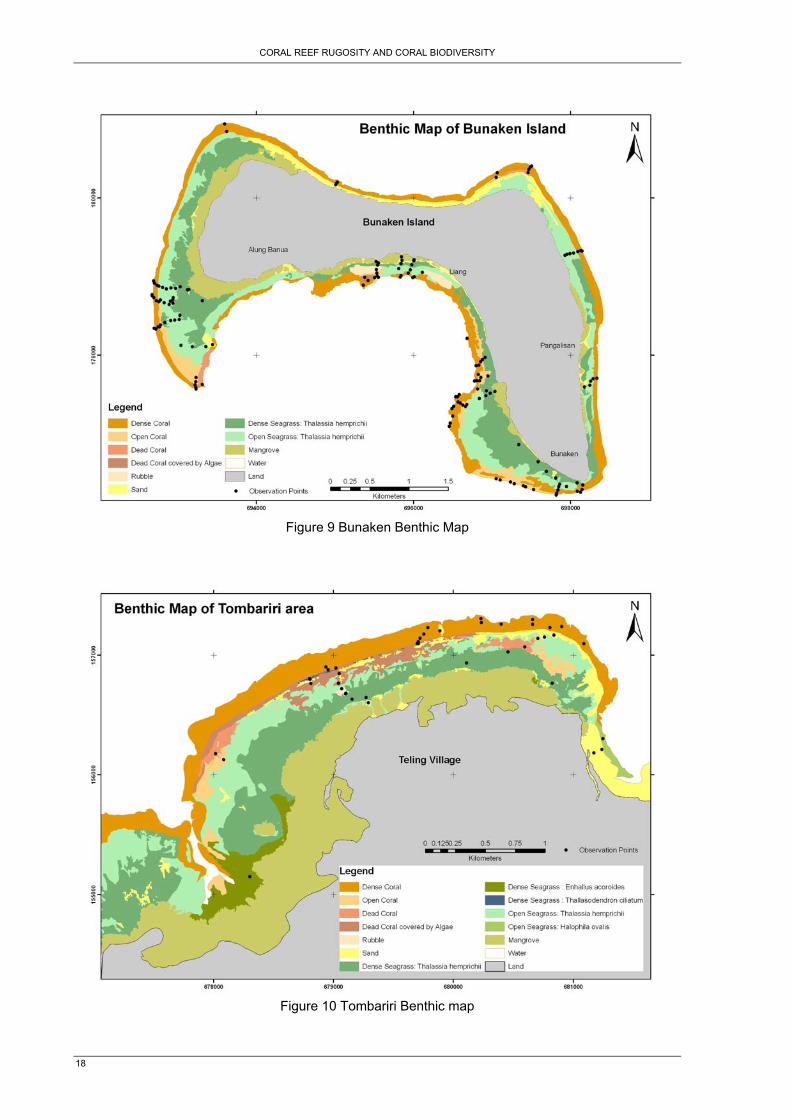
3.1. Benthic Map In Total, 188 observation points were visited during the fieldwork in order to correlate the benthic type
as a result of visual interpretation and in the field. And then the data acquired from benthic estimation
were classified using classification system presented in table 3 in order to create benthic map classes.
The detailed of observation point and its cover is presented in the appendix B. Two thematic maps in
figure 9 and 10 shows the benthic types of Bunaken Island and Tombariri respectively. A total of 11
class benthic types and other 3 classes are displayed, namely dense coral, open coral, dead
coral,dead coral covered by algae, dense segrass Thallasia hemprichii, dense seagrass Enhalus
acoroides, dense seagrass Thallasodendron ciliatum, open segrass Thallasia hemprichii, open
segrass Halodule ovalis, rubble, sand, water, mangrove and Land. Note that dense segrass Enhallus
acoroides, open seagrass Halodule ovalis and dense seagrass Thallasodendron ciliatum only found at
Tombariri area.
Table 3 Classification Scheme for Benthic Classess
Live Coral Dead Coral Seagrass
DC Algae Rubble Algae Sand Classes
>=40% Dense Coral
20<=LC<40 Open Coral
LC<20 >=50 Dead Coral
DC<50% >=50% Dense Seagrass *
20%<=SG<50% Open Seagrass *
SG<20% >=50% Dead Coral Covered by Algae
<50% >=50% Rubble
<50% >=70% Sand
LC + DC > 20 Open Coral
RU+S>60 Rubble
Water
Mangrove
Land
* Species level
CORAL REEF RUGOSITY AND CORAL BIODIVERSITY
18
Figure 9 Bunaken Benthic Map
Figure 10 Tombariri Benthic map
CORAL REEF RUGOSITY AND CORAL BIODIVERSITY
19
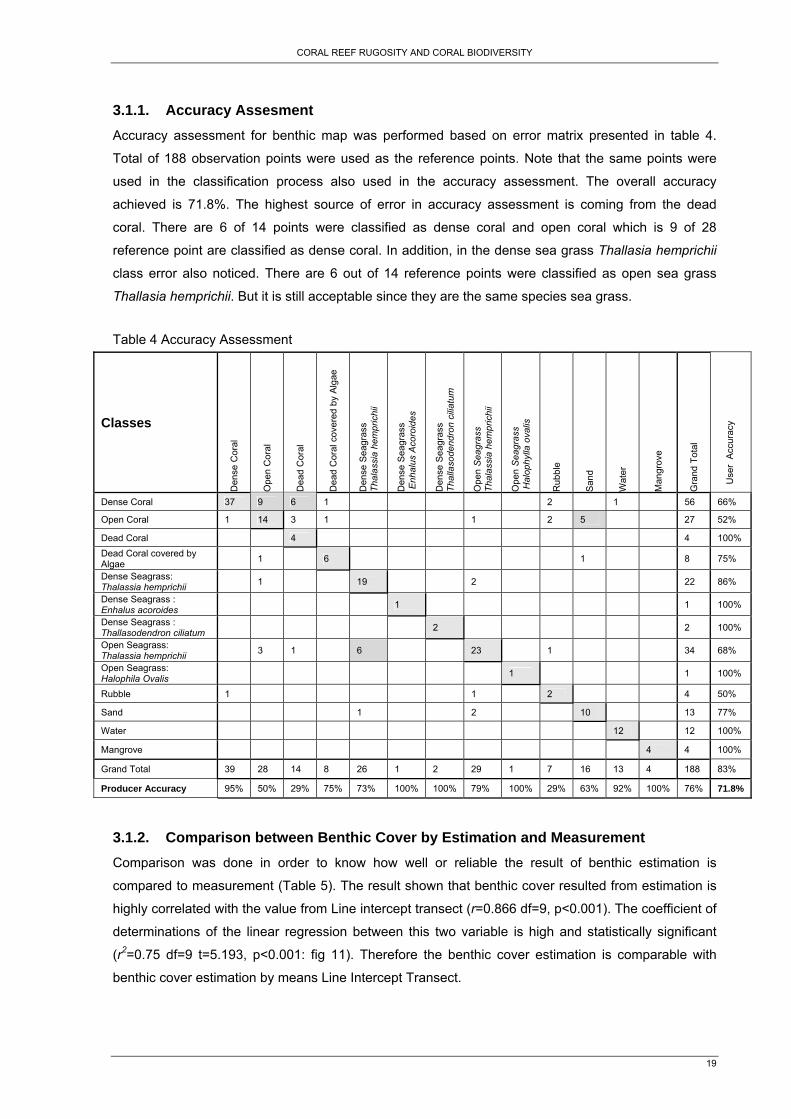
3.1.1. Accuracy Assesment Accuracy assessment for benthic map was performed based on error matrix presented in table 4.
Total of 188 observation points were used as the reference points. Note that the same points were
used in the classification process also used in the accuracy assessment. The overall accuracy
achieved is 71.8%. The highest source of error in accuracy assessment is coming from the dead
coral. There are 6 of 14 points were classified as dense coral and open coral which is 9 of 28
reference point are classified as dense coral. In addition, in the dense sea grass Thallasia hemprichii
class error also noticed. There are 6 out of 14 reference points were classified as open sea grass
Thallasia hemprichii. But it is still acceptable since they are the same species sea grass.
Table 4 Accuracy Assessment
Classes
Den
se C
oral
Ope
n C
oral
Dea
d C
oral
Dea
d C
oral
cov
ered
by
Alg
ae
Den
se S
eagr
ass
Th
alas
sia
hem
pric
hii
Den
se S
eagr
ass
Enh
alus
Aco
roid
es
Den
se S
eagr
ass
Th
alla
sode
ndro
n ci
liatu
m
Ope
n S
eagr
ass
Th
alas
sia
hem
pric
hii
Ope
n S
eagr
ass
Hal
ophy
lla o
valis
Rub
ble
San
d
Wat
er
Man
grov
e
Gra
nd T
otal
Use
r A
ccur
acy
Dense Coral 37 9 6 1 2 1 56 66%
Open Coral 1 14 3 1 1 2 5 27 52%
Dead Coral 4 4 100% Dead Coral covered by Algae 1 6 1 8 75%
Dense Seagrass: Thalassia hemprichii 1 19 2 22 86%
Dense Seagrass : Enhalus acoroides 1 1 100%
Dense Seagrass : Thallasodendron ciliatum 2 2 100%
Open Seagrass: Thalassia hemprichii 3 1 6 23 1 34 68%
Open Seagrass: Halophila Ovalis 1 1 100%
Rubble 1 1 2 4 50%
Sand 1 2 10 13 77%
Water 12 12 100%
Mangrove 4 4 100%
Grand Total 39 28 14 8 26 1 2 29 1 7 16 13 4 188 83%
Producer Accuracy 95% 50% 29% 75% 73% 100% 100% 79% 100% 29% 63% 92% 100% 76% 71.8%
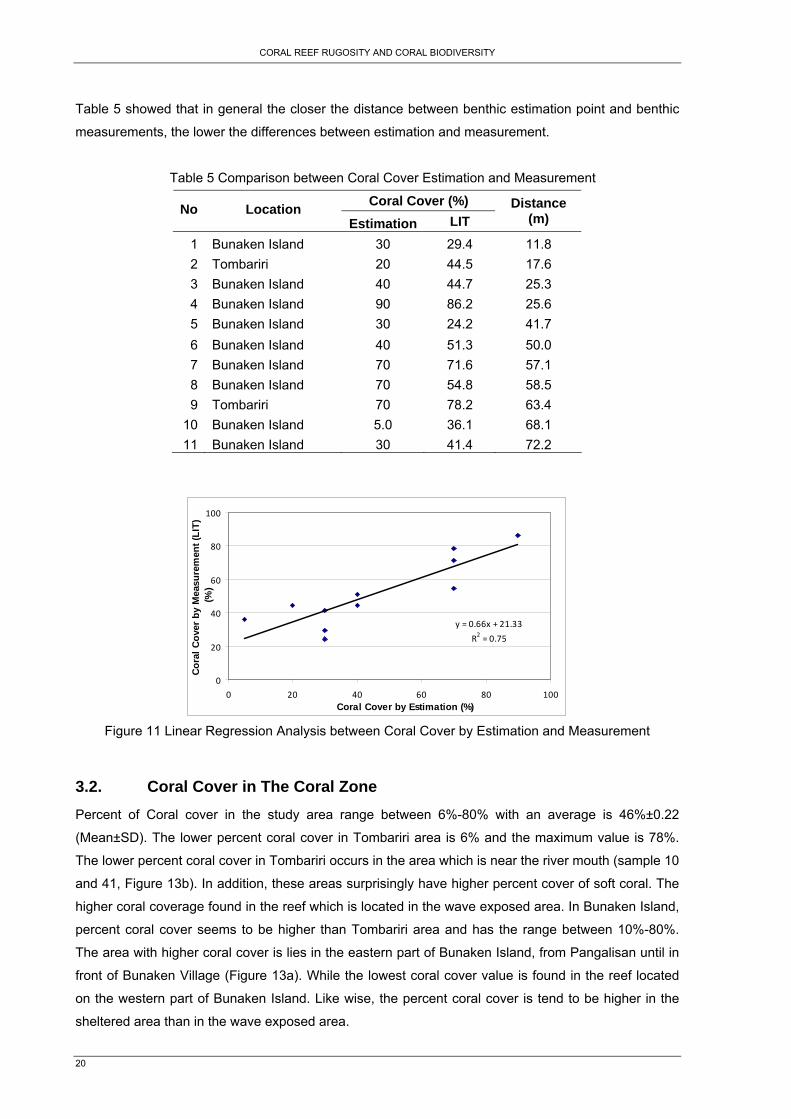
3.1.2. Comparison between Benthic Cover by Estimation and Measurement Comparison was done in order to know how well or reliable the result of benthic estimation is
compared to measurement (Table 5). The result shown that benthic cover resulted from estimation is
highly correlated with the value from Line intercept transect (r=0.866 df=9, p<0.001). The coefficient of
determinations of the linear regression between this two variable is high and statistically significant
(r2=0.75 df=9 t=5.193, p<0.001: fig 11). Therefore the benthic cover estimation is comparable with
benthic cover estimation by means Line Intercept Transect.
CORAL REEF RUGOSITY AND CORAL BIODIVERSITY
20
Table 5 showed that in general the closer the distance between benthic estimation point and benthic
measurements, the lower the differences between estimation and measurement.
Table 5 Comparison between Coral Cover Estimation and Measurement
Coral Cover (%) No Location Estimation LIT
Distance (m)
1 Bunaken Island 30 29.4 11.8 2 Tombariri 20 44.5 17.6 3 Bunaken Island 40 44.7 25.3 4 Bunaken Island 90 86.2 25.6 5 Bunaken Island 30 24.2 41.7 6 Bunaken Island 40 51.3 50.0 7 Bunaken Island 70 71.6 57.1 8 Bunaken Island 70 54.8 58.5 9 Tombariri 70 78.2 63.4
10 Bunaken Island 5.0 36.1 68.1 11 Bunaken Island 30 41.4 72.2
y = 0.66x + 21.33
R2 = 0.75
0
20
40
60
80
100
0 20 40 60 80 100Coral Cover by Estimation (%)
Cora
l Cov
er b
y M
easu
rem
ent (
LIT)
(%
)
Figure 11 Linear Regression Analysis between Coral Cover by Estimation and Measurement
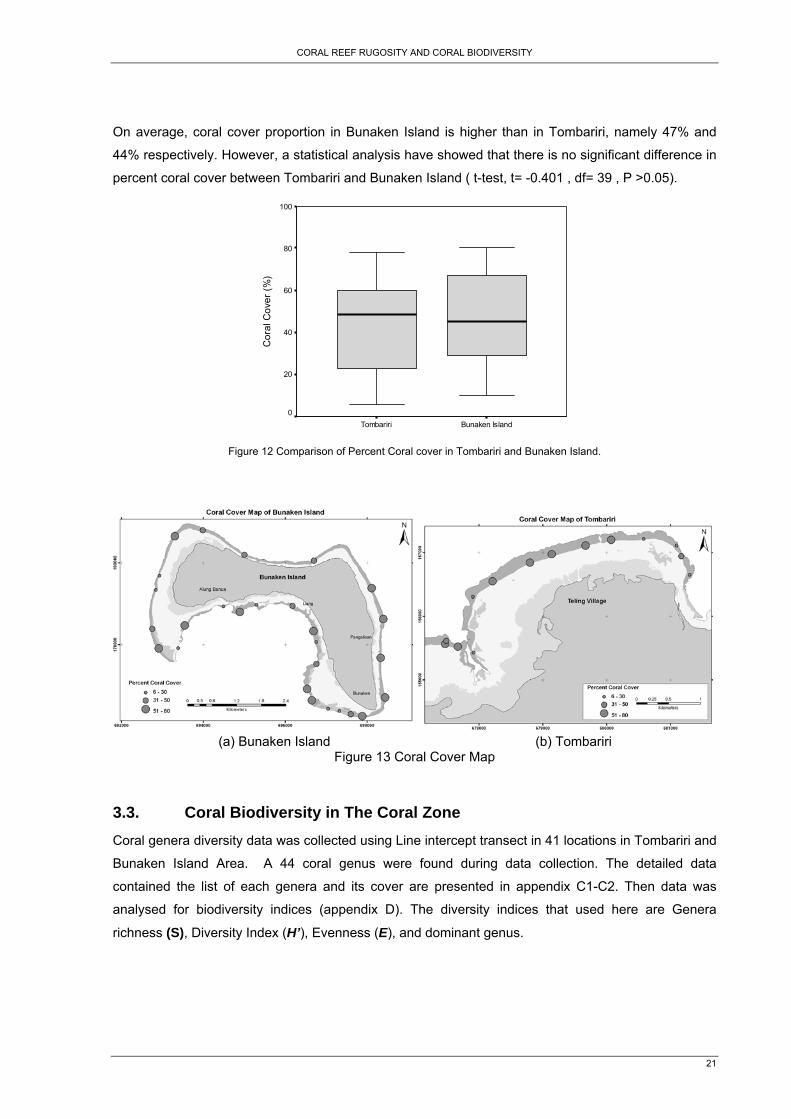
3.2. Coral Cover in The Coral Zone Percent of Coral cover in the study area range between 6%-80% with an average is 46%±0.22
(Mean±SD). The lower percent coral cover in Tombariri area is 6% and the maximum value is 78%.
The lower percent coral cover in Tombariri occurs in the area which is near the river mouth (sample 10
and 41, Figure 13b). In addition, these areas surprisingly have higher percent cover of soft coral. The
higher coral coverage found in the reef which is located in the wave exposed area. In Bunaken Island,
percent coral cover seems to be higher than Tombariri area and has the range between 10%-80%.
The area with higher coral cover is lies in the eastern part of Bunaken Island, from Pangalisan until in
front of Bunaken Village (Figure 13a). While the lowest coral cover value is found in the reef located
on the western part of Bunaken Island. Like wise, the percent coral cover is tend to be higher in the
sheltered area than in the wave exposed area.
CORAL REEF RUGOSITY AND CORAL BIODIVERSITY
21
On average, coral cover proportion in Bunaken Island is higher than in Tombariri, namely 47% and
44% respectively. However, a statistical analysis have showed that there is no significant difference in
percent coral cover between Tombariri and Bunaken Island ( t-test, t= -0.401 , df= 39 , P >0.05).
Bunaken IslandTombariri
Cor
al C
over
(%)
100
80
60
40
20
0
Figure 12 Comparison of Percent Coral cover in Tombariri and Bunaken Island.
(a) Bunaken Island (b) Tombariri
Figure 13 Coral Cover Map
3.3. Coral Biodiversity in The Coral Zone Coral genera diversity data was collected using Line intercept transect in 41 locations in Tombariri and
Bunaken Island Area. A 44 coral genus were found during data collection. The detailed data
contained the list of each genera and its cover are presented in appendix C1-C2. Then data was
analysed for biodiversity indices (appendix D). The diversity indices that used here are Genera
richness (S), Diversity Index (H’), Evenness (E), and dominant genus.
CORAL REEF RUGOSITY AND CORAL BIODIVERSITY
22
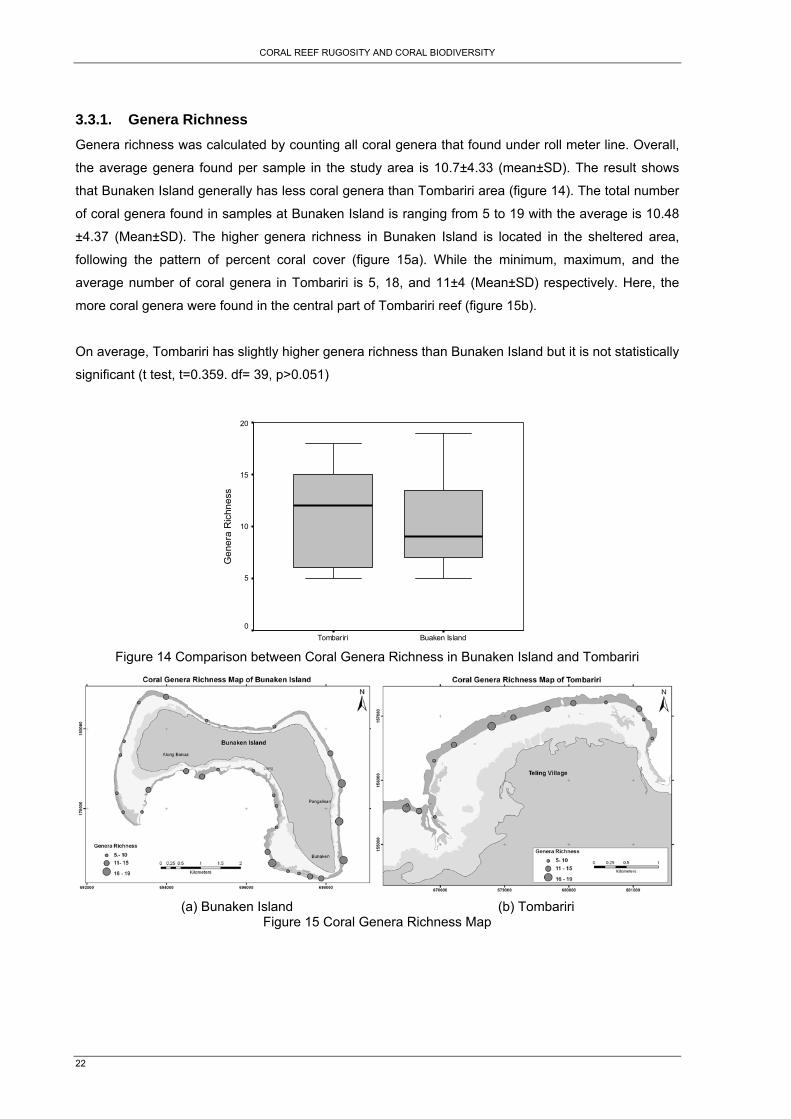
3.3.1. Genera Richness Genera richness was calculated by counting all coral genera that found under roll meter line. Overall,
the average genera found per sample in the study area is 10.7±4.33 (mean±SD). The result shows
that Bunaken Island generally has less coral genera than Tombariri area (figure 14). The total number
of coral genera found in samples at Bunaken Island is ranging from 5 to 19 with the average is 10.48
±4.37 (Mean±SD). The higher genera richness in Bunaken Island is located in the sheltered area,
following the pattern of percent coral cover (figure 15a). While the minimum, maximum, and the
average number of coral genera in Tombariri is 5, 18, and 11±4 (Mean±SD) respectively. Here, the
more coral genera were found in the central part of Tombariri reef (figure 15b).
On average, Tombariri has slightly higher genera richness than Bunaken Island but it is not statistically
significant (t test, t=0.359. df= 39, p>0.051)
Buaken IslandTombariri
Gen
era
Ric
hnes
s
20
15
10
5
0
Figure 14 Comparison between Coral Genera Richness in Bunaken Island and Tombariri
(a) Bunaken Island (b) Tombariri
Figure 15 Coral Genera Richness Map
CORAL REEF RUGOSITY AND CORAL BIODIVERSITY
23
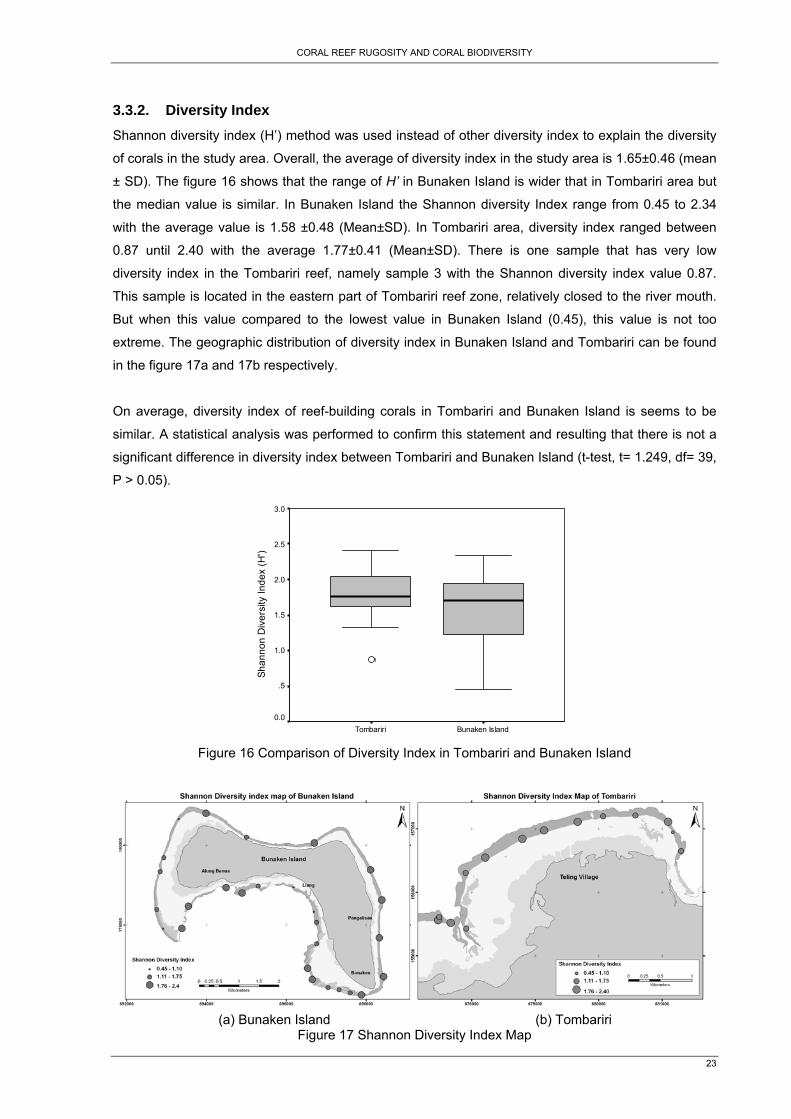
3.3.2. Diversity Index Shannon diversity index (H’) method was used instead of other diversity index to explain the diversity
of corals in the study area. Overall, the average of diversity index in the study area is 1.65±0.46 (mean
± SD). The figure 16 shows that the range of H’ in Bunaken Island is wider that in Tombariri area but
the median value is similar. In Bunaken Island the Shannon diversity Index range from 0.45 to 2.34
with the average value is 1.58 ±0.48 (Mean±SD). In Tombariri area, diversity index ranged between
0.87 until 2.40 with the average 1.77±0.41 (Mean±SD). There is one sample that has very low
diversity index in the Tombariri reef, namely sample 3 with the Shannon diversity index value 0.87.
This sample is located in the eastern part of Tombariri reef zone, relatively closed to the river mouth.
But when this value compared to the lowest value in Bunaken Island (0.45), this value is not too
extreme. The geographic distribution of diversity index in Bunaken Island and Tombariri can be found
in the figure 17a and 17b respectively.
On average, diversity index of reef-building corals in Tombariri and Bunaken Island is seems to be
similar. A statistical analysis was performed to confirm this statement and resulting that there is not a
significant difference in diversity index between Tombariri and Bunaken Island (t-test, t= 1.249, df= 39,
P > 0.05).
Bunaken IslandTombariri
Shan
non
Div
ersi
ty In
dex
(H')
3.0
2.5
2.0
1.5
1.0
.5
0.0
1
Figure 16 Comparison of Diversity Index in Tombariri and Bunaken Island
(a) Bunaken Island (b) Tombariri
Figure 17 Shannon Diversity Index Map
CORAL REEF RUGOSITY AND CORAL BIODIVERSITY
24
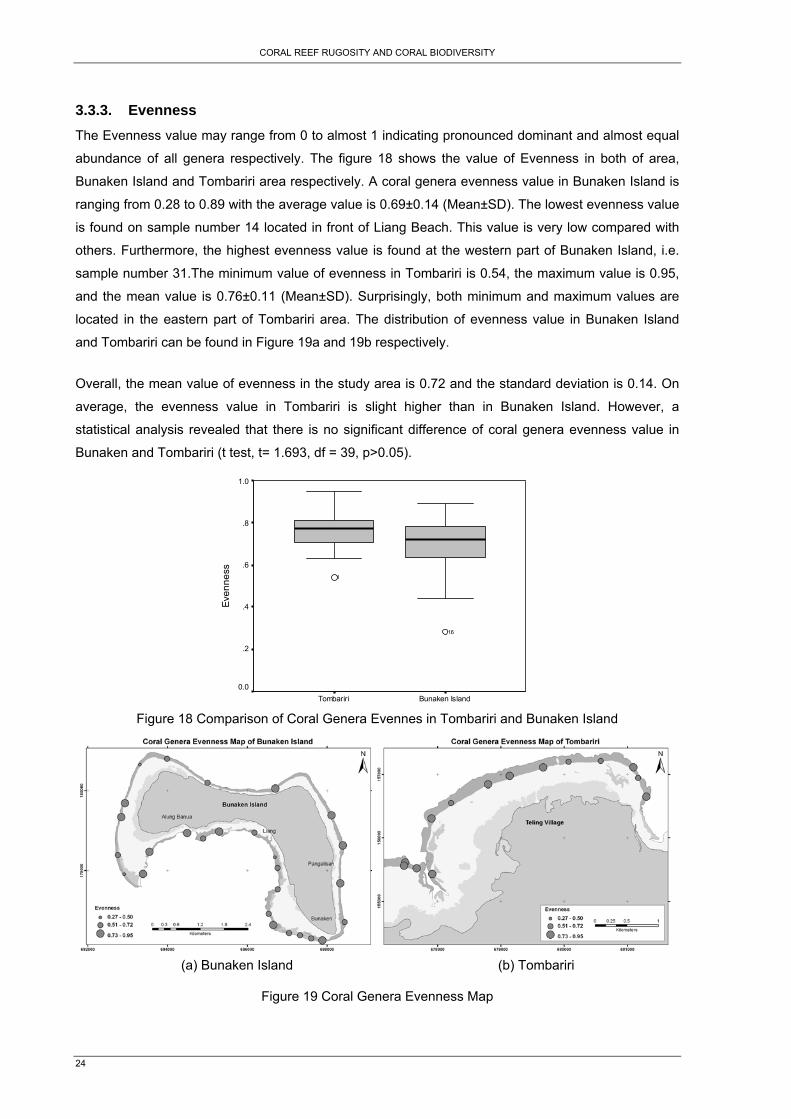
3.3.3. Evenness The Evenness value may range from 0 to almost 1 indicating pronounced dominant and almost equal
abundance of all genera respectively. The figure 18 shows the value of Evenness in both of area,
Bunaken Island and Tombariri area respectively. A coral genera evenness value in Bunaken Island is
ranging from 0.28 to 0.89 with the average value is 0.69±0.14 (Mean±SD). The lowest evenness value
is found on sample number 14 located in front of Liang Beach. This value is very low compared with
others. Furthermore, the highest evenness value is found at the western part of Bunaken Island, i.e.
sample number 31.The minimum value of evenness in Tombariri is 0.54, the maximum value is 0.95,
and the mean value is 0.76±0.11 (Mean±SD). Surprisingly, both minimum and maximum values are
located in the eastern part of Tombariri area. The distribution of evenness value in Bunaken Island
and Tombariri can be found in Figure 19a and 19b respectively.
Overall, the mean value of evenness in the study area is 0.72 and the standard deviation is 0.14. On
average, the evenness value in Tombariri is slight higher than in Bunaken Island. However, a
statistical analysis revealed that there is no significant difference of coral genera evenness value in
Bunaken and Tombariri (t test, t= 1.693, df = 39, p>0.05).
Bunaken IslandTombariri
Even
ness
1.0
.8
.6
.4
.2
0.0
16
1
Figure 18 Comparison of Coral Genera Evennes in Tombariri and Bunaken Island
(a) Bunaken Island (b) Tombariri
Figure 19 Coral Genera Evenness Map
CORAL REEF RUGOSITY AND CORAL BIODIVERSITY
25
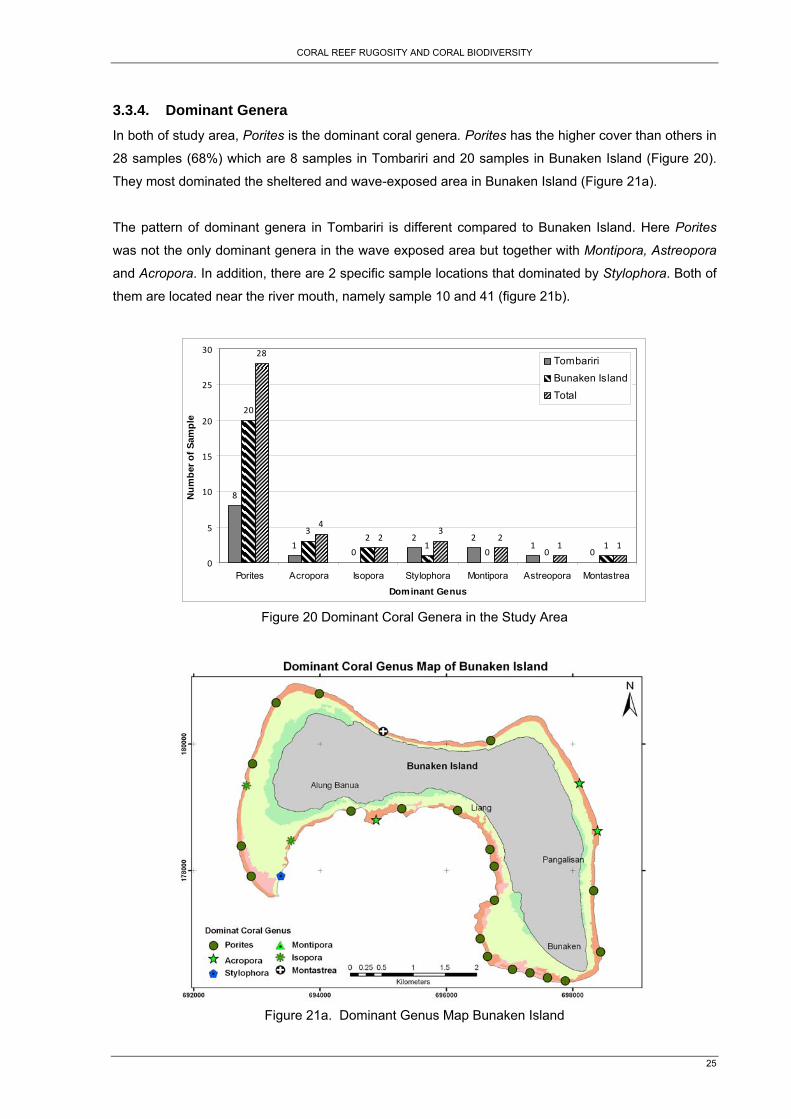
3.3.4. Dominant Genera In both of study area, Porites is the dominant coral genera. Porites has the higher cover than others in
28 samples (68%) which are 8 samples in Tombariri and 20 samples in Bunaken Island (Figure 20).
They most dominated the sheltered and wave-exposed area in Bunaken Island (Figure 21a).
The pattern of dominant genera in Tombariri is different compared to Bunaken Island. Here Porites
was not the only dominant genera in the wave exposed area but together with Montipora, Astreopora
and Acropora. In addition, there are 2 specific sample locations that dominated by Stylophora. Both of
them are located near the river mouth, namely sample 10 and 41 (figure 21b).
8
10
2 21
0
20
32
10 0
1
28
4
23
21 1
0
5
10
15
20
25
30
Porites Acropora Isopora Stylophora Montipora Astreopora Montastrea
Dominant Genus
Num
ber o
f Sam
ple
Tombariri
Bunaken Island
Total
Figure 20 Dominant Coral Genera in the Study Area
Figure 21a. Dominant Genus Map Bunaken Island
CORAL REEF RUGOSITY AND CORAL BIODIVERSITY
26
21b. Tombariri
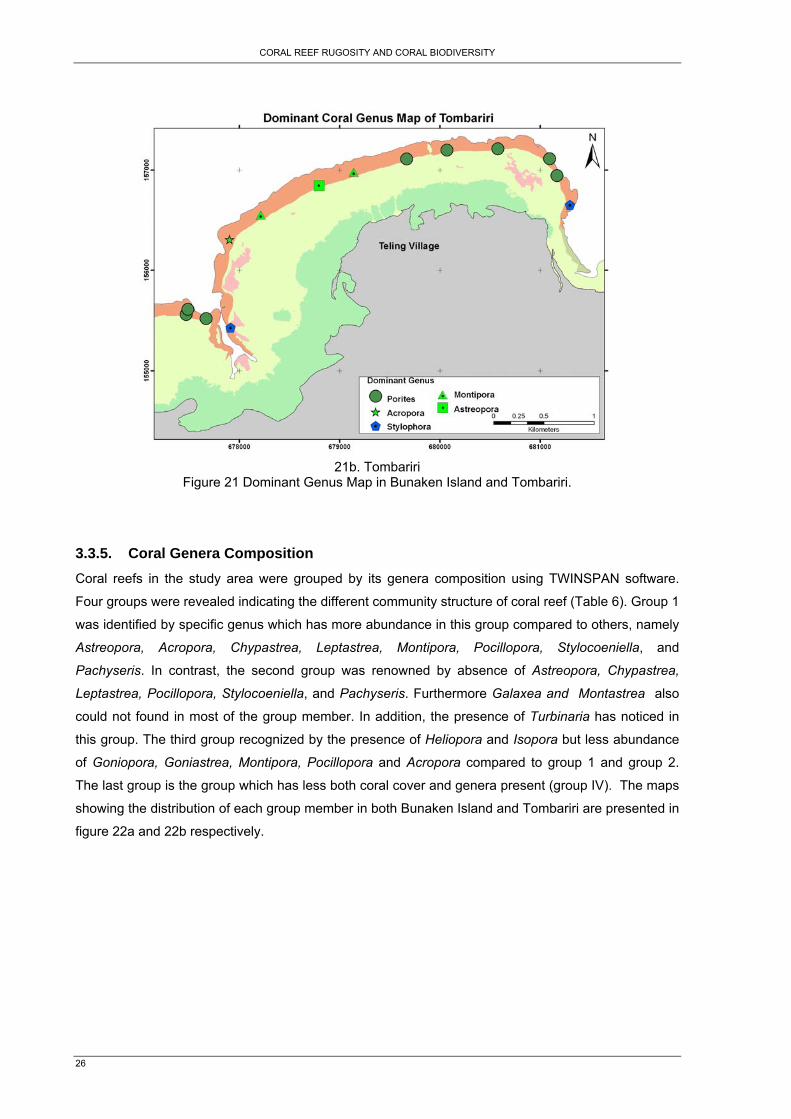
Figure 21 Dominant Genus Map in Bunaken Island and Tombariri.
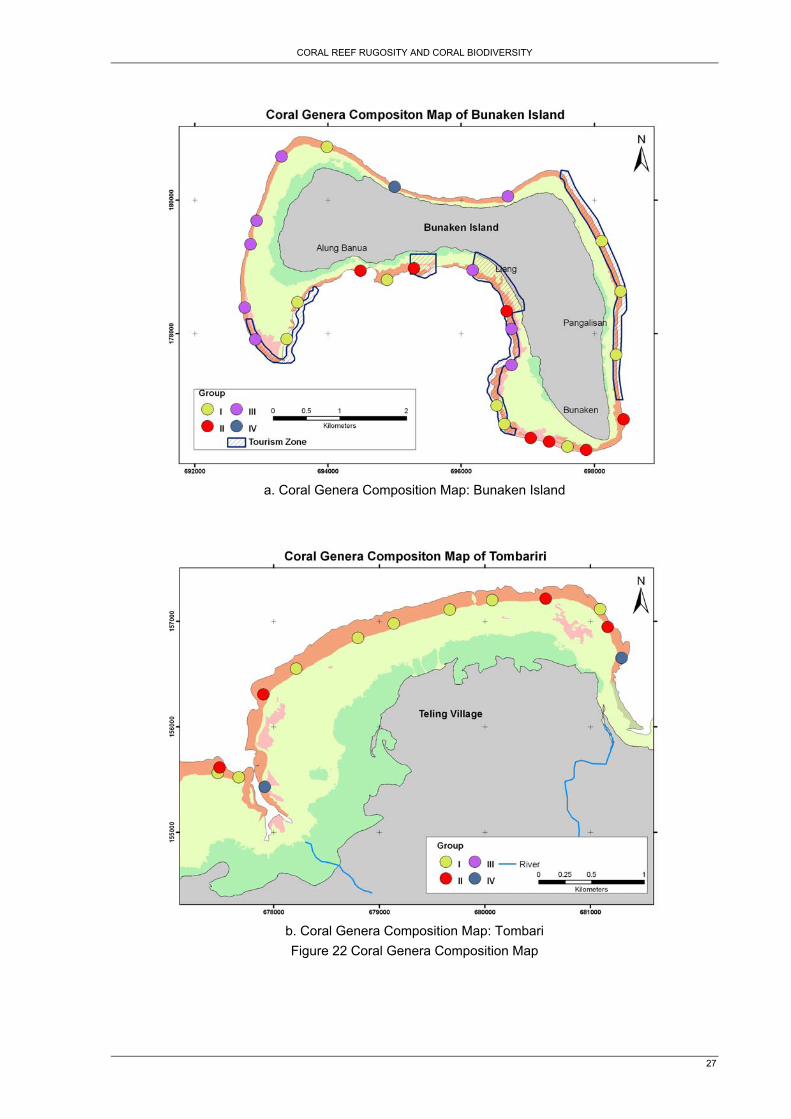
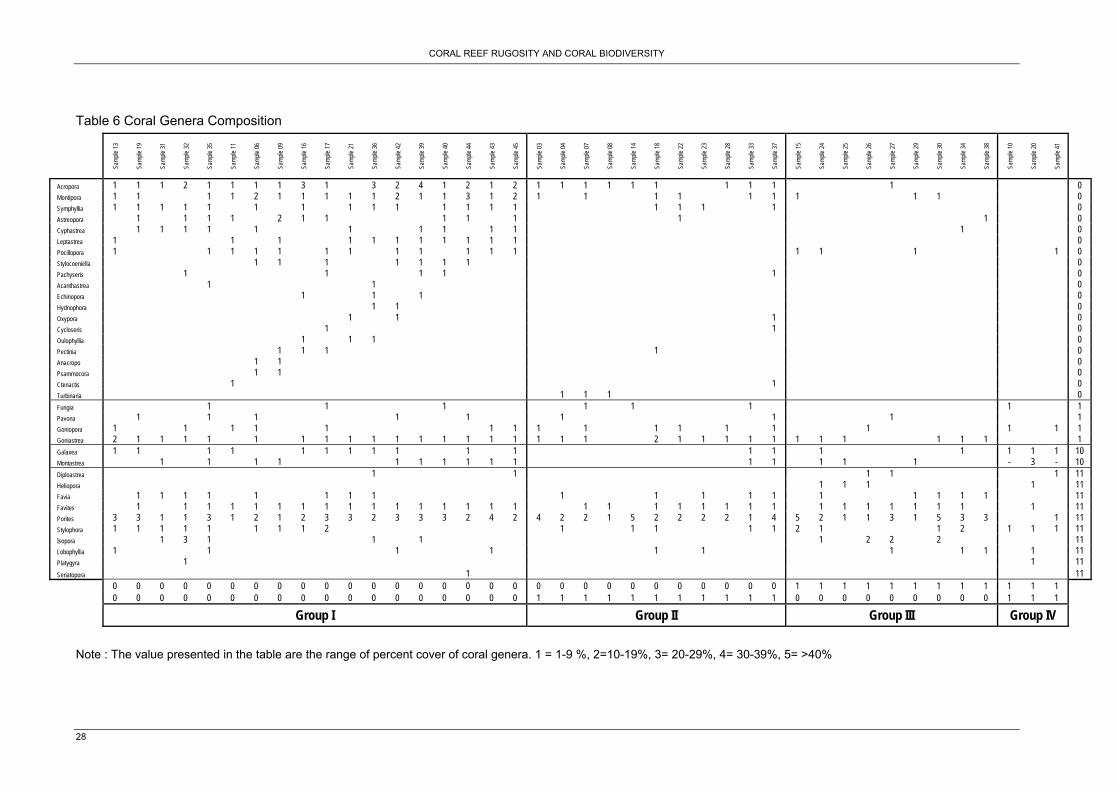
3.3.5. Coral Genera Composition Coral reefs in the study area were grouped by its genera composition using TWINSPAN software.
Four groups were revealed indicating the different community structure of coral reef (Table 6). Group 1
was identified by specific genus which has more abundance in this group compared to others, namely
Astreopora, Acropora, Chypastrea, Leptastrea, Montipora, Pocillopora, Stylocoeniella, and
Pachyseris. In contrast, the second group was renowned by absence of Astreopora, Chypastrea,
Leptastrea, Pocillopora, Stylocoeniella, and Pachyseris. Furthermore Galaxea and Montastrea also
could not found in most of the group member. In addition, the presence of Turbinaria has noticed in
this group. The third group recognized by the presence of Heliopora and Isopora but less abundance
of Goniopora, Goniastrea, Montipora, Pocillopora and Acropora compared to group 1 and group 2.
The last group is the group which has less both coral cover and genera present (group IV). The maps
showing the distribution of each group member in both Bunaken Island and Tombariri are presented in
figure 22a and 22b respectively.
CORAL REEF RUGOSITY AND CORAL BIODIVERSITY
27
a. Coral Genera Composition Map: Bunaken Island
b. Coral Genera Composition Map: Tombari Figure 22 Coral Genera Composition Map
CORAL REEF RUGOSITY AND CORAL BIODIVERSITY
28
Table 6 Coral Genera Composition
Samp
le 13
Samp
le 19
Samp
le 31
Samp
le 32
Samp
le 35
Samp
le 11
Samp
le 06
Samp
le 09
Samp
le 16
Samp
le 17
Samp
le 21
Samp
le 36
Samp
le 42
Samp
le 39
Samp
le 40
Samp
le 44
Samp
le 43
Samp
le 45
Samp
le 03
Samp
le 04
Samp
le 07
Samp
le 08
Samp
le 14
Samp
le 18
Samp
le 22
Samp
le 23
Samp
le 28
Samp
le 33
Samp
le 37
Samp
le 15
Samp
le 24
Samp
le 25
Samp
le 26
Samp
le 27
Samp
le 29
Samp
le 30
Samp
le 34
Samp
le 38
Samp
le 10
Samp
le 20
Samp
le 41
Acropora 1 1 1 2 1 1 1 1 3 1 3 2 4 1 2 1 2 1 1 1 1 1 1 1 1 1 1 0 Montipora 1 1 1 1 2 1 1 1 1 1 2 1 1 3 1 2 1 1 1 1 1 1 1 1 1 0 Symphyllia 1 1 1 1 1 1 1 1 1 1 1 1 1 1 1 1 1 1 0 Astreopora 1 1 1 1 2 1 1 1 1 1 1 1 0 Cyphastrea 1 1 1 1 1 1 1 1 1 1 1 0 Leptastrea 1 1 1 1 1 1 1 1 1 1 1 0 Pocillopora 1 1 1 1 1 1 1 1 1 1 1 1 1 1 1 1 0 Stylocoeniella 1 1 1 1 1 1 1 0 Pachyseris 1 1 1 1 1 0 Acanthastrea 1 1 0 Echinopora 1 1 1 0 Hydnophora 1 1 0 Oxypora 1 1 1 0 Cycloseris 1 1 0 Oulophyllia 1 1 1 0 Pectinia 1 1 1 1 0 Anacropo 1 1 0 Psammocora 1 1 0 Ctenactis 1 1 0 Turbinaria 1 1 1 0 Fungia 1 1 1 1 1 1 1 1 Pavona 1 1 1 1 1 1 1 1 1 Goniopora 1 1 1 1 1 1 1 1 1 1 1 1 1 1 1 1 1 Goniastrea 2 1 1 1 1 1 1 1 1 1 1 1 1 1 1 1 1 1 1 2 1 1 1 1 1 1 1 1 1 1 1 1 Galaxea 1 1 1 1 1 1 1 1 1 1 1 1 1 1 1 1 1 1 10 Montastrea 1 1 1 1 1 1 1 1 1 1 1 1 1 1 1 - 3 - 10 Diploastrea 1 1 1 1 1 11 Heliopora 1 1 1 1 11 Favia 1 1 1 1 1 1 1 1 1 1 1 1 1 1 1 1 1 1 11 Favites 1 1 1 1 1 1 1 1 1 1 1 1 1 1 1 1 1 1 1 1 1 1 1 1 1 1 1 1 1 1 1 1 11 Porites 3 3 1 1 3 1 2 1 2 3 3 2 3 3 3 2 4 2 4 2 2 1 5 2 2 2 2 1 4 5 2 1 1 3 1 5 3 3 1 11 Stylophora 1 1 1 1 1 1 1 1 2 1 1 1 1 1 2 1 1 2 1 1 1 11 Isopora 1 3 1 1 1 1 2 2 2 11 Lobophyllia 1 1 1 1 1 1 1 1 1 1 11 Platygyra 1 1 11 Seriatopora 1 11 0 0 0 0 0 0 0 0 0 0 0 0 0 0 0 0 0 0 0 0 0 0 0 0 0 0 0 0 0 1 1 1 1 1 1 1 1 1 1 1 1 0 0 0 0 0 0 0 0 0 0 0 0 0 0 0 0 0 0 1 1 1 1 1 1 1 1 1 1 1 0 0 0 0 0 0 0 0 0 1 1 1
Group I Group II Group III Group IV
Note : The value presented in the table are the range of percent cover of coral genera. 1 = 1-9 %, 2=10-19%, 3= 20-29%, 4= 30-39%, 5= >40%
CORAL REEF RUGOSITY AND CORAL BIODIVERSITY
29
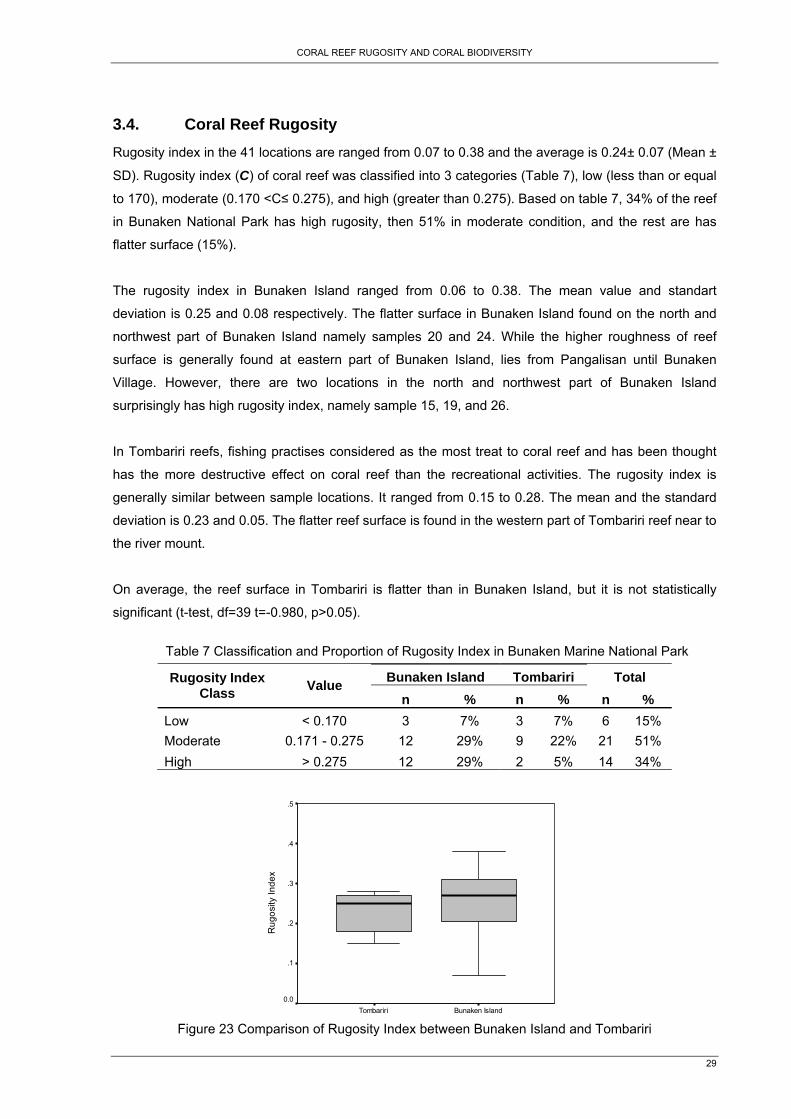
3.4. Coral Reef Rugosity Rugosity index in the 41 locations are ranged from 0.07 to 0.38 and the average is 0.24± 0.07 (Mean ±
SD). Rugosity index (C) of coral reef was classified into 3 categories (Table 7), low (less than or equal
to 170), moderate (0.170 <C≤ 0.275), and high (greater than 0.275). Based on table 7, 34% of the reef
in Bunaken National Park has high rugosity, then 51% in moderate condition, and the rest are has
flatter surface (15%).
The rugosity index in Bunaken Island ranged from 0.06 to 0.38. The mean value and standart
deviation is 0.25 and 0.08 respectively. The flatter surface in Bunaken Island found on the north and
northwest part of Bunaken Island namely samples 20 and 24. While the higher roughness of reef
surface is generally found at eastern part of Bunaken Island, lies from Pangalisan until Bunaken
Village. However, there are two locations in the north and northwest part of Bunaken Island
surprisingly has high rugosity index, namely sample 15, 19, and 26.
In Tombariri reefs, fishing practises considered as the most treat to coral reef and has been thought
has the more destructive effect on coral reef than the recreational activities. The rugosity index is
generally similar between sample locations. It ranged from 0.15 to 0.28. The mean and the standard
deviation is 0.23 and 0.05. The flatter reef surface is found in the western part of Tombariri reef near to
the river mount.
On average, the reef surface in Tombariri is flatter than in Bunaken Island, but it is not statistically
significant (t-test, df=39 t=-0.980, p>0.05).
Table 7 Classification and Proportion of Rugosity Index in Bunaken Marine National Park
Bunaken Island Tombariri Total Rugosity Index Class Value
n % n % n % Low < 0.170 3 7% 3 7% 6 15% Moderate 0.171 - 0.275 12 29% 9 22% 21 51% High > 0.275 12 29% 2 5% 14 34%
Bunaken IslandTombariri
Rug
osity
Inde
x
.5
.4
.3
.2
.1
0.0
Figure 23 Comparison of Rugosity Index between Bunaken Island and Tombariri
CORAL REEF RUGOSITY AND CORAL BIODIVERSITY
30
(a) Bunaken Island (b) Tombariri
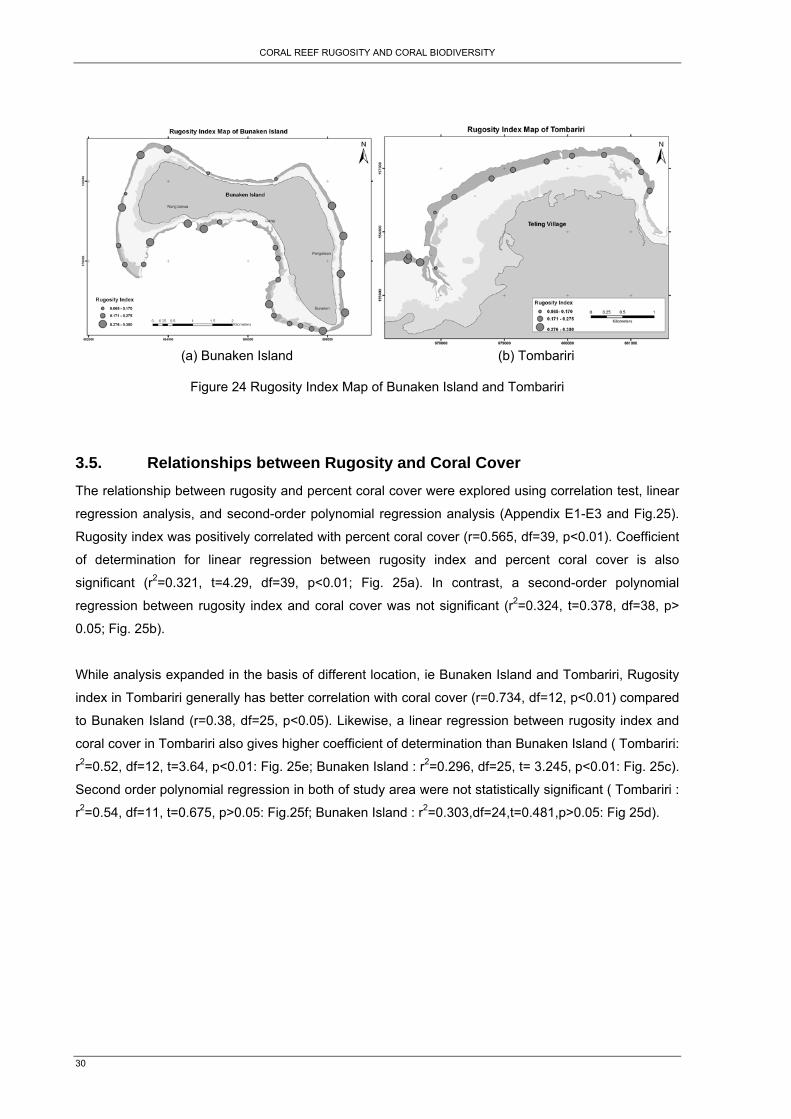
Figure 24 Rugosity Index Map of Bunaken Island and Tombariri
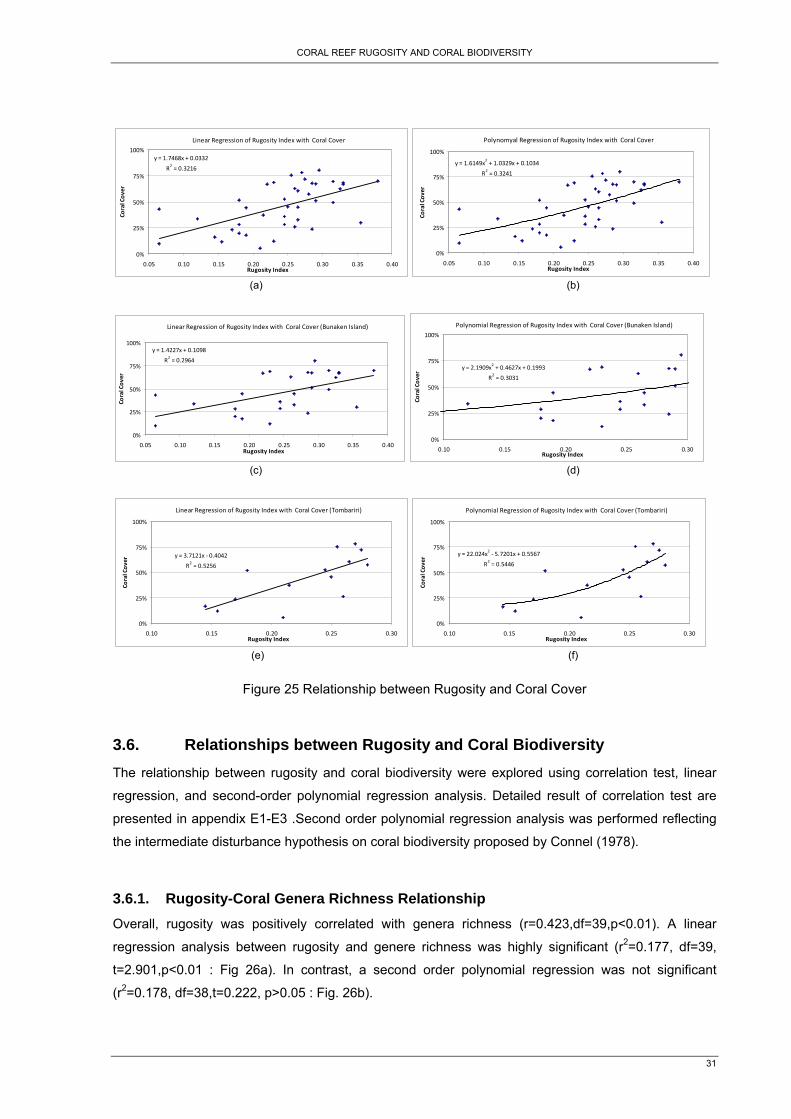
3.5. Relationships between Rugosity and Coral Cover The relationship between rugosity and percent coral cover were explored using correlation test, linear
regression analysis, and second-order polynomial regression analysis (Appendix E1-E3 and Fig.25).
Rugosity index was positively correlated with percent coral cover (r=0.565, df=39, p<0.01). Coefficient
of determination for linear regression between rugosity index and percent coral cover is also
significant (r2=0.321, t=4.29, df=39, p<0.01; Fig. 25a). In contrast, a second-order polynomial
regression between rugosity index and coral cover was not significant (r2=0.324, t=0.378, df=38, p>
0.05; Fig. 25b).
While analysis expanded in the basis of different location, ie Bunaken Island and Tombariri, Rugosity
index in Tombariri generally has better correlation with coral cover (r=0.734, df=12, p<0.01) compared
to Bunaken Island (r=0.38, df=25, p<0.05). Likewise, a linear regression between rugosity index and
coral cover in Tombariri also gives higher coefficient of determination than Bunaken Island ( Tombariri:
r2=0.52, df=12, t=3.64, p<0.01: Fig. 25e; Bunaken Island : r2=0.296, df=25, t= 3.245, p<0.01: Fig. 25c).
Second order polynomial regression in both of study area were not statistically significant ( Tombariri :
r2=0.54, df=11, t=0.675, p>0.05: Fig.25f; Bunaken Island : r2=0.303,df=24,t=0.481,p>0.05: Fig 25d).
CORAL REEF RUGOSITY AND CORAL BIODIVERSITY
31
Linear Regression of Rugosity Index with Coral Cover
y = 1.7468x + 0.0332
R2 = 0.3216
0%
25%
50%
75%
100%
0.05 0.10 0.15 0.20 0.25 0.30 0.35 0.40Rugosity Index
Coral Cover
Polynomyal Regression of Rugosity Index with Coral Cover
y = 1.6149x2 + 1.0329x + 0.1034
R2 = 0.3241
0%
25%
50%
75%
100%
0.05 0.10 0.15 0.20 0.25 0.30 0.35 0.40Rugosity Index
Coral Cov
er
(a) (b)
Linear Regression of Rugosity Index with Coral Cover (Bunaken Island)
y = 1.4227x + 0.1098
R2 = 0.2964
0%
25%
50%
75%
100%
0.05 0.10 0.15 0.20 0.25 0.30 0.35 0.40Rugosity Index
Coral Cov
er
Polynomial Regression of Rugosity Index with Coral Cover (Bunaken Island)
y = 2.1909x2 + 0.4627x + 0.1993
R2 = 0.3031
0%
25%
50%
75%
100%
0.10 0.15 0.20 0.25 0.30Rugosity Index
Coral Cover
(c) (d)
Linear Regression of Rugosity Index with Coral Cover (Tombariri)
y = 3.7121x ‐ 0.4042
R2 = 0.5256
0%
25%
50%
75%
100%
0.10 0.15 0.20 0.25 0.30Rugosity Index
Coral Cover
Polynomial Regression of Rugosity Index with Coral Cover (Tombariri)
y = 22.024x2 ‐ 5.7201x + 0.5567
R2 = 0.5446
0%
25%
50%
75%
100%
0.10 0.15 0.20 0.25 0.30Rugosity Index
Coral Cov
er
(e) (f)
Figure 25 Relationship between Rugosity and Coral Cover
3.6. Relationships between Rugosity and Coral Biodiversity The relationship between rugosity and coral biodiversity were explored using correlation test, linear
regression, and second-order polynomial regression analysis. Detailed result of correlation test are
presented in appendix E1-E3 .Second order polynomial regression analysis was performed reflecting
the intermediate disturbance hypothesis on coral biodiversity proposed by Connel (1978).
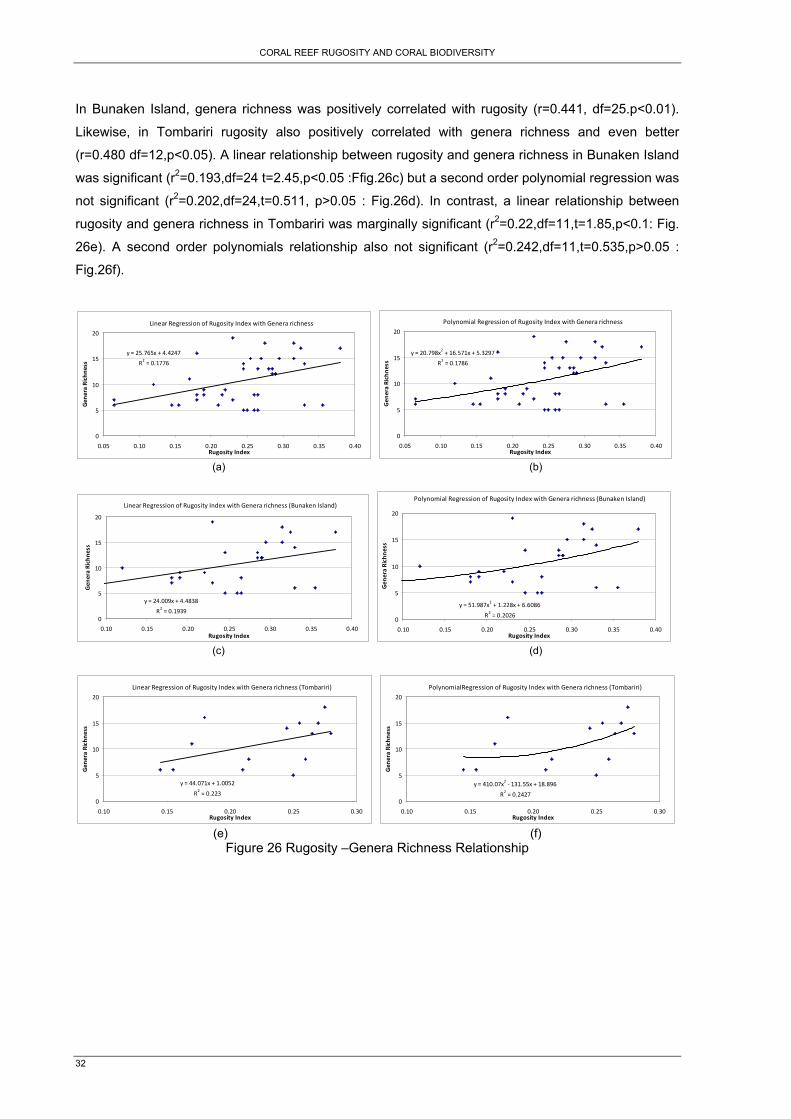
3.6.1. Rugosity-Coral Genera Richness Relationship Overall, rugosity was positively correlated with genera richness (r=0.423,df=39,p<0.01). A linear
regression analysis between rugosity and genere richness was highly significant (r2=0.177, df=39,
t=2.901,p<0.01 : Fig 26a). In contrast, a second order polynomial regression was not significant
(r2=0.178, df=38,t=0.222, p>0.05 : Fig. 26b).
CORAL REEF RUGOSITY AND CORAL BIODIVERSITY
32
In Bunaken Island, genera richness was positively correlated with rugosity (r=0.441, df=25.p<0.01).
Likewise, in Tombariri rugosity also positively correlated with genera richness and even better
(r=0.480 df=12,p<0.05). A linear relationship between rugosity and genera richness in Bunaken Island
was significant (r2=0.193,df=24 t=2.45,p<0.05 :Ffig.26c) but a second order polynomial regression was
not significant (r2=0.202,df=24,t=0.511, p>0.05 : Fig.26d). In contrast, a linear relationship between
rugosity and genera richness in Tombariri was marginally significant (r2=0.22,df=11,t=1.85,p<0.1: Fig.
26e). A second order polynomials relationship also not significant (r2=0.242,df=11,t=0.535,p>0.05 :
Fig.26f).
Linear Regression of Rugosity Index with Genera richness
y = 25.765x + 4.4247
R2 = 0.1776
0
5
10
15
20
0.05 0.10 0.15 0.20 0.25 0.30 0.35 0.40Rugosity Index
Gen
era Richness
Polynomial Regression of Rugosity Index with Genera richness
y = 20.798x2 + 16.571x + 5.3297
R2 = 0.1786
0
5
10
15
20
0.05 0.10 0.15 0.20 0.25 0.30 0.35 0.40Rugosity Index
Gen
era Richne
ss
(a) (b)
Linear Regression of Rugosity Index with Genera richness (Bunaken Island)
y = 24.009x + 4.4838
R2 = 0.19390
5
10
15
20
0.10 0.15 0.20 0.25 0.30 0.35 0.40Rugosity Index
Gen
era Richne
ss
Polynomial Regression of Rugosity Index with Genera richness (Bunaken Island)
y = 51.987x2 + 1.228x + 6.6086
R2 = 0.20260
5
10
15
20
0.10 0.15 0.20 0.25 0.30 0.35 0.40Rugosity Index
Gen
era Richne
ss
(c) (d)
Linear Regression of Rugosity Index with Genera richness (Tombariri)
y = 44.071x + 1.0052
R2 = 0.2230
5
10
15
20
0.10 0.15 0.20 0.25 0.30Rugosity Index
Gen
era Richne
ss
PolynomialRegression of Rugosity Index with Genera richness (Tombariri)
y = 410.07x2 ‐ 131.55x + 18.896
R2 = 0.24270
5
10
15
20
0.10 0.15 0.20 0.25 0.30Rugosity Index
Gen
era Richne
ss
(e) (f)
Figure 26 Rugosity –Genera Richness Relationship
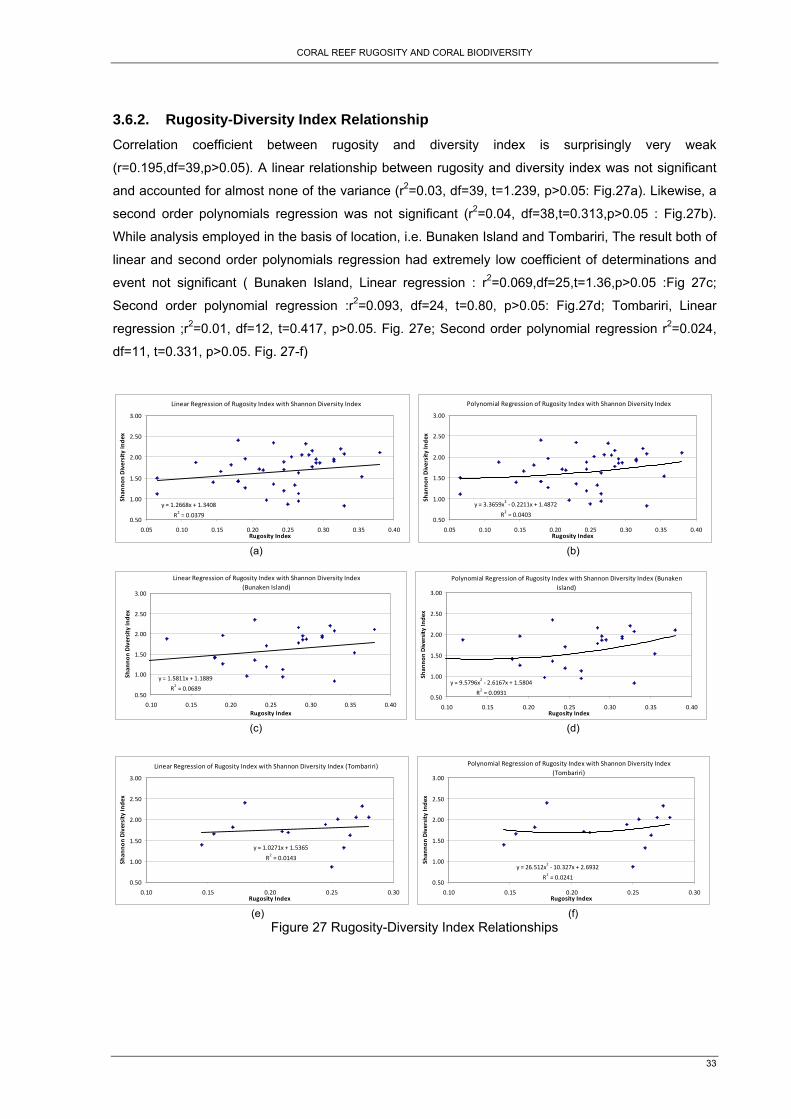
CORAL REEF RUGOSITY AND CORAL BIODIVERSITY
33
3.6.2. Rugosity-Diversity Index Relationship Correlation coefficient between rugosity and diversity index is surprisingly very weak
(r=0.195,df=39,p>0.05). A linear relationship between rugosity and diversity index was not significant
and accounted for almost none of the variance (r2=0.03, df=39, t=1.239, p>0.05: Fig.27a). Likewise, a
second order polynomials regression was not significant (r2=0.04, df=38,t=0.313,p>0.05 : Fig.27b).
While analysis employed in the basis of location, i.e. Bunaken Island and Tombariri, The result both of
linear and second order polynomials regression had extremely low coefficient of determinations and
event not significant ( Bunaken Island, Linear regression : r2=0.069,df=25,t=1.36,p>0.05 :Fig 27c;
Second order polynomial regression :r2=0.093, df=24, t=0.80, p>0.05: Fig.27d; Tombariri, Linear
regression ;r2=0.01, df=12, t=0.417, p>0.05. Fig. 27e; Second order polynomial regression r2=0.024,
df=11, t=0.331, p>0.05. Fig. 27-f)
Linear Regression of Rugosity Index with Shannon Diversity Index
y = 1.2668x + 1.3408
R2 = 0.03790.50
1.00
1.50
2.00
2.50
3.00
0.05 0.10 0.15 0.20 0.25 0.30 0.35 0.40Rugosity Index
Shan
non Diversity In
dex
Polynomial Regression of Rugosity Index with Shannon Diversity Index
y = 3.3659x2 ‐ 0.2211x + 1.4872
R2 = 0.04030.50
1.00
1.50
2.00
2.50
3.00
0.05 0.10 0.15 0.20 0.25 0.30 0.35 0.40Rugosity Index
Shan
non Diversity In
dex
(a) (b)
Linear Regression of Rugosity Index with Shannon Diversity Index
(Bunaken Island)
y = 1.5811x + 1.1889
R2 = 0.06890.50
1.00
1.50
2.00
2.50
3.00
0.10 0.15 0.20 0.25 0.30 0.35 0.40Rugosity Index
Shan
non Diversity In
dex
Polynomial Regression of Rugosity Index with Shannon Diversity Index (Bunaken Island)
y = 9.5796x2 ‐ 2.6167x + 1.5804
R2 = 0.09310.50
1.00
1.50
2.00
2.50
3.00
0.10 0.15 0.20 0.25 0.30 0.35 0.40Rugosity Index
Shan
non
Diversity In
dex
(c) (d)
Linear Regression of Rugosity Index with Shannon Diversity Index (Tombariri)
y = 1.0271x + 1.5365
R2 = 0.0143
0.50
1.00
1.50
2.00
2.50
3.00
0.10 0.15 0.20 0.25 0.30Rugosity Index
Shan
non Diversity In
dex
Polynomial Regression of Rugosity Index with Shannon Diversity Index (Tombariri)
y = 26.512x2 ‐ 10.327x + 2.6932
R2 = 0.02410.50
1.00
1.50
2.00
2.50
3.00
0.10 0.15 0.20 0.25 0.30Rugosity Index
Shan
non Diversity In
dex
(e) (f)
Figure 27 Rugosity-Diversity Index Relationships
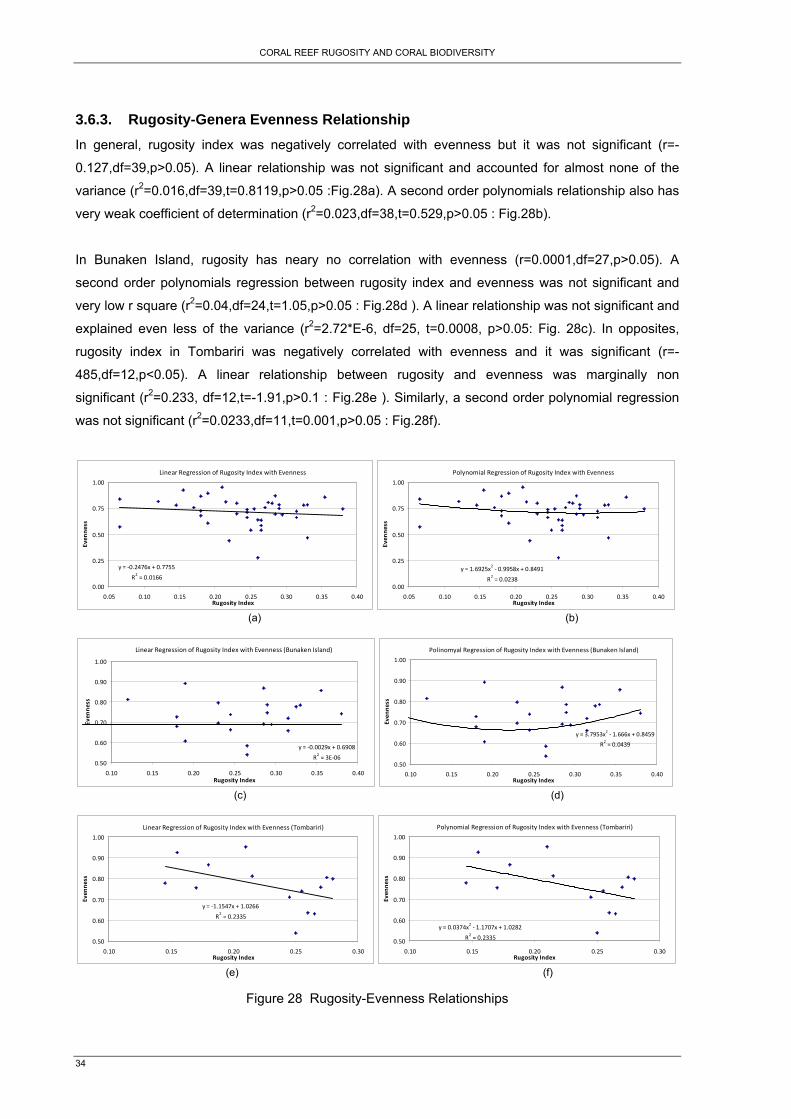
CORAL REEF RUGOSITY AND CORAL BIODIVERSITY
34
3.6.3. Rugosity-Genera Evenness Relationship In general, rugosity index was negatively correlated with evenness but it was not significant (r=-
0.127,df=39,p>0.05). A linear relationship was not significant and accounted for almost none of the
variance (r2=0.016,df=39,t=0.8119,p>0.05 :Fig.28a). A second order polynomials relationship also has
very weak coefficient of determination (r2=0.023,df=38,t=0.529,p>0.05 : Fig.28b).
In Bunaken Island, rugosity has neary no correlation with evenness (r=0.0001,df=27,p>0.05). A
second order polynomials regression between rugosity index and evenness was not significant and
very low r square (r2=0.04,df=24,t=1.05,p>0.05 : Fig.28d ). A linear relationship was not significant and
explained even less of the variance (r2=2.72*E-6, df=25, t=0.0008, p>0.05: Fig. 28c). In opposites,
rugosity index in Tombariri was negatively correlated with evenness and it was significant (r=-
485,df=12,p<0.05). A linear relationship between rugosity and evenness was marginally non
significant (r2=0.233, df=12,t=-1.91,p>0.1 : Fig.28e ). Similarly, a second order polynomial regression
was not significant (r2=0.0233,df=11,t=0.001,p>0.05 : Fig.28f).
Linear Regression of Rugosity Index with Evenness
y = ‐0.2476x + 0.7755
R2 = 0.01660.00
0.25
0.50
0.75
1.00
0.05 0.10 0.15 0.20 0.25 0.30 0.35 0.40Rugosity Index
Even
ness
Polynomial Regression of Rugosity Index with Evenness
y = 1.6925x2 ‐ 0.9958x + 0.8491
R2 = 0.02380.00
0.25
0.50
0.75
1.00
0.05 0.10 0.15 0.20 0.25 0.30 0.35 0.40Rugosity Index
Even
ness
(a) (b)
Linear Regression of Rugosity Index with Evenness (Bunaken Island)
y = ‐0.0029x + 0.6908
R2 = 3E‐060.50
0.60
0.70
0.80
0.90
1.00
0.10 0.15 0.20 0.25 0.30 0.35 0.40Rugosity Index
Even
ness
Polinomyal Regression of Rugosity Index with Evenness (Bunaken Island)
y = 3.7953x2 ‐ 1.666x + 0.8459
R2 = 0.0439
0.50
0.60
0.70
0.80
0.90
1.00
0.10 0.15 0.20 0.25 0.30 0.35 0.40Rugosity Index
Even
ness
(c) (d)
Linear Regression of Rugosity Index with Evenness (Tombariri)
y = ‐1.1547x + 1.0266
R2 = 0.2335
0.50
0.60
0.70
0.80
0.90
1.00
0.10 0.15 0.20 0.25 0.30Rugosity Index
Even
ness
Polynomial Regression of Rugosity Index with Evenness (Tombariri)
y = 0.0374x2 ‐ 1.1707x + 1.0282
R2 = 0.23350.50
0.60
0.70
0.80
0.90
1.00
0.10 0.15 0.20 0.25 0.30Rugosity Index
Even
ness
(e) (f)
Figure 28 Rugosity-Evenness Relationships
CORAL REEF RUGOSITY AND CORAL BIODIVERSITY
35
4. Discussion
4.1. Coral Cover in The Coral Zone In total, forty four corals genera were found during the three weeks field data collection with average
percent live coral cover 46%. The percent live coral cover in Bunaken Island and Tombariri doesn’t
have a significant difference. In Bunaken Island the highest percent coral cover is placed in the wave-
sheltered area especially in the east part of Bunaken Island. In contrast, in Tombariri the wave-
exposed area surprisingly has higher coral cover compared to those in sheltered area. Wave generally
reduce the abundance of coral by breaks the coral colony and turns into rubble, especially the
branching and foliose coral. How ever wave can also be as an agent for coral fragmentation that leads
to production of a new coral colony (Dollar 1982). In Tombariri, the low live coral cover in the wave
sheltered area might be due to sedimentation and run-off from nearby river. Compared to previous
research in the study area that conducted by Mehta in the year 1999, the spatial pattern of coral cover
was altered. In the year 1999 the highest percent coral cover was found in the western part of
Bunaken Island while the eastern part had a lower percent coral cover. This finding is contradicting
with the present result. It might be due to changes in disturbance and stressor gradients.
4.2. Coral Biodiversity There were no significant difference in the average of genera richness, Shannon diversity index and
evenness between Bunaken Island and Tombariri. Genera richness and diversity index in Bunaken
Island and Tombariri also has a similar distribution pattern with coral cover. Higher value of genera
richness and diversity index in Bunaken Island was also found in the wave-sheltered area. While in
Tombariri the higher value of genera richness and diversity index was found in wave-exposed area.
Comparisons with previous study and with others location were also performed in order to get insight
about the coral biodiversity in the study area. Nevertheless it is difficult to perform these comparisons.
Not only does the taxonomic expertise of the two sets of researchers have to be equivalent and the
methodologies comparable but also the location must be specified in both studies. In our study we
choose coral genera level instead of species level because of limited experience of the observers. The
most recent study that conducted in the Bunaken National Park is who conducted by Turak and de
vantier (2004). In total, they found 390 species from 63 genera and 15 families of reef-building corals.
Compared with our results, this finding is higher. It may be because of them also investigating coral
biodiversity not only in the shallow water area, but also in the deeper area. Another possible reason is
because we only did the line intercept sampling in the coral zone in Bunaken Island and Tombariri but
they did in the whole area of The Bunaken National Park. A recent study that conducted by scientist in
Pulau Seribu Reef complex Indonesia found a total of 13 families,44 genera, and 158 Species (Cleary
et al. 2006). Overall, the total number of genera found in both of study area (44 coral genera) is high
CORAL REEF RUGOSITY AND CORAL BIODIVERSITY
36
compared to similar study that conducted by Meixia in Luhuitou reef, Senya China. They only found 24
genera and 69 coral species (Meixia et al. 2008). Shannon diversity index in Bunaken National Park
consistently higher (1.65) compared to Lohuitou reef, Senya China (1.04) and even higher than in
Madang lagoon Papua New Guinea (1.11) (Pandolfi and Minchin 1996). Here confirmed that the
Bunaken National Parks has high coral biodiversity. However the coral genera in Bunaken National
park have uneven distribution since Porites was dominant in more than 65% of sample locations.
Further analysis was done by grouping the coral genera based on its occurrence and abundance.
Four groups of location that have a similar coral genera composition were revealed. In Bunaken
Island, it seems like there were 3 pattern of the distribution of group member of four coral genera
groups. In the eastern part of Bunaken Island, the reef was dominated by Astreopora, Acropora,
Chypastrea, Leptastrea, Montipora, Pocillopora, Stylocoeniella, and Pachyseris. (Group I) The second
is the reef that placed along Bunaken Village until in front of Tawara lagoon. Here the pattern is
uncertain; it might be due to high level of anthropogenic disturbance. This area is the centre of tourism
activities like diving, snorkelling, and bottom-glass touring (DeVantier and Turak 2004). The last, is the
reefs that located in the north and west portion of Bunaken Island that dominated by member of group
III. This is may be as a result of wave action that limits the occurrences of specific corals. Only corals
that have a strong structure and resistant to physical disturbance can growth in the wave exposed
area (Dollar 1982). In Tombariri, there was a specific group that located near the river mount namely
group IV. This group is the group which has less both coral cover and genera present. It might be
because of the sediment contamination and freshwater runoff from nearby river. In contrast, this
location has high percent cover of soft coral. Sedimentation in certain level will limits the coral growth
and coral recruitment. The presence of soft coral also has negative effect on corals. Some soft corals
can secrete a toxic that might be responsible for causing localized mortality and decreasing in
survivorship of hard corals (Sammarco et al. 1983; Fabricius 1997).
4.3. Comparing Coral Reef Rugosity In The Different Environmental Condition
The idea of comparing rugosity index in Bunaken Island and Tombariri is based on the different
environmental condition that may play a role in the structuring of the reef in the two areas. Bunaken
Island is high attractive location for tourist. Most of tourist activities are diving, snorkeling and bottom
glass touring. In contrast, reef in Tombariri historically are much more vulnerable due to destructive
fishing practises and sedimentation. It has been thought that tourism-related activities are has a less
effect on coral reef compared to the other utilization of the reef and fishing practises. Here, rugosity
index is used as an approach to the integrated and long term effect of disturbance on coral reef.
The rugosity index of coral reef in the study area is ranged from 0.07-0.38 and the overall average is
0.24. In Bunaken Island the mean rugosity index is 0.25 and in Tombariri 0.23. It seems that the reef
surface in Tombariri is flatter than in Bunaken Island. But an Independent t- test revealed that it was
not significant. It may imply that the different environmental condition in the study area did not have a
different effect on rugosity of coral reef. Both of disturbance and stressors in Bunaken Island and
CORAL REEF RUGOSITY AND CORAL BIODIVERSITY
37
Tombariri have the equal effect on coral reef rugosity. The effect of environmental condition that
measured by means of rugosity is an integrated and in the long term scale because the effect of
individual disturbance and stressor on coral reef are difficult or even almost impossible to separate
(Aronson and Precht 1995).
In Bunaken Island, where is highly-exploited tourist area, the disturbance may came from diving
related activities, snorkelling, and bottom-glass boat touring. Diving-related activities that can be a
cause of flattering the reef surface is anchoring the dive mark, the diving-boat anchoring, and
trampling. Diving activities itself is generally have less effect on the reef structure compared to the
diving related activity. Study that conducted in Bunaken National Park in 2005 revealed that the effect
of 3 boats that accidently strikes the coral reef are much more destructive than the effect of 100 divers
that dive in one location simultaneously (DeVantier and Turak 2004). In addition, the storm that occurs
in the period October to March also as a source of disturbance, especially for the reef that lays on the
north-west side of Bunaken Island. Both of these disturbances results in an increase in coral
fragmentation and a loss of three dimensional structural complexity of the reef (Rogers 1993; Zakai
and Chadwick-Furman 2002; Fava et al. 2009).
In Tombariri area, the anthropogenic factor which is considered as a major treat to coral reef is
destructive fishing practices. This area was historically severe from blast fishing and other destructive
fishing techniques. Blast fishing is anthropogenic disturbance that physically change the reef structure
and turned into lower rugosity (Fox and Caldwell 2006). It was not only kills the targeted fish but also
breaks the coral skeleton and creates coral rubble. Blast fishing is illegally fishing method, but wide
spread and considered as a major treat to reefs (McManus et al. 1997). Over 50% of coral reefs in
South East Asia are threatened from this illegal activity. However, a recent study that conducted in
Komodo National Park, Indonesia revealed that the reefs that severe from blasting are considerably
recover in 5 years (Fox and Caldwell 2006) .But the recovery rate of coral reef after blasting might be
different over the area due to recruitment ability and others factors. Reefs affected by anthropogenic
mechanical damage such as blasting can recover from that damage if two conditions are met. First,
they are protected from further damage and the second is some reefs in the area are undamaged
(Pearson 1981; Edinger et al. 1998). The reefs in Tombariri area also had more severe from
sedimentation than Bunaken Island. Sedimentation will limit the coral growth; as a result it will inhibit
the reef development (McClanahan and Obura 1997). As a consequence, the rugosity index in the
location that near to the river generally has lower value (sample 10 and 41).
During the field work, we noticed that the reef most exposed to wave action (those on the northwest-
facing portions of Bunaken Island and Tombariri) especially in Bunaken Island had a flatter terrain
than those in more protected positions. Wave action generally reduces the rugosity of the reefs by
breaks the corals structure especially the branching corals. Therefore, the analysis was expanded in
the basis of wave-exposure level, i.e. wave-exposed area and wave sheltered area. On the average,
rugosity index in the wave exposed area is lower than in wave-sheltered area, namely 0.23±0.08 and
0.26±0.06 respectively (Mean±SD). Surprisingly, the statistical analysis shown that there was not
CORAL REEF RUGOSITY AND CORAL BIODIVERSITY
38
significant different in rugosity index between coral reef in the wave-exposed area and wave-sheltered
area (t-test, df=39, t=1.277, p>0.05: appendix F2.). This finding is contradicting with similar study that
conducted in Belize, Jamaican and Hawaiian coral reefs. The reefs in those areas that placed in the
wave-exposed area are significantly flatter than in the wave-sheltered area (Aronson et al. 1994;
Aronson and Precht 1995; Friedlander et al. 2003; Alvarez-Filip et al. 2009). The possible reason is
that the wave action is not the only major variable that structuring the reefs in the study area. The
possible factor that together with wave action in structuring the coral reef in Bunaken National Park is
anthropogenic influence as mentioned above. The second possible reason is since we have two
locations that separated kilometres away, the wave action might be different, it should not only
analyzed in the basis of wave exposure but also combined with the Island basis (Bunaken Island and
Tombariri). Thus, the future work with the specific sampling design is definitely needed if we want to
compare the rugosity index between wave -exposed and wave-sheltered area.
In order to get insight about the status of coral reef rugosity in Bunaken National Park, comparison
between rugosity index in Bunaken Island and elsewhere was also performed. So far, the coral reef
rugosity status is well documented in the Caribbean coral reefs. In Carrybow Cay and Curlew reefs
Belize, rugosity index is ranged from 0.2 to almost 0.8 (Aronson and Precht 1995). A recent study that
conducted in Caribbean region involving 250 sampling sites also revealed that the range of rugosity
index in that region is from 0.1 to 0.8 (Alvarez-Filip et al. 2009) . Similar study that conducted in
Hawaiian coral reef shown that the rugosity index of coral reef in this area ranged from 0.28 to 0.64
(Friedlander et al. 2003). They also found a trend in decreasing surface roughness in Caribbean
region during last decades. In the periods of 1969-2009, the proportion of complex reef (rugosity>0.5)
has decline from 45% to 2%. And the average of rugosity index also decreases from 0.65 to 0.3. They
suggest that this flattering process might be due to anthropogenic and natural disturbances. Special
concern is given to anthropogenic disturbance that rising dramatically in the last decade. Compared to
Bunaken National Park, those values are higher. In Bunaken National Park there was no one of
samples location that had rugosity index more than 0.4. Most of them (51%) are between 0.171-0.275.
But the mean value of rugosity index in Bunaken National Park is only slight lower that in those in
Caribbean, namely 0.24 and 0.3 respectively.
In summary, the coral reef that sited in the different environmental setting in Bunaken Island and
Tombariri did not have a different rugosity index. If compared to other area in the world the average of
rugosity index in Bunaken National Park is slight lower but can be assume to be a similar. This
flattering of reef surface is as a result of both natural and anthropogenic disturbance that
simultaneously faced by the reef.
CORAL REEF RUGOSITY AND CORAL BIODIVERSITY
39
4.4. Relationship between Rugosity-Coral Cover, and Coral Biodiversity The relationships between rugosity, percent coral cover and coral biodiversity were explored using
correlation test and linear regression analysis. Since rugosity is also indicator for integrated and long-
term disturbance, a second order polynomial regression analysis also was employed. A second order
polynomial regression curve is predicted to be concave downward reflects the intermediate
disturbance hypothesis that stated diversity will be maximal in the intermediate level of disturbance.
Based on correlation analysis, percent coral cover is the most variable that highly significant and
positively correlated with rugosity index in Bunaken National Park(r=0.565, p<0.01). The coefficient of
determination for linear regression between rugosity index and percent coral cover is also highly
significant (r2=0.321 p<0.01). Tombariri generally have higher correlation coefficient and coefficient of
determination of linear regression than Bunaken Island. The same trend is also applied to rugosity-
coral biodiversity relationships.
In the whole study area, the biodiversity indices that have highest correlation with rugosity is genera
richness then followed by diversity index and evenness. Nevertheless, only genera richness that has
significant correlation with rugosity index (r=0.423, p<0.05). The trend is similar in Bunaken Island and
Tombariri except genera evenness. Genera evenness was negatively and significantly correlated with
rugosity index in Tombariri (r =-0.485 p<0.05). The coefficient of determination for linear regression
between rugosity index and biodiversity indices is relatively low. Thus it only can explain less variation
of coral biodiversity. A second order polynomial regression analysis between rugosity index and coral
biodiversity also cannot explain the variations of these variables better than linear regression. None of
the second order polynomial regression curve is concave downward, and even was not significant.
This result is contradicted with similar study in Belize coral reef that conducted by Arronson and
Precth (1995). They successfully proven that second order polynomial regression between rugosity
index and coral biodiversity is highly significant and even the regression curve is concave downward
supporting the intermediate disturbance hypothesis.
The possible reasons for this different result are follows: first, the dominant source of disturbance and
stressor in Bunaken National Park is not only from nature but also from anthropogenic disturbance
that can be acute and or chronics. Second, the dominant species in the study area is Porites with
massive colony. Massive coral colony is more resistant to disturbance than branching corals (Jackson
1991). Thus the intermediate disturbance hypothesis would most be applicable in the shallow coral
reef that dominated by fragile corals such as branching corals and foliose corals (Rogers 1993).
In summary, among all variable, percent coral cover is the most variable that highly correlated with
coral reef rugosity, then followed by genera richness, diversity index, and evenness. Linear regression
model can better explain the variation of percent coral cover, genera richness, Shannon diversity
index, and evenness rather than a second order polynomial regression model. However rugosity index
can only explain very low variation of genera richness, diversity index and evenness. A part of
CORAL REEF RUGOSITY AND CORAL BIODIVERSITY
40
consideration, it implies that the intermediate disturbance hypothesis may not applicable in the coral
reef in Bunaken National Park.
4.5. Limitation of The Research The research conducted fairly well, but a number of obstacles were faced during research. These
include:
- Lack of hidro-oceanographic data such as salinity, wave action, surface current, tides and
depth.
- Large part of Aerial photograph showed scattering of waves, which hides the reflection of the
bottom. Therefore interpretation of these areas is not reliable.
CORAL REEF RUGOSITY AND CORAL BIODIVERSITY
41
5. Conclusions and Recommendation
5.1. Conclusions
• A total 44 coral genera were found in the Bunaken National Park and the average of live coral
cover is 46%.
• The abundance and biodiversity of reef corals did not have a significant different between
Bunaken Island and Tombariri.
• Four groups of coral genera and its distribution can be distinguished. Group I is located in the
eastern part of Bunaken Island and the central part of Tombariri. Group II has no certain
distribution. Group III is dominant in the north and west portion of Bunaken Island, and group
IV is mainly located in the western and eastern part of Tombariri reefs near the river mounth.
• The coral reef in Bunaken Island and Tombariri which is sited in the different environmental
condition did not have a different rugosity index.
• Coral cover is the variable that has highest correlation with coral reef rugosity and then
followed by genera richness, Shannon diversity index, and evenness.
• The highest coefficient of determination of linear regression was found in the linear regression
analysis between rugosity index and coral cover (r2=0.321). Tombariri has higher coefficient of
determination of linear regression (r2=0.526) rather than Bunakan Island (r2=0.296).
• None of second order polynomial regression was significant. Therefore linear regression
model can better explain the variation of percent live coral cover, genera richness, Shannon
diversity index, and evenness rather than a second order polynomial regression model, at
least in the Bunaken National Park. However rugosity index can only explain very low
variation of genera richness, diversity index and evenness.
5.2. Recommendation 1. Future research is exploring remote sensing method (LiDAR and SAR) to obtain information
on coral reef rugosity with a major goal to replace in-situ measurements.

CORAL REEF RUGOSITY AND CORAL BIODIVERSITY
42
CORAL REEF RUGOSITY AND CORAL BIODIVERSITY
43
Bibliography
Alquezar R, Boyd W (2007) Development of rapid, cost effective coral survey techniques: tools for management and conservation planning. Journal of Coastal Conservation 11:105-119
Alvarez-Filip L, Dulvy NK, Gill JA, M. I, Watkinson AR (2009) Flattening of Caribbean coral reefs: region-wide declines in architectural complexity. Proceedings of the Royal Society B: Biological Sciences 276:3019-3025
Andréfouët S, Guzman HM (2005) Coral reef distribution, status and geomorphology–biodiversity relationship in Kuna Yala (San Blas) archipelago, Caribbean Panama. Coral Reefs 24:31-42
Aronson RB, Precht WF (1995) Landscape patterns of reef coral diversity: a test of the intermediate disturbance hypothesis. Journal of Experimental Marine Biology and Ecology 192:1-14
Aronson RB, Edmunds PJ, Precht WF, Swanson DW, Levitan DR (1994) Large Scale, Long term Monitoring of Carribbean Coral Reefs : Simple, Quick, Inexpensive Technique. Atoll Research Bulletin 421:1-14
B. Gratwicke, M. R. Speight (2005) The relationship between fish species richness, abundance and habitat complexity in a range of shallow tropical marine habitats. Journal of Fish Biology 66:650-667
Barnes RSK (1999) An introduction to marine ecology. Blackwell Science, Oxford [England] ; Beck MW (1998) Comparison of The Measurement and Effect of Habitat Structure on Gastropods in
Rocky Intertidal and Mangrove Habitats. Marine Ecology Progress Series 169:165-178 Bertels L, Vanderstraete T, Van Coillie S, Knaeps E, Sterckx S, Goossens R, Deronde B (2008)
Mapping of coral reefs using hyperspectral CASI data; a case study: Fordata, Tanimbar, Indonesia. International Journal of Remote Sensing 29:2359-2391
Brock J, Wright CW, Clayton T, Nayegandhi A (2004) LIDAR optical rugosity of coral reefs in Biscayne National Park, Florida. Coral Reefs 23:48-59
Brock JC, Wright CW, Kuffner IB, Hernandez R, Thompson P (2006) Airborne lidar sensing of massive stony coral colonies on patch reefs in the northern Florida reef tract. Remote Sensing of Environment 104:31-42
Chabanet P, Adjeroud M, Andréfouët S, Bozec Y-M, Ferraris J, Garcìa-Charton J-A, Schrimm M (2005) Human-induced physical disturbances and their indicators on coral reef habitats: A multi-scale approach. Aquat Living Resour 18:215-230
Cleary DFR, Suharsono, Hoeksema BW (2006) Coral diversity across a disturbance gradient in the Pulau Seribu reef complex off Jakarta, Indonesia Marine, Freshwater, and Wetlands Biodiversity Conservation, pp285-306
Connell JH (1978) Diversity in Tropical Rain Forests and Coral Reefs. Science 199:1302-1310 Connell JH (1997) Disturbance and recovery of coral assemblages. Coral Reefs 16:S101-S113 Connell JH, Hughes TP, Wallace CC (1997) A 30-Year Study of Coral Abundance, Recruitment, and
Disturbance at Several Scales in Space and Time. Ecological Monographs 67:461-488 Cooper T, Gilmour J, Fabricius K (2009) Bioindicators of changes in water quality on coral reefs:
review and recommendations for monitoring programmes. Coral Reefs 28:589-606 Cranfield HJ, Rowden AA, Smith DJ, Gordon DP, Michael KP (2004) Macrofaunal assemblages of
benthic habitat of different complexity and the proposition of a model of biogenic reef habitat regeneration in Foveaux Strait, New Zealand. Journal of Sea Research 52:109-125
DeVantier L, Turak E (2004) Managing Marine Tourism in BunakenNational Park and Adjacent Waters,North Sulawesi, Indonesia.North Sulawesi Marine Tourism carryng Capacity report. 114
CORAL REEF RUGOSITY AND CORAL BIODIVERSITY
44
DeVantier L, Turak E, Skelton P (2006) Ecological assessment of the coral communities of Bunaken National Park, Manado, Indonesia
Dollar SJ (1982) Wave stress and coral community structure in Hawaii. Coral Reefs 1:71-81 Dunn D, Halpin P (2009) Rugosity-based regional modeling of hard-bottom habitat. Marine Ecology
Progress Series 377:1-11 Edinger EN, Risk MJ (2000) Reef classification by coral morphology predicts coral reef conservation
value. Biological Conservation 92:1-13 Edinger EN, Jompa J, Limmon GV, Widjatmoko W, Risk MJ (1998) Reef degradation and coral
biodiversity in indonesia: Effects of land-based pollution, destructive fishing practices and changes over time. Marine Pollution Bulletin 36:617-630
English S, Wilkinson C, Baker V (1997) Survey Manual for Tropical Marine Resources. Australian Institute of Marine Science, Townsville,QLD
Fabricius KE (1997) Soft coral abundance on the central Great Barrier Reef: effects of Acanthaster planci, space availability, and aspects of the physical environment. Coral Reefs 16:159-167
Fava F, Ponti M, Scinto A, Calcinai B, Cerrano C (2009) Possible effects of human impacts on epibenthic communities and coral rubble features in the marine Park of Bunaken (Indonesia). Estuarine, Coastal and Shelf Science In Press, Corrected Proof
Fox HE, Caldwell RL (2006) Recovery from Blast Fishing on Coral Reefs: A Tale of Two Scales. Ecological Applications 16:1631-1635
Friedlander A, G. , Aeby E, Brown A, Clark SC, S. Dollar C, Hunter PJ, J. Smith B, Walsh I, Williams, Wiltse W (2005) The State of Coral Reef Ecosystems of the Main Hawaiian Islands. In: Memorandum NT (ed) The State of Coral Reef Ecosystems of the United States and Pacific Freely Associated States 522
Friedlander AM, Parrish JD (1998) Temporal dynamics of fish communities on an exposed shoreline in Hawaii. Environmental Biology of Fishes 53:1-18
Friedlander AM, Brown EK, Jokiel PL, Smith WR, Rodgers KS (2003) Effects of habitat, wave exposure, and marine protected area status on coral reef fish assemblages in the Hawaiian archipelago. Coral Reefs 22:291-305
Gratwicke B, Speight MR (2005) Effect of Habitat Complexity on Carribean Marine Fish Assemblages. Marine Ecology Progress Series 292:301-310
Hochberg EJ, Atkinson MJ, Andréfouët S (2003) Spectral reflectance of coral reef bottom-types worldwide and implications for coral reef remote sensing. Remote Sensing of Environment 85:159-173
Holden H, Ledrew E (1999) Hyperspectral identification of coral reef features. International Journal of Remote Sensing 20:2545-2563
Huston MA (1985) Patterns of Species Diversity on Coral Reefs. Annual Review of Ecology and Systematics 16:149-177
Jackson JBC (1991) Adaptation and Diversity of Reef Corals. BioScience 41:475-482 Knudby A, LeDrew E (2007) Measuring Structural Complexity on Coral reefs. American Academy of
Underwater Science 26th Symposium:181-188 Knudby A, LeDrew E, Newman C (2007) Progress in the use of remote sensing for coral reef
biodiversity studies. Progress in Physical Geography 31:421-434 Kuffner I, Brock J, Grober-Dunsmore R, Bonito V, Hickey T, Wright C (2007) Relationships Between
Reef Fish Communities and Remotely Sensed Rugosity Measurements in Biscayne National Park, Florida, USA. Environmental Biology of Fishes 78:71-82
Leujak W, Ormond RFG (2007) Comparative accuracy and efficiency of six coral community survey methods. Journal of Experimental Marine Biology and Ecology 351:168-187
Luckhurst BE, Luckhurst K (1978) Analysis of The Influence of Substrate Variables on Coral Reef Fish Communities. Marine Biology 49:317-323
Magguran (1998) Ecological Diversity and Its Measurements. Princeton University Press, New Jersey

CORAL REEF RUGOSITY AND CORAL BIODIVERSITY
45
Magno M, Villanoy C (2006) Quantifying the Complexity of Phillipine Coasline fro Estimating Entrainment Potential. 10th International Coral Reef Sympossium:1471-1476
McClanahan TR, Obura D (1997) Sedimentation effects on shallow coral communities in Kenya. Journal of Experimental Marine Biology and Ecology 209:103-122
McCormick.MI (1994) Comparison of Field method for Measuring Surface Topography and Their Assosiations with a Tropical reef Fish Assemblage. Marine Ecology Progress Series 112:87-96
McManus JW, Reyes JRB, NaÑOla JCL (1997) Effects of Some Destructive Fishing Methods on Coral Cover and Potential Rates of Recovery. Environmental Management 21:69-78
Mehta A (1999) Bunaken National Park : Natural History Book. USAID, Manado Meixia Z, Kefu Y, Qiaomin Z, Qi S (2008) Spatial pattern of coral diversity in Luhuitou fringing reef,
Sanya, China. Acta Ecologica Sinica 28:1419-1428 Moll H (1986) The Coral Community Structure on The Reefs Visited during the Snellius II Expedition in
Eastern Indonesia. Zoologische Mededelingen 60:1-25 Moore SD, McCabe GP, Craig BA (2009) Introduction to The Prantice of Statistic. W.H. Freeman and
Company. New York Mumby PJ (2006) The Impact Of Exploiting Grazers (Scaridae) On The Dynamics Of Caribbean Coral
Reefs. Ecological Applications 16:747-769 Mumby PJ, Skirving W, Strong AE, Hardy JT, LeDrew EF, Hochberg EJ, Stumpf RP, David LT (2004)
Remote sensing of coral reefs and their physical environment. Marine Pollution Bulletin 48:219-228
Pandolfi JM, Minchin PR (1996) A comparison of taxonomic composition and diversity between reef coral life and death assemblages in Madang Lagoon, Papua New Guinea. Palaeogeography, Palaeoclimatology, Palaeoecology 119:321-341
Pearson RG (1981) Recovery and recolonization of coral reefs. Marine Ecology Progress Series 4:105-122
Perez JRG, Lehmann A, Gonzalez JEA (2004) Spatial Predisction of Coral Reef Habitat: Integrating Ecology with Spatial Modelling and Remote Sensing. Marine Ecology Progress Series 269:141-152
Purkis S, Graham N, Riegl B (2008) Predictability of reef fish diversity and abundance using remote sensing data in Diego Garcia (Chagos Archipelago). Coral Reefs 27:167-178
Purkis SJ, Myint SW, Riegl BM (2006) Enhanced detection of the coral Acropora cervicornis from satellite imagery using a textural operator. Remote Sensing of Environment 101:82-94
Rogers CS (1993) Hurricanes and coral reefs: The intermediate disturbance hypothesis revisited. Coral Reefs 12:127-137
Rogers CS, Fitz HC, Gilnack M, Beets J, Hardin J (1984) Scleractinian coral recruitment patterns at Salt River submarine canyon, St. Croix, U.S. Virgin Islands. Coral Reefs 3:69-76
Rooney J (1993) Rugosity Measurements. http://cramp.wcc.hawaii.edu/LT_Montoring_files/lt_Rugosity_measurements.htm, Hawai Sammarco PW, Coll JC, Barre S, Willis B (1983) Competitive strategies of soft corals (Coelenterata:
Octocorallia): Allelopathic effects on selected scleractinian corals. Coral Reefs 1:173-178 Suharsono (1996) Jenis jenis karang yang umum dijumpai di perairan Indonesia. P3O-LIPI, Jakarta Turak E, DeVantier L (2003) Reef-building corals of Bunaken National Park -Final Report to the
International Ocean Institute Regional Centre for Australia & the Western Pacific. International Ocean Institute Regional Centre for Australia & the Western Pacific, Manado 66
Veron J (2000) Corals of The World. AUstralian Institute of Marine Science, Townsville, QLD Veron JEN (1986) Corals of Australia and the Indo-Pacific. Angus & Robertson, North Ryde, NSW,
Australia : Wilkinson CR, Buddemeier RW (1994) Global Climate Change and Coral Reefs: Implications for
People and Reefs. Report of the UNEP-IOC-ASPEI-IUCN Global Task Team on the implicationsof climate change on coral reefs. IUCN, Gland, Switzerland 124
CORAL REEF RUGOSITY AND CORAL BIODIVERSITY
46
Wilson SK, Graham NAJ, Pratchett MS, Jones GP, Polunin NVC (2006) Multiple disturbances and the global degradation of coral reefs: are reef fishes at risk or resilient? Global Change Biology 12:2220-2234
Zakai D, Chadwick-Furman NE (2002) Impacts of intensive recreational diving on reef corals at Eilat, northern Red Sea. Biological Conservation 105:179-187
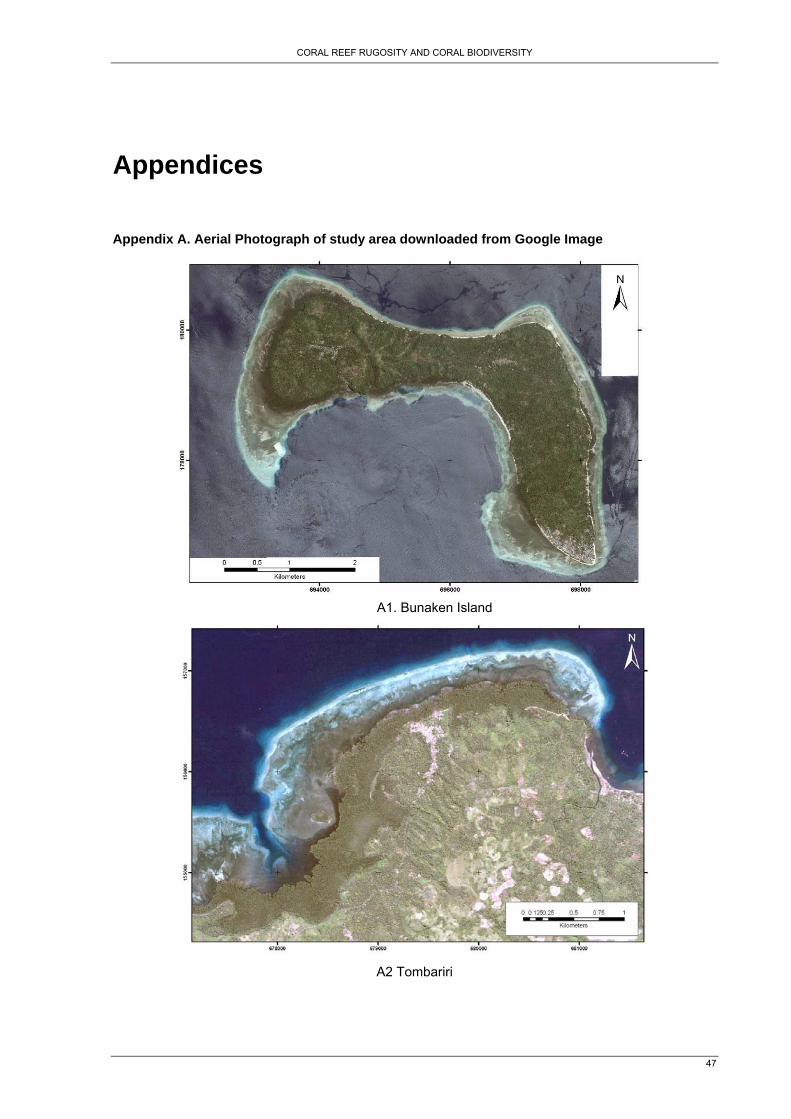
CORAL REEF RUGOSITY AND CORAL BIODIVERSITY
47
Appendices
Appendix A. Aerial Photograph of study area downloaded from Google Image
A1. Bunaken Island
A2 Tombariri
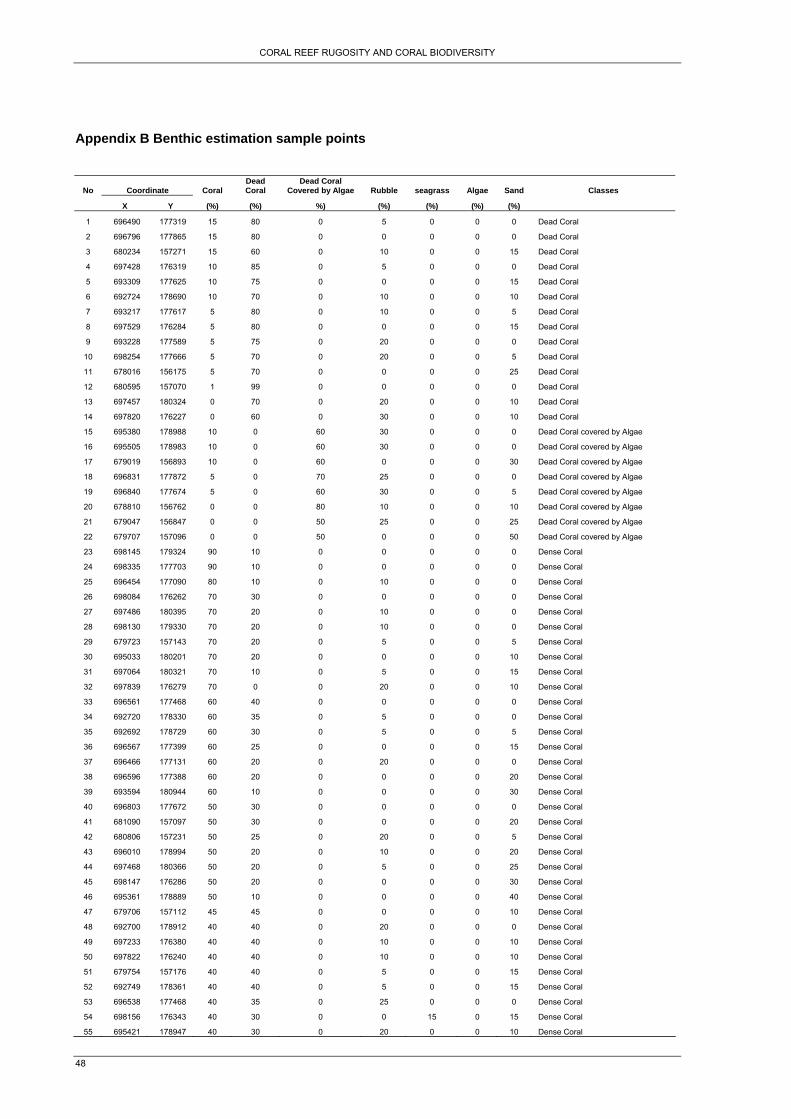
CORAL REEF RUGOSITY AND CORAL BIODIVERSITY
48
Appendix B Benthic estimation sample points
No Coordinate Coral Dead Coral
Dead Coral Covered by Algae Rubble seagrass Algae Sand Classes
X Y (%) (%) %) (%) (%) (%) (%)
1 696490 177319 15 80 0 5 0 0 0 Dead Coral
2 696796 177865 15 80 0 0 0 0 0 Dead Coral
3 680234 157271 15 60 0 10 0 0 15 Dead Coral
4 697428 176319 10 85 0 5 0 0 0 Dead Coral
5 693309 177625 10 75 0 0 0 0 15 Dead Coral
6 692724 178690 10 70 0 10 0 0 10 Dead Coral
7 693217 177617 5 80 0 10 0 0 5 Dead Coral
8 697529 176284 5 80 0 0 0 0 15 Dead Coral
9 693228 177589 5 75 0 20 0 0 0 Dead Coral
10 698254 177666 5 70 0 20 0 0 5 Dead Coral
11 678016 156175 5 70 0 0 0 0 25 Dead Coral
12 680595 157070 1 99 0 0 0 0 0 Dead Coral
13 697457 180324 0 70 0 20 0 0 10 Dead Coral
14 697820 176227 0 60 0 30 0 0 10 Dead Coral
15 695380 178988 10 0 60 30 0 0 0 Dead Coral covered by Algae
16 695505 178983 10 0 60 30 0 0 0 Dead Coral covered by Algae
17 679019 156893 10 0 60 0 0 0 30 Dead Coral covered by Algae
18 696831 177872 5 0 70 25 0 0 0 Dead Coral covered by Algae
19 696840 177674 5 0 60 30 0 0 5 Dead Coral covered by Algae
20 678810 156762 0 0 80 10 0 0 10 Dead Coral covered by Algae
21 679047 156847 0 0 50 25 0 0 25 Dead Coral covered by Algae
22 679707 157096 0 0 50 0 0 0 50 Dead Coral covered by Algae
23 698145 179324 90 10 0 0 0 0 0 Dense Coral
24 698335 177703 90 10 0 0 0 0 0 Dense Coral
25 696454 177090 80 10 0 10 0 0 0 Dense Coral
26 698084 176262 70 30 0 0 0 0 0 Dense Coral
27 697486 180395 70 20 0 10 0 0 0 Dense Coral
28 698130 179330 70 20 0 10 0 0 0 Dense Coral
29 679723 157143 70 20 0 5 0 0 5 Dense Coral
30 695033 180201 70 20 0 0 0 0 10 Dense Coral
31 697064 180321 70 10 0 5 0 0 15 Dense Coral
32 697839 176279 70 0 0 20 0 0 10 Dense Coral
33 696561 177468 60 40 0 0 0 0 0 Dense Coral
34 692720 178330 60 35 0 5 0 0 0 Dense Coral
35 692692 178729 60 30 0 5 0 0 5 Dense Coral
36 696567 177399 60 25 0 0 0 0 15 Dense Coral
37 696466 177131 60 20 0 20 0 0 0 Dense Coral
38 696596 177388 60 20 0 0 0 0 20 Dense Coral
39 693594 180944 60 10 0 0 0 0 30 Dense Coral
40 696803 177672 50 30 0 0 0 0 0 Dense Coral
41 681090 157097 50 30 0 0 0 0 20 Dense Coral
42 680806 157231 50 25 0 20 0 0 5 Dense Coral
43 696010 178994 50 20 0 10 0 0 20 Dense Coral
44 697468 180366 50 20 0 5 0 0 25 Dense Coral
45 698147 176286 50 20 0 0 0 0 30 Dense Coral
46 695361 178889 50 10 0 0 0 0 40 Dense Coral
47 679706 157112 45 45 0 0 0 0 10 Dense Coral
48 692700 178912 40 40 0 20 0 0 0 Dense Coral
49 697233 176380 40 40 0 10 0 0 10 Dense Coral
50 697822 176240 40 40 0 10 0 0 10 Dense Coral
51 679754 157176 40 40 0 5 0 0 15 Dense Coral
52 692749 178361 40 40 0 5 0 0 15 Dense Coral
53 696538 177468 40 35 0 25 0 0 0 Dense Coral
54 698156 176343 40 30 0 0 15 0 15 Dense Coral
55 695421 178947 40 30 0 20 0 0 10 Dense Coral
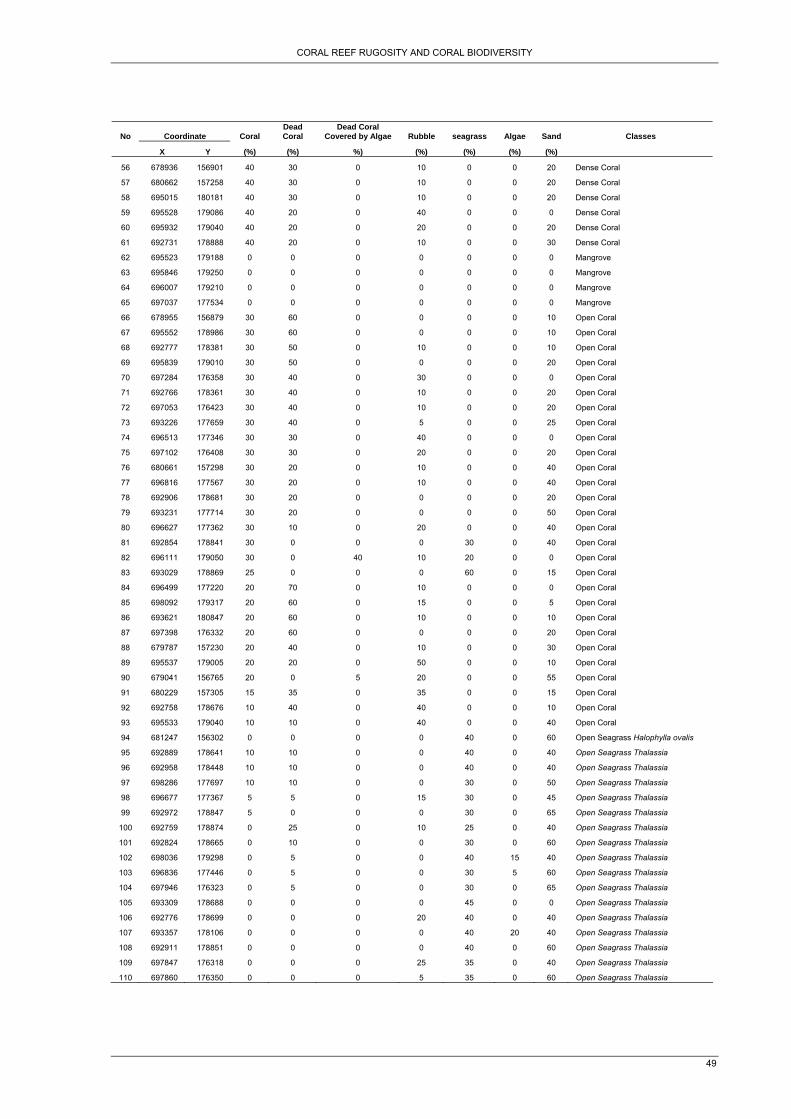
CORAL REEF RUGOSITY AND CORAL BIODIVERSITY
49
No Coordinate Coral Dead Coral
Dead Coral Covered by Algae Rubble seagrass Algae Sand Classes
X Y (%) (%) %) (%) (%) (%) (%)
56 678936 156901 40 30 0 10 0 0 20 Dense Coral
57 680662 157258 40 30 0 10 0 0 20 Dense Coral
58 695015 180181 40 30 0 10 0 0 20 Dense Coral
59 695528 179086 40 20 0 40 0 0 0 Dense Coral
60 695932 179040 40 20 0 20 0 0 20 Dense Coral
61 692731 178888 40 20 0 10 0 0 30 Dense Coral
62 695523 179188 0 0 0 0 0 0 0 Mangrove
63 695846 179250 0 0 0 0 0 0 0 Mangrove
64 696007 179210 0 0 0 0 0 0 0 Mangrove
65 697037 177534 0 0 0 0 0 0 0 Mangrove
66 678955 156879 30 60 0 0 0 0 10 Open Coral
67 695552 178986 30 60 0 0 0 0 10 Open Coral
68 692777 178381 30 50 0 10 0 0 10 Open Coral
69 695839 179010 30 50 0 0 0 0 20 Open Coral
70 697284 176358 30 40 0 30 0 0 0 Open Coral
71 692766 178361 30 40 0 10 0 0 20 Open Coral
72 697053 176423 30 40 0 10 0 0 20 Open Coral
73 693226 177659 30 40 0 5 0 0 25 Open Coral
74 696513 177346 30 30 0 40 0 0 0 Open Coral
75 697102 176408 30 30 0 20 0 0 20 Open Coral
76 680661 157298 30 20 0 10 0 0 40 Open Coral
77 696816 177567 30 20 0 10 0 0 40 Open Coral
78 692906 178681 30 20 0 0 0 0 20 Open Coral
79 693231 177714 30 20 0 0 0 0 50 Open Coral
80 696627 177362 30 10 0 20 0 0 40 Open Coral
81 692854 178841 30 0 0 0 30 0 40 Open Coral
82 696111 179050 30 0 40 10 20 0 0 Open Coral
83 693029 178869 25 0 0 0 60 0 15 Open Coral
84 696499 177220 20 70 0 10 0 0 0 Open Coral
85 698092 179317 20 60 0 15 0 0 5 Open Coral
86 693621 180847 20 60 0 10 0 0 10 Open Coral
87 697398 176332 20 60 0 0 0 0 20 Open Coral
88 679787 157230 20 40 0 10 0 0 30 Open Coral
89 695537 179005 20 20 0 50 0 0 10 Open Coral
90 679041 156765 20 0 5 20 0 0 55 Open Coral
91 680229 157305 15 35 0 35 0 0 15 Open Coral
92 692758 178676 10 40 0 40 0 0 10 Open Coral
93 695533 179040 10 10 0 40 0 0 40 Open Coral
94 681247 156302 0 0 0 0 40 0 60 Open Seagrass Halophylla ovalis
95 692889 178641 10 10 0 0 40 0 40 Open Seagrass Thalassia
96 692958 178448 10 10 0 0 40 0 40 Open Seagrass Thalassia
97 698286 177697 10 10 0 0 30 0 50 Open Seagrass Thalassia
98 696677 177367 5 5 0 15 30 0 45 Open Seagrass Thalassia
99 692972 178847 5 0 0 0 30 0 65 Open Seagrass Thalassia
100 692759 178874 0 25 0 10 25 0 40 Open Seagrass Thalassia
101 692824 178665 0 10 0 0 30 0 60 Open Seagrass Thalassia
102 698036 179298 0 5 0 0 40 15 40 Open Seagrass Thalassia
103 696836 177446 0 5 0 0 30 5 60 Open Seagrass Thalassia
104 697946 176323 0 5 0 0 30 0 65 Open Seagrass Thalassia
105 693309 178688 0 0 0 0 45 0 0 Open Seagrass Thalassia
106 692776 178699 0 0 0 20 40 0 40 Open Seagrass Thalassia
107 693357 178106 0 0 0 0 40 20 40 Open Seagrass Thalassia
108 692911 178851 0 0 0 0 40 0 60 Open Seagrass Thalassia
109 697847 176318 0 0 0 25 35 0 40 Open Seagrass Thalassia
110 697860 176350 0 0 0 5 35 0 60 Open Seagrass Thalassia
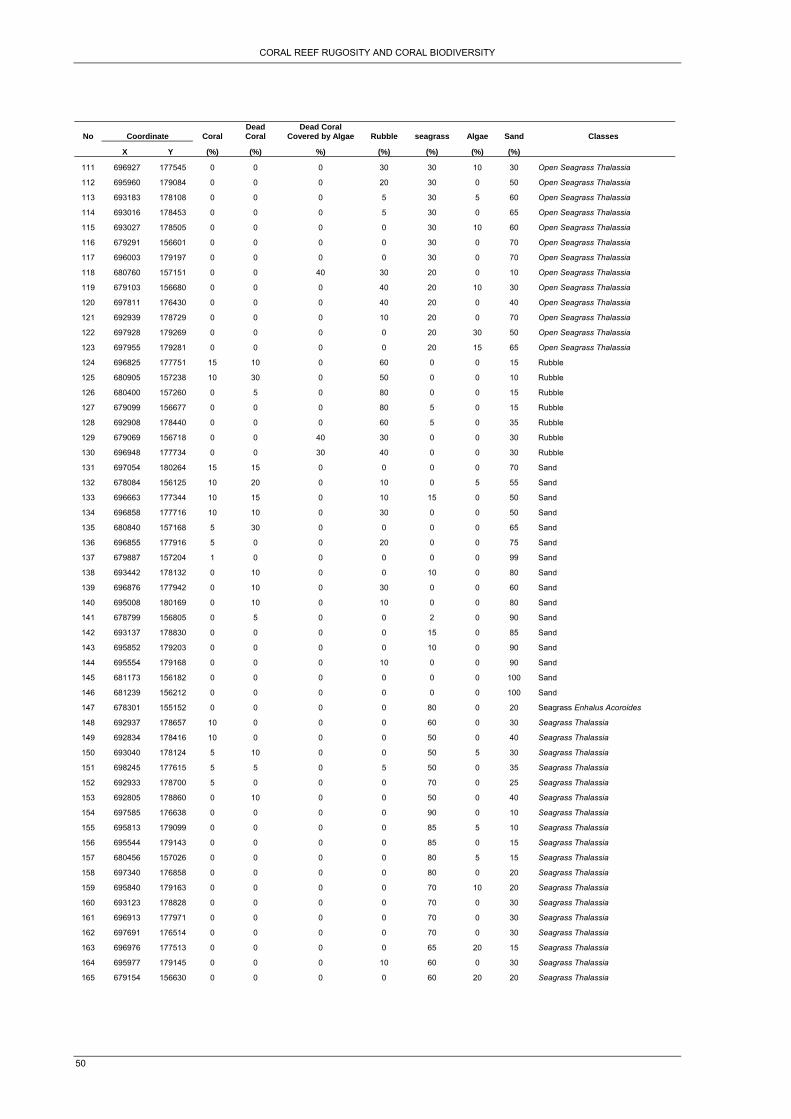
CORAL REEF RUGOSITY AND CORAL BIODIVERSITY
50
No Coordinate Coral Dead Coral
Dead Coral Covered by Algae Rubble seagrass Algae Sand Classes
X Y (%) (%) %) (%) (%) (%) (%)
111 696927 177545 0 0 0 30 30 10 30 Open Seagrass Thalassia
112 695960 179084 0 0 0 20 30 0 50 Open Seagrass Thalassia
113 693183 178108 0 0 0 5 30 5 60 Open Seagrass Thalassia
114 693016 178453 0 0 0 5 30 0 65 Open Seagrass Thalassia
115 693027 178505 0 0 0 0 30 10 60 Open Seagrass Thalassia
116 679291 156601 0 0 0 0 30 0 70 Open Seagrass Thalassia
117 696003 179197 0 0 0 0 30 0 70 Open Seagrass Thalassia
118 680760 157151 0 0 40 30 20 0 10 Open Seagrass Thalassia
119 679103 156680 0 0 0 40 20 10 30 Open Seagrass Thalassia
120 697811 176430 0 0 0 40 20 0 40 Open Seagrass Thalassia
121 692939 178729 0 0 0 10 20 0 70 Open Seagrass Thalassia
122 697928 179269 0 0 0 0 20 30 50 Open Seagrass Thalassia
123 697955 179281 0 0 0 0 20 15 65 Open Seagrass Thalassia
124 696825 177751 15 10 0 60 0 0 15 Rubble
125 680905 157238 10 30 0 50 0 0 10 Rubble
126 680400 157260 0 5 0 80 0 0 15 Rubble
127 679099 156677 0 0 0 80 5 0 15 Rubble
128 692908 178440 0 0 0 60 5 0 35 Rubble
129 679069 156718 0 0 40 30 0 0 30 Rubble
130 696948 177734 0 0 30 40 0 0 30 Rubble
131 697054 180264 15 15 0 0 0 0 70 Sand
132 678084 156125 10 20 0 10 0 5 55 Sand
133 696663 177344 10 15 0 10 15 0 50 Sand
134 696858 177716 10 10 0 30 0 0 50 Sand
135 680840 157168 5 30 0 0 0 0 65 Sand
136 696855 177916 5 0 0 20 0 0 75 Sand
137 679887 157204 1 0 0 0 0 0 99 Sand
138 693442 178132 0 10 0 0 10 0 80 Sand
139 696876 177942 0 10 0 30 0 0 60 Sand
140 695008 180169 0 10 0 10 0 0 80 Sand
141 678799 156805 0 5 0 0 2 0 90 Sand
142 693137 178830 0 0 0 0 15 0 85 Sand
143 695852 179203 0 0 0 0 10 0 90 Sand
144 695554 179168 0 0 0 10 0 0 90 Sand
145 681173 156182 0 0 0 0 0 0 100 Sand
146 681239 156212 0 0 0 0 0 0 100 Sand
147 678301 155152 0 0 0 0 80 0 20 Seagrass Enhalus Acoroides
148 692937 178657 10 0 0 0 60 0 30 Seagrass Thalassia
149 692834 178416 10 0 0 0 50 0 40 Seagrass Thalassia
150 693040 178124 5 10 0 0 50 5 30 Seagrass Thalassia
151 698245 177615 5 5 0 5 50 0 35 Seagrass Thalassia
152 692933 178700 5 0 0 0 70 0 25 Seagrass Thalassia
153 692805 178860 0 10 0 0 50 0 40 Seagrass Thalassia
154 697585 176638 0 0 0 0 90 0 10 Seagrass Thalassia
155 695813 179099 0 0 0 0 85 5 10 Seagrass Thalassia
156 695544 179143 0 0 0 0 85 0 15 Seagrass Thalassia
157 680456 157026 0 0 0 0 80 5 15 Seagrass Thalassia
158 697340 176858 0 0 0 0 80 0 20 Seagrass Thalassia
159 695840 179163 0 0 0 0 70 10 20 Seagrass Thalassia
160 693123 178828 0 0 0 0 70 0 30 Seagrass Thalassia
161 696913 177971 0 0 0 0 70 0 30 Seagrass Thalassia
162 697691 176514 0 0 0 0 70 0 30 Seagrass Thalassia
163 696976 177513 0 0 0 0 65 20 15 Seagrass Thalassia
164 695977 179145 0 0 0 10 60 0 30 Seagrass Thalassia
165 679154 156630 0 0 0 0 60 20 20 Seagrass Thalassia
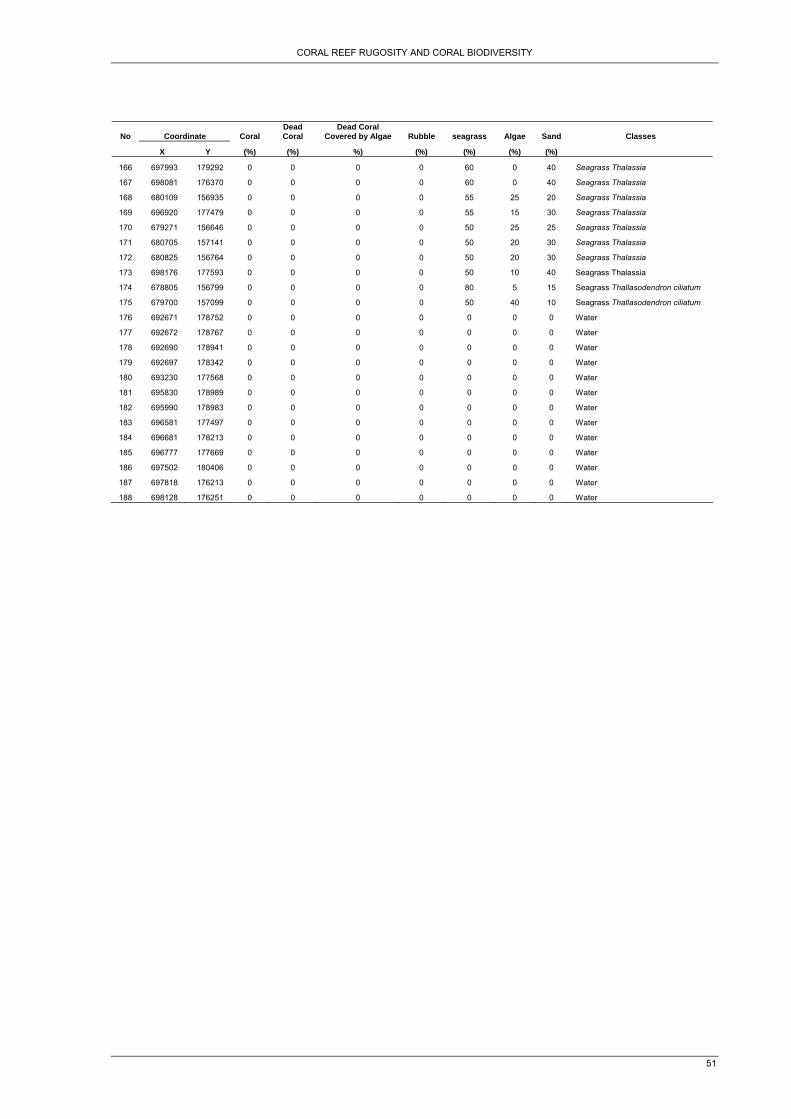
CORAL REEF RUGOSITY AND CORAL BIODIVERSITY
51
No Coordinate Coral Dead Coral
Dead Coral Covered by Algae Rubble seagrass Algae Sand Classes
X Y (%) (%) %) (%) (%) (%) (%)
166 697993 179292 0 0 0 0 60 0 40 Seagrass Thalassia
167 698081 176370 0 0 0 0 60 0 40 Seagrass Thalassia
168 680109 156935 0 0 0 0 55 25 20 Seagrass Thalassia
169 696920 177479 0 0 0 0 55 15 30 Seagrass Thalassia
170 679271 156646 0 0 0 0 50 25 25 Seagrass Thalassia
171 680705 157141 0 0 0 0 50 20 30 Seagrass Thalassia
172 680825 156764 0 0 0 0 50 20 30 Seagrass Thalassia
173 698176 177593 0 0 0 0 50 10 40 Seagrass Thalassia
174 678805 156799 0 0 0 0 80 5 15 Seagrass Thallasodendron ciliatum
175 679700 157099 0 0 0 0 50 40 10 Seagrass Thallasodendron ciliatum
176 692671 178752 0 0 0 0 0 0 0 Water
177 692672 178767 0 0 0 0 0 0 0 Water
178 692690 178941 0 0 0 0 0 0 0 Water
179 692697 178342 0 0 0 0 0 0 0 Water
180 693230 177568 0 0 0 0 0 0 0 Water
181 695830 178989 0 0 0 0 0 0 0 Water
182 695990 178983 0 0 0 0 0 0 0 Water
183 696581 177497 0 0 0 0 0 0 0 Water
184 696681 178213 0 0 0 0 0 0 0 Water
185 696777 177669 0 0 0 0 0 0 0 Water
186 697502 180406 0 0 0 0 0 0 0 Water
187 697818 176213 0 0 0 0 0 0 0 Water
188 698128 176251 0 0 0 0 0 0 0 Water
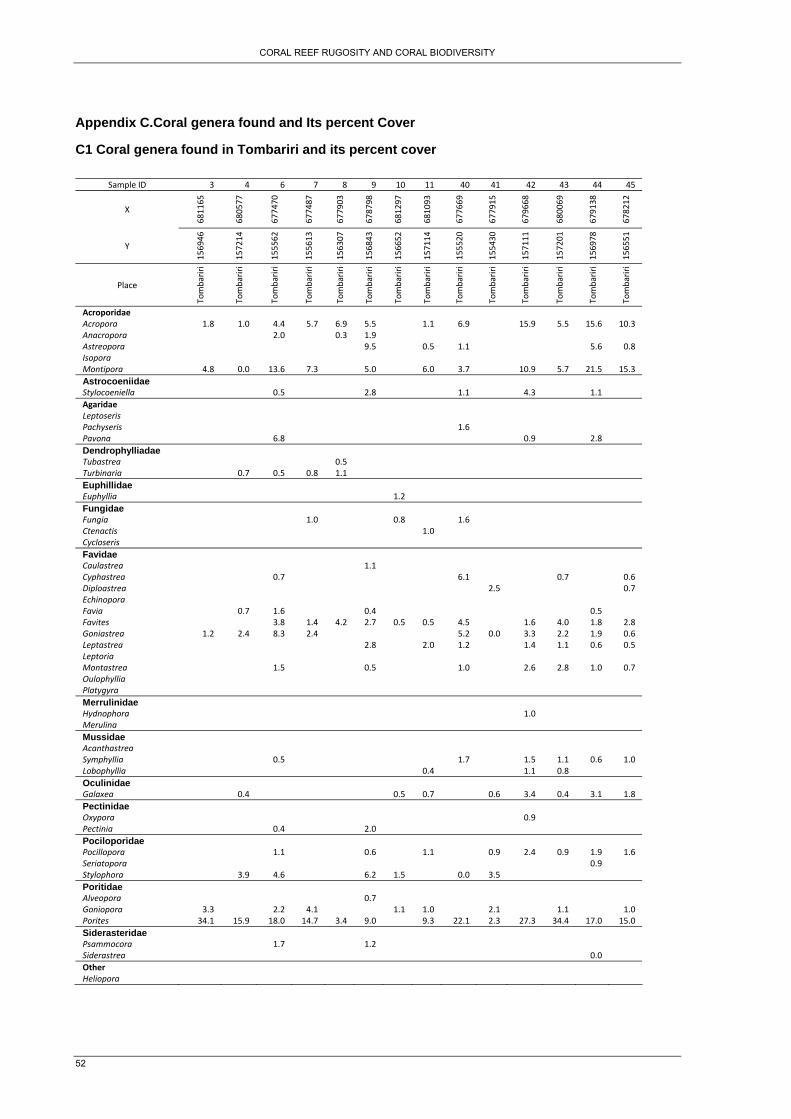
CORAL REEF RUGOSITY AND CORAL BIODIVERSITY
52
Appendix C.Coral genera found and Its percent Cover
C1 Coral genera found in Tombariri and its percent cover
Sample ID 3 4 6 7 8 9 10 11 40 41 42 43 44 45
X 681165
680577
677470
677487
677903
678798
681297
681093
677669
677915
679668
680069
679138
678212
Y
156946
157214
155562
155613
156307
156843
156652
157114
155520
155430
157111
157201
156978
156551
Place
Tombariri
Tombariri
Tombariri
Tombariri
Tombariri
Tombariri
Tombariri
Tombariri
Tombariri
Tombariri
Tombariri
Tombariri
Tombariri
Tombariri
Acroporidae
Acropora 1.8 1.0 4.4 5.7 6.9 5.5 1.1 6.9 15.9 5.5 15.6 10.3 Anacropora 2.0 0.3 1.9 Astreopora 9.5 0.5 1.1 5.6 0.8 Isopora Montipora 4.8 0.0 13.6 7.3 5.0 6.0 3.7 10.9 5.7 21.5 15.3 Astrocoeniidae Stylocoeniella 0.5 2.8 1.1 4.3 1.1 Agaridae Leptoseris Pachyseris 1.6 Pavona 6.8 0.9 2.8 Dendrophylliadae Tubastrea 0.5 Turbinaria 0.7 0.5 0.8 1.1 Euphillidae Euphyllia 1.2 Fungidae Fungia 1.0 0.8 1.6 Ctenactis 1.0 Cycloseris Favidae Caulastrea 1.1 Cyphastrea 0.7 6.1 0.7 0.6 Diploastrea 2.5 0.7 Echinopora Favia 0.7 1.6 0.4 0.5 Favites 3.8 1.4 4.2 2.7 0.5 0.5 4.5 1.6 4.0 1.8 2.8 Goniastrea 1.2 2.4 8.3 2.4 5.2 0.0 3.3 2.2 1.9 0.6 Leptastrea 2.8 2.0 1.2 1.4 1.1 0.6 0.5 Leptoria Montastrea 1.5 0.5 1.0 2.6 2.8 1.0 0.7 Oulophyllia Platygyra Merrulinidae Hydnophora 1.0 Merulina Mussidae Acanthastrea Symphyllia 0.5 1.7 1.5 1.1 0.6 1.0 Lobophyllia 0.4 1.1 0.8 Oculinidae Galaxea 0.4 0.5 0.7 0.6 3.4 0.4 3.1 1.8 Pectinidae Oxypora 0.9 Pectinia 0.4 2.0 Pociloporidae Pocillopora 1.1 0.6 1.1 0.9 2.4 0.9 1.9 1.6 Seriatopora 0.9 Stylophora 3.9 4.6 6.2 1.5 0.0 3.5 Poritidae Alveopora 0.7 Goniopora 3.3 2.2 4.1 1.1 1.0 2.1 1.1 1.0 Porites 34.1 15.9 18.0 14.7 3.4 9.0 9.3 22.1 2.3 27.3 34.4 17.0 15.0 Siderasteridae Psammocora 1.7 1.2 Siderastrea 0.0 Other Heliopora
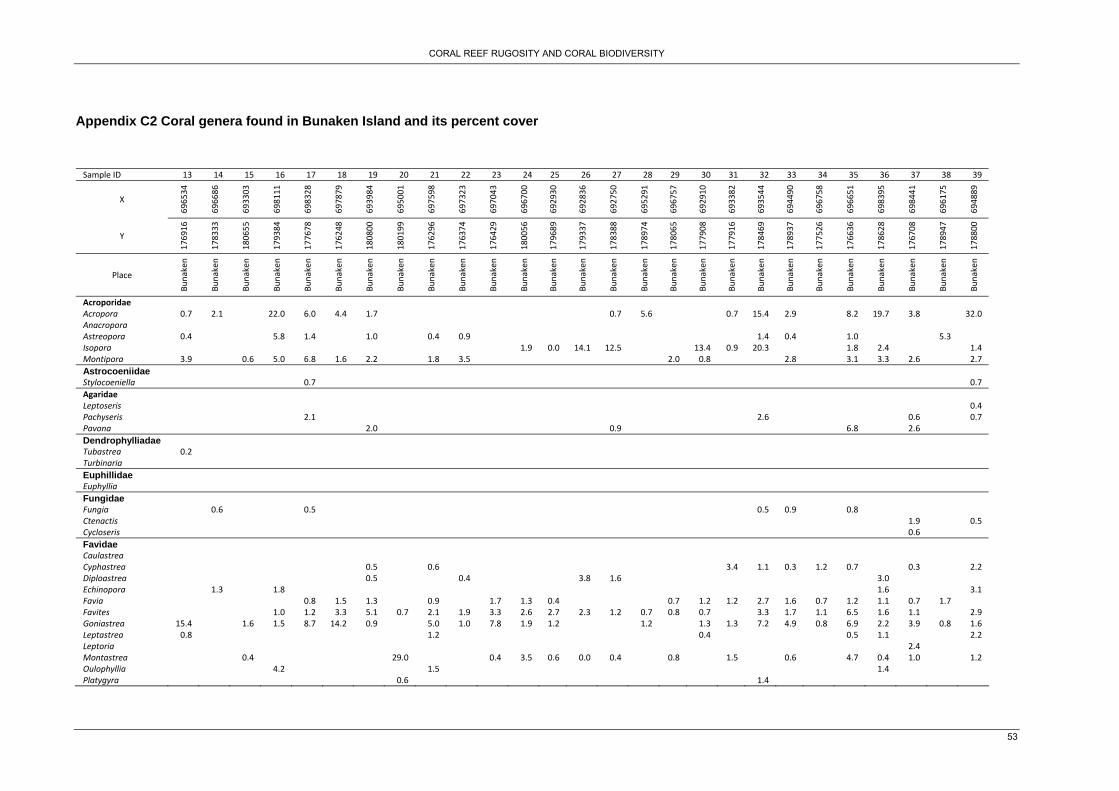
CORAL REEF RUGOSITY AND CORAL BIODIVERSITY
53
Appendix C2 Coral genera found in Bunaken Island and its percent cover Sample ID 13 14 15 16 17 18 19 20 21 22 23 24 25 26 27 28 29 30 31 32 33 34 35 36 37 38 39
X
696534
696686
693303
698111
698328
697879
693984
695001
697598
697323
697043
696700
692930
692836
692750
695291
696757
692910
693382
693544
694490
696758
696651
698395
698441
696175
694889
Y
176916
178333
180655
179384
177678
176248
180800
180199
176296
176374
176429
180056
179689
179337
178388
178974
178065
177908
177916
178469
178937
177526
176636
178628
176708
178947
178800
Place
Bunaken
Bunaken
Bunaken
Bunaken
Bunaken
Bunaken
Bunaken
Bunaken
Bunaken
Bunaken
Bunaken
Bunaken
Bunaken
Bunaken
Bunaken
Bunaken
Bunaken
Bunaken
Bunaken
Bunaken
Bunaken
Bunaken
Bunaken
Bunaken
Bunaken
Bunaken
Bunaken
Acroporidae
Acropora 0.7 2.1 22.0 6.0 4.4 1.7 0.7 5.6 0.7 15.4 2.9 8.2 19.7 3.8 32.0 Anacropora Astreopora 0.4 5.8 1.4 1.0 0.4 0.9 1.4 0.4 1.0 5.3 Isopora 1.9 0.0 14.1 12.5 13.4 0.9 20.3 1.8 2.4 1.4 Montipora 3.9 0.6 5.0 6.8 1.6 2.2 1.8 3.5 2.0 0.8 2.8 3.1 3.3 2.6 2.7 Astrocoeniidae Stylocoeniella 0.7 0.7 Agaridae Leptoseris 0.4 Pachyseris 2.1 2.6 0.6 0.7 Pavona 2.0 0.9 6.8 2.6 Dendrophylliadae Tubastrea 0.2 Turbinaria Euphillidae Euphyllia Fungidae Fungia 0.6 0.5 0.5 0.9 0.8 Ctenactis 1.9 0.5 Cycloseris 0.6 Favidae Caulastrea Cyphastrea 0.5 0.6 3.4 1.1 0.3 1.2 0.7 0.3 2.2 Diploastrea 0.5 0.4 3.8 1.6 3.0 Echinopora 1.3 1.8 1.6 3.1 Favia 0.8 1.5 1.3 0.9 1.7 1.3 0.4 0.7 1.2 1.2 2.7 1.6 0.7 1.2 1.1 0.7 1.7 Favites 1.0 1.2 3.3 5.1 0.7 2.1 1.9 3.3 2.6 2.7 2.3 1.2 0.7 0.8 0.7 3.3 1.7 1.1 6.5 1.6 1.1 2.9 Goniastrea 15.4 1.6 1.5 8.7 14.2 0.9 5.0 1.0 7.8 1.9 1.2 1.2 1.3 1.3 7.2 4.9 0.8 6.9 2.2 3.9 0.8 1.6 Leptastrea 0.8 1.2 0.4 0.5 1.1 2.2 Leptoria 2.4 Montastrea 0.4 29.0 0.4 3.5 0.6 0.0 0.4 0.8 1.5 0.6 4.7 0.4 1.0 1.2 Oulophyllia 4.2 1.5 1.4 Platygyra 0.6 1.4
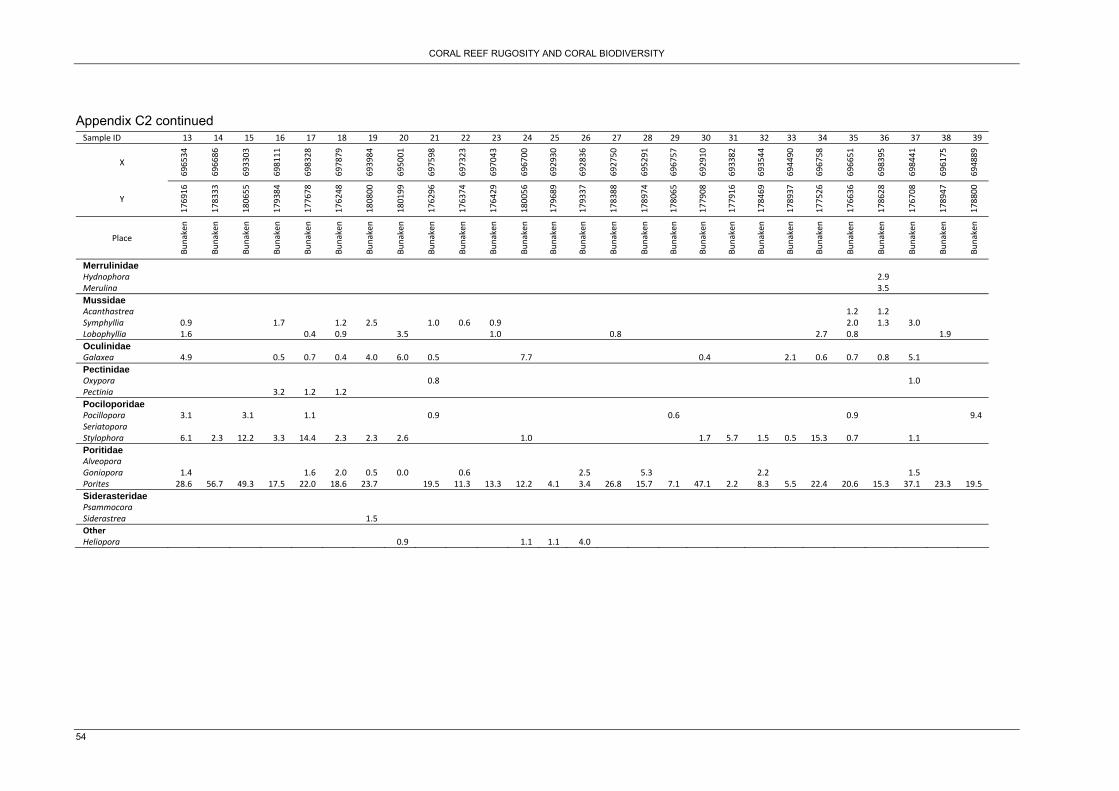
CORAL REEF RUGOSITY AND CORAL BIODIVERSITY
54
Appendix C2 continued Sample ID 13 14 15 16 17 18 19 20 21 22 23 24 25 26 27 28 29 30 31 32 33 34 35 36 37 38 39
X
696534
696686
693303
698111
698328
697879
693984
695001
697598
697323
697043
696700
692930
692836
692750
695291
696757
692910
693382
693544
694490
696758
696651
698395
698441
696175
694889
Y
176916
178333
180655
179384
177678
176248
180800
180199
176296
176374
176429
180056
179689
179337
178388
178974
178065
177908
177916
178469
178937
177526
176636
178628
176708
178947
178800
Place
Bunaken
Bunaken
Bunaken
Bunaken
Bunaken
Bunaken
Bunaken
Bunaken
Bunaken
Bunaken
Bunaken
Bunaken
Bunaken
Bunaken
Bunaken
Bunaken
Bunaken
Bunaken
Bunaken
Bunaken
Bunaken
Bunaken
Bunaken
Bunaken
Bunaken
Bunaken
Bunaken
Merrulinidae Hydnophora 2.9 Merulina 3.5 Mussidae Acanthastrea 1.2 1.2 Symphyllia 0.9 1.7 1.2 2.5 1.0 0.6 0.9 2.0 1.3 3.0 Lobophyllia 1.6 0.4 0.9 3.5 1.0 0.8 2.7 0.8 1.9 Oculinidae Galaxea 4.9 0.5 0.7 0.4 4.0 6.0 0.5 7.7 0.4 2.1 0.6 0.7 0.8 5.1 Pectinidae Oxypora 0.8 1.0 Pectinia 3.2 1.2 1.2 Pociloporidae Pocillopora 3.1 3.1 1.1 0.9 0.6 0.9 9.4 Seriatopora Stylophora 6.1 2.3 12.2 3.3 14.4 2.3 2.3 2.6 1.0 1.7 5.7 1.5 0.5 15.3 0.7 1.1 Poritidae Alveopora Goniopora 1.4 1.6 2.0 0.5 0.0 0.6 2.5 5.3 2.2 1.5 Porites 28.6 56.7 49.3 17.5 22.0 18.6 23.7 19.5 11.3 13.3 12.2 4.1 3.4 26.8 15.7 7.1 47.1 2.2 8.3 5.5 22.4 20.6 15.3 37.1 23.3 19.5 Siderasteridae Psammocora Siderastrea 1.5 Other Heliopora 0.9 1.1 1.1 4.0
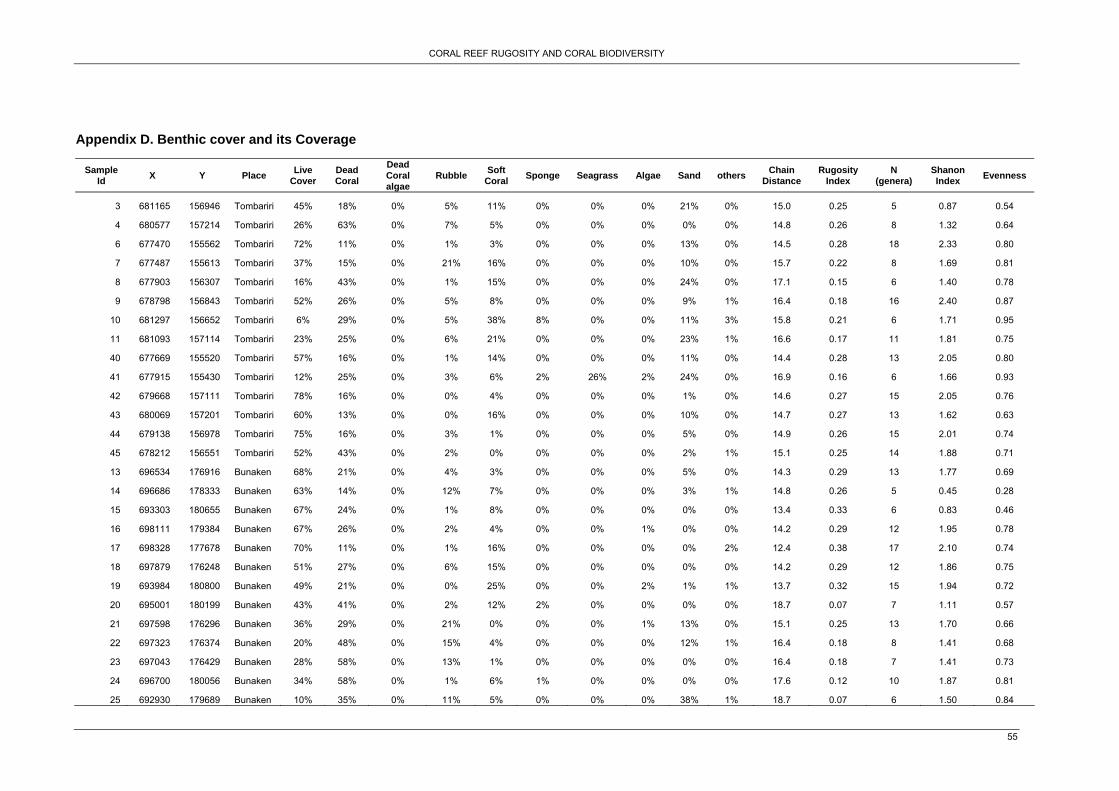
CORAL REEF RUGOSITY AND CORAL BIODIVERSITY
55
Appendix D. Benthic cover and its Coverage
Sample Id X Y Place Live
Cover Dead Coral
Dead Coral algae
Rubble Soft Coral Sponge Seagrass Algae Sand others Chain
Distance Rugosity
Index N
(genera) Shanon Index Evenness
3 681165 156946 Tombariri 45% 18% 0% 5% 11% 0% 0% 0% 21% 0% 15.0 0.25 5 0.87 0.54
4 680577 157214 Tombariri 26% 63% 0% 7% 5% 0% 0% 0% 0% 0% 14.8 0.26 8 1.32 0.64
6 677470 155562 Tombariri 72% 11% 0% 1% 3% 0% 0% 0% 13% 0% 14.5 0.28 18 2.33 0.80
7 677487 155613 Tombariri 37% 15% 0% 21% 16% 0% 0% 0% 10% 0% 15.7 0.22 8 1.69 0.81
8 677903 156307 Tombariri 16% 43% 0% 1% 15% 0% 0% 0% 24% 0% 17.1 0.15 6 1.40 0.78
9 678798 156843 Tombariri 52% 26% 0% 5% 8% 0% 0% 0% 9% 1% 16.4 0.18 16 2.40 0.87
10 681297 156652 Tombariri 6% 29% 0% 5% 38% 8% 0% 0% 11% 3% 15.8 0.21 6 1.71 0.95
11 681093 157114 Tombariri 23% 25% 0% 6% 21% 0% 0% 0% 23% 1% 16.6 0.17 11 1.81 0.75
40 677669 155520 Tombariri 57% 16% 0% 1% 14% 0% 0% 0% 11% 0% 14.4 0.28 13 2.05 0.80
41 677915 155430 Tombariri 12% 25% 0% 3% 6% 2% 26% 2% 24% 0% 16.9 0.16 6 1.66 0.93
42 679668 157111 Tombariri 78% 16% 0% 0% 4% 0% 0% 0% 1% 0% 14.6 0.27 15 2.05 0.76
43 680069 157201 Tombariri 60% 13% 0% 0% 16% 0% 0% 0% 10% 0% 14.7 0.27 13 1.62 0.63
44 679138 156978 Tombariri 75% 16% 0% 3% 1% 0% 0% 0% 5% 0% 14.9 0.26 15 2.01 0.74
45 678212 156551 Tombariri 52% 43% 0% 2% 0% 0% 0% 0% 2% 1% 15.1 0.25 14 1.88 0.71
13 696534 176916 Bunaken 68% 21% 0% 4% 3% 0% 0% 0% 5% 0% 14.3 0.29 13 1.77 0.69
14 696686 178333 Bunaken 63% 14% 0% 12% 7% 0% 0% 0% 3% 1% 14.8 0.26 5 0.45 0.28
15 693303 180655 Bunaken 67% 24% 0% 1% 8% 0% 0% 0% 0% 0% 13.4 0.33 6 0.83 0.46
16 698111 179384 Bunaken 67% 26% 0% 2% 4% 0% 0% 1% 0% 0% 14.2 0.29 12 1.95 0.78
17 698328 177678 Bunaken 70% 11% 0% 1% 16% 0% 0% 0% 0% 2% 12.4 0.38 17 2.10 0.74
18 697879 176248 Bunaken 51% 27% 0% 6% 15% 0% 0% 0% 0% 0% 14.2 0.29 12 1.86 0.75
19 693984 180800 Bunaken 49% 21% 0% 0% 25% 0% 0% 2% 1% 1% 13.7 0.32 15 1.94 0.72
20 695001 180199 Bunaken 43% 41% 0% 2% 12% 2% 0% 0% 0% 0% 18.7 0.07 7 1.11 0.57
21 697598 176296 Bunaken 36% 29% 0% 21% 0% 0% 0% 1% 13% 0% 15.1 0.25 13 1.70 0.66
22 697323 176374 Bunaken 20% 48% 0% 15% 4% 0% 0% 0% 12% 1% 16.4 0.18 8 1.41 0.68
23 697043 176429 Bunaken 28% 58% 0% 13% 1% 0% 0% 0% 0% 0% 16.4 0.18 7 1.41 0.73
24 696700 180056 Bunaken 34% 58% 0% 1% 6% 1% 0% 0% 0% 0% 17.6 0.12 10 1.87 0.81
25 692930 179689 Bunaken 10% 35% 0% 11% 5% 0% 0% 0% 38% 1% 18.7 0.07 6 1.50 0.84
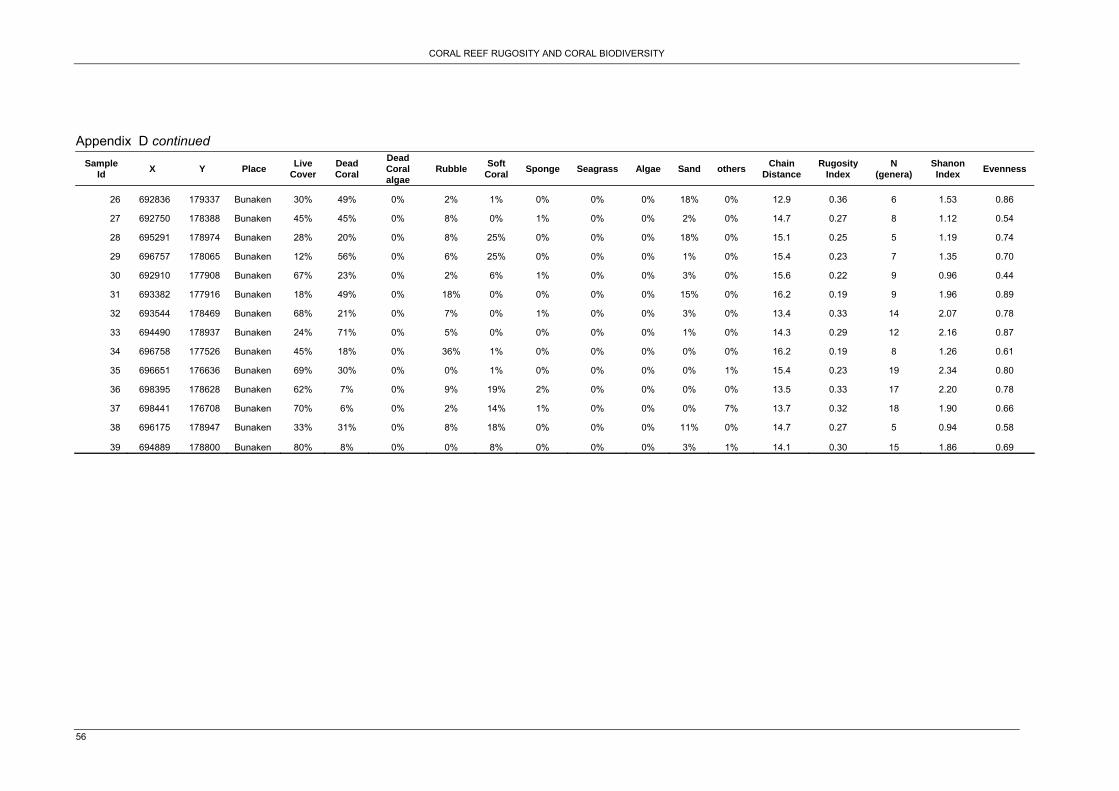
CORAL REEF RUGOSITY AND CORAL BIODIVERSITY
56
Appendix D continued
Sample Id X Y Place Live
Cover Dead Coral
Dead Coral algae
Rubble Soft Coral Sponge Seagrass Algae Sand others Chain
Distance Rugosity
Index N
(genera) Shanon Index Evenness
26 692836 179337 Bunaken 30% 49% 0% 2% 1% 0% 0% 0% 18% 0% 12.9 0.36 6 1.53 0.86
27 692750 178388 Bunaken 45% 45% 0% 8% 0% 1% 0% 0% 2% 0% 14.7 0.27 8 1.12 0.54
28 695291 178974 Bunaken 28% 20% 0% 8% 25% 0% 0% 0% 18% 0% 15.1 0.25 5 1.19 0.74
29 696757 178065 Bunaken 12% 56% 0% 6% 25% 0% 0% 0% 1% 0% 15.4 0.23 7 1.35 0.70
30 692910 177908 Bunaken 67% 23% 0% 2% 6% 1% 0% 0% 3% 0% 15.6 0.22 9 0.96 0.44
31 693382 177916 Bunaken 18% 49% 0% 18% 0% 0% 0% 0% 15% 0% 16.2 0.19 9 1.96 0.89
32 693544 178469 Bunaken 68% 21% 0% 7% 0% 1% 0% 0% 3% 0% 13.4 0.33 14 2.07 0.78
33 694490 178937 Bunaken 24% 71% 0% 5% 0% 0% 0% 0% 1% 0% 14.3 0.29 12 2.16 0.87
34 696758 177526 Bunaken 45% 18% 0% 36% 1% 0% 0% 0% 0% 0% 16.2 0.19 8 1.26 0.61
35 696651 176636 Bunaken 69% 30% 0% 0% 1% 0% 0% 0% 0% 1% 15.4 0.23 19 2.34 0.80
36 698395 178628 Bunaken 62% 7% 0% 9% 19% 2% 0% 0% 0% 0% 13.5 0.33 17 2.20 0.78
37 698441 176708 Bunaken 70% 6% 0% 2% 14% 1% 0% 0% 0% 7% 13.7 0.32 18 1.90 0.66
38 696175 178947 Bunaken 33% 31% 0% 8% 18% 0% 0% 0% 11% 0% 14.7 0.27 5 0.94 0.58
39 694889 178800 Bunaken 80% 8% 0% 0% 8% 0% 0% 0% 3% 1% 14.1 0.30 15 1.86 0.69
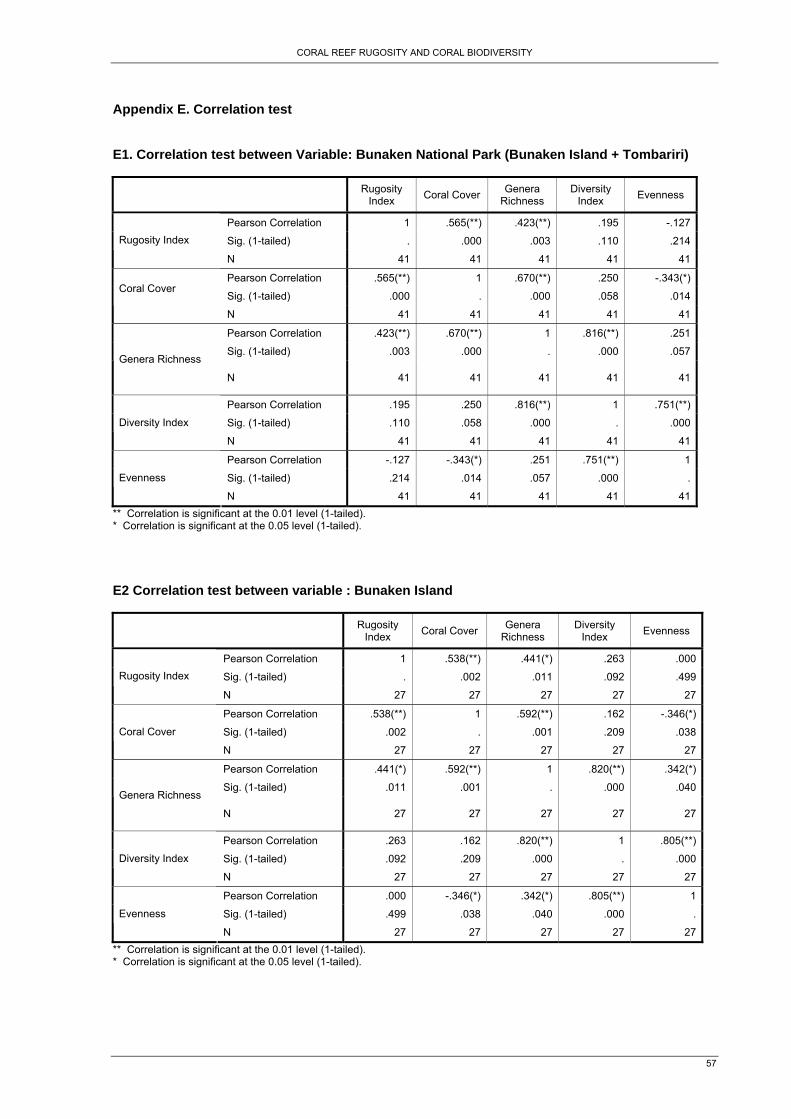
CORAL REEF RUGOSITY AND CORAL BIODIVERSITY
57
Appendix E. Correlation test
E1. Correlation test between Variable: Bunaken National Park (Bunaken Island + Tombariri)
Rugosity Index Coral Cover Genera
Richness Diversity
Index Evenness
Pearson Correlation 1 .565(**) .423(**) .195 -.127
Sig. (1-tailed) . .000 .003 .110 .214Rugosity Index
N 41 41 41 41 41
Pearson Correlation .565(**) 1 .670(**) .250 -.343(*)
Sig. (1-tailed) .000 . .000 .058 .014Coral Cover
N 41 41 41 41 41
Pearson Correlation .423(**) .670(**) 1 .816(**) .251
Sig. (1-tailed) .003 .000 . .000 .057Genera Richness
N 41 41 41 41 41
Pearson Correlation .195 .250 .816(**) 1 .751(**)
Sig. (1-tailed) .110 .058 .000 . .000Diversity Index
N 41 41 41 41 41
Pearson Correlation -.127 -.343(*) .251 .751(**) 1
Sig. (1-tailed) .214 .014 .057 .000 .Evenness
N 41 41 41 41 41** Correlation is significant at the 0.01 level (1-tailed). * Correlation is significant at the 0.05 level (1-tailed). E2 Correlation test between variable : Bunaken Island
Rugosity Index Coral Cover Genera
Richness Diversity
Index Evenness
Pearson Correlation 1 .538(**) .441(*) .263 .000
Sig. (1-tailed) . .002 .011 .092 .499Rugosity Index
N 27 27 27 27 27
Pearson Correlation .538(**) 1 .592(**) .162 -.346(*)
Sig. (1-tailed) .002 . .001 .209 .038Coral Cover
N 27 27 27 27 27
Pearson Correlation .441(*) .592(**) 1 .820(**) .342(*)
Sig. (1-tailed) .011 .001 . .000 .040Genera Richness
N 27 27 27 27 27
Pearson Correlation .263 .162 .820(**) 1 .805(**)
Sig. (1-tailed) .092 .209 .000 . .000Diversity Index
N 27 27 27 27 27
Pearson Correlation .000 -.346(*) .342(*) .805(**) 1
Sig. (1-tailed) .499 .038 .040 .000 .Evenness
N 27 27 27 27 27** Correlation is significant at the 0.01 level (1-tailed). * Correlation is significant at the 0.05 level (1-tailed).
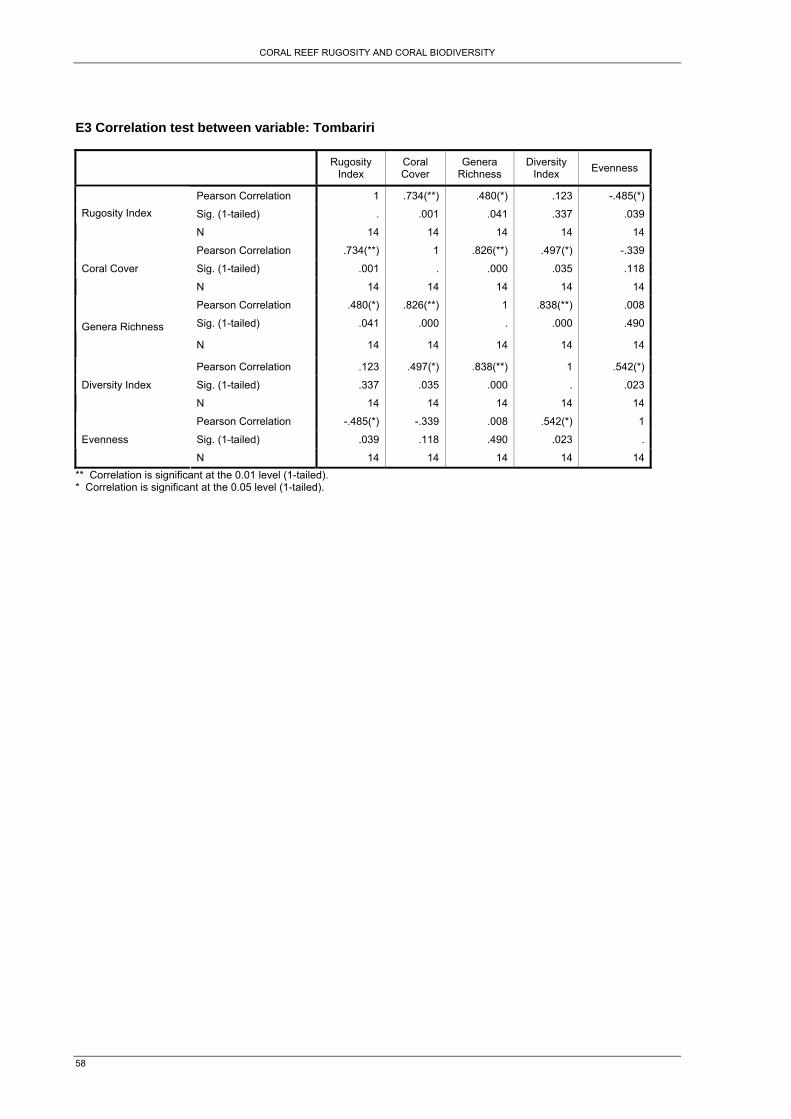
CORAL REEF RUGOSITY AND CORAL BIODIVERSITY
58
E3 Correlation test between variable: Tombariri
Rugosity Index
Coral Cover
Genera Richness
Diversity Index Evenness
Pearson Correlation 1 .734(**) .480(*) .123 -.485(*)
Sig. (1-tailed) . .001 .041 .337 .039 Rugosity Index
N 14 14 14 14 14
Pearson Correlation .734(**) 1 .826(**) .497(*) -.339
Sig. (1-tailed) .001 . .000 .035 .118 Coral Cover
N 14 14 14 14 14
Pearson Correlation .480(*) .826(**) 1 .838(**) .008
Sig. (1-tailed) .041 .000 . .000 .490 Genera Richness
N 14 14 14 14 14
Pearson Correlation .123 .497(*) .838(**) 1 .542(*)
Sig. (1-tailed) .337 .035 .000 . .023 Diversity Index
N 14 14 14 14 14
Pearson Correlation -.485(*) -.339 .008 .542(*) 1
Sig. (1-tailed) .039 .118 .490 .023 . Evenness
N 14 14 14 14 14 ** Correlation is significant at the 0.01 level (1-tailed). * Correlation is significant at the 0.05 level (1-tailed).
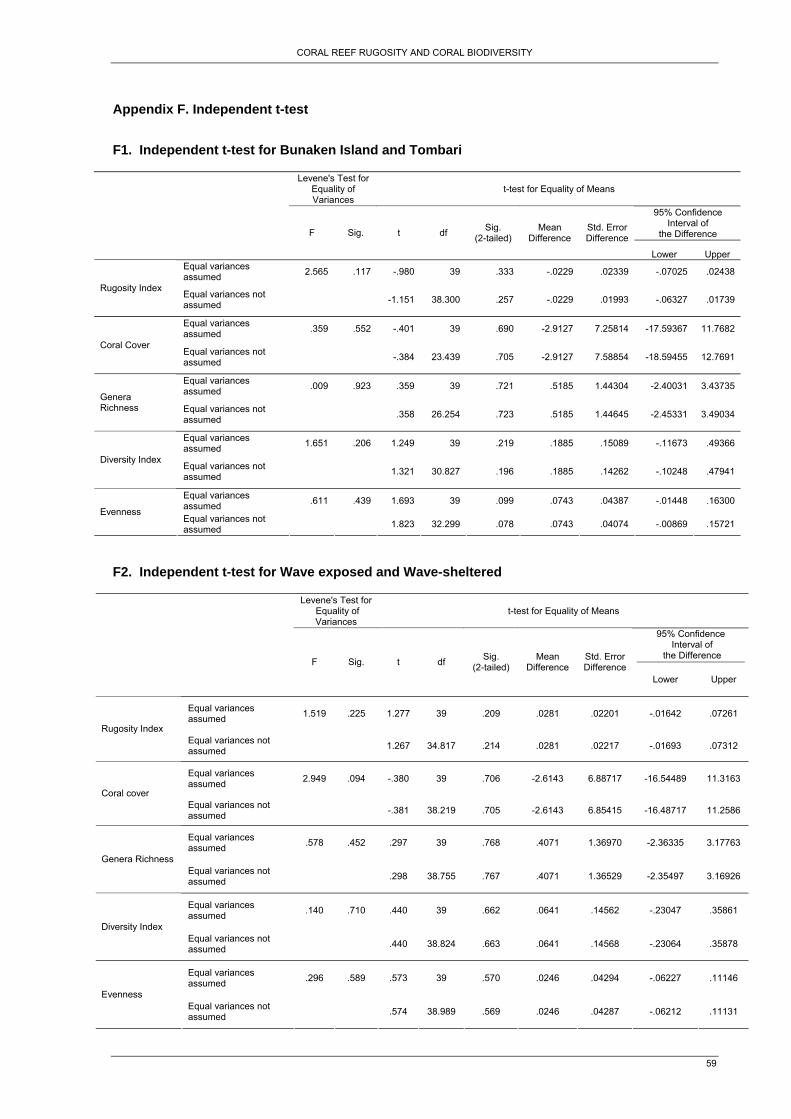
CORAL REEF RUGOSITY AND CORAL BIODIVERSITY
59
Appendix F. Independent t-test F1. Independent t-test for Bunaken Island and Tombari
Levene's Test for Equality of Variances
t-test for Equality of Means
95% Confidence Interval of
the Difference
F Sig. t df Sig. (2-tailed)
Mean Difference
Std. Error Difference
Lower Upper Equal variances assumed 2.565 .117 -.980 39 .333 -.0229 .02339 -.07025 .02438
Rugosity Index Equal variances not assumed -1.151 38.300 .257 -.0229 .01993 -.06327 .01739
Equal variances assumed .359 .552 -.401 39 .690 -2.9127 7.25814 -17.59367 11.7682
Coral Cover Equal variances not assumed -.384 23.439 .705 -2.9127 7.58854 -18.59455 12.7691
Equal variances assumed .009 .923 .359 39 .721 .5185 1.44304 -2.40031 3.43735
Genera Richness Equal variances not
assumed .358 26.254 .723 .5185 1.44645 -2.45331 3.49034
Equal variances assumed 1.651 .206 1.249 39 .219 .1885 .15089 -.11673 .49366
Diversity Index Equal variances not assumed 1.321 30.827 .196 .1885 .14262 -.10248 .47941
Equal variances assumed .611 .439 1.693 39 .099 .0743 .04387 -.01448 .16300
Evenness Equal variances not assumed 1.823 32.299 .078 .0743 .04074 -.00869 .15721
F2. Independent t-test for Wave exposed and Wave-sheltered
Levene's Test for Equality of Variances
t-test for Equality of Means
95% Confidence Interval of
the Difference
F Sig. t df Sig. (2-tailed)
Mean Difference
Std. Error Difference
Lower Upper
Equal variances assumed 1.519 .225 1.277 39 .209 .0281 .02201 -.01642 .07261
Rugosity Index Equal variances not assumed 1.267 34.817 .214 .0281 .02217 -.01693 .07312
Equal variances assumed 2.949 .094 -.380 39 .706 -2.6143 6.88717 -16.54489 11.3163
Coral cover Equal variances not assumed -.381 38.219 .705 -2.6143 6.85415 -16.48717 11.2586
Equal variances assumed .578 .452 .297 39 .768 .4071 1.36970 -2.36335 3.17763
Genera Richness Equal variances not assumed .298 38.755 .767 .4071 1.36529 -2.35497 3.16926
Equal variances assumed .140 .710 .440 39 .662 .0641 .14562 -.23047 .35861
Diversity Index Equal variances not assumed .440 38.824 .663 .0641 .14568 -.23064 .35878
Equal variances assumed .296 .589 .573 39 .570 .0246 .04294 -.06227 .11146
Evenness Equal variances not assumed .574 38.989 .569 .0246 .04287 -.06212 .11131
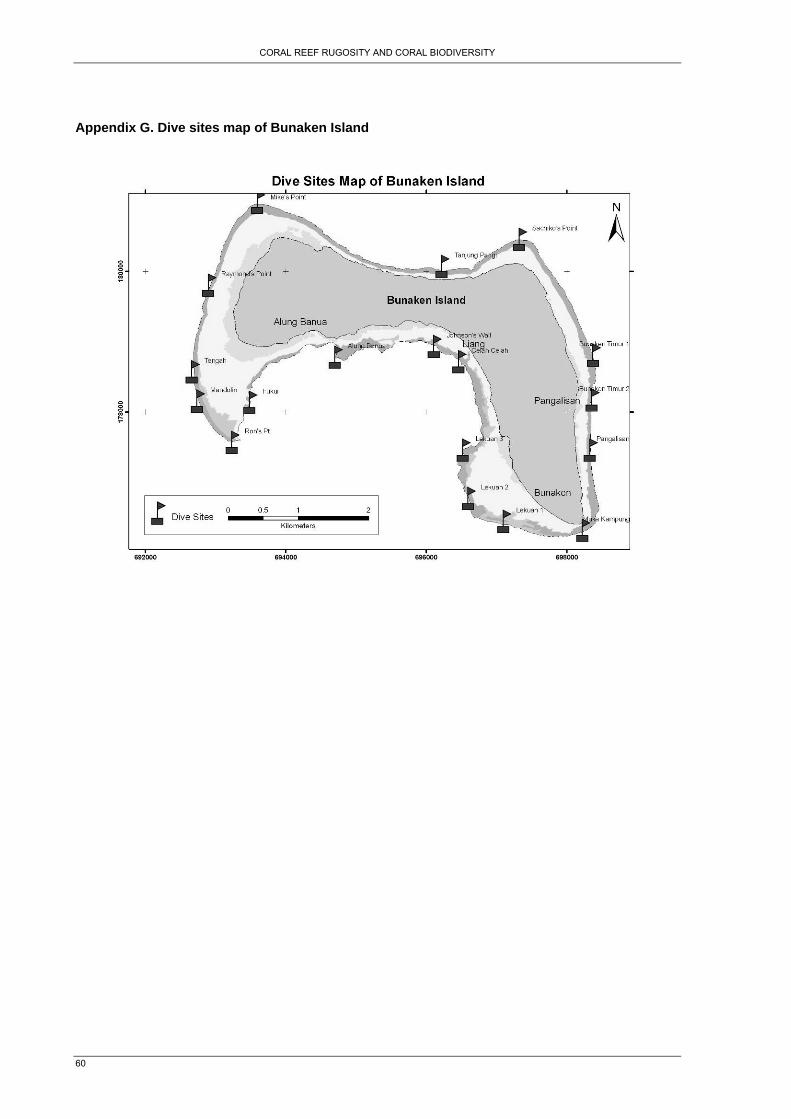
CORAL REEF RUGOSITY AND CORAL BIODIVERSITY
60
Appendix G. Dive sites map of Bunaken Island