Embed Size (px)
Citation preview
Supporting healthcareprofessionals for over 150 yearsSupporting healthcareprofessionals for over 150 years
Investor PresentationOctober – December 2018
Forward looking statements and non-IFRS measures
This document may contain forward-looking statements that may or may not prove accurate. For example, statements regarding expectedrevenue growth and trading margins, market trends and our product pipeline are forward-looking statements. Phrases such as "aim","plan", "intend", "anticipate", "well-placed", "believe", "estimate", "expect", "target", "consider" and similar expressions are generallyintended to identify forward-looking statements. Forward-looking statements involve known and unknown risks, uncertainties and otherimportant factors that could cause actual results to differ materially from what is expressed or implied by the statements. For Smith &Nephew, these factors include: economic and financial conditions in the markets we serve, especially those affecting health careproviders, payers and customers; price levels for established and innovative medical devices; developments in medical technology;regulatory approvals, reimbursement decisions or other government actions; product defects or recalls or other problems with qualitymanagement systems or failure to comply with related regulations; litigation relating to patent or other claims; legal compliance risks andrelated investigative, remedial or enforcement actions; disruption to our supply chain or operations or those of our suppliers; competitionfor qualified personnel; strategic actions, including acquisitions and dispositions, our success in performing due diligence, valuing andintegrating acquired businesses; disruption that may result from transactions or other changes we make in our business plans ororganisation to adapt to market developments; and numerous other matters that affect us or our markets, including those of a political,economic, business, competitive or reputational nature. Please refer to the documents that Smith & Nephew has filed with the U.S.Securities and Exchange Commission under the U.S. Securities Exchange Act of 1934, as amended, including Smith & Nephew's mostrecent annual report on Form 20-F, for a discussion of certain of these factors. Any forward-looking statement is based on informationavailable to Smith & Nephew as of the date of the statement. All written or oral forward-looking statements attributable to Smith & Nepheware qualified by this caution. Smith & Nephew does not undertake any obligation to update or revise any forward-looking statement toreflect any change in circumstances or in Smith & Nephew's expectations.
Certain items included in ‘trading results’, such as trading profit, trading profit margin, tax rate on trading results, trading cash flow, tradingprofit to cash conversion ratio, EPSA and underlying growth are non-IFRS financial measures. The non-IFRS financial measures in thisannouncement are explained and reconciled to the most directly comparable financial measure prepared in accordance with IFRS in ourThird Quarter 2018 Results announcement dated 1st November 2018.
2
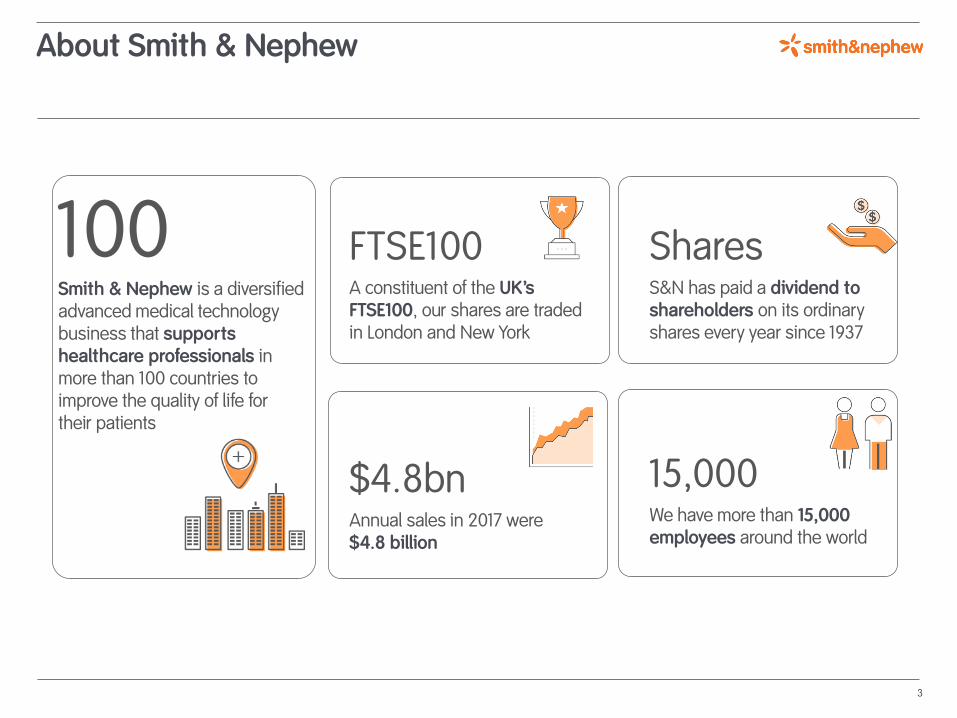
About Smith & Nephew
100Smith & Nephew is a diversified advanced medical technology business that supportshealthcare professionals in more than 100 countries to improve the quality of life for their patients
A constituent of the UK’s FTSE100, our shares are traded in London and New York
FTSE100
Annual sales in 2017 were $4.8 billion
$4.8bn
S&N has paid a dividend to shareholders on its ordinary shares every year since 1937
Shares
We have more than 15,000 employees around the world
15,000
3
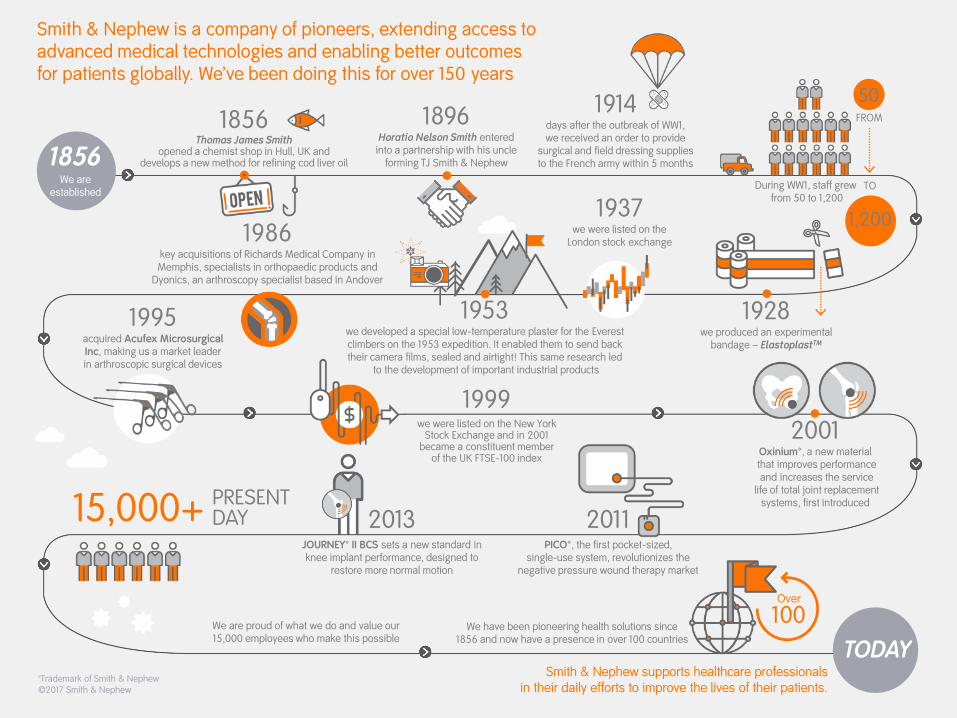
Smith & Nephew is a company of pioneers, extending access to advanced medical technologies and enabling better outcomes for patients globally. We’ve been doing this for over 150 years
Smith & Nephew supports healthcare professionals in their daily efforts to improve the lives of their patients.
™Trademark of Smith & Nephew©2017 Smith & Nephew
1856We are
established
TODAY
1856Thomas James Smith
opened a chemist shop in Hull, UK anddevelops a new method for refining cod liver oil
1896Horatio Nelson Smith entered
into a partnership with his uncle forming TJ Smith & Nephew
1914days after the outbreak of WW1, we received an order to provide
surgical and field dressing supplies to the French army within 5 months
50FROM
TO
1,2001986
key acquisitions of Richards Medical Company inMemphis, specialists in orthopaedic products and
Dyonics, an arthroscopy specialist based in Andover
1937we were listed on the
London stock exchange
1995acquired Acufex Microsurgical Inc, making us a market leader in arthroscopic surgical devices
1928we produced an experimental
bandage – ElastoplastTM
2001Oxinium™, a new materialthat improves performanceand increases the service
life of total joint replacementsystems, first introduced
1999we were listed on the New York
Stock Exchange and in 2001became a constituent member
of the UK FTSE-100 index
2011PICO™, the first pocket-sized,
single-use system, revolutionizes the negative pressure wound therapy market
2013JOURNEY™ II BCS sets a new standard inknee implant performance, designed to
restore more normal motion
We are proud of what we do and value our 15,000 employees who make this possible
We have been pioneering health solutions since 1856 and now have a presence in over 100 countries
15,000+ PRESENTDAY
Over
100
1953we developed a special low-temperature plaster for the Everestclimbers on the 1953 expedition. It enabled them to send backtheir camera films, sealed and airtight! This same research led
to the development of important industrial products
During WW1, staff grewfrom 50 to 1,200
90%
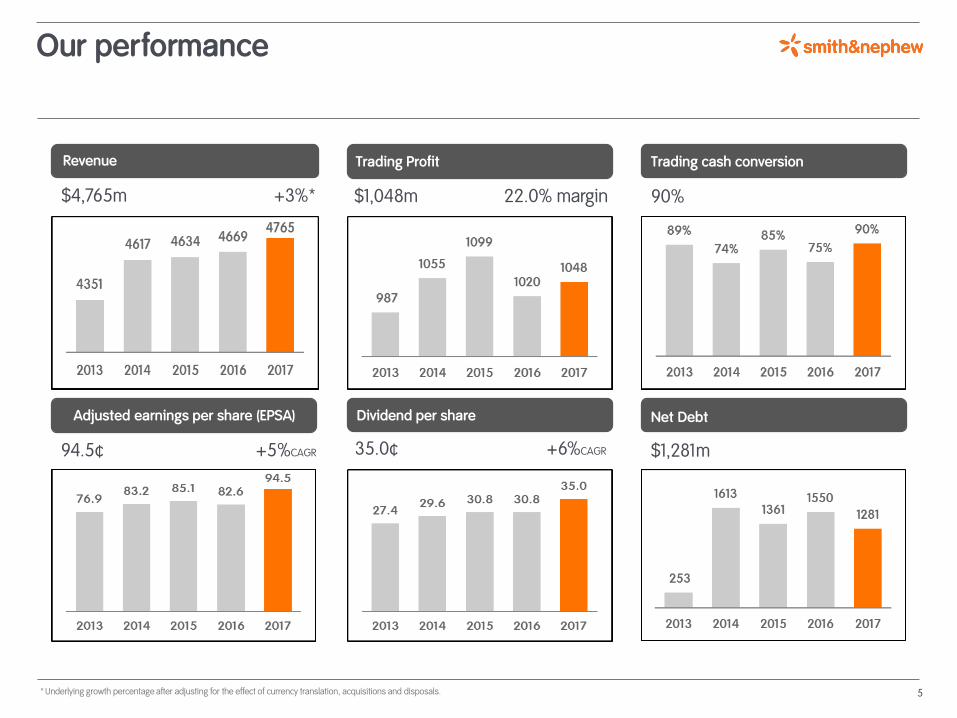
Our performance
$4,765m +3%* $1,048m 22.0% margin
$1,281m94.5¢ +5%CAGR 35.0¢ +6%CAGR
* Underlying growth percentage after adjusting for the effect of currency translation, acquisitions and disposals.
Revenue Trading Profit Trading cash conversion
Adjusted earnings per share (EPSA) Dividend per share Net Debt
5
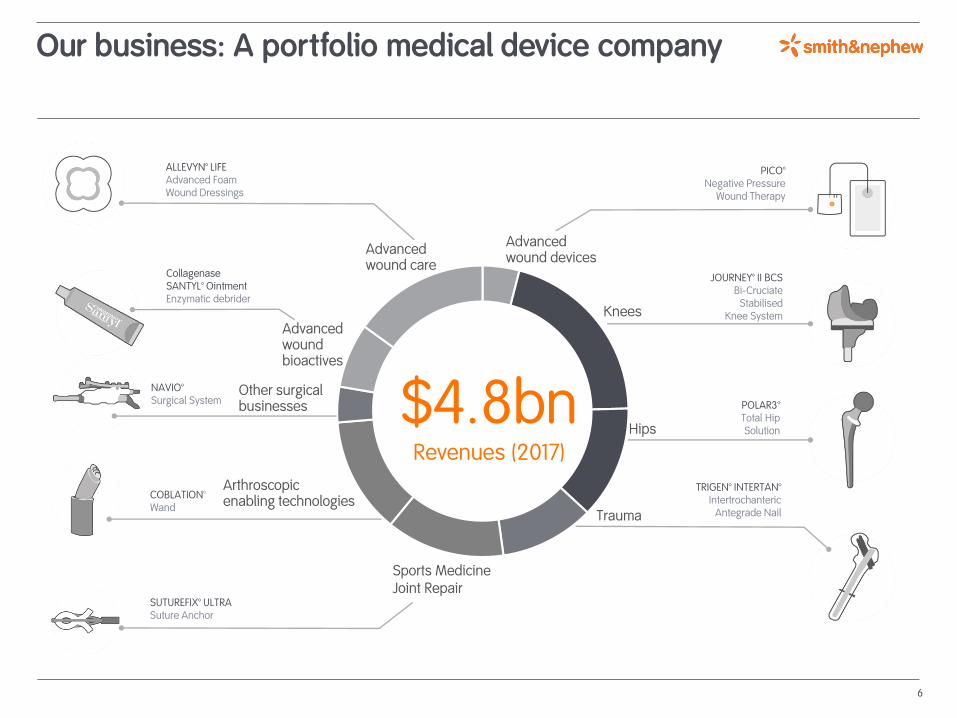
Our business: A portfolio medical device company
Advanced wound care
Advanced woundbioactives
Other surgicalbusinesses
Arthroscopic enabling technologies
Sports MedicineJoint Repair
Trauma
Hips
Knees
Advanced wound devices
ALLEVYN™ LIFEAdvanced Foam Wound Dressings
CollagenaseSANTYL™ OintmentEnzymatic debrider
NAVIO™Surgical System
COBLATION™Wand
SUTUREFIX™ ULTRASuture Anchor
PICO™Negative Pressure
Wound Therapy
JOURNEY™ II BCSBi-Cruciate
StabilisedKnee System
$4.8bnRevenues (2017)
POLAR3™Total HipSolution
TRIGEN™ INTERTAN™Intertrochanteric
Antegrade Nail
6
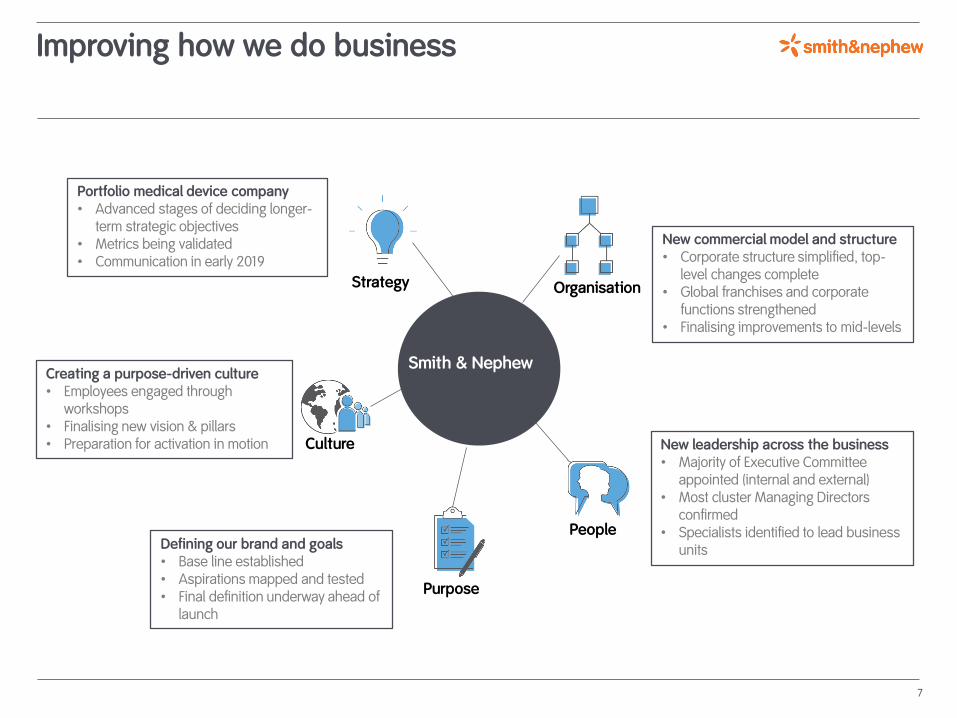
Improving how we do business
7
Organisation
Purpose
Smith & Nephew
Strategy
Culture
People
New commercial model and structure• Corporate structure simplified, top-
level changes complete • Global franchises and corporate
functions strengthened• Finalising improvements to mid-levels
New leadership across the business• Majority of Executive Committee
appointed (internal and external) • Most cluster Managing Directors
confirmed • Specialists identified to lead business
units
Creating a purpose-driven culture• Employees engaged through
workshops• Finalising new vision & pillars• Preparation for activation in motion
Defining our brand and goals• Base line established • Aspirations mapped and tested• Final definition underway ahead of
launch
Portfolio medical device company• Advanced stages of deciding longer-
term strategic objectives• Metrics being validated• Communication in early 2019
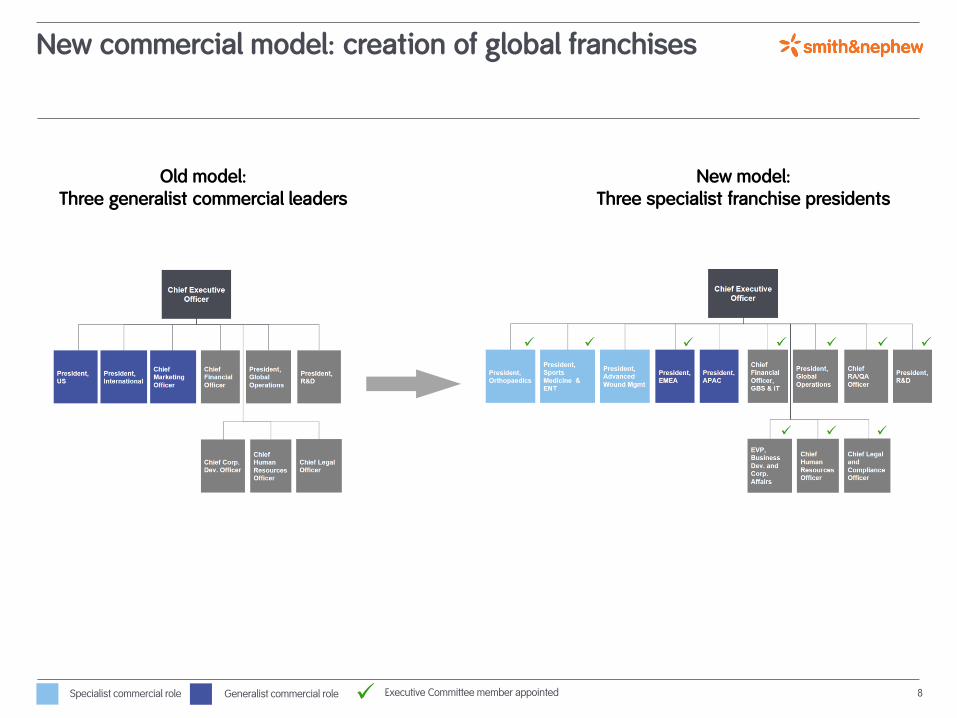
New commercial model: creation of global franchises
8 Executive Committee member appointed
New model:Three specialist franchise presidents
Old model:Three generalist commercial leaders
Specialist commercial role Generalist commercial role
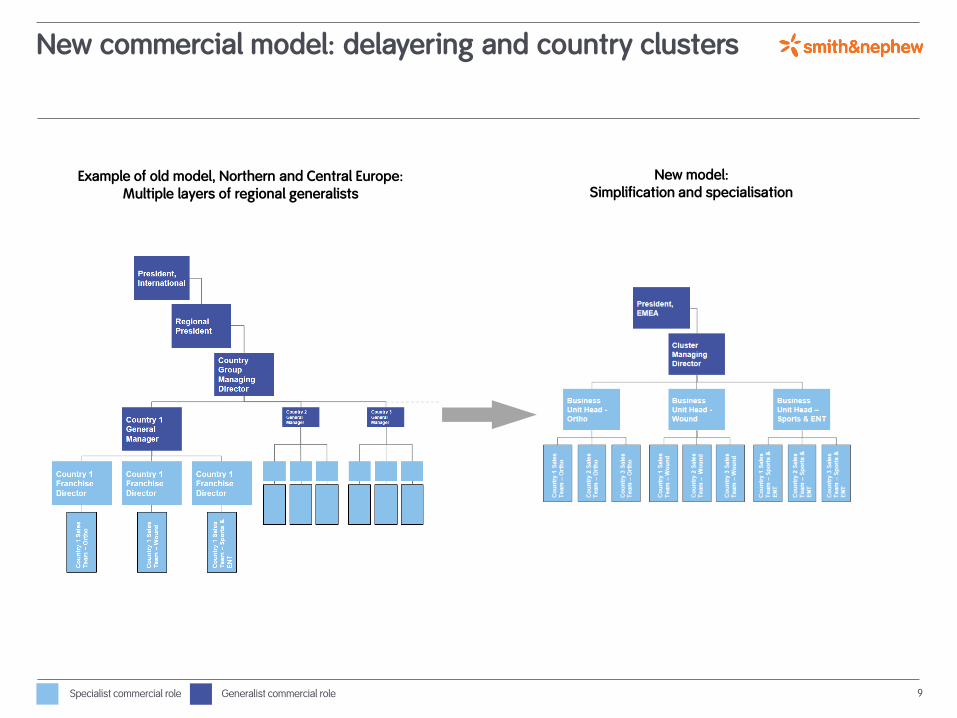
New commercial model: delayering and country clusters
9
Example of old model, Northern and Central Europe:Multiple layers of regional generalists
New model:Simplification and specialisation
Specialist commercial role Generalist commercial role
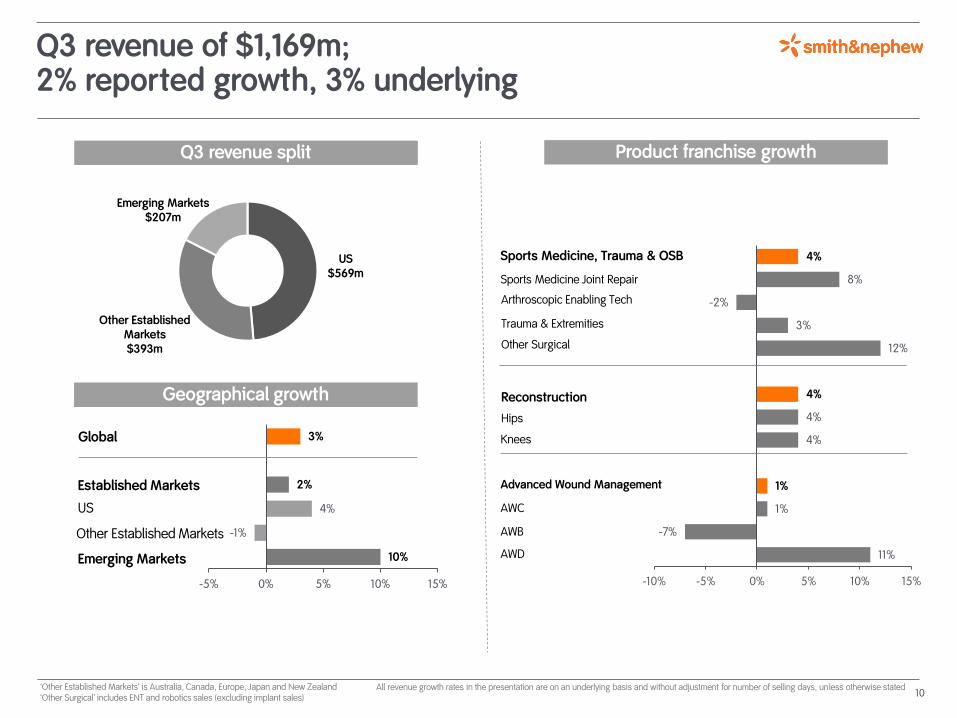
Q3 revenue of $1,169m; 2% reported growth, 3% underlying
10
11%
-7%
1%
1%
4%
4%
4%
12%
3%
-2%
8%
4%
-10% -5% 0% 5% 10% 15%
Sports Medicine Joint Repair
Arthroscopic Enabling Tech
Reconstruction
Hips
Knees
Advanced Wound Management
AWC
AWB
AWD
Trauma & Extremities
Other Surgical
Sports Medicine, Trauma & OSB
Product franchise growth
All revenue growth rates in the presentation are on an underlying basis and without adjustment for number of selling days, unless otherwise stated
10%
-1%
4%
2%
3%
-5% 0% 5% 10% 15%
Global
Established Markets
US
Other Established Markets
Emerging Markets
Q3 revenue split
Geographical growth
‘Other Established Markets’ is Australia, Canada, Europe, Japan and New Zealand ‘Other Surgical’ includes ENT and robotics sales (excluding implant sales)
US$569m
Other Established Markets $393m
Emerging Markets$207m
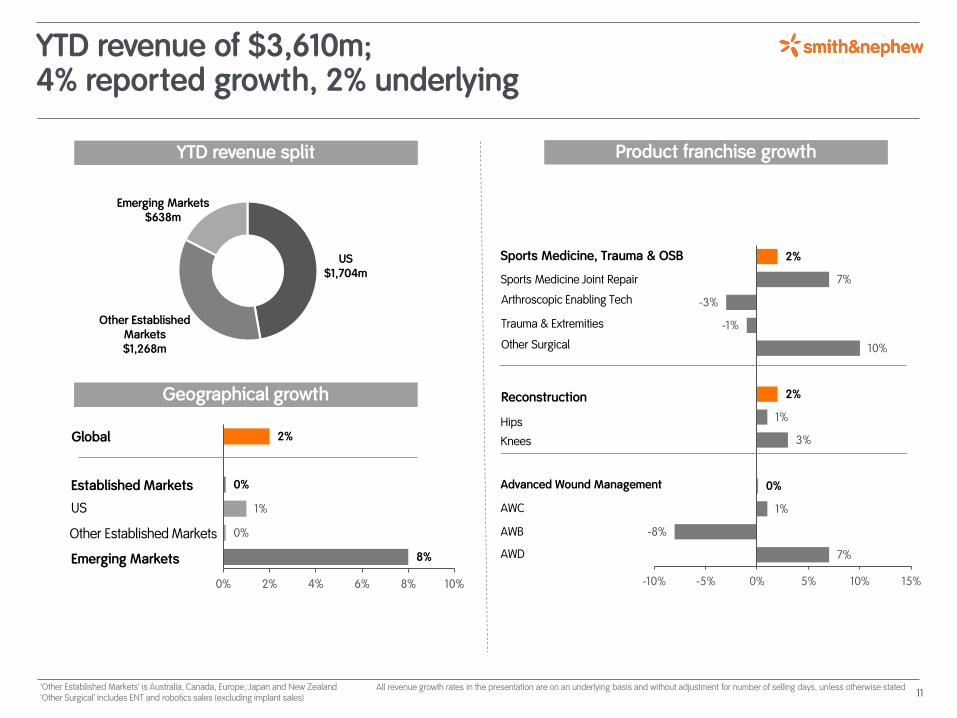
YTD revenue of $3,610m; 4% reported growth, 2% underlying
11
7%
-8%
1%
0%
3%
1%
2%
10%
-1%
-3%
7%
2%
-10% -5% 0% 5% 10% 15%
Sports Medicine Joint Repair
Arthroscopic Enabling Tech
Reconstruction
Hips
Knees
Advanced Wound Management
AWC
AWB
AWD
Trauma & Extremities
Other Surgical
Sports Medicine, Trauma & OSB
Product franchise growth
All revenue growth rates in the presentation are on an underlying basis and without adjustment for number of selling days, unless otherwise stated
8%
0%
1%
0%
2%
0% 2% 4% 6% 8% 10%
Global
Established Markets
US
Other Established Markets
Emerging Markets
YTD revenue split
Geographical growth
‘Other Established Markets’ is Australia, Canada, Europe, Japan and New Zealand ‘Other Surgical’ includes ENT and robotics sales (excluding implant sales)
US$1,704m
Other Established Markets $1,268m
Emerging Markets$638m
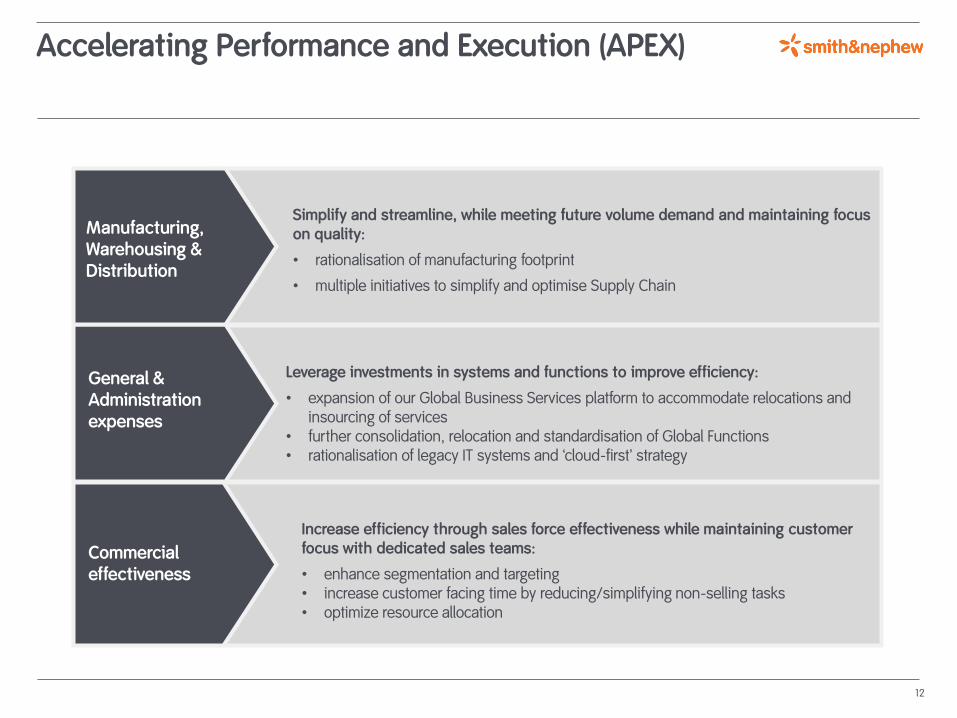
Increase efficiency through sales force effectiveness while maintaining customer focus with dedicated sales teams:
• enhance segmentation and targeting• increase customer facing time by reducing/simplifying non-selling tasks• optimize resource allocation
Leverage investments in systems and functions to improve efficiency:
• expansion of our Global Business Services platform to accommodate relocations and insourcing of services
• further consolidation, relocation and standardisation of Global Functions• rationalisation of legacy IT systems and ‘cloud-first’ strategy
Simplify and streamline, while meeting future volume demand and maintaining focus on quality:
• rationalisation of manufacturing footprint
• multiple initiatives to simplify and optimise Supply Chain
Accelerating Performance and Execution (APEX)
Manufacturing,Warehousing &Distribution
General & Administrationexpenses
Commercialeffectiveness
12
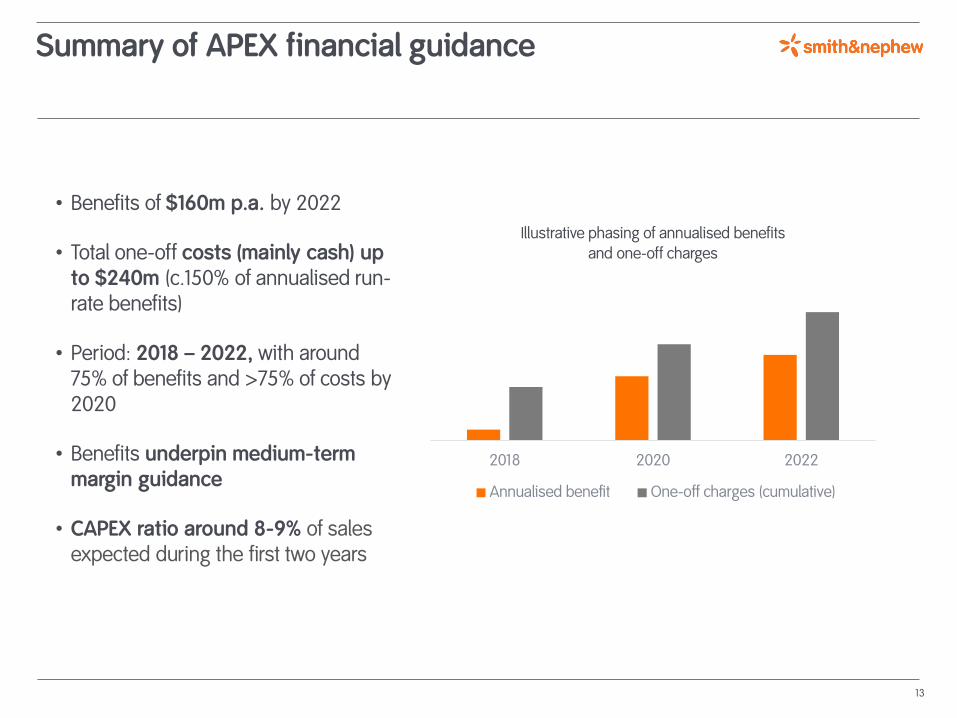
Summary of APEX financial guidance
• Benefits of $160m p.a. by 2022
• Total one-off costs (mainly cash) up to $240m (c.150% of annualised run-rate benefits)
• Period: 2018 – 2022, with around 75% of benefits and >75% of costs by 2020
• Benefits underpin medium-term margin guidance
• CAPEX ratio around 8-9% of sales expected during the first two years
2018 2020 2022
Illustrative phasing of annualised benefits
and one-off charges
Annualised benefit One-off charges (cumulative)
13
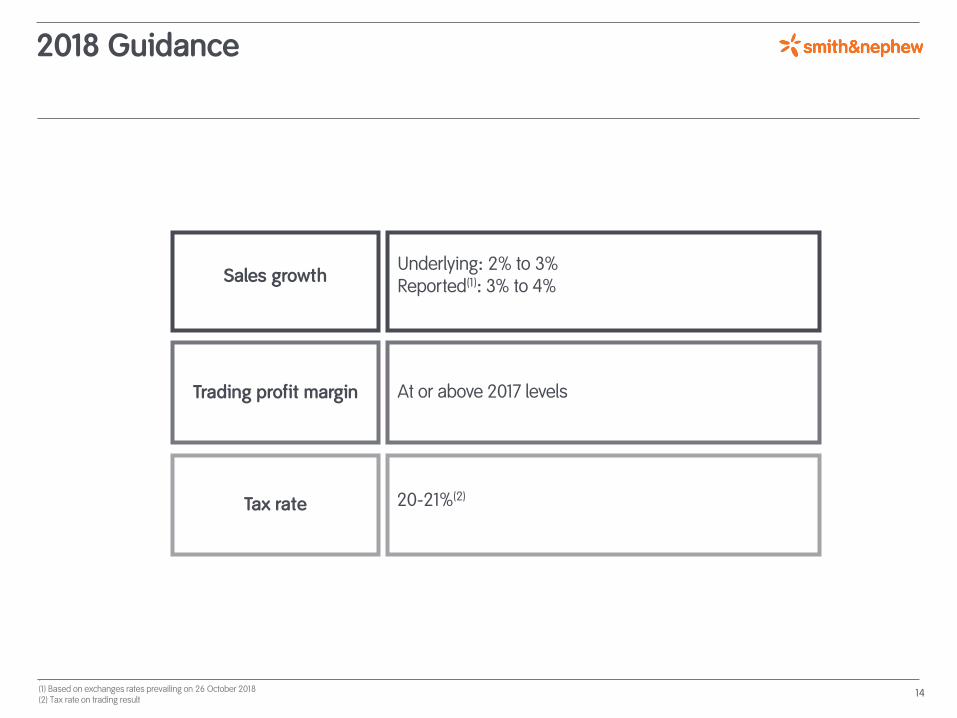
2018 Guidance
14
. (1) Based on exchanges rates prevailing on 26 October 2018(2) Tax rate on trading result
Sales growth
20-21%(2)
Underlying: 2% to 3%Reported(1): 3% to 4%
Tax rate
At or above 2017 levels Trading profit margin

Appendices
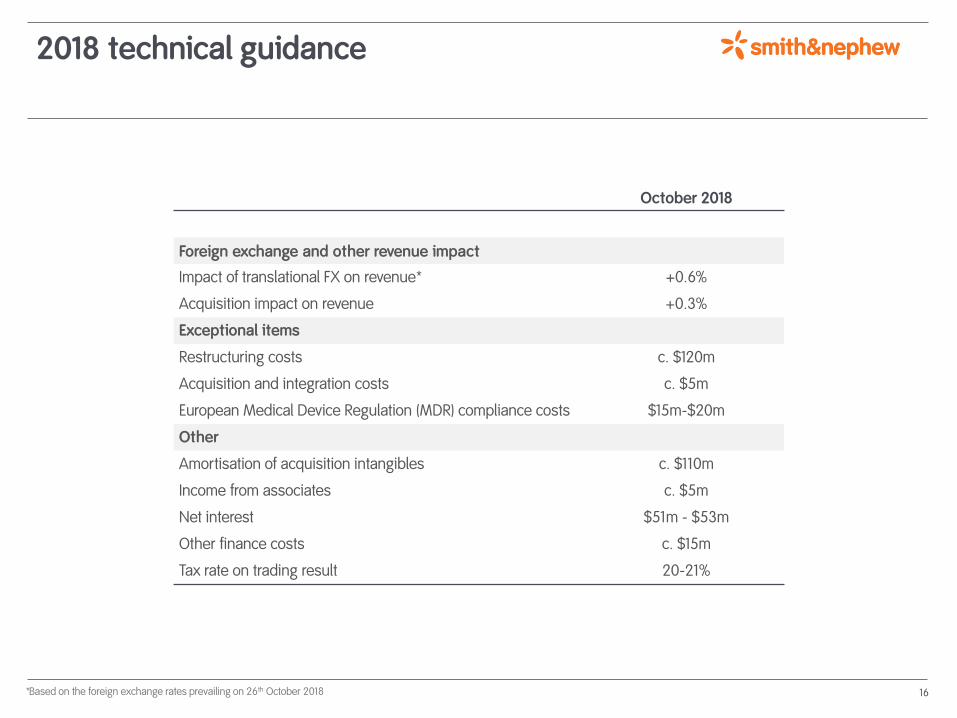
October 2018
Foreign exchange and other revenue impact
Impact of translational FX on revenue* +0.6%
Acquisition impact on revenue +0.3%
Exceptional items
Restructuring costs c. $120m
Acquisition and integration costs c. $5m
European Medical Device Regulation (MDR) compliance costs $15m-$20m
Other
Amortisation of acquisition intangibles c. $110m
Income from associates c. $5m
Net interest $51m - $53m
Other finance costs c. $15m
Tax rate on trading result 20-21%
*Based on the foreign exchange rates prevailing on 26th October 2018 16
2018 technical guidance
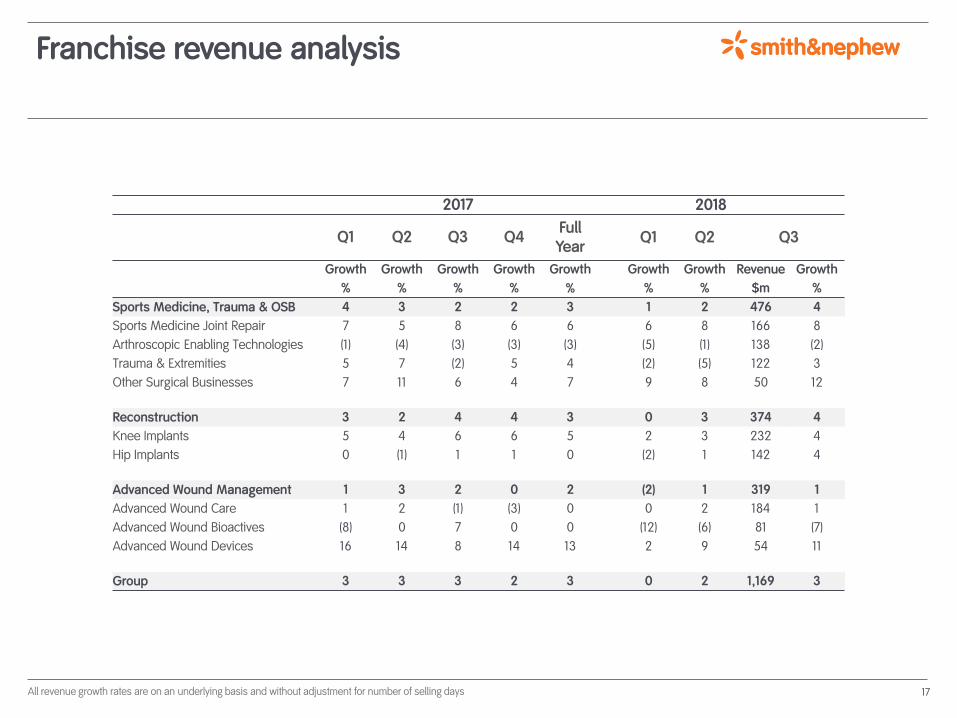
2017 2018
Q1 Q2 Q3 Q4FullYear
Q1 Q2 Q3
Growth Growth Growth Growth Growth Growth Growth Revenue Growth
% % % % % % % $m %
Sports Medicine, Trauma & OSB 4 3 2 2 3 1 2 476 4
Sports Medicine Joint Repair 7 5 8 6 6 6 8 166 8
Arthroscopic Enabling Technologies (1) (4) (3) (3) (3) (5) (1) 138 (2)
Trauma & Extremities 5 7 (2) 5 4 (2) (5) 122 3
Other Surgical Businesses 7 11 6 4 7 9 8 50 12
Reconstruction 3 2 4 4 3 0 3 374 4
Knee Implants 5 4 6 6 5 2 3 232 4
Hip Implants 0 (1) 1 1 0 (2) 1 142 4
Advanced Wound Management 1 3 2 0 2 (2) 1 319 1
Advanced Wound Care 1 2 (1) (3) 0 0 2 184 1
Advanced Wound Bioactives (8) 0 7 0 0 (12) (6) 81 (7)
Advanced Wound Devices 16 14 8 14 13 2 9 54 11
Group 3 3 3 2 3 0 2 1,169 3
All revenue growth rates are on an underlying basis and without adjustment for number of selling days 17
Franchise revenue analysis
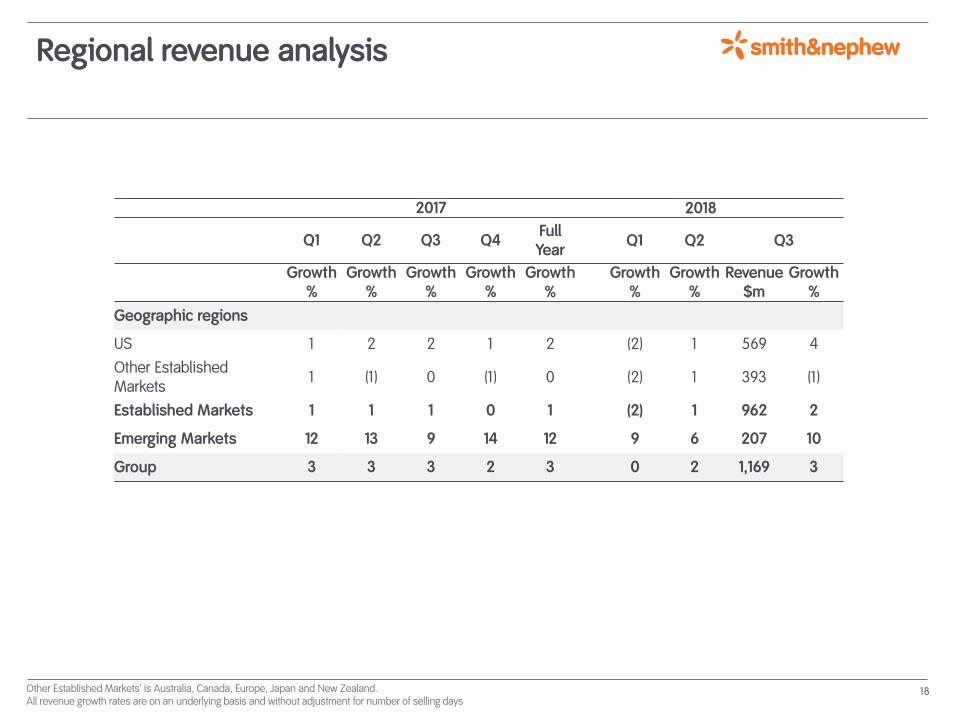
2017 2018
Q1 Q2 Q3 Q4FullYear
Q1 Q2 Q3
Growth Growth Growth Growth Growth Growth Growth Revenue Growth% % % % % % % $m %
Geographic regions
US 1 2 2 1 2 (2) 1 569 4
Other Established Markets
1 (1) 0 (1) 0 (2) 1 393 (1)
Established Markets 1 1 1 0 1 (2) 1 962 2
Emerging Markets 12 13 9 14 12 9 6 207 10
Group 3 3 3 2 3 0 2 1,169 3
Other Established Markets’ is Australia, Canada, Europe, Japan and New Zealand. All revenue growth rates are on an underlying basis and without adjustment for number of selling days
18
Regional revenue analysis
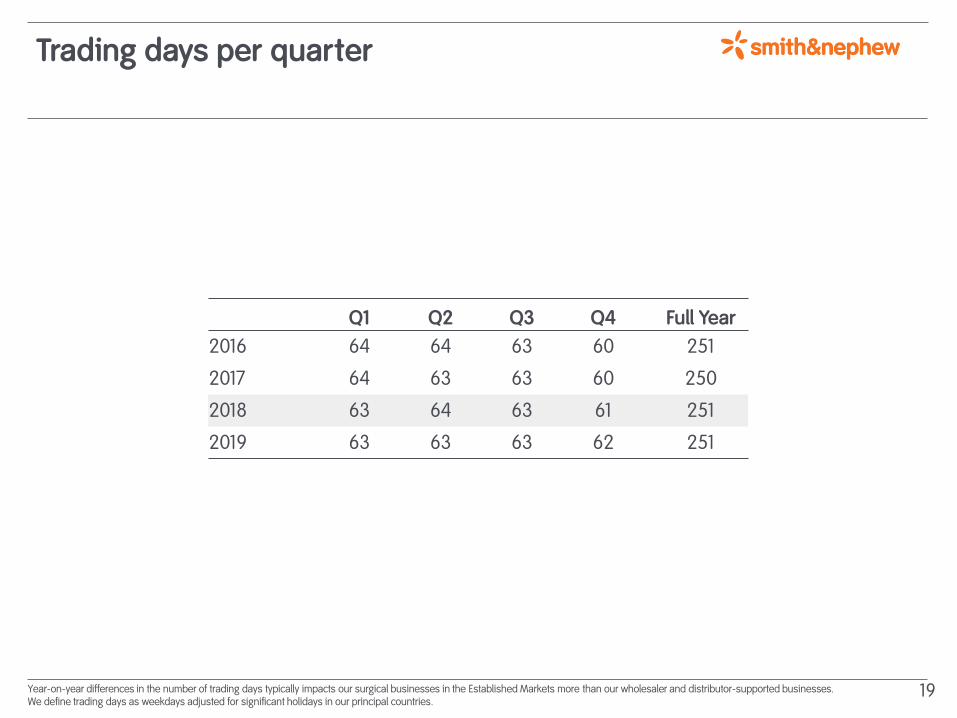
Year-on-year differences in the number of trading days typically impacts our surgical businesses in the Established Markets more than our wholesaler and distributor-supported businesses. We define trading days as weekdays adjusted for significant holidays in our principal countries.
Q1 Q2 Q3 Q4 Full Year
2016 64 64 63 60 251
2017 64 63 63 60 250
2018 63 64 63 61 251
2019 63 63 63 62 251
19
Trading days per quarter
Management
Namal NawanaChief Executive OfficerNamal joined the Board and was appointed Chief Executive Officer on 7 May 2018. He is based in Andover, US.Namal holds an Honours degree in mechanical engineering and a Master of Medical Science from the Universityof Adelaide, South Australia as well as an MBA from Henley Management College. Namal was Chief ExecutiveOfficer, President and a member of the Board of Directors of Alere, Inc. from October 2014 until October 2017,when Alere was acquired by Abbott Laboratories. Namal joined Alere as Chief Operating Officer in December 2012before being named Interim Chief Executive Officer in July 2014. Before joining Alere, Namal spent more than 15years at Johnson & Johnson in various leadership roles. He served as the Worldwide President of DePuy SynthesSpine, a Johnson & Johnson company, from February 2011 to November 2012. Prior to that he served in roles ofincreasing responsibility in Europe, Asia and North America. Namal was appointed to the Board of Directors ofHologic, Inc. in January 2018. Namal has a solid, international background in orthopaedics, sports medicine andspine, together with a track record of performance, execution and driving change. He is a truly global executivewith wide international experience across a range of geographies and also has the experience as a CEO of amajor US listed company in the healthcare sector where he turned the company round prior to its acquisition.
Graham BakerChief Financial OfficerGraham joined the Board as Chief Financial Officer in March 2017. He holds an MA degree in Economics fromCambridge University and qualified as a Chartered Accountant and Chartered Tax Advisor with Arthur Andersen.In 1995, he joined AstraZeneca PLC where he worked for 20 years, holding multiple senior roles, including VicePresident, Finance, International (2013-2015) with responsibility for all emerging markets, Vice President, GlobalFinancial Services (2011-2013) and Vice President Finance & Chief Financial Officer, North America (2008-10). Mostrecently, Graham was Chief Financial Officer of generic pharmaceuticals company Alvogen. Graham has deepsector knowledge and has had extensive exposure to established and emerging markets which is extremelyrelevant to his role at Smith & Nephew. He has a strong track record of delivering operational excellence and hasrelevant experience across major finance roles and geographic markets, leading large teams responsible forsignificant budgets.
20

Investor Relations Contacts
Andrew Swift
Head of Investor Relations
T: +44 (0) 207 960 2285
Nick Fridberg
Senior Director Strategic Planning & Investor Relations
T: +44 (0) 192 347 7100
Ghazaleh Mahdizadeh
Investor Relations Manager
T: +44 (0) 207 960 2339
Smith & Nephew plc
15 Adam Street
London
WC2N 6LA
21


![Looking back and looking forward[1]](https://img.pdfslide.net/doc/110x75/5559ad0dd8b42aa4288b511b/looking-back-and-looking-forward1.jpg)