Embed Size (px)
Citation preview

Corporate Deleveraging and Financial Flexibility:
A Cross – Country Analysis
Daniel Dreher
Thesis Submitted for the Financial Analyst Honors Program
Dr. Rita Biswas
Dr. Ying Wang
University at Albany
Fall 2019

Corporate Deleveraging and Financial Flexibility
2
ABSTRACT
Most firms naturally tend to deleverage from their historical peak market-leverage (ML) ratios to
near-zero ML while also insisting on growing and maintaining high cash balances. Among 424
publicly traded non-United States companies based in developed countries with five or more years
post peak ML data, the median ML at the historical peak is 0.369 and 0.021 at the subsequent
trough. The median cash/total assets ratio rises from 0.046 to 0.080, respectively, during the
corresponding period. These findings universally support prevailing theories in which firms
deleverage from peak ML to restore ample financial flexibility and rebuild cash balances to assure
reliable and cost-efficient access to capital. There are only two considerable differences between
developed and emerging market economy firms. ML ratios at the peak and trough are 9.1% and
7.6% higher, respectively, in the emerging markets when compared to the developed markets.
Book leverage (BL) ratios at the peak and trough are 6.4% and 5.7% higher, respectively, in the
emerging markets when compared to the developed markets. Net debt ratios (NDR) at the peak
and trough are 11% and 6.6% higher, respectively, in the emerging markets when compared to the
developed markets. The average annual changes of ML in the developed sample from the peak to
trough are just about -7% while the changes are only -4% in the emerging markets sample. In
addition, during the deleveraging period, the change in the NDR from ML peak to trough is 28%
higher in developed countries than in emerging markets. These findings support theories in which
there are key differences in the capital structure decisions of companies in developed countries
and that of those in emerging market countries.

Corporate Deleveraging and Financial Flexibility
3
Table of Contents
I. INTRODUCTION 4
II. LITERATURE REVIEW 6
III. HYPOTHESES 12
IV. DATA & METHODOLOGY 12
A. SAMPLE CONSTRUCTION 13
B. METHODOLOGY 14
V. DEVELOPED COUNTRY ANALYSIS AND RESULTS 16
A. FREQUENCY DISTRIBUTION OF DEVELOPED COUNTRY SAMPLE 16
B. DECILES OF PEAK MARKET LEVERAGE FOR DEVELOPED COUNTRIES 18
C. ANNUAL DELEVERAGING TENDENCIES 21
D. DELEVERAGING WHILE RESTORING FINANCIAL FLEXIBILITY 22
VI. EMERGING MARKET ANALYSIS AND RESULTS 26
A. DEBT MARKETS IN EMERGING MARKETS 26
B. FREQUENCY DISTRIBUTION OF EMERGING MARKET SAMPLE 26
C. DECILES OF PEAK MARKET LEVERAGE FOR EMERGING COUNTRIES 29
D. ANNUAL DELEVERAGING TENDENCIES 31
E. DELEVERAGING WHILE RESTORING FINANCIAL FLEXIBILITY 32
VII. KEY DIFFERENCES BETWEEN DEVELOPED AND EMERGING 36
VIII. FINDINGS 39
A. ON DELEVERAGING AND CASH ACCRETION 39
B. ON DIFFERENCES BETWEEN DEVELOPED AND EMERGING COUNTRIES 39
IX. CONCLUSION 41
X. REFERENCES 42

Corporate Deleveraging and Financial Flexibility
4
I. Introduction
Traditional capital structure theories appeal to the tax benefit versus bankruptcy cost
tradeoffs to justify firm managers maintaining a certain level of debt. These theories can be seen
in Gilson (1997); Lintner (1956); Stiglitz (1973). On the other hand, the financial flexibility
argument in capital structure theory says that most firms will set financial policies that allow them
to have the easiest, most cost-effective access to capital. Under this argument, firms might choose
debt in the short term, but their long-term preference will be for near-zero or very low levels of
debt so that they retain the financial flexibility. This is shown in Denis (2011); DeAngelo et al.
(2007); DeAngelo et al. (2011). However, the empirical evidence on this has been mixed in studies
such as Hartford et al. (2009) and Skinner (2008).
DeAngelo et al. (2017) conduct a study on US public non-financial firms and show that
firms deleverage to restore ample financial flexibility and that management of corporations carry
out decisions with financial flexibility in mind. Their findings explain why most firms proactively
deleverage from peak to near-zero ML. ML stands for Market Leverage and it is the book value of
total debt divided by book debt plus the market value of equity. Their findings also explain why
most firms deleverage to negative net debt as well after having similar conservative fiscal policies
before the peak ML. They also show that firms treat financial flexibility and the option to borrow
as valuable, with debt used for short-lived financing rather than permanent financing. They
recognize the benefits of internally generated equity obtained through retained earnings. They
show that firms have important financial flexibility-related dependencies among leverage, cash-
balance, and retention versus payout decisions.
The purpose of this paper will be to expand on the work done by Deangelo et al. (2017)
through a cross-country analysis by sparking this question to a sample of Non-US publicly traded
Corporate Deleveraging and Financial Flexibility
5
companies. The analysis is broken down further by comparing the results of developed countries
to those of emerging market countries. The size of emerging markets, especially the debt markets
in them have grown over the prior decade. While the increase in market size has been
comprehensively documented, the fact that emerging market debt liquidity is presently on the same
level as US investment grade liquidity is less widely known. In emerging market nations, the risks
that accompany all debt issuances in developed nations are heightened due to the potential political
and economic volatility. Emerging markets also face other cross-border risks, including exchange
rate fluctuations and currency devaluations. Emerging market firms, like more external financing
dependent, small or medium enterprises compared to larger firms in developed countries, or
companies with limited collateral to post, would more likely disproportionately increase their
leverage ratios relative to other types of firms. In addition, advantageous global monetary
conditions can foster leverage growth by relaxing financial borrowing constraints, which is
exacerbated in emerging market firms relative to those in developed markets. Vo (2017); Alter
(2016). Furthering the work done by DeAngelo et al. (2017) is important to provide us a look into
how other developed countries treat financial flexibility and how emerging market countries may
differ.

Corporate Deleveraging and Financial Flexibility
6
II. Literature Review
The findings from DeAngelo et al. (2017) offer us insights into how managers think when it
comes to capital structure decisions. They demonstrate to us that many firms view debt largely as
a funding tool and do not see material (tax or agency) benefits from having debt permanently in
the capital structure. A fundamental reason is that proactive deleveraging to near-zero ML and
negative net debt is pervasive, and such deleveraging is incompatible with firms treating debt as a
perpetual source of capital. Findings from Stiglitz (1973) show that Empirical studies of the effects
of taxation on corporate financial structure suggest that taxation has not caused a very significant
effect on corporate financial structure, let alone the drastic change that one might have anticipated
given the exceptionally vast increases in the corporate tax rates in the last fifty years. Lang et al.
(1995) show that the agency costs of owning debt over equity has no material value. Agency costs
of equity arises when there are differences in the thoughts of management and shareholders of the
firm. Agency cost of debt arises when there are differences of thought between the shareholders
and debt holders, for instance the behavior seen in giving out cash dividends to shareholders.
Another issue that arises when management deals with financial flexibility is that there is a
relationship between paying out dividends, retaining the earnings, or repurchasing shares. These
change based on the capital structure of the company, what type of company it is, and how they
sell themselves to the shareholders and debt holders. DeAngelo et al. (2017) show that many of
the firms would prefer to increase dividends while deleveraging, forsaking paying down more debt
or building cash balances, prioritizing financial flexibility considerations (future access to equity
capital). After satisfying shareholders of the firm, the next priority would be to build cash balances
to allow future financial flexibility resulting in easier access to funding needs.
Corporate Deleveraging and Financial Flexibility
7
Lintner (1956), shows that managers are extremely reluctant to cut dividends. Evidence from
the study is consistent with a judgment that postwar dividends were undepressed (below normal
expectations in terms of profits after tax and long-established policies) by the large tax bite out of
pretax earnings. Even during a time of high PPE and capex expenditures caused by the war, many
firms chose to keep the payouts. Skinner (2008) shows that the relation between overall firm
payouts, defined as the sum of dividends and (net) repurchases, is stronger than the relation
between earnings and dividends. Skinner adopts the Lintner model to analyze the relation between
the payouts and earnings. He also shows managers of firms with long-standing dividend policies
are increasingly conservative in setting their firms’ dividend policies, reducing the strength of the
link between dividends and earnings. On the other hand, there is an increasingly dynamic relation
between repurchases and earnings, created in a more rapid speed of adjustment of repurchases to
earnings. Because managers are not obliged to make the repurchases every year, they are likely to
connect repurchases to earnings over longer periods. This shows that Lintner regressions of
payouts on the earnings will have more significant coefficients and higher explanatory power.
In addition, DeAngelo et al. (2017) show that, contrary to widespread belief, many firms do
not genuinely have positive leverage targets. Firms could avoid overshooting of deleveraging
targets by buying back shares or paying dividends instead of accumulating cash balances. Such
transitory payouts could keep the ML ratios higher. Alternatively, the firms choose to grow cash
balances, pushing ML closer to zero and net debt negative, possibly to be able to obtain future debt
more easily, therefore exhibiting their preference for financial flexibility.
Financial flexibility refers to the ability of a firm to answer in an apt and value-maximizing
way to unexpected changes in the firm's cash flows or investment opportunity set. The concept of
financial flexibility is not recent. However, until recently, flexibility considerations have not been

Corporate Deleveraging and Financial Flexibility
8
considered a first-order determinant of corporate financial policies. Denis (2011) notifies us that
increasingly, academics have argued that the desire of firms to maintain flexibility remains a
critical component of corporate financial policies. Several studies to date provide theory and
evidence in support of the view that firms attain financial flexibility through the management of
corporate liquidity, through capital structure policies, and through payout policy. Denis et al.
(2012) indicates that firms that intentionally increase leverage through substantial debt issuances
do so primarily as a response to operating needs and not a desire to make a large equity payout. In
lieu, the growth of the firm’s leverage ratio varies mostly on whether the company yields a
financial excess. Companies that create subsequent shortfalls typically tend to finance these
deficits principally with more debt even though they show leverage ratios that are well above
normal estimated target levels.
In addition, DeAngelo et al. (2017) talk about capital structure, payout policy and financial
flexibility. They combine elements of the pecking order and trade-off theories of capital structure
to develop a more influential and empirically descriptive theory. In this theory, firms have low
long-run leverage targets; debt sales are temporary abnormalities from the target to meet
unexpected capital needs, companies rebalance to target with a pause despite zero adjustment
costs, and older firms pay big dividends to substitute access to external equity while restraining
internal funds to mitigate agency costs and lower corporate taxes.
DeAngelo et al. (2011) demonstrate to us that firms deliberately deviate from permanent
leverage targets by issuing transitory debt. They estimate a dynamic capital structure model with
these features and find it replicates industry leverage very well, explains debt
issuances/repayments better than existing tradeoff models, and accounts for the leverage changes
accompanying investment spikes. They find that firms that issue debt incur no flotation or other
Corporate Deleveraging and Financial Flexibility
9
direct issuance costs, but nonetheless face an economically meaningful opportunity cost of
borrowing. This is because a firm’s decision to issue debt in a given period reduces the debt
capacity available to meet its future funding needs or more generally, reduces the firm’s ultimate
ability to borrow at the terms it currently faces.
In summary, the findings around capital structure and financial flexibility policies of United
States firms shows that firms prefer ample financial flexibility. They prefer it mainly to secure
more extensive access to future capital needs, use debt only a transitory as there are no tax nor
agency benefits to acquiring permanent long-term debt, and that firms from the sample, contrary
to general belief, may not proactively target positive leverage ratios. As an alternative, the firms
chose to grow cash balances, pushing ML closer to zero and net debt negative, possibly to be able
to afford future debt, therefore indicating their preference for financial flexibility.
As a segue into what will be discussed regarding financial flexibility into non-US public
companies and the differences between developed countries and emerging countries, this study
will first present the research on financial flexibility and corporate structure strategy in the
international marketplace. Bancel (2004) shows us financial flexibility and earnings per share
dilution are primary concerns of managers in issuing debt and common stock, respectively.
Managers equally value hedging considerations and use windows of opportunities when obtaining
capital. They find that although a country's legal environment remains a principal cause of debt
policy, it represents a minor role in common shareholder policy. They also find firms’ financial
policies are partial to both their environment and their overseas operations. Firms find their most
optimal capital structures by tradeoff costs and welfares of financing. Dejong et al. (2008) study
capital structure decisions around the world. They analyze important firm-specific and country-
specific factors in the leverage choice of firms from 42 countries around the world. Their analysis
Corporate Deleveraging and Financial Flexibility
10
yields two new results. Primarily, they find that firm-specific determinants of leverage differ across
countries, while more prior studies implicitly assume equal impact of these determinants. Second,
although they agree with the conventional direct impact of country-specific factors on the capital
structure of firms, they show there is an indirect impact because country-specific factors also affect
the roles of company-specific factors of leverage. These findings are significant to the research
that is going to be completed on a cross-country basis.
In addition, the present study will contribute to research that has been done in the emerging
markets (EM) segment as the study will carry out research into the differences between them and
the policies of established countries. Alter (2016) shows that corporate debt in emerging markets
has risen significantly in recent years amid accommodative global financial conditions. Alter finds
that accommodative U.S. financial circumstances are reliably related with faster EM debt growth
during the past 10 years. In specific, a 1-percentage point decline in the U.S. policy rate agrees to
a considerable increase in EM leverage growth of 9 bps on average (comparative to the sample
mean debt growth of 35 bps per year). This impact is more marked for companies that are
dependent on outside financing, for SMEs (small-scale and medium-sized enterprises), and for
companies in more financially open emerging markets with less flexibility in exchange rates.
These findings suggest that worldwide financial circumstances move EM firms’ debt growth in
part by changing domestic interest rates and by soothing corporate borrowing restrictions.
Vo (2017) studies capital structure in emerging markets, with evidence from Vietnam. Capital
structure theory is more important in emerging markets due to their unique legal, cultural, and
institutional characteristics. This paper sheds light on the question on whether determinants on
capital structure policy are different in emerging markets. Results from the study show that the
determinants of capital structure are different in emerging markets for long-term and short-term

Corporate Deleveraging and Financial Flexibility
11
indicators due to the unique differences involved. Given the increasing importance of emerging
markets, investigation of financing decisions in emerging economies is a fascinating topic on its
own merits. Despite a vast volume of research in the literature about capital structure determinants,
there is, however, a gap in investigating this issue in emerging economies. This paper will shed
more light into the emerging market aspects of capital structure theory. One should expect to
identify a few key differences in the capital structure policies of emerging market firms and
developed market firms. First, one should expect to see a marginally higher average ML ratio for
the emerging market firms compared to the developed country firms due to increased dependence
on external financing, less advantageous alternatives in the illiquid equity markets and historically
higher propensities to use debt financing. One should also expect to see a higher cash buildup
during the deleveraging period for the emerging market countries relative to the developed country
firms. It is more important in the volatile emerging markets relative to the more stable developed
markets to have the cash available to have better future access to capital and to mitigate future
issues of liquidity, solvency, and other inherent risks.

Corporate Deleveraging and Financial Flexibility
12
III. Hypotheses
The hypotheses for this study are stated as follows.
H1: Publicly Traded Non-US firms that are a part of developed countries actively deleverage
from their peak ML ratios
HNull: Publicly traded Non – US firms do not actively deleverage from their peak ML ratios.
HAlt: Publicly traded Non – US firms actively deleverage from their peak ML ratios.
H2: There are key differences in the capital structure decisions of companies in developed
countries and that of those in emerging market countries
HNull: There is no difference between developed countries and emerging market countries
for firms’ proactive deleveraging from their peak ML ratios.
HAlt: There is a difference between developed countries and emerging market countries for
firms’ proactive deleveraging from their peak ML ratios.
IV. Data & Methodology
In order to the test the above hypothesis, this study will use the following metrics.
Table 1: Total debt is the sum of all long term and short-term debt. The market value of equity (market
capitalization) is the equity value of a firm or the share price times the shares outstanding. Total assets
are the sum of all assets owned by the firm. Cash represents cash on hand at the given year. Marketable
(equity) securities are to be sold within a year.

Corporate Deleveraging and Financial Flexibility
13
a. Sample Construction
The entire sample from Thomas Reuters Worldscope had 768,367 firm-year observations.
A firm-year observation is a data point for a given year of a firm. The countries selected for either
the developed or emerging market samples are derived from the “FTSE Classification of Equity
Markets as of September 2018.” A firm will have as many firm-year observations as it has years
of data available on Worldscope. The first step is to identify all publicly traded firms for the
countries that are in each group. At that point, there is a need to take out firms that have no debt
or less than one year of data available. Many of those firms with only one year of data are ordinarily
the companies highly levered for mergers or acquisitions and possibly taken private or unlisted.
Firms that were in the industries of either utilities or financials were removed. Next, if there were
any missing data points or zeroes for debt, assets or ISIC code, they were removed from the sample.
Finally, only firms with at least 5 years of post-peak ML data available were kept in the sample.
Developed Emerging
Line Item F-Y Obs. # Firms F-Y Obs. # Firms
Total Number of Firms 350677 47702 180047 18137
- Utilities 5883 800 5450 549
- Financials 64162 8728 27289 2749
After Utilities and Financials Removed 280632 38174 147308 14839
- Missing or 0 Data for Debt 143209 19480 73527 7407
- Missing Firm Industry ID 74856 10183 38433 3872
After Firms with No Debt or Industry ID 62567 8511 35347 3561
- Firms with < 6 Years of Total Data Available 53407 7265 28438 2865
Firms with >= 6 Years of Total Data Available 9160 1246 6909 696
- Missing or 0 Value for Assets 1228 167 1340 135
- Firms without 5 years Post Peak Data 4815 655 2303 232
Final Sample of Firms 3117 424 3266 329
Corporate Deleveraging and Financial Flexibility
14
b. Methodology
This paper will consider two primary points. First, do the sample of Non – US developed
country firms actively engage in deleveraging from their peak ML ratios while also increasing
their cash balances for financial flexibility purposes? Second, do firms in emerging market
countries have different capital structure propensities and do they differ from developed country
firms in terms of deleveraging from peak ML and cash accretion policies?
The sample construction above shows how final sample was constructed. Financial and
utility companies were removed due to their abnormal balance sheets. Data that was either null or
zero for debt was removed because it would throw off the finished results for all of the ratios
mentioned in the data section. If a firm was missing an ID, it was removed due to the chance that
it was either a financial or a utility firm and that it would be unable to be categorized in the
frequency diagrams. If a firm-year observation had a null or zero value for assets, it was removed
from the sample altogether, due to the fact that a missing number for assets would make for an
untrue value for equity, therefore throwing off the ratios mentioned in the data section. Ultimately,
data is just needed for firms with over 5 years of post-peak data available. This is because it shows
us firms that are unsuspected of being under a takeover or merger situation, and gives us a few
years of sample size to have a great confidence in the final results.
Some other alternatives could have been used instead of the above. For one, there could be
a considerably larger sample size by removing the restraints on the number of years of post-peak
data. This would have delivered a larger sample, but it would have led to less valid or indicative
results. On the same note, keeping financial and utility companies could work to give a larger
sample size, but as stated before it would deliver an impact on the ultimate results. Other possible

Corporate Deleveraging and Financial Flexibility
15
alternatives could involve using different countries, for instance using other resources than “FTSE”
to originate a sample for developed and emerging that is different from the one used in this study.
That could have a change on the results. Lastly, one may choose different filters that they find
more or less appropriate to either keep, remove, or add in from this study.
This study focuses on the time-series impact of cumulative earnings retention on ML ratios
as opposed to the cross-sectional relation between leverage and current earnings, which many
earlier studies analyze. The longitudinal approach conducts robustness checks of the key findings
when firms deleverage after their ML ratios increase markedly. In the robustness checks, the study
examines deleveraging from leverage peaks measured in book-value terms and after book leverage
increases markedly.
Corporate Deleveraging and Financial Flexibility
16
V. Developed Country Analysis and Results
a. Frequency Distribution of Developed Country Sample
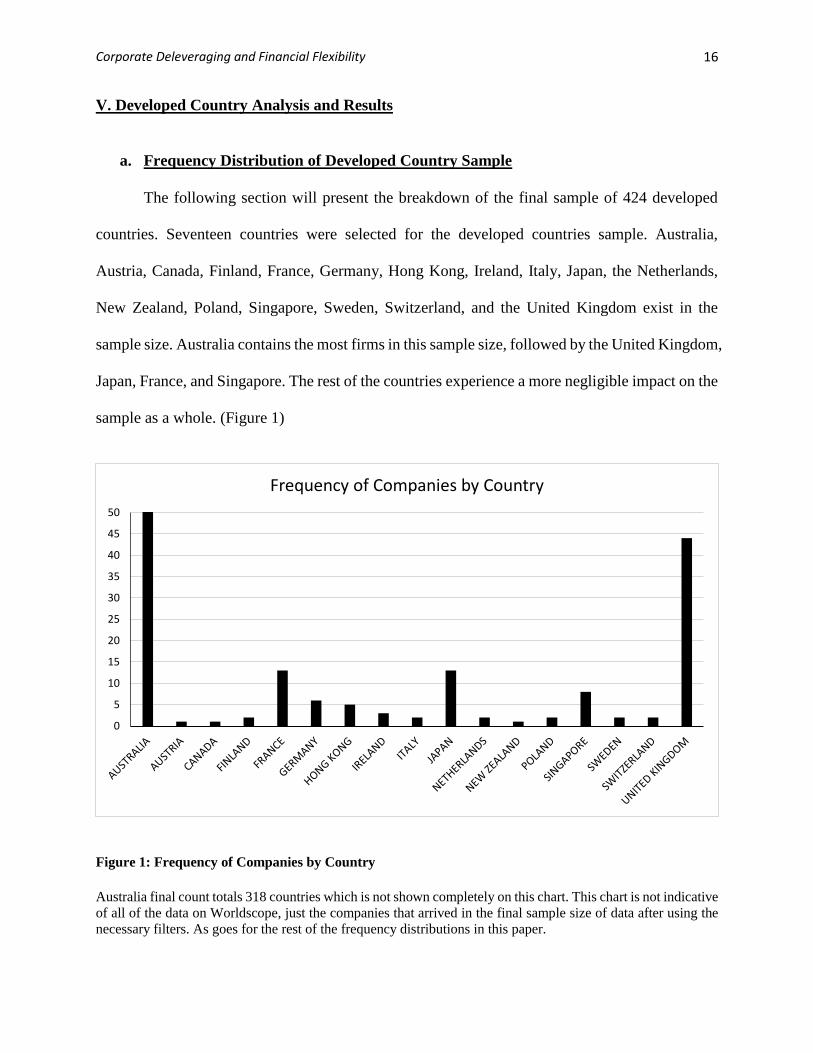
The following section will present the breakdown of the final sample of 424 developed
countries. Seventeen countries were selected for the developed countries sample. Australia,
Austria, Canada, Finland, France, Germany, Hong Kong, Ireland, Italy, Japan, the Netherlands,
New Zealand, Poland, Singapore, Sweden, Switzerland, and the United Kingdom exist in the
sample size. Australia contains the most firms in this sample size, followed by the United Kingdom,
Japan, France, and Singapore. The rest of the countries experience a more negligible impact on the
sample as a whole. (Figure 1)
Figure 1: Frequency of Companies by Country
Australia final count totals 318 countries which is not shown completely on this chart. This chart is not indicative
of all of the data on Worldscope, just the companies that arrived in the final sample size of data after using the
necessary filters. As goes for the rest of the frequency distributions in this paper.
0
5
10
15
20
25
30
35
40
45
50
Frequency of Companies by Country
Corporate Deleveraging and Financial Flexibility
17
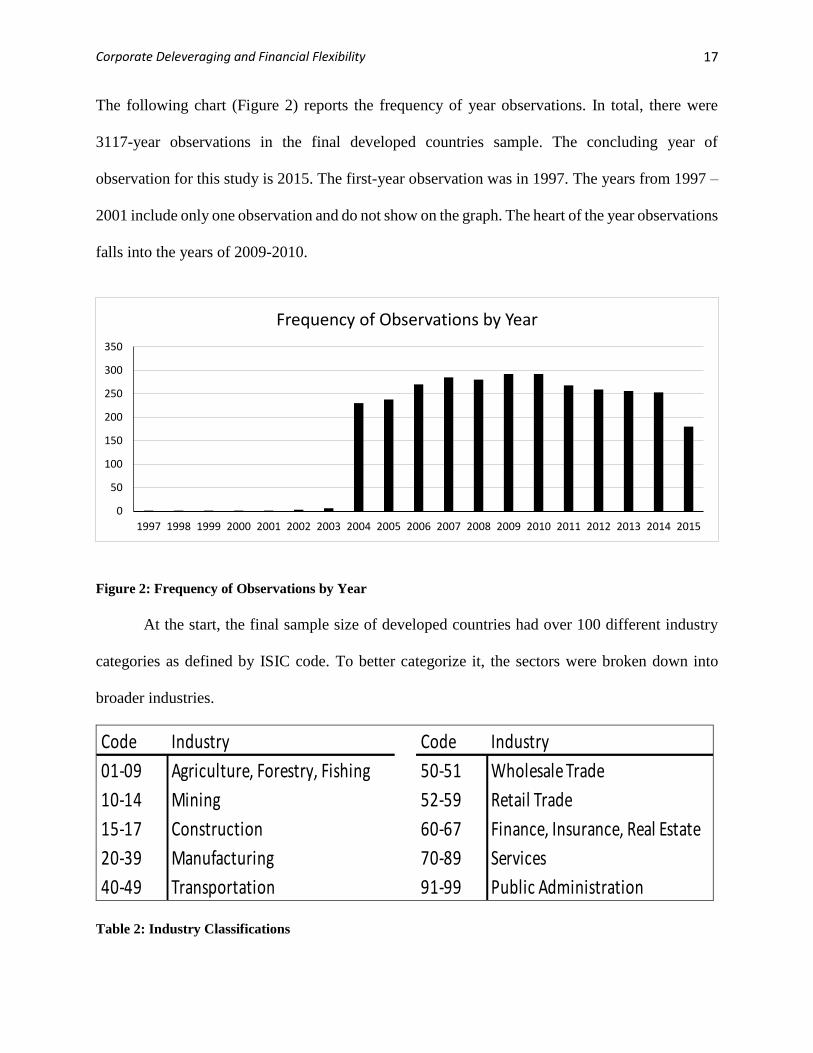
The following chart (Figure 2) reports the frequency of year observations. In total, there were
3117-year observations in the final developed countries sample. The concluding year of
observation for this study is 2015. The first-year observation was in 1997. The years from 1997 –
2001 include only one observation and do not show on the graph. The heart of the year observations
falls into the years of 2009-2010.
Figure 2: Frequency of Observations by Year
At the start, the final sample size of developed countries had over 100 different industry
categories as defined by ISIC code. To better categorize it, the sectors were broken down into
broader industries.
Code Industry Code Industry
01-09 Agriculture,Forestry,Fishing 50-51 WholesaleTrade
10-14 Mining 52-59 RetailTrade
15-17 Construction 60-67 Finance,Insurance,RealEstate
20-39 Manufacturing 70-89 Services
40-49 Transportation 91-99 PublicAdministration
Table 2: Industry Classifications
0
50
100
150
200
250
300
350
1997 1998 1999 2000 2001 2002 2003 2004 2005 2006 2007 2008 2009 2010 2011 2012 2013 2014 2015
Frequency of Observations by Year
18
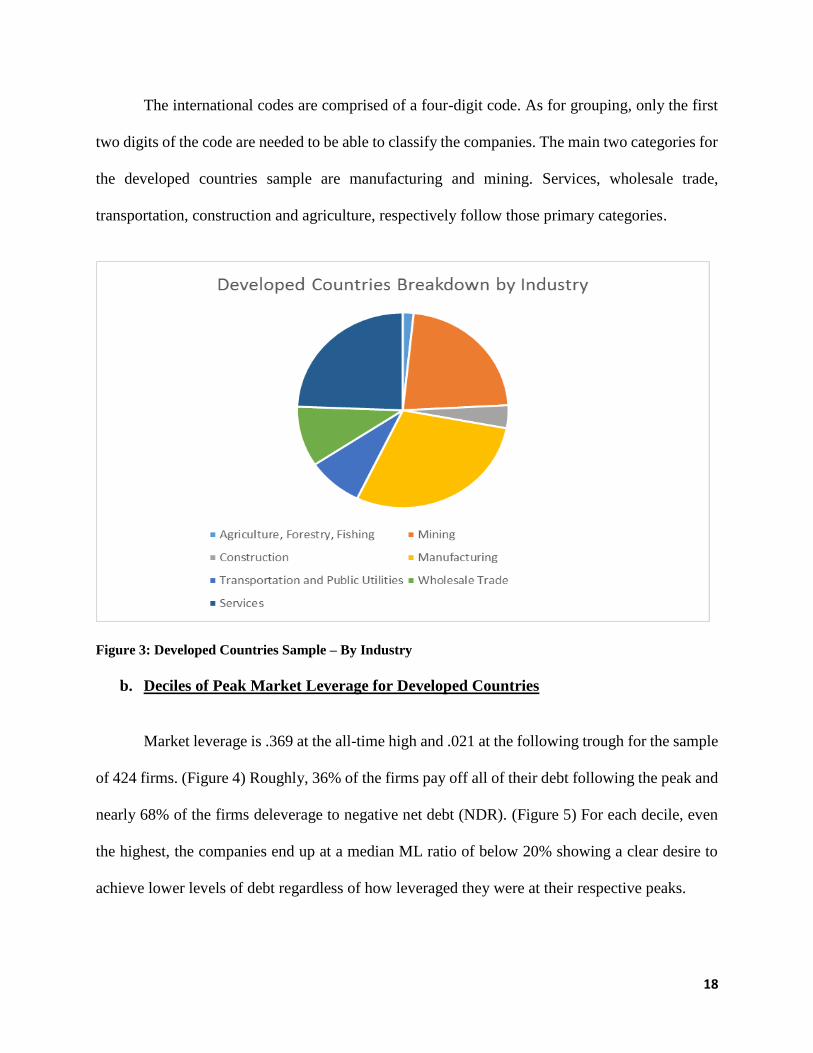
The international codes are comprised of a four-digit code. As for grouping, only the first
two digits of the code are needed to be able to classify the companies. The main two categories for
the developed countries sample are manufacturing and mining. Services, wholesale trade,
transportation, construction and agriculture, respectively follow those primary categories.
Figure 3: Developed Countries Sample – By Industry
b. Deciles of Peak Market Leverage for Developed Countries
Market leverage is .369 at the all-time high and .021 at the following trough for the sample
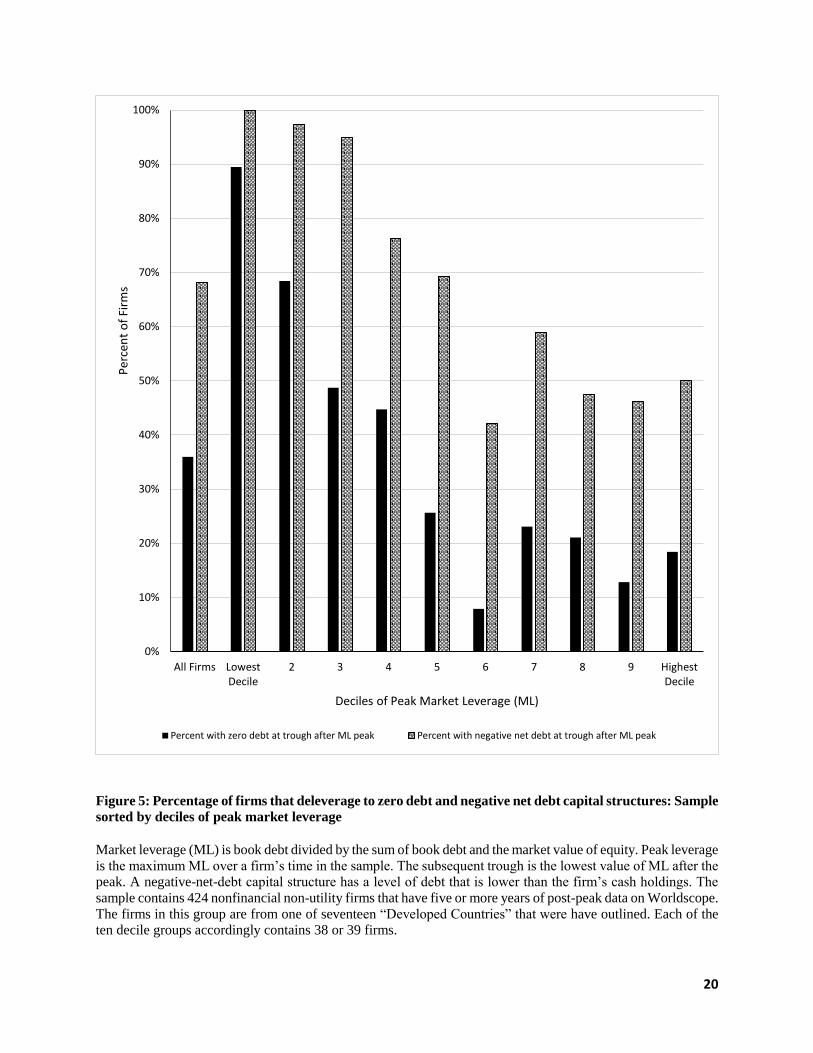
of 424 firms. (Figure 4) Roughly, 36% of the firms pay off all of their debt following the peak and
nearly 68% of the firms deleverage to negative net debt (NDR). (Figure 5) For each decile, even
the highest, the companies end up at a median ML ratio of below 20% showing a clear desire to
achieve lower levels of debt regardless of how leveraged they were at their respective peaks.

19
Figure 4: Levels of deleveraging from peak market leverage (ML) to following trough: Sorted by deciles
of peak ML
Market leverage (ML) is debt divided by the total of book debt and equity. Peak leverage is the top ML over a
company’s time in the sample. The following trough is the lowest value of ML after the peak. The sample
contains 424 nonfinancial firms that have more than 5 years of post-peak data on Worldscope. The firms in this
group are from one of seventeen “Developed Countries” that were outlined. Each of the ten decile groups contain
38 or 39 firms. For deciles 1 and 2, the median firm has zero debt at the post-peak trough, and so the figure only
shows a positive value for the median ML at the trough after peak for deciles 3 to 10.
0
0.1
0.2
0.3
0.4
0.5
0.6
0.7
0.8
0.9
All Firms LowestDecile
2 3 4 5 6 7 8 9 HighestDecile
Med
ian
ML
Rat
io
Deciles of Peak Market Leverage (ML)
Median ML at Peak Median ML at Later trough
20
Figure 5: Percentage of firms that deleverage to zero debt and negative net debt capital structures: Sample
sorted by deciles of peak market leverage
Market leverage (ML) is book debt divided by the sum of book debt and the market value of equity. Peak leverage
is the maximum ML over a firm’s time in the sample. The subsequent trough is the lowest value of ML after the
peak. A negative-net-debt capital structure has a level of debt that is lower than the firm’s cash holdings. The
sample contains 424 nonfinancial non-utility firms that have five or more years of post-peak data on Worldscope.
The firms in this group are from one of seventeen “Developed Countries” that were have outlined. Each of the ten decile groups accordingly contains 38 or 39 firms.
0%
10%
20%
30%
40%
50%
60%
70%
80%
90%
100%
All Firms LowestDecile
2 3 4 5 6 7 8 9 HighestDecile
Per
cen
t o
f Fi
rms
Deciles of Peak Market Leverage (ML)
Percent with zero debt at trough after ML peak Percent with negative net debt at trough after ML peak

21
c. Annual Deleveraging Tendencies
Market Leverage Book Leverage Net Debt / TA
Beginning-of-year
ratio
Probability
of Annual
Decrease
Median
Annual
Change
Probability
of Annual
Decrease
Median
Annual
Change
Probability
of Annual
Decrease
Median
Annual
Change
.5 < Leverage 71.20% -0.139 71.69% -0.222 64.96% -0.212
.4 < Leverage <= .5 68.42% -0.110 69.46% -0.082 70.18% -0.106
.3 < Leverage <= .4 63.33% -0.072 64.35% -0.072 60.56% -0.080
.2 < Leverage <= .3 56.81% -0.051 61.39% -0.089 56.68% -0.048
.1 < Leverage <= .2 52.33% -0.044 56.06% -0.060 45.60% 0.050
.0 < Leverage <= .1 56.14% -0.062 54.83% -0.065 26.13% 0.591
All Leverage >= 0 59.92% -0.074 59.30% -0.080 - -
All Net Debt/TA
>=0 - - - - 47.01% 0.144
All Net Debt/TA <0 - - - - 38.98% 0.197
Figure 6: Deleveraging propensities: Annual changes in leverage as a function of the beginning-of-year
level of leverage
Market leverage (ML) is the ratio of the book value of debt to the sum of the book value of debt and the market
value of equity. Book leverage (BL or Debt/TA) is the ratio of the book value of total (short-term plus long-term)
debt to the book value of total assets. The net-debt ratio (NDR or Net Debt/TA) equals debt minus cash, divided
by total assets. The full sample contains 424 nonfinancial firms with a total 3117 firm-year observations in the
Worldscope file over 1997-2015.
Figure six above reports annual leverage changes of all of the firms in the developed
countries sample. The most significant thing to note about this figure is that when leverage is high
in one year it tends to decrease in the subsequent year, which is seen in the median annual change.
The probability of annual decrease was calculated by taking the year observation, categorizing it
by the beginning of year ML ratio, and noting the direction of the leverage of the firm from that
year to the next. Specifically, when either market or book leverage ratios exceed 50% leverage at
the beginning of any given year, there is a 65% to 71% chance of an annual decrease in leverage
with a mean annual median change of about --19%. This pattern follows suit as all of the median
ML ratios above zero, which is 100% of the sample size, have a negative median annual change.
22
Market Leverage Book Leverage Net Debt / TA
% of Sample
Firm Yr. Obs.
% of Sample
Firm Yr. Obs.
% of Sample
Firm Yr. Obs.
.5 < Leverage 14.2% 382 6.2% 166 5.1% 137
.4 < Leverage <= .5 9.2% 247 6.2% 167 4.2% 114
.3 < Leverage <= .4 13.4% 360 12.3% 331 9.3% 251
.2 < Leverage <= .3 14.5% 389 17.6% 474 13.9% 374
.1 < Leverage <= .2 14.3% 386 18.1% 487 16.5% 443
.0 < Leverage <= .1 34.5% 928 39.7% 1067 20.5% 551
All Leverage >= 0 100% 2692 100% 2692 69.5% 1870
All Leverage < 0 - - - - 30.5% 821
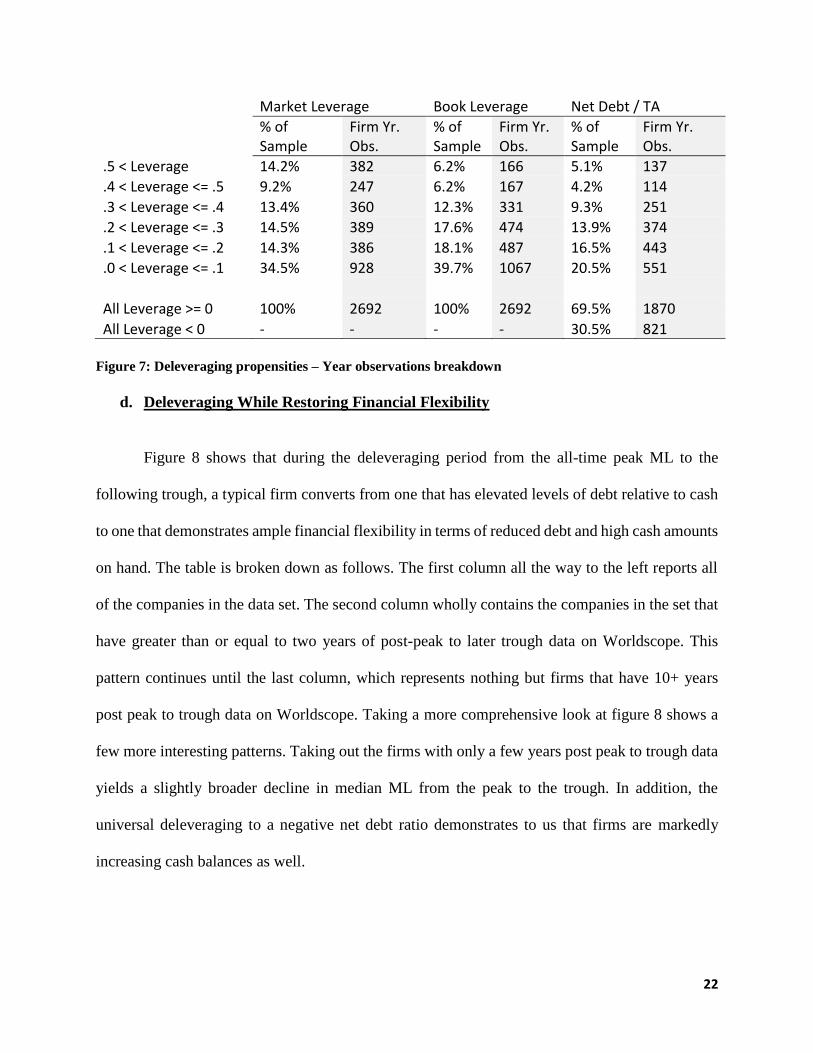
Figure 7: Deleveraging propensities – Year observations breakdown
d. Deleveraging While Restoring Financial Flexibility
Figure 8 shows that during the deleveraging period from the all-time peak ML to the
following trough, a typical firm converts from one that has elevated levels of debt relative to cash
to one that demonstrates ample financial flexibility in terms of reduced debt and high cash amounts
on hand. The table is broken down as follows. The first column all the way to the left reports all
of the companies in the data set. The second column wholly contains the companies in the set that
have greater than or equal to two years of post-peak to later trough data on Worldscope. This
pattern continues until the last column, which represents nothing but firms that have 10+ years
post peak to trough data on Worldscope. Taking a more comprehensive look at figure 8 shows a
few more interesting patterns. Taking out the firms with only a few years post peak to trough data
yields a slightly broader decline in median ML from the peak to the trough. In addition, the
universal deleveraging to a negative net debt ratio demonstrates to us that firms are markedly
increasing cash balances as well.

23
Fig
ure
8:
Del
ever
agin
g e
pis
od
es:
Mark
et l
ever
age
(ML
) an
d r
elate
d f
inan
cial
rati
os
at
the
ML
pea
k a
nd
su
bse
qu
ent
ML
tro
ugh
, w
ith
th
e
base
lin
e sa
mp
le p
art
itio
ned
by t
he
min
imu
m n
um
ber
of
yea
rs o
f p
ost
-pea
k d
ata
avail
ab
le o
n W
orl
dsc
op
e
Mar
ket
lev
erag
e (M
L)
is t
he
rati
o o
f th
e book v
alue
of
deb
t to
the
sum
of
the
book v
alue
of
deb
t an
d t
he
mar
ket
val
ue
of
equ
ity
. P
eak
lev
erag
e is
th
e
max
imum
val
ue
of
ML
over
a f
irm
’s e
nti
re t
ime
in t
he
sam
ple
. T
he
trough a
fter
pea
k i
s th
e lo
wes
t val
ue
of
a fi
rm’s
ML
th
at c
om
es s
ub
sequ
ent
to i
ts
pea
k. W
hen
a f
irm
has
mult
iple
post
-pea
k y
ears
wit
h t
he
sam
e m
inim
um
val
ue
of
ML
, T
he
earl
iest
such
yea
r to
be
the
dat
e o
f th
e po
st-p
eak
tro
ug
h i
s
taken
. B
ook l
ever
age
(BL
) is
the
rati
o o
f th
e book v
alue
of
deb
t to
the
book v
alue
of
tota
l as
sets
. N
et D
ebt/
TA
is
the
bo
ok
val
ue
of
deb
t m
inu
s th
e su
m
of
cash
and m
arket
able
sec
uri
ties
, div
ided
by t
ota
l as
sets
.

24
Figure 8 Figure 9
Figure 10 Figure 11
Figure 8: Median ML ratio at peak and trough grouped by minimum number of years post peak data
Figure 9: Median ML ratio at peak and trough grouped by exact number of years post peak data
Figure 10: Median Cash/TA ratio at peak and trough grouped by minimum number of years post peak
data
Figure 11: Median Cash / TA ratio at peak and trough grouped by exact number of years post peak data

25
Figure 12 Figure 13
Figure 14 Figure 15
Figure 12: Median NDR ratio at peak and trough grouped by minimum number of years post peak data
Figure 13: Median NDR ratio at peak and trough grouped by exact number of years post peak data
Figure 14: Median BL ratio at peak and trough grouped by minimum number of years post peak data
Figure 15: Median BL ratio at peak and trough grouped by exact number of years post peak data
26
VI. Emerging Market Analysis and Results
a. Debt Markets in Emerging Markets
The corporate debt of nonfinancial firms across major emerging market economies
quadrupled between 2004 and 2014. Simultaneously, the structure of that corporate debt has
been flowing away from loans and toward bonds. Although more considerable leverage can be
used for investment, thus boosting growth, the rising trend in recent years certainly raises alarms
because many financial crises in emerging markets have been headed by quick leverage growth.
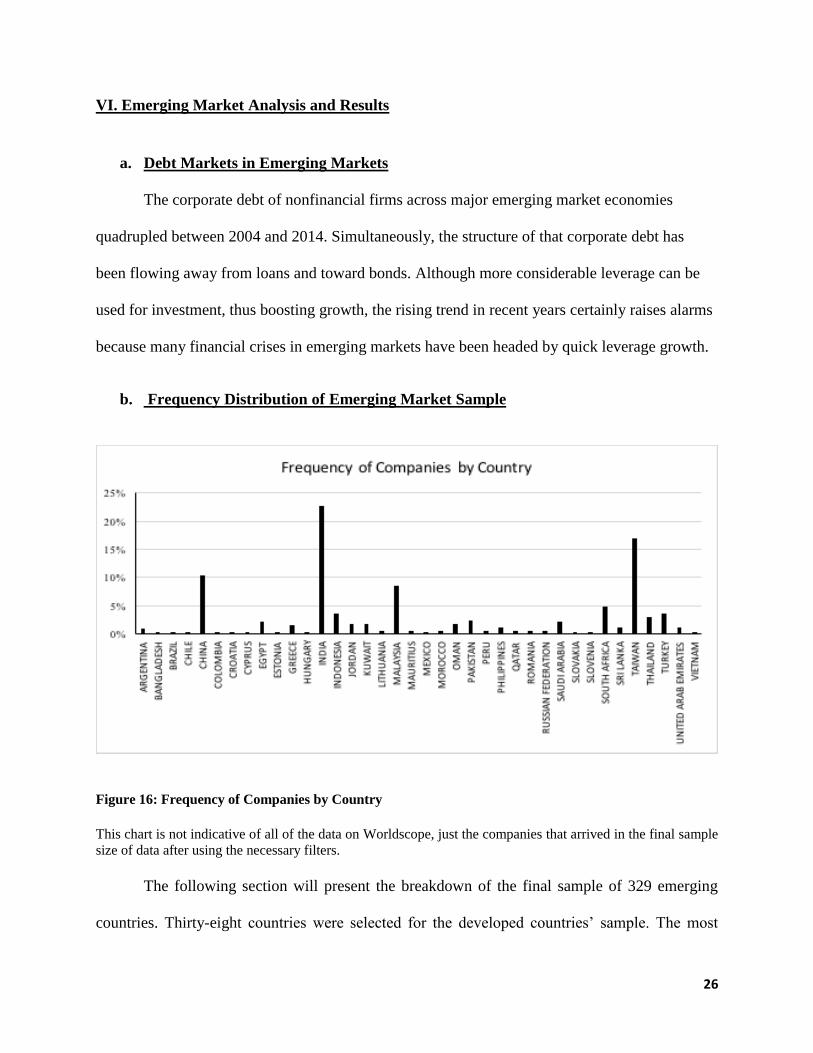
b. Frequency Distribution of Emerging Market Sample
Figure 16: Frequency of Companies by Country
This chart is not indicative of all of the data on Worldscope, just the companies that arrived in the final sample
size of data after using the necessary filters.
The following section will present the breakdown of the final sample of 329 emerging
countries. Thirty-eight countries were selected for the developed countries’ sample. The most

27
prevalent countries in this sample are India, Taiwan, China, Malaysia, and South Africa,
respectively. The other 33 countries have a smaller impact on the sample as a whole. (Figure 16)
The following chart (Figure 17) reports the frequency of year observations. In total, there were
3266-year observations in the final developed countries sample. The concluding year of
observation for this study is 2015. The first-year observation was in 1991. The years from 1991 –
2001 have only a few observations and slightly show on the graph. The heart of the year
observations falls into the years of 2008-2009.
Figure 17: Frequency of Observations by Year
Initially, the final sample size of developed countries had over 100 different industry
categories as defined by ISIC code. In order to better categorize it, the sectors were broken down
into more general industries. It is the same categorization used as the developed countries earlier
in the paper. The principal difference between the developed and the emerging is that
0%
2%
4%
6%
8%
10%
12%
1991 1994 1997 2000 2003 2006 2009 2012 2015
Frequency of Observations by Year

28
manufacturing takes up a considerably more significant percentage of the companies in the sample
size.
Code Industry Code Industry
01-09 Agriculture,Forestry,Fishing 50-51 WholesaleTrade
10-14 Mining 52-59 RetailTrade
15-17 Construction 60-67 Finance,Insurance,RealEstate
20-39 Manufacturing 70-89 Services
40-49 Transportation 91-99 PublicAdministration
Table 3: Industry Classifications
Figure 18: Emerging Countries Sample – By Industry

29
c. Deciles of Peak Market Leverage for Emerging Countries
Market leverage is .468 at the all-time high and .103 at the following trough for the sample
of 329 firms. (Figure 19) Roughly 12% of the firms pay off all of their debt following the peak
and nearly 35% of the firms deleverage to negative net debt (NDR). (Figure 20). There are some
significant differences between the peak and trough ML ratios of the developed countries and the
emerging market countries. For the entire sample, there is a 10% higher ML ratio at the peak and
a 5% higher ML ratio at the trough when comparing it to the developed country sample. Another
observation is that even though there is a higher median ML ratio for the emerging market data
set, there is a great peak to trough decline in ML ratio, which shows that there is still a clear
propensity for companies to deleverage to restore financial flexibility.
Figure 19: Scale of deleveraging from peak market leverage (ML) to subsequent trough: Sample sorted
by deciles of peak ML
Market leverage (ML) is book debt divided by the sum of book debt and the market value of equity. Peak leverage
is the maximum ML over a firm’s time in the sample. The subsequent trough is the lowest value of ML after the
peak. The sample contains 329 nonfinancial firms that have five or more years of post-peak data on Worldscope.
Each of the ten decile groups accordingly contains 32 or 31 firms.
0
0.1
0.2
0.3
0.4
0.5
0.6
0.7
0.8
All Firms LowestDecile
2 3 4 5 6 7 8 9 HighestDecile
Med
ian
ML
Rat
io
Deciles of Peak Market Leverage (ML)
Median ML at Peak Median ML at Later trough

30
Figure 20: Percentage of firms that deleverage to zero debt and negative net debt capital structures:
Sample sorted by deciles of peak ML
Market leverage (ML) is book debt divided by the sum of book debt and the market value of equity. Peak leverage
is the maximum ML over a firm’s time in the sample. The subsequent trough is the lowest value of ML after the
peak. A negative-net-debt capital structure has a level of debt that is lower than the firm’s cash holdings. The
sample contains 329 nonfinancial non-utility firms that have five or more years of post-peak data on Worldscope.
Each of the ten decile groups accordingly contains 32 or 31 firms.
0%
10%
20%
30%
40%
50%
60%
70%
80%
90%
All Firms LowestDecile
2 3 4 5 6 7 8 9 HighestDecile
Percent with zero debt at trough after ML peak Percent with negative net debt at trough after ML peak
31
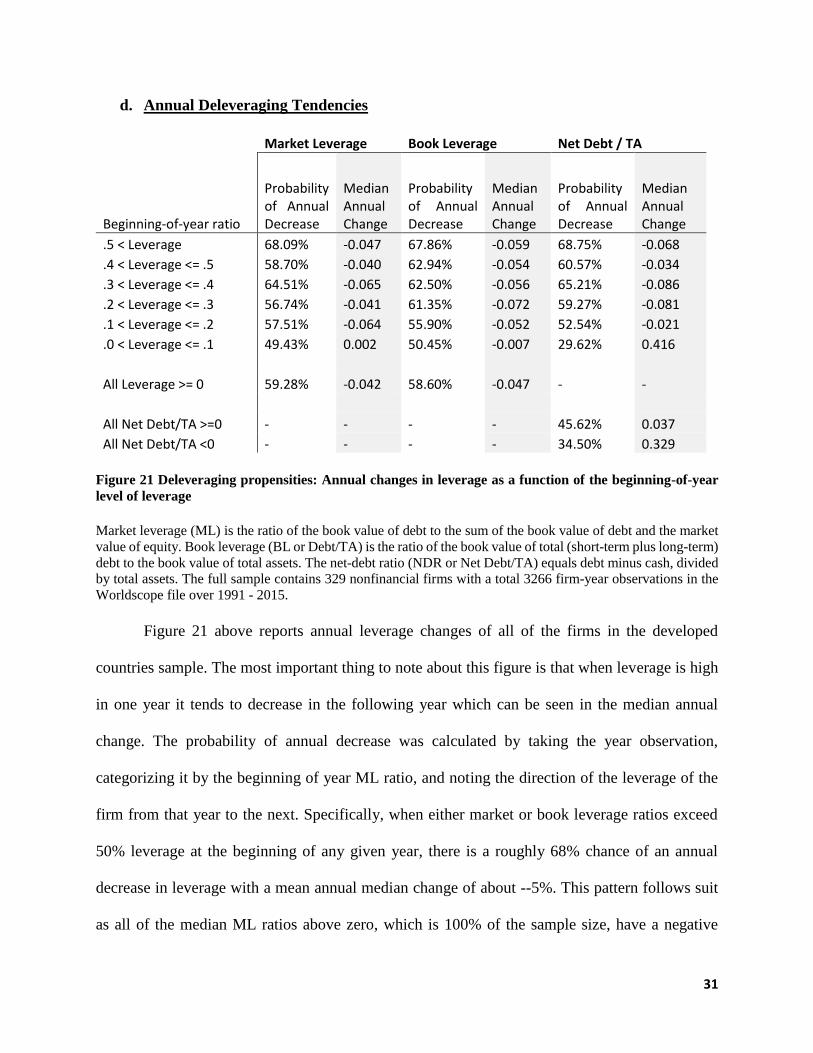
d. Annual Deleveraging Tendencies
Market Leverage Book Leverage Net Debt / TA
Beginning-of-year ratio
Probability of Annual Decrease
Median Annual Change
Probability of Annual Decrease
Median Annual Change
Probability of Annual Decrease
Median Annual Change
.5 < Leverage 68.09% -0.047 67.86% -0.059 68.75% -0.068
.4 < Leverage <= .5 58.70% -0.040 62.94% -0.054 60.57% -0.034
.3 < Leverage <= .4 64.51% -0.065 62.50% -0.056 65.21% -0.086
.2 < Leverage <= .3 56.74% -0.041 61.35% -0.072 59.27% -0.081
.1 < Leverage <= .2 57.51% -0.064 55.90% -0.052 52.54% -0.021
.0 < Leverage <= .1 49.43% 0.002 50.45% -0.007 29.62% 0.416
All Leverage >= 0 59.28% -0.042 58.60% -0.047 - -
All Net Debt/TA >=0 - - - - 45.62% 0.037
All Net Debt/TA <0 - - - - 34.50% 0.329
Figure 21 Deleveraging propensities: Annual changes in leverage as a function of the beginning-of-year
level of leverage
Market leverage (ML) is the ratio of the book value of debt to the sum of the book value of debt and the market
value of equity. Book leverage (BL or Debt/TA) is the ratio of the book value of total (short-term plus long-term)
debt to the book value of total assets. The net-debt ratio (NDR or Net Debt/TA) equals debt minus cash, divided
by total assets. The full sample contains 329 nonfinancial firms with a total 3266 firm-year observations in the
Worldscope file over 1991 - 2015.
Figure 21 above reports annual leverage changes of all of the firms in the developed
countries sample. The most important thing to note about this figure is that when leverage is high
in one year it tends to decrease in the following year which can be seen in the median annual
change. The probability of annual decrease was calculated by taking the year observation,
categorizing it by the beginning of year ML ratio, and noting the direction of the leverage of the
firm from that year to the next. Specifically, when either market or book leverage ratios exceed
50% leverage at the beginning of any given year, there is a roughly 68% chance of an annual
decrease in leverage with a mean annual median change of about --5%. This pattern follows suit
as all of the median ML ratios above zero, which is 100% of the sample size, have a negative
32
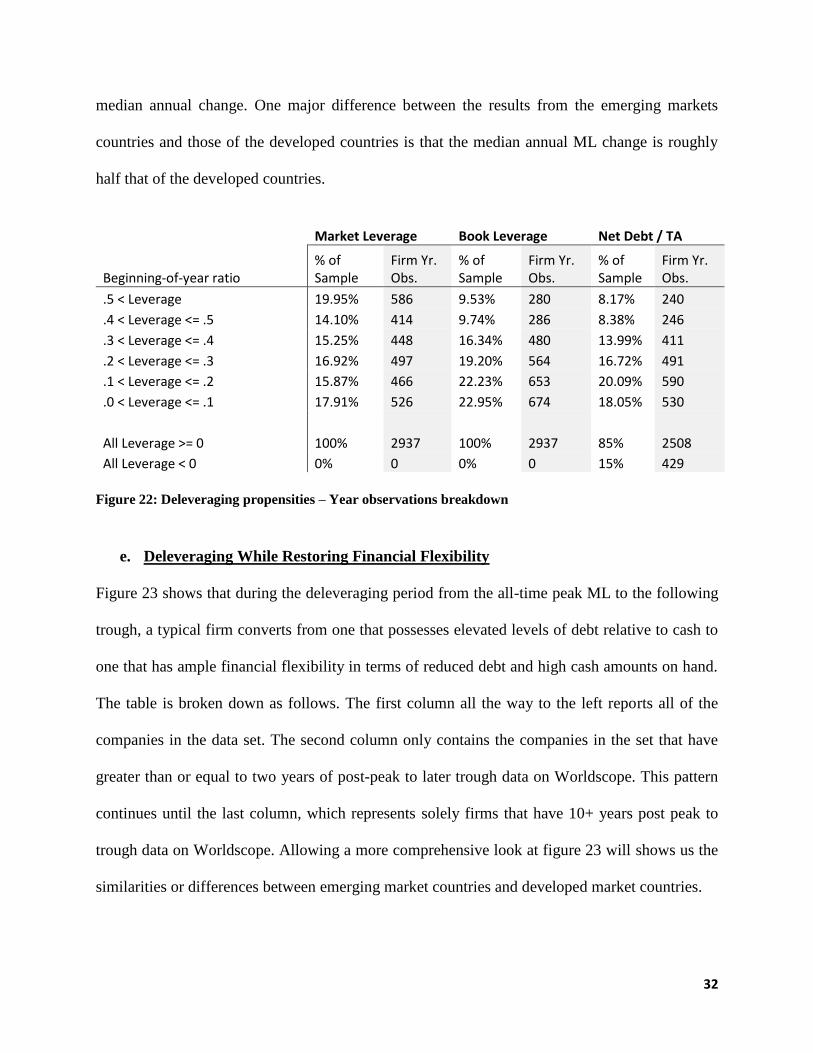
median annual change. One major difference between the results from the emerging markets
countries and those of the developed countries is that the median annual ML change is roughly
half that of the developed countries.
Market Leverage Book Leverage Net Debt / TA
Beginning-of-year ratio % of Sample
Firm Yr. Obs.
% of Sample
Firm Yr. Obs.
% of Sample
Firm Yr. Obs.
.5 < Leverage 19.95% 586 9.53% 280 8.17% 240
.4 < Leverage <= .5 14.10% 414 9.74% 286 8.38% 246
.3 < Leverage <= .4 15.25% 448 16.34% 480 13.99% 411
.2 < Leverage <= .3 16.92% 497 19.20% 564 16.72% 491
.1 < Leverage <= .2 15.87% 466 22.23% 653 20.09% 590
.0 < Leverage <= .1 17.91% 526 22.95% 674 18.05% 530
All Leverage >= 0 100% 2937 100% 2937 85% 2508
All Leverage < 0 0% 0 0% 0 15% 429
Figure 22: Deleveraging propensities – Year observations breakdown
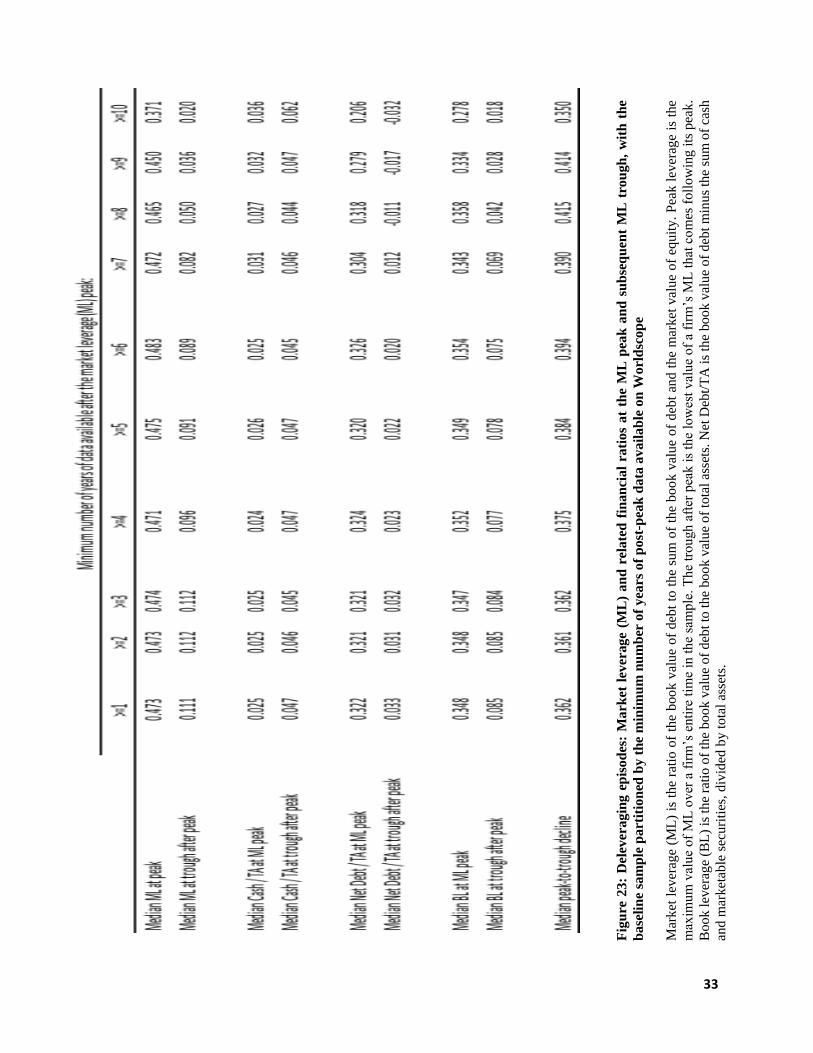
e. Deleveraging While Restoring Financial Flexibility
Figure 23 shows that during the deleveraging period from the all-time peak ML to the following
trough, a typical firm converts from one that possesses elevated levels of debt relative to cash to
one that has ample financial flexibility in terms of reduced debt and high cash amounts on hand.
The table is broken down as follows. The first column all the way to the left reports all of the
companies in the data set. The second column only contains the companies in the set that have
greater than or equal to two years of post-peak to later trough data on Worldscope. This pattern
continues until the last column, which represents solely firms that have 10+ years post peak to
trough data on Worldscope. Allowing a more comprehensive look at figure 23 will shows us the
similarities or differences between emerging market countries and developed market countries.
33
Fig
ure
23
: D
elev
eragin
g e
pis
od
es:
Mark
et l
ever
age
(ML
) an
d r
elate
d f
inan
cial
rati
os
at
the
ML
pea
k a
nd
su
bse
qu
ent
ML
tro
ugh
, w
ith
th
e
base
lin
e sa
mp
le p
art
itio
ned
by t
he
min
imu
m n
um
ber
of
yea
rs o
f p
ost
-pea
k d
ata
avail
ab
le o
n W
orl
dsc
op
e
Mar
ket
lev
erag
e (M
L)
is t
he
rati
o o
f th
e book v
alue
of
deb
t to
the
sum
of
the
book v
alue
of
deb
t an
d t
he
mar
ket
val
ue
of
equ
ity
. P
eak l
ever
age
is t
he
max
imum
val
ue
of
ML
over
a f
irm
’s e
nti
re t
ime
in t
he
sam
ple
. T
he
trough a
fter
pea
k i
s th
e lo
wes
t val
ue
of
a fi
rm’s
ML
that
co
mes
foll
ow
ing i
ts p
eak.
Book l
ever
age
(BL
) is
the
rati
o o
f th
e boo
k v
alue
of
deb
t to
the
book v
alue
of
tota
l as
sets
. N
et D
ebt/
TA
is
the
bo
ok v
alu
e o
f d
ebt
min
us
the
sum
of
cash
and m
arket
able
sec
uri
ties
, div
ided
by t
ota
l as
sets
.
34
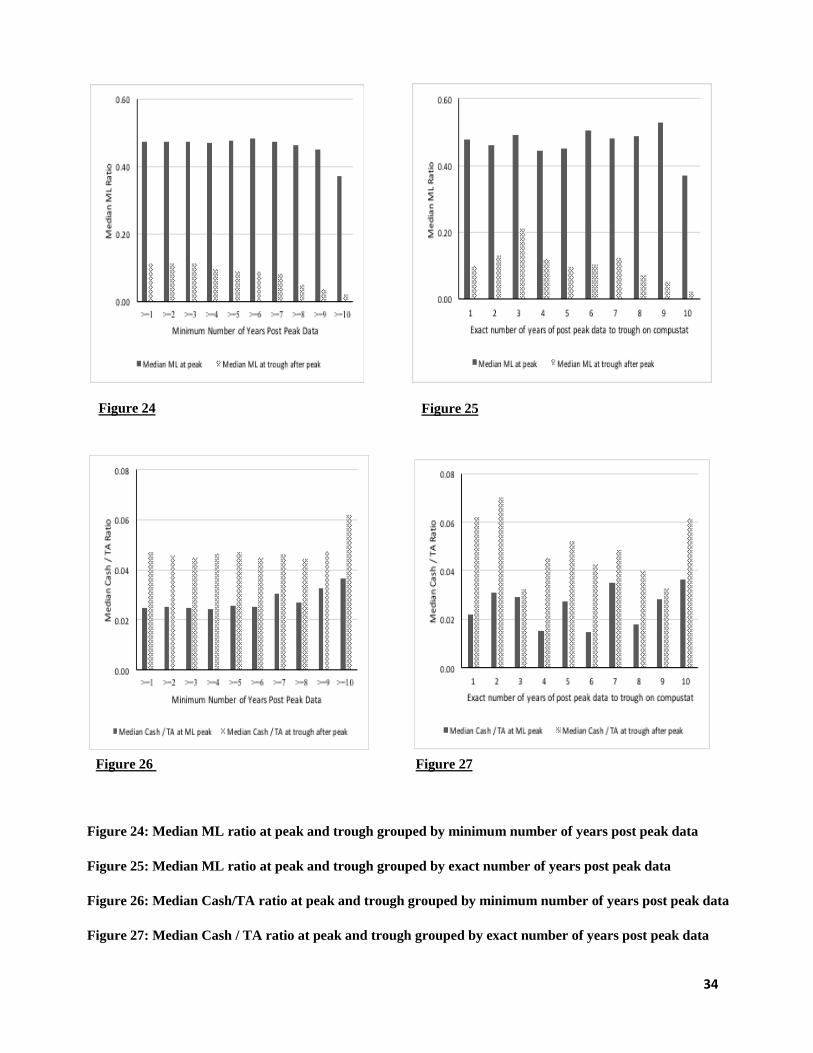
Figure 26 Figure 27
Figure 24 Figure 25
Figure 24: Median ML ratio at peak and trough grouped by minimum number of years post peak data
Figure 25: Median ML ratio at peak and trough grouped by exact number of years post peak data
Figure 26: Median Cash/TA ratio at peak and trough grouped by minimum number of years post peak data
Figure 27: Median Cash / TA ratio at peak and trough grouped by exact number of years post peak data
35
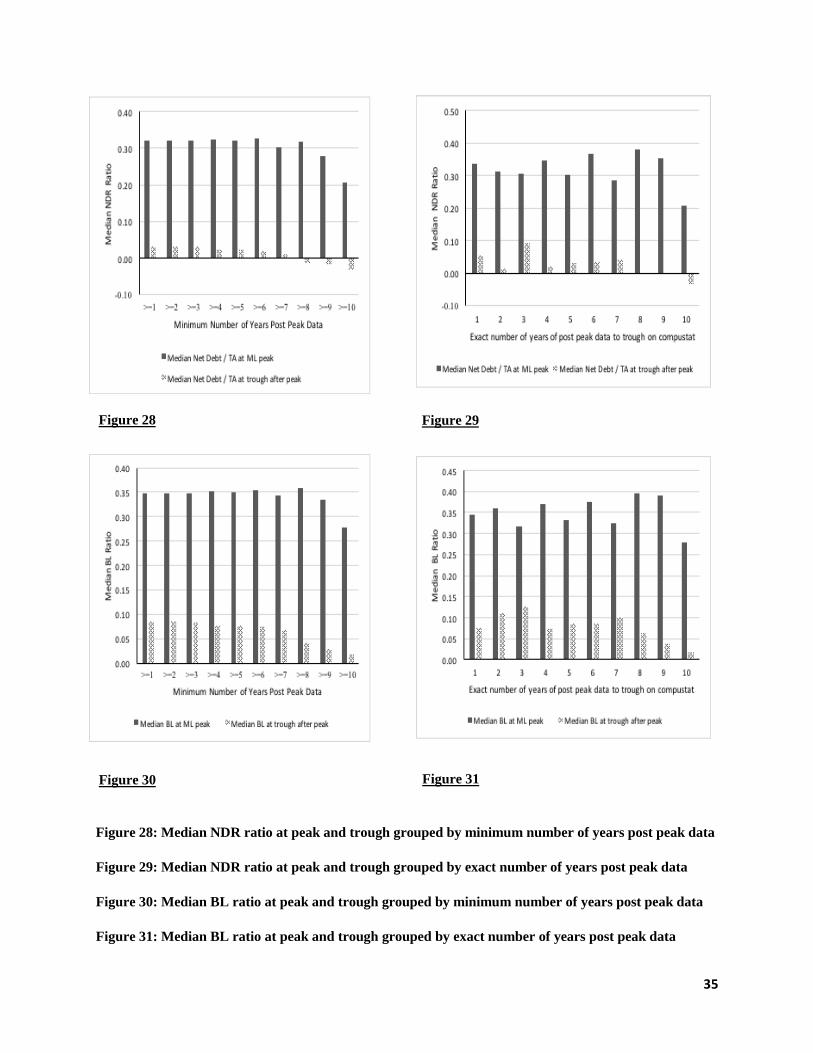
Figure 28: Median NDR ratio at peak and trough grouped by minimum number of years post peak data
Figure 29: Median NDR ratio at peak and trough grouped by exact number of years post peak data
Figure 30: Median BL ratio at peak and trough grouped by minimum number of years post peak data
Figure 31: Median BL ratio at peak and trough grouped by exact number of years post peak data
Figure 30 Figure 31
Figure 28 Figure 29
36
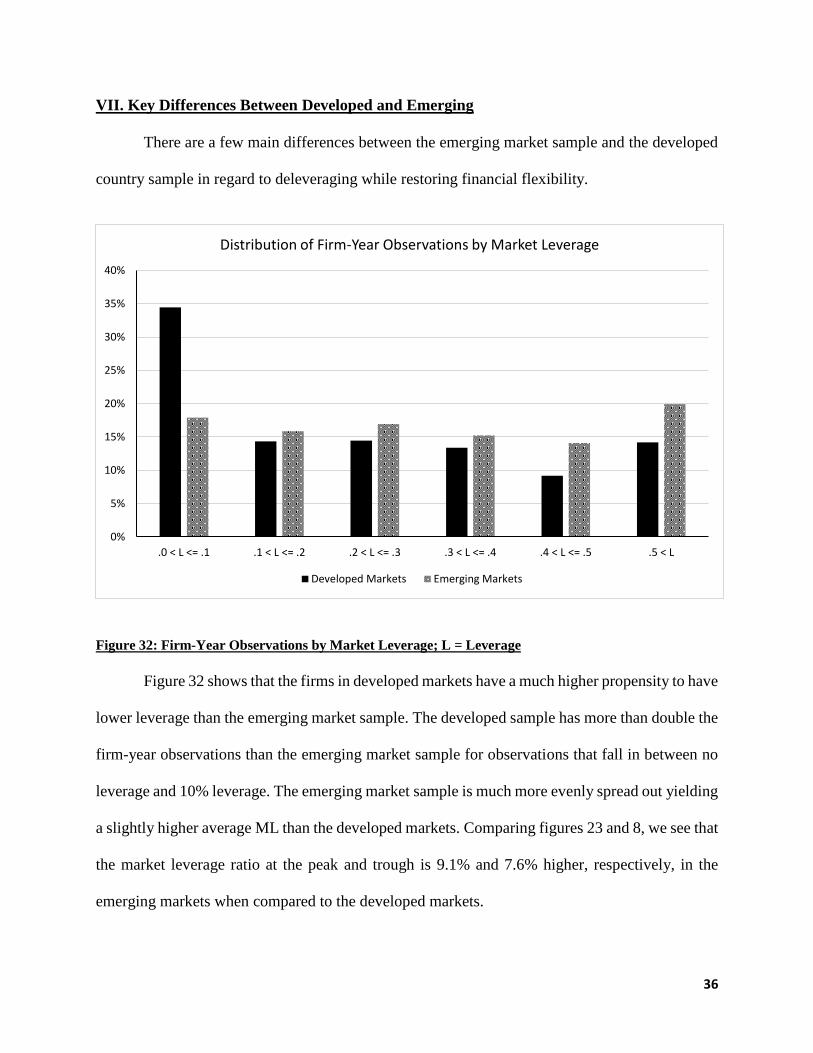
VII. Key Differences Between Developed and Emerging
There are a few main differences between the emerging market sample and the developed
country sample in regard to deleveraging while restoring financial flexibility.
Figure 32: Firm-Year Observations by Market Leverage; L = Leverage
Figure 32 shows that the firms in developed markets have a much higher propensity to have
lower leverage than the emerging market sample. The developed sample has more than double the
firm-year observations than the emerging market sample for observations that fall in between no
leverage and 10% leverage. The emerging market sample is much more evenly spread out yielding
a slightly higher average ML than the developed markets. Comparing figures 23 and 8, we see that
the market leverage ratio at the peak and trough is 9.1% and 7.6% higher, respectively, in the
emerging markets when compared to the developed markets.
0%
5%
10%
15%
20%
25%
30%
35%
40%
.0 < L <= .1 .1 < L <= .2 .2 < L <= .3 .3 < L <= .4 .4 < L <= .5 .5 < L
Distribution of Firm-Year Observations by Market Leverage
Developed Markets Emerging Markets
37
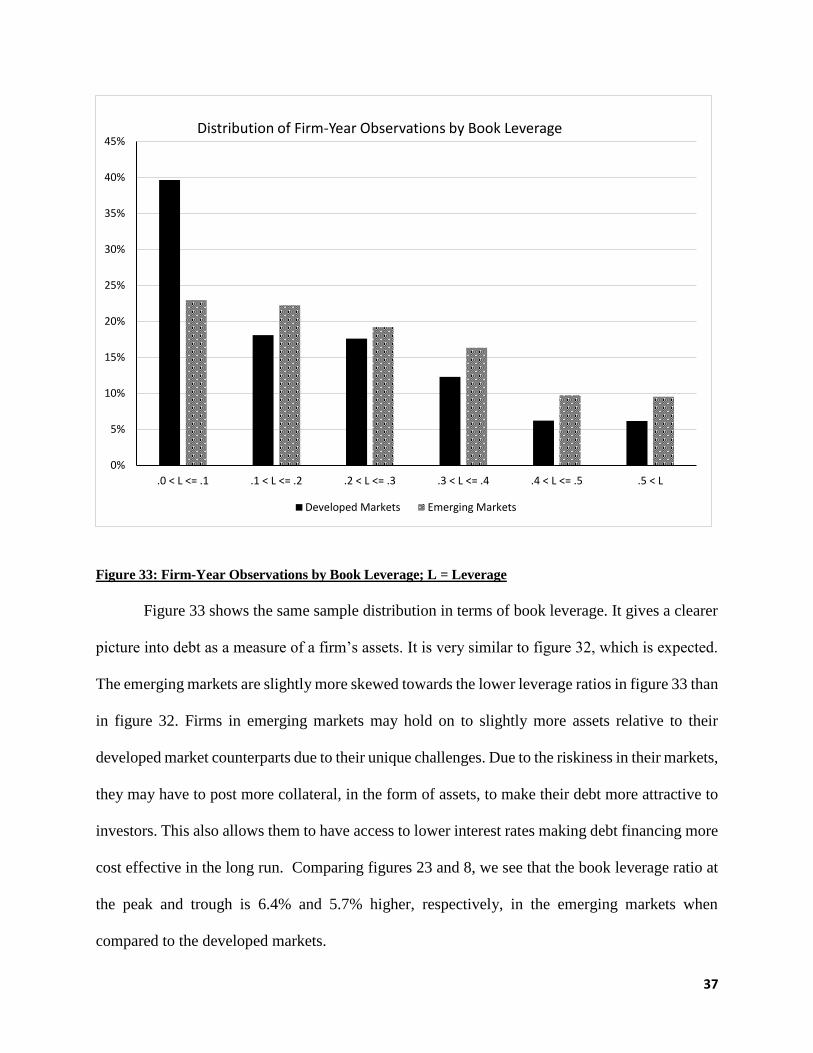
Figure 33: Firm-Year Observations by Book Leverage; L = Leverage
Figure 33 shows the same sample distribution in terms of book leverage. It gives a clearer
picture into debt as a measure of a firm’s assets. It is very similar to figure 32, which is expected.
The emerging markets are slightly more skewed towards the lower leverage ratios in figure 33 than
in figure 32. Firms in emerging markets may hold on to slightly more assets relative to their
developed market counterparts due to their unique challenges. Due to the riskiness in their markets,
they may have to post more collateral, in the form of assets, to make their debt more attractive to
investors. This also allows them to have access to lower interest rates making debt financing more
cost effective in the long run. Comparing figures 23 and 8, we see that the book leverage ratio at
the peak and trough is 6.4% and 5.7% higher, respectively, in the emerging markets when
compared to the developed markets.
0%
5%
10%
15%
20%
25%
30%
35%
40%
45%
.0 < L <= .1 .1 < L <= .2 .2 < L <= .3 .3 < L <= .4 .4 < L <= .5 .5 < L
Distribution of Firm-Year Observations by Book Leverage
Developed Markets Emerging Markets
38
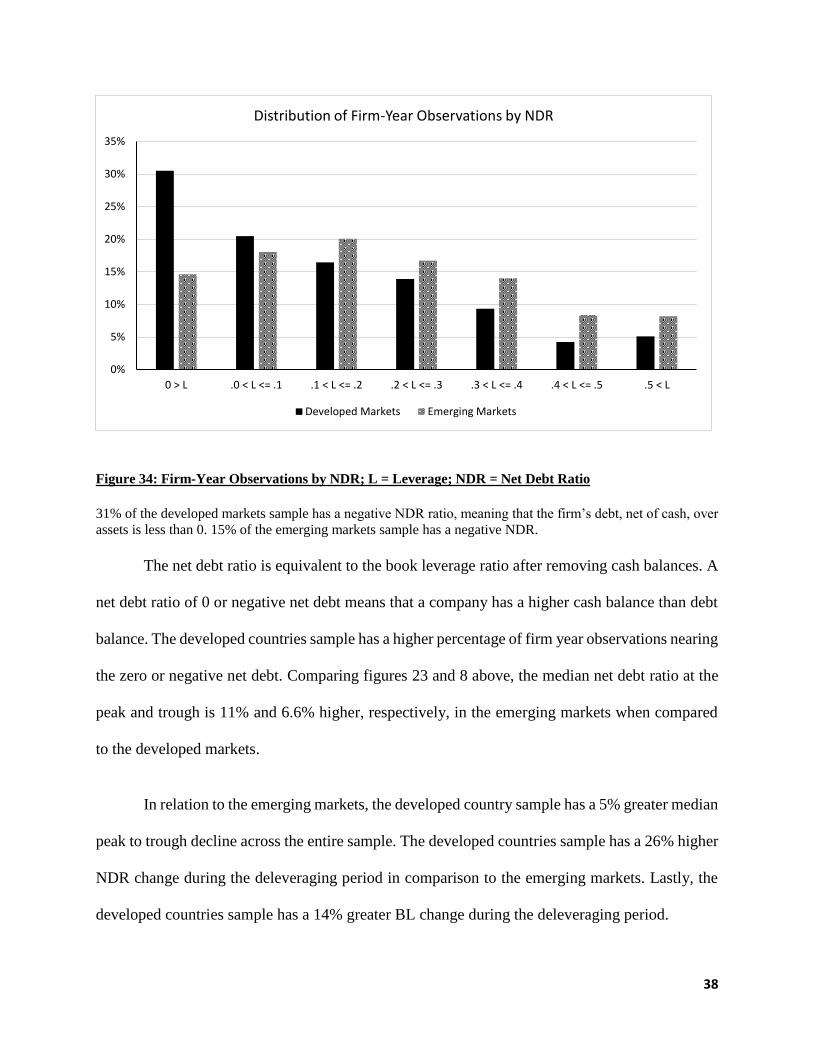
Figure 34: Firm-Year Observations by NDR; L = Leverage; NDR = Net Debt Ratio
31% of the developed markets sample has a negative NDR ratio, meaning that the firm’s debt, net of cash, over
assets is less than 0. 15% of the emerging markets sample has a negative NDR.
The net debt ratio is equivalent to the book leverage ratio after removing cash balances. A
net debt ratio of 0 or negative net debt means that a company has a higher cash balance than debt
balance. The developed countries sample has a higher percentage of firm year observations nearing
the zero or negative net debt. Comparing figures 23 and 8 above, the median net debt ratio at the
peak and trough is 11% and 6.6% higher, respectively, in the emerging markets when compared
to the developed markets.
In relation to the emerging markets, the developed country sample has a 5% greater median
peak to trough decline across the entire sample. The developed countries sample has a 26% higher
NDR change during the deleveraging period in comparison to the emerging markets. Lastly, the
developed countries sample has a 14% greater BL change during the deleveraging period.
0%
5%
10%
15%
20%
25%
30%
35%
0 > L .0 < L <= .1 .1 < L <= .2 .2 < L <= .3 .3 < L <= .4 .4 < L <= .5 .5 < L
Distribution of Firm-Year Observations by NDR
Developed Markets Emerging Markets
39
VIII. Findings
a. On Deleveraging and Cash Accretion
This paper demonstrates that Non-US publicly traded companies have a propensity to
actively deleverage from their peak market leverage ratios. Figure 6 and figure 21 show that at
almost any leverage ratio there is above or around a 50% chance for a firm to lower their leverage
ratio. They also show that the higher the leverage ratio is at the beginning of the year, the higher
the chance of deleveraging in the subsequent year. This shows that managers do not want to be
highly leveraged if possible and will make decisions to lower their leverage more than not,
especially so at the higher ML ratios of above 50%. While maintaining these preferences, managers
also desire to have cash accretion during times of deleveraging. One can see in figure 8 and in
figure 23 that for all firms, ML ratios decrease 76% and 90% for emerging and developed
countries, respectively, from their median peak ML ratio to the subsequent trough. Simultaneously,
there is a cash buildup of roughly 185% for both the emerging and developed samples. This shows
that managers have an inclination to increase cash balances during this period, most importantly
to acquire financial flexibility to meet possible future funding needs.
b. On Differences Between Developed and Emerging Countries
The market leverage ratio at the peak and trough is 9.1% and 7.6% higher, respectively, in
the emerging markets when compared to the developed markets. This shows that there is a
significant difference in the capital structure decisions of managers in emerging markets. The firms
are, on average, more highly levered than their developed counterparts. The book leverage ratio at
the peak and trough is 6.4% and 5.7% higher, respectively, in the emerging markets when
compared to the developed markets. This was expected to be around the same as the ML ratio
40
comparison. The only reason it is slightly lower is due to the fact that relative to their own debt,
emerging market firms carry more assets on hand than their developed market counterparts.
Primarily to be able to post more collateral and to avoid liquidity/solvency issues in the future.
The median net debt ratio at the peak and trough is 11% and 6.6% higher, respectively, in the
emerging markets when compared to the developed markets. The developed markets have an
easier time building cash balances and driving their net debt ratios to zero or even negative when
compared to their emerging market counterparts.
Another considerable difference can be found in figures 21 and 6. Figure 6 shows the
annual deleveraging propensities for developed country firms and figure 21 shows the same for
the emerging market firms. For all firms, the average of the median annual changes of ML based
upon the beginning of the year ML, in the developed sample is -7% while the changes are only
about 4% in the emerging markets sample. In relation to the emerging markets, the developed
country sample has a 5% greater median peak to trough decline across the entire sample. The
developed countries sample has a 26% higher net debt/TA change during the deleveraging period
in comparison to the emerging markets. Lastly, the developed countries sample has a 14% greater
BL change during the deleveraging period.
41
IX. Conclusion
This paper has shed light into the topics of how publicly traded non-US firms that are a
part of developed countries actively deleverage from their peak ML ratios and how there are key
differences in the capital structure decisions of companies in developed countries and that of
those in emerging market countries. We learned that managers do not want to be highly
leveraged if possible and will make decisions to lower their leverage more than not. In addition,
a key takeaway is that Non-US publicly traded companies have a propensity to actively
deleverage from their peak market leverage ratios. We learned that there is a significant
difference in the capital structure decisions of managers in emerging markets and that the firms
are, on average, more highly levered than their developed counterparts.
Based on the results, there are many practical applications that managers could follow.
Mainly, using this research to understand why, when, and how managers choose to deleverage.
Also, the results shed light into how important cash accretion policies are and how they should
be prioritized by management. This study raises a number of opportunities for future research.
For instance, a future study could shed light into countries that were not mentioned in this study.
Future studies could also analyze other time periods to compare and contrast how debt and
manager’s tendencies change over time. More research will be necessary to further elaborate the
findings in this paper and as more data becomes available, future results and these results can be
more refined.
42
X. References
Adrian Alter and Salim Elekdag, Emerging Market Corporate Leverage and Global Financial
Conditions, IMF Working Papers, 16, 243, (1), (2016).
Asquith, P., R. Gertner, and D. Scharfstein. 1994, Anatomy of financial distress: An examination
of junk-bond issuers. Quarterly Journal of Economics 109:625–58.
Bancel, Franck, and Usha R. Mittoo. “Cross-Country Determinants of Capital Structure Choice:
A Survey of European Firms.” Financial Management, vol. 33, no. 4, 2004, pp. 103–
132. JSTOR, JSTOR, www.jstor.org/stable/3666330.
DeAngelo, H., and L. DeAngelo. 2007. Capital structure, payout policy, and financial flexibility.
Working Paper, USC Marshall School of Business.
DeAngelo, H., L. DeAngelo, and T. Whited. 2011. Capital structure dynamics and transitory debt.
Journal of Financial Economics 99:235–61.
De Jong, Abe and Nguyen, Thuy Thu and Kabir, Rezaul, Capital Structure Around the World: The
Roles of Firm- and Country-Specific Determinants (September 1, 2008). Journal of
Banking and Finance, Vol. 32, No. 9, 2008.
Denis, D., and S. McKeon. 2012. Debt financing and financial flexibility: Evidence from proactive
leverage increases. Review of Financial Studies 25:1897–929.
Denis, D. 2011. Financial flexibility and corporate liquidity. Journal of Corporate Finance 17:667–
74.
Gilson, S. 1997. Transactions costs and capital structure choice: Evidence from financially
distressed firms. Journal of Finance 52:161–96.
Harford, J., S. Klasa, and N. Walcott. 2009. Do firms have leverage targets? Evidence from
acquisitions. Journal of Financial Economics 93:1–14.
Harry DeAngelo, Andrei S Gonçalves, René M Stulz; Corporate Deleveraging and Financial
Flexibility, The Review of Financial Studies, Volume 31, Issue 8, 1 August 2018, Pages
3122–3174
Lang, L., A. Poulsen, and R. Stulz. 1995. Asset sales, firm performance, and the agency costs of
managerial discretion. Journal of Financial Economics 37:3–37.
Lintner, J. 1956. Distribution of incomes of corporations among dividends retained earnings, and
taxes. American Economic Review 46:97–113.
Modigliani, F., and M. Miller. 1963. Corporate income taxes and the cost of capital: A correction.
American Economic Review 53:433–43.

43
Skinner, D. 2008. The evolving relation between earnings, dividends, and stock repurchases.
Journal of Financial Economics 87:582–609.
Stiglitz, J. 1973. Taxation, corporate financial policy, and the cost of capital. Journal of Public
Economics 2:1–34
Vo, Xuan Vinh, 2017. "Determinants of capital structure in emerging markets: Evidence from
Vietnam," Research in International Business and Finance, Elsevier, vol. 40(C), pages 105-
113.