Embed Size (px)
Citation preview

i
CORPORATE GOVERNANCE, DISCLOSURE METHOD
AND INFORMATION ASYMMETRY
A Thesis Submitted to the College of
Graduate Studies and Research
In Partial Fulfillment of the Requirements
For the Degree of Master of Science in Finance
In the Department of Finance and Management Science
Edwards School of Business
University of Saskatchewan
Saskatoon, Saskatchewan, Canada
BY
YIFANG WAN
© Copyright Yifang Wan, October 2009. All rights reserved.

i
PERMISSION TO USE
In presenting this thesis in partial fulfillment of the requirements for a Postgraduate de-
gree from the University of Saskatchewan, I agree that the Libraries of this University
may make it freely available for inspection. I further agree that permission for copying of
this thesis in any manner, in whole or in part, for scholarly purposes may be granted by
the professor or professors who supervised my thesis work or, in their absence, by the
Head of the Department or the Dean of the College in which my thesis work was done. It
is understood that any copying or publication or use of this thesis or parts thereof for fi-
nancial gain shall not be allowed without my written permission. It is also understood that
due recognition shall be given to me and to the University of Saskatchewan in any schol-
arly use which may be made of any material in my thesis.
Requests for permission to copy or to make other use of material in this thesis in
whole or part should be addressed to:
Head of the Department of Finance and Management Science
Edwards School of Business
University of Saskatchewan
25 Campus Drive
Saskatoon, Saskatchewan S7N 5A7

ii
ABSTRACT
We examine whether corporate governance affects the level of information
asymmetry in the capital market. We hypothesize that firms with stronger corporate gov-
ernance would be more likely to voluntarily disclose corporate information using public
rather than selective methods, and that this would be associated with lower levels of in-
formation asymmetry. We carefully establish the path through which corporate govern-
ance affects a firm’s voluntary disclosure method based on previous literature. Surpris-
ingly, in full sample analysis we find that firms with stronger corporate governance (as
measured by Gompers et al.’s, 2003, G index) are associated with higher levels of infor-
mation asymmetry (as measured by Easley et al.’s, 1996, PIN). In subsample analysis, we
find that, consistent with our hypothesis, for the most weakly governed firms, stronger
corporate governance is associated with lower information asymmetry, and the impact of
corporate governance on information asymmetry is more pronounced than that of firms
with moderate and strong corporate governance.
To further test our hypothesis, we consider the external effect of Regulation Fair
Disclosure on the disclosure method to examine the corporate governance-information
asymmetry relationship. Consistent with our hypothesis, our evidence suggests that by
forbidding the practice of selective disclosure, the regulation significantly decreases the
impact of corporate governance on information asymmetry level.
Keywords: Corporate Governance, Voluntary Disclosure, Information Asymmetry
JEL Classification: G380 (Corporate Finance and Governance: Government Policy and
Regulation), M480 (Accounting and Auditing: Government Policy and Regulation)

iii
ACKNOWLEDGMENTS
I would like to express my deepest gratitude to all the people who helped and encouraged
me during my master study.
I especially wish to thank my supervisor, Dr. Craig Wilson, for his incredibly helpful
guidance on my thesis, for always accessible and patiently answering all my questions,
for helping me to clarify my cluttered ideas, and for supporting me to freely choose the
thesis topics and schedule my research procedure.
I am also very thankful to the Department of Finance & Management and the College of
Graduate Studies & Research for considering me as a recipient of the Graduate Teaching
Fellowship and the University Graduate Scholarship. Without their support, financing my
study will be as hard as writing the thesis itself.
Deepest thanks are also due to my thesis committee members, Dr. Dev Mishra and Dr.
Zhenyu Wu, for their helpful comments and suggestions.
In addition, I want to express my gratitude to Prof. Stephen Brown of Maryland Univer-
sity and Prof. Andrew Metrick of Yale University for generously sharing their research
data.
Special thanks also to Dr. Marie Racine and our department secretary Brenda Orischuk.
Their innovative hosting of department events is one of the most important parts of my
lovely memory in Saskatoon.
I owe much to all the faculty members and staff as well as my fellow students in the MSc.
Finance program. This thesis could not have been done without their support.
Last but not the least, my deepest love and gratefulness goes to my parents for their end-
less love, for believing in me and being proud of me, and for always backing me up. I
cannot but extend my infinite love and appreciation to my husband Yujian, for all his
support to my life.

iv
TABLE OF CONTENTS
PERMISSION TO USE ....................................................................................................... i
ABSTRACT ........................................................................................................................ ii
ACKNOWLEDGMENTS ................................................................................................. iii
LIST OF TABLES ............................................................................................................. vi
LIST OF FIGURES .......................................................................................................... vii
CHAPTER I INTRODUCTION ......................................................................................... 1
CHAPTER II LITERATURE REVIEW ............................................................................. 5
2.1 Regulation Fair Disclosure ................................................................................. 5
2.1.1 An Overview of Regulation Fair Disclosure .................................................. 5
2.1.2 Academic Studies on Regulation FD .............................................................. 8
2.2 Corporate Governance and Voluntary Disclosure ............................................. 14
2.3 Voluntary Disclosure and Information Asymmetry .......................................... 17
CHAPTER III SAMPLE CONSTRUCTION AND DATA DESCRIPTION ................... 20
3.1 Main Regression Variables................................................................................ 20
3.1.1 PIN ................................................................................................................ 20
3.1.2 The G Index .................................................................................................. 23
3.2 Control Variables............................................................................................... 25
3.2.1 Analysts Following ....................................................................................... 25
3.2.2 Other Control Variables ................................................................................ 26
CHAPTER IV HYPOTHESES AND METHODOLOGY ............................................... 29
4.1 Hypotheses ........................................................................................................ 29
4.1.1 Corporate Governance, Disclosure, and Information Asymmetry ................ 29
4.1.2 Regulation FD and Disclosure Method ......................................................... 30
4.2 Methodology ..................................................................................................... 31
4.2.1 The Basic Model ........................................................................................... 32
4.2.2 Different Corporate Governance Levels ....................................................... 32
4.2.3 The Effect of Regulation FD ......................................................................... 33
CHAPTER V EMPIRICAL EVIDENCE AND ROBUSTNESS CHECKS .................... 34
5.1 Empirical Evidence ........................................................................................... 34
5.1.1 Initial Regressions ......................................................................................... 34

v
5.1.2 Group Difference .......................................................................................... 35
5.1.3 The Influence of Regulation FD ................................................................... 36
5.1.4 Influence of Regulation FD on Different Groups ......................................... 37
5.1.5 Discussion ..................................................................................................... 38
5.2 Robustness Checks ............................................................................................ 39
5.2.1 The Distribution of PIN ................................................................................ 39
5.2.2 The Entrenchment Index ............................................................................... 40
5.2.3 The Unbalanced G Sample ........................................................................... 40
5.2.4 The Double Counting Trading Volume in NASDAQ Market ....................... 42
CHAPTER VI CONCLUSION ........................................................................................ 44
REFERENCES ................................................................................................................. 45

vi
LIST OF TABLES
Table page
Table 3.1 Data Distribution by Every 0.1 ……………………………………….…………... 53
Table 3.2 0.90-1.00 PIN Data Distribution by Every 0.01 …………….…………………...… 54
Table 3.3 0.00-0.10 PIN Data Distribution by Every 0.01 …………………….…………...… 55
Table 3.4 IRRC Corporate Governance Provisions ……………………………………...…… 56
Table 3.5 Summary Statistics of G by Reporting Year …………………………….………… 57
Table 3.6 Definitions of Regression Variables ……………………………………………… 58
Table 3.7 Summary Statistics of Regression Variables ………………………………….…… 59
Table 3.8 Pearson Correlation Coefficients of Regression Variables ………………….…… 60
Table 3.9 Pearson Correlation Coefficients of Regression Variables on Regulation FD ...… 61
Table 5.1.1 Regressions Analysis of Corporate Governance and Information Asymmetry … 63
Table 5.1.2 Group Analysis on Corporate Governance and Information Asymmetry ……… 64
Table 5.1.3 Event Study Analysis on Corporate Governance and Information Asymmetry .. 66
Table 5.1.4 Event Study Analysis on Group Differences …………………………………… 67
Table 5.1.5 Regressions Analysis Using Year Dummies …………………………………… 70
Table 5.2.1.1 Regression Analysis on LOGPIN ……………………………………………… 71
Table 5.2.1.2 Group Analysis on LOGPIN …………………………………………………… 72
Table 5.2.1.3 Event Study Analysis on LOGPIN ……………………………………….…… 74
Table 5.2.1.4 Event Study Analysis on Group Differences for LOGPIN ………………...… 75
Table 5.2.2.1 Regression Analysis on PIN with E Index ………………………………..…… 77
Table 5.2.2.2 Group Analysis on PIN with E Index ………………………………………… 78
Table 5.2.2.3 Event Study Analysis with E Index …………………………….……………… 80
Table 5.2.3.1 Summary Statistics of G for Firms Staying in IRRC ……………..…………… 81
Table 5.2.3.2 Regression Analysis on PIN for Firms Staying in IRRC ………………….…… 82
Table 5.2.3.3 Group Analysis on PIN for Firms Staying in IRRC ……………..…………… 83
Table 5.2.3.4 Event Study Analysis for Firms Staying in IRRC ……………………………. 85
Table 5.2.3.5 Event Study Analysis on Group Differences for Firms Staying in IRRC …..… 87
Table 5.2.4.1 Summary Statistics of PIN and G on NYSE, NASDAQ and AMEX ……...… 88
Table 5.2.4.2 Regression Analysis on PIN for Firms Listed on NYSE ………………….…… 89
Table 5.2.4.3 Group Analysis on PIN for Firms Listed on NYSE ………………………….. 90
Table 5.2.4.4 Event Study Analysis for Firms Listed on NYSE ………………………….… 92
Table 5.2.4.5 Event Study Analysis on Group Differences for Firms Listed on NYSE …..… 93

vii
LIST OF FIGURES
Figure page
Figure 3.1 Tree Diagram of the Trading Process ……………………………………… 95
Figure 3.2 Plot of quarterly and annual PIN during 1993 and 2006 .……………………….. 96
Figure 3.3 Sample Construction Process of G ……………………………………………... 97
Figure 3.4 Main Regression Variables Construction Process ……………………………….. 98
Figure 4.1 Disclosure Decision Process …………………………………………………….. 99
Figure 4.2 Information Impact Path ………………………………………………………... 100
Figure 4.3 Internal and External Forces on Disclosure Structure …………………………… 101
Figure 5.1 Analysis on Information Asymmetry by Different Governance Levels …………. 102
Figure 5.2 Frequency Histogram of PIN …………………………………………………….. 103
Figure 5.3 Frequency Histogram of LOGPIN ……………………………………………….. 104

1
CHAPTER I
INTRODUCTION
One aspect of finance involves efficient borrowing and lending of funds. In the
setting of a corporation, conflicts of interest arise between borrowers and lenders as a
consequence of the separation of ownership and control. Broadly speaking, there are two
main classes of such conflicts studied by finance researchers, namely the lemon problem
of adverse selection and the agency problem of moral hazard. The former deals with the
possibility that managers overstate the firm’s value and mislead savers or lenders into
making inappropriate investment decisions; and the latter deals with the possibility that
managers improperly use or expropriate shareholder wealth. One practical solution to
these problems is monitoring (and signalling) through financial disclosure. In this thesis,
we focus on the effect of financial disclosure on the adverse selection problem.
Financial disclosure is a channel through which existing and potential sharehold-
ers obtain valuation information about the firm. It is the connection between corporate
insiders and capital market investors. When there is new information, it could remain un-
disclosed, it could be mandatorily disclosed, or it could be voluntarily disclosed. There-
fore, the content of disclosure reveals not only a firm’s financial and operational situation,
but also its managers’ incentives and discretion to disclose relevant information. It re-
flects the power managers can exert on disclosure decision making, and this distribution
of power between managers and shareholders is integrally linked to the firm’s corporate
governance.1 And as information is distributed through different channels to different
receivers, information asymmetry arises among market participants. In conclusion, the
effect of disclosure as a connection between managers and shareholders involves the as-
sociation of management power and shareholder variation. It characterizes the link be-
tween corporate governance and information asymmetry through the compound relation-
ships between corporate governance and disclosure, and disclosure and information
asymmetry.
1 This research uses Gompers et al. (2003)’s G index to proxy firms quality of corporate governance, which they construct using 24 governance provisions. G is equal to the number of a firm’s provisions. It measures the balance of power between shareholders and managers. More provisions mean a higher G and weaker corporate governance. See Chapter III for a detailed description on how G is constructed. Earlier studies include Bebchuk et al. (2009), Gompers et al. (2003) and Masulis et al. (2007).

2
Both parts of the corporate governance-information asymmetry relationship have
been studied in previous literature. Various studies on the relationship between corporate
governance and disclosure have been done on various markets around the world.2 Since
the content of mandatory disclosure is not (legally) subject to the will of managers, re-
searchers generally focus attention on the association between corporate governance and
voluntary disclosure. They consider the quality and value of voluntary disclosure as well
as ownership structure and composition of the board of directors. However, in these
studies, the method of disclosure (either selective or public) is not considered.
Holland (1998) is among the first to study the distinction between selective vol-
untary disclosure and public voluntary disclosure. When news is voluntarily disclosed, it
can either be delivered through private channels, or it can be released publicly. Selective
disclosure could lead to information asymmetry among news receivers. Holland (1998)
provides descriptive incentives for the structural difference in mangers’ voluntary disclo-
sure choices, but does not specify any internal cause of the structural difference. On the
other hand, Core (2001) separates the voluntary disclosure process into two steps. First,
firms decide their optimal disclosure policy based on developing needs, usually decided
by cross-sectional differences; then when information arrives, corporate governance de-
termines the ability the firm to carry out its optimal disclosure policy.
We link Core’s (2001) idea with Holland’s (1998) voluntary disclosure separation
theory, and outline a path between corporate governance and disclosure method. The ab-
solute amount of voluntary disclosure is determined by cross-sectional differences.
Meanwhile, the relative amount, or the method of voluntary disclosure, is determined by
corporate governance. Strong governance ensures that the firm’s optimal policy is fol-
lowed using public disclosure as necessary; while weaker governance gives managers a
greater ability to selectively release information for personal interest. As a consequence,
the variation of the disclosure method across firms may bring about different levels of
information asymmetry in the capital market. The above survey, together with a detailed
analysis in Chapters II and III, develop the main argument in our thesis: The level of
corporate governance determines a firm’s information structure, and thus influences its
2 See for example El-Gazzar (1998), Eng and Mak (2003), Lang and Lundholm (1993), Ruland et al. (1990), Schadewitz and Blevins (1998), and Williamson (1981).

3
level of information asymmetry.
Using a sample of 5,285 observations during the period between 1995 and 2005,
we find a negative and statistically significant relationship between corporate governance
and information asymmetry (in the sense that well governed firms have higher informa-
tion asymmetry). This finding is supplemented by a subsample analysis on different gov-
ernance levels. We find that the impact of corporate governance is more severe for
weakly governed firms, and is less severe for strongly governed firms. Specifically, the
weakly governed firms behave significantly differently from the other firms. The G coef-
ficient signs are positive for weakly firms and negative for the others. Therefore, we sug-
gest that while managers of weakly governed firms may selectively disclose information
to exploit rent seeking opportunities, those of moderately governed firms may rather use
selective disclosure to avoid job loss.
In further analysis, we examine how the disclosure method is related to the rela-
tionship between corporate governance and information asymmetry. The SEC enforced
Regulation Fair Disclosure (Regulation FD) as an external force regulating the disclosure
method. We find that Regulation FD changes the pattern of how corporate governance
influences the level of information asymmetry. Generally, the degree of impact for cor-
porate governance on information asymmetry is reduced. In particular, the decrease is
more pronounced for weakly governed firms, suggesting that changes in corporate gov-
ernance provide a strong internal force on the method of disclosure for firms with suffi-
ciently weak governance. The above evidence is robust to controlling for several other
key factors on information asymmetry including analyst following, capitalization, trading
volume, block holder ownership, and book-to-market ratio.
Our study makes several valuable contributions to the literature. First, we outline
a clear channel where disclosure method is the intermediary through which corporate
governance affects market behaviour, and we clearly describe the path through which
corporate governance affects a firm’s voluntary disclosure method. We provide evidence
suggesting that corporate governance affects market information asymmetry. Second, we
examine the impact of Regulation FD in a new and unique way. We test the relationship
between corporate governance and information asymmetry, and then examine the effect
that Regulation FD had on this relationship to infer how the regulation affects the disclo-

4
sure method. We find that Regulation FD successfully changes the disclosure method of
adopted firms, and equalizes the impact of corporate governance on information asym-
metry for firms with different governance levels. 3 We also provide a rich review of
academic studies on Regulation FD by summarizing the existing literature into four dis-
tinct approaches. In addition, our research substantially expands the growing literature on
the corporate governance index constructed by governance provisions related to Gompers
et al. (2003) and Bebchuk et al. (2009). We find that while the E Index developed by
Bebchuk et al. (2009) may contain most of the firm value information driven by G, it
does not seem to contain as much information about corporate disclosure and information
asymmetry level as the G index.
The rest of the thesis is organized as follows. Chapter II provides a detailed lit-
erature review on Regulation FD, corporate governance and voluntary disclosure, and
voluntary disclosure and information asymmetry. Chapter III describes the data and sam-
ple construction. Chapter IV presents our hypothesis and methodology. Chapter V pre-
sents the empirical results and robustness tests on the impact of corporate governance on
information asymmetry level. Chapter VI concludes the thesis.
3 Our study can also be viewed as an empirical test on the effectiveness of the legal institution in the capital market.

5
CHAPTER II
LITERATURE REVIEW
2.1 Regulation Fair Disclosure
2.1.1 An Overview of Regulation Fair Disclosure
On August 15, 2000, the U.S. Securities and Exchange Commission passed Rules
10b5-1 and 10b5-2: Selective Disclosure and Insider Trading Regulation, which was
proposed on December 20, 1999 and would go into effect on October 23, 2000. The
regulation is commonly referred to as Regulation Fair Disclosure (Regulation FD). It re-
quires publicly traded companies to disclose relevant information to all investors simul-
taneously. Under the regulation, any material information disclosed in private must be
publicly released within 24 hours or the next business day by filling an SEC 8-K form
through the SEC’s EDGAR system,4 issuing a press release, or making a broadcasting or
internet announcement. Although for violations, responsible individuals are subjected to
fines up to one million dollars for issuers and fifty thousand dollars for executives, the
regulation covers only officers, directions, investor relations officers, public relations of-
ficers, and other authorized spokespeople, and it applies only to the communications be-
tween the above authorized spokespeople and the investment community.
2.1.1.1 The history of U.S. insider trading regulation
The U.S. government addresses concerns about preventing insider trading fraud
through two main manners: the common law and the SEC rules.
The first attempt in trading regulation happened in 1909 when the Supreme Court
made its decision that firms must disclose inside information or they should abstain from
using it to trade. However, the question “who is an insider?” was not answered at that
time. Later, a more comprehensive version was proposed after the NYSE collapse during
the late 1920’s to the early 1930’s. In 1933, section 17 of the Securities Act received
sanction to forbid frauds in security sale, and this action was later reinforced in the Secu-
rities Exchange Act of 1934, which defined and prohibited certain forms of trading frauds.
4 In 2004 the SEC proposed Rule (33-8496) which encourage firms to voluntarily file disclosure reports in the extensible business reporting language (XBRL). See Debreceny et al. (2005) for a descriptive valuation of this rule.

6
The SEC’s Rule 10b-5 in 1942 was based on the 1934 Act, and it concerned both in-
formed buying and informed selling. Although the term “insider trading” was not clearly
defined in all three rules, “insider” was referred to as corporate officers, directors and
owners of at least 10% of a firm’s stock in the 1934 Act. The 1942 rule broadened this
definition by including corporate “outsiders” and people who receive illicit tips into the
list.
The Insider Trading Sanctions Act of 1984 was the first to prohibit traders from
trading on material information, and the Insider Trading and Securities Fraud Enforce-
ment Act of 1988 recoded the 1984 Act, adding information “tippers” to the covering list.
Both acts entitled the SEC the right to charge up to three times the amount of any illegal
gain from insider trading. However, the definition of “material information” was not
clearly explained. As a substitute, the existing definitions from the case law in practice
were applied. Mainly based on the Basic v. Leviuson and TSC Industries v. Northway
cases, the case law considers that information is material “if there is a substantial likeli-
hood that a reasonable shareholder would consider it important in making an investment
decision” (Bethel, 2007, pg 337).
Even in the latest Regulation FD this important term is still not defined. However,
FD is the first to clearly provide specific types of “material” information such as “earn-
ings information, mergers, acquisitions, tender offers, joint ventures, or changes in assets,
new products or discoveries, changes in control or management, changes in an auditor,
or defaults on senior securities, bankruptcies or receiverships” (Bethel, 2007, pg 337).
And instead of setting an “affirmative burden” to disclose information, the regulation re-
quires wide distribution of information once the officer delivers a message.
Later in 2004 the SEC issued additional guidance on filing form 8-K disclosure to
better support Regulation FD. Such issues, together with FD and other previous rules,
help the SEC to better adapt to emerging changes in the capital market arising from on-
going technological innovation.
2.1.1.2 Why did the SEC put Regulation FD into action?
The SEC believed that the practice of selective disclosure leads to (1) a loss of
investors’ confidence in the integrity and fairness of the capital market; (2) the same
negative impact as insider trading, which was illegal even though selective disclosure

7
was not; (3) a commoditization of material information under which stock issuers might
tip analysts who give favoured reports and exclude analysts who refused to do so. (Ham-
ilton and Trautmann, 2000)
Some of the SEC’s rationales were supported by academic theory from previous
research. For example, Holden and Subrahmanyam (1992) show that as informed traders
operate aggressively, their common private information is incorporated into stock prices
very rapidly. Diamond and Verrecchia (1991) show that having a large amount of public
information serves to reduce information asymmetry and the associated risk to market
makers. Foster and Viswanathan (1996) show that the differences between initial infor-
mation sources for informed traders determine their specific "monopoly power" over
other traders and market makers. Therefore, if selective disclosure is prohibited and every
investor receives identical information, none of them will have a superior position in the
market. In that case, asymmetry disappears, information is reflected by price very quickly,
and there is no abnormal profit available for informed traders.
Empirical evidence also supports the SEC's proposal on regulating selective dis-
closure. Frankel et al. (1999) and Bowen et al. (2002) show that conference calls are in-
formative but not all investors have equal access to this information. It creates a selective
disclosure problem, and leads to an information gap between the analysts’ community
and ordinary investors.
2.1.1.3 Debates among affected parties before the sanction
After Regulation FD was proposed, the SEC received over 6,000 letters support-
ing the rule, mainly from individual investors. Many of them expressed their frustration
when they sometimes saw prices moving sharply, but they did not receive any related
news until quite a long time later. Other supporters believed that, besides enhancing capi-
tal market confidence, the new regulation would encourage the flow of information to
investors and would reduce financial analysts' existing reliance on firm-provided infor-
mation.
Opponents of the regulation were mainly from the analysts’ community as well as
some stock issuers who frequently used conference calls as information disclosure media.
They argued that as some key words in the regulation, such as “material information” and
“non-exclusive disclosure”, did not provide explicit definitions and measures for com-

8
pliance, the regulation might bring about a “chilling effect,” under which firms would
provide less and substandard information to prevent being caught violating the regulation.
They also argued that individual investors could get lost without professional interpreta-
tion from analysts when firms released data simultaneously to all parties.
2.1.2 Academic Studies on Regulation FD
One of the points against the new regulation was the fear that if firms did not
know how to comply because of the imprecise, ambiguous wording, then they would
provide as little information as possible to avoid being punished by the SEC. As shown in
a survey conducted by the National Investor Relation Institute (NIRI) in 2000, 42% of
462 investor relation professionals said they would limit their communication practice.
However, according to a later survey by NIRI in 2001 after Regulation FD went into ef-
fect, only 24% of the 577 professionals said they did reduce information disclosure,
compared to 48% who said there were no change on their conducts and 27% who admit-
ted that they were giving even more information.5 Another NIRI survey showed that 90%
of firms now allowed full access for all investors to conference calls, compared to 60%
before Regulation FD.6 It seems at a glance that by the implementation of Regulation FD,
the SEC substantially achieved its goal.
However, there are also plenty of surveys telling different stories. According to
the Wall Street Journal on October 17, 2005, although information flows are not curtailed
by the regulation, the planned result to stop the practice of selective disclosure is also in-
adequate. For instance, 97% firms continue the one-to-one meetings with analysts and
institutional investors, and 71% of them still provide earning guidance in the breakout
sessions after brokerage house presentations. What was worse, a CFA institute survey in
2003 showed that only 45% members voted that information from stock issuers was of
good quality, compared to 60% in 1999.7
Sparked by the debatable anecdotal evidence listed above, considerable academic
5 See Mathew et al. (2004)
6 See Duarte et al. (2008).
7 See M. Rapport, Corporate governance (a special report); Five years later: critics felt regulation FD would choke off the flow of corporate information. Here's why it didn't happen, Wall St J, East Ed (2005), p. R 8 New York, N.Y. Oct. 17.
9
research has involved Regulation FD. These studies can be grouped into four distinct ap-
proaches as follows: (1) to investigate market behaviour; (2) to study analysts’ behaviour;
(3) to see how information asymmetry changes, and (4) to learn how firms react to the
regulation, that is, how corporate performance changes after the regulation.
2.1.2.1 The market behaviour approach
Research on Regulation FD begins with studies on how the general market be-
haviour changes and the meaning of these changes. Early evidence from Zitzewitz (2002)
shows that multi-forecasting days account for over 70% of new information in the first
quarter after Regulation FD, compared to 35% before the regulation. Zitzewitz concludes
that the regulation reduces selective disclosure to analysts without reducing total infor-
mation. Most studies about the market behaviour approach employ the return volatility as
a proxy for stock informative level. For example, Heflin et al. (2003) observe that stock
price deviation, a measure of market information that is referred to as “information gap,”
becomes smaller after the regulation. This observation is further supported by Francis et
al. (2006) who apply both event volatility and general return volatility as information
proxies. Bailey et al. (2003) observe an increase in trading volume, but a decline in return
volatility around earning releases after Regulation FD. They claim that the decline is due
to decimalization which happened almost at the same time as Regulation FD. Similarly,
Eleswarapu et al. (2004) observe a decline in return volatility around mandatory earnings
announcements. They conclude that information flow is unchanged because the decline
loses its statistical significance when voluntary announcements are taken into account.
In contrast, Mathew et al. (2004), observing abnormal return volatility around
earning announcements, conclude that information flow increased after Regulation FD,
with small firms bearing a larger impact. Bushee et al. (2004) examine price volatility
and individual investors’ trading activity during periods around conference calls. They
believe that the high price volatility after Regulation FD reveals that price is more infor-
mative following its implementation. Similarly, Ahmed and Scheible (2007) find that the
regulation reduces the differences in information quality among investors.
To sum up, a large amount of research has been done on the market behaviour ap-
proach, and the general results support the SEC’s achievement of a better capital market
environment.

10
2.1.2.2 The analysts’ information effect approach
Early research in this approach focuses mostly on analysts’ forecasts. For instance,
Heflin et al. (2003) and Bailey et al. (2003) both study market behaviour and analysts’
behaviour, but they obtain dissimilar results about analysts’ forecast dispersion: Heflin et
al. (2003) find no change in forecast dispersion while Bailey et al. (2003) observe an in-
crease. However, both agree that there is no change in analysts’ forecast accuracy, one of
the key factors in Regulation FD studies. Although Heflin et al. (2003) observe a smaller
forecast error, and they explain that other factors beyond the regulation change, such as
the economic environment, may have lead to the decline.
The majority of studies on analysts’ behaviour come out after 2005 with innova-
tive ideas. While Agrawal et al. (2006) and Yang and Mensah (2006) still focus on the
analysts’ forecast accuracy and dispersion, Mohanram and Sunder (2006) focus more on a
dynamic view that analysts are putting more effort into searching out their own sources of
information after Regulation FD. In their opinion, analysts now switch their focus from
well-followed firms to less followed firms to capture unique information discovery. Large
brokerage analysts lose their superior forecast power, which levels the playing field.
Likewise, Gintschel and Markov (2004) notice that highly ranked brokerage houses and
optimistic analysts are affected by Regulation FD to a greater degree. However, by ex-
cluding high-tech firms from their sample, in order to control for the economic recession
coincident with Regulation FD, Gomes et al. (2007) find that analysts shift to large firms
after the regulation is implemented. Ferreira and Smith (2006) also study the information
changes of analysts rating. They find that investors continue to respond to analysts’ rec-
ommendations in the same way as before.
On the other hand, Arya et al. (2005) stand on the critical side of the regulation. In
their theoretical model, selective disclosure can stave off analysts herding behaviour be-
cause parties are able to incorporate a more diverse set of information into their reports.
The regulation, by ruling out the practice of selective disclosure, heightens herding be-
haviour and leaves investors worse off. As a response, Mensah and Yang (2008) apply a
similar empirical model and they find that Regulation FD does not increase herding be-
haviour, but slightly increases “anti-herding” behaviour instead.
As an alternative to equity analysis, Jorion et al. (2005) study the impact of

11
Regulation FD on credit analysis. They observe an increase in the information content of
rating changes after the regulation. One explanation for this result is that credit analysis is
excluded from FD’s blacklist. Nevertheless, it is found that the increase is more pro-
nounced for larger firms with a greater analyst following. The evidence overwhelmingly
shows that the SEC achieves its goal to limit the practice of selective disclosure, espe-
cially for large firms.
In conclusion, most of academic researchers agree that there is little impairment
to analysts’ ability, but results in this approach are still unsettled.
2.1.2.3 The information asymmetry approach
One reason that the SEC arranged to stop the practice of selective disclosure is
related to its goals to maintain investors’ confidence and belief in the integrity of the
capital markets. Selective disclosure, by causing information asymmetry between in-
formed traders and dealers and uninformed traders, grants a small portion of market par-
ticipants with superior ability to profit from private information to the detriment of ordi-
nary, uninformed investors. Stimulated by this problem, the third approach to studying
Regulation FD directly concerns whether the regulation solves the selective disclosure
problem or not. Two main methods used by researchers are: (1) to examine the informa-
tion asymmetry with the bid-ask spread and (2) to estimate the probability of informa-
tion-based trading.
The bid-ask spread method. Basically, the bid-ask spread is considered to be composed
of four parts: order-processing cost, inventory-holding cost, monopoly charges or compe-
tition discounts, and adverse selection cost due to information asymmetry between deal-
ers and informed traders (Huang and Stoll, 1997). The pioneers of the adverse selection
approach to studying Regulation FD assume that the first three parts are unaffected by
information dissemination changes associated with the implementation of the regulation.
In this case, any changes in bid-ask spread would reflect changes in information asym-
metry. Sunder (2002) tests the difference in bid-ask spread between matched pairs of
“open” and “restricted” firms during pre- and post-regulation periods. Sunder finds that
after the regulation, the difference in bid-ask spread between the two groups is eliminated.
Her result suggests that Regulation FD helps to reduce the level of information asymme-
try in the stock market. Although Sunder’s result is in favour of the SEC’s goal, her

12
methodology is criticized by several other authors, since the other three components of
the bid-ask spread could also be influenced by the regulation.
Further studies extend Sunder’s (2002) work by decomposing the adverse selec-
tion part separately from the bid-ask spread through various theoretical models. Straser
(2002) and Eleswarapu et al. (2004) both use Huang and Stoll’s (1996) model, but reach
contradictory conclusions. While Straser observes a higher adverse selection component
after the regulation, Eleswarapu et al. find that at earning announcements, this component
declined, and the decrease is more pronounced for smaller and less liquid stocks. Later,
by jointly applying three other models to decompose the adverse selection component,
Chiyachantana et al. (2004) confirm that Regulation FD does help to reduce information
asymmetry. On the other hand, Lee et al. (2004) find no significant change in the adverse
selection component, whereas Sidhu et al. (2008) find that the adverse selection compo-
nent increases after Regulation FD.
The probability of information-based trading method. The inconsistent results from
the bid-ask spread approach suggest that researchers may need to explore new measure-
ments of the degree of selective disclosure. The probability of informed trading approach
is one of the most feasible. There are several theoretical models available for this ap-
proach, such as Easley et al.’s (1996) (EKOP) model used by Straser (2002) and Duarte
et al. (2008) and the Hasbrouck (1991) model used by Collver (2007).
Under the EKOP setting, Straser (2002) uses a sample of 137 days of intraday
data for 130 matched pairs to examine the impact of Regulation FD on “open” and
“closed” firms respectively.8 It is shown that PIN increases after Regulation FD. To ex-
plain the result, Straser separates market leaked information into two parts, the private
information and the private component of public information. According to Straser, as
private information decreases with the prohibition of selective disclosure, analysts put
more effort into finding signals from public information. As a result, financial analysts
discover more from public messages, and the private component of public information
8 According to Straser (2001, pg 10) “open” firms “consist of companies that claim to have provided public disclosure of all material information as required by Regulation FD prior to its institution.” While “closed” firms “consist of companies that prior to Regulation FD released their information strictly to analysts and/or shareholders.” The classification is developed from the results of a Business Week survey in August 2000.

13
increases. This increase in the private component outweighs the decrease of selectively
leaked information, and thus the overall PIN increases.
Straser uses a relatively small sample in her study because of the need to control
for pair matching. Duarte et al. (2008) supplement Straser’s work by using 3,000 firms
from NYSE and over 2,000 firms from NASDAQ, and a longer event window period is
applied as well. They find a marginally significant increase in the median of PIN, and the
significance is further weakened by their firm level chi-squared tests. They do not pro-
vide an explicit explanation for the result. Collver (2007) extends this approach by ap-
plying Hasbrouck’s (1991) summary informativeness statistic to measure informed trad-
ing. A decrease in the informed trading index is observed.
2.1.2.4 The corporate governance approach
This approach is less developed compared to the previous three approaches.
Studies about this approach focus on testing how firms react to the regulation, and most
of them provide a descriptive background check. For example, Straser (2002), Heflin et al.
(2003) and Bailey et al. (2003) observe that firms’ public disclosure increases in general,
especially in the first quarter right after regulation FD. Bushee et al. (2004) find that the
regulation has a small negative impact on managers’ decision to hold conference calls.
Obviously, since Regulation FD is a rule affecting firms’ disclosure activities, new
features in the corporation information environment may emerge, which could lead to
changes in corporate capital structure and corporate governance. For instance, different
degrees of information disclosure could alter the information asymmetry between share-
holders and managers, and could change the cost for potential shareholders to seek in-
formation about stocks. Duarte et al. (2008) show that while NYSE/AMEX stocks’ cost
of capital has no significant change, the cost of capital of NASDAQ stocks experiences a
moderate increase. Gomes et al. (2007) also observe a rising cost of capital, mostly in
small firms.
The above review of various studies on Regulation FD highlights the conflicts
that arise between the SEC’s goals and the actual outcome, and suggests the importance
of further understanding the cost and benefits of the regulation. This has important im-
plications for other jurisdictions considering the implementation of similar regulations on
information disclosure.

14
2.2 Corporate Governance and Voluntary Disclosure
“The information disclosed…describes what the corporate insiders want to be
disclosed about the corporation’s activities and performance.” (Melis, 2004, pg 32)
The conflict of interest between principle and agent is one of the most frequently
studied problems in finance. In a business entity, such conflict arises between sharehold-
ers and management, or ownership and control. If there is not an effective method to re-
strict managers’ behaviour, they can easily expropriate investors’ money for their own
interest. The incentive of expropriating investors’ money can lead the managers to behave
in two ways: they may cheat existing investors, and/or they may cheat potential investors.
The former activity is called the “agency problem” (Jensen and Meckling, 1976); and the
latter activity is called the “information problem” (or “lemon problem,” Akerlof, 1970).
When investors enter the capital market with their savings, their investment selec-
tion criteria are usually based on information that is provided by managers. If managers
do not disclose all relevant information that reflects firms’ value, then investors may have
biased estimates of value, and hence they may make unsuitable investment choices. On
the other hand, after savings are placed into the firms, investors often do not show much
interest in actively participating in management activities. Therefore, investors’ impres-
sion of firm value relies heavily on manager’s clarification, which gives managers the
opportunity to engage in self-serving behaviour.
The above analysis explains the importance of information disclosure as a key
element in solving the conflict of interest problem and in protecting shareholder rights. In
the current capital market, business entities are required to disclose accounting informa-
tion. Additional information can be provided on a voluntary basis. Since mandatory dis-
closure is a minimum requirement of corporate disclosure, most academic studies focus
on voluntary disclosure decisions.
There exist various explanations about why firms make voluntary disclosure. Ba-
sically, six motives are mentioned in previous literature: the capital markets transactions
hypothesis, the corporate control contest hypothesis, the stock compensation hypothesis,
the litigation cost hypothesis, the management talent signalling hypothesis, and the pro-
prietary cost hypothesis (Healy and Palepu, 2001). The capital market hypothesis claims
that mangers use voluntary disclosure as a tool to solve the “lemon problem,” to reduce

15
information asymmetry on the capital market, and thus reduce the cost of capital when
they seek external financing. The corporate control contest hypothesis says that managers
voluntarily disclose additional information to explain poor performance when they feel
the firm is undervalued and when managers face the possibility of job loss. The stock
compensation hypothesis says that managers publish news to avoid being classed as “in-
siders” when they exercise their options or trade their stocks. And they also disclose in-
formation to allow accurate valuation before issuing option or stock compensation. The
litigation cost hypothesis has two sides; managers could increase voluntary disclosure to
avoid being sued for inadequate disclosure, or they could decrease disclosure, especially
around earning forecast announcements, if they are afraid that their information is biased
or inaccurate. The management talent signalling hypothesis states that managers are more
likely to disclose good news in order to distinguish themselves from their colleagues. Fi-
nally, the proprietary cost hypothesis argues that managers’ decision about whether to
disclose certain information depends on their belief about whether the news will reduce
firm value. They choose not to disclose if the news is likely to “damage the competitive
position” (Healy and Palepu, 2001, pg 424).
While each of the above hypotheses has its own rationale and empirical evidence,
their common theme is the relationship between managers and investors, interpreted as a
balance of power. Therefore, we seek to identify a clear relationship between corporate
governance and voluntary disclosure. Core (2001) breaks down the voluntary disclosure
process into two steps. First, firms decide their optimal disclosure policy based on devel-
oping needs, which are usually decided by cross-sectional differences. For example, firms
with differing degrees of commitment to industrial standards may apply different disclo-
sure policies. Then, as news arrives, the firm’s corporate governance determines the
firm’s ability to enforce its optimal disclosure policy.
In our study, when the regulatory environment allows it, managers may choose
between making public announcements to all investors and selectively disclosing the
news to certain parties. Selective disclosure allows managers the opportunity to act in
their own interest against the interests of ordinary shareholders, creating the possibility of
an agency problem. Therefore corporate governance does not determine the absolute de-
gree of firms’ voluntary disclosure, but it rather determines the relative position in volun-

16
tary disclosure. For instance, if the power of shareholders is relatively strong, then man-
agers will be less likely to use information for their own interest, whereas if the power of
management is relatively strong, there will be few restrictions on how managers disclose
information. This is how we link corporate governance to how managers make voluntary
disclosure.
As Eng and Mak (2003) stated, the link between disclosure and corporate gov-
ernance is first noted by Williamson (1981). Since then there have been many studies
testing the relationship between corporate governance and voluntary disclosure in the U.S.
as well as globally.9 On the corporate governance side, most of the above research fo-
cuses on ownership structure and board composition as proxies for the balance of power
between shareholders and managers. Researchers using ownership structure as measure-
ment proxies focus on management ownership (Eng and Mak, 2003, and Ruland et al.,
1990), large outside shareholder ownership (Eng and Mak, 2003, and Ruland et al., 1990),
institutional ownership (El-Gazzar, 1998, and Schadewitz and Blevins, 1998), and gov-
ernment ownership (Eng and Mak, 2003). While researchers using board composition as
measurement proxies focus on the proportion of independent directors on the board (Eng
and Mak, 2003, Ho and Wong, 2001, and Forker, 1992), the existence of an audit com-
mittee on the board (Forker, 1992, Ho and Wong, 2001, Collier, 1993, and McMullen,
1996), the existence of a dominant person in the firm (Forker, 1992, and Ho and Wong,
2001), and the existence of a related person on the board (Ho and Wong, 2001).
Meanwhile, on the voluntary disclosure side, most of studies focus on either the
amount of voluntary disclosure (Ruland et al., 1990, El-Gazzar, 1998, and Schadewitz
and Blevins, 1998), or the quality of voluntary disclosure measured by self-constructed
scores or AIMR scores based on analysts rating (Eng and Mak, 2003, and Lang and Lun-
holm, 1993). To our knowledge, only Holland (1998) provides descriptive incentives for
the structural difference in voluntary disclosure choices, but Holland does not specify the
internal and endogenous relationship between corporate governance and voluntary dis-
closure structure as we put forward in this thesis.
9 See for example, Ruland et al. (1990) in the United States, McKinnon and Dalimunthe (1993) in Austra-lia, Meek et al. (1995) in United Kingdom and Continental European, Ben Ali et al. (2007) in France, Ho and Wong (2001) in Hong Kong, and Eng and Mak (2003) in Singapore.

17
2.3 Voluntary Disclosure and Information Asymmetry
“…companies identified two distinct or extreme areas for corporate disclosure.
The first was where market failure created a clear-cut domain for private disclosure only.
The second was where regulation created a distinct area for mandatory public disclosure.
In between these two … lay a wide area for company discretion concerning public versus
private disclosure choices.” (Holland, 1998, pg 29)
The information structure of a firm refers to the three categories of information
within a firm: that subject to mandatory disclosure, that which is voluntarily disclosed,
and that which is undisclosed. Of the information that is disclosed, managers can either
publish news through a public channel, (e.g. filling SEC forms, issuing press release, etc.),
or they can release news to privileged groups through a selective channel, (e.g. public
limited conference calls, presentations to brokerage houses, meetings with institutional
shareholders, reports to analysts, etc.). In this thesis, we refer to these as public disclosure
and selective disclosure respectively.
Evidence suggests that voluntary public information can reduce the level of in-
formation asymmetry among market participants, and thus can help to form a sound and
efficient market. Analytically, Barry and Brown (1985), Diamond (1985), Diamond and
Verrecchia (1991) and Kim and Verrecchia (1994) argue that more information generally
reduces information risk on prices; likewise voluntary disclosure serves to reduce infor-
mation asymmetry among traders. Empirically, Leuz and Verrecchia (2000), Healy et al.
(1999) and Welker (1995) investigate links between voluntary disclosure and stock li-
quidity. Their findings are mixed. While Welker and Leuz and Verrecchia find that firms
with better quality disclosure have lower bid-ask spreads, Healy et al. find that firms with
a larger amount of disclosure have significantly higher bid-ask spreads. In addition,
Botosan and Plumlee (2002) test the capital market effect of voluntary disclosure on the
cost of capital, and they find that the cost of capital decreases with more disclosure. Tra-
belsi et al. (2004) and Trabelsi et al. (2008) study the performance pattern and incentives
of internet financial reporting, and find that internet disclosure helps to reduce analysts’
forecasting error. Most (but not all) of the above evidence is consistent with the idea that
public voluntary disclosure serves to reduce information asymmetry and information risk.
On the other hand, there is not much documentation on the capital market conse-

18
quence of private information. Admati (1985) , Wang (1993), Dow and Gorton (1995)
and Easley and O’Hara (2004) all model the activities of informed and uninformed trad-
ers, and they find that because of the different degree of available information, informed
traders and uninformed traders invest in different portfolios. Specifically, informed trad-
ers construct their portfolios on the efficient frontier associated with their superior infor-
mation. Since uninformed traders have inferior information, they cannot “replicate” the
informed traders’ portfolios, thus their portfolios will always locate below the informed
traders’ efficient frontier. As selective disclosure causes information asymmetry to arise
between these two parties, it makes informed traders better off at the expense of unin-
formed traders.
Easley and O’Hara (2004) develop a framework to consider both public informa-
tion and private information together. They provide an analytical model to demonstrate
how a firm’s information structure affects its capital market behaviour. Their finding
suggests that for stocks with more private information and less public information, unin-
formed investors require a higher rate of return as compensation because more private
information increases information asymmetry and the information risk uninformed in-
vestors face. Easley and O’Hara (2004) pg 1578 conclude “If, as our analysis suggests,
the quality of information affects asset pricing, then how information is provided to the
market is clearly important.” Although they claim that the results of Easley et al. (2002)
can be viewed as an empirical test of their analysis, in fact Easley et al. (2002) test the
different roles of private and public information independently, rather than testing both
simultaneously. To our knowledge, there are no empirical studies examining this issue
directly.
The association between concepts discussed in section 2.1 (the role of Regulation
Fair Disclosure), section 2.2 (corporate governance and voluntary disclosure), and section
2.3 (voluntary disclosure and information asymmetry) is as follows: As an internal force,
the balance of power between shareholders and management decides how managers fol-
low the corporation’s optimal disclosure policy, and the relative position is reflected as
the information structure of the firm, which decides the level of information asymmetry
between informed and uninformed traders. To test the endogenous level of corporate
governance as the internal force, we study Regulation FD and treat it as an external force

19
on the firm’s information structure.
20
CHAPTER III
SAMPLE CONSTRUCTION AND DATA DESCRIPTION
3.1 Main Regression Variables
3.1.1 PIN
In this thesis we use the probability of information-based trading (PIN) as a proxy
to measure the level of information asymmetry among market participants. Ranging from
0 to 1, PIN estimates the probability that any random trade is made by an informed trader.
A large PIN value is associated with a high level of information asymmetry.10 PIN is de-
rived by Easley et al. (1996) (EKOP, hereafter) from a microstructure model mimicking
the trading process in a risk-neutral, perfectly competitive market. The game tree in Fig-
ure 3.1 describes the trading process.
[Insert Figure 3.1
Tree Diagram of the Trading Process]
An information event may occur at the beginning of each day with probability .
A low signal arrives with conditional probability , and a high signal with conditional
probability 1 – . If the information event does not occur, then only uninformed traders
trade in the market, and although it is not strictly necessary, EKOP assumes buy orders
and sell orders arrive at the same rate . Informed traders arrive at the rate , but they
trade only on days in which an information event has occurred. Therefore, given a low
signal on a particular day, the seller arrival rate is + , and the buyer arrival rate is
because informed traders sell their shares but do not buy after observing the low signal.
Similarly, when there is a high signal, the seller arrival rate is , and the buyer arrival rate
is + . The parameters , , and are estimated using maximum likelihood based on
the number of buy orders and sell orders observed each day. Assuming that the arrivals
follow independent Poisson processes, the estimation of PIN is given as
10 Duarte and Young (2009) and Mohanram and Rajgopal (2009) discuss whether PIN is associated with the cost of
capital. Our study, using PIN as a measurement of risk, does not involve this issue.

21
2 . (1)
Our PIN data are obtained from the website of Professor Stephen Brown of
Maryland University. Brown calculates quarterly PIN estimates for the entire database of
the Centre of Research on Security Price (CRSP) from the first quarter of 1993 to the
second quarter of 2006. The sample includes stocks listed on the New York Stock Ex-
change (NYSE), the American Stock Exchange (AMEX), and the National Association of
Securities Dealers Automated Quotations (NASDAQ).
To be compatible with the other variables in this research, the quarterly PIN data
are converted to annual data by taking the arithmetic average of the four quarters each
year, ignoring all missing values. To achieve a better estimation of the effect of Regula-
tion FD, a maximum symmetric time frame surrounding the event year 2000 is selected
as the event window, containing eleven years of data from 1995 to 2005.
The parameters , and which EKOP use to derive PIN are estimated using a
likelihood function suggested by Easley et al. (1996) using , 1 ! !
! !1 ! ! . (2)
Here B and S are the estimated daily numbers of buy and sell orders, with trade
signs being estimated using Lee and Ready’s (1991) algorithm, and T is the number of
days in each estimation period (quarters in Brown’s calculation).
Previous studies, such as Easley et al. (2002), Vega (2006) and Yan and Zhang
(2006), are concerned about the possible situation in which corner solutions may lead to
biased PIN estimation. For example, Yan and Zhang (2006) illustrate a case in which PIN
has the correct estimation if is between 0 and 1. However, if equals 0, PIN becomes 0,
and if equals 1, PIN increases from 0.131 to as large as 0.801. Such problems require
special attention. Although the possible effect of corner solutions cannot be fully ruled
out, the negative impacts can be reduced by filtering out questionable extreme values in
the PIN data.

22
[Insert Table 3.1
PIN Data Distribution by Every 0.1]
As listed in Table 3.1, about 84% of PIN observations lie within the range 0.1-0.4.
The percentage of each category descends gradually as the range increases. However, the
range 0.9-1.0 contains fully 10 percent more observations than range 0.8-0.9.
[Insert Table 3.2
0.90-1.00 PIN Data Distribution by Every 0.01]
Table 3.2 further decomposes the range 0.9-1.0 by a finer partition of 0.01. It
turns out that most observations lie in the sub-range 0.99-1.00. If PIN equals 1, then for
the specific firm during the particular period, information events happen on every trading
day and uninformed traders’ arrival rate is zero. Although theoretically this possibility
cannot be fully ruled out, we believe that the unusually high number of PIN observations
close to 1 is a consequence of a parameter corner solution problem rather than a meas-
urement of extremely frequent information events.
[Insert Table 3.3
0.00-0.10 PIN Data Distribution by Every 0.01]
Similarly, the range 0.0-0.1 is further investigated. As shown in Table 3.3, there
exists an unusual number of observations in the sub-range 0.00-0.01, and theoretically it
means that almost no information event occurs for the specific firm during the particular
period. Although firms could choose to keep their financial status and operating activities
transparent enough to the public, we believe this is emblimatic of problematic parameter
estimations. Therefore, the suspicious PIN data in the ranges 0.00-0.01 and 0.99-1.00 are
excluded from further analysis to maintain a more precise estimation of the information
asymmetry on the capital market.
[Insert Figure 3.2
Plot of quarterly and annual PIN during 1993 and 2006]
Figure 3.2 shows how the quarterly mean and the annual mean of PIN behave
from 1993 to 2006. A downward trend is observed during the period, which means that
information asymmetry tends to become lower as time goes by. Such a trend could be the
result of introducing advanced communications technology, implementing new arbitrage
techniques, or changing trading habits of market participants such as an increased preva-

23
lence of day trading, etc. As in Figure 3.2, the trend seems to become steeper after 2001,
the year after Regulation FD is implemented. Although there could be other possible ex-
planations, it could be that the implementation of Regulation FD plays an important role
in the falling tendency of the information asymmetry level. Also, PIN displays a low
value every year in the first quarter, suggesting strong seasonality. In fact, when the Win-
ters Smoothing Method is applied, the null hypotheses that the seasonality parameter
equals zero and the trend parameter equals zero are strongly rejected.
3.1.2 The G Index
In this study, the balance of power in corporate governance is measured by the
Corporate Governance Index (G) constructed by Gompers et al. (2003). The original data
source is the Investor Responsibility Research Centre (IRRC). The IRRC generates a
non-exclusive list of corporate anti-takeover provisions for publicly listed firms every
two or three years in Corporate Takeover Defences (Rosenbaum 1990, 1993, 1995, 1998,
2000, 2002, 2004, 2006). According to Bebchuk et al. (2009, pg 796) “[i]n any given
year of publication, the firms in the IRRC volume accounted for more than 90% of the
total U.S. stock market capitalization”. The IRRC gathers its data from a variety of public
sources, for example, “corporate by-laws and charters, proxy statements, annual reports”
and “10-K and 10-Q documents filed with the SEC” (Gompers et al., 2003, pg 110).
[Insert Table 3.4
IRRC Corporate Governance Provisions]
Gompers et al. (2003) construct the G Index with the IRRC corporate governance
provisions. A list of the provisions is presented in Table 3.4. They generally limit share-
holder activism and increase managers’ ability to curtail shareholders activism, for exam-
ple, by allowing managers to defend a hostile takeover. The G index is constructed by
giving one point to a firm if the firm adopts a provision on the list. Only two of the
twenty-eight provisions are considered pro shareholders, namely Cumulative Voting and
Secret Ballot. For the two exceptions, points are added to firms that do not adopt the pro-
visions. Therefore, a higher G index is associated with more controlling power residing
with managers relative to shareholders, it is more difficult for shareholders to replace
managers, and corporate governance is weaker. In addition, both firm-level provisions
and state-level laws are listed by the IRRC, and some of them have the same core con-

24
cepts thus can be viewed as mutual substitutes. To address this overlapping problem, only
one point is given no matter whether the firm has only one of the provisions or both.
Hence the G index has a theoretical possible range from 0 to 24.
The G data is obtained from Yale University’s Professor Andrew Metrick’s per-
sonal webpage, and it contains 5,624 firms with 14,000 observations from 1990 to 2006.
The G data has two identifiers: company name and exchange ticker. We match it with the
CRSP database to associate each firm with a CRSP permanent number. To begin with, the
ticker symbol is used with the effective date of the exchange ticker data in CRSP and the
date in G data are matched as a supplement. After this step, 4,952 firms with 11,376 ob-
servations are matched, and 2,713 observations remain unsettled. We then manually
match the remaining firms. Our hand checking process is composed of three rounds. First,
firms with the same tickers but different ways of recording names in the two datasets are
picked out. Then, we examine full names of the firms recorded by abbreviated characters
in either data set and match them together. In the final round we exam the incorporation
states and company history of each firm including mergers, acquisitions, delisting, share
buy-backs, name changes, and so on. 13,847 observations in G dataset are matched with
the CRSP database totally. A list of the sample construction process on G is presented in
Figure 3.3.
Since the IRRC do not publish reports every year, the G data is only available for
the reporting years: 1990, 1993, 1995, 1998, 2000, 2002, 2004, and 2006. Following
Gompers et al. (2003), the gaps between reporting years are filled by assuming that the G
value for each firm is constant until the value is updated in the next report. Thus a firm’s
G value equals its previous reported value in non-reporting years. The G dataset is ex-
panded to 28,573 observations after this step. Next, we match the G dataset with the PIN
dataset which returns 21,251 firm-year observations. In particular, there are 16,993 ob-
servations for the event window 1995 to 2005.
[Insert Figure 3.3
Sample Construction Process of G and
Table 3.5
Summary Statistics of G by Reporting Year]
Table 3.5 presents the summary statistics of G for each reporting year. Following

25
Gompers et al. (2003), G is grouped into 3 subsets. Firms with values less than 6 are al-
located to the “Low” group, and firms with values above 13 are allocated to the “High”
group. The rest are allocated to the “Medium” group. The “Low” group contains 10.1%
of the entire sample, and the “High” group contains 5.01%. The mean and the median of
G remain constant between 1990 and 2006. The standard deviation of G becomes lower
through time. As in Table 3.5, both percentage of the “High” group and percentage of the
“Low” group drop continuously from 1990 to 2006, and the percentage of observations
with the median value of G, 9, grows. The distribution of G becomes more concentrated
through time.
In 1998 the IRRC expands its database by 28% with the inclusion of over three
hundred new firms. Most of these are small firms with extremely low G values. The
population mean drops more than 5 percent in 1998, mostly because the “Low” group
grows by 184 percent in that year. In their next report in 2000, the IRRC excludes many
of these firms.
3.2 Control Variables
3.2.1 Analysts Following
Previous literature has shown that coverage by financial analysts is one of the de-
terminants of market liquidity and information asymmetry. For example, Skinner (1990)
and Brennan et al. (1993) find that firms with a larger analysts’ coverage incorporate
news into price quickly, and Brennan and Subrahmanyam (1996) find that adverse selec-
tion cost is lower for firms with a higher analyst following. Specifically, Easley et al.
(1998) and Duarte et al. (2008) use PIN as a proxy for market information asymmetry
and find that PIN becomes lower with higher analysts coverage. Therefore, we consider
analysts’ following to be an important control variable for PIN.
The Annual Analysts Following Index (AAF) is gathered and converted from the
Institutional Brokers’ Estimate System (I/B/E/S) data. The I/B/E/S database contains
monthly recommendation data collected from analysts’ forecasting reports by Thomson
Reuters Inc. Our I/B/E/S monthly data has 12,925 firms with 867,848 observations, cov-
ering a period from November 1993 to December 2007. The primary identifiers for
I/B/E/S are I/B/E/S tickers, CUSIP numbers, stock exchange tickers, and company names
are also provided as secondary identifiers. We follow the Wharton Research Data Service

26
method to match I/B/E/S with the CRSP database. First, the two datasets are linked by
CUSIP numbers. Then, the unmatched data from the first round are linked by exchange
tickers and effective periods. 7,491 stocks with 637,351 observations are matched in total,
consisting 73% of the original I/B/E/S dataset. To be consistent with the other variables,
these monthly formatted data are converted into yearly format by taking the arithmetic
average of the 12 months each year. The output, AFF data set, contains 51,963 observa-
tions. After merging AAF with G and PIN by CRSP permanent number, 15,406 valid ob-
servations remain. A summary of the above mentioned sample construction process is
shown in Figure 3.4.
[Insert Figure 3.4
Main Regression Variables Construction Process]
3.2.2 Other Control Variables
Effects of many other control variables on PIN are also tested in previous litera-
ture. We consider some of them here in this thesis.
3.2.2.1 Market characteristics
Trading Volume. The impact of trading volume on PIN is tested by Easley et al. (1996)
and Dennis and Weston (2001). The data used in this thesis is from the CRSP database. It
is converted from monthly form to annual form by the same method as the analysts fol-
lowing data described in Section 3.2.1
Capitalization. Previous research tests the impact of market capitalization on PIN
(Brown et al., 2004 and Easley et al., 2002). Moreover, Mohanram and Rajgopal (2009)
find that PIN and firm size have a negative correlation. We get the annual year-end mar-
ket capitalization data from the CRSP database.
3.2.2.2 Institutional characteristics
Book-to-Market Ratio. The relationship between book-to-market ratio and PIN is tested
in Easley et al. (2002). They show that the book-to-market ratio is positively correlated
with PIN. Also, Gompers et al. (2003) test the relationship between G and
book-to-market ratio and they find a positive correlation. Data of annual book value per
share is obtained from Compustat, and year-end market price is collected from CRSP.
They are matched by the initial eight digits of CUSIP identifiers.

27
Institutional Ownership. Previous research, such as Brown et al. (2004) and Dennis and
Weston (2001), also examine the impact of institutional ownership on PIN. We use the
block holder data obtained from Andrew Metrick’s personal webpage. Metrick provides
block holders’ data from 1996 to 2001 based on IRRC survey data. The sample of the
block holder data includes S&P 500 stocks as well as large firms frequently mentioned in
business journals. The “Sumblks” variable, which is the percentage held by all block
holders for that firm-year, is used in our research as a proxy for institutional ownership.
To fit Metrick’s data into our event window period, the block holder value in 1995 is as-
sumed the same as in 1996, and block holder values from 2002 to 2005 are assumed un-
changed since 2001.11
There are 5,285 observations in the merged dataset for regression analysis. A list
of regression variables and detailed definitions are presented in Table 3.6. The summary
sample statistics of each variable and their correlations are presented in Tables 3.7 and
3.8.
[Insert Table 3.6
Definitions of Regression Variables,
Table 3.7
Summary Statistics of Regression Variables
Table 3.8
Pearson Correlation Coefficients of Regression Variables and
Table 3.9
Pearson Correlation Coefficients of Regression Variables on Regulation FD]
Table 3.8 reports the results of Pearson correlation coefficients the correlations
among PIN, G and the control variables. Information asymmetry level is negatively asso-
ciated with corporate governance, the annual average analysts’ following number, market
capitalization and trading volume, and it is positively associated with the book-to-market
value and institutional ownership. It suggests that for strongly governed firms, the level
of information asymmetry is relatively low, while for weakly governed firms, the infor-
mation asymmetry level is relatively high. The correlations between AAF and Capitaliza-
11 The mean of Sumblks grows inconstantly from 21.65 to 25.01 between 1996 and 2001, but without fur-ther guidance, we assume it remains constant thereafter.

28
tion, AAF and Volume, and Capitalization and Volume are relatively high with values at
0.422, 0.481 and 0.522. Since high correlation between independent variables could pos-
sibly lead to multicollinearity problems, when running the full regressions these three
variables are carefully examined by dropping each of them at a time to see how the coef-
ficients of the other variables change. It is shown that dropping any of the three variables
do not lead to substantial changes in the full regression results. The baseline regressions
also help to explain this issue.
A comparison of the correlation coefficients for the main regression variables be-
fore and after Regulation FD is included in Table 3.9. The time horizon is between 1995
and 2005. The years 1995 to 1999 are recognized as pre-Regulation FD, and the years
2001 to 2005 are recognized as post-Regulation FD. The implementation year 2000 is
excluded from the correlation analysis. Fisher’s Z Transformation is used to examine
whether significant differences exist between the correlation coefficients. A notable result
in Panel A is that the correlation value between PIN and G decreases by 49% after Regu-
lation FD, which is significant at the 5% level, suggesting that the corporate govern-
ance-information asymmetry relationship is less reliable when there is a restriction on
selective disclosure.

29
CHAPTER IV
HYPOTHESES AND METHODOLOGY
4.1 Hypotheses
With respect to the interaction between information asymmetry and firm’s corpo-
rate governance, we derive the following related questions.
Does the balance of power between shareholders and mangers influence the level of
information asymmetry? If so, then how does it influence? To what degree and
through what path? Are the patterns the same for different levels of corporate gov-
ernance?
Is the relationship between corporate governance and information asymmetry af-
fected by changes in the disclosure method? Does Regulation FD achieve its desired
goal to force firms to publicly disclose the information which was selectively dis-
closed prior to the regulation?
4.1.1 Corporate Governance, Disclosure, and Information Asymmetry
A firm’s disclosure policy is designed to fulfill its development needs. These
needs are unique for each individual firm. They are different across industries and across
firms in different developing phases, and vary with the firm’s commitment to its inves-
tors.12 When new information arrives that is not mandated to be disclosed by regulations,
the optimal disclosure policy indicates whether the information should be disclosed, and
managers ultimately decide whether and through which channel, public or selective, the
information should be issued. However, to what degree the manager can make choices
which reflect her personal interest is determined by the firm’s corporate governance. This
firm-level disclosure decision process is outlined in Figure 4.1.
[Insert Figure 4.1
Disclosure Decision Process]
As we discussed in Chapter II, a firm’s disclosure method, or information struc-
ture, has a significant effect on the level of information asymmetry among investors.
Public disclosure delivers the firm’s financial status and operating activities to all inves-
12 See Core (2001) for a detailed discussion about the literature on this topic.

30
tors thus reducing information asymmetry, and selective disclosure delivers such infor-
mation to particular groups and thus increases information asymmetry. For our informa-
tion asymmetry measurement proxy PIN, public disclosure decreases the probability of a
private information event α, thus PIN decreases; while selective disclosure decreases α
and PIN increases. The path through which corporate governance affects market informa-
tion asymmetry level is shown in Figure 4.2.
[Insert Figure 4.2
Information Impact Path]
Our theory suggests that the disclosure channel is the intermediary through which
corporate governance affects market behaviour, and we clearly describe the path through
which corporate governance affects a firm’s voluntary disclosure method.13 Also, we test
the relative impact of public and selective disclosure on information asymmetry simulta-
neously. To our knowledge, there is no previous work that clearly examines these points.
Hypothesis 1a: (Untestable in our framework) Firms with better corporate governance
(i.e. more shareholder power) use more public and fewer selective disclosure methods.
Hypothesis 1b: (Testable) Firms with better corporate governance have less information
asymmetry in the capital market.
Hypothesis 1c: (Testable) There is a threshold level of corporate governance beyond
which improved corporate governance has little influence on the disclosure method and
the level of information asymmetry. In particular, the corporate governance-information
asymmetry relationship is more pronounced for poorly governed firms.
4.1.2 Regulation FD and Disclosure Method
Regulation FD aims to stop the practice of selective disclosure to develop a sound
and efficient capital market. All information needs to go public once a selective disclo-
sure is made. Therefore, Regulation FD can be viewed as an external force that alters a
corporation’s disclosure method. The function of the regulation on disclosure and its
connection with corporate governance and information asymmetry is shown in Figure
4.3.
13 Masulis et al. (2007) examine how governance provisions affect shareholder wealth through the invest-ment choice channel.

31
[Insert Figure 4.3
Internal and External Forces on Disclosure Structure]
The effectiveness of Regulation FD is of great importance to both policy makers
and other stakeholders. As we discussed in Chapter II, previous research examines the
regulation through several different approaches, including market behaviour, analysts’
reactions, information asymmetry proxies, and firm reactions. While the first three ap-
proaches analyze market outcomes, some studies using the last approach focus directly
on the change in disclosure method. However, because whether certain news was to be
selectively disclosed or publicly disclosed cannot be distinguished without Regulation FD,
there is no established way to directly measure the change of disclosure method affected
by the regulation. So far, most studies using this approach focus on investigating the
change on the quantities of public disclosure as a substitute.14 Our research tests Regula-
tion FD from a different aspect. Because the disclosure method is unobservable, and it
plays a crucial function in the connection illustrated in Figure 4.3, we test the relationship
between corporate governance and information asymmetry instead, and then we examine
the impact of Regulation FD on this relationship. If corporate governance stands as an
internal force affecting the disclosure method and the regulation stands as an external
force, then how these two forces interact to form the disclosure method and further affect
information asymmetry in the capital market is of great interest to academics and practi-
tioners.
Hypothesis 2a: Regulation FD, as an external force on disclosure method reduces the ef-
fect of corporate governance on information asymmetry.
Hypothesis 2b: The impact of Regulation FD on the corporate governance-asymmetry
relationship is more pronounced for poorly governed firms.
4.2 Methodology
Our main model tests the influence of corporate governance on the level of in-
formation asymmetry, controlling for firm-level variables that also affect the level of in-
formation asymmetry.
14 These studies include Straser (2002), Heflin et al. (2003) and Bailey et al. (2003).

32
, , (3)
Our proxy for information asymmetry is PIN, and corporate governance is meas-
ured by the G index. Control variables are collected from the factors shown to have sig-
nificant impact on PIN in previous literature, including analyst following, market charac-
teristics, and institutional characteristics. Considering that PIN has a downward trend
over time, a year dummy variable is also included. Firm level annual data is used in the
regression.
4.2.1 The Basic Model
Hypothesis 1b in Section 4.1.1 is tested by the basic models in Equations 4 and 5:
, , , , (4)
, , , , . (5)
Equation 4 tests the simple relationship between PIN and G, while in Equation 5
other factors affecting PIN are applied as control variables. The Ordinary Least Squares
method is applied to the regression.
4.2.2 Different Corporate Governance Levels
To see whether different levels of corporate governance have different relation-
ships between PIN and G, we test separately the regressions in Equation 4 for the “High”,
“Medium” and “Low” groups described in Chapter III. Two group dummy variables are
applied to detect whether there exist any significant differences among the coefficients α
and the coefficients 1 in the three independent regressions. Both dummy on intercept
and dummy on slope are tested in Equations 6 and 7:
, , , , , , , ,, , (6)
, , , , , , , ,, , . (7)
The dummy variable equals to 1 for all firms that fall in the category of the
“High” group, and zero otherwise. Similarly, the dummy variable equals to 1 for all

33
firms in the category of “Low” group, and zero otherwise. The parameters α2 and α3 test
the difference in the intercept terms in Equation 6 and 7 between the “High” group and
the “Medium” group and the “Low” group and the “Medium” group respectively. The
coefficients 2 and 3 test similar differences in the slopes of G.
4.2.3 The Effect of Regulation FD
Using eleven years of data around Regulation FD, the approach we employ is a
long-term event study. As argued by Agrawal et al. (2006), it takes time for financial
analysts and firms to adjust to the regulation. Likewise, the impact of governance provi-
sions on information asymmetry could take a long time to take effect. Gompers et al.
(2003, pg 108) claim that the ordinary short term “event-study methodology cannot iden-
tify the impact of governance provisions” and suggest a long-term approach instead.
To see if Regulation FD alters the way corporate governance affects information
asymmetry, we separate the data into two groups. The 5 years data before Regulation FD,
from 1995 to 1999, is assigned to the “Before” group, and the 5 years data after Regula-
tion FD, from 2001 to 2005, is assigned to the “After” group. Separate regressions under
Equation 4 are taken for each group to obtain separate coefficients, and a dummy variable
is used to test if the two groups of coefficients are identical in Equations 8 and 9:
, , , , , , , (8)
, , , , ,
, , . (9)
The dummy variable equals 1 for all the firms in the “After” group, and zero
otherwise. The parameter α2 measures the difference on intercept before and after Regu-
lation FD, and the parameter 2 measures the difference on slope of G before and after
the regulation.

34
CHAPTER V
EMPIRICAL EVIDENCE AND ROBUSTNESS CHECKS
5.1 Empirical Evidence
5.1.1 Initial Regressions
In this thesis we test the joint relationship among corporate governance, voluntary
disclosure method, and information asymmetry. Because the method of voluntary disclo-
sure is unobservable, we examine the relationship between corporate governance and in-
formation asymmetry directly. Our basic regression tests the simple relationship between
the proxies of corporate governance and of information asymmetry, namely the G index
and PIN. The long-term downward trend of PIN is controlled by a year variable.15 Given
the fact that there exist many other factors affecting the market information asymmetry
level, three sets of control variables are also considered. In the baseline regression, the
key control variable, annual average analysts following, is included. And in the full re-
gression, a set of market characteristics variables and a set of institutional characteristics
variables are included as well. Regression results and important parameters of the three
regressions are presented in Table 5.1.1.
[Insert Table 5.1.1
Regressions Analysis of Corporate Governance and Information Asymmetry]
The results for the basic regressions suggest that G has a negative impact on PIN,
with a coefficient of -0.002, which means that for one unit increase in G there is 0.2%
unit decrease in PIN. While this coefficient is statistically significant, it does not seem to
be economically significant. The regression explains 4.7% of PIN. The negative coeffi-
cient suggests that for firms in which managers have less power, the information asym-
metry level is higher. This result contradicts Hypothesis 1b; however, one explanation for
this could be due to a non-linear relationship between PIN and G. If G is low enough,
there may be little or no reduction to PIN for any further decrease in G. This motivates us
to re-examine the relationship for the High, Medium, and Low G subsamples.
There are several other possible explanations for this result. The first explanation
15 Year dummies are also tested as a substitute for the year trend variable. Similar results are reported in Table 5.1.5.

35
comes from the corporate control contest hypothesis described in Chapter II. Managers in
firms with fewer anti-takeover provisions face more risk of losing job, so they use selec-
tive disclosure to explain poor performance, and thus decrease the likelihood of job lose.
Another explanation is the management talent signal hypothesis in Chapter II. Less pow-
erful managers face more risk of being replaced, thus they have more incentive to dis-
close through a selective channel to potential employers to distinguish themselves from
their competitors. A third explanation involves the conflict of interest between large
shareholders and small shareholders. As discussed by Shleifer and Vishny (1997), firms
that have a dominant (non-managing) shareholder usually have fewer pro-manager provi-
sions, so managers of such firms have less power. Furthermore, in this case large share-
holders may pressure managers to disclose information to them at the expense of minor-
ity shareholders.16
The significance level and signs of the G coefficients do not change between the
baseline regression and the full regression, and the adjusted R squared statistic increases
dramatically to 0.249 with the inclusion of analysts following.
5.1.2 Group Difference
The corporate governance for firms with high G should have more impact on in-
formation asymmetry than the corporate governance for low G firms, because poorly
governed firms may tend to have more private information events, while for firms with
adequate governance, information asymmetry may not be sensitive to changes in gov-
ernance. As discussed in Chapter III, we follow Gompers et al. (2003) in constructing our
G-based subsamples. The “High” group contains firms with G over 13; the “Low” group
contains firms with G less than 6, and the rest are included in the “Medium” group. Table
5.1.2 shows the regression results for each of the three groups.
[Insert Table 5.1.2
Group Analysis on Corporate Governance and Information Asymmetry]
The results for the basic regressions are presented in Panel A. Consistent with our
hypothesis, the “High” group has a positive and significant coefficient β of G, and the
coefficient of G for the “Low” group is not significantly different from zero. Also, the 16 However, Reza and Wilson (2007) find that Canadian family-controlled firms tend to have a lower PIN, which seems to contradict this theory.

36
adjusted R-squared statistic for the “High” group is higher than that for the “Low” group,
which means that corporate governance explains more information asymmetry for more
powerful managers firms. The above evidence suggests that for firms with strong corpo-
rate governance (low G), manager’s power may not be an important factor in the disclo-
sure method decision process (at least for small changes); while for firms with weak cor-
porate governance (high G), the power of managers is likely to be an important concern
in determining its disclosure method. Not surprisingly because of their large proportion,
the medium G firms are not substantially different from the full sample.
One of the notable results in Table 5.1.2 is that the sign of the G coefficient for the
“High” group is positive, and at over 1% per unit G, it is also economically significant,
unlike our basic regression results for the whole population in Table 5.1.1. The positive
sign suggests that for these weakly governed firms, information asymmetry level grows
with the power of mangers. This finding is consistent with our theory that more powerful
managers have greater influence on disclosure choices, thus more information is dis-
closed selectively, which leads to higher information asymmetry. Moreover, the differ-
ence in G coefficients between the “High” group and the other two groups is significant,
while the difference between the “Low” group and the rest is not significant. The G coef-
ficient of the “High” group is significantly higher than the coefficient of the other two
groups. It suggests that the “High” group firms behave differently from ordinary firms in
that the impact of corporate governance on information asymmetry is significantly larger
than the other two groups. Evidence from the baseline regression and the full regression
reported in Panel B and Panel C further confirms this finding. The group dummies,
measuring differences between the “High” firms and the other firms, are significant at 1%
level and 5% level for the baseline regression and the full regression respectively. And
the group dummies measuring the differences between the “Low” firms and the rest are
not significant. The above finding is illustrated in Figure 5.1.
[Insert Figure 5.1
Analysis on Information Asymmetry by Different Governance Level]
5.1.3 The Influence of Regulation FD
If our theory is true, then the change of disclosure method should alter the degree
of impact that corporate governance has on information asymmetry. As Regulation FD

37
acts on the disclosure method directly, an event study on the regulation is applied as an-
other assessment of the theory. The regression results for the event study are presented in
Table 5.1.3.
[Insert Table 5.1.3
Event Study Analysis on Corporate Governance and Information Asymmetry]
After the implementation of Regulation FD, the significance levels of the G coef-
ficient estimations do not change, but the coefficients of G decrease. Tested by an event
dummy variable, the decrease is significant at 1% level. The above evidence suggests that
Regulation FD significantly changes the corporate governance-information asymmetry
relationship, which implies that firms’ disclosure method could be the channel in the rela-
tionship.
5.1.4 Influence of Regulation FD on Different Groups
As discussed in Section 5.1.2, for the “High” group, corporate governance has a
strong and significant on information asymmetry, while for the “Low” group, it shows no
significant evidence of such a relationship. In fact, the evidence from Panel C of Table
5.1.2 shows that while for the “High” firms, G is one of the most influential factors on
PIN, for the “Low” firms PIN is more likely to be determined by the control variables. In
this section, we examine whether the relationship between G and PIN for the sub-groups
is changed with the implementation of Regulation FD. Regression results are presented in
Table 5.1.4.
[Insert Table 5.1.4
Event Study Analysis on Group Differences]
Panels A, B and C provide regression results for the High, Low and Medium
groups respectively. In Panel A, the coefficient of G on PIN is positive and significant
before the implementation of Regulation FD, while the coefficient after Regulation FD is
not significant. The decrease of coefficient values, tested by an event dummy variable, is
significant at the 1% level. In Panel B, neither of the G coefficients before or after the
regulation is significant, and the difference is not significant either. And in Panel C, the G
coefficient for the full regression is not significant before the regulation, but it becomes
negative and significant later. To sum up, for all three groups, the values of G coefficients
decrease with the implementation of Regulation FD. This evidence suggests that the im-

38
pact of corporate governance on information asymmetry is reduced by the new rule on
disclosure methods. The evidence also suggests that the impact of Regulation FD is more
pronounced for high G firms. A possible explanation could be that before the regulation,
powerful managers selectively disclosed information thus increased the information
asymmetry level on the capital market. Meanwhile, less powerful managers publically
disclosed information following the firms’ optimal disclosure policy, and had little impact
on the level of information asymmetry. Regulation FD forces managers to publicly dis-
close all information once any selective disclosure is made. As a result, after the regula-
tion, powerful managers are less able to alter their disclosure method for personal interest,
and thus their impact on the level of information asymmetry decreases.
Another notable result in Table 5.1.4 is that in Panel A the coefficient of AAF is
not significant before Regulation FD, but it becomes significant after the regulation,
while in Panel B and Panel C both the AAF coefficients are significantly different from
zero. This evidence suggests that analysts’ following becomes one of the main factors
determining information asymmetry level after Regulation FD along with the decreased
impact of corporate governance. The change suggests that Regulation FD successfully
reforms firms’ disclosure method and it helps to reduce information asymmetry, particu-
larly for those firms with the weakest corporate governance.
5.1.5 Discussion
The evidence presented in the earlier sections in this chapter suggests that corpo-
rate governance is a factor influencing the level of information asymmetry in the capital
market. One reason for this association may be because of an intermediary link with the
method of voluntary disclosure. Although our findings are consistent with this theory in
the sense that improvements in corporate governance could tend to reduce selective dis-
closure, particularly for those firms having the worst corporate governance, which could
in turn tend to reduce the level of information asymmetry, they are not conclusive evi-
dence of this theory, because we lack a measure for selective (vs. public) disclosure.
Therefore, we can only provide circumstantial evidence supporting Core’s (2001) and
Holland’s (1998) hypotheses.
This finding is further supported by observing the change in the relationship be-
tween corporate governance and information asymmetry following the implementation of

39
Regulation FD. If selective voluntary disclosure is the principle channel through which
corporate governance is related to information asymmetry, then the regulation is likely to
have the most significant effect (in terms of a reduction in the strength of this relationship)
on those firms having the worst corporate governance. Therefore, this finding also pro-
vides circumstantial evidence for Core’s (2001) and Holland’s (1998) hypotheses.
5.2 Robustness Checks
Our work in this thesis is subject to various constraints. Four of the most important
concerns are tested in this chapter as robustness checks for our hypotheses.
5.2.1 The Distribution of PIN
Figure 5.2 presents the density histogram of PIN. Compared to a normal distribu-
tion, the PIN data histogram is right-skewed and it has fat tail. To mitigate the impact of
PIN’s distribution on regression results, a logistic transformation of PIN is also tested as a
robustness check. The transformation is LOGPIN Log PIN1 PIN . (10)
As shown in Figure 5.3, the logistically transformed PIN data fits the normal distribution
better than the original PIN data. The regression results of G on LOGPIN are presented in
Tables 5.2.1.1, 5.2.1.2, 5.2.1.3 and 5.2.1.4.
[Insert Figure 5.2 and 5.3, Table 5.2.1.1, 5.2.1.2, 5.2.1.3 and 5.2.1.4]
The evidence from these regressions on LOGPIN is similar to our main regression
results. In Table 5.2.1.1, the parameter of G is negative and significant. In Table 5.2.1.2,
the “High” group’s G parameter is positive and significant, while the G parameter for the
“Low” group is not significantly different from zero. The difference between the “High”
group and the “Medium” and “Low” groups is significant except in the full regressions,
while the difference between the “Low” group and the rest is not significant. In Table
5.2.1.3, both the “Before” group and the “After” group have negative and significant G
coefficients, and the difference between them is significant. In Table 5.2.1.4, the “High”
group has a significant decrease in the G coefficient before and after Regulation FD, and
the difference for the “Low” group is also significant. This evidence suggests that the in-
ternal relationship proved by our empirical model is robust to the distribution of the in-
40
formation asymmetry proxy.
5.2.2 The Entrenchment Index
As discussed in Chapter IV, the G index is constructed by giving one point to the
firm with each of the corporate governance provisions reported by the IRRC. Although
Gompers et al. (2003) find that G is significantly associated with the net profit margin
and return, Bebchuk et al. (2009) argue that the G index is a noisy measurement of firm
value. Bebchuk et al. construct an entrenchment index (E) using 6 of the most discussed
provisions: classified board, bylaw amendment limitations, charter amendment limita-
tions, supermajority, golden parachutes, and poison pill. They show that the E index is
more relevant to stock return and firm value than the other 18 provisions. Later research-
ers, such as Masulis et al. (2007), take both G and E Index into consideration. Masulis et
al. show that both indices are significantly related to acquisition returns.
The E Index is tested here as a robustness check for our empirical evidence. Ta-
bles 5.2.2.1, 5.2.2.2 and 5.2.2.3 list the regressions results of E on PIN. As in Table
5.2.2.1, the association of corporate governance and information asymmetry is negative
and significant. Table 5.2.2.3 examines the difference on E coefficient before and after
Regulation FD. The change for both basic and baseline regressions are not significant. To
further test the relationship between PIN and E, we group the E index data by the number
of provisions. Firms with E lower than 2 is allocated to the “Low” group, and firms with
E higher than 3 is allocated to the “High” group. In Table 5.2.2.2 it turns out that there is
no significant difference on the PIN and E relation between these two groups. Also, the
adjusted R-Squared statistics in Table 5.2.2.1 are lower than the corresponding ones in
Table 5.1.1. One possible reason could be that the E Index does not carry as much impor-
tant information on the disclosure method, although it might contain important informa-
tion on firm value and return. It is likely that all 24 provisions are valuable determinants
about the balance of power between shareholders and managers.
[Insert Table 5.2.2.1, 5.2.2.2 and 5.2.2.3]
5.2.3 The Unbalanced G Sample
The IRRC follows the S&P 500 Index as well as some of the large corporations
frequently mentioned by business journals on each report. Therefore, each IRRC report
covers different sample firms, and the G index contains unbalanced samples. As we dis-

41
cussed in Chapter III, the IRRC database grows by 24.9% in 1998 compared to the prior
record year 1995. Such a growth causes the population mean to drop from 9.3 in 1995 to
8.8 in 1998 by about 5%. In 2000, most of these firms were discarded from the data base
and the mean of population climbs back to 9.0.
To rule out the effect of an unstable sample, we test firms remaining in the G in-
dex throughout the five record years during each event window as a robustness check. We
consider firms with unchanged CRSP permanent number to be one firm, regardless name
changes, ticker changes, acquirers and mergers. There are 741 such firms in our sample
set. Table 5.2.3.1 presents summary statistics of this subset.
[Insert Table 5.2.3.1
Summary Statistics of G for Firms Staying in IRRC]
The sample mean and medium gradually increase from 1995 to 2005, and more
firms move from low G to high G. The percentage of firms with G less than 6 gradually
decreases, while the percentage of firms with G over 13 increases. This finding is differ-
ent from that in Table 3.5 which presents the summary statistics of the whole G popula-
tion. In Table 3.5, both the “Low” group and the “High” group become smaller and
smaller as time goes by, and the moving tendency is toward the population median, while
in Table 5.2.3.1 the trend of the samples is towards the “High” group. Another distinct
difference is that in Table 3.5, there are more samples in the “Low” group than in the
“High” group for the whole G population, while in Table 5.2.3.1 the number of firms in
the “High” group outweighs the “Low” group. Such distributional differences could af-
fect the relationship between PIN and G.
As we discussed earlier in this chapter, managers have more power on the deci-
sion of disclosure choices in high G firms. Therefore we expect to see a stronger link
between G and PIN with the selected subsample. Regression results for this subsample
are presented in Tables 5.2.3.2, 5.2.3.3, 5.2.3.4 and 5.2.3.5.
[Insert Table 5.2.3.2, 5.2.3.3, 5.2.3.4 and 5.2.3.5]
The evidence in Table 3.2 confirms the negative and significant relationship be-
tween G and PIN. The adjusted R-squared statistic is higher than the one in Table 5.1.1,
which is consistent with our hypothesis that for high G firms, corporate governance mat-
ters more in disclosure method. Table 3.3 confirms the significant difference between the

42
“High” group and the others, and the insignificant difference between the “Low” group
and the others. Table 3.4 confirms the significant change with the implementation of
Regulation FD. Table 3.5 confirms our hypothesis that Regulation FD affects disclosure
method by eliminating external factors. To sum up, our empirical evidence is not subject
to the unbalanced sample selections.
5.2.4 The Double Counting Trading Volume in NASDAQ Market
The NASDAQ market is well-known for overstating trading volume. Since it is
mostly a dealer market, many trades are double-counted, which leads to the boosting of
trading volume. The NASDAQ trading volume is also boosted by frequent inter-dealer
transactions in which trades occur between dealers only. As shown in Atkins and Dyl
(1997), such activities severely boost NASDAQ trading volume by up to 50%.
Aware of this situation, in 1998 the National Association of Securities Dealers
(NASD) proposed the Riskless Principal Trade Reporting (RPTR) Rule, which was im-
plemented in February 2001. The Rules intend to prevent dealers from actual trades in
matching asks and bids, thus protect dealers from potential loss, and eliminate the dou-
ble-counting. These rules, along with the emerging of Electronic Communication Net-
work (ECN) trading, help to reduce the degree of overstating trading volume in
NASDAQ market. As tested in Anderson and Dyl (2005), the median of NASDAQ trad-
ing volume dropped by 38% since RPTR. By 2006, about 75% of NASDAQ trades are
through ECN. (Anderson and Dyl, 2007).
The double-counting trading volume can affect our research in three ways: (1) the
analysis of PIN during Regulation FD, as the implementation of RPTR is in the same pe-
riod; (2) trading volume as a control variable when analyzing PIN on G, since we con-
sider trading volume as a combination of NYSE and NASDAQ markets; and (3) PIN it-
self is sensitive to volume since it is constructed based on the estimated buyer and seller
arrival rates.
To rule out the effect of the double counting problem, we test a sample set of
only NYSE firms as a robustness check. Separate summary statistics of PIN and G on the
NYSE, NASDAQ and AMEX markets are presented in Table 5.2.4.1.
[Insert Table 5.2.4.1
Summary Statistics of PIN and G on NYSE, NASDAQ and AMEX]

43
As shown in Table 5.2.4.1., the 12,654 observations in NYSE market have a
higher mean G index (9.571 compared to 8.178 and 8.346) and a lower mean of PIN
(0.143 compared to 0.193 and 0.175) than the 8,513 observations on the other two mar-
kets. As in Section 5.2.3, we hypothesize that NYSE having a high G will have a strong
relationship between PIN and G. This hypothesis is confirmed in Table 5.2.4.2. The coef-
ficient of G is negative and significant, and the adjusted R-squared statistic is 360 percent
higher than that in Table 5.1.1 for the whole population. The change from Regulation FD
is presented in Table 5.2.4.3. The regulation has a significant impact on NYSE stocks.
The group difference from Regulation FD is presented in Tables 5.2.4.4 and 5.2.4.5, with
the same findings as our main regression results in Section 5.1.
[Insert Table 5.2.4.2, 5.2.4.3, 5.2.4.4 and 5.2.4.5]

44
CHAPTER VI
CONCLUSION
Voluntary disclosure is a channel through which corporate information is passed
on to the capital market. The decision to voluntarily disclose information is determined
by corporate controllers. Moreover, corporate controllers also determine whether volun-
tarily disclosing information will be done through public or selective means. Therefore,
the balance of power between managers and shareholders and the level of managerial en-
trenchment could have a substantial effect on not only what information is disclosed, but
also how it is disclosed. For example, a powerful manager may experience fewer restric-
tions in the use of selective, rather than public, information disclosure, and such manag-
ers are likely to disclose in a self-serving manner. Managers with a moderate level power
may use selective disclosure to avoid job loss. The role of disclosure method as the con-
nection between corporate governance and information asymmetry is consistent with the
results of our event study on Regulation FD. The regulation seems to successfully alter
firms’ disclosure method, and reduces the strong impact of governance changes on in-
formation asymmetry for weakly governed firms.
Our research is subject to several of limitations. First, we do not test the causality
of corporate governance and information asymmetry level. We cannot rule out the possi-
bility that asymmetric information in the capital market can inversely affect the approval
of new governance provisions or the submission of opposing resolutions. Second, the
original source of the G data and the block holder data is the IRRC, which covers only
S&P 500 and other large firms. Therefore, it is possible that our data set excludes small
firms and experiences a large firm bias. Thus caution is needed when extrapolating the
conclusions to small firms.
There remain several untested questions in this thesis. First, different effects from
the components of the corporate governance index on disclosure method and information
asymmetry can be further examined, and other proxies for corporate governance can be
tested. Second, other market characteristics associated with disclosure methods, such as
bid-ask spread, information credibility and analysts forecast accuracy, can be tested. In-
dustrial differences may also affect the relationship. We leave these questions for future
research.
45
REFERENCES
Admati, Anat R. 1985. A noisy rational expectations equilibrium for multi-asset securities
markets. Econometrica 53 (3), 629-657.
Agrawal, Anup, Sahiba Chadha, and Mark A. Chen. 2006. Who is afraid of Reg FD? The
behaviour and performance of sell-side analysts following the SEC's fair disclosure
rules. The Journal of Business 79 (6), 2811-2834.
Ahmed, Anwer S., and Richard A. Schneible Jr. 2007. The impact of Regulation Fair
Disclosure on investors' prior information quality - evidence from an analysis of
changes in trading volume and stock price reactions to earnings announcements
Journal of Corporate Finance 13 (2-3), 282-299.
Akerlof, George A. 1970. The market for "lemons": Quality uncertainty and the market
mechanism. The Quarterly Journal of Economics 84 (3), 488-500.
Anderson, Anne M., and Edward A. Dyl. 2007. Trading volume: NASDAQ and the
NYSE. Financial Analysts Journal 63 (3), 79-86.
Anderson, Anne M., and Edward A. Dyl. 2005. Market structure and trading volume. The
Journal of Financial Research 28 (1), 115-131.
Arya, Anil, Jonathan Glover, Brian Mittendorf, and Ganapathi Narayanamoorthy. 2005.
Unintended consequences of regulating disclosures: The case of Regulation Fair
Disclosure. Journal of Accounting and Public Policy 24 (3), 243-252.
Atkins, A. B., and E. A. Dyl. 1997. Market structure and reported trading volume:
NASDAQ versus the NYSE. The Journal of Financial Research 20 (3), 291-304.
Bailey, Warren, Haitao Li, Connie X. Mao, and Rui Zhong. 2003. Regulation Fair Dis-
closure and earnings information, Market, analyst, and corporate responses. The
Journal of Finance 58 (6), 2487-2514.
Barry, Christopher B., and Stephen J. Brown. 1985. Differential information and security
market equilibrium. The Journal of Financial and Quantitative Analysis 20 (4),
407-422.
Bebchuk, Lucian, Alma Cohen, and Allen Ferrell. 2009. What matters in corporate gov-
ernance? Review of Financial Studies 22 (2), 783-827.

46
Bethel, Jennifer E. 2007. Recent changes in disclosure regulation: Description and evi-
dence. Journal of Corporate Finance 13 (2-3), 335-342.
Ben Ali, C., Trabelsi, S. and Summa, M. 2007. Disclosure Quality and Ownership Struc-
ture: Evidence from the French Stock Market. Corporate Ownership and Control 5
(2).
Botosan, Christine A., and Marlene A. Plumlee. 2002. A re-examination of disclosure
level and the expected cost of equity capital. Journal of Accounting Research 40 (1),
21-40.
Bowen, Robert M., Angela K. Davis, and Dawn A. Matsumoto. 2002. Do conference
calls affect analysts' forecasts? The Accounting Review 77 (2), 285-316.
Brennan, Michael J., Narasimhan Jegadeesh, and Bhaskaran Swaminathan. 1993. In-
vestment analysis and the adjustment of stock prices to common information. The
Review of Financial Studies 6 (4), 799-824.
Brennan, Michael J., and Avanidhar Subrahmanyam. 1996. Market microstructure and
asset pricing: On the compensation for illiquidity in stock returns. Journal of Finan-
cial Economics 41 (3), 441-464.
Brown, Stephen, Stephen A. Hillegeist, and Kin Lo. 2004. Conference calls and informa-
tion asymmetry. Journal of Accounting and Economics 37 (3), 343-366.
Bushee, Brian J., Dawn A. Matsumoto, and Gregory S. Miller. 2004. Managerial and in-
vestor responses to disclosure regulation: The case of Reg FD and conference calls.
The Accounting Review 79 (3), 617-643.
Chiyachantana, Chiraphol N., Christine X. Jiang, Nareerat Taechapirrontong, and Robert
A. Wood. 2004. The impact of Regulation Fair Disclosure on information asymmetry
and trading: An intraday analysis. Financial Review 39 (4), 549-577.
Collier, Paul. 1993. Factors affecting the formation of audit committees in major UK
listed companies. Accounting and Business Research 23 (91A), 421-430.
Collver, Charles D. 2007. Is there less informed trading after Regulation Fair Disclosure?
Journal of Corporate Finance 13 (2-3), 270-281.
Core, John E. 2001. A review of the empirical disclosure literature: Discussion. Journal
of Accounting and Economics 31 (1-3), 441-456.

47
Debreceny, R., Chandra, A., Cheh, J., Janvrin, D., Trabelsi, S., Trites, G. and Vasarhelyi,
M. 2005. Financial Reporting in XBRL on the SEC’s EDGAR System: A Critique
and Evaluation. Journal of Information Systems 19 (2), 191-210.
Dennis, Patrick J., and James P. Weston. 2001. Who's informed? An analysis of stock
ownership and informed trading. Working paper. University of Virginia and Rice
University.
Diamond, Douglas W. 1985. Optimal release of information by firms. The Journal of Fi-
nance 40 (4), 1071-1094.
Diamond, Douglas W., and Robert E. Verrecchia. 1991. Disclosure, liquidity, and the cost
of capital. The Journal of Finance 46 (4), 1325-1359.
Dow, James, and Gary Gorton. 1995. Profitable informed trading in a simple general
equilibrium model of asset pricing. Journal of Economic Theory 67 (2), 327-369.
Duarte, Jefferson, Xi Han, Jarrad Harford, and Lance Young. 2008. Information asymme-
try, information dissemination and the effect of Regulation FD on the cost of capital.
Journal of Financial Economics 87 (1), 24-44.
Duarte, Jefferson, and Lance Young. 2009. Why is PIN priced? Journal of Financial
Economics 91 (2), 119-138.
Easley, David, Soeren Hvidkjaer, and Maureen O'Hara. 2002. Is information risk a de-
terminant of asset returns? The Journal of Finance 57 (5), 2185-2221.
Easley, David, Nicholas M. Kiefer, Maureen O'Hara, and Joseph B. Paperman. 1996. Li-
quidity, information, and infrequently traded stocks. The Journal of Finance 51 (4),
1405-1436.
Easley, David, and Maureen O’Hara. 2004. Information and the cost of capital. The
Journal of Finance 59 (4), 1553-1583.
Easley, David, Maureen O'Hara, and Joseph Paperman. 1998. Financial analysts and in-
formation-based trade. Journal of Financial Markets 1 (2), 175-201.
Eleswarapu, Venkat R., Rex Thompson, and Kumar Venkataraman. 2004. The impact of
regulation fair disclosure: Trading costs and information asymmetry. The Journal of
Financial and Quantitative Analysis 39 (2), 209-225.

48
El-Gazzar, Samir M. 1998. Predisclosure information and institutional ownership, A
cross-sectional examination of market revaluations during earnings announcement
periods. The Accounting Review 73 (1), 119-129.
Eng, L. L., and Y. T. Mak. 2003. Corporate governance and voluntary disclosure. Journal
of Accounting and Public Policy 22 (4), 325-345.
Ferreira, Eurico J., and Stanley D. Smith. 2006. Effect of Reg FD on information in ana-
lysts' rating changes. Financial Analysts Journal 62 (3), 44-57.
Forker, John J. 1992. Corporate governance and disclosure quality. Accounting and Busi-
ness Research 22 (86), 111-124.
Foster, F. Douglas, and S. Viswanathan. 1996. Strategic trading when agents forecast the
forecasts of others. The Journal of Finance 51 (4), 1437-1478.
Francis, Jennifer, Dhananjay Nanda, and Xin Wang. 2006. Re-examining the effects of
Regulation Fair Disclosure using foreign listed firms to control for concurrent
shocks. Journal of Accounting and Economics 41 (3), 271-292.
Frankel, Richard, Marilyn Johnson, and Douglas J. Skinner. 1999. An empirical examina-
tion of conference calls as a voluntary disclosure medium. Journal of Accounting
Research 37 (1), 133-150.
Gintschel, Andreas, and Stanimir Markov. 2004. The effectiveness of Regulation FD.
Journal of Accounting and Economics 37 (3), 293-314.
Gomes, Armando, Gary Gorton, and Leonardo Madureira. 2007. SEC Regulation Fair
Disclosure, information, and the cost of capital. Journal of Corporate Finance 13
(2-3), 300-334.
Gompers, Paul, Joy Ishii, and Andrew Metrick. 2003. Corporate governance and equity
prices. Quarterly Journal of Economics 118 (1), 107-155.
Hamilton, James, and Ted Trautmann. 2000. Fair disclosure and insider trading reforms,
Reg. FD, rule 10b5-1 and rule 10b5-2CCH, Inc. (Riverwoods, IL).
Hasbrouck, Joel. 1991. The summary informativeness of stock trades: An econometric
analysis. The Review of Financial Studies 4 (3), 571-595.
Healy, Paul M., Amy P. Hutton, and Krishna G. Palepu. 1999. Stock performance and in-

49
termediation changes surrounding sustained increases in disclosure. Contemporary
Accounting Research 16 (3), 485-520.
Healy, Paul M., and Krishna G. Palepu. 2001. Information asymmetry, corporate disclo-
sure, and the capital markets: A review of the empirical disclosure literature. Journal
of Accounting and Economics 31 (1-3), 405-440.
Heflin, Frank, K. R. Subramanyam, and Yuan Zhang. 2003. Regulation FD and the finan-
cial information environment: Early evidence. The Accounting Review 78 (1), 1-37.
Ho, Simon S. M., and Kar Shun Wong. 2001. A study of the relationship between corpo-
rate governance structures and the extent of voluntary disclosure. Journal of Interna-
tional Accounting, Auditing and Taxation 10 (2), 139-156.
Holden, Craig W., and Avanidhar Subrahmanyam. 1992. Long-lived private information
and imperfect competition. The Journal of Finance 47 (1), 247-270.
Holland, John. 1998. Private voluntary disclosure, financial intermediation and market
efficiency. Journal of Business Finance & Accounting 25 (1-2), 29-68.
Huang, Roger D., and Hans R. Stoll. 1996. Dealer versus auction markets: A paired
comparison of execution costs on NASDAQ and the NYSE. Journal of Financial
Economics 41 (3), 313-357.
Huang, Roger D., and Hans R. Stoll. 1997. The components of the bid-ask spread: A
general approach. The Review of Financial Studies 10 (4), 995-1034.
Jensen, Michael C., and William H. Meckling. 1976. Theory of the firm: Managerial be-
haviour, agency costs and ownership structure. Journal of Financial Economics 3 (4),
305-360.
Jorion, Philippe, Zhu Liu, and Charles Shi. 2005. Informational effects of Regulation FD:
Evidence from rating agencies. Journal of Financial Economics 76 (2), 309-330.
Kim, Oliver, and Robert E. Verrecchia. 1994. Market liquidity and volume around earn-
ings announcements. Journal of Accounting and Economics 17 (1-2), 41-67.
Lang, Mark, and Russell Lundholm. 1993. Cross-sectional determinants of analyst ratings
of corporate disclosures. Journal of Accounting Research 31 (2), 246-271.

50
Lee, Charles M. C., and Mark J. Ready. 1991. Inferring trade direction from intraday data.
The Journal of Finance 46 (2), 733-746.
Lee, Chun I., Leonard Rosenthal, and Kimberly Gleason. 2004. Effect of Regulation FD
on asymmetric information. Financial Analysts Journal 60 (3), 79-89.
Leuz, Christian, and Robert E. Verrecchia. 2000. The economic consequences of in-
creased disclosure. Journal of Accounting Research 38 (Supplement: Studies on Ac-
counting), 91-124.
Masulis, Ronald W., Cong Wang, and Fei Xie. 2007. Corporate governance and acquirer
returns. The Journal of Finance 62 (4), 1851-1889.
Mathew, Prem G., J. Christopher Hughen, and Kent P. Ragan. 2004. A reexamination of
information flow in financial markets: The impact of Regulation FD and decimaliza-
tion. Quarterly Journal of Business & Economics 43 (1-2), 123-147.
McKinnon, Jill L., and Lian Dalimunthe. 1993. Voluntary disclosure of segment informa-
tion by Australian diversified companies. Accounting & Finance 33 (1), 33-50.
McMullen, D. 1996. Audit committee performance: An investigation of the consequences
associated with audit committees. Auditing 15 (1), 87.
Meek, Gary K., Clare B. Roberts, and Sidney J. Gray. 1995. Factors influencing volun-
tary annual report disclosures by U.S., U.K. and continental European multinational
corporations. Journal of International Business Studies 26 (3), 555-572.
Melis, Andrea. 2004. Financial reporting, corporate communication and governance.
Corporate Ownership and Control 1 (2), 31-37.
Mensah, Yaw M., and Rong Yang. 2008. An empirical evaluation of analysts’ herding
behaviour following Regulation Fair Disclosure. Journal of Accounting and Public
Policy 27 (4), 317-338.
Mohanram, P. S., and S. V. Sunder. 2006. How has Regulation FD affected the operations
of financial analysts? Contemporary Accounting Research 23 (2), 491-525.
Mohanram, Partha, and Shiva Rajgopal. 2009. Is PIN priced risk? Journal of Accounting
and Economics 47 (3), 226-243.
Reza, Syed Walid, and Craig A. Wilson. 2007. Does corporate ownership impact the

51
probability of informed trading? International Journal of Business Research 7 (1),
188-210.
Ruland, William, Samuel Tung, and Nashwa E. George. 1990. Factors associated with the
disclosure of managers' forecasts. The Accounting Review 65 (3), 710-721.
Schadewitz, Hannu J., and Dallas R. Blevins. 1998. Major determinants of interim dis-
closures in an emerging market. American Business Review 16 (1), 41-55.
Shleifer, Andrei, and Robert W. Vishny. 1997. A survey of corporate governance. The
Journal of Finance 52 (2), 737-783.
Sidhu, Baljit, Tom Smith, Robert E. Whaley and Richard H. Willis. 2008. Regulation Fair
Disclosure and the cost of adverse selection. Journal of Accounting Research 46 (3),
697-728.
Skinner, Douglas J. 1990. Options markets and the information content of accounting
earnings releases. Journal of Accounting and Economics 13 (3), 191-211.
Straser, Vesna. 2002. Regulation Fair Disclosure and information asymmetry. Working
paper. University of Notre Dame
Sunder, Shyam V. 2002. Investor access to conference call disclosures: Impact of Regula-
tion Fair Disclosure on information asymmetry. Working paper. Northwestern Uni-
versity
Trabelsi, S., Labelle, R. and Laurin, C. 2004. The Management of Financial Disclosure
on Corporate Websites: A Conceptual Model. Canadian Accounting Perspective 3(2),
235-259.
Trabelsi, S., Labelle, R., and Dumontier, P. 2008. Incremental Voluntary Disclosure on
Corporate Web Sites, Determinants and Consequences. Journal of Contemporary
Accounting and Economics 4(2), 120-155.
Vega, Clara. 2006. Stock price reaction to public and private information. Journal of Fi-
nancial Economics 82 (1), 103-133.
Wang, Jiang. 1993. A model of intertemporal asset prices under asymmetric information.
The Review of Economic Studies 60 (2), 249-282.
Welker, Michael. 1995. Disclosure policy, information asymmetry, and liquidity in equity
52
markets. Contemporary Accounting Research 11 (2), 801-827.
Williamson, Oliver E. 1981. The modern corporation: Origins, evolution, attributes.
Journal of Economic Literature 19 (4), 1537-1568.
Yan, Yuxing, and Shaojun Zhang. 2006. An improved estimation method and empirical
properties of the probability of informed trading. Working paper. University of
Pennsylvania and Nanyang Technological University.
Yang, R., and Y. M. Mensah. 2006. The effect of the SEC's Regulation Fair Disclosure on
analyst forecast attributes. Journal of Financial Regulation and Compliance 14 (2),
192-209.
Zitzewitz, Eric W. 2002. Regulation Fair Disclosure and the private information of ana-
lysts. Working paper. Dartmouth College.

53
Table 3.1
PIN Data Distribution by Every 0.1
This table decomposes the value of PIN into 10 categories by every 0.1. The sample consists of
398,756 quarterly PIN estimations between the first quarter of 1993 and the second quarter of 2006 for
firms listed on NYSE, AMEX and NASDAQ. A detailed definition of PIN is in Section 3.1.1.
Range by
0.1 Frequency Percentage
Cumulative
Frequency
Cumulative
Percent
0.0-0.1 28,946 7.26 28,946 7.26
0.1-0.2 144,319 36.19 173,265 43.45
0.2-0.3 132,550 33.24 305,815 76.69
0.3-0.4 55,674 13.96 361,489 90.65
0.4-0.5 17,648 4.43 379,137 95.08
0.5-0.6 7,744 1.94 386,881 97.02
0.6-0.7 4,788 1.20 391,669 98.22
0.7-0.8 3,093 0.78 394,762 99.00
0.8-0.9 1,793 0.45 396,555 99.45
0.9-1.0 2,201 0.55 398,756 100.00

54
Table 3.2
0.90-1.00 PIN Data Distribution by Every 0.01
This table decomposes the subgroup of PIN from 0.90 to 1.00 into 10 categories by every 0.01.The
sample consists of 2,201 quarterly PIN estimations valued between 0.90 and 1.00 from the first quar-
ter of 1993 to the second quarter of 2006 for firms listed on NYSE, AMEX and NASDAQ. A detailed
definition of PIN is in Section 3.1.1.
Range by 0.01 Frequency Percentage Cumulative
Frequency
Cumulative
Percent
0.90-0.91 99 4.50 99 4.50
0.91-0.92 69 3.13 168 7.63
0.92-0.93 80 3.63 248 11.27
0.93-0.94 58 2.64 306 13.90
0.94-0.95 31 1.41 337 15.31
0.95-0.96 29 1.32 366 16.63
0.96-0.97 17 0.77 383 17.40
0.97-0.98 9 0.41 392 17.81
0.98-0.99 4 0.18 396 17.99
0.99-1.00 1,805 82.01 2,201 100.00

55
Table 3.3
0.00-0.10 PIN Data Distribution by Every 0.01
This table decomposes the subgroup of PIN from 0.00 to 0.10 into 10 categories by every 0.01.The
sample consists of 28,960 quarterly PIN estimations valued between 0.00 and 0.01 from the first
quarter of 1993 to the second quarter of 2006 for firms listed on NYSE, AMEX and NASDAQ. A de-
tailed definition of PIN is in Section 3.1.1.
Range by 0.01 Frequency Percentage Cumulative
Frequency
Cumulative
Percent
0.00-0.01 1,779 6.14 1,779 6.14
0.01-0.02 279 0.96 2,058 7.11
0.02-0.03 424 1.46 2,482 8.57
0.03-0.04 605 2.09 3,087 10.66
0.04-0.05 986 3.40 4,073 14.06
0.05-0.06 1,756 6.06 5,829 20.13
0.06-0.07 3,055 10.55 8,884 30.68
0.07-0.08 4,863 16.79 13,747 47.47
0.08-0.09 6,686 23.09 20,433 70.56
0.09-0.10 8,527 29.44 28,960 100.00
56
Table 3.4
IRRC Corporate Governance Provisions
Provisions Contents
Delay Blank Check Preferred stocks that the board determines holders’ rights.
Classified Board Directors are in different classes serving overlapping terms.
Special Meeting Require majority shareholder support for a special meeting.
Written Consent Limitations on action by Written Consent.
Protection Compensation Plans Extra compensations under change in control.
Indemnification Contracts Contracts indemnifying managers from lawsuit expenses.
Golden Parachutes Compensation to senior executives under change in control.
Director Indemnification Bylaws/charter indemnifying managers from lawsuit expenses.
Limitations on Liability Charter amendments that limit directors’ personal liability.
Severance Agreements Positions/compensation not contingent under change in control.
Voting Bylaw Amendment Limit shareholders’ ability to amend the governing documents.
Charter Amendment Limit shareholders’ ability to amend the governing documents.
Cumulative Voting (+) Allows a shareholder to allocate total votes in any manner.
Secret Ballot (+) Independent third party sworn to secrecy count proxy votes.
Supermajority* Higher votes for combinations than threshold requirements.
Unequal Voting Limit voting rights of some shareholders and expand others.
Other Antigreenmail* Prevent shareholder selling at premium for not seeking control.
Directors’ Duties* Considering constituencies besides shareholders in a merger.
Fair Price* Limit the range of prices a bidder can pay in two-tier offers.
Pension Parachutes Prevent using pension fund of object to finance acquisition.
Poison Pill Provide holders with special rights in a triggering event
Silver Parachutes More employees are eligible for golden parachutes benefits.
State Antigreenmail law* Prevent shareholder selling at premium for not seeking control.
Business Combination Law Pause certain transactions approved by Board of Directors
Cash-out Law Sales to control shareholder at highest recent acquired price
Directors’ Duties Law* Considering constituencies besides shareholders in a merger.
Fair price Law* Limit the range of prices a bidder can pay in two-tier offers
Control Share Acquisition Law* Higher votes for combinations than threshold requirements.
57
Table 3.5
Summary Statistics of G by Reporting Year
This table provides summary statistics of G, the Governance Index over time. The sample consists of
14,000 annual G data from 1990 to 2006 for firms covered by the IRRC Corporate Takeover Defences
(Rosenbaum 1990, 1993, 1995, 1998, 2000, 2002, 2004 and 2006). Firms are allocated into 3 groups fol-
lowing Gompers et al. (2003). The Low group is composed of firms with G ≤ 5, and the High group is
composed of firms with G ≥ 14. The rest are in the Medium group. A detailed definition of G is in Section
3.1.2.
1990 1993 1995 1998 2000 2002 2004 2006 Total
Governance Index
Minimum 1.0 2.0 2.0 2.0 2.0 1.0 2.0 2.0 1.0
Maximum 17.0 17.0 17.0 18.0 19.0 18.0 18.0 18.0 19.0
Mean 8.9 9.2 9.3 8.8 9.0 9.0 9.0 9.0 9.0
Median 9.0 9.0 9.0 9.0 9.0 9.0 9.0 9.0 9.0
Mode 10.0 9.0 9.0 10.0 9.0 8.0 8.0 9.0 9.0
Std Dev 2.9 2.9 2.8 2.8 2.7 2.6 2.6 2.5 2.7
Number of Firms
G ≤ 5 (Low) 183 170 145 267 185 167 169 140 1,426
G = 6 144 106 125 199 192 163 154 159 1,242
G = 7 171 158 146 213 221 222 215 223 1,569
G = 8 173 154 172 233 229 276 317 283 1,837
G = 9 170 196 194 212 255 254 282 315 1,878
G = 10 186 176 185 238 251 271 281 247 1,835
G = 11 158 176 173 203 208 218 230 224 1,590
G = 12 106 129 150 145 150 128 155 146 1,109
G = 13 89 103 114 117 109 101 95 85 813
G ≥14(High) 87 95 92 87 87 94 85 74 701
Total 1,467 1,463 1,496 1,914 1,887 1,894 1,983 1,896 14,000
% of Low 12.5% 11.6% 9.7% 13.9% 9.8% 8.8% 8.5% 7.4% 10.2%
% of High 5.9% 6.5% 6.1% 4.5% 4.6% 5.0% 4.3% 3.9% 5.0%
% of G = 9 11.6% 13.4% 13.0% 11.1% 13.5% 13.4% 14.2% 16.6% 13.4%

58
Table 3.6
Definitions of Regression Variables
Variable Definition
PIN Probability of Information-based Trading
G The Corporate Governance Index
AAF Annual Average Analysts Following
Capitalization Year-end market capitalization
Volume Annual Average trading volume
Book-to-Market Year-end book-to-market ratio
Block Percentage of shares held by all block holders

59
Table 3.7
Summary Statistics of Regression Variables
Variable N Mean Std
Dev Sum Minimum Maximum
PIN 5,285 0.139 0.055 736.453 0.013 0.703
G 5,285 9.503 2.723 50,223 2.000 18.000
AAF 5,285 10.007 6.940 52,888 1.000 39.417
Capitalization 5,285 7,949,178 23,522,136 42,011,400,000 8,178 507,216,640
Volume 5,285 195,777 439,534 1,034,681,829 297 13,188,100
Book-to-Market 5,285 0.389 0.377 2,057 0.000 10.979
Block 5,285 23.034 17.221 121,735 0.000 92.600

60
Table 3.8
Pearson Correlation Coefficients of Regression Variables
The sample contains 5,285 observations during 1995 and 2005. Pearson correlation coefficients be-
tween regression variables are provided.
PIN G AAF Cap Vol BM Block
PIN 1.000 -0.108 -0.447 -0.263 -0.248 0.171 0.273
(<0.001) (<0.001) (<0.001) (<0.001) (<0.001) (<0.001)
G 1.000 -0.011 -0.057 -0.062 0.006 -0.251
(0.443) (<0.001) (<0.001) (0.643) (<0.001)
AAF 1.000 0.422 0.481 -0.223 -0.291
(<0.001) (<0.001) (<0.001) (<0.001)
Capitalization 1.000 0.522 -0.163 -0.199
(<0.001) (<0.001) (<0.001)
Volume 1.000 -0.080 -0.173
(<0.001) (<0.001)
Book-to-Market 1.000 0.118
(<0.001)
Block 1.000

61
Table 3.9
Pearson Correlation Coefficients of Regression Variables on Regulation FD
The sample contains 4,733 observations during 1995 and 2005. The years 1995 to 1999 are recognized
as before Regulation FD, and 2001 to 2005 are recognized as after the regulation. The year 2000 is
excluded from the analysis. Panel A provides Pearson correlation coefficients between regression
variables. Panel B provides a comparison of correlation coefficients. P-values are shown in parenthe-
ses. A detailed description is in Section 3.2.2.
PIN G AAF Cap Vol BM Block
Panel A: Pearson Correlation Coefficients
After
PIN 1.000 -0.123 -0.478 -0.310 -0.247 0.209 0.293
(<0.001) (<0.001) (<0.001) (<0.001) (<0.001) (<0.001)
G 1.000 -0.048 -0.047 -0.069 0.000 -0.235
(0.013) (0.014) (0.000) (0.986) (<0.001)
AAF 1.000 0.424 0.512 -0.245 -0.271
(<0.001) (<0.001) (<0.001) (<0.001)
Capitalization 1.000 0.641 -0.178 -0.215
(<0.001) (<0.001) (<0.001)
Volume 1.000 -0.102 -0.199
(<0.001) (<0.001)
Book-to-Market 1.000 0.080
(<0.001)
Block 1.000
Before
PIN 1.000 -0.059 -0.439 -0.255 -0.246 0.234 0.279
(0.008) (<0.001) (<0.001) (<0.001) (<0.001) (<0.001)
G 1 0.029 -0.06 -0.107 -0.033 -0.286
(0.195) (0.007) (<0.001) (0.133) (<0.001)
AAF 1 0.445 0.572 -0.248 -0.312
(<0.001) (<0.001) (<0.001) (<0.001)
Capitalization 1 0.578 -0.185 -0.186
(<0.001) (<0.001) (<0.001)
Volume 1 -0.191 -0.193
(<0.001) (<0.001)
Book-to-Marke 1 0.144
(<0.001)
Block 1.000

62
PIN G AAF Cap Vol BM Block
Panel B: Comparison of Correlation Coefficients Before and After Regulation FD
Difference : ρ ρ
PIN 0 2.104 1.651 2.023 0.012 6.410 -0.362
(0.035) (0.099) (0.043) (0.990) (0.000) (0.717)
G 0 2.644 -0.386 -1.308 -0.663 -1.875
(0.008) (0.699) (0.191) (0.507) (0.061)
AAF 0 0.884 2.948 -5.351 -1.545
(0.377) (0.003) (0.000) (0.122)
Capitalization 0 -2.936 -3.622 1.042
(0.003) (0.000) (0.297)
Volume 0 -4.888 0.099
(0.000) (0.921)
Book-to-Market 0 3.665
(0.000)
Block 0

63
Table 5.1.1
Regressions Analysis of Corporate Governance and Information Asymmetry
This table provides regression results for the whole population. The sample consists of 5,285 observa-
tions between 1995 and 2005. The dependent variable is PIN. In Basic Regression only G and year are
included. In Baseline Regression AFF is also considered. In Full Regression all other control variables
are considered as well. Variable definitions are in Table 3.6. T-statistics are presented in parentheses.
***and ** indicates significance at 0.01 and 0.05 level respectively.
(1) (2) (3)
Basic Regression Baseline Regression Full Regression
G -0.002*** -0.002*** -0.001***
(-6.886) (-8.140) (-4.890)
AAF -0.004*** -0.003***
(-37.688) (-25.734)
Capitalization 0.000***
(-6.305)
Volume 0.000**
(2.503)
Book-to-Market 0.013***
(7.633)
Block 0.000***
(11.671)
Year -0.003*** -0.003*** -0.004***
(-14.105) (-16.045) (-18.748)
Intercept 0.179*** 0.216*** 0.191***
(59.826) (76.207) (57.520)
Adjusted R Square 0.047 0.249 0.285
Degree of Freedom 5282 5281 5277

64
Table 5.1.2
Group Analysis on Corporate Governance and Information Asymmetry
This table provides regression results for the High, Low, and Medium groups respectively. The sample
period is between 1995 and 2005. The dependent variable is PIN. Variable definitions are in Table 3.6.
Column (4) provides statistics of the difference between coefficients of the High group and the other
two groups, and Column (5) provides statistics of the difference between the Low group and the other
two groups. The differences are tested with a High group dummy variable and a Low group dummy
variable respectively. Panel A, Panel B and Panel C provide the regression results for Basic Regres-
sion, Baseline Regression and Full Regression correspondingly. T-statistics are presented in parenthe-
ses, with ***, ** and * indicates significance at 0.01, 0.05 and 0.1 level respectively.
(1) (2) (3) (4) (5)
Variable High Low Medium High-
(Low+Medium)
Low-
(High+Medium)
Panel A: Basic Regression
G 0.011*** -0.003 -0.002*** 0.013*** -0.001
(3.756) (-0.591) (-3.985) (3.730) (-0.318)
Year -0.004*** -0.002 -0.003***
(-4.608) (-1.612) (-13.340)
Intercept -0.006 0.182*** 0.175*** -0.184*** 0.017
(-0.145) (8.837) (43.473) (-3.656) (1.002)
Adjusted R Square 0.094 0.007 0.042
Degree of Freedom 343 409 4524
Panel B: Baseline Regression
G 0.007** 0.001 -0.002*** 0.008*** 0.003
(2.467) (0.240) (-6.071) (2.691) (0.862)
AAF -0.003*** -0.004*** -0.004***
(-7.177) (-8.923) (-35.915)
Year -0.004*** -0.001 -0.004***
(-5.489) (-1.172) (-15.473)
Intercept 0.087** 0.195*** 0.216*** -0.115*** -0.007
(1.997) (10.300) (57.964) (-2.562) (-0.493)
Adjusted R Square 0.213 0.169 0.254
Degree of Freedom 342 408 4523

65
(1) (2) (3) (4) (5)
Variable High Low Medium High-
(Low+Medium)
Low-
(High+Medium)
Panel C: Full Regression
G 0.007** 0.002 -0.001*** 0.008** 0.002
(2.314) (0.587) (-3.364) (2.505) (0.638)
AAF -0.002*** -0.003*** -0.003***
(-4.118) (-5.205) (-24.784)
Capitalization 0.000*** 0.000** 0.000***
(-3.105) (-2.510) (-5.861)
Volume 0.000 0.000** 0.000**
(0.865) (2.232) (2.223)
Book-to-Market -0.002 0.042*** 0.012***
(-0.266) (5.776) (6.376)
Block 0.000** 0.001*** 0.000***
(2.058) (4.189) (9.936)
Year -0.004*** -0.002** -0.004***
(-5.245) (-2.425) (-17.840)
Intercept 0.085* 0.151*** 0.192*** -0.108** -0.005
(1.952) (8.056) (45.312) (-2.467) (-0.309)
Adjusted R Square 0.251 0.279 0.286
Degree of Freedom 338 404 4519

66
Table 5.1.3
Event Study Analysis on Corporate Governance and Information Asymmetry
This table provides regression results for the event study analysis on Regulation FD. The years 1995 to 1999 are recognized as before Regulation FD, and 2001 to 2005
are after. The year 2000 is excluded from the analysis. The dependent variable is PIN. Columns (3), (6) and (9) are statistics of the differences on coefficients before and
after the regulation tested with a dummy variable using a t-test. T-statistics are presented in parentheses. *** and * indicates significance at 0.01 and 0.1 level respec-
tively.
(1) (2) (3) (4) (5) (6) (7) (8) (9)
Basic Regression Baseline Regression Full Regression
After Before After-Before After Before After-Before After Before After-Before
G -0.003*** -0.001*** -0.001** -0.003*** -0.001*** -0.002*** -0.002*** 0.000 -0.002***
(-6.285) (-3.495) (-2.228) (-8.662) (-3.288) (-3.965) (-6.539) (-0.198) (-3.902)
AAF -0.004*** -0.003*** -0.003*** -0.003***
(-28.992) (-23.366) (-20.339) (-16.047)
Capitalization 0.000*** 0.000**
(-7.285) (-2.475)
Volume 0.000*** 0.000***
(3.873) (3.716)
Book-to-Market 0.013*** 0.028***
(4.638) (9.089)
Block 0.000*** 0.001***
(7.676) (8.751)
Year -0.002*** -0.010*** -0.001 -0.010*** -0.001* -0.012***
(-2.652) (-13.141) (-1.628) (-15.246) (-1.827) (-17.858)
Intercept 0.176*** 0.195*** 0.026*** 0.211*** 0.225*** 0.030*** 0.183*** 0.195*** 0.027***
(22.509) (43.255) (4.141) (30.525) (53.616) (5.471) (24.624) (40.793) (5.038)
Adjusted R Square 0.018 0.082 0.25 0.278 0.291 0.338
Degree of Freedom 2711 2016 2710 2015 2706 2011
66

67
Table 5.1.4
Event Study Analysis on Group Differences
This table provides regression results for event study analysis on Regulation FD by groups. The dependent variable is PIN. Panel A, B and C provide regression results
for the High group, the Low group and the Medium group, respectively. Column (3), (6) and (9) are statistics of the differences on coefficients before and after the
regulation tested with a event dummy variable. T-statistics are presented in parentheses. ***, ** and * indicates significance at 0.01, 0.05 and 0.1 level respectively.
(1) (2) (3) (4) (5) (6) (7) (8) (9)
Basic Regression Baseline Regression Full Regression
After Before After-Before After Before After-Before After Before After-Before
Panel A: High
G -0.002 0.030*** -0.031*** -0.002 0.028*** -0.023*** -0.003 0.027*** -0.023***
(-0.449) (6.279) (-5.025) (-0.663) (5.235) (-3.783) (-0.842) (5.156) (-3.852)
AAF -0.004*** -0.001 -0.003*** -0.001
(-7.408) (-0.771) (-3.799) (-0.835)
Capitalization 0.000** 0.000
(-2.425) (-1.021)
Volume 0.000 0.000**
(-0.576) (2.337)
Book-to-Market 0.009 0.005
(0.894) (0.308)
Block 0.000 0.001***
(-0.043) (3.621)
Year -0.003 -0.009*** -0.002 -0.008*** -0.001 -0.009***
(-1.191) (-2.844) (-1.017) (-2.826) (-0.587) (-3.003)
Intercept 0.178*** -0.261*** 0.465*** 0.217*** -0.228*** 0.342*** 0.212*** -0.230*** 0.339***
(2.865) (-3.735) (5.078) (3.934) (-2.780) (3.787) (3.797) (-2.886) (3.802)
Adjusted R Square 0.009 0.283 0.229 0.287 0.280 0.395
Degree of Freedom 193 117 192 116 188 112
67

68
(1) (2) (3) (4) (5) (6) (7) (8) (9)
Basic Regression Baseline Regression Full Regression
After Before After-Before After Before After-Before After Before After-Before
Panel B: Low
G 0.005 -0.008 0.014 0.008 -0.006 0.018** 0.007 -0.005 0.013
(0.723) (-1.347) (1.487) (1.11) (-1.291) (2.110) (0.977) (-1.178) (1.626)
AAF -0.002** -0.005*** -0.002** -0.003***
(-2.522) (-10.322) (-2.247) (-4.879)
Capitalization 0.000*** 0.000
(-2.798) (1.295)
Volume 0.000** 0.000**
(2.555) (-2.473)
Book-to-Market 0.031* 0.047***
(1.771) (5.974)
Block 0.000 0.001***
(1.652) (3.682)
Year 0 -0.005* 0 -0.005** 0.001 -0.005***
(-0.028) (-1.673) (0.031) (-2.209) (0.254) (-2.654)
Intercept 0.135*** 0.216*** -0.054 0.139*** 0.25*** -0.068* 0.106** 0.197*** -0.052
(2.929) (7.628) (-1.249) (3.073) (10.641) (-1.727) (2.328) (8.729) (-1.386)
Adjusted R Square 0.004 0.020 0.047 0.342 0.149 0.492
Degree of Freedom 141 219 140 218 136 214
68

69
(1) (2) (3) (4) (5) (6) (7) (8) (9)
Basic Regression Baseline Regression Full Regression
After Before After-Before After Before After-Before After Before After-Before
Panel C: Medium
G -0.002*** -0.001 -0.002** -0.003*** -0.001* -0.002*** -0.002*** 0.000 -0.002***
(-4.334) (-1.193) (-2.196) (-6.952) (-1.814) (-3.419) (-4.607) (0.19) (-3.184)
AAF -0.004*** -0.003*** -0.003*** -0.003***
(-28.914) (-20.967) (-19.988) (-15.673)
Capitalization 0.000*** 0.000***
(-6.8) (-3.315)
Volume 0.000*** 0.000***
(3.727) (5.027)
Book-to-Market 0.013*** 0.025***
(4.442) (7.48)
Block 0.000*** 0.000***
(7.399) (6.39)
Year -0.002** -0.011*** -0.001 -0.011*** -0.001* -0.013***
(-2.493) (-13.664) (-1.504) (-15.804) (-1.726) (-18.02)
Intercept 0.173*** 0.189*** 0.033*** 0.214*** 0.223*** 0.036*** 0.182*** 0.198*** 0.033***
(19.115) (32.302) (4.001) (27.048) (40.845) (4.962) (21.352) (33.03) (4.598)
Adjusted R Square 0.011 0.100 0.269 0.288 0.310 0.339
Degree of Freedom 2371 1674 2370 1673 2366 1669
69

70
Table 5.1.5
Regressions Analysis Using Year Dummies
This table provides regression results for the whole population of 5,285 observations. The dependent variable is PIN.
Year dummies are used instead of a year trend variable. T-statistics are presented in parentheses. ***, **and * indicates
significance at 0.01, 0.05 and 0.1 level respectively.
(1) (2) (3)
Basic Regression Baseline Regression Full Regression
G -0.002*** -0.002*** -0.001***(-7.458) (-8.855) (-5.440)
AAF -0.004*** -0.003***
(-38.718) (-26.635)
Capitalization 0.000***
(-5.695)
Volume 0.000***
(2.785)
Book-to-Market 0.015***
(8.723)
Block 0.000***
(12.169)
Dummy1995 0.045*** 0.045*** 0.051*** (12.172) (13.925) (15.834)Dummy1996 0.040*** 0.038*** 0.044*** (10.763) (11.795) (13.815)Dummy1997 0.015*** 0.013*** 0.019*** (4.272) (4.011) (6.078)Dummy1998 0.009 0.003 0.008*** (2.576) (1.132) (2.795)Dummy1999 0.009*** 0.009*** 0.011*** (2.668) (3.021) (3.889)Dummy2000 0.005* 0.005* 0.006** (1.680) (1.812) (2.048)Dummy2001 0.011*** 0.008*** 0.010*** (3.457) (2.953) (3.540)Dummy2002 0.003 -0.002 -0.003 (0.801) (-0.565) (-1.180)Dummy2003 0.002 -0.002 -0.001
(0.566) (-0.672) (-0.386)Dummy2004 0.004 0.002 0.003
(1.170) (0.746) (1.027)
Intercept(2005) 0.148*** 0.187*** 0.154*** (42.258) (57.503) (40.530)Adjusted R Square 0.066 0.273 0.311
Degree of Freedom 5273 5272 5268

71
Table 5.2.1.1
Regression Analysis on LOGPIN
This table provides regression results for a sample consisting of 5,285 observations between 1995 and
2005. The dependent variable is LOGPIN. In Basic Regression only G and year are included. In Base-
line Regression AFF is also considered. In Full Regression all other control variables are considered as
well. Variable definitions are in Section 3.1.1 and Table 3.6. T-statistics are presented in parentheses.
*** indicates significance at 0.01 level.
(1) (2) (3)
Basic Regression Baseline Regression Full Regression
G -0.013*** -0.014*** -0.009***
(-5.924) (-7.442) (-4.580)
AAF -0.033*** -0.025***
(-45.308) (-29.264)
Capitalization 0.000***
(-9.311)
Volume 0.000
(-1.054)
Book-to-Market 0.105***
(7.872)
Block 0.004***
(12.348)
Year -0.034*** -0.035*** -0.038***
(-17.494) (-20.803) (-23.125)
Intercept -1.545*** -1.209*** -1.419***
(-64.275) (-55.701) (-56.394)
Adjusted R Square 0.064 0.326 0.372
Degree of Freedom 5282 5281 5277

72
Table 5.2.1.2
Group Analysis on LOGPIN
This table provides regression results for the High, Low and Medium groups respectively. The sample
period is between 1995 and 2005. The dependent variable is LOGPIN. Variable definitions are in Sec-
tion 3.1.1 and Table 3.6. Column (4) provides statistics of the difference between coefficients of the
High group and the other two groups, and Column (5) provides statistics of the difference between the
Low group and the others. The differences are tested with group dummy variables. Panels A, B and C
provide the regression results for Basic, Baseline, and Full regressions correspondingly. T-statistics are
presented in parentheses, with ***, ** and * indicates significance at 0.01, 0.05 and 0.1 level
respectively.
(1) (2) (3) (4) (5)
Variable High Low Medium High-
(Low+Medium)
Low-
(High+Medium)
Panel A: Basic Regression
G 0.077*** -0.026 -0.010*** 0.088*** -0.017
(3.262) (-0.812) (-3.368) (3.172) (-0.574)
Year -0.036*** -0.018** -0.035***
(-5.635) (-2.223) (-16.491)
Intercept -2.809*** -1.509*** -1.575*** -1.245*** 0.163
(-8.027) (-9.871) (-48.270) (-3.087) (1.206)
Adjusted R Square 0.111 0.013 0.060
Degree of Freedom 343 409 4524
Panel B: Baseline Regression
G 0.037* 0.004 -0.015*** 0.045* 0.020
(1.682) (0.130) (-5.868) (1.920) (0.793)
AAF -0.028*** -0.030*** -0.033***
(-9.147) (-10.520) (-43.144)
Year -0.040*** -0.013* -0.036***
(-6.983) (-1.810) (-20.013)
Intercept -1.909*** -1.400*** -1.190*** -0.606* -0.061
(-5.800) (-10.283) (-41.204) (-1.767) (-0.532)
Adjusted R Square 0.286 0.224 0.334
Degree of Freedom 342 408 4523

73
(1) (2) (3) (4) (5)
Variable High Low Medium High-
(Low+Medium)
Low-
(High+Medium)
Panel C: Full Regression
G 0.032 0.009 -0.009*** 0.041* 0.013
(1.492) (0.337) (-3.362) (1.789) (0.559)
AAF -0.019*** -0.018*** -0.025***
(-4.875) (-5.173) (-28.207)
Capitalization 0.000*** 0.000*** 0.000***
(-3.755) (-3.206) (-8.747)
Volume 0.000 0.000 0.000
(0.112) (0.557) (-0.931)
Book-to-Market -0.001 0.277*** 0.096***
(-0.014) (5.369) (6.823)
Block 0.002* 0.004*** 0.004***
(1.899) (4.541) (10.567)
Year -0.039*** -0.020*** -0.039***
(-6.466) (-2.887) (-22.100)
Intercept -1.930*** -1.725*** -1.400*** -0.576* -0.0386
(-5.939) (-12.902) (-43.210) (-1.735) (-0.340)
Adjusted R Square 0.334 0.333 0.376
Degree of Freedom 338 404 4519
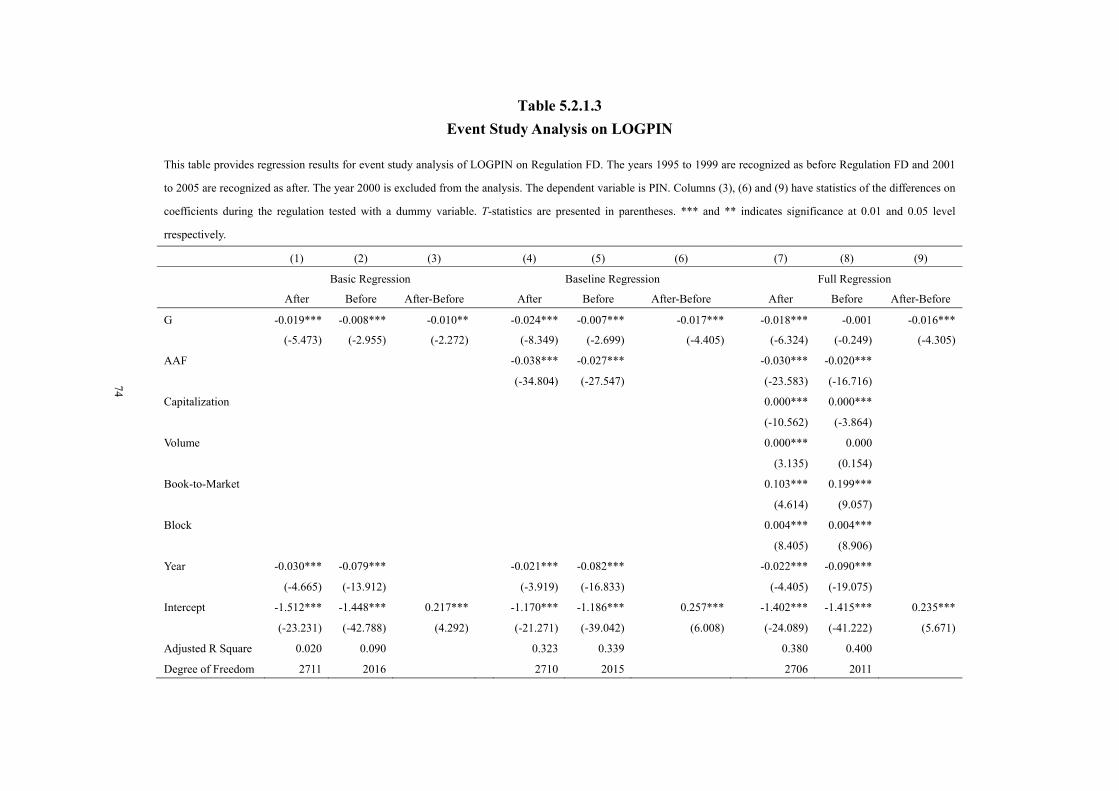
74
Table 5.2.1.3
Event Study Analysis on LOGPIN
This table provides regression results for event study analysis of LOGPIN on Regulation FD. The years 1995 to 1999 are recognized as before Regulation FD and 2001
to 2005 are recognized as after. The year 2000 is excluded from the analysis. The dependent variable is PIN. Columns (3), (6) and (9) have statistics of the differences on
coefficients during the regulation tested with a dummy variable. T-statistics are presented in parentheses. *** and ** indicates significance at 0.01 and 0.05 level
rrespectively.
(1) (2) (3) (4) (5) (6) (7) (8) (9)
Basic Regression Baseline Regression Full Regression
After Before After-Before After Before After-Before After Before After-Before
G -0.019*** -0.008*** -0.010** -0.024*** -0.007*** -0.017*** -0.018*** -0.001 -0.016***
(-5.473) (-2.955) (-2.272) (-8.349) (-2.699) (-4.405) (-6.324) (-0.249) (-4.305)
AAF -0.038*** -0.027*** -0.030*** -0.020***
(-34.804) (-27.547) (-23.583) (-16.716)
Capitalization 0.000*** 0.000***
(-10.562) (-3.864)
Volume 0.000*** 0.000
(3.135) (0.154)
Book-to-Market 0.103*** 0.199***
(4.614) (9.057)
Block 0.004*** 0.004***
(8.405) (8.906)
Year -0.030*** -0.079*** -0.021*** -0.082*** -0.022*** -0.090***
(-4.665) (-13.912) (-3.919) (-16.833) (-4.405) (-19.075)
Intercept -1.512*** -1.448*** 0.217*** -1.170*** -1.186*** 0.257*** -1.402*** -1.415*** 0.235***
(-23.231) (-42.788) (4.292) (-21.271) (-39.042) (6.008) (-24.089) (-41.222) (5.671)
Adjusted R Square 0.020 0.090 0.323 0.339 0.380 0.400
Degree of Freedom 2711 2016 2710 2015 2706 2011
74

75
Table 5.2.1.4
Event Study Analysis on Group Differences for LOGPIN
This table provides regression results for event study analysis on Regulation FD by groups. The dependent variable is LOGPIN. Panels A and B provides regression re-
sults for the High and Low groups respectively. Columns (3), (6) and (9) have statistics of the differences in coefficients before and after the regulation tested with a
dummy variable. T-statistics are presented in parentheses. ***, ** and * indicates significance at 0.01, 0.05 and 0.1 level respectively.
(1) (2) (3) (4) (5) (6) (7) (8) (9)
Basic Regression Baseline Regression Full Regression
After Before After-Before After Before After-Before After Before After-Before
Panel A: High
G -0.011 0.201*** -0.209*** -0.016 0.171*** -0.125*** -0.020 0.164*** -0.130***
(-0.303) (6.362) (-4.270) (-0.542) (4.875) (-2.700) (-0.678) (4.851) (-2.863)
AAF -0.039*** -0.009* -0.026*** -0.006
(-8.758) (-1.882) (-4.745) (-0.960)
Capitalization 0.000*** 0.000
(-3.191) (-1.31)
Volume 0.000 0.000
(-0.208) (1.423)
Book-to-Market 0.072 0.079
(0.844) (0.749)
Block 0.000 0.007***
(-0.186) (3.760)
Year -0.043** -0.079*** -0.036** -0.079*** -0.028 -0.080***
(-2.120) (-3.971) (-2.110) (-3.984) (-1.634) (-4.017)
Intercept -1.447*** -4.493*** 3.214*** -1.066** -3.964*** 1.931*** -1.140** -4.061*** 1.964***
(-2.706) (-9.648) (4.443) (-2.341) (-7.343) (2.817) (-2.507) (-7.734) (2.924)
Adjusted R Square 0.023 0.317 0.302 0.338 0.364 0.440
Degree of Freedom 193 117 192 116 188 112
75

76
(1) (2) (3) (4) (5) (6) (7) (8) (9)
Basic Regression Baseline Regression Full Regression
After Before After-Before After Before After-Before After Before After-Before
Panel B: Low
G 0.045 -0.067 0.116* 0.076 -0.054 0.150** 0.063 -0.05* 0.118**
(0.797) (-1.575) (1.692) (1.392) (-1.594) (2.475) (1.220) (-1.654) (2.078)
AAF -0.021*** -0.036*** -0.016** -0.021***
(-3.753) (-11.242) (-2.114) (-5.265)
Capitalization 0.000*** 0.000
(-3.750) (1.222)
Volume 0.000 0.000***
(1.522) (-3.283)
Book-to-Market 0.220* 0.298***
(1.746) (5.356)
Block 0.003* 0.004***
(1.897) (3.646)
Year -0.007 -0.044** -0.005 -0.047*** -0.005 -0.048***
(-0.236) (-2.138) (-0.160) (-2.869) (-0.181) (-3.254)
Intercept -1.898*** -1.235*** -0.442 -1.853*** -0.973*** -0.561** -2.054*** -1.320*** -0.445*
(-5.539) (-5.981) (-1.383) (-5.650) (-5.851) (-1.983) (-6.323) (-8.210) (-1.676)
Adjusted R Square 0.005 0.031 0.096 0.386 0.226 0.522
Degree of Freedom 141 219 140 218 136 214
76

77
Table 5.2.2.1
Regression Analysis on PIN with E Index
This table provides regression results for a sample consisting of 5,099 observations between 1995 and
2005. The dependent variable is PIN. In Basic Regression only E Index and year are included. In
Baseline Regression AFF is also considered. In Full Regression all other control variables are consi-
dered as well. Variable definitions are in Section 5.2.2 and Table 3.6. T-statistics are presented in pa-
rentheses. *** and ** indicates significance at 0.01 and 0.05 level respectively.
(1) (2) (3)
Basic Regression Baseline Regression Full Regression
E -0.001 -0.002*** -0.001**
(-1.227) (-4.761) (-2.399)
AAF -0.004*** -0.003***
(-37.921) (-25.828)
Capitalization 0.000***
(-6.499)
Volume 0.000**
(2.414)
Book-to-Market 0.013***
(7.759)
Block 0.001***
(12.727)
Year -0.004*** -0.003*** -0.004***
(-14.497) (-15.957) (-18.772)
Intercept 0.164*** 0.203*** 0.181***
(78.671) (95.843) (71.110)
Adjusted R Square 0.040 0.243 0.284
Degree of Freedom 5354 5353 5349

78
Table 5.2.2.2
Group Analysis on PIN with E Index
This table provides regression results for the High, Low, and Medium groups respectively. The sample
period is between 1995 and 2005. The dependent variable is PIN. Variable definitions are in Section
5.2.2 and Table 3.6. Column (4) provides statistics of the difference between coefficients of the High
group and the other two groups, and Column (5) provides statistics of the difference between the Low
group and the other two groups. The differences are tested with group dummy variables. Panels A, B
and C provide the regression results for the Basic, Baseline, and Full regressions correspondingly.
T-statistics are presented in parentheses, with *** indicates significance at 0.01 level.
(1) (2) (3) (4) (5)
Variable High Low Medium High-
(Low+Medium)
Low-
(High+Medium)
Panel A: Basic Regression
E -0.001 0.001 0.001 -0.002 0.000
(-0.289) (0.277) (0.504) (-0.468) (-0.106)
Year -0.003*** -0.004*** -0.003***
(-7.756) (-6.770) (-10.329)
Intercept 0.165*** 0.166*** 0.158*** 0.007 0.006
(11.748) (40.161) (28.810) (0.422) (0.958)
Adjusted R Square 0.046 0.034 0.037
Degree of Freedom 1251 1310 2787
Panel B: Baseline Regression
E -0.002 -0.003 -0.002 0.000 -0.001
(-0.765) (-0.791) (-1.200) (-0.043) (-0.173)
AAF -0.004*** -0.003*** -0.004***
(-18.837) (-16.937) (-28.658)
Year -0.004*** -0.003*** -0.003***
(-9.686) (-6.422) (-11.552)
Intercept 0.207*** 0.201*** 0.202*** -0.001 0.002
(16.385) (46.990) (39.926) (-0.054) (0.350)
Adjusted R Square 0.257 0.208 0.256
Degree of Freedom 1250 1309 2786

79
(1) (2) (3) (4) (5)
Variable High Low Medium High-
(Low+Medium)
Low-
(High+Medium)
Panel C: Full Regression
E -0.001 -0.001 -0.001 0.000 -0.001
(-0.255) (-0.210) (-0.500) (-0.061) (-0.331)
AAF -0.003*** -0.003*** -0.003***
(-10.891) (-11.521) (-17.363)
Capitalization 0.000 0.000*** 0.000***
(0.499) (-5.832) (-3.419)
Volume 0.000*** 0.000*** 0.000
(-6.410) (4.986) (-0.289)
Book-to-Market 0.003 0.021*** 0.021***
(1.188) (5.659) (7.434)
Block 0.001*** 0.001*** 0.001***
(6.606) (6.704) (8.836)
Year -0.003*** -0.004*** -0.004***
(-8.449) (-8.483) (-13.965)
Intercept 0.182*** 0.175*** 0.178*** -0.001 0.002
(14.399) (33.304) (33.071) (-0.040) (0.381)
Adjusted R Square 0.307 0.283 0.300
Degree of Freedom 1246 1305 2782

80
Table 5.2.2.3
Event Study Analysis with E Index
This table provides regression results for event study analysis with E Index on Regulation FD. 1995 to 1999 are recognized as before Regulation FD. 2001 to 2005 are
recognized as after. Year 2000 is excluded from analysis. The dependent variable is PIN. Column (3), (6) and (9) are statistics of the differences on coefficients during the
regulation tested with a event dummy variable. T-statistics are presented in parentheses. *** and ** indicates significance at 0.01 and 0.05 level respectively.
(1) (2) (3) (4) (5) (6) (7) (8) (9)
Basic Regression Baseline Regression Full Regression
After Before After-Before After Before After-Before After Before After-Before
E -0.001 -0.001 0.000 -0.004*** -0.002*** -0.001 -0.003*** 0.000 -0.001
(-1.143) (-1.390) (0.301) (-4.790) (-2.789) (-0.957) (-3.546) (-0.047) (-0.997)
AAF -0.004*** -0.003*** -0.003*** -0.003***
(-28.930) (-23.481) (-20.218) (-15.804)
Capitalization 0.000*** 0.000***
(-7.411) (-2.680)
Volume 0.000*** 0.000***
(3.792) (3.227)
Book-to-Market 0.014*** 0.027***
(5.017) (8.944)
Block 0.000*** 0.001***
(8.625) (9.291)
Year -0.002*** -0.010*** -0.001** -0.010*** -0.001** -0.012***
(-3.257) (-13.049) (-2.076) (-15.153) (-2.181) (-17.871)
Intercept 0.157*** 0.185*** 0.014*** 0.194*** 0.219*** 0.015*** 0.168*** 0.193*** 0.013***
(21.952) (57.761) (3.095) (30.297) (68.544) (3.761) (24.681) (52.280) (3.249)
Adjusted R Square 0.005 0.078 0.238 0.273 0.286 0.336
Degree of Freedom 2740 2048 2739 2047 2735 2043
80

81
Table 5.2.3.1
Summary Statistics of G for Firms Staying in IRRC
This table provides summary statistics of G, the Governance Index, from 1995 to 2005 for firms stay-
ing in the IRRC database for the full period. It consists of 741 firms with 3,705 annual G observations.
Firms are allocated into 3 groups following Gompers et al. (2003). The Low group is composed of
firms with G ≤ 5, and the High group is composed of firms with G ≥ 14. The rest are in the Medium
group. A detailed description can be found in Section 5.2.3.
1995 1998 2000 2002 2004 All
Governance Index
Minimum 2.0 3.0 2.0 3.0 3.0 2.0
Maximum 17.0 18.0 19.0 18.0 18.0 19.0
Mean 9.3 9.6 9.8 10.1 10.1 9.8
Median 9.0 10.0 10.0 10.0 10.0 10.0
Mode 9.0 10.0 10.0 10.0 11.0 10.0
Std Dev 2.9 2.8 2.7 2.6 2.5 2.7
Number of Firms
G ≤ 5 (Low) 77 59 46 33 31 246
G = 6 57 52 39 33 27 208
G = 7 79 65 71 53 62 330
G = 8 88 88 76 85 86 423
G = 9 92 87 92 83 88 442
G = 10 80 109 108 116 107 520
G = 11 83 93 105 115 114 510
G = 12 79 68 78 86 94 405
G = 13 54 69 71 71 68 333
G ≥ 14 (High) 52 51 55 66 64 288
Total 741 741 741 741 741 3,705
Percentage of Low 10.391% 7.962% 6.208% 4.453% 4.184% 6.640%
Percentage of High 7.018% 6.883% 7.422% 8.907% 8.637% 7.773%

82
Table 5.2.3.2
Regression Analysis on PIN for Firms Staying in IRRC
This table provides regression results of 3,489 observations between 1995 and 2005 for firms staying
in the IRRC database all along the period. The dependent variable is PIN. In Basic Regression only G
and year are included. In Baseline Regression AFF is also considered. In Full Regression all other
control variables are considered as well. Variable definitions are in Section 5.2.3 and Table 3.6.
T-statistics are presented in parentheses. *** indicates significance at 0.01 level.
(1) (2) (3)
Basic Regression Baseline Regression Full Regression
G -0.001*** -0.002*** -0.001***
(-3.339) (-6.531) (-4.350)
AAF -0.003*** -0.003***
(-35.729) (-23.641)
Capitalization 0.000***
(-3.876)
Volume 0.000
(0.946)
Book-to-Market 0.018***
(8.269)
Block 0.000***
(9.972)
Year -0.005*** -0.004*** -0.005***
(-16.295) (-17.961) (-20.293)
Intercept 0.168*** 0.210*** 0.186***
(49.285) (66.753) (51.778)
Adjusted R Square 0.078 0.325 0.364
Degree of Freedom 3486 3485 3481

83
Table 5.2.3.3
Group Analysis on PIN for Firms Staying in IRRC
This table provides regression results for the High, Low, and Medium groups respectively. The sample
period is between 1995 and 2005. The dependent variable is PIN. Variable definitions are in Section
5.2.3 and Table 3.6. Column (4) provides statistics of the difference between coefficients of the High
group and the other two groups, and Column (5) provides statistics of the difference between the Low
group and the other two groups. The differences are tested with two group dummy variables. Panels A,
B and C provide the regression results for the Basic, Baseline, and Full regressions correspondingly.
T-statistics are presented in parentheses, with ***, ** and * indicates significance at 0.01, 0.05 and 0.1
level respectively.
(1) (2) (3) (4) (5)
High Low Medium
High-
(Low+Medium)
Low-
(High+Medium)
Panel A: Basic Regression
G 0.013*** 0.000 -0.001* 0.014*** 0.000
(4.864) (-0.058) (-1.877) (4.399) (0.011)
Year -0.004*** -0.003 -0.005***
(-5.354) (-1.463) (-15.598)
Intercept -0.038 0.169*** 0.164*** -0.202*** 0.015
(-0.934) (5.087) (37.689) (-4.315) (0.685)
Adjusted R Square 0.160 0.012 0.078
Degree of Freedom 284 172 3024
Panel B: Baseline Regression
G 0.009*** 0.004 -0.002*** 0.010*** 0.005
(3.488) (0.573) (-5.526) (3.735) (1.383)
AAF -0.003*** -0.004*** -0.003***
(-8.492) (-5.997) (-34.592)
Year -0.004*** -0.002 -0.004***
(-6.049) (-1.274) (-17.427)
Intercept 0.061 0.183*** 0.211*** -0.143*** 0.018
(1.605) (6.053) (53.656) (-3.550) (-0.924)
Adjusted R Square 0.331 0.184 0.339
Degree of Freedom 283 171 3023

84
(1) (2) (3) (4) (5)
High Low Medium
High-
(Low+Medium)
Low-
(High+Medium)
Panel C: Full Regression
G 0.007*** -0.001 -0.001*** 0.010*** 0.003
(2.888) (-0.222) (-3.399) (3.572) (0.727)
AAF -0.003*** -0.001 -0.003***
(-5.946) (-1.331) (-23.213)
Capitalization 0.000* 0.000** 0.000***
(-1.700) (-2.196) (-3.551)
Volume 0.000 0.000 0.000
(0.455) (1.584) (0.401)
Book-to-Market -0.004 0.080*** 0.018***
(-0.618) (4.597) (8.262)
Block 0.001*** 0.001*** 0.000***
(5.532) (4.481) (7.114)
Year -0.005*** -0.005*** -0.005***
(-6.369) (-2.770) (-19.443)
Intercept 0.071* 0.135*** 0.188*** -0.138*** -0.003
(1.943) (4.693) (41.955) (-3.507) (-0.170)
Adjusted R Square 0.417 0.339 0.372
Degree of Freedom 279 167 3019

85
Table 5.2.3.4
Event Study Analysis for Firms Staying in IRRC
This table provides regression results for event study analysis on Regulation FD by groups. The dependent variable is PIN. Panels A and B provide regression results for
the High and Low groups respectively. Columns (3), (6) and (9) have statistics on the differences in coefficients before and after the regulation tested with a dummy
variable. T-statistics are presented in parentheses. *** and ** indicates significance at 0.01 and 0.05 level respectively.
(1) (2) (3) (4) (5) (6) (7) (8) (9)
Basic Regression Baseline Regression Full Regression
After Before After-Before After Before After-Before After Before After-Before
G -0.001** -0.001 0.000 -0.002*** -0.001*** -0.001 -0.002*** 0.000 -0.001
(-2.281) (-1.395) (-0.405) (-5.344) (-2.668) (-1.458) (-4.124) (-1.095) (-1.411)
AAF -0.004*** -0.003*** -0.003*** -0.002***
(-26.785) (-21.411) (-18.134) (-12.201)
Capitalization 0.000*** 0.000
(-4.411) (0.253)
Volume 0.000** 0.000**
(2.535) (-2.318)
Book-to-Market 0.018*** 0.024***
(5.315) (7.130)
Block 0.000*** 0.001***
(6.116) (7.844)
Year -0.004*** -0.012*** -0.003*** -0.011*** -0.003*** -0.013***
(-5.035) (-11.793) (-4.682) (-12.400) (-4.971) (-14.160)
Intercept 0.166*** 0.191*** 0.017** 0.208*** 0.223*** 0.018*** 0.183*** 0.198*** 0.016***
(19.373) (34.834) (2.328) (28.140) (44.852) (2.860) (23.110) (36.453) (2.624)
Adjusted R Square 0.018 0.095 0.302 0.323 0.340 0.383
Degree of Freedom 1763 1362 1762 1361 1758 1357
85
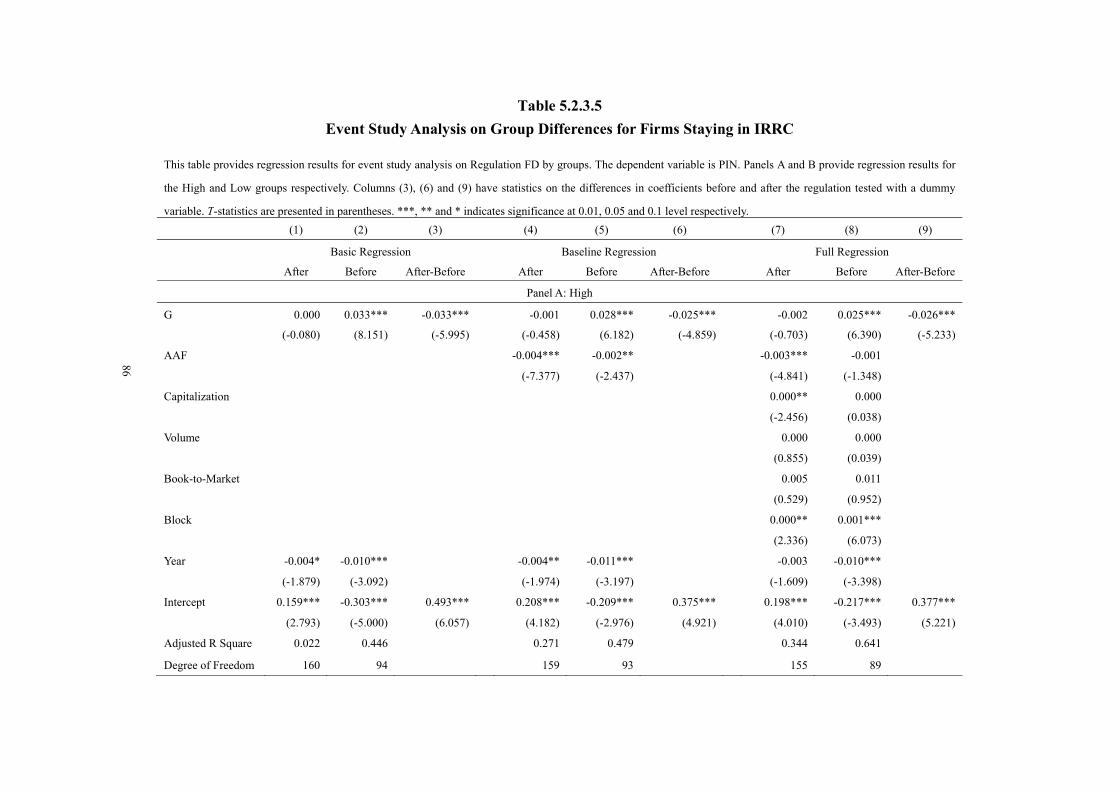
86
Table 5.2.3.5
Event Study Analysis on Group Differences for Firms Staying in IRRC
This table provides regression results for event study analysis on Regulation FD by groups. The dependent variable is PIN. Panels A and B provide regression results for
the High and Low groups respectively. Columns (3), (6) and (9) have statistics on the differences in coefficients before and after the regulation tested with a dummy
variable. T-statistics are presented in parentheses. ***, ** and * indicates significance at 0.01, 0.05 and 0.1 level respectively.
(1) (2) (3) (4) (5) (6) (7) (8) (9)
Basic Regression Baseline Regression Full Regression
After Before After-Before After Before After-Before After Before After-Before
Panel A: High
G 0.000 0.033*** -0.033*** -0.001 0.028*** -0.025*** -0.002 0.025*** -0.026***
(-0.080) (8.151) (-5.995) (-0.458) (6.182) (-4.859) (-0.703) (6.390) (-5.233)
AAF -0.004*** -0.002** -0.003*** -0.001
(-7.377) (-2.437) (-4.841) (-1.348)
Capitalization 0.000** 0.000
(-2.456) (0.038)
Volume 0.000 0.000
(0.855) (0.039)
Book-to-Market 0.005 0.011
(0.529) (0.952)
Block 0.000** 0.001***
(2.336) (6.073)
Year -0.004* -0.010*** -0.004** -0.011*** -0.003 -0.010***
(-1.879) (-3.092) (-1.974) (-3.197) (-1.609) (-3.398)
Intercept 0.159*** -0.303*** 0.493*** 0.208*** -0.209*** 0.375*** 0.198*** -0.217*** 0.377***
(2.793) (-5.000) (6.057) (4.182) (-2.976) (4.921) (4.010) (-3.493) (5.221)
Adjusted R Square 0.022 0.446 0.271 0.479 0.344 0.641
Degree of Freedom 160 94 159 93 155 89
86

87
(1) (2) (3) (4) (5) (6) (7) (8) (9)
Basic Regression Baseline Regression Full Regression
After Before After-Before After Before After-Before After Before After-Before
Panel B: Low
G 0.024* -0.015* 0.039*** 0.028** -0.012* 0.042*** 0.015 -0.013** 0.028**
(1.826) (-1.915) (2.763) (2.197) (-1.766) (3.292) (0.986) (-2.138) (2.305)
AAF -0.003** -0.004*** 0.000 -0.002**
(-2.201) (-7.106) (-0.001) (-2.352)
Capitalization 0.000 0.000
(-1.573) (0.992)
Volume 0.000 0.000
(0.681) (-1.345)
Book-to-Market 0.071* 0.073***
(1.760) (4.167)
Block 0.001 0.001***
(1.441) (3.323)
Year -0.002 -0.008 -0.001 -0.006 -0.004 -0.008**
(-0.270) (-1.576) (-0.146) (-1.473) (-0.515) (-2.149)
Intercept 0.053 0.253*** -0.163** 0.054 0.273*** -0.181*** 0.056 0.221*** -0.122**
(0.638) (6.272) (-2.367) (0.672) (8.239) (-2.933) (0.689) (6.795) (-2.053)
Adjusted R Square 0.059 0.059 0.138 0.379 0.242 0.531
Degree of Freedom 54 99 53 98 49 94
87

88
Table 5.2.4.1
Summary Statistics of PIN and G on NYSE, NASDAQ and AMEX
This table provides summary statistics of PIN and G on the NYSE, NASDAQ and AMEX market
seperately. The sample consists of 21,167 observations from 1993 to 2006. A detailed description can
be found in Section 5.2.4.
Mean Median Standard Deviation Observations
PIN
AMEX 0.193 0.181 0.078 751
NYSE 0.143 0.133 0.055 12654
Nasdaq 0.175 0.164 0.07 7762
G
AMEX 8.178 8 2.932 751
NYSE 9.571 10 2.676 12654
Nasdaq 8.346 8 2.604 7762

89
Table 5.2.4.2
Regression Analysis on PIN for Firms Listed on NYSE
This table provides regression results of 4,136 observations between 1995 and 2005 for firms listed on
NYSE. The dependent variable is PIN. In the Basic Regression, only G and year are included. In the
Baseline Regression, AFF is also considered. In the Full Regression, all other control variables are
considered as well. Variable definitions are in Section 5.2.4 and Table 3.6. T-statistics are presented in
parentheses. *** indicates significance at 0.01 level.
(1) (2) (3)
Basic Regression Baseline Regression Full Regression
G -0.001*** -0.002*** -0.001***
(-5.924) (-8.235) (-4.256)
AAF -0.004*** -0.003***
(-46.262) (-29.418)
Capitalization 0.000***
(-3.679)
Volume 0.000***
(-4.627)
Book-to-Market 0.016***
(11.649)
Block 0.000***
(14.69)
Year -0.006*** -0.006*** -0.006***
(-27.53) (-34.765) (-37.481)
Intercept 0.182*** 0.221*** 0.191***
(66.557) (93.248) (70.253)
Adjusted R Square 0.169 0.456 0.513
Degree of Freedom 4069 4068 4064

90
Table 5.2.4.3
Group Analysis on PIN for Firms Listed on NYSE
This table provides regression results for the High, Low, and Medium groups respectively. The sample
period is between 1995 and 2005. The dependent variable is PIN. Variable definitions are in Section
5.2.3 and Table 3.6. Column (4) provides statistics on the difference between coefficients of the High
group and the other two groups, and Column (5) provides statistics on the difference between the Low
group and the other two groups. The differences are tested with two group dummy variables. Panels A,
B, and C provide the regression results for the Basic, Baseline, and Full regressions correspondingly.
T-statistics are presented in parentheses, with ***, ** and * indicates significance at 0.01, 0.05 and 0.1
level respectively.
(1) (2) (3) (4) (5)
High Low Medium
High-
(Low+Medium)
Low-
(High+Medium)
Panel A: Basic Regression
G 0.015*** -0.007 -0.001*** 0.016*** -0.005
(6.150) (-1.359) (-4.187) (5.882) (-1.449)
Year -0.006*** -0.007*** -0.006***
(-8.138) (-5.361) (-25.978)
Intercept -0.054 0.220*** 0.180*** -0.232*** 0.035**
(-1.502) (8.970) (50.328) (-5.736) (2.010)
Adjusted R Square 0.264 0.107 0.166
Degree of Freedom 291 252 3520
Panel B: Baseline Regression
G 0.010*** -0.006 -0.002*** 0.012*** -0.005
(5.058) (-1.471) (-7.060) (5.427) (-1.496)
AAF -0.003*** -0.004*** -0.003***
(-11.230) (-9.456) (-44.205)
Year -0.006*** -0.006*** -0.006***
(-10.537) (-5.854) (-33.287)
Intercept 0.048 0.251*** 0.222*** -0.170*** 0.025*
(1.549) (11.731) (73.443) (-5.200) (1.774)
Adjusted R Square 0.487 0.342 0.464
Degree of Freedom 290 251 3519

91
(1) (2) (3) (4) (5)
High Low Medium
High-
(Low+Medium)
Low-
(High+Medium)
Panel C: Full Regression
G 0.008*** -0.009** -0.001*** 0.011*** -0.007**
(4.053) (-2.254) (-3.943) (5.195) (-2.338)
AAF -0.003*** -0.002*** -0.003***
(-7.888) (-4.369) (-28.279)
Capitalization 0.000** 0.000 0.000***
(-2.190) (0.508) (-4.300)
Volume 0.000 0.000* 0.000***
(0.327) (-1.798) (-4.350)
Book-to-Market -0.017* 0.023*** 0.016***
(-1.958) (2.999) (11.919)
Block 0.001*** 0.001*** 0.000***
(4.795) (5.327) (11.365)
Year -0.006*** -0.007*** -0.006***
(-9.667) (-6.581) (-35.819)
Intercept 0.071** 0.220*** 0.194*** -0.159*** 0.034**
(2.332) (10.236) (57.629) (-5.110) (2.538)
Adjusted R Square 0.546 0.448 0.518
Degree of Freedom 286 247 3515

92
Table 5.2.4.4
Event Study Analysis for Firms Listed on NYSE
This table provides regression results for the event study analysis on Regulation FD by groups. The dependent variable is PIN. Panels A and B provide regression results
for the High and Low groups respectively. Columns (3), (6) and (9) have statistics on the differences in coefficients before and after the regulation tested with a dummy
variable. T-statistics are presented in parentheses. *** and ** indicates significance at 0.01 and 0.05 level respectively.
(1) (2) (3) (4) (5) (6) (7) (8) (9)
Basic Regression Baseline Regression Full Regression
After Before After-Before After Before After-Before After Before After-Before
G -0.001*** -0.002*** 0.000 -0.002*** -0.002*** 0.000 -0.001*** -0.001** 0.000
(-3.723) (-4.192) (0.627) (-6.831) (-4.754) (-0.399) (-3.675) (-2.387) (-0.389)
AAF -0.004*** -0.003*** -0.003*** -0.002***
(-39.282) (-23.915) (-25.522) (-12.785)
Capitalization 0.000** 0.000
(-2.519) (-1.37)
Volume 0.000*** 0.000***
(-3.361) (-2.981)
Book-to-Market 0.021*** 0.024***
(10.797) (8.304)
Block 0.000*** 0.000***
(12.097) (8.103)
Year -0.008*** -0.011*** -0.008*** -0.011*** -0.008*** -0.012***
(-13.317) (-14.52) (-16.639) (-16.967) (-17.983) (-18.693)
Intercept 0.205*** 0.197*** 0.022*** 0.245*** 0.228*** 0.025*** 0.209*** 0.198*** 0.024***
(31.467) (43.712) (3.875) (48.758) (55.82) (5.296) (40.191) (42.067) (5.486)
Adjusted R Square 0.089 0.122 0.482 0.351 0.556 0.416
Degree of Freedom 2032 1620 2031 1619 2027 1615
92
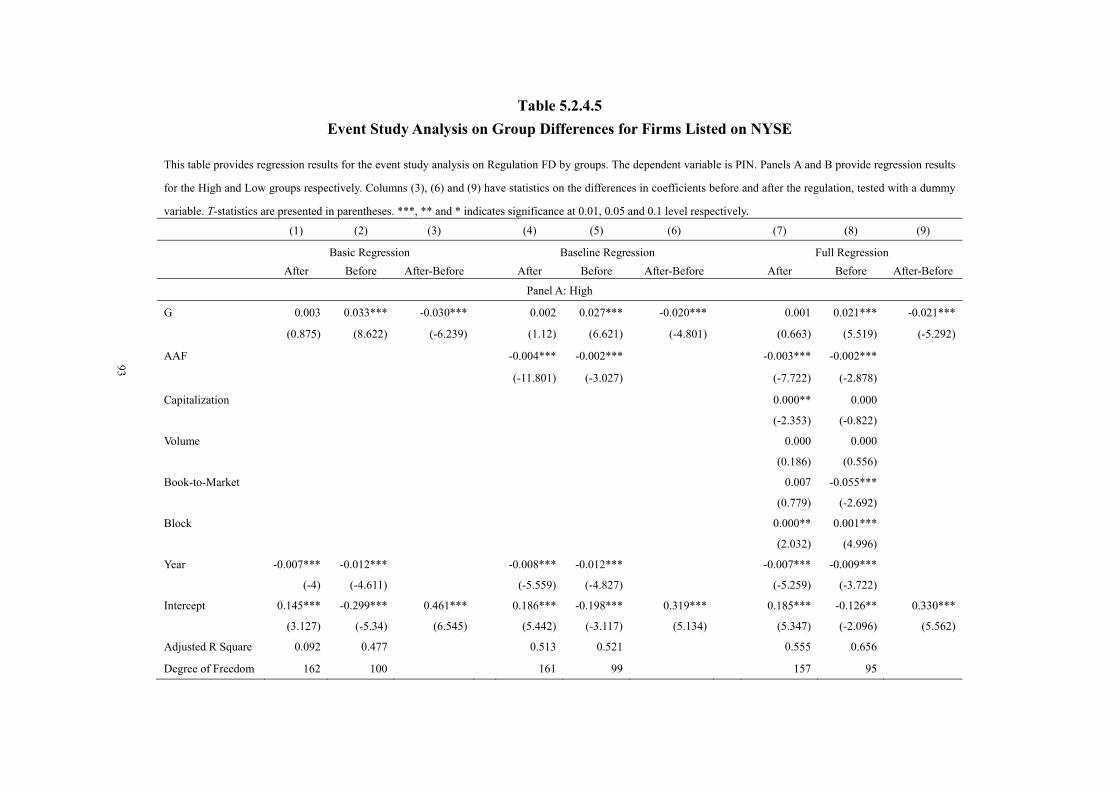
93
Table 5.2.4.5
Event Study Analysis on Group Differences for Firms Listed on NYSE
This table provides regression results for the event study analysis on Regulation FD by groups. The dependent variable is PIN. Panels A and B provide regression results
for the High and Low groups respectively. Columns (3), (6) and (9) have statistics on the differences in coefficients before and after the regulation, tested with a dummy
variable. T-statistics are presented in parentheses. ***, ** and * indicates significance at 0.01, 0.05 and 0.1 level respectively.
(1) (2) (3) (4) (5) (6) (7) (8) (9)
Basic Regression Baseline Regression Full Regression
After Before After-Before After Before After-Before After Before After-Before
Panel A: High
G 0.003 0.033*** -0.030*** 0.002 0.027*** -0.020*** 0.001 0.021*** -0.021***
(0.875) (8.622) (-6.239) (1.12) (6.621) (-4.801) (0.663) (5.519) (-5.292)
AAF -0.004*** -0.002*** -0.003*** -0.002***
(-11.801) (-3.027) (-7.722) (-2.878)
Capitalization 0.000** 0.000
(-2.353) (-0.822)
Volume 0.000 0.000
(0.186) (0.556)
Book-to-Market 0.007 -0.055***
(0.779) (-2.692)
Block 0.000** 0.001***
(2.032) (4.996)
Year -0.007*** -0.012*** -0.008*** -0.012*** -0.007*** -0.009***
(-4) (-4.611) (-5.559) (-4.827) (-5.259) (-3.722)
Intercept 0.145*** -0.299*** 0.461*** 0.186*** -0.198*** 0.319*** 0.185*** -0.126** 0.330***
(3.127) (-5.34) (6.545) (5.442) (-3.117) (5.134) (5.347) (-2.096) (5.562)
Adjusted R Square 0.092 0.477 0.513 0.521 0.555 0.656
Degree of Freedom 162 100 161 99 157 95
93

94
(1) (2) (3) (4) (5) (6) (7) (8) (9)
Basic Regression Baseline Regression Full Regression
After Before After-Before After Before After-Before After Before After-Before
Panel B: Low
G 0.002 -0.011 0.013 0.005 -0.013** 0.018* -0.001 -0.014** 0.015
(0.266) (-1.527) (1.203) (0.58) (-2.181) (1.859) (-0.109) (-2.574) (1.628)
AAF -0.003*** -0.004*** -0.002** -0.002
(-3.91) (-8.075) (-2.099) (-2.611)
Capitalization 0.000 0.000
(0.399) (0.31)
Volume 0.000 0.000*
(-0.801) (-1.943)
Book-to-Market 0.006 0.035***
(0.304) (3.594)
Block 0.001** 0.001***
(2.303) (3.892)
Year -0.006 -0.011*** -0.007 -0.01*** -0.008* -0.009***
(-1.459) (-3.385) (-1.655) (-3.694) (-1.935) (-3.748)
Intercept 0.181*** 0.25*** -0.041 0.202*** 0.291*** -0.063 0.205*** 0.24*** -0.049
(3.384) (7.448) (-0.788) (4.092) (10.269) (-1.384) (4.022) (8.319) (-1.160)
Adjusted R Square 0.027 0.088 0.186 0.374 0.299 0.488
Degree of Freedom 79 144 78 143 74 139
94

95
Figure 3.1
Tree Diagram of the Trading Process
Easley et al. (1996, pg 1409).
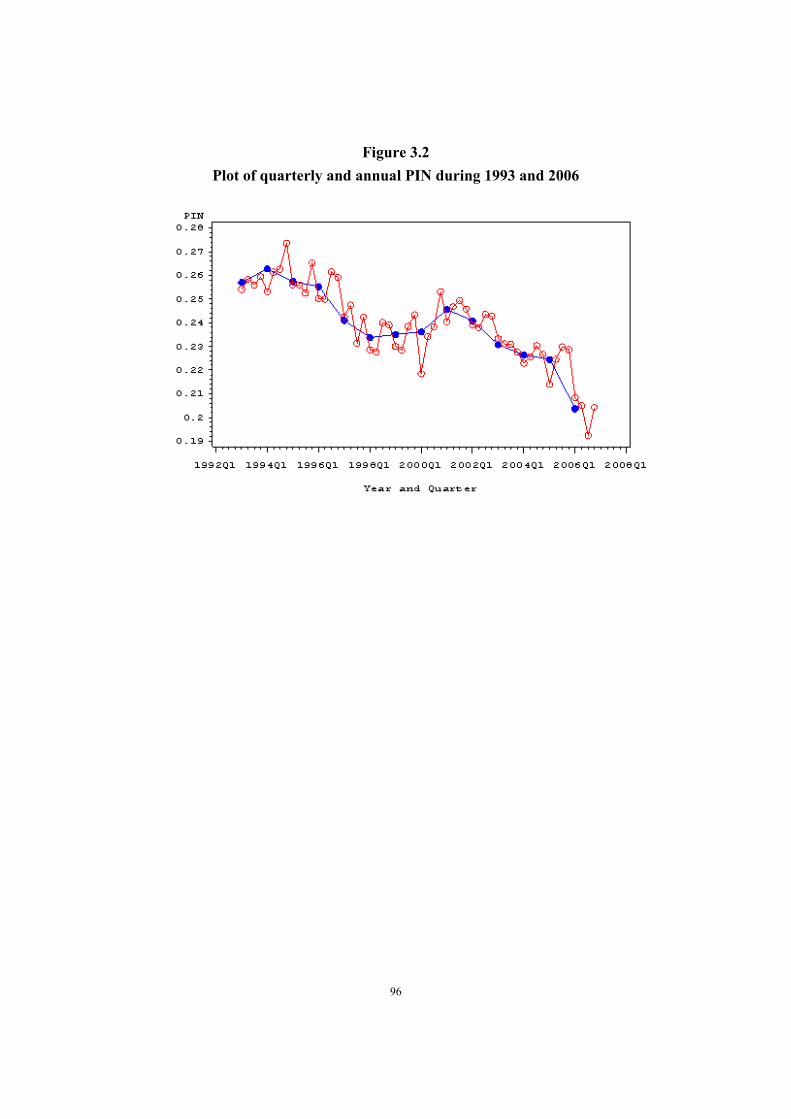
96
Figure 3.2
Plot of quarterly and annual PIN during 1993 and 2006

97
Figure 3.3
Sample Construction Process of G

98
Figure 3.4
Main Regression Variables Construction Process

99
Figure 4.1
Disclosure Decision Process

100
Figure 4.2
Information Impact Path

101
Figure 4.3
Internal and External Forces on Disclosure Structure
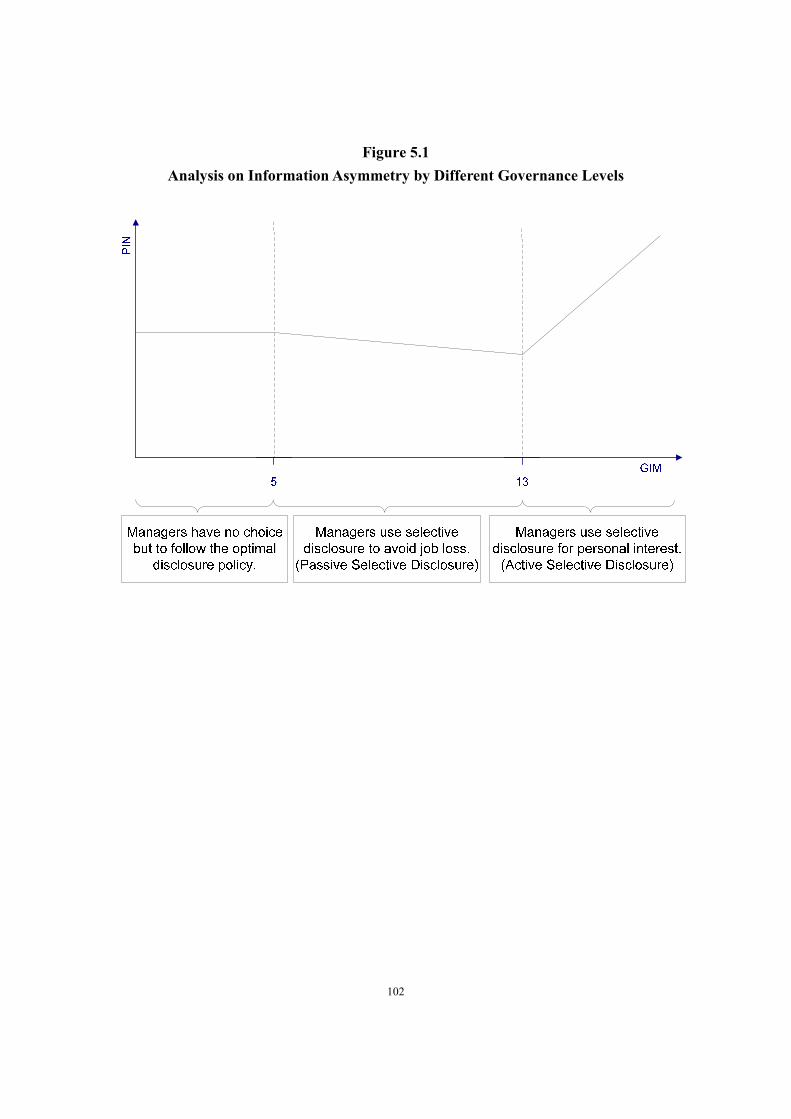
102
Figure 5.1
Analysis on Information Asymmetry by Different Governance Levels
103
Figure 5.2
Frequency Histogram of PIN

104
Figure 5.3
Frequency Histogram of LOGPIN


![Saskatoon Retriever Club [HUNT TEST] CATALOGUE · Saskatoon Retriever Club [HUNT TEST] CATALOGUE To be held At Saskatoon Retriever Grounds located about 35 km (22 miles) SE of Saskatoon](https://img.pdfslide.net/doc/110x75/5af572557f8b9a95468f625d/saskatoon-retriever-club-hunt-test-catalogue-retriever-club-hunt-test-catalogue.jpg)