Embed Size (px)
Citation preview
th46 Annual Report 2008-09
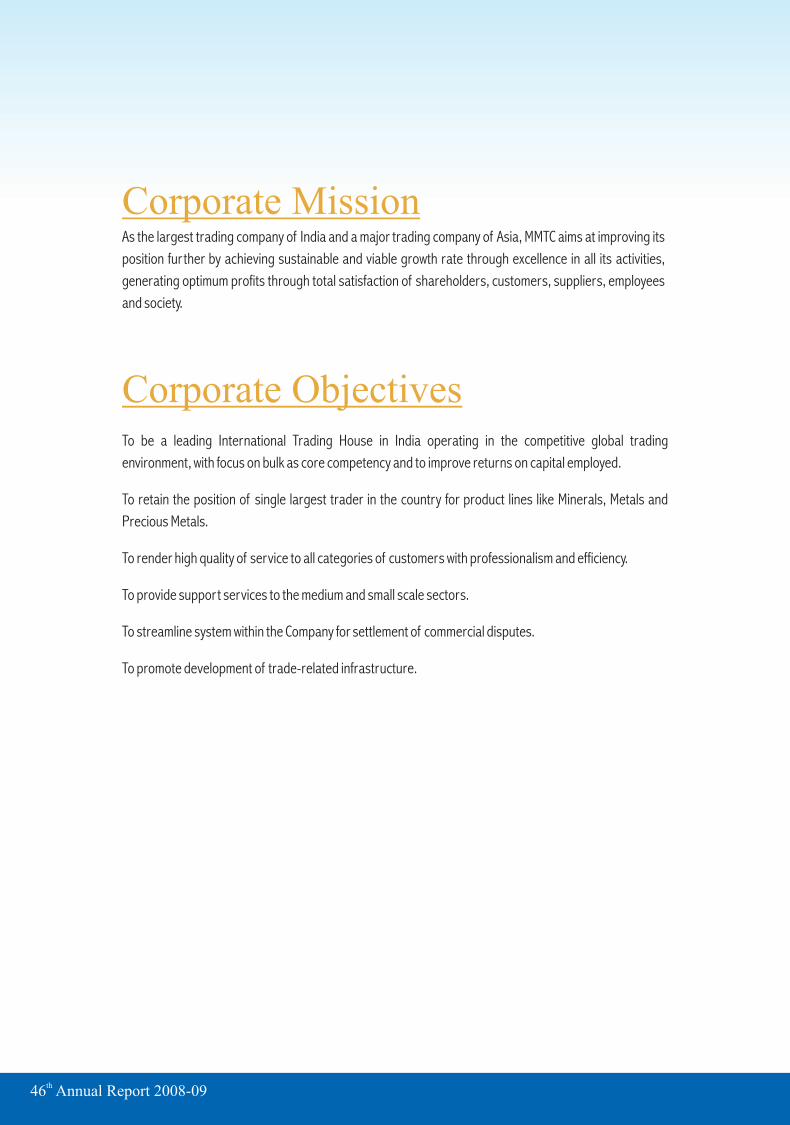
As the largest trading company of India and a major trading company of Asia, MMTC aims at improving its
position further by achieving sustainable and viable growth rate through excellence in all its activities,
generating optimum profits through total satisfaction of shareholders, customers, suppliers, employees
and society.
Corporate Mission
To be a leading International Trading House in India operating in the competitive global trading
environment, with focus on bulk as core competency and to improve returns on capital employed.
To retain the position of single largest trader in the country for product lines like Minerals, Metals and
Precious Metals.
To render high quality of service to all categories of customers with professionalism and efficiency.
To provide support services to the medium and small scale sectors.
To streamline system within the Company for settlement of commercial disputes.
To promote development of trade-related infrastructure.
Corporate Objectives
Largest International Trading Company of India.
Largest exporter of Minerals from India, bagging CAPEXIL award consecutively for the last 18 years.
Single largest importer/supplier of Bullion and Non-ferrous Metals in the country.
Leading international trader of Agro, Fertilizers, Coal & Hydrocarbons.
Present at 56 locations in India through offices, warehouses, port offices and retail outlets.
Subsidiary in Singapore (MTPL) holds prestigious "Global Trader Programme" (GTP) status.
Enhanced product offerings through its promoted project, Neelachal Ispat Nigam Ltd. (NINL),
a 1.10 million ton Iron & Steel Plant in Orissa.
¡
¡Highest ever imports of Rs. 306951 million.
¡Best ever exports of Rs. 45759 million.
¡Highest ever sales per employee at Rs. 196 million.
Highest ever trade turnover of Rs. 368207 million.
¡
¡Setting up of Commodity Exchange jointly with Indiabulls.
¡Opening a London Metal Exchange warehouse in India.
¡Setting up gold/silver medallion manufacturing unit as JV with international partner.
¡Setting up chain of retail stores in different cities of India for sale of medallions, jewellery and SANCHI
silverware.
¡Setting up of permanent iron ore loading berth at Ennore as joint venture.
¡Setting up free trade and warehousing zones along with JV partner.
¡Exploration of coal block allotted to MMTC.
¡Developing SEZ for jewellery alongwith JV partner being explored.
¡Developing port jetty in Paradip with a consortium.
15 MW wind energy farm in the State of Karnataka (commissioned & working).
MMTC Today
Highlights of Performance 2008-09
Strategic Initiatives
3
(Rs. in million)
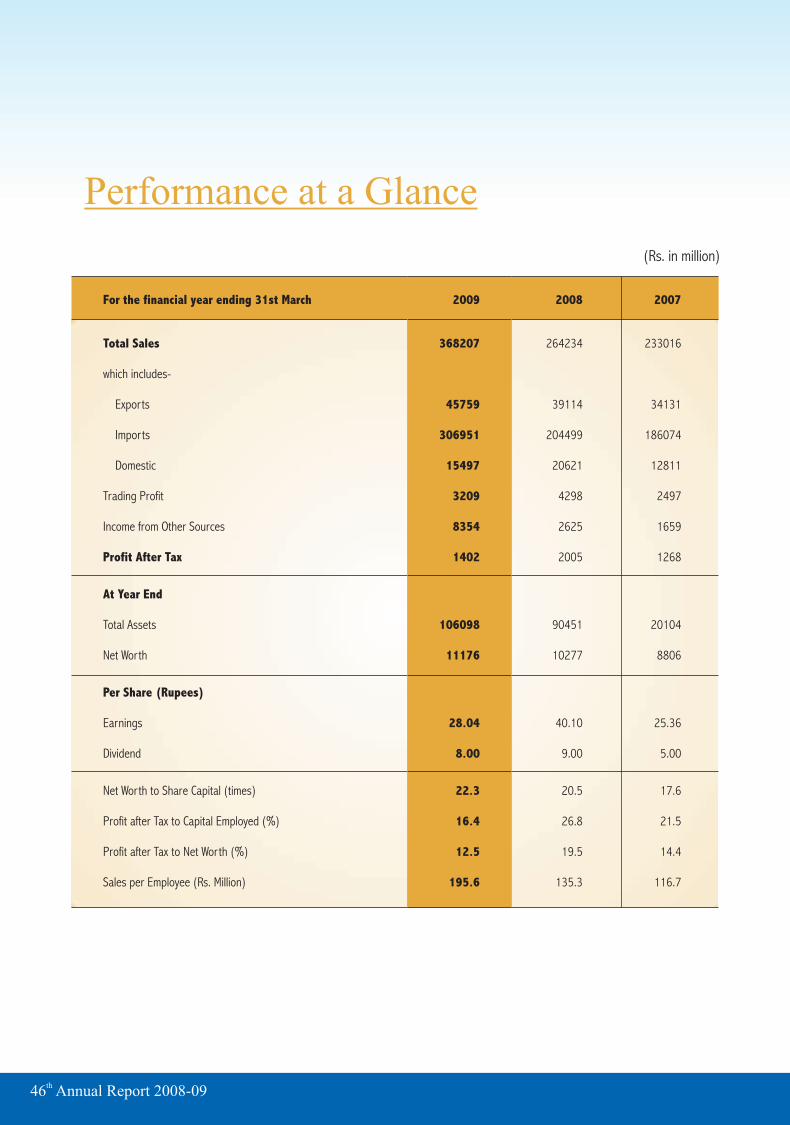
For the financial year ending 31st March 2009 2008 2007
Total Sales 368207 264234 233016
which includes-
Exports 45759 39114 34131
Imports 306951 204499 186074
Domestic 15497 20621 12811
Trading Profit 3209 4298 2497
Income from Other Sources 8354 2625 1659
Profit After Tax 1402 2005 1268
At Year End
Total Assets 106098 90451 20104
Net Worth 11176 10277 8806
Per Share (Rupees)
Earnings 28.04 40.10 25.36
Dividend 8.00 9.00 5.00
Net Worth to Share Capital (times) 22.3 20.5 17.6
Profit after Tax to Capital Employed (%) 16.4 26.8 21.5
Profit after Tax to Net Worth (%) 12.5 19.5 14.4
Sales per Employee (Rs. Million) 195.6 135.3 116.7
Performance at a Glance
th46 Annual Report 2008-09
reserves exceeding Rs. 1073 crores with its turnover touching a
staggering figure of Rs. 36821 crores in 2008-09 with zero long term
debt liability. Today MMTC - India's largest International Trading
Company has a strong nation wide trading network offering a large
and wide range of products and services and is the largest exporter
of minerals from India, largest single importer/ supplier of bullion in
the country, leading exporter/importer of agro commodities and a
major player in coal and hydrocarbons, metals and fertilizers sectors.
The Company has the unique record of uninterrupted profit and
dividend payment since last 40 years.
Performance during 2008-09
All of us have a reason to feel proud of the strength of character, the
sagacity, the resilience and the foresight with which MMTC has
successfully negotiated the last 46 years of its operations. All these
sterling characteristics were severely tested during 2008-09 and
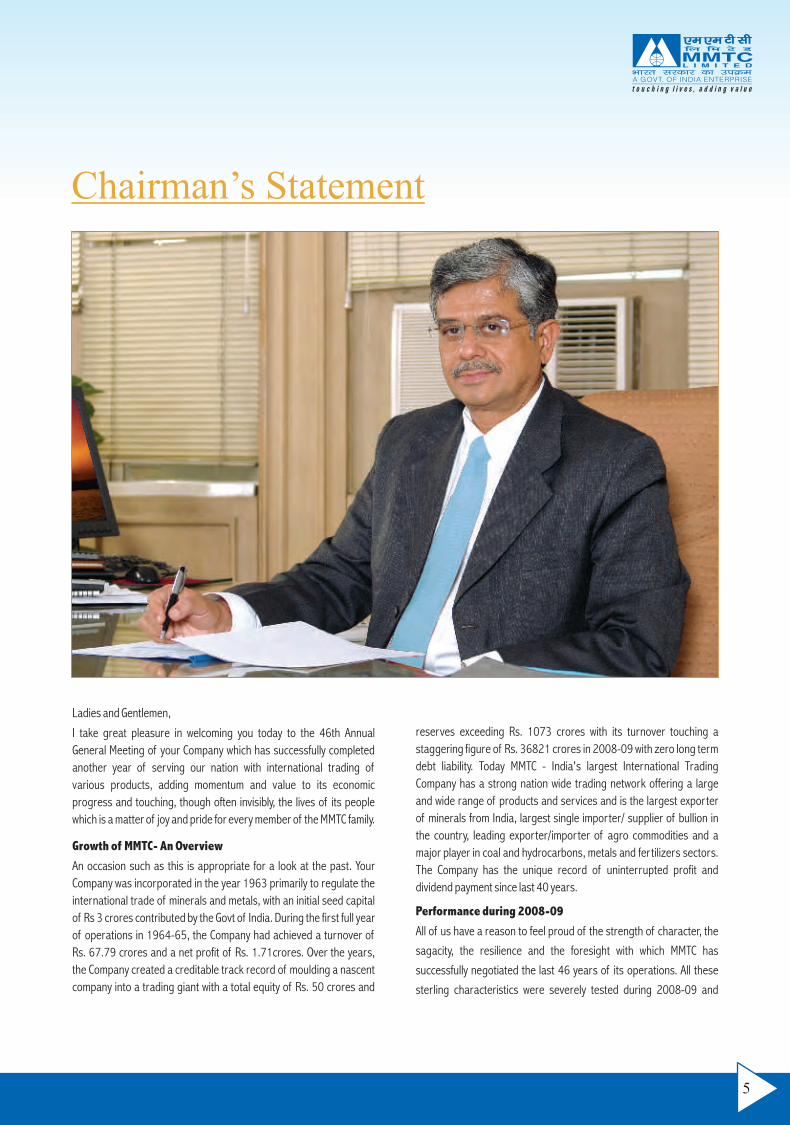
Ladies and Gentlemen,
I take great pleasure in welcoming you today to the 46th Annual
General Meeting of your Company which has successfully completed
another year of serving our nation with international trading of
various products, adding momentum and value to its economic
progress and touching, though often invisibly, the lives of its people
which is a matter of joy and pride for every member of the MMTC family.
Growth of MMTC- An Overview
An occasion such as this is appropriate for a look at the past. Your
Company was incorporated in the year 1963 primarily to regulate the
international trade of minerals and metals, with an initial seed capital
of Rs 3 crores contributed by the Govt of India. During the first full year
of operations in 1964-65, the Company had achieved a turnover of
Rs. 67.79 crores and a net profit of Rs. 1.71crores. Over the years,
the Company created a creditable track record of moulding a nascent
company into a trading giant with a total equity of Rs. 50 crores and
Chairman’s Statement
5
Subsidiary Company
During the year 2008-09, MMTC Transnational Pte. Ltd. Singapore
(MTPL)- the wholly owned subsidiary of your Company also achieved
its highest ever business turnover of US$ 686 million and generated
its highest ever net profit of US$ 6.91 million, registering growth of
254% over the previous year. The net worth of MTPL stood at US$
14.58 million as on 31st March 2009. It has so far paid total dividends
of US$ 4.08 million besides multiplying its net worth by nearly
15 times since its inception in end 1994.
MMTC's Promoted Project-Neelachal Ispat Nigam Ltd.
(NINL)
As a strategy to diversify and add value to trading operations, your
Company jointly with the Govt of Orissa, has set up Neelachal Ispat
Nigam Limited (NINL) - an iron and steel plant of 1.1 million tonnes
capacity, 0.8 million tonne coke oven plant with captive power plants
The project has firm iron ore supply linkages and also has captive Iron
ore mining rights for reserves estimated at about 150 million tonnes.
The phase-1 (pig iron) of the plant with a project cost of Rs.1910
crores has already commenced commercial production. The
construction of phase-II of the Project costing Rs.1810 crores is
under progress. During the financial year 2008-09 NINL has recorded
a sales turnover of Rs.1359 crores with a net profit after tax of
Rs.79.2 crores.
Corporate Governance in MMTC
We at MMTC are continuously dedicated to promoting the principles of
sound corporate governance norms as a self discipline code for
sustainable enrichment of stakeholders' value.
This year again your Company has received 'NIL' comments from CAG
successively for third year in a row. The Statutory Auditors too have
not given any adverse comments having an impact on the profit for the
year 2008-09. This proves the commitment and conviction of your
Company for the best accounting and disclosure practices.
Looking Ahead
While at one level we gamely combated the effects of the downturn, at
another we have been aggressively pursuing our aim of
diversification, with a view to add value to MMTC's existing trading
operations, through various strategic initiatives following public-
private partnership routes. These value multiplier initiatives to
enhance your Company's future sustainability, in broad terms include:
I am happy to share with you that your Company was able to weather
the storm and has continued to be successful. The suddenness and
severity of the global financial crisis caught everybody by surprise. We,
in India, had initially hoped that the inherent strength and momentum
of our rapidly growing economy would insulate us from the global ills.
However, our economy started to slow down even as the global
economy went into reverse gear and before we knew it, we were
fighting with our backs to the wall. According to World Trade
Organization economists, world economic growth slowed abruptly in
2008 against the backdrop of the worst financial crisis since the
1930s. Growth in 2008 was down to 1.7%, from 3.5% a year earlier
and was the slowest since 2001- well below the 10 year average rate
of 2.9%. Developed economies only managed a meagre 0.8% growth
during the last year, compared to 2.5% in 2007. Developing
economies also behaved in a similar fashion and expanded their
output in 2008 by 5.6%, down from 7.5% in 2007.
Despite signs of the sharp deterioration in trade being evident in the
later part of 2008 as demand sagged and production slowed, your
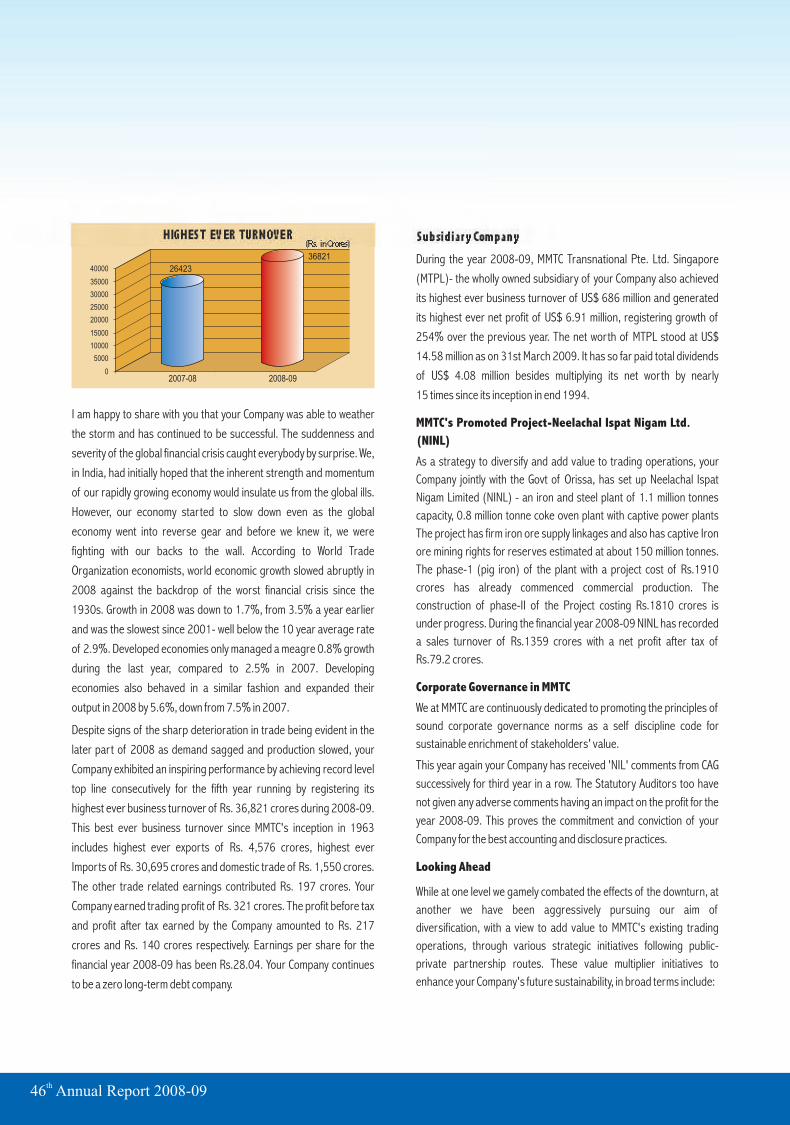
Company exhibited an inspiring performance by achieving record level
top line consecutively for the fifth year running by registering its
highest ever business turnover of Rs. 36,821 crores during 2008-09.
This best ever business turnover since MMTC's inception in 1963
includes highest ever exports of Rs. 4,576 crores, highest ever
Imports of Rs. 30,695 crores and domestic trade of Rs. 1,550 crores.
The other trade related earnings contributed Rs. 197 crores. Your
Company earned trading profit of Rs. 321 crores. The profit before tax
and profit after tax earned by the Company amounted to Rs. 217
crores and Rs. 140 crores respectively. Earnings per share for the
financial year 2008-09 has been Rs.28.04. Your Company continues
to be a zero long-term debt company.
(Rs. in Crores)HIGHEST EVER TURNOVER
26423
0
5000
10000
15000
20000
25000
30000
35000
40000
2007-08 2008-09
36821
th46 Annual Report 2008-09
7
1. Setting up of a commodity exchange under the name and style of
“Indian Commodity Exchange Limited” which is likely to
commence operations shortly.
2. Setting up of a currency futures exchange under the name and
style of “United Stock Exchange of India Ltd” which also is likely
to commence operations shortly.
3. Joining hands with an international producer as a joint venture
partner for setting up a gold /silver medallion manufacturing
unit, which would also include a gold refinery as an integral part,
under the name and style of “MMTC-Pamp India Private
Limited”. The civil construction activities for the said unit have
already commenced in Haryana and the unit is likely to
commence trial production in mid 2010.
4. For effective marketing of the finished products from the above
unit, as well as jewellery from other sources, your Company will
be setting up, in partnership with a leading Indian company, a
chain of retail stores at various cities in India for medallions,
jewellery and its homegrown brand of 'SANCHI' silverware.
Towards this end a special purpose vehicle (SPV) under the
name and style of “MMTC-Gitanjali Private Limited” has been
incorporated and to begin with one retail store each in Delhi,
Gurgaon and Ahmedabad has already been opened under the
name “SHUDDHI” by the said SPV.
5. Setting up permanent berth with loading facilities for iron ore at
Ennore Port jointly with SICAL and L&T Infrastructure Ltd. under
the name and style of M/s. SICAL Iron Ore Terminals Limited,
Chennai. The permanent berth being constructed by M/s. SICAL
Iron Ore Terminals Limited is likely to be operational by
mid 2010.
6. Development of deep draught iron ore berth at Paradeep Port
(Orissa) jointly with Noble Group Ltd and Gammon Infrastructure
Projects Ltd under the name and style of M/s. Blue Water Iron
Ore Terminal Private Ltd.
7. Towards investing in mining infrastructure your Company is
promoting a joint venture company with M/s TATA Steel Ltd. for
exploration and development of mines for minerals, ferrous and
non-ferrous ores, precious metals, diamonds and coal etc.
8. Your Company has been allotted a coal mine in Jharkhand having
estimated reserves of about 700 million MT, pre-feasibility study
of which has already commenced and prospecting license is
likely to be issued shortly by the concerned authorities.
These value multiplier projects, which your Company is pursuing, are
progressing well and once commissioned shall provide integrated
dimensions to your Company's diversification pursuit with huge upside
potential.
Acknowledgements
I take this opportunity, to express my thanks to all the shareholders for
their continued trust in the Board of Directors and the Management of
the Company. I am grateful to the Govt of India, our principal
shareholder, for its full support and valuable guidance. On behalf of
the Company, I would also like to thank all our customers, suppliers
and other business associates for their support and co-operation
without which the success of the past 46 years would not have been
possible. I look forward to your continued support in the Company's
exciting journey into the future.
Thank you.
Sanjiv BatraChairman and Managing Director
New Delhith30 September 2009
Note : The above statement does not purport to be part of the proceedings at the46th AGM of MMTC Limited held on 30th September 2009.
th46 Annual Report 2008-09
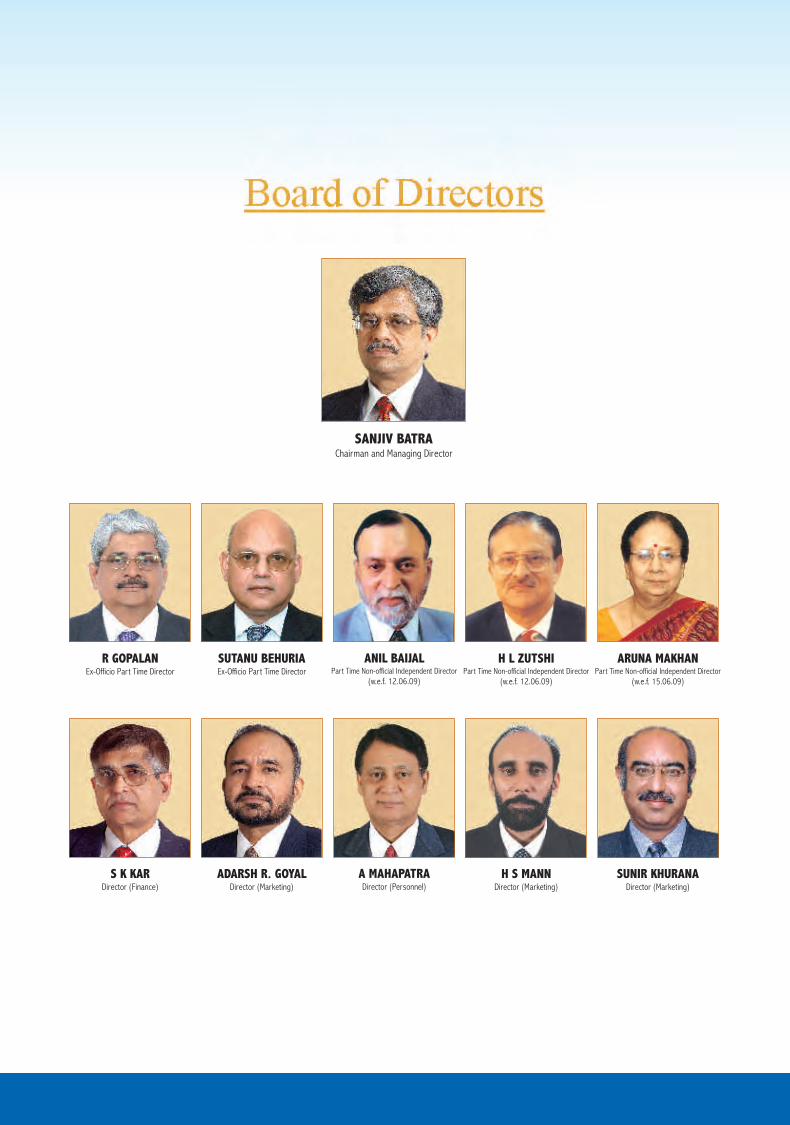
SANJIV BATRAChairman and Managing Director
H S MANNDirector (Marketing)
S K KARDirector (Finance)
ADARSH R. GOYAL Director (Marketing)
A MAHAPATRADirector (Personnel)
SUNIR KHURANA Director (Marketing)
H L ZUTSHIPart Time Non-official Independent Director
(w.e.f. 12.06.09)
R GOPALANEx-Officio Part Time Director
SUTANU BEHURIAEx-Officio Part Time Director
ANIL BAIJALPart Time Non-official Independent Director
(w.e.f. 12.06.09)
ARUNA MAKHANPart Time Non-official Independent Director
(w.e.f. 15.06.09)
Board of Directors
9
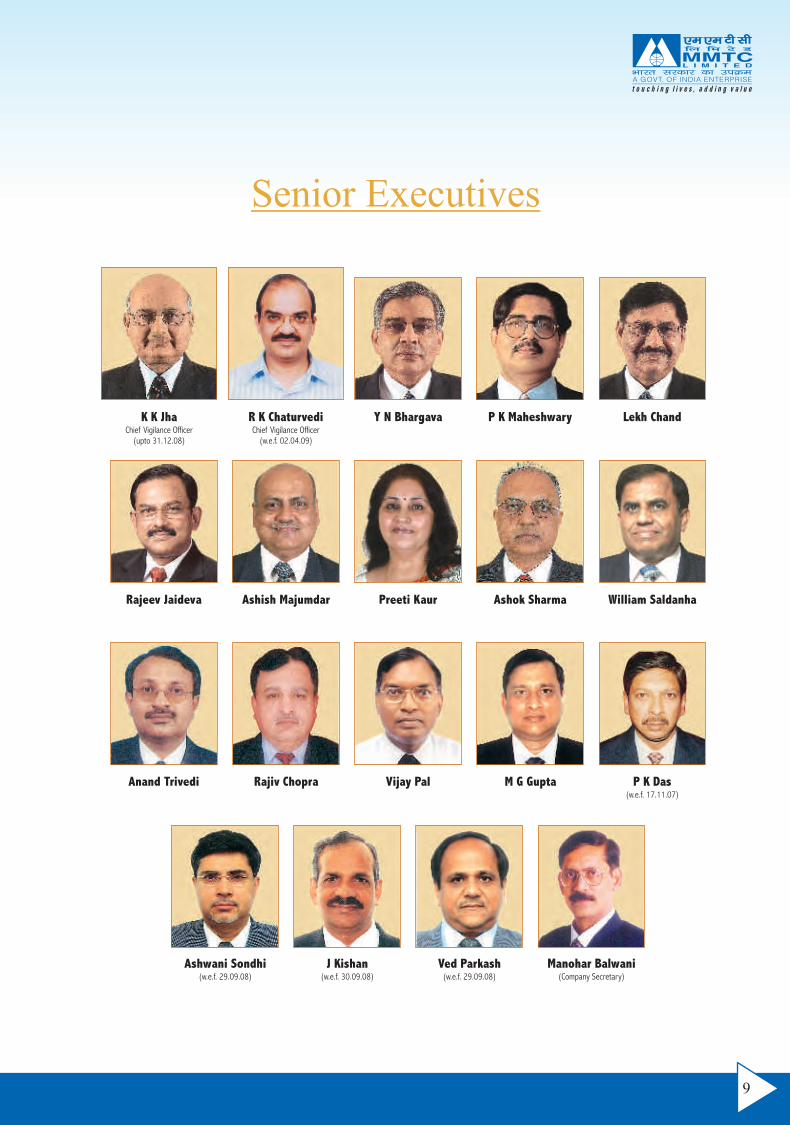
K K JhaChief Vigilance Officer
(upto 31.12.08)
R K ChaturvediChief Vigilance Officer
(w.e.f. 02.04.09)
Y N Bhargava P K Maheshwary Lekh Chand
Rajeev Jaideva Ashish Majumdar Preeti Kaur Ashok Sharma William Saldanha
Anand Trivedi Rajiv Chopra Vijay Pal M G Gupta P K Das(w.e.f. 17.11.07)
Manohar Balwani (Company Secretary)
J Kishan(w.e.f. 30.09.08)
Ved Parkash(w.e.f. 29.09.08)
Ashwani Sondhi(w.e.f. 29.09.08)
Senior Executives
th46 Annual Report 2008-09
(Rs. in million)
2008-09 2007-08
Exports 45,759 39,114
Imports 306,951 204,499
Domestic 15,497 20,621
Other trade earnings 1967 796
Net Sales/ Trading Earnings 370174 265,030
Trading Profit 3209 4298
Profit before Taxes 2174 3,246
Profit after Taxes 1402 2,005
Dividend
(i) Interim Dividend on Equity Shares 200 175
(ii) Proposed Dividend 200 275
(iii) Dividend Tax 68 76
Reserves and Surplus 10734 9800
The MembersMMTC Limited
On behalf of Board of Directors, I have pleasure in presenting 46th Annual Report on the performance of your company for the financial year ended 31st March 2009 along with Audited Statements of Accounts, Auditor’s Report & Review of Accounts by the Comptroller and Auditor General of India.
Results of Operations
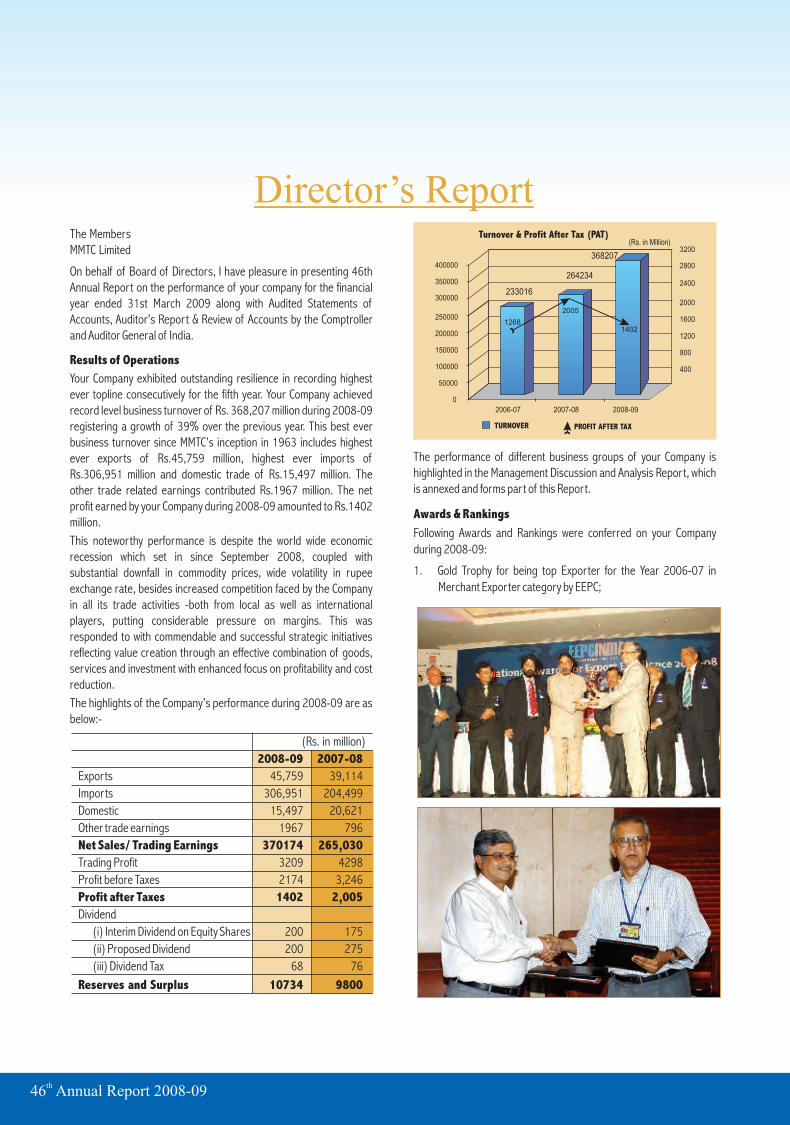
Your Company exhibited outstanding resilience in recording highest ever topline consecutively for the fifth year. Your Company achieved record level business turnover of Rs. 368,207 million during 2008-09 registering a growth of 39% over the previous year. This best ever business turnover since MMTC’s inception in 1963 includes highest ever exports of Rs.45,759 million, highest ever imports of Rs.306,951 million and domestic trade of Rs.15,497 million. The other trade related earnings contributed Rs.1967 million. The net profit earned by your Company during 2008-09 amounted to Rs.1402 million.
This noteworthy performance is despite the world wide economic recession which set in since September 2008, coupled with substantial downfall in commodity prices, wide volatility in rupee exchange rate, besides increased competition faced by the Company in all its trade activities -both from local as well as international players, putting considerable pressure on margins. This was responded to with commendable and successful strategic initiatives reflecting value creation through an effective combination of goods, services and investment with enhanced focus on profitability and cost reduction.
The highlights of the Company’s performance during 2008-09 are as below:-
The performance of different business groups of your Company is highlighted in the Management Discussion and Analysis Report, which is annexed and forms part of this Report.
Awards & Rankings
Following Awards and Rankings were conferred on your Company during 2008-09:
1. Gold Trophy for being top Exporter for the Year 2006-07 in Merchant Exporter category by EEPC;
Director’s ReportTurnover & Profit After Tax (PAT)
0
50000
2006-07
264234
2007-08
233016
2008-09
2005
(Rs. in Million)
TURNOVER PROFIT AFTER TAX
3200
300000
350000
400000
100000
150000
200000
2500001268
2000
1200
800
400
1600
2400
2800368207
1402
11
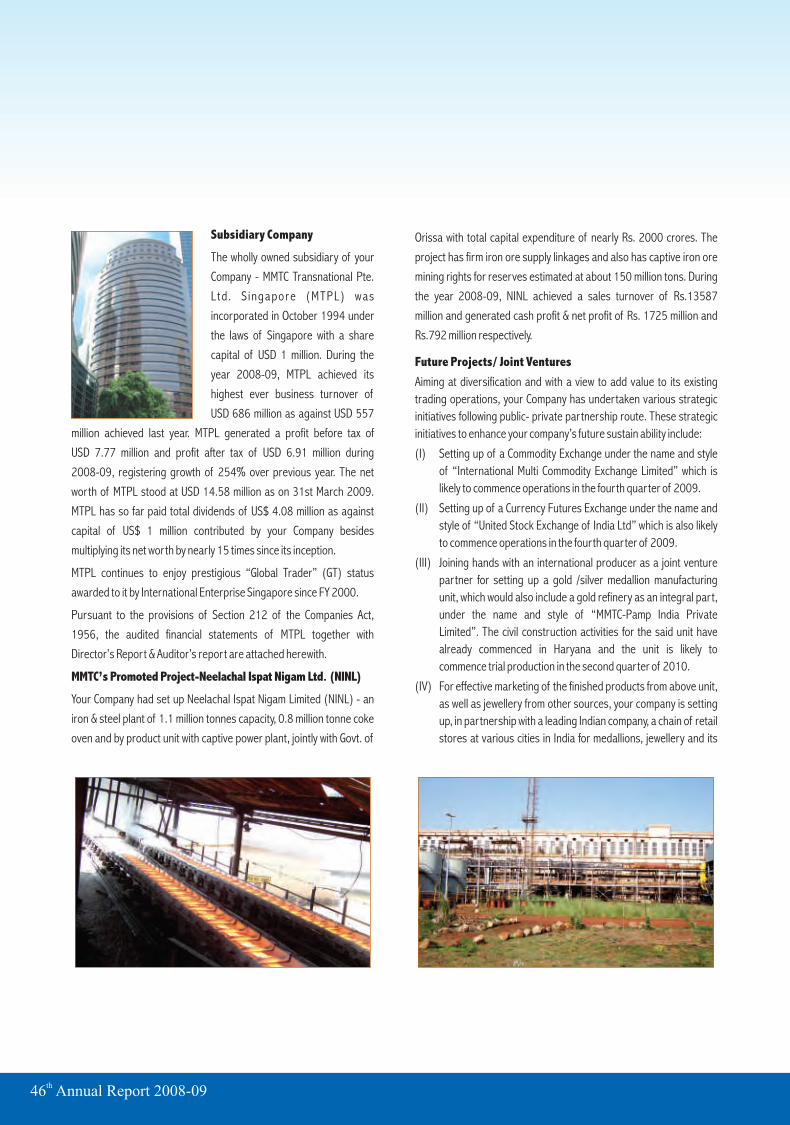
EARNINGS OUTGO
Rs. In Million Rs. In Million
Exports 45788.40 Imports 306271.95
Others 159.66 Interest 1007.16
Others 2132.58
Total 45948.06 Total 309411.69
Reserves
A sum of Rs. 9800 million was available in the reserves and surplus of
your Company as on 1st April 2008. Your Directors have proposed
that out of Rs.934 million available out of the profits for the year
2008-09, after payment of dividend and tax thereon, an amount of
Rs.170 million be transferred to General Reserves of the Company
and balance profit of Rs.764 million be carried forward as retained
profits. Accordingly an amount of Rs.10734 million shall be available
in “Reserves and Surplus” of your Company as on 31st March 2009.
Foreign Exchange Earnings and Outgo
The Foreign Exchange earnings and outgo of your Company during
2008-09 has been as under: -
2. CAPEXIL highest award for highest export in Minerals and Ores
sector for the year 2007-08, (17th time in a row);
3. Niryat Shree Bronze Trophy for the year 2005-06 presented by
the Hon’ble President of India, in January 2009 in the Highest
Foreign Exchange Earner category by Federation of Indian
Exporters Organisation (FIEO).
4. Top Indian Company in the Trading Sector by Dun & Bradstreet in
their rankings “India’s Top 500 companies 2008”. In the same
publication ranked 13th based on total income for the year
2007-08
5. Ranked as the Highest Wealth Creator PSU by Dalal Street
Journal
6. Top ranking in the list of India’s top 100 wealth creation
companies published by the Times Group and the Economic
Times in their publication “ET 500” released in Oct 2008. In the
same publication MMTC has been ranked 17th amongst India’s
biggest companies
7. Ranked 4th amongst India’s most valuable Public Sector
Companies by “Business Today” in its publication “BT500”
released in November 2008. In the same publication, ranked at
6th place amongst 10 most valuable companies.
8. Ranked 12th in the list of India’s Top PSUs 2009 released by Dun
& Bradstreet
Dividend
An interim dividend @ 40% on the Paid-up Capital was declared by
Board of Directors and paid to the shareholders in March 2009. The
Board of Directors recommend the declaration of final dividend of
80% which would include interim dividend @ 40% already paid on the
equity capital of the Company for the year 2008-09.
th46 Annual Report 2008-09
Subsidiary Company
The wholly owned subsidiary of your
Company - MMTC Transnational Pte.
Ltd. S ingapore (MTPL) was
incorporated in October 1994 under
the laws of Singapore with a share
capital of USD 1 million. During the
year 2008-09, MTPL achieved its
highest ever business turnover of
USD 686 million as against USD 557
million achieved last year. MTPL generated a profit before tax of
USD 7.77 million and profit after tax of USD 6.91 million during
2008-09, registering growth of 254% over previous year. The net
worth of MTPL stood at USD 14.58 million as on 31st March 2009.
MTPL has so far paid total dividends of US$ 4.08 million as against
capital of US$ 1 million contributed by your Company besides
multiplying its net worth by nearly 15 times since its inception.
MTPL continues to enjoy prestigious “Global Trader” (GT) status
awarded to it by International Enterprise Singapore since FY 2000.
Pursuant to the provisions of Section 212 of the Companies Act,
1956, the audited financial statements of MTPL together with
Director’s Report & Auditor’s report are attached herewith.
MMTC’s Promoted Project-Neelachal Ispat Nigam Ltd. (NINL)
Your Company had set up Neelachal Ispat Nigam Limited (NINL) - an
iron & steel plant of 1.1 million tonnes capacity, 0.8 million tonne coke
oven and by product unit with captive power plant, jointly with Govt. of
Orissa with total capital expenditure of nearly Rs. 2000 crores. The
project has firm iron ore supply linkages and also has captive iron ore
mining rights for reserves estimated at about 150 million tons. During
the year 2008-09, NINL achieved a sales turnover of Rs.13587
million and generated cash profit & net profit of Rs. 1725 million and
Rs.792 million respectively.
Future Projects/ Joint Ventures
Aiming at diversification and with a view to add value to its existing
trading operations, your Company has undertaken various strategic
initiatives following public- private partnership route. These strategic
initiatives to enhance your company’s future sustain ability include:
(I) Setting up of a Commodity Exchange under the name and style
of “International Multi Commodity Exchange Limited” which is
likely to commence operations in the fourth quarter of 2009.
(II) Setting up of a Currency Futures Exchange under the name and
style of “United Stock Exchange of India Ltd” which is also likely
to commence operations in the fourth quarter of 2009.
(III) Joining hands with an international producer as a joint venture
partner for setting up a gold /silver medallion manufacturing
unit, which would also include a gold refinery as an integral part,
under the name and style of “MMTC-Pamp India Private
Limited”. The civil construction activities for the said unit have
already commenced in Haryana and the unit is likely to
commence trial production in the second quarter of 2010.
(IV) For effective marketing of the finished products from above unit,
as well as jewellery from other sources, your company is setting
up, in partnership with a leading Indian company, a chain of retail
stores at various cities in India for medallions, jewellery and its
13
your Company with no man-days being lost during the year. Regular
meetings were held with the unions / associations at local level and
Federation / Association at the Apex level under Joint Consultative
Machinery / Structured Scheme of Meetings for arriving at amicable
resolution of personnel issues with a view to achieve Company’s goals
and objectives.
The aggregate manpower of the Company as on 31st March 09 stood
at 1882, including six Board level executives, the balance comprising
of 613 officers, 1167 staff & 96 workers. This manpower strength
includes 24 officers, 137 staff & 96 workers of erstwhile Mica Trading
Company Ltd., which had been merged with your Company pursuant to
the orders of BIFR. While the composite representation of the total
manpower consisted of women employees representing 18.27%
(344 employees) of the total manpower, the representation of SC, ST,
OBC & persons with disabilities (PWD) was to the extent of 21.25%
(400 employees), 7.27% (137 employees), 1.06% (20 employees)
and 1.64% (31 employees) respectively. During the year 45 officers,
including 5 from SC & and 4 from OBC categories were inducted
through campus recruitment. Presidential Directives on reservations
for SCs, STs, OBCs and PWD in services were followed fully in
recruitment and promotion. In an effort for rightsizing the manpower,
Voluntary Retirement Scheme was offered which was availed by
9 officers, 32 staff cadre employees and 28 workers.
Aiming towards further enhancing / upgrading the skills of employees
in the constantly changing business scenario 960 employees were
imparted training during the year in different spheres of company’s
activities. This was done through programmes organized both with in-
house expertise as well as external resources from renowned
institutions / organizations. The employees deputed for training
included 150 employees belonging to SC, 66 to ST and 229 women
employees. In terms of man-days such training works out to
2428 training man days during the year 2008-09.
homegrown brand of ’SANCHI’ silverware. Towards this end a
special purpose vehicle (SPV) under the name and style of
“MMTC-Gitanjali Private Limited” has been incorporated and to
begin with one retail store each in Delhi and Ahmedabad have
already been opened under the name “SHUDDHI” by the said
SPV.
(V) Setting up permanent berth with loading facilities for iron ore at
Ennore Port jointly with SICAL and L&T Infrastructure Ltd. under
the name and style of M/s. SICAL Iron Ore Terminals Limited,
Chennai. The permanent berth being constructed by M/s. SICAL
Iron Ore Terminals Limited is likely to be operational in first
quarter of 2010.
(VI) Development of deep draught iron ore berth at Paradeep Port
(Orissa) jointly with Noble Group Ltd and Gammon Infrastructure
Projects Ltd under the name and style of M/s. Blue Water Iron
Ore Terminal Private Ltd.
(VII) Towards investing in mining infrastructure your Company shall
be promoting a joint venture Company with M/s TATA Steel Ltd.
for exploration and development of mines for minerals, ferrous
and non-ferrous ores, precious metals, diamonds and coal etc.
(VIII) As reported earlier, to facilitate promotion of two-way trade,
your Company is setting up of free trade and warehousing zones
at Haldia and Kandla on lines similar to Special Economic Zones.
(IX) Your Company has been allotted a coal mine in Jharkhand having
estimated reserves of about 700 million MT, pre-feasibility study
of which has already commenced and prospecting license is
likely to be issued shortly by the concerned authorities.
Industrial Relations & Human Resource Management
Cordial and harmonious industrial relations continued to prevail in
th46 Annual Report 2008-09
Implementation of Official Language
Your Company has been dedicated to uphold Official Language Policy
of the Government. Towards this and to promote usage of the Official
Language by employees of the Company, several programs in the
form of Hindi Workshops/ Hindi Week/ Hindi Fortnight were organized
at the Corporate Office and Regional Offices.
During the year the Company had the privilege of interacting with the
Parliamentary Committee on Official Languages. This Committee
visited & inspected Regional Office Mumbai, Banglore & Goa. The
Hon’ble Committee expressed satisfaction on the steps/ measures
taken and the progress made in implementation of Official Language.
During the year your Company was awarded third prize consecutively
for the second year by the Town Official Language Implementation
Committee (PSE) for the excellent work done in implementation of
Official Language Policy.
Vigilance
To enhance the goodwill & confidence emanating from value based
business practices, the Vigilance group of your Company carried
further its focus on system improvement and preventive vigilance. An
annual calendar of vigilance inspections was prepared by the group
well in advance to ensure systematic and regular vigilance
inspections. During the year regular inspections were conducted by
vigilance & non-vigilance officers and based on the feedback received,
corrective/ preventive measures were suggested. Special emphasis
was also laid on updation of trade related drills/ manuals, streamlining
of tendering and other procedures in line with the guidelines issued by
Central Vigilance Commission.
During the year under report Vigilance group of your Company was
also instrumental in organizing “Vigilance Awareness Week” in various
offices of MMTC in November 2008 whereat stress was laid upon
increasing vigilance awareness amongst employees and business
associates, to bring enhanced transparency in public dealings.
Corporate Social Responsibility
Your Company since its inception in 1963 has been sensitive to its
social responsibilities and has been discharging its responsibilities
whenever there have been any natural calamity like earthquake,
cyclone, Tsunami, drought, flood etc. The Company has adopted
Corporate Social Responsibility as Corporate Policy for which funds to
the extent of 1% of the retainable earnings of the previous year are
earmarked. The main focus of the company’s CSR policy is to provide
relief and restoration at the time of national calamities, promotion of
literacy, organize health check up camps and community activities
preferably in the neighboring areas of MMTC’s operations particularly
in backward areas.
During the year 2008-09, your Company spent over Rs.5 million on
various CSR projects which included contribution of Rs. 2.50 million to
the Chief Minister's Relief Fund, Govt. of Orissa, which was badly
affected by fury of floods.
15
Corporate Governance
Corporate governance is an area of major significance for all those
who are affected by organizations directly or indirectly, whether as
investors, directors, employees, suppliers, customers or the
community in general. Your Company remains committed and
dedicated to continuous development and adoption of the best
corporate governance practices, which include honesty, trust and
integrity, transparency, performance orientation, responsibility and
accountability, mutual respect, and commitment to the organization.
A separate report on corporate governance along with Statutory
Auditor’s certificate regarding compliance of the stipulations relating
to corporate governance specified in clause 49 of the Listing
Agreement(s) signed with stock exchanges is annexed to and forms
part of this report.
Code of Conduct
Pursuant to Clause 49 (I)(D) of the Listing Agreement signed with
Stock Exchanges, a detailed Code of Conduct for Board Members and
Senior Management Personnel has been laid down and hosted on the
website of your Company. All Board Members and Senior Management
Personnel (except one) on the regular rolls of the company as on 31st
March 2009, to whom the said code is applicable have affirmed
compliance of the same for the period ended 31st March 2009. Action
against the one defaulting General Manager is in progress.
Public Deposit Scheme
As on 1st April 2008, there were no outstanding public deposits and
the Company did not invite/ accept any public deposit during the year
ended 31st March 2009.
Statutory Auditor's Report
The Statutory Auditors have not given any comments having an impact
on the profit for the year 2008-09. Applicable disclosures have been
made in the ‘notes forming part of accounts’ in respect of other
observations contained in the report of Statutory Auditors, as
annexed, which have no financial impact on the profit for the
year 2008-09.
Comments of Comptroller & Auditor General of India
The Comptroller & Auditor General of India(C&AG) has given ‘Nil’
comments under section 619(4) of the Companies Act, 1956 on the
accounts of the Company for the year ended 31.03.2009.The
communication dated 31.08.2009 of C & AG in this regard is annexed
herewith.
Conservation of Energy
During the year 2008-09, there was no activity in Mica group of your
Company. Pursuant to Section 217(i)(e) of the Companies Act, 1956,
a statement on conservation of energy is annexed to this report.
Particulars of Employees
Pursuant to provisions of section 217(2A) of the Companies Act,
1956 read with the Companies (Particulars of Employees) Rules,
1975, as amended from time to time, it is stated that there were no
employees who were in receipt of remuneration exceeding
Rs.24 lakhs per annum or Rs. 2.00 lakhs per month during the
year 2008-09.
Directors’ Responsibility Statement
Pursuant to the provisions of Section 217(2AA) of the Companies Act,
1956, your Directors state:
i) That in the preparation of the annual accounts, the applicable
accounting standards have been followed along with proper
explanation relating to material departures;
ii) That the Directors had selected such accounting policies and
applied them consistently and made judgments and estimates
that are reasonable and prudent so as to give a true and fair
view of the state of affairs of the Company at the end of the
financial year and of the profit of the Company for the year
ended 31.3.2009;
iii) That the Directors have taken a proper and sufficient care for the
maintenance of the adequate accounting records in accordance
with the provisions of Companies Act, 1956 for safeguarding the
assets of the Company and for preventing and detecting fraud
and other irregularities;
iv) That the Directors have prepared the annual accounts on a
going concern basis.
th46 Annual Report 2008-09
Board of Directors
¡Shri Anil Baijal assumed the charge of Non Official Part Time Director (Independent Director) on the Board of MMTC w.e.f. 12th June 2009.
¡Smt Aruna Makhan assumed the charge of Non Official Part Time Director (Independent Director) on the Board of MMTC w.e.f. 15th June 2009.
¡Shri H L Zutshi assumed the charge of Non Official Part Time Director (Independent Director) on the Board of MMTC w.e.f. 12th June 2009.
The Board welcomes Shri Anil Baijal, Smt. Aruna Makhan & Shri H L Zutshi and expresses confidence that the Company shall immensely benefit from their rich and varied experience.
In terms of provisions of Article 87(4)(A) of Articles of Association of the Company regarding rotational retirement of Directors, Shri R Gopalan, Director, Shri Adarsh R Goyal, Director (Marketing), Shri A Mahapatra, Director (Personnel) and Shri H S Mann, Director (Marketing) shall retire at the AGM and being eligible have offered themselves for reappointment.
Acknowledgements
Your Directors are thankful to the Department of Commerce, all govt. agencies, RBI and other banks, railways, customs, ports, NMDC, customers and suppliers for their valuable support and cooperation during the year. Your Directors also wish to place on record their deep sense of appreciation for the committed services rendered by managers and staff of your Company without which it would not have been possible to realize significant business and profit recorded during the year.
By the Order of the Board
Place : New Delhi (Sanjiv Batra)
Dated: 31st August, 2009 Chairman and Managing Director

Overview of Global Developments in 2008
According to World Trade Organization economists, world economic
growth – measured by total production, or gross domestic product
(GDP) – slowed abruptly in 2008 against the backdrop of the worst
financial crisis since the 1930s. Growth in 2008 was down to 1.7%,
from 3.5% a year earlier and was the slowest since 2001- well below
the 10 year average rate of 2.9%. Developed economies only
managed a meagre 0.8% growth during last year, compared to 2.5%
in 2007. Developing economies, on the other hand, expanded their
output in 2008 by 5.6%, down from 7.5% in 2007.
Annual trade figures in dollar terms were strongly influenced by
changes in commodity prices and exchange rates in
2008.Merchandise trade growth in real terms (i.e. adjusted to
discount changes in prices) slowed significantly in 2008 to 2%,
compared to 6% in 2007. In dollar terms (which includes price
changes and exchange rate fluctuations), world merchandise exports
increased by 15% in 2008, to $15.8 trillion, while exports of
commercial services rose 11% to $3.7 trillion. Merchandise trade in
volume terms (excluding the price and exchange rate fluctuations)
expanded by 2% in 2008, down from 6% in 2007.
WTO economists have forecast that the collapse in global demand
brought on by the biggest economic downturn in decades will drive
exports down by roughly 9% in volume terms in 2009, the biggest
such contraction since the Second World War. The contraction in
developed countries will be particularly severe with exports falling by
10% in 2009. In developing countries, which are far more dependent
on trade for growth, exports will shrink by some 2%-3% in 2009, WTO
economists say. WTO in its annual assessment of global trade states
that Economic contraction in most of the industrial world and steep
export declines already posted in the early months of this year by
most major economies – particularly those in Asia – makes for an
unusually bleak 2009 trade assessment.
Overview of Developments in India during 2008-09
As per the Economic Survey 2008-09 presented to Parliament in July
2009, financial meltdown and economic recession in developed
countries was a major factor in India’s economic slowdown during
2008-09. Economic growth decelerated to 6.7 per cent in 2008-09
compared to 9 per cent in 2007-08 and 9.7 per cent in 2006-07. This
deceleration in growth was spread across all sectors except mining
and quarrying. During 2008-09, India’s cumulative merchandise
exports grew at a modest 3.6 per cent in US Dollar terms while overall
import growth was at 14.4 per cent.
MMTC- 2008-09 in Retrospect
Financial Review
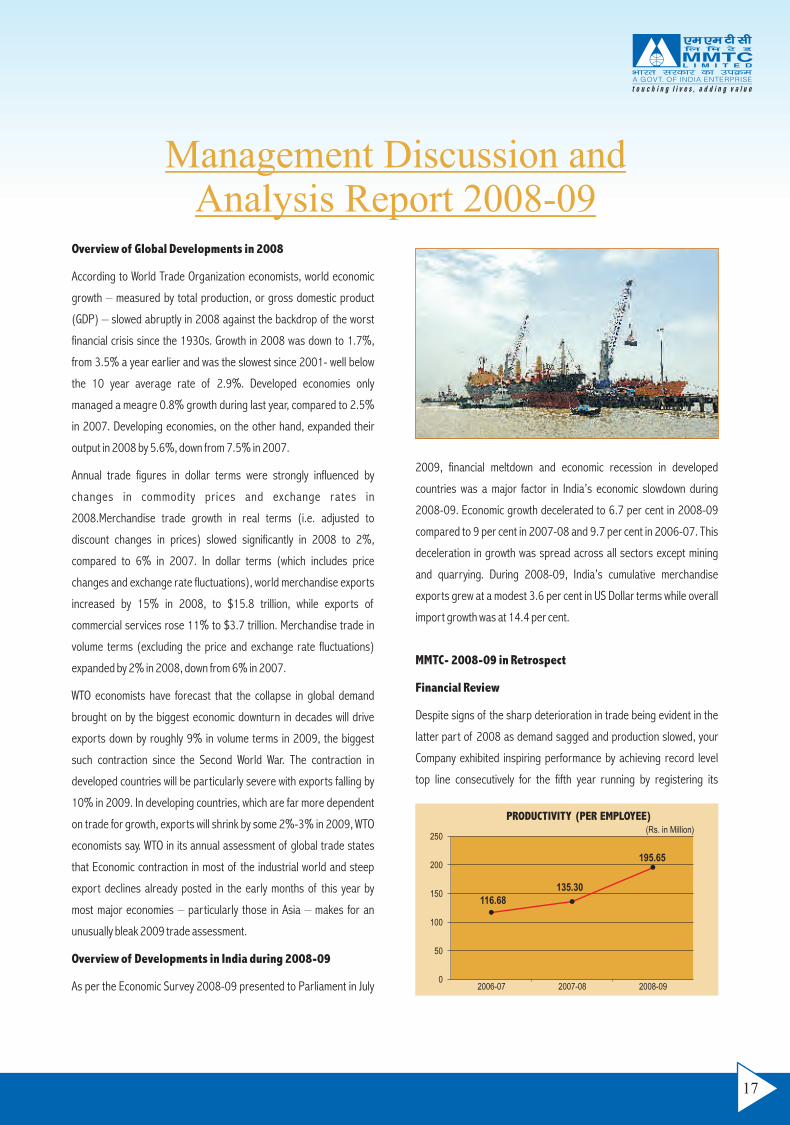
Despite signs of the sharp deterioration in trade being evident in the
latter part of 2008 as demand sagged and production slowed, your
Company exhibited inspiring performance by achieving record level
top line consecutively for the fifth year running by registering its
PRODUCTIVITY (PER EMPLOYEE)(Rs. in Million)
0
50
100
150
200
250
2006-07
116.68
2007-08 2008-09
135.30
195.65
Management Discussion and Analysis Report 2008-09
17
th46 Annual Report 2008-09
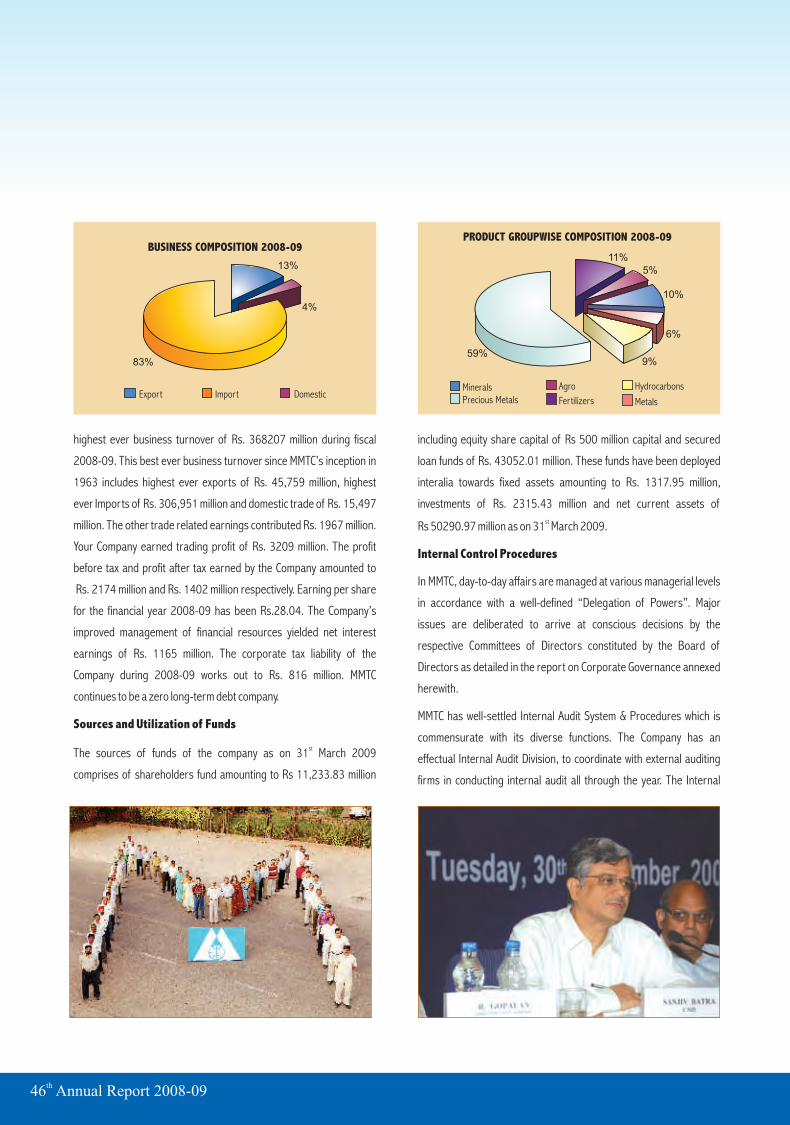
highest ever business turnover of Rs. 368207 million during fiscal
2008-09. This best ever business turnover since MMTC’s inception in
1963 includes highest ever exports of Rs. 45,759 million, highest
ever Imports of Rs. 306,951 million and domestic trade of Rs. 15,497
million. The other trade related earnings contributed Rs. 1967 million.
Your Company earned trading profit of Rs. 3209 million. The profit
before tax and profit after tax earned by the Company amounted to
Rs. 2174 million and Rs. 1402 million respectively. Earning per share
for the financial year 2008-09 has been Rs.28.04. The Company’s
improved management of financial resources yielded net interest
earnings of Rs. 1165 million. The corporate tax liability of the
Company during 2008-09 works out to Rs. 816 million. MMTC
continues to be a zero long-term debt company.
Sources and Utilization of Funds
stThe sources of funds of the company as on 31 March 2009
comprises of shareholders fund amounting to Rs 11,233.83 million
including equity share capital of Rs 500 million capital and secured
loan funds of Rs. 43052.01 million. These funds have been deployed
interalia towards fixed assets amounting to Rs. 1317.95 million,
investments of Rs. 2315.43 million and net current assets of stRs 50290.97 million as on 31 March 2009.
Internal Control Procedures
In MMTC, day-to-day affairs are managed at various managerial levels
in accordance with a well-defined “Delegation of Powers”. Major
issues are deliberated to arrive at conscious decisions by the
respective Committees of Directors constituted by the Board of
Directors as detailed in the report on Corporate Governance annexed
herewith.
MMTC has well-settled Internal Audit System & Procedures which is
commensurate with its diverse functions. The Company has an
effectual Internal Audit Division, to coordinate with external auditing
firms in conducting internal audit all through the year. The Internal
PRODUCT GROUPWISE COMPOSITION 2008-09
10%
5%
9%59%
11%
6%
HydrocarbonsMineralsPrecious Metals
Agro
Fertilizers MetalsExport Import Domestic
BUSINESS COMPOSITION 2008-09
13%
4%
83%
19
Audit reports are considered by ‘Senior Management Audit
Committee’ and ‘Audit Committee of Directors’. The Audit Committee
also meets the Company’s statutory auditors regularly to ascertain
their concerns and observations on financial reports. The directions
of the Audit Committee are implemented by the Management in all
cases.
Subsidiary Company
During the year 2008-09, MMTC Transnational Pte. Ltd. Singapore
(MTPL)- the wholly owned subsidiary of your Company incorporated
in October 1994 with a share capital of USD 1 million achieved its
highest ever business turnover of USD 686 million as against USD 557
million achieved last year. MTPL generated a profit before tax of USD
7.77 million and profit after tax of USD 6.91 million during 2008-09,
registering growth of 254% over previous year. The net worth of stMTPL stood at USD 14.58 million as on 31 March 2009. MTPL has so
far paid total dividends of USD 4.08 million besides multiplying its net
worth by nearly 15 times since its inception.
BUSINESS GROUPWISE REVIEW FOR 2008-09
Minerals
Despite global downturn leading to sharp deterioration in trade,
pressure on availability of ores for exports and constraints of
infrastructure and logistics, coupled with stiff competition from
exporters from Australia and Brazil, your Company maintained its
leadership position in mineral exports through aggressive marketing
efforts, enhanced customer focus and tapping of emerging
opportunities, especially in China. During the year 2008-09 China,
Japan and South Korea were the key markets where MMTC exported
minerals.
Minerals group of your Company contributed a turnover of Rs. 37632
million during the year, which is the highest ever business volume
registered by the Company in this segment. The performance of
minerals group during 2008-09 includes exports valued at Rs. 36875
million, imports amounting to Rs. 192 million and domestic trade of
Rs. 565 million. In quantitative terms, the exports made by the group
include 61.69 lakh tonnes of iron ore valued at Rs 27536 million,
3.03 lakh MT of chrome concentrate valued at Rs 7323 million,
0.41 lakh MT of chrome ore valued at Rs. 952 million and 1.92 lakh MT
of manganese ore valued at Rs. 1064 million. The domestic trade
concluded by the group includes 2.30 lakh tonnes of iron ore valued
at Rs 498 million, 0.46 lakh tonnes of limestone valued at Rs 22
million, 0.94 lakh tonnes of dolomite valued at Rs 44 million and 5773
tons of ferro chrome valued at Rs. 1 million. The group also imported
7359 tons of manganese ore valued at Rs. 192 million.
The export of iron & steel making raw material from India has
increased significantly in the recent past and the opportunities exist to
expand it further in future. The demand is being driven by China, which
has emerged as the largest buyer of iron ore. The demand from
traditional buyers like Japan and South Korea is likely to continue to
remain stable. MMTC has secured long-term purchase commitments
for five years beginning FY 2006-07 from Japan and South Korea and
annual Memoranda of Agreements are being signed with them for
2009-10. However the availability of iron ore for exports during
2009-10 may be adversely affected due to imposition of export duty
on iron ore lumps, increase in railway freight on iron ore for exports
and increase in demand from domestic steel industry. Furthermore
global meltdown is leading to reduction in demand of steel worldwide,
which may lead to lower imports of iron ore by Japanese, Korean and
Chinese steel mills.
th46 Annual Report 2008-09
Precious Metals, Gems & Jewellery
Your Company enjoys the position of market leader in the Indian
bullion trade having flexibility to operate from various centers spread
all over the country, offering novel product services besides
maintaining enduring relationship. The Precious Metals, Gems &
Jewellery group of the Company contributed a turnover of Rs. 217443
million during 2008-09. This performance was realized through
diversified activities, which include imports of gold at Rs. 173863
million, silver worth Rs. 21532 million, platinum worth Rs. 17079
million, rough diamonds worth Rs. 247 million, silver grains worth Rs.
169 million as also domestic sale of gold bar/medallions at Rs. 1569
million, gold worth Rs. 1135 million, silver worth Rs. 701 million,
jewellery worth Rs 95 million, silver medallions at Rs. 127 million,
‘SANCHI’ silverware at Rs. 145 million and sales at domestic jewellery
exhibitions at Rs. 347 million. The group also exported silver valued at
Rs. 434 million.
The Precious Metals group of your Company is continuously working
on improving service to customers and now has twenty-five percent
share of gold imports. The Precious Metals group is focusing on
improving sales of value-added products, viz. jewellery, medallions
and silverware. The Company has established a Joint Venture with
M/s. Gitanjali (India’s leading retail Jewellery company). A Company by
the name of MMTC Gitanjali Private Limited has already been
incorporated and outlets opened. It is proposed to open more outlets
to increase the retail marketing network. Tie-up has also been done
with a company having large distribution network, including reach in
rural areas. A Joint Venture for gold/silver refining and medallions
manufacture has also been incorporated by the name of M/s. MMTC-
Pamp India Private Limited. The civil construction for the same has
started in Haryana and the plant is expected to be operational in the
first quarter of 2010. The tie-up will give your Company opportunity to
market a certain percentage of the products of the Joint Venture.
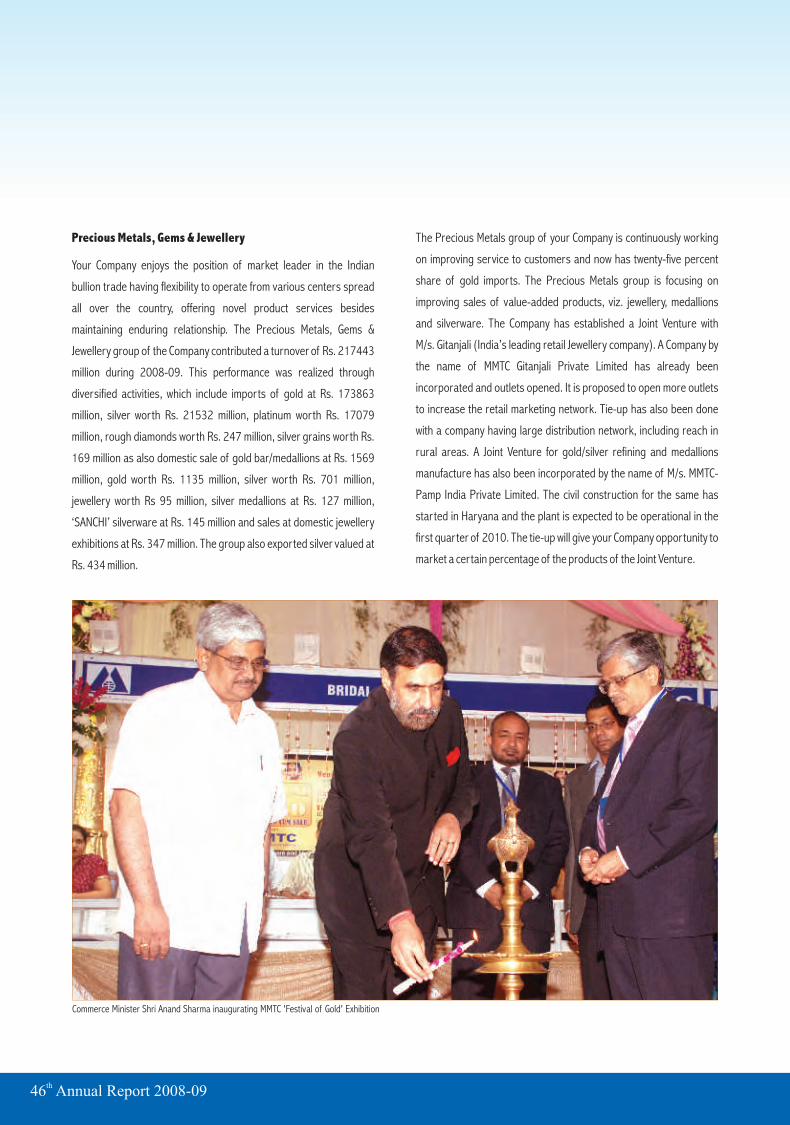
Commerce Minister Shri Anand Sharma inaugurating MMTC 'Festival of Gold' Exhibition

21
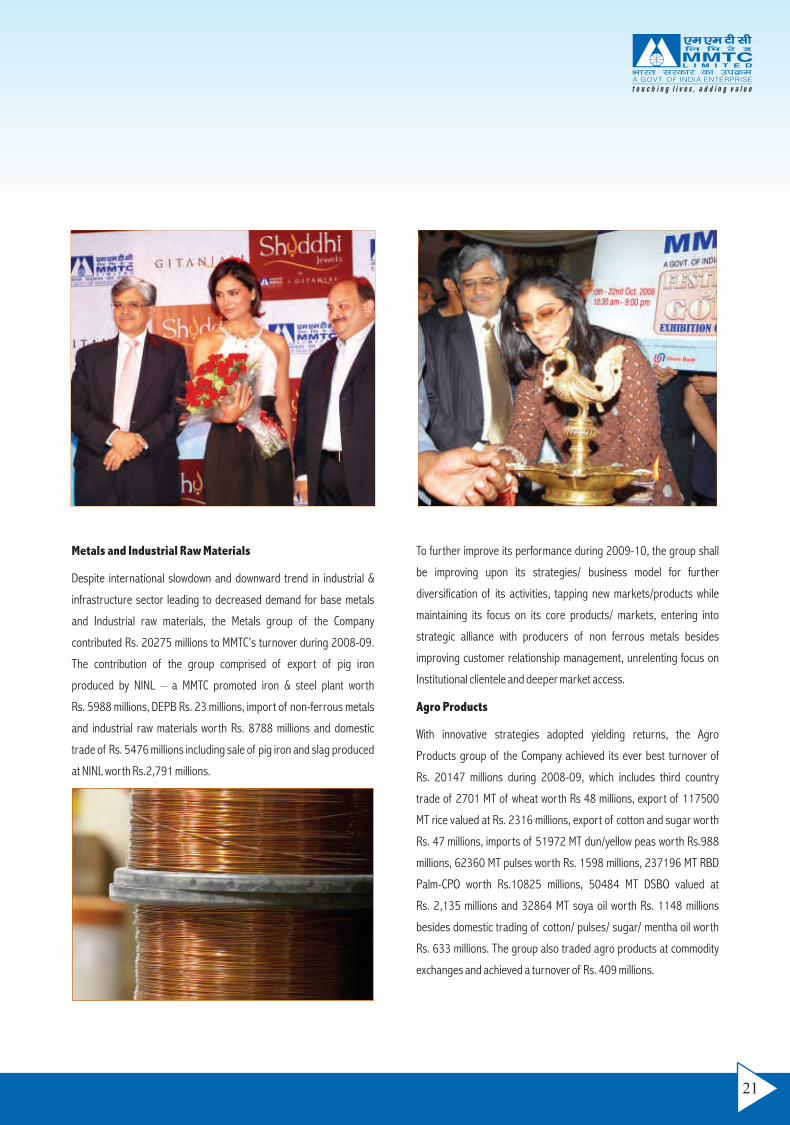
Metals and Industrial Raw Materials
Despite international slowdown and downward trend in industrial &
infrastructure sector leading to decreased demand for base metals
and Industrial raw materials, the Metals group of the Company
contributed Rs. 20275 millions to MMTC’s turnover during 2008-09.
The contribution of the group comprised of export of pig iron
produced by NINL – a MMTC promoted iron & steel plant worth
Rs. 5988 millions, DEPB Rs. 23 millions, import of non-ferrous metals
and industrial raw materials worth Rs. 8788 millions and domestic
trade of Rs. 5476 millions including sale of pig iron and slag produced
at NINL worth Rs.2,791 millions.
To further improve its performance during 2009-10, the group shall
be improving upon its strategies/ business model for further
diversification of its activities, tapping new markets/products while
maintaining its focus on its core products/ markets, entering into
strategic alliance with producers of non ferrous metals besides
improving customer relationship management, unrelenting focus on
Institutional clientele and deeper market access.
Agro Products
With innovative strategies adopted yielding returns, the Agro
Products group of the Company achieved its ever best turnover of
Rs. 20147 millions during 2008-09, which includes third country
trade of 2701 MT of wheat worth Rs 48 millions, export of 117500
MT rice valued at Rs. 2316 millions, export of cotton and sugar worth
Rs. 47 millions, imports of 51972 MT dun/yellow peas worth Rs.988
millions, 62360 MT pulses worth Rs. 1598 millions, 237196 MT RBD
Palm-CPO worth Rs.10825 millions, 50484 MT DSBO valued at
Rs. 2,135 millions and 32864 MT soya oil worth Rs. 1148 millions
besides domestic trading of cotton/ pulses/ sugar/ mentha oil worth
Rs. 633 millions. The group also traded agro products at commodity
exchanges and achieved a turnover of Rs. 409 millions.

th46 Annual Report 2008-09
The Agro Group of the Company shall continue to pursue its plans and
strategies to meet the shortages of food grains and pulses in the
country by imports, export of excess availability of agro products
besides meeting the challenges stemming from wide variations in
quantity/ product range available for imports/exports and
broadening commodity profile to ensure sustainability of business
growth in this segment in future. The group is exploring possibilities of
entering into retail marketing of edible oil by direct marketing and
venturing into business of processed foods in both export and
domestic markets.
Fertilizers and Chemicals
The Fertilizer and Chemicals group contributed a turnover of
Rs.39867 million. The group’s performance during 2008-09 included
third country trade of 2500 MT urea worth Rs. 50 million, import of
11.29 lakh MT of urea valued at Rs. 30259 million, 3.08 lakh MT of
muriate of potash at Rs. 7916 million, 0.50 lakh MT sulphur worth
Rs. 1567 million and soda ash worth Rs.7 million besides domestic
trading of ammonium sulphate produced at NINL – the MMTC
promoted Iron & Steel plant valued at Rs. 68 million. With these results
MMTC emerged as the largest importer of urea in the country.
The group judiciously leveraged and synergised MMTC’s expertise in
bulk handling with domain knowledge, hands on experience, expertise
in logistic management and skills to predict emerging trends in the
global market of fertilizers to realize this noteworthy performance.
The consumption of fertilizers is growing in India at a rapid pace
leading to increased shortfall between the demand vis-à-vis
indigenous production resulting in increased volume of imports.
Moreover, India is largely dependent on imported raw materials such
as sulphur, rock phosphate and phos acid for indigenous phosphatic
industry. Besides this, the country’s total requirements of MOP are
fully imported. Such a scenario provides lot of potential for future
growth in import of fertilizer and fertilizer raw materials, especially in
view of enhanced focus of Government on Agricultural sector with a
view to ensure food security for growing population. Keeping in view
the above, the group has planned during 2009-10, further increase in
business volumes by tapping these emerging opportunities, However
the volume of fertilizer imports and its prices are dependent on
various factors like monsoon, Government Policy, domestic
production and international demand- supply balance etc. Besides the
global economic downturn likely to impact the growth of domestic
economy may also impact the agri sector in terms of buying power of
farmers, which may have adverse impact on growth prospects of this
segment of your company.
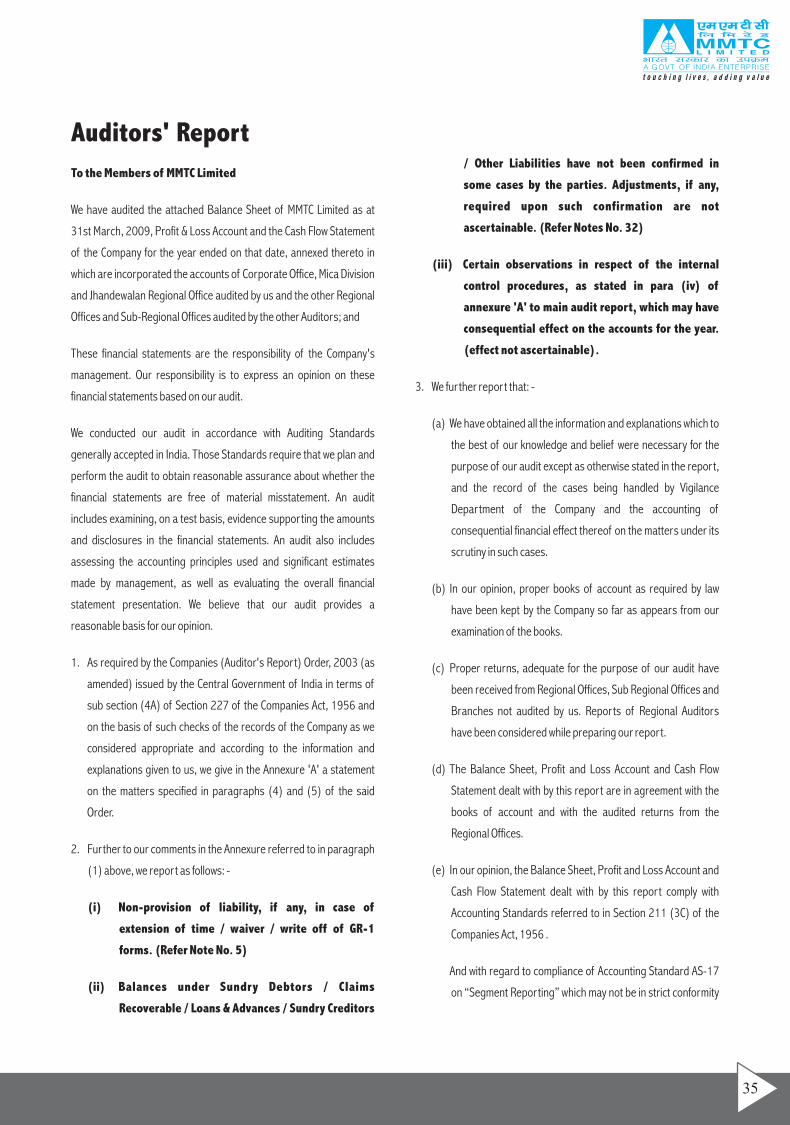
Coal & Hydrocarbons
The Coal & Hydrocarbons group contributed a turnover of Rs. 31387
million to the highest ever turnover recorded by your Company. The
turnover contributed by the group included import of 38.15 lakh
tonnes of steam coal valued at Rs.21251 million, 9.18 lakh tonnes of

23
coking coal valued at Rs. 5539 million, 0.23 lakh tones of LAM coke
worth Rs. 566 million and solar oil worth Rs. 8 million besides
domestic trading in LAM coke worth Rs.3257 million, crude tar
amounting to Rs. 414 million, met coke worth Rs. 86 million, steam
coal worth Rs.266 million.
With domestic production unable to meet the growing demand of non
coking coal for power sector, steel, fertilizer and other heavy
industries, the existence of big supply gap compels the country to
depend upon sizable imports. Further the increase in demands of
steam coal likely to increase considerably in future with many new coal
fired generation plants being underway shall be opening up newer
vistas for this segment of your Company. The Coal & Hydrocarbon
group of your Company has fine-tuned its strategies to tap these
emerging opportunities to import and serve the increased demand of
coal & coke to power, steel, fertilizer, chemical, cement & sponge Iron
units in future.
Mica
As reported in earlier years, the changed market requirement and
technological developments in mica processing technologies globally
led to activities at Mica Division coming to a halt since 2002-03. The
decision on the review petition filed with the appropriate authorities
under the Industrial Disputes Act for closure of Mica division is yet to
be pronounced by the Govt.
Others
The other products contributed Rs. 1456 million to the turnover of the
Company, which included imports of cement, PVC/plastic, wool and
engineering & capital goods worth Rs.1274 million, domestic trade of
Rs. 88 million besides sale of power amounting to Rs. 94 million,
generated at the 15 MW wind power farms commissioned in March
2007 in Karnataka.
During the year 2009-10, the company shall continue availing
opportunities emerging in new markets/products for generating
additional business revenues for the Company.
Cautionary Statement
Statements in the Management Discussions and Analysis describing
the Company’s projections, estimates, expectations may be “forward
looking statements” within the meaning of applicable laws and
regulations. Actual results could differ materially from those
expressed or implied. Important factors that could make a difference
to the Company’s operations include economic conditions affecting
demand/supply and price conditions in the domestic and overseas
market in which the Company operates, changes in government
regulations, tax laws, other statutes and other incidental factors.
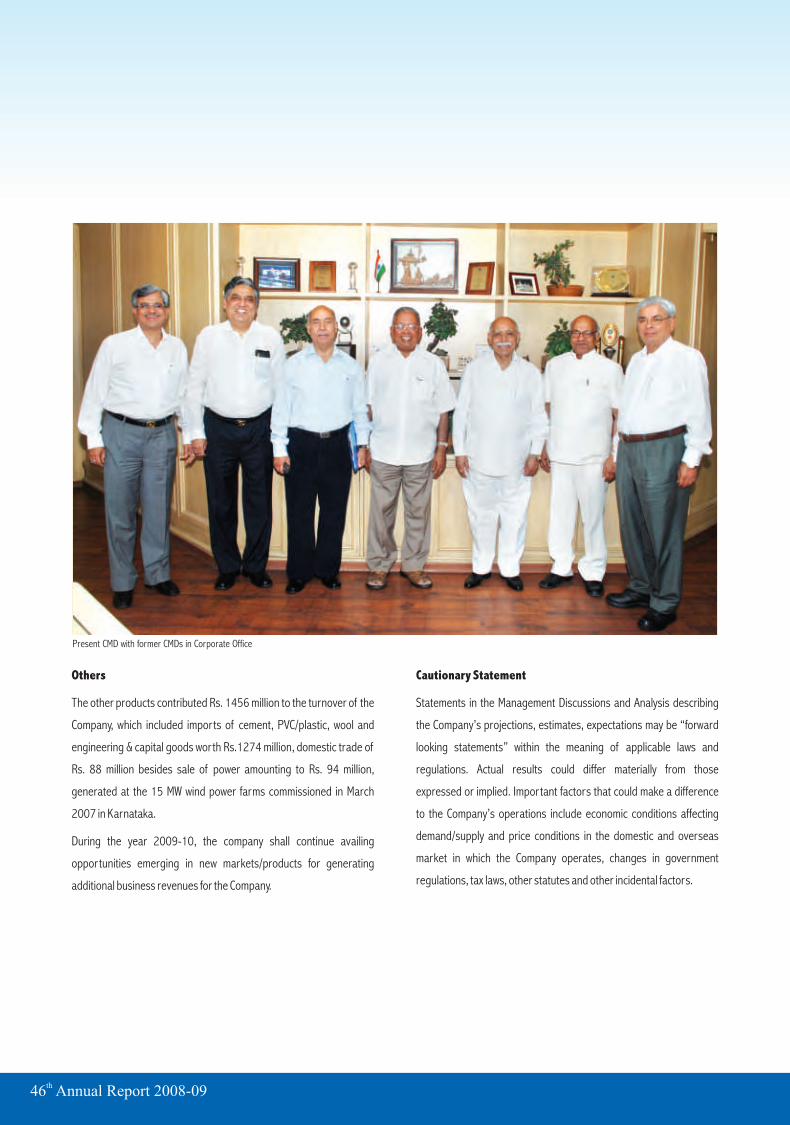
Present CMD with former CMDs in Corporate Office
th46 Annual Report 2008-09
Overview of Global Developments in 2008
According to World Trade Organization economists, world economic
growth – measured by total production, or gross domestic product
(GDP) – slowed abruptly in 2008 against the backdrop of the worst
financial crisis since the 1930s. Growth in 2008 was down to 1.7%,
from 3.5% a year earlier and was the slowest since 2001- well below
the 10 year average rate of 2.9%. Developed economies only
managed a meagre 0.8% growth during last year, compared to 2.5%
in 2007. Developing economies, on the other hand, expanded their
output in 2008 by 5.6%, down from 7.5% in 2007.
Annual trade figures in dollar terms were strongly influenced by
changes in commodity prices and exchange rates in
2008.Merchandise trade growth in real terms (i.e. adjusted to
discount changes in prices) slowed significantly in 2008 to 2%,
compared to 6% in 2007. In dollar terms (which includes price
changes and exchange rate fluctuations), world merchandise exports
increased by 15% in 2008, to $15.8 trillion, while exports of
commercial services rose 11% to $3.7 trillion. Merchandise trade in
volume terms (excluding the price and exchange rate fluctuations)
expanded by 2% in 2008, down from 6% in 2007.
WTO economists have forecast that the collapse in global demand
brought on by the biggest economic downturn in decades will drive
exports down by roughly 9% in volume terms in 2009, the biggest
such contraction since the Second World War. The contraction in
developed countries will be particularly severe with exports falling by
10% in 2009. In developing countries, which are far more dependent
on trade for growth, exports will shrink by some 2%-3% in 2009, WTO
economists say. WTO in its annual assessment of global trade states
that Economic contraction in most of the industrial world and steep
export declines already posted in the early months of this year by
most major economies – particularly those in Asia – makes for an
unusually bleak 2009 trade assessment.
Overview of Developments in India during 2008-09
As per the Economic Survey 2008-09 presented to Parliament in July
2009, financial meltdown and economic recession in developed
countries was a major factor in India’s economic slowdown during
2008-09. Economic growth decelerated to 6.7 per cent in 2008-09
compared to 9 per cent in 2007-08 and 9.7 per cent in 2006-07. This
deceleration in growth was spread across all sectors except mining
and quarrying. During 2008-09, India’s cumulative merchandise
exports grew at a modest 3.6 per cent in US Dollar terms while overall
import growth was at 14.4 per cent.
MMTC- 2008-09 in Retrospect
Financial Review
Despite signs of the sharp deterioration in trade being evident in the
latter part of 2008 as demand sagged and production slowed, your
Company exhibited inspiring performance by achieving record level
top line consecutively for the fifth year running by registering its
PRODUCTIVITY (PER EMPLOYEE)(Rs. in Million)
0
50
100
150
200
250
2006-07
116.68
2007-08 2008-09
135.30
195.65
Management Discussion and Analysis Report 2008-09
17

th46 Annual Report 2008-09
highest ever business turnover of Rs. 368207 million during fiscal
2008-09. This best ever business turnover since MMTC’s inception in
1963 includes highest ever exports of Rs. 45,759 million, highest
ever Imports of Rs. 306,951 million and domestic trade of Rs. 15,497
million. The other trade related earnings contributed Rs. 1967 million.
Your Company earned trading profit of Rs. 3209 million. The profit
before tax and profit after tax earned by the Company amounted to
Rs. 2174 million and Rs. 1402 million respectively. Earning per share
for the financial year 2008-09 has been Rs.28.04. The Company’s
improved management of financial resources yielded net interest
earnings of Rs. 1165 million. The corporate tax liability of the
Company during 2008-09 works out to Rs. 816 million. MMTC
continues to be a zero long-term debt company.
Sources and Utilization of Funds
stThe sources of funds of the company as on 31 March 2009
comprises of shareholders fund amounting to Rs 11,233.83 million
including equity share capital of Rs 500 million capital and secured
loan funds of Rs. 43052.01 million. These funds have been deployed
interalia towards fixed assets amounting to Rs. 1317.95 million,
investments of Rs. 2315.43 million and net current assets of stRs 50290.97 million as on 31 March 2009.
Internal Control Procedures
In MMTC, day-to-day affairs are managed at various managerial levels
in accordance with a well-defined “Delegation of Powers”. Major
issues are deliberated to arrive at conscious decisions by the
respective Committees of Directors constituted by the Board of
Directors as detailed in the report on Corporate Governance annexed
herewith.
MMTC has well-settled Internal Audit System & Procedures which is
commensurate with its diverse functions. The Company has an
effectual Internal Audit Division, to coordinate with external auditing
firms in conducting internal audit all through the year. The Internal
PRODUCT GROUPWISE COMPOSITION 2008-09
10%
5%
9%59%
11%
6%
HydrocarbonsMineralsPrecious Metals
Agro
Fertilizers MetalsExport Import Domestic
BUSINESS COMPOSITION 2008-09
13%
4%
83%

19
Audit reports are considered by ‘Senior Management Audit
Committee’ and ‘Audit Committee of Directors’. The Audit Committee
also meets the Company’s statutory auditors regularly to ascertain
their concerns and observations on financial reports. The directions
of the Audit Committee are implemented by the Management in all
cases.
Subsidiary Company
During the year 2008-09, MMTC Transnational Pte. Ltd. Singapore
(MTPL)- the wholly owned subsidiary of your Company incorporated
in October 1994 with a share capital of USD 1 million achieved its
highest ever business turnover of USD 686 million as against USD 557
million achieved last year. MTPL generated a profit before tax of USD
7.77 million and profit after tax of USD 6.91 million during 2008-09,
registering growth of 254% over previous year. The net worth of stMTPL stood at USD 14.58 million as on 31 March 2009. MTPL has so
far paid total dividends of USD 4.08 million besides multiplying its net
worth by nearly 15 times since its inception.
BUSINESS GROUPWISE REVIEW FOR 2008-09
Minerals
Despite global downturn leading to sharp deterioration in trade,
pressure on availability of ores for exports and constraints of
infrastructure and logistics, coupled with stiff competition from
exporters from Australia and Brazil, your Company maintained its
leadership position in mineral exports through aggressive marketing
efforts, enhanced customer focus and tapping of emerging
opportunities, especially in China. During the year 2008-09 China,
Japan and South Korea were the key markets where MMTC exported
minerals.
Minerals group of your Company contributed a turnover of Rs. 37632
million during the year, which is the highest ever business volume
registered by the Company in this segment. The performance of
minerals group during 2008-09 includes exports valued at Rs. 36875
million, imports amounting to Rs. 192 million and domestic trade of
Rs. 565 million. In quantitative terms, the exports made by the group
include 61.69 lakh tonnes of iron ore valued at Rs 27536 million,
3.03 lakh MT of chrome concentrate valued at Rs 7323 million,
0.41 lakh MT of chrome ore valued at Rs. 952 million and 1.92 lakh MT
of manganese ore valued at Rs. 1064 million. The domestic trade
concluded by the group includes 2.30 lakh tonnes of iron ore valued
at Rs 498 million, 0.46 lakh tonnes of limestone valued at Rs 22
million, 0.94 lakh tonnes of dolomite valued at Rs 44 million and 5773
tons of ferro chrome valued at Rs. 1 million. The group also imported
7359 tons of manganese ore valued at Rs. 192 million.
The export of iron & steel making raw material from India has
increased significantly in the recent past and the opportunities exist to
expand it further in future. The demand is being driven by China, which
has emerged as the largest buyer of iron ore. The demand from
traditional buyers like Japan and South Korea is likely to continue to
remain stable. MMTC has secured long-term purchase commitments
for five years beginning FY 2006-07 from Japan and South Korea and
annual Memoranda of Agreements are being signed with them for
2009-10. However the availability of iron ore for exports during
2009-10 may be adversely affected due to imposition of export duty
on iron ore lumps, increase in railway freight on iron ore for exports
and increase in demand from domestic steel industry. Furthermore
global meltdown is leading to reduction in demand of steel worldwide,
which may lead to lower imports of iron ore by Japanese, Korean and
Chinese steel mills.

th46 Annual Report 2008-09
Precious Metals, Gems & Jewellery
Your Company enjoys the position of market leader in the Indian
bullion trade having flexibility to operate from various centers spread
all over the country, offering novel product services besides
maintaining enduring relationship. The Precious Metals, Gems &
Jewellery group of the Company contributed a turnover of Rs. 217443
million during 2008-09. This performance was realized through
diversified activities, which include imports of gold at Rs. 173863
million, silver worth Rs. 21532 million, platinum worth Rs. 17079
million, rough diamonds worth Rs. 247 million, silver grains worth Rs.
169 million as also domestic sale of gold bar/medallions at Rs. 1569
million, gold worth Rs. 1135 million, silver worth Rs. 701 million,
jewellery worth Rs 95 million, silver medallions at Rs. 127 million,
‘SANCHI’ silverware at Rs. 145 million and sales at domestic jewellery
exhibitions at Rs. 347 million. The group also exported silver valued at
Rs. 434 million.
The Precious Metals group of your Company is continuously working
on improving service to customers and now has twenty-five percent
share of gold imports. The Precious Metals group is focusing on
improving sales of value-added products, viz. jewellery, medallions
and silverware. The Company has established a Joint Venture with
M/s. Gitanjali (India’s leading retail Jewellery company). A Company by
the name of MMTC Gitanjali Private Limited has already been
incorporated and outlets opened. It is proposed to open more outlets
to increase the retail marketing network. Tie-up has also been done
with a company having large distribution network, including reach in
rural areas. A Joint Venture for gold/silver refining and medallions
manufacture has also been incorporated by the name of M/s. MMTC-
Pamp India Private Limited. The civil construction for the same has
started in Haryana and the plant is expected to be operational in the
first quarter of 2010. The tie-up will give your Company opportunity to
market a certain percentage of the products of the Joint Venture.
Commerce Minister Shri Anand Sharma inaugurating MMTC 'Festival of Gold' Exhibition
21
Metals and Industrial Raw Materials
Despite international slowdown and downward trend in industrial &
infrastructure sector leading to decreased demand for base metals
and Industrial raw materials, the Metals group of the Company
contributed Rs. 20275 millions to MMTC’s turnover during 2008-09.
The contribution of the group comprised of export of pig iron
produced by NINL – a MMTC promoted iron & steel plant worth
Rs. 5988 millions, DEPB Rs. 23 millions, import of non-ferrous metals
and industrial raw materials worth Rs. 8788 millions and domestic
trade of Rs. 5476 millions including sale of pig iron and slag produced
at NINL worth Rs.2,791 millions.
To further improve its performance during 2009-10, the group shall
be improving upon its strategies/ business model for further
diversification of its activities, tapping new markets/products while
maintaining its focus on its core products/ markets, entering into
strategic alliance with producers of non ferrous metals besides
improving customer relationship management, unrelenting focus on
Institutional clientele and deeper market access.
Agro Products
With innovative strategies adopted yielding returns, the Agro
Products group of the Company achieved its ever best turnover of
Rs. 20147 millions during 2008-09, which includes third country
trade of 2701 MT of wheat worth Rs 48 millions, export of 117500
MT rice valued at Rs. 2316 millions, export of cotton and sugar worth
Rs. 47 millions, imports of 51972 MT dun/yellow peas worth Rs.988
millions, 62360 MT pulses worth Rs. 1598 millions, 237196 MT RBD
Palm-CPO worth Rs.10825 millions, 50484 MT DSBO valued at
Rs. 2,135 millions and 32864 MT soya oil worth Rs. 1148 millions
besides domestic trading of cotton/ pulses/ sugar/ mentha oil worth
Rs. 633 millions. The group also traded agro products at commodity
exchanges and achieved a turnover of Rs. 409 millions.
th46 Annual Report 2008-09
The Agro Group of the Company shall continue to pursue its plans and
strategies to meet the shortages of food grains and pulses in the
country by imports, export of excess availability of agro products
besides meeting the challenges stemming from wide variations in
quantity/ product range available for imports/exports and
broadening commodity profile to ensure sustainability of business
growth in this segment in future. The group is exploring possibilities of
entering into retail marketing of edible oil by direct marketing and
venturing into business of processed foods in both export and
domestic markets.
Fertilizers and Chemicals
The Fertilizer and Chemicals group contributed a turnover of
Rs.39867 million. The group’s performance during 2008-09 included
third country trade of 2500 MT urea worth Rs. 50 million, import of
11.29 lakh MT of urea valued at Rs. 30259 million, 3.08 lakh MT of
muriate of potash at Rs. 7916 million, 0.50 lakh MT sulphur worth
Rs. 1567 million and soda ash worth Rs.7 million besides domestic
trading of ammonium sulphate produced at NINL – the MMTC
promoted Iron & Steel plant valued at Rs. 68 million. With these results
MMTC emerged as the largest importer of urea in the country.
The group judiciously leveraged and synergised MMTC’s expertise in
bulk handling with domain knowledge, hands on experience, expertise
in logistic management and skills to predict emerging trends in the
global market of fertilizers to realize this noteworthy performance.
The consumption of fertilizers is growing in India at a rapid pace
leading to increased shortfall between the demand vis-à-vis
indigenous production resulting in increased volume of imports.
Moreover, India is largely dependent on imported raw materials such
as sulphur, rock phosphate and phos acid for indigenous phosphatic
industry. Besides this, the country’s total requirements of MOP are
fully imported. Such a scenario provides lot of potential for future
growth in import of fertilizer and fertilizer raw materials, especially in
view of enhanced focus of Government on Agricultural sector with a
view to ensure food security for growing population. Keeping in view
the above, the group has planned during 2009-10, further increase in
business volumes by tapping these emerging opportunities, However
the volume of fertilizer imports and its prices are dependent on
various factors like monsoon, Government Policy, domestic
production and international demand- supply balance etc. Besides the
global economic downturn likely to impact the growth of domestic
economy may also impact the agri sector in terms of buying power of
farmers, which may have adverse impact on growth prospects of this
segment of your company.
Coal & Hydrocarbons
The Coal & Hydrocarbons group contributed a turnover of Rs. 31387
million to the highest ever turnover recorded by your Company. The
turnover contributed by the group included import of 38.15 lakh
tonnes of steam coal valued at Rs.21251 million, 9.18 lakh tonnes of
23
coking coal valued at Rs. 5539 million, 0.23 lakh tones of LAM coke
worth Rs. 566 million and solar oil worth Rs. 8 million besides
domestic trading in LAM coke worth Rs.3257 million, crude tar
amounting to Rs. 414 million, met coke worth Rs. 86 million, steam
coal worth Rs.266 million.
With domestic production unable to meet the growing demand of non
coking coal for power sector, steel, fertilizer and other heavy
industries, the existence of big supply gap compels the country to
depend upon sizable imports. Further the increase in demands of
steam coal likely to increase considerably in future with many new coal
fired generation plants being underway shall be opening up newer
vistas for this segment of your Company. The Coal & Hydrocarbon
group of your Company has fine-tuned its strategies to tap these
emerging opportunities to import and serve the increased demand of
coal & coke to power, steel, fertilizer, chemical, cement & sponge Iron
units in future.
Mica
As reported in earlier years, the changed market requirement and
technological developments in mica processing technologies globally
led to activities at Mica Division coming to a halt since 2002-03. The
decision on the review petition filed with the appropriate authorities
under the Industrial Disputes Act for closure of Mica division is yet to
be pronounced by the Govt.

Others
The other products contributed Rs. 1456 million to the turnover of the
Company, which included imports of cement, PVC/plastic, wool and
engineering & capital goods worth Rs.1274 million, domestic trade of
Rs. 88 million besides sale of power amounting to Rs. 94 million,
generated at the 15 MW wind power farms commissioned in March
2007 in Karnataka.
During the year 2009-10, the company shall continue availing
opportunities emerging in new markets/products for generating
additional business revenues for the Company.
Cautionary Statement
Statements in the Management Discussions and Analysis describing
the Company’s projections, estimates, expectations may be “forward
looking statements” within the meaning of applicable laws and
regulations. Actual results could differ materially from those
expressed or implied. Important factors that could make a difference
to the Company’s operations include economic conditions affecting
demand/supply and price conditions in the domestic and overseas
market in which the Company operates, changes in government
regulations, tax laws, other statutes and other incidental factors.
Present CMD with former CMDs in Corporate Office
th46 Annual Report 2008-09
To the Members of MMTC Limited
We have audited the attached Balance Sheet of MMTC Limited as at
31st March, 2009, Profit & Loss Account and the Cash Flow Statement
of the Company for the year ended on that date, annexed thereto in
which are incorporated the accounts of Corporate Office, Mica Division
and Jhandewalan Regional Office audited by us and the other Regional
Offices and Sub-Regional Offices audited by the other Auditors; and
These financial statements are the responsibility of the Company's
management. Our responsibility is to express an opinion on these
financial statements based on our audit.
We conducted our audit in accordance with Auditing Standards
generally accepted in India. Those Standards require that we plan and
perform the audit to obtain reasonable assurance about whether the
financial statements are free of material misstatement. An audit
includes examining, on a test basis, evidence supporting the amounts
and disclosures in the financial statements. An audit also includes
assessing the accounting principles used and significant estimates
made by management, as well as evaluating the overall financial
statement presentation. We believe that our audit provides a
reasonable basis for our opinion.
1. As required by the Companies (Auditor's Report) Order, 2003 (as
amended) issued by the Central Government of India in terms of
sub section (4A) of Section 227 of the Companies Act, 1956 and
on the basis of such checks of the records of the Company as we
considered appropriate and according to the information and
explanations given to us, we give in the Annexure 'A' a statement
on the matters specified in paragraphs (4) and (5) of the said
Order.
2. Further to our comments in the Annexure referred to in paragraph
(1) above, we report as follows: -
(i) Non-provision of liability, if any, in case of
extension of time / waiver / write off of GR-1
forms. (Refer Note No. 5)
(ii) Balances under Sundry Debtors / Claims
Recoverable / Loans & Advances / Sundry Creditors
/ Other Liabilities have not been confirmed in
some cases by the parties. Adjustments, if any,
required upon such confirmation are not
ascertainable. (Refer Notes No. 32)
(iii) Certain observations in respect of the internal
control procedures, as stated in para (iv) of
annexure 'A' to main audit report, which may have
consequential effect on the accounts for the year.
(effect not ascertainable).
3. We further report that: -
(a) We have obtained all the information and explanations which to
the best of our knowledge and belief were necessary for the
purpose of our audit except as otherwise stated in the report,
and the record of the cases being handled by Vigilance
Department of the Company and the accounting of
consequential financial effect thereof on the matters under its
scrutiny in such cases.
(b) In our opinion, proper books of account as required by law
have been kept by the Company so far as appears from our
examination of the books.
(c) Proper returns, adequate for the purpose of our audit have
been received from Regional Offices, Sub Regional Offices and
Branches not audited by us. Reports of Regional Auditors
have been considered while preparing our report.
(d) The Balance Sheet, Profit and Loss Account and Cash Flow
Statement dealt with by this report are in agreement with the
books of account and with the audited returns from the
Regional Offices.
(e) In our opinion, the Balance Sheet, Profit and Loss Account and
Cash Flow Statement dealt with by this report comply with
Accounting Standards referred to in Section 211 (3C) of the
Companies Act, 1956 .
And with regard to compliance of Accounting Standard AS-17
on “Segment Reporting” which may not be in strict conformity
Auditors' Report
35
with the format / reporting requirements as enumerated in
AS-17.
(f) Being a government company, pursuant to the gazette
notification No.GSR 829 (F) dated 21-10-2003 issued by
Government of India, provisions of clause (g) of section 274
of the companies Act 1956 are not applicable to the company.
We further report that, the impact of paragraphs 2(i) to 2(iii) above on
the profit of the year and the assets and liabilities appearing in the
Balance Sheet, could not be ascertained. In our opinion and to the
best of our information and according to the explanations given to us
the said accounts read together with the Significant Accounting
Policies and notes thereon, give the information required by the
Companies Act, 1956 in the manner so required, other than as stated
above, and give a true and fair view in conformity with the accounting
principles generally accepted in India:
(A) In the case of the Balance Sheet, of the state of affairs of the
Company as at 31st March, 2009; and
(B) In the case of the Profit and Loss Account, of the Profit of the
Company for the year ended on that date; and
(C) In the case of the Cash Flow Statement, of the cash flows of the
Company for the year ended on that date.
For N. K. Bhargava & Co.
Chartered Accountants
Sd/-
(CA N.K.BHARGAVA)
Partner
M. No. 080624
Place: New Delhi
Dated: 07.08.2009
th46 Annual Report 2008-09
ANNEXURE 'A' TO AUDITOR'S REPORT
Referred to in paragraph 1 of the Auditor's Report of even date to the
members of MMTC Limited on the financial statements for the year
ended 31st March 2009.
(i) (a) The Company has generally maintained proper records
showing full particulars including quantitative details and
situation of fixed assets. However Fixed assets
registers maintained at RO JJC, RO Goa & Corporate
Office needs to be further improved.
(b) As explained to us, all the assets have been physically
verified by the management during the year which, in our
opinion is reasonable having regard to the size of the
company and the nature of its assets. No material
discrepancies were noticed on such verification.
(c) In our opinion and according to the information and
explanations given to us, no substantial part of the fixed
assets have been disposed off by the Company during the
year and therefore the going concern assumption is not
affected.
(ii) (a) The inventory has been physically verified by the
management during the year, except in case of goods in
transit, stocks lying in Central / State Warehouses where
Confirmation were obtained from the parties and relied
upon. In our opinion, the frequency of verification is
reasonable.
(b) In our opinion, procedures of physical verification of
inventory followed by the management are reasonable and
adequate in relation to the size of the Company and the
nature of its business.
(c) On the basis of our examination of the inventory records, in
our opinion, the Company is maintaining proper records of
inventory. The discrepancies noticed on verification
between the physical stock and the books of account were
not material.
(iii) (a) As informed to us, the Company has not granted any loans,
secured or unsecured to Companies, firms or other parties
covered in the register maintained under section 301 of
the Companies Act, 1956.
(b) Not applicable in view of para (iii) (a) above.
(c) Not applicable in view of para (iii) (a) above.
(d) Not applicable in view of para (iii) (a) above.
(e) As informed to us, the Company has not taken any loans,
secured or unsecured from Companies, firms or other
parties covered in the register maintained under Section
301 of the Companies Act, 1956.
(f) Not applicable in view of para (iii) (e) above.
(g) Not applicable in view of para (iii) (e) above.
(iv) In our opinion and according to the information and
explanations given to us, there are adequate internal control
procedures commensurate with the size of the Company and
the nature of its business with regard to the purchase of
inventory, fixed assets and with regard to the sale of goods and
services. During the course of our audit, no major weakness
has been noticed in the internal control system
However, the internal control mechanism needs to be
strengthened in the following areas:
(a) Active and prompt follow-up of old debts,
advances (including staff advances) and claims by
respective Commodity Division.
(b) Periodic confirmation of outstanding balance,
reconciliation of debtors, inter-unit, other heads
of account and current assets & current liabilities
of cost center.
(c) Follow-up of court cases and recoveries arising
out of execution of decrees / awards announced in
favour of the company.
(d) Rotation of jobs on the operations being carried
out where the magnitude of the transactions is
very high. However such rotations are not affected
in any structured manner or under any laid down
policy. The Policy in this regard has already been
drafted and is under deliberation.
(e) Expeditious follow up of old Sales Tax cases /
Appeals pending with Courts / Appellate
37
Authorities of CO, ROs and SROs including closed
SROs to save on legal costs and interest payable
on disputed additional demands.
(f) Proper utilization of BTS software to account for
the bullion trading effectively.
(v) (a) In our opinion and according to the information and
explanations given to us, there are not contracts and
arrangements referred to in Section 301 of the Companies
Act 1956, particulars of which need to be entered into a
register maintained under Section 301 of the Act.
(b) Not applicable in view of para (v) (a) above.
(vi) The directives issued by the Reserve Bank of India and the
provisions of Section 58A and 58AA or any other relevant
provisions of the Companies Act, 1956 and the rules framed
there-under have been complied with, in respect of deposits
accepted from the Public. We have been informed that, no order
has been passed by Company Law Board or National Company
Law Tribunal or Reserve Bank of India or any other Court or
Tribunal in this regard.
(vii) The Company has an internal audit system, which in
our opinion is commensurate with the size of the
Company and nature of its business however, in our
opinion internal audit needs to be further
strengthened.
(viii) As informed to us, the maintenance of cost records under
Section 209 (1) (d) of the Companies Act, 1956 has not been
prescribed by the Central Government.
(ix) (a) According to the information and explanations given to us
and the records of the Company examined by us, in our
opinion, the Company is regular in depositing with
appropriate authorities undisputed statutory dues
including Provident Fund, Investor Education and
Protection Fund, Employees State Insurance, Income-Tax,
Sales-tax, Wealth Tax, Service Tax, Customs Duty, Excise
Duty, Cess and other material statutory dues as applicable
with the appropriate authorities and that no undisputed
amounts payable in respect of the same were in arrears as
at 31-03-2009 for a period of more than six months from
the date they became payable.
(b) According to the information and explanation given to us
and the records of the Company examined by us, the
particulars of dues of Income Tax / Sales Tax / Wealth Tax /
Service Tax / Custom Duty / Excise Duty / Cess (as
applicable) as at March 31, 2009 which have not been
deposited on account of any dispute, are referred to in
Annexure-'B'
(x) The Company does not have any accumulated losses and has
not incurred cash losses in the current financial year and in the
immediately preceding financial year.
(xi) According to the records of the Company examined by us and as
per the information and explanations given to us, the Company
has not defaulted in repayment of dues to any financial
institution or bank or debenture holders.
(xii) According to the information and explanations given to us, the
Company has not granted any loans and advances on the basis
of security by way of pledge of shares, debentures and other
securities; except certain loans to employees which have been
granted on the basis of security of house and vehicles and in
this regard proper documents & records are maintained. In
respect of loans to its employees other than those as stated
already, are granted without any security.
(xiii) In our opinion, the company is not chit fund or a Nidhi / Mutual
benefit fund / society. Therefore, the provisions of clause 4(xiii)
of the Companies (Auditor's Report) Order, 2003 (as amended)
are not applicable to the Company.
(xiv) In our opinion, the Company is not dealing in or trading in
shares, securities, debentures and other investments.
Accordingly, the provisions of clause 4(xiv) of the Companies
(Auditor's Report) Order, 2003 (as amended) are not
applicable to the Company.
(xv) In our opinion and according to the information and
explanations given to us the terms & conditions of the
guarantee given by the company for loans taken by NINL from
banks or financial institutions during the year are not prima-facie
prejudicial to the interest of the Company.
(xvi) According to the information and explanations given to us, the
Company has not taken any term loans during the year. Hence,
the provisions of clause 4(xvi) of the Companies (Auditor's
th46 Annual Report 2008-09
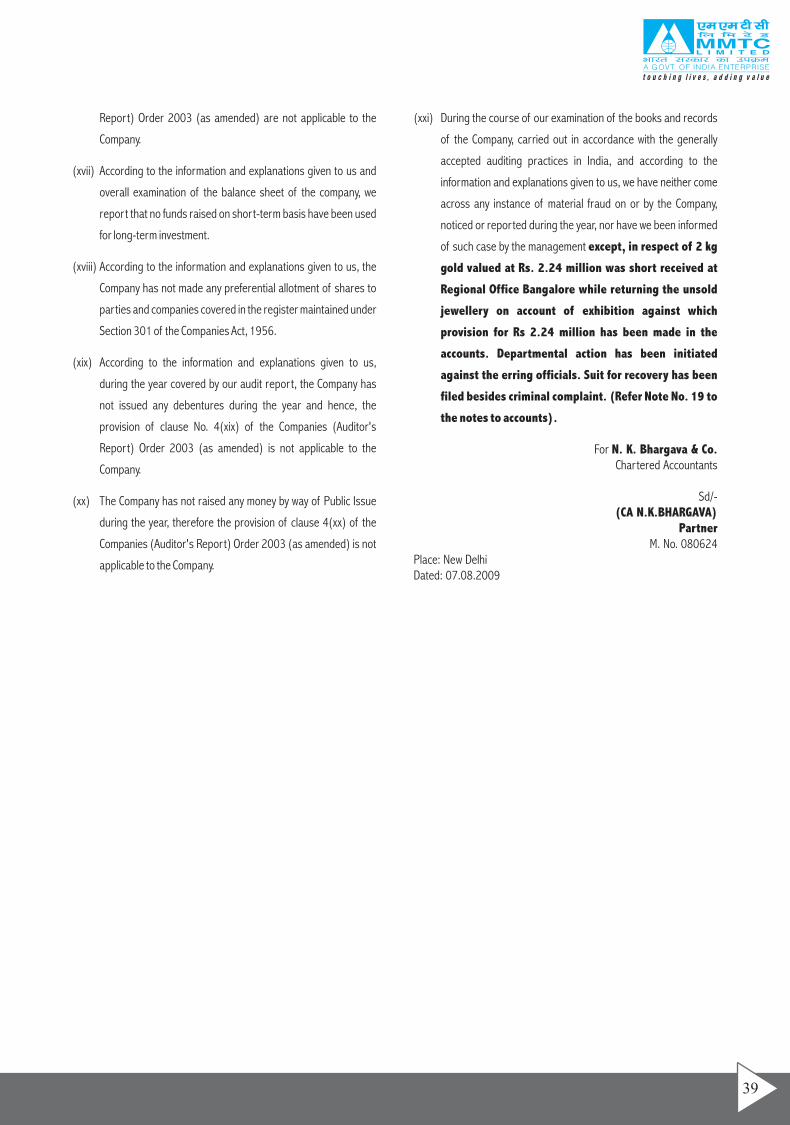
Report) Order 2003 (as amended) are not applicable to the
Company.
(xvii) According to the information and explanations given to us and
overall examination of the balance sheet of the company, we
report that no funds raised on short-term basis have been used
for long-term investment.
(xviii) According to the information and explanations given to us, the
Company has not made any preferential allotment of shares to
parties and companies covered in the register maintained under
Section 301 of the Companies Act, 1956.
(xix) According to the information and explanations given to us,
during the year covered by our audit report, the Company has
not issued any debentures during the year and hence, the
provision of clause No. 4(xix) of the Companies (Auditor's
Report) Order 2003 (as amended) is not applicable to the
Company.
(xx) The Company has not raised any money by way of Public Issue
during the year, therefore the provision of clause 4(xx) of the
Companies (Auditor's Report) Order 2003 (as amended) is not
applicable to the Company.
(xxi) During the course of our examination of the books and records
of the Company, carried out in accordance with the generally
accepted auditing practices in India, and according to the
information and explanations given to us, we have neither come
across any instance of material fraud on or by the Company,
noticed or reported during the year, nor have we been informed
of such case by the management except, in respect of 2 kg
gold valued at Rs. 2.24 million was short received at
Regional Office Bangalore while returning the unsold
jewellery on account of exhibition against which
provision for Rs 2.24 million has been made in the
accounts. Departmental action has been initiated
against the erring officials. Suit for recovery has been
filed besides criminal complaint. (Refer Note No. 19 to
the notes to accounts).
For N. K. Bhargava & Co.Chartered Accountants
Sd/-(CA N.K.BHARGAVA)
PartnerM. No. 080624
Place: New DelhiDated: 07.08.2009
39
ANNEXURE 'B' TO AUDITORS' REPORT
Referred to in paragraph 9(b) of Annexure -'A' a statement on the matters specified in the Companies (Auditors Report) Order, 2003 (as amended) of MMTC Limited for the year ended on 31st March 2009
According to the records of the company dues of Income Tax, Sales Tax, Custom Duty, Excise Duty and Cess which have not been deposited on account of disputes are stated below:
Chennai Regional Office
Name of the Statute Nature of the dues Amount (In Rs.) Period Forum of Dispute
CST ACT Sales Tax on Interest Collected 66,590 1995-96 Sales Tax Appeals Tribunal
CST ACT Tax on Interest Collected 14,458 1996-98 Assistant Commissioner (CT)
CST ACT Sales Tax, Penalty & Interest 18,926 1993-95 High Court
TNGST ACT Sales Tax on Interest Collected 40,134 1996-98 Assistant Commissioner (CT)
TNGST ACT Sales Tax, Penalty & Interest 79,144 1991-93 High Court
TNGST ACT Sales Tax, Penalty & Interest 27,12,229 1995-2001 Sales Tax Appeals Tribunal
TNGST ACT Sales Tax, Penalty & Interest 3,45,019 1991-95 Special Tribunal Chennai
Mumbai Regional Office
Name of the Statute Nature of the dues Amount (In Rs.) Period Forum of Dispute
BST ACT Sales Tax 3,29,69,209 1986-87 MST TRIBUNAL
BST ACT Sales Tax 4,27,51,939 1987-88 MST TRIBUNAL
BST ACT Sales Tax 7,56,98,025 1988-89 MST TRIBUNAL
BST ACT Sales Tax 14,96,06,778 1989-90 MST TRIBUNAL
BST ACT Sales Tax 23,30,46,478 1990-91 DC (APPEAL)
BST ACT Sales Tax 28,98,738 1991-92 DC (APPEAL)
BST ACT Sales Tax 11,14,933 1992-93 MST TRIBUNAL
BST ACT Sales Tax 45,03,961 2001-02 DC(APPEAL)
Corporate Office
Name of the Statute Nature of the dues Amount (In Rs.) Period Forum of Dispute
Income Tax Act, 1961 Income Tax & Interest 3.29 crores A/Y 2003-04 CIT(A)
Income Tax Act, 1961 Income Tax & Interest 42.41 crores 1991-92 to CIT(A)/ITAT/High Court2006-07
Delhi Regional Office
Name of the Statute Nature of the dues Amount (In Rs.) Period Forum of Dispute
Delhi Sales Tax Sales Tax 11,65,303 1984-85 D.C. appeal
th46 Annual Report 2008-09
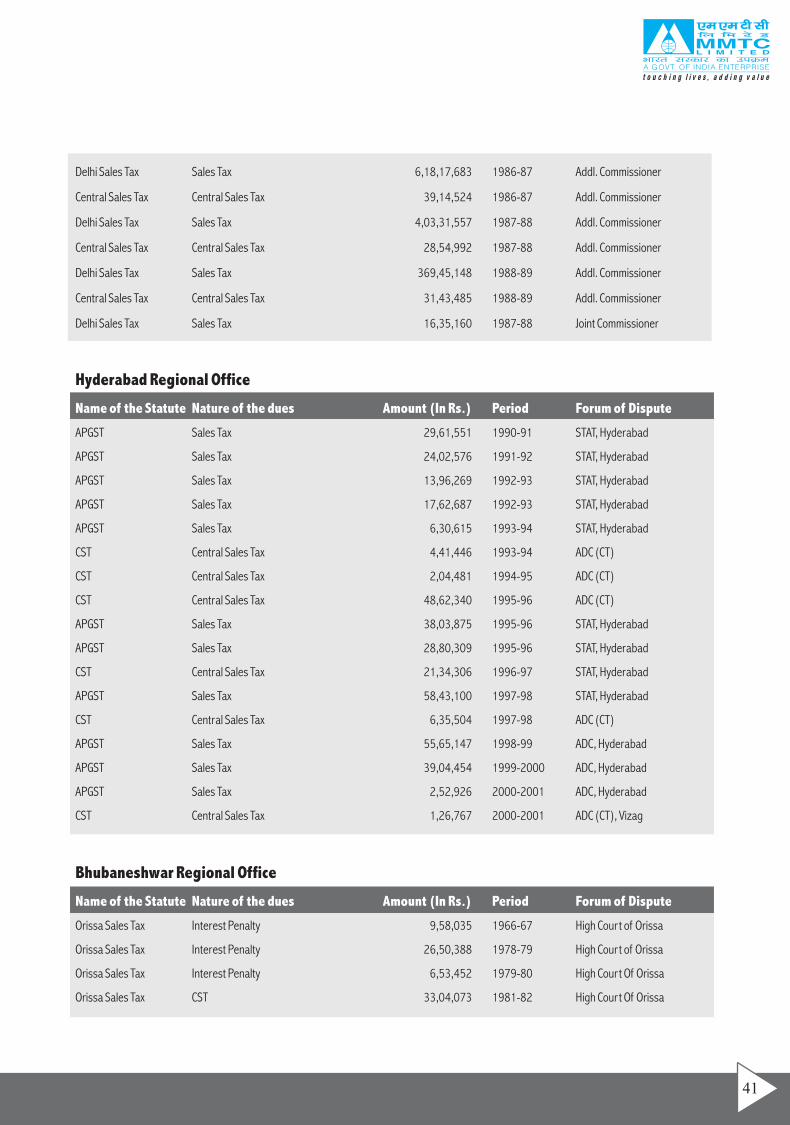
41
Delhi Sales Tax Sales Tax 6,18,17,683 1986-87 Addl. Commissioner
Central Sales Tax Central Sales Tax 39,14,524 1986-87 Addl. Commissioner
Delhi Sales Tax Sales Tax 4,03,31,557 1987-88 Addl. Commissioner
Central Sales Tax Central Sales Tax 28,54,992 1987-88 Addl. Commissioner
Delhi Sales Tax Sales Tax 369,45,148 1988-89 Addl. Commissioner
Central Sales Tax Central Sales Tax 31,43,485 1988-89 Addl. Commissioner
Delhi Sales Tax Sales Tax 16,35,160 1987-88 Joint Commissioner
Hyderabad Regional Office
Name of the Statute Nature of the dues Amount (In Rs.) Period Forum of Dispute
APGST Sales Tax 29,61,551 1990-91 STAT, Hyderabad
APGST Sales Tax 24,02,576 1991-92 STAT, Hyderabad
APGST Sales Tax 13,96,269 1992-93 STAT, Hyderabad
APGST Sales Tax 17,62,687 1992-93 STAT, Hyderabad
APGST Sales Tax 6,30,615 1993-94 STAT, Hyderabad
CST Central Sales Tax 4,41,446 1993-94 ADC (CT)
CST Central Sales Tax 2,04,481 1994-95 ADC (CT)
CST Central Sales Tax 48,62,340 1995-96 ADC (CT)
APGST Sales Tax 38,03,875 1995-96 STAT, Hyderabad
APGST Sales Tax 28,80,309 1995-96 STAT, Hyderabad
CST Central Sales Tax 21,34,306 1996-97 STAT, Hyderabad
APGST Sales Tax 58,43,100 1997-98 STAT, Hyderabad
CST Central Sales Tax 6,35,504 1997-98 ADC (CT)
APGST Sales Tax 55,65,147 1998-99 ADC, Hyderabad
APGST Sales Tax 39,04,454 1999-2000 ADC, Hyderabad
APGST Sales Tax 2,52,926 2000-2001 ADC, Hyderabad
CST Central Sales Tax 1,26,767 2000-2001 ADC (CT), Vizag
Bhubaneshwar Regional Office
Name of the Statute Nature of the dues Amount (In Rs.) Period Forum of Dispute
Orissa Sales Tax Interest Penalty 9,58,035 1966-67 High Court of Orissa
Orissa Sales Tax Interest Penalty 26,50,388 1978-79 High Court of Orissa
Orissa Sales Tax Interest Penalty 6,53,452 1979-80 High Court Of Orissa
Orissa Sales Tax CST 33,04,073 1981-82 High Court Of Orissa
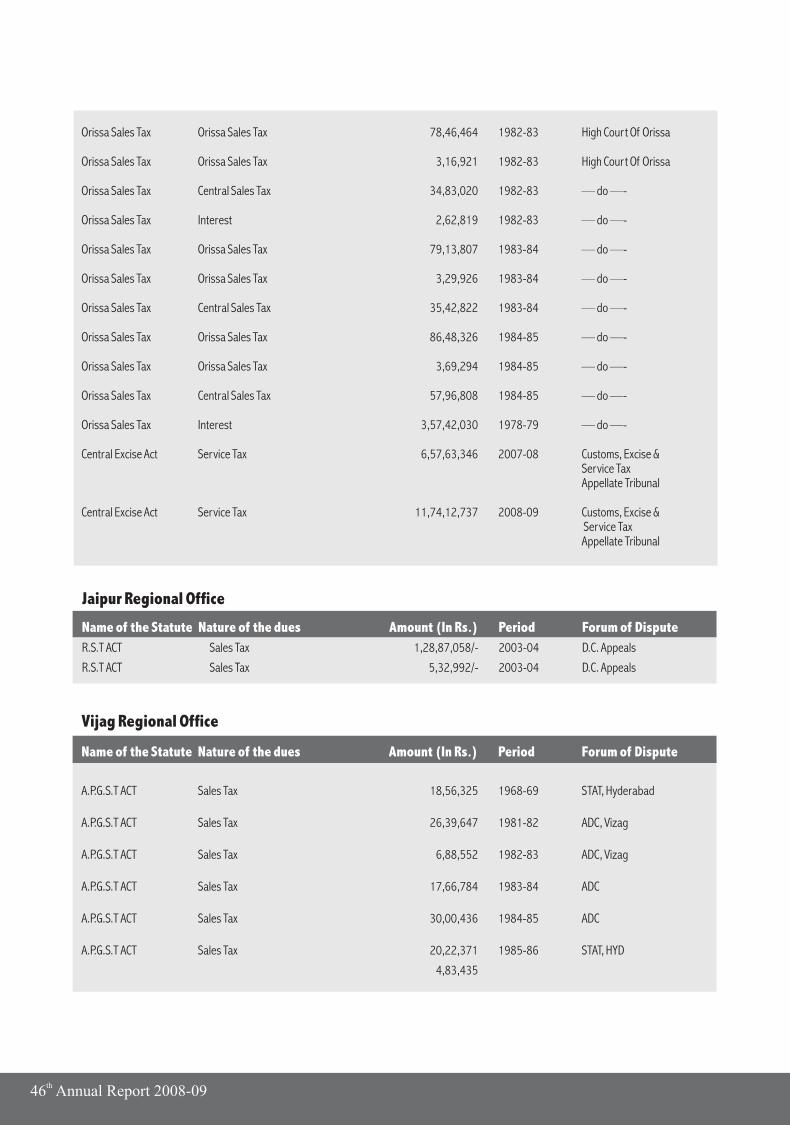
th46 Annual Report 2008-09
Orissa Sales Tax Orissa Sales Tax 78,46,464 1982-83 High Court Of Orissa
Orissa Sales Tax Orissa Sales Tax 3,16,921 1982-83 High Court Of Orissa
Orissa Sales Tax Central Sales Tax 34,83,020 1982-83
Orissa Sales Tax Interest 2,62,819 1982-83
Orissa Sales Tax Orissa Sales Tax 79,13,807 1983-84
Orissa Sales Tax Orissa Sales Tax 3,29,926 1983-84
Orissa Sales Tax Central Sales Tax 35,42,822 1983-84
Orissa Sales Tax Orissa Sales Tax 86,48,326 1984-85
Orissa Sales Tax Orissa Sales Tax 3,69,294 1984-85
Orissa Sales Tax Central Sales Tax 57,96,808 1984-85
Orissa Sales Tax Interest 3,57,42,030 1978-79
Central Excise Act Service Tax 6,57,63,346 2007-08 Customs, Excise & Service Tax Appellate Tribunal
Central Excise Act Service Tax 11,74,12,737 2008-09 Customs, Excise & Service Tax Appellate Tribunal
— do —-
— do —-
— do —-
— do —-
— do —-
— do —-
— do —-
— do —-
— do —-
Jaipur Regional Office
Name of the Statute Nature of the dues Amount (In Rs.) Period Forum of Dispute
R.S.T ACT Sales Tax 1,28,87,058/- 2003-04 D.C. Appeals
R.S.T ACT Sales Tax 5,32,992/- 2003-04 D.C. Appeals
Vijag Regional Office
Name of the Statute Nature of the dues Amount (In Rs.) Period Forum of Dispute
A.P.G.S.T ACT Sales Tax 18,56,325 1968-69 STAT, Hyderabad
A.P.G.S.T ACT Sales Tax 26,39,647 1981-82 ADC, Vizag
A.P.G.S.T ACT Sales Tax 6,88,552 1982-83 ADC, Vizag
A.P.G.S.T ACT Sales Tax 17,66,784 1983-84 ADC
A.P.G.S.T ACT Sales Tax 30,00,436 1984-85 ADC
A.P.G.S.T ACT Sales Tax 20,22,371 1985-86 STAT, HYD
4,83,435
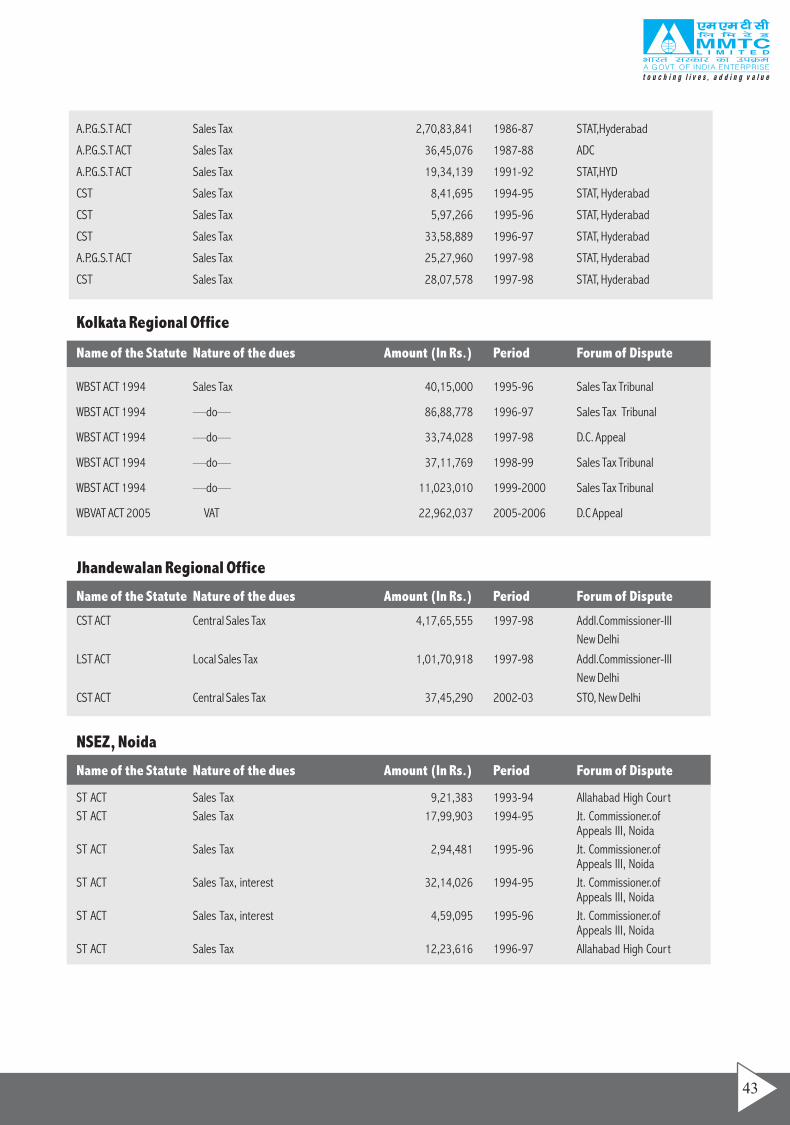
43
A.P.G.S.T ACT Sales Tax 2,70,83,841 1986-87 STAT,Hyderabad
A.P.G.S.T ACT Sales Tax 36,45,076 1987-88 ADC
A.P.G.S.T ACT Sales Tax 19,34,139 1991-92 STAT,HYD
CST Sales Tax 8,41,695 1994-95 STAT, Hyderabad
CST Sales Tax 5,97,266 1995-96 STAT, Hyderabad
CST Sales Tax 33,58,889 1996-97 STAT, Hyderabad
A.P.G.S.T ACT Sales Tax 25,27,960 1997-98 STAT, Hyderabad
CST Sales Tax 28,07,578 1997-98 STAT, Hyderabad
Kolkata Regional Office
WBST ACT 1994 Sales Tax 40,15,000 1995-96 Sales Tax Tribunal
WBST ACT 1994 —do— 86,88,778 1996-97 Sales Tax Tribunal
WBST ACT 1994 —do— 33,74,028 1997-98 D.C. Appeal
WBST ACT 1994 —do— 37,11,769 1998-99 Sales Tax Tribunal
WBST ACT 1994 —do— 11,023,010 1999-2000 Sales Tax Tribunal
WBVAT ACT 2005 VAT 22,962,037 2005-2006 D.C Appeal
Name of the Statute Nature of the dues Amount (In Rs.) Period Forum of Dispute
Jhandewalan Regional Office
CST ACT Central Sales Tax 4,17,65,555 1997-98 Addl.Commissioner-III
New Delhi
LST ACT Local Sales Tax 1,01,70,918 1997-98 Addl.Commissioner-III
New Delhi
CST ACT Central Sales Tax 37,45,290 2002-03 STO, New Delhi
Name of the Statute Nature of the dues Amount (In Rs.) Period Forum of Dispute
NSEZ, Noida
ST ACT Sales Tax 9,21,383 1993-94 Allahabad High Court
ST ACT Sales Tax 17,99,903 1994-95 Jt. Commissioner.of Appeals III, Noida
ST ACT Sales Tax 2,94,481 1995-96 Jt. Commissioner.of Appeals III, Noida
ST ACT Sales Tax, interest 32,14,026 1994-95 Jt. Commissioner.of Appeals III, Noida
ST ACT Sales Tax, interest 4,59,095 1995-96 Jt. Commissioner.of Appeals III, Noida
ST ACT Sales Tax 12,23,616 1996-97 Allahabad High Court
Name of the Statute Nature of the dues Amount (In Rs.) Period Forum of Dispute
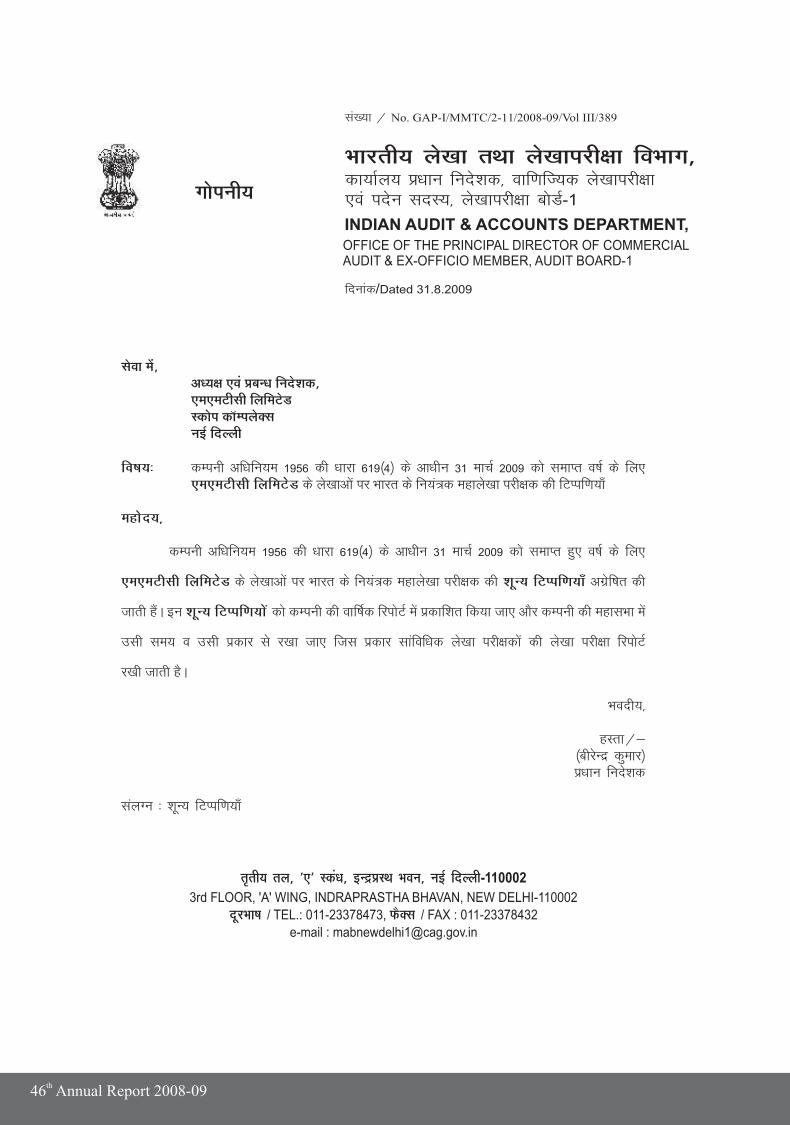
th46 Annual Report 2008-09
lsok esa]v/;{k ,oa çcU/k funs'kd]
Ldksi dkWEiysDlubZ fnYyh
fo"k;% dEiuh vf/kfu;e 1956 dh /kkjk 619¼4½ ds vk/khu 31 ekpZ 2009 dks lekIr o"kZ ds fy, ,e,eVhlh fyfeVsM ds ys[kkvksa ij Hkkjr ds fu;a=d egkys[kk ijh{kd dh fVIif.k;k¡
egksn;]
dEiuh vf/kfu;e 1956 dh /kkjk 619¼4½ ds vk/khu 31 ekpZ 2009 dks lekIr gq, o"kZ ds fy,
,e,eVhlh fyfeVsM ds ys[kkvkas ij Hkkjr ds fu;a=d egkys[kk ijh{kd dh 'kwU; fVIif.k;k¡ vxzsf"kr dh
tkrh gSaA bu 'kwU; fVIif.k;ksa dks dEiuh dh okf"kZd fjiksVZ esa izdkf'kr fd;k tk, vkSj dEiuh dh egklHkk esa
mlh le; o mlh izdkj ls j[kk tk, ftl izdkj lkafof/kd ys[kk ijh{kdksa dh ys[kk ijh{kk fjiksVZ
j[kh tkrh gSA
Hkonh;]
gLrk@&¼chjsUnz dqekj½iz/kku funs'kd
layXu % 'kwU; fVIif.k;k¡Õ
,e,eVhlh fyfeVsM
Hkkjrh; ys[kk rFkk ys[kkijh{kk foHkkx]dk;kZy; ç/kku funs'kd] okf.kfT;d ys[kkijh{kk,oa insu lnL;] ys[kkijh{kk cksMZ-1
INDIAN AUDIT & ACCOUNTS DEPARTMENT,OFFICE OF THE PRINCIPAL DIRECTOR OF COMMERCIALAUDIT & EX-OFFICIO MEMBER, AUDIT BOARD-1
la[;k @ No. GAP-I/MMTC/2-11/2008-09/Vol III/389
xksiuh;
fnukad/Dated 31.8.2009
r̀rh; ry] *,* Lda/k] bUæçLFk Hkou] ubZ fnYyh-110002
3rd FLOOR, 'A' WING, INDRAPRASTHA BHAVAN, NEW DELHI-110002
nwjHkk"k / TEL.: 011-23378473, QSDl / FAX : 011-23378432
e-mail : [email protected]
45
COMMENTS OF THE COMPTROLLER AND AUDITOR GENERAL OF INDIA UNDER SECTION 619 (4) OF THE COMPANIES ACT, 1956 ON THE ACCOUNTS OF MMTC LIMITED FOR THE YEAR ENDED 31 MARCH 2009
The preparation of financial statements of MMTC Limited for the year ended 31 March 2009 in accordance with the financial
reporting framework prescribed under the Companies Act, 1956 is the responsibility of the Management of the Company. The Statutory
Auditors appointed by the Comptroller and Auditor General of India under Section 619 (2) of the Companies Act, 1956 are responsible
for expressing opinion on these financial statements under Section 227 of the Companies Act, 1956 based on independent audit in
accordance with the Auditing and Assurance Standards prescribed by their professional body the Institute of Chartered Accounts of thIndia. This is stated to have been done by them vide their Audit Report dated 07 August 2009.
I on behalf of the Comptroller and Auditor General of India have conducted a supplementary audit under Section 619(3) (b) of
the Companies Act, 1956 of the financial statements of MMTC Limited for the year ended 31 March 2009. This supplementary audit
has been carried out independently without access to the working papers of the Statutory Auditors and is limited primarily to inquiries of
the Statutory Auditors and Company personnel and a selective examination of some of the accounting records. On the basis of my audit
nothing significant has come to my knowledge which would give rise to any comment upon or supplement to Statutory Auditors' report
under Section 619 (4) of the Companies Act, 1956.
For and on behalf of theComptroller and Auditor General of India
Sd/-(Birendra Kumar)
Principal Director of Commercial Audit& ex-Officio Member, Audit Board-I,
New Delhi.Place: New DelhiDated : 31 August 2009
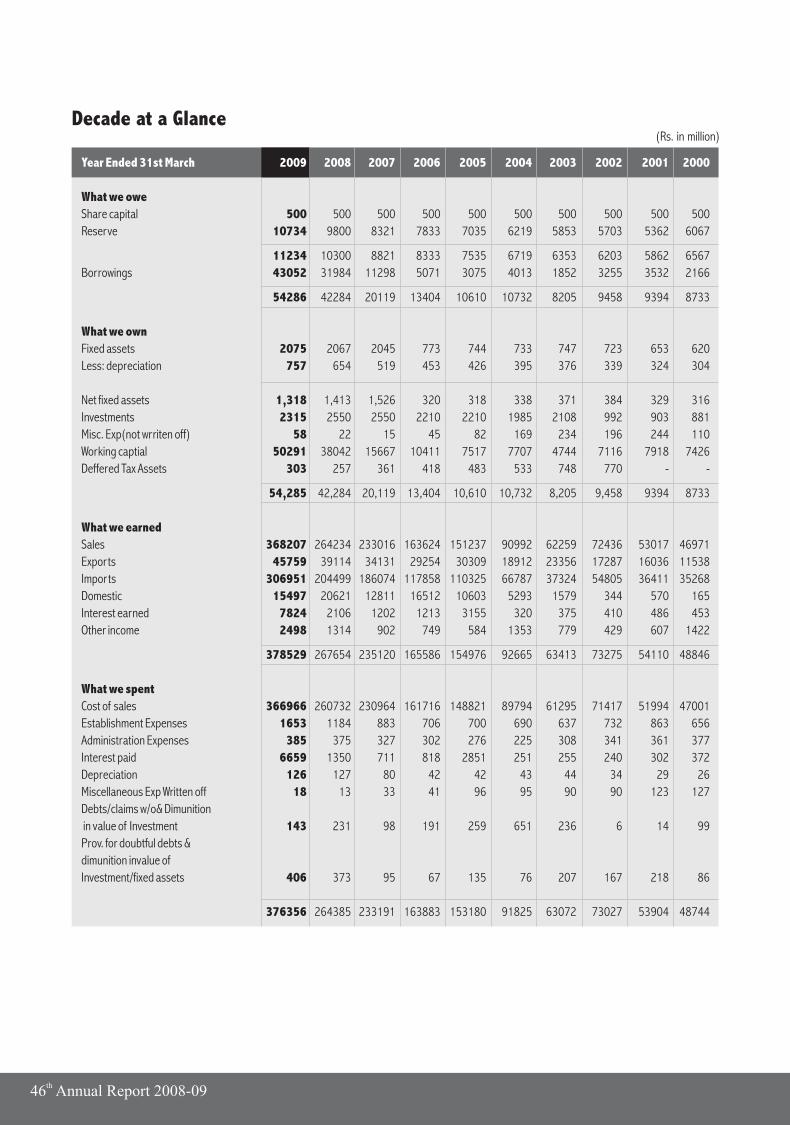
th46 Annual Report 2008-09
Decade at a Glance(Rs. in million)
Year Ended 31st March 2009 2008 2007 2006 2005 2004 2003 2002 2001 2000
What we owe
Share capital 500 500 500 500 500 500 500 500 500 500
Reserve 10734 9800 8321 7833 7035 6219 5853 5703 5362 6067
11234 10300 8821 8333 7535 6719 6353 6203 5862 6567
Borrowings 43052 31984 11298 5071 3075 4013 1852 3255 3532 2166
54286 42284 20119 13404 10610 10732 8205 9458 9394 8733
What we own
Fixed assets 2075 2067 2045 773 744 733 747 723 653 620
Less: depreciation 757 654 519 453 426 395 376 339 324 304
Net fixed assets 1,318 1,413 1,526 320 318 338 371 384 329 316
Investments 2315 2550 2550 2210 2210 1985 2108 992 903 881
Misc. Exp(not wrriten off) 58 22 15 45 82 169 234 196 244 110
Working captial 50291 38042 15667 10411 7517 7707 4744 7116 7918 7426
Deffered Tax Assets 303 257 361 418 483 533 748 770 - -
54,285 42,284 20,119 13,404 10,610 10,732 8,205 9,458 9394 8733
What we earned
Sales 368207 264234 233016 163624 151237 90992 62259 72436 53017 46971
Exports 45759 39114 34131 29254 30309 18912 23356 17287 16036 11538
Imports 306951 204499 186074 117858 110325 66787 37324 54805 36411 35268
Domestic 15497 20621 12811 16512 10603 5293 1579 344 570 165
Interest earned 7824 2106 1202 1213 3155 320 375 410 486 453
Other income 2498 1314 902 749 584 1353 779 429 607 1422
378529 267654 235120 165586 154976 92665 63413 73275 54110 48846
What we spent
Cost of sales 366966 260732 230964 161716 148821 89794 61295 71417 51994 47001
Establishment Expenses 1653 1184 883 706 700 690 637 732 863 656
Administration Expenses 385 375 327 302 276 225 308 341 361 377
Interest paid 6659 1350 711 818 2851 251 255 240 302 372
Depreciation 126 127 80 42 42 43 44 34 29 26
Miscellaneous Exp Written off 18 13 33 41 96 95 90 90 123 127
Debts/claims w/o& Dimunition
in value of Investment 143 231 98 191 259 651 236 6 14 99
Prov. for doubtful debts &
dimunition invalue of
Investment/fixed assets 406 373 95 67 135 76 207 167 218 86
376356 264385 233191 163883 153180 91825 63072 73027 53904 48744
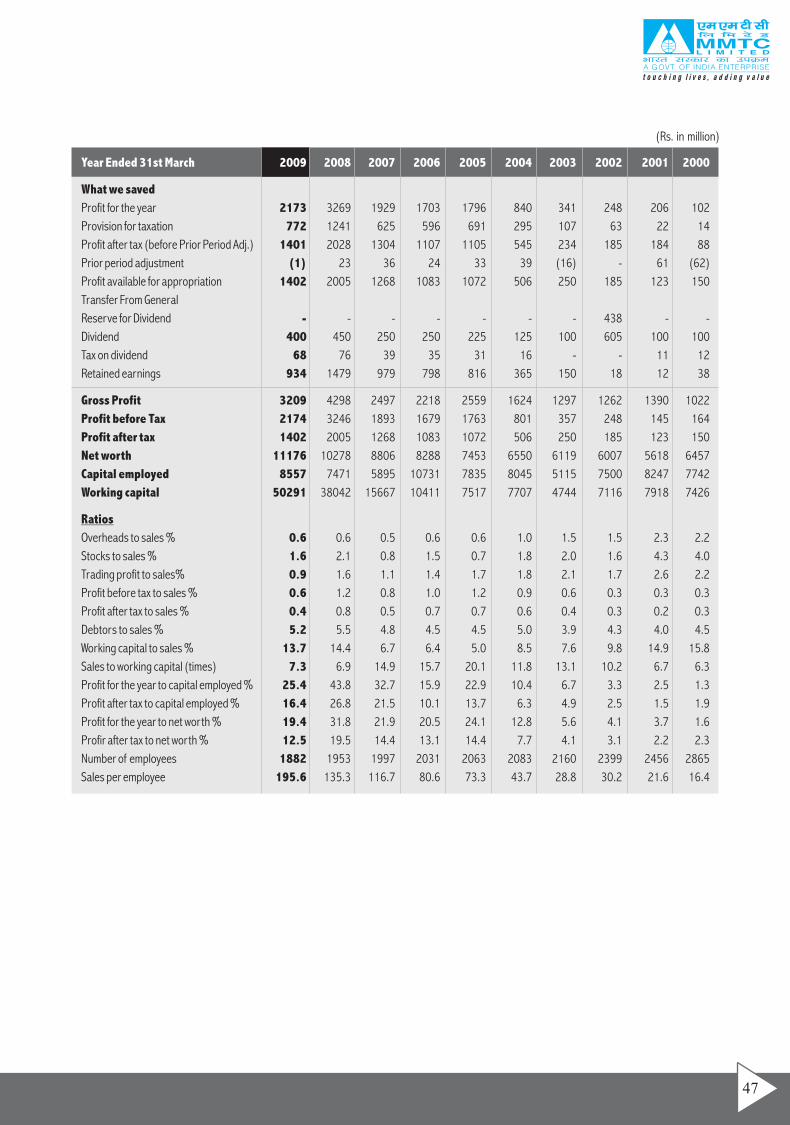
47
(Rs. in million)
Year Ended 31st March 2009 2008 2007 2006 2005 2004 2003 2002 2001 2000
What we saved
Profit for the year 2173 3269 1929 1703 1796 840 341 248 206 102
Provision for taxation 772 1241 625 596 691 295 107 63 22 14
Profit after tax (before Prior Period Adj.) 1401 2028 1304 1107 1105 545 234 185 184 88
Prior period adjustment (1) 23 36 24 33 39 (16) - 61 (62)
Profit available for appropriation 1402 2005 1268 1083 1072 506 250 185 123 150
Transfer From General
Reserve for Dividend - - - - - - - 438 - -
Dividend 400 450 250 250 225 125 100 605 100 100
Tax on dividend 68 76 39 35 31 16 - - 11 12
Retained earnings 934 1479 979 798 816 365 150 18 12 38
Gross Profit 3209 4298 2497 2218 2559 1624 1297 1262 1390 1022
Profit before Tax 2174 3246 1893 1679 1763 801 357 248 145 164
Profit after tax 1402 2005 1268 1083 1072 506 250 185 123 150
Net worth 11176 10278 8806 8288 7453 6550 6119 6007 5618 6457
Capital employed 8557 7471 5895 10731 7835 8045 5115 7500 8247 7742
Working capital 50291 38042 15667 10411 7517 7707 4744 7116 7918 7426
Ratios
Overheads to sales % 0.6 0.6 0.5 0.6 0.6 1.0 1.5 1.5 2.3 2.2
Stocks to sales % 1.6 2.1 0.8 1.5 0.7 1.8 2.0 1.6 4.3 4.0
Trading profit to sales% 0.9 1.6 1.1 1.4 1.7 1.8 2.1 1.7 2.6 2.2
Profit before tax to sales % 0.6 1.2 0.8 1.0 1.2 0.9 0.6 0.3 0.3 0.3
Profit after tax to sales % 0.4 0.8 0.5 0.7 0.7 0.6 0.4 0.3 0.2 0.3
Debtors to sales % 5.2 5.5 4.8 4.5 4.5 5.0 3.9 4.3 4.0 4.5
Working capital to sales % 13.7 14.4 6.7 6.4 5.0 8.5 7.6 9.8 14.9 15.8
Sales to working capital (times) 7.3 6.9 14.9 15.7 20.1 11.8 13.1 10.2 6.7 6.3
Profit for the year to capital employed % 25.4 43.8 32.7 15.9 22.9 10.4 6.7 3.3 2.5 1.3
Profit after tax to capital employed % 16.4 26.8 21.5 10.1 13.7 6.3 4.9 2.5 1.5 1.9
Profit for the year to net worth % 19.4 31.8 21.9 20.5 24.1 12.8 5.6 4.1 3.7 1.6
Profir after tax to net worth % 12.5 19.5 14.4 13.1 14.4 7.7 4.1 3.1 2.2 2.3
Number of employees 1882 1953 1997 2031 2063 2083 2160 2399 2456 2865
Sales per employee 195.6 135.3 116.7 80.6 73.3 43.7 28.8 30.2 21.6 16.4
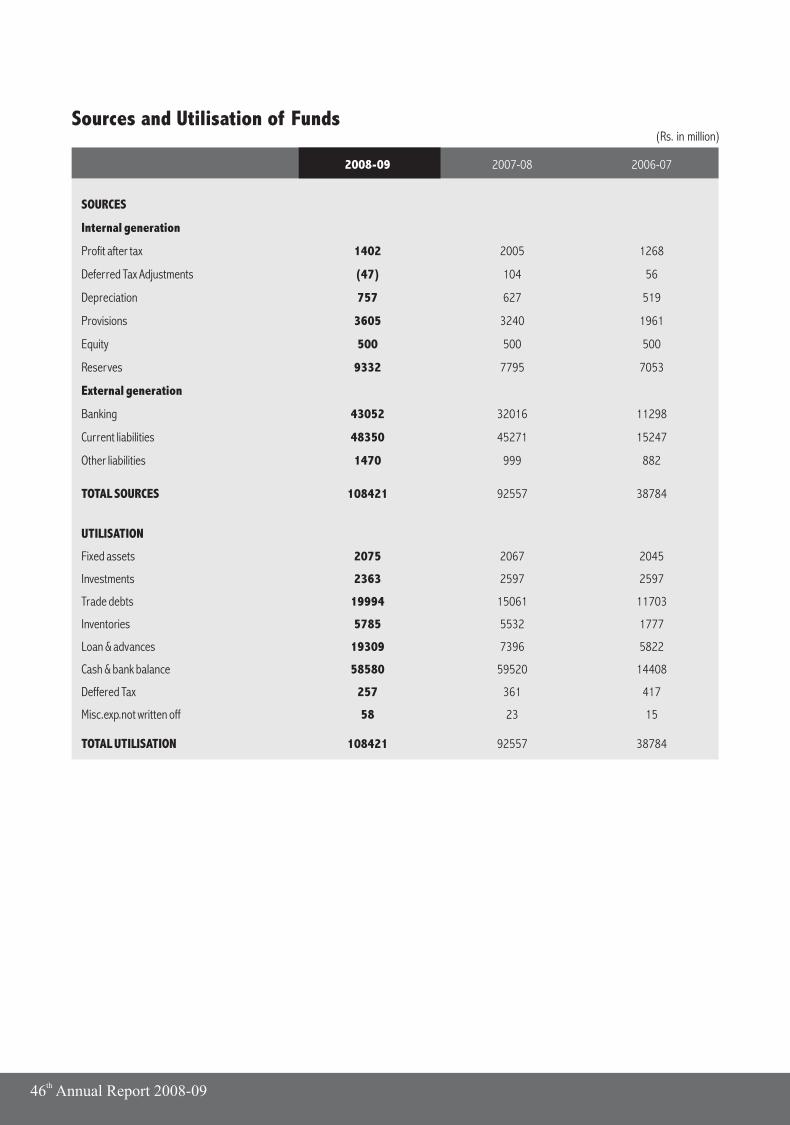
th46 Annual Report 2008-09
Sources and Utilisation of Funds(Rs. in million)
2008-09 2007-08 2006-07
SOURCES
Internal generation
Profit after tax 1402 2005 1268
Deferred Tax Adjustments (47) 104 56
Depreciation 757 627 519
Provisions 3605 3240 1961
Equity 500 500 500
Reserves 9332 7795 7053
External generation
Banking 43052 32016 11298
Current liabilities 48350 45271 15247
Other liabilities 1470 999 882
TOTAL SOURCES 108421 92557 38784
UTILISATION
Fixed assets 2075 2067 2045
Investments 2363 2597 2597
Trade debts 19994 15061 11703
Inventories 5785 5532 1777
Loan & advances 19309 7396 5822
Cash & bank balance 58580 59520 14408
Deffered Tax 257 361 417
Misc.exp.not written off 58 23 15
TOTAL UTILISATION 108421 92557 38784
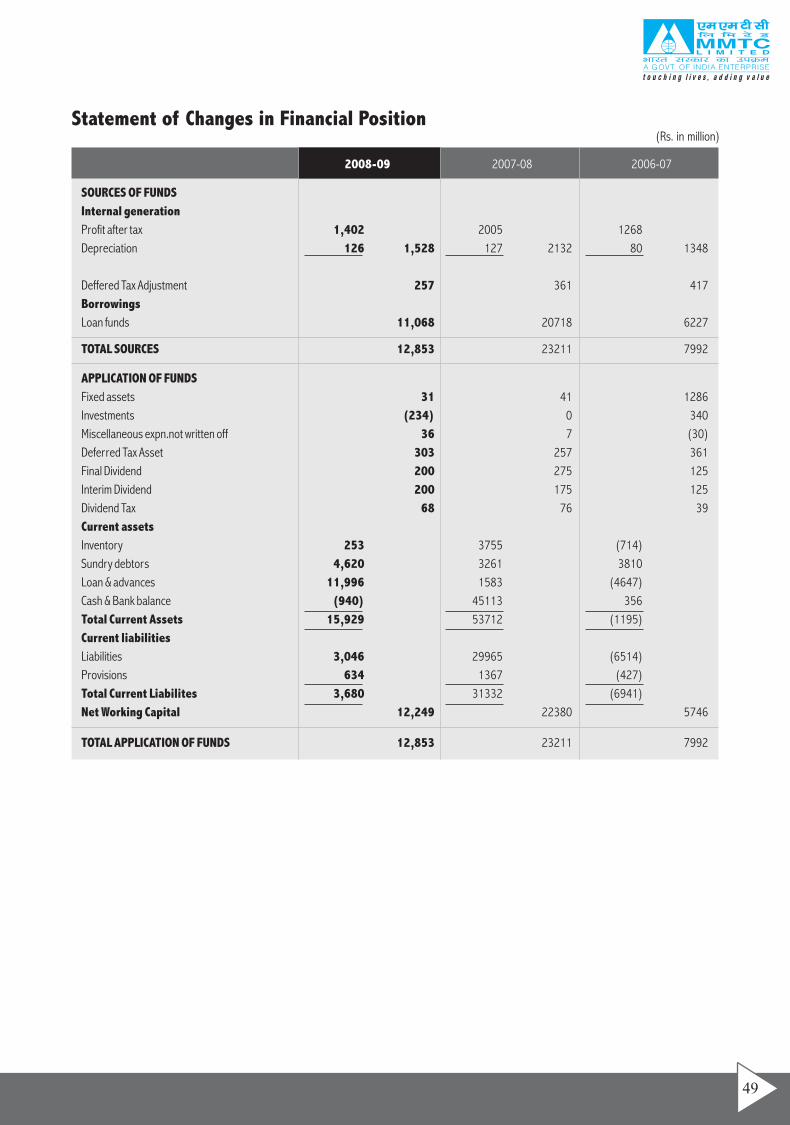
(Rs. in million)
SOURCES OF FUNDS
Internal generation
2008-09 2007-08 2006-07
Profit after tax 1,402 2005 1268
Depreciation 126 1,528 127 2132 80 1348
Deffered Tax Adjustment 257 361 417
Borrowings
Loan funds 11,068 20718 6227
TOTAL SOURCES 12,853 23211 7992
APPLICATION OF FUNDS
Fixed assets 31 41 1286
Investments (234) 0 340
Miscellaneous expn.not written off 36 7 (30)
Deferred Tax Asset 303 257 361
Final Dividend 200 275 125
Interim Dividend 200 175 125
Dividend Tax 68 76 39
Current assets
Inventory 253 3755 (714)
Sundry debtors 4,620 3261 3810
Loan & advances 11,996 1583 (4647)
Cash & Bank balance (940) 45113 356
Total Current Assets 15,929 53712 (1195)
Current liabilities
Liabilities 3,046 29965 (6514)
Provisions 634 1367 (427)
Total Current Liabilites 3,680 31332 (6941)
Net Working Capital 12,249 22380 5746
TOTAL APPLICATION OF FUNDS 12,853 23211 7992
Statement of Changes in Financial Position
49
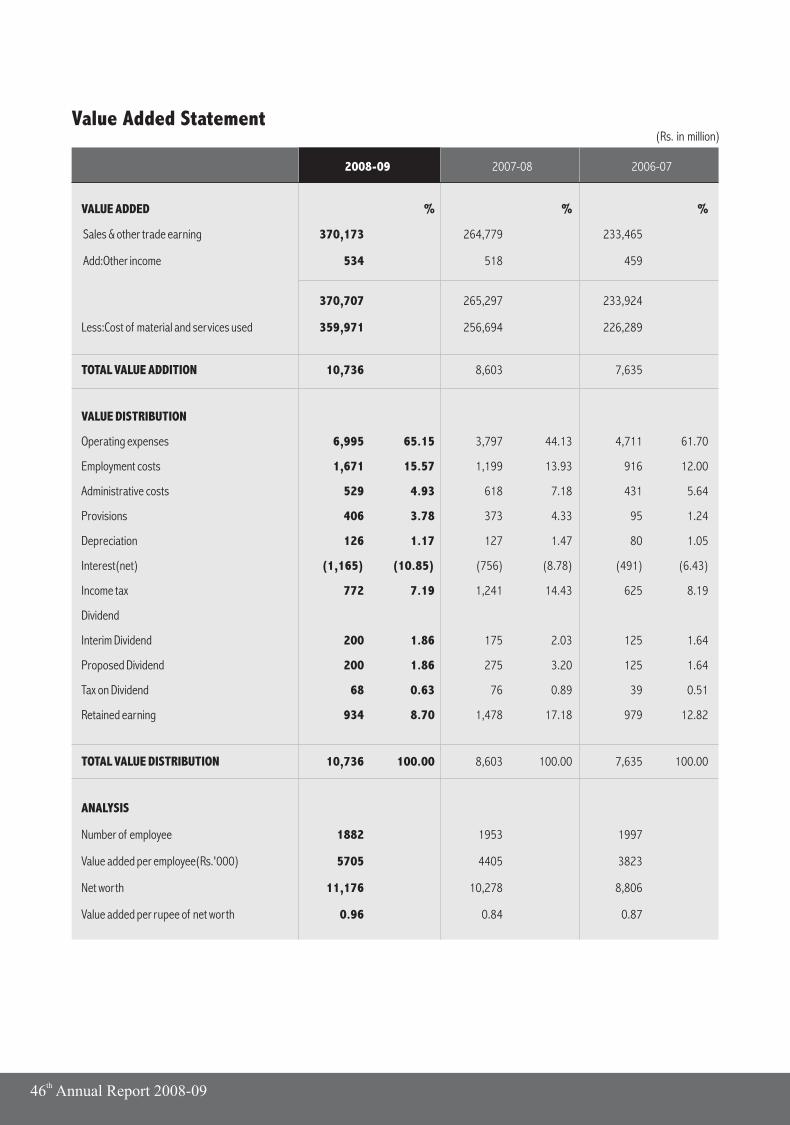
(Rs. in million)
VALUE ADDED % % %
2008-09 2007-08 2006-07
Sales & other trade earning 370,173 264,779 233,465
Add:Other income 534 518 459
370,707 265,297 233,924
Less:Cost of material and services used 359,971 256,694 226,289
TOTAL VALUE ADDITION 10,736 8,603 7,635
VALUE DISTRIBUTION
Operating expenses 6,995 65.15 3,797 44.13 4,711 61.70
Employment costs 1,671 15.57 1,199 13.93 916 12.00
Administrative costs 529 4.93 618 7.18 431 5.64
Provisions 406 3.78 373 4.33 95 1.24
Depreciation 126 1.17 127 1.47 80 1.05
Interest(net) (1,165) (10.85) (756) (8.78) (491) (6.43)
Income tax 772 7.19 1,241 14.43 625 8.19
Dividend
Interim Dividend 200 1.86 175 2.03 125 1.64
Proposed Dividend 200 1.86 275 3.20 125 1.64
Tax on Dividend 68 0.63 76 0.89 39 0.51
Retained earning 934 8.70 1,478 17.18 979 12.82
TOTAL VALUE DISTRIBUTION 10,736 100.00 8,603 100.00 7,635 100.00
ANALYSIS
Number of employee 1882 1953 1997
Value added per employee(Rs.'000) 5705 4405 3823
Net worth 11,176 10,278 8,806
Value added per rupee of net worth 0.96 0.84 0.87
Value Added Statement
th46 Annual Report 2008-09
Annual Accounts
2008-09
th46 Annual Report 2008-09
ACCOUNTING POLICIES
1. BASIS OF PREPARATION OF FINANCIAL STATEMENT
(a) The financial statements are prepared according to the historical cost convention on accrual basis and in line with the fundamental accounting principles of prudence, consistency and materiality.
(b) The financial statements are reported in Indian Rupee and all values are rounded to the nearest million unless otherwise stated.
(c ) Statement of Compliance
The financial statements are prepared on the basis of generally accepted accounting principles in India, accounting standards issued by the Institute of Chartered Accountants of India and the provisions of the Companies Act, 1956 as amended from time to time.
2. PURCHASES AND SALES
a) Purchases and sales are booked where the company has entered into purchase/sale contract/agreement with the sellers/buyers or received allocation letter from Government, on performance of the contract/agreement/allocation either wholly or partly.
b) Gold/Silver sent by foreign suppliers on consignment basis:
i) Purchases include gold/silver withdrawn from consignment stock on outright purchase basis for sale to exporters, as per the scheme of Exim Policy being operated by the Company as a nominated agency.
ii) Purchase of Gold for domestic sale is accounted for on withdrawal from the consignment stock and fixation of price with the suppliers.
iii) Gold/silver withdrawn on loan basis where from consignment stock, are shown as loan given to parties and shown under Loans and Advances. The corresponding liability towards the stocks received from foreign suppliers is shown under Sundry Creditors. Loan/Sundry Creditors are adjusted when purchase and sales are booked.
iv) In the case of replenishment basis, gold/silver booked by exporter by paying margin money, purchase is booked after "fixing" the price with the foreign suppliers. However, sale is booked when quantity is actually delivered after completion of exports.
v) Consignment stocks held on behalf of foreign suppliers at the year end is suitably disclosed in the accounts. However, customs duty paid in respect of balance consignment stock is shown as prepaid expenses.
c) In respect of exports of Iron Ore/Manganese Ore where final sale value is ascertained on the basis of destinational weight and analysis results and such results are awaited, provision towards DWA risk is made @ 1% on the provisional sale value. In case of FOBT supplies where DWA risk on the purchase value is to the account of supplier provision @1% is made on the difference between sale value and purchase value.
d) Pending settlements, certain expenses/ gain/loss like dispatch
earned/ demurrage payable etc. are accounted for on provisional basis.
3. REVENUE RECOGNITION
i) Revenue is recognized on accrual basis except in the following items which are accounted for on actual realization since relisability of such items is uncertain in accordance with the provisions of AS - 9 issued by ICAI:-
a) Tax credit, duty credit authorization under Target Plus scheme, REP/Advance Licenses, Service Tax refund, etc.
b) Decrees pending for execution/contested dues and interest thereon, if any:
c) Interest on overdue recoverables where realisability is uncertain.
d) Liquidated damages on suppliers/underwriters, refund of custom duty on account of survey shortage, and refund of income-tax/sales-tax/VAT and interest thereon.
Insurance claims are accounted for upon being accepted by the insurance company.
ii) Claims are recognized in the Profit & Loss Account on accrual basis including receivables from Govt. towards subsidy, cash incentives, reimbursement of losses etc. when it is not unreasonable to expect ultimate collection. Claims recognized but subsequently becoming doubtful are provided for through Profit & Loss Account.
4. PREPAID EXPENSES
Prepaid expenses upto Rs.5,000/- in each case are charged to revenue. Deposits upto Rs.1,000/- in each case with Government Department, Statutory Corporations, Electricity Boards and Local Bodies are also charged off to revenue.
5. FIXED ASSETS
(a) All fixed assets are stated at historical cost less accumulated depreciation and any impairment in value.
(b) The Company's expenditure toward construction/development of assets on land owned by the Government/Semi Government Authorities, is capitalized under heading "Fixed Assets created on Land and neither the Fixed Assets nor the Land belongs to the Company".
6. DEPRECIATION
Depreciation is provided on straight line method at the rates approved by the Board of Directors, which are equal to or higher than those provided under schedule XIV of the Companies Act, 1956. Depreciation on assets acquired/disposed during the year is provided from/upto the month the asset is acquired/disposed. Depreciation includes amortisation of lease-hold land and Railway Wagon Rakes under WIS. Wooden partitions and temporary structures are fully depreciated in the year of purchase/erection. Moveable assets whose written down value at the beginning of the year and / or value in respect of purchases made during the year are less than Rs 10,000/- or less in each case, 100% depreciation is provided except retaining a nominal value of Re 1/-. The depreciation rates are as under:
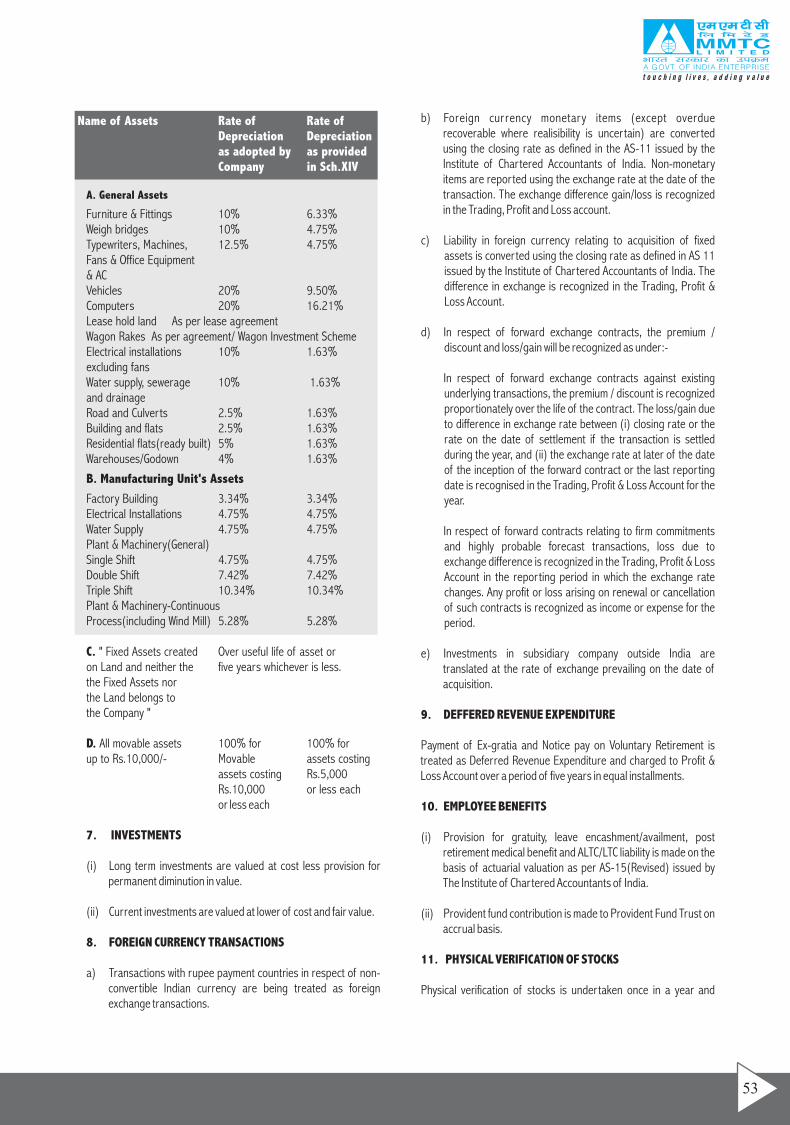
53
b) Foreign currency monetary items (except overdue recoverable where realisibility is uncertain) are converted using the closing rate as defined in the AS-11 issued by the Institute of Chartered Accountants of India. Non-monetary items are reported using the exchange rate at the date of the transaction. The exchange difference gain/loss is recognized in the Trading, Profit and Loss account.
c) Liability in foreign currency relating to acquisition of fixed assets is converted using the closing rate as defined in AS 11 issued by the Institute of Chartered Accountants of India. The difference in exchange is recognized in the Trading, Profit & Loss Account.
d) In respect of forward exchange contracts, the premium / discount and loss/gain will be recognized as under:-
In respect of forward exchange contracts against existing underlying transactions, the premium / discount is recognized proportionately over the life of the contract. The loss/gain due to difference in exchange rate between (i) closing rate or the rate on the date of settlement if the transaction is settled during the year, and (ii) the exchange rate at later of the date of the inception of the forward contract or the last reporting date is recognised in the Trading, Profit & Loss Account for the year.
In respect of forward contracts relating to firm commitments and highly probable forecast transactions, loss due to exchange difference is recognized in the Trading, Profit & Loss Account in the reporting period in which the exchange rate changes. Any profit or loss arising on renewal or cancellation of such contracts is recognized as income or expense for the period.
e) Investments in subsidiary company outside India are translated at the rate of exchange prevailing on the date of acquisition.
9. DEFFERED REVENUE EXPENDITURE
Payment of Ex-gratia and Notice pay on Voluntary Retirement is treated as Deferred Revenue Expenditure and charged to Profit & Loss Account over a period of five years in equal installments.
10. EMPLOYEE BENEFITS
(i) Provision for gratuity, leave encashment/availment, post retirement medical benefit and ALTC/LTC liability is made on the basis of actuarial valuation as per AS-15(Revised) issued by The Institute of Chartered Accountants of India.
(ii) Provident fund contribution is made to Provident Fund Trust on accrual basis.
11. PHYSICAL VERIFICATION OF STOCKS
Physical verification of stocks is undertaken once in a year and
Name of Assets Rate of Depreciation Depreciationas adopted by as provided Company in Sch.XIV
A. General Assets
Rate of
Furniture & Fittings 10% 6.33%Weigh bridges 10% 4.75%Typewriters, Machines, 12.5% 4.75%Fans & Office Equipment & AC Vehicles 20% 9.50%Computers 20% 16.21%Lease hold land As per lease agreementWagon Rakes As per agreement/ Wagon Investment SchemeElectrical installations 10% 1.63%excluding fansWater supply, sewerage 10% 1.63%and drainageRoad and Culverts 2.5% 1.63%Building and flats 2.5% 1.63%Residential flats(ready built) 5% 1.63%Warehouses/Godown 4% 1.63%
B. Manufacturing Unit's Assets
Factory Building 3.34% 3.34%Electrical Installations 4.75% 4.75%Water Supply 4.75% 4.75%Plant & Machinery(General)Single Shift 4.75% 4.75%Double Shift 7.42% 7.42%Triple Shift 10.34% 10.34%Plant & Machinery-ContinuousProcess(including Wind Mill) 5.28% 5.28%
C. " Fixed Assets created Over useful life of asset or on Land and neither the five years whichever is less.the Fixed Assets nor the Land belongs to the Company "
D. All movable assets 100% for 100% for up to Rs.10,000/- Movable assets costing
assets costing Rs.5,000Rs.10,000 or less eachor less each
7. INVESTMENTS
(i) Long term investments are valued at cost less provision for permanent diminution in value.
(ii) Current investments are valued at lower of cost and fair value.
8. FOREIGN CURRENCY TRANSACTIONS
a) Transactions with rupee payment countries in respect of non-convertible Indian currency are being treated as foreign exchange transactions.
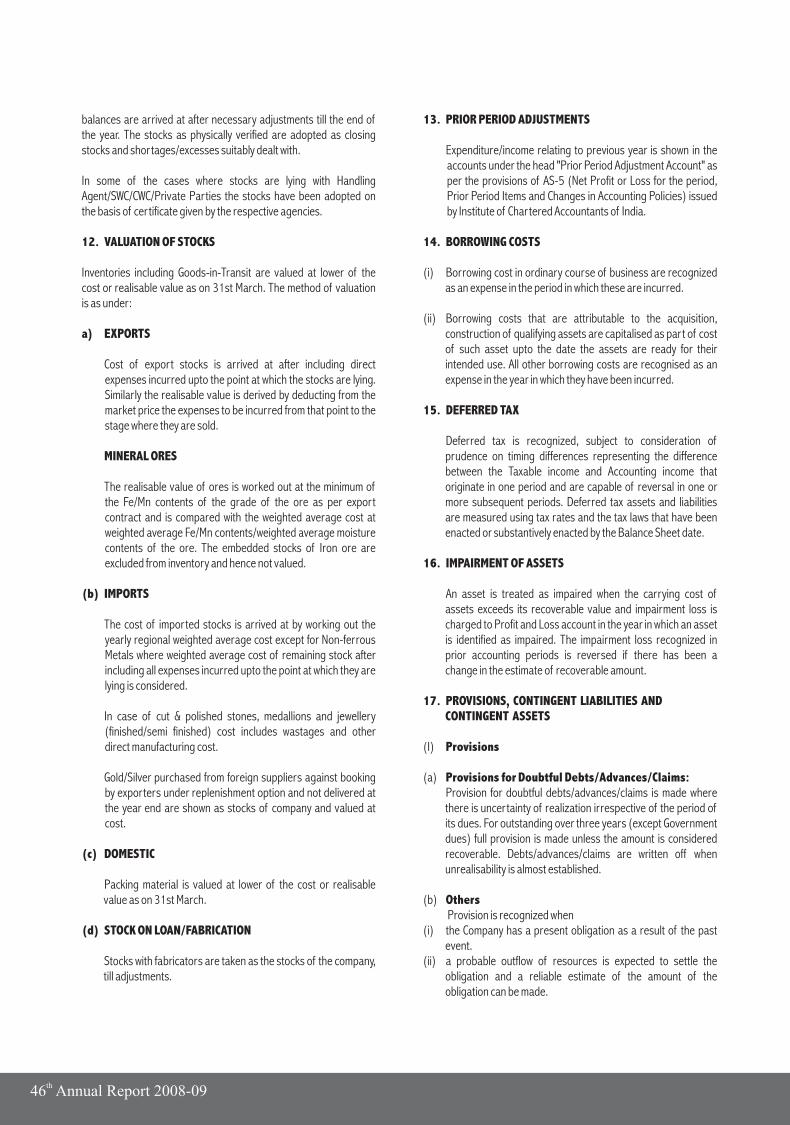
th46 Annual Report 2008-09
balances are arrived at after necessary adjustments till the end of the year. The stocks as physically verified are adopted as closing stocks and shortages/excesses suitably dealt with.
In some of the cases where stocks are lying with Handling Agent/SWC/CWC/Private Parties the stocks have been adopted on the basis of certificate given by the respective agencies.
12. VALUATION OF STOCKS
Inventories including Goods-in-Transit are valued at lower of the cost or realisable value as on 31st March. The method of valuation is as under:
a) EXPORTS
Cost of export stocks is arrived at after including direct expenses incurred upto the point at which the stocks are lying. Similarly the realisable value is derived by deducting from the market price the expenses to be incurred from that point to the stage where they are sold.
MINERAL ORES
The realisable value of ores is worked out at the minimum of the Fe/Mn contents of the grade of the ore as per export contract and is compared with the weighted average cost at weighted average Fe/Mn contents/weighted average moisture contents of the ore. The embedded stocks of Iron ore are excluded from inventory and hence not valued.
(b) IMPORTS
The cost of imported stocks is arrived at by working out the yearly regional weighted average cost except for Non-ferrous Metals where weighted average cost of remaining stock after including all expenses incurred upto the point at which they are lying is considered.
In case of cut & polished stones, medallions and jewellery (finished/semi finished) cost includes wastages and other direct manufacturing cost.
Gold/Silver purchased from foreign suppliers against booking by exporters under replenishment option and not delivered at the year end are shown as stocks of company and valued at cost.
(c) DOMESTIC
Packing material is valued at lower of the cost or realisable value as on 31st March.
(d) STOCK ON LOAN/FABRICATION
Stocks with fabricators are taken as the stocks of the company, till adjustments.
13. PRIOR PERIOD ADJUSTMENTS
Expenditure/income relating to previous year is shown in the accounts under the head "Prior Period Adjustment Account" as per the provisions of AS-5 (Net Profit or Loss for the period, Prior Period Items and Changes in Accounting Policies) issued by Institute of Chartered Accountants of India.
14. BORROWING COSTS
(i) Borrowing cost in ordinary course of business are recognized as an expense in the period in which these are incurred.
(ii) Borrowing costs that are attributable to the acquisition, construction of qualifying assets are capitalised as part of cost of such asset upto the date the assets are ready for their intended use. All other borrowing costs are recognised as an expense in the year in which they have been incurred.
15. DEFERRED TAX
Deferred tax is recognized, subject to consideration of prudence on timing differences representing the difference between the Taxable income and Accounting income that originate in one period and are capable of reversal in one or more subsequent periods. Deferred tax assets and liabilities are measured using tax rates and the tax laws that have been enacted or substantively enacted by the Balance Sheet date.
16. IMPAIRMENT OF ASSETS
An asset is treated as impaired when the carrying cost of assets exceeds its recoverable value and impairment loss is charged to Profit and Loss account in the year in which an asset is identified as impaired. The impairment loss recognized in prior accounting periods is reversed if there has been a change in the estimate of recoverable amount.
17. PROVISIONS, CONTINGENT LIABILITIES AND CONTINGENT ASSETS
(I) Provisions
(a) Provisions for Doubtful Debts/Advances/Claims:Provision for doubtful debts/advances/claims is made where there is uncertainty of realization irrespective of the period of its dues. For outstanding over three years (except Government dues) full provision is made unless the amount is considered recoverable. Debts/advances/claims are written off when unrealisability is almost established.
(b) Others Provision is recognized when
(i) the Company has a present obligation as a result of the past event.
(ii) a probable outflow of resources is expected to settle the obligation and a reliable estimate of the amount of the obligation can be made.
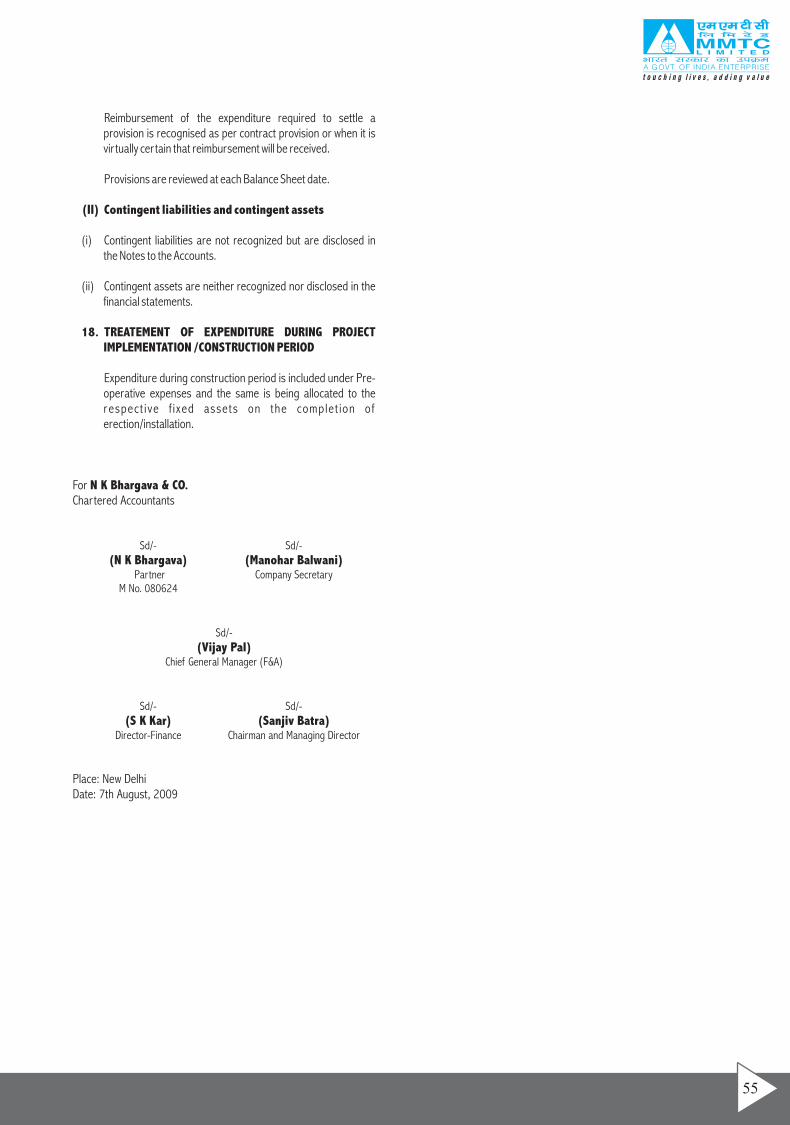
Reimbursement of the expenditure required to settle a provision is recognised as per contract provision or when it is virtually certain that reimbursement will be received.
Provisions are reviewed at each Balance Sheet date.
(II) Contingent liabilities and contingent assets
(i) Contingent liabilities are not recognized but are disclosed in the Notes to the Accounts.
(ii) Contingent assets are neither recognized nor disclosed in the financial statements.
18. TREATEMENT OF EXPENDITURE DURING PROJECT IMPLEMENTATION /CONSTRUCTION PERIOD
Expenditure during construction period is included under Pre-operative expenses and the same is being allocated to the respect ive f ixed assets on the complet ion of erection/installation.
7th August, 2009
For N K Bhargava & CO. Chartered Accountants
Sd/- Sd/-(N K Bhargava) (Manohar Balwani)
Partner Company Secretary M No. 080624
Sd/-(Vijay Pal)
Chief General Manager (F&A)
Sd/- Sd/-(S K Kar) (Sanjiv Batra)
Director-Finance Chairman and Managing Director
Place: New DelhiDate:
55
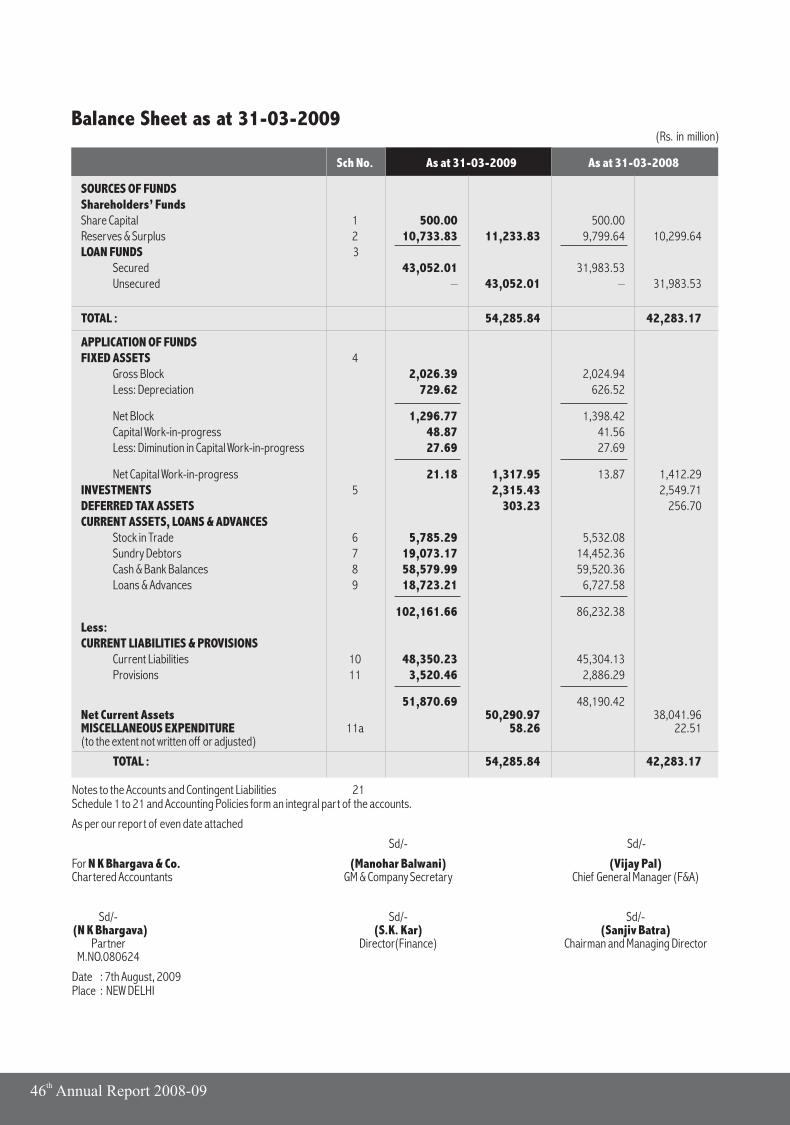
(Rs. in million)Balance Sheet as at 31-03-2009
Notes to the Accounts and Contingent Liabilities 21Schedule 1 to 21 and Accounting Policies form an integral part of the accounts.
As per our report of even date attached
Sd/- Sd/-
For N K Bhargava & Co. (Manohar Balwani) (Vijay Pal)Chartered Accountants Company Secretary Chief General Manager (F&A)
Sd/- Sd/- Sd/-(N K Bhargava) (S.K. Kar) (Sanjiv Batra)
Partner Director(Finance) Chairman and Managing DirectorM.NO.080624
Date :Place : NEW DELHI
GM &
7th August, 2009
SOURCES OF FUNDSShareholders’ Funds
Sch No. As at 31-03-2009 As at 31-03-2008
Share Capital 1 500.00 500.00 Reserves & Surplus 2 10,733.83 11,233.83 9,799.64 10,299.64 LOAN FUNDS 3
Secured 43,052.01 31,983.53Unsecured – 43,052.01 – 31,983.53
TOTAL : 54,285.84 42,283.17
APPLICATION OF FUNDS FIXED ASSETS 4
Gross Block 2,026.39 2,024.94Less: Depreciation 729.62 626.52
Net Block 1,296.77 1,398.42Capital Work-in-progress 48.87 41.56 Less: Diminution in Capital Work-in-progress 27.69 27.69
Net Capital Work-in-progress 21.18 1,317.95 13.87 1,412.29INVESTMENTS 5 2,315.43 2,549.71DEFERRED TAX ASSETS 303.23 256.70CURRENT ASSETS, LOANS & ADVANCES
Stock in Trade 6 5,785.29 5,532.08Sundry Debtors 7 19,073.17 14,452.36Cash & Bank Balances 8 58,579.99 59,520.36Loans & Advances 9 18,723.21 6,727.58
102,161.66 86,232.38Less:CURRENT LIABILITIES & PROVISIONS
Current Liabilities 10 48,350.23 45,304.13Provisions 11 3,520.46 2,886.29
51,870.69 48,190.42Net Current Assets 50,290.97 38,041.96MISCELLANEOUS EXPENDITURE 11a 58.26 22.51(to the extent not written off or adjusted)
TOTAL : 54,285.84 42,283.17
th46 Annual Report 2008-09
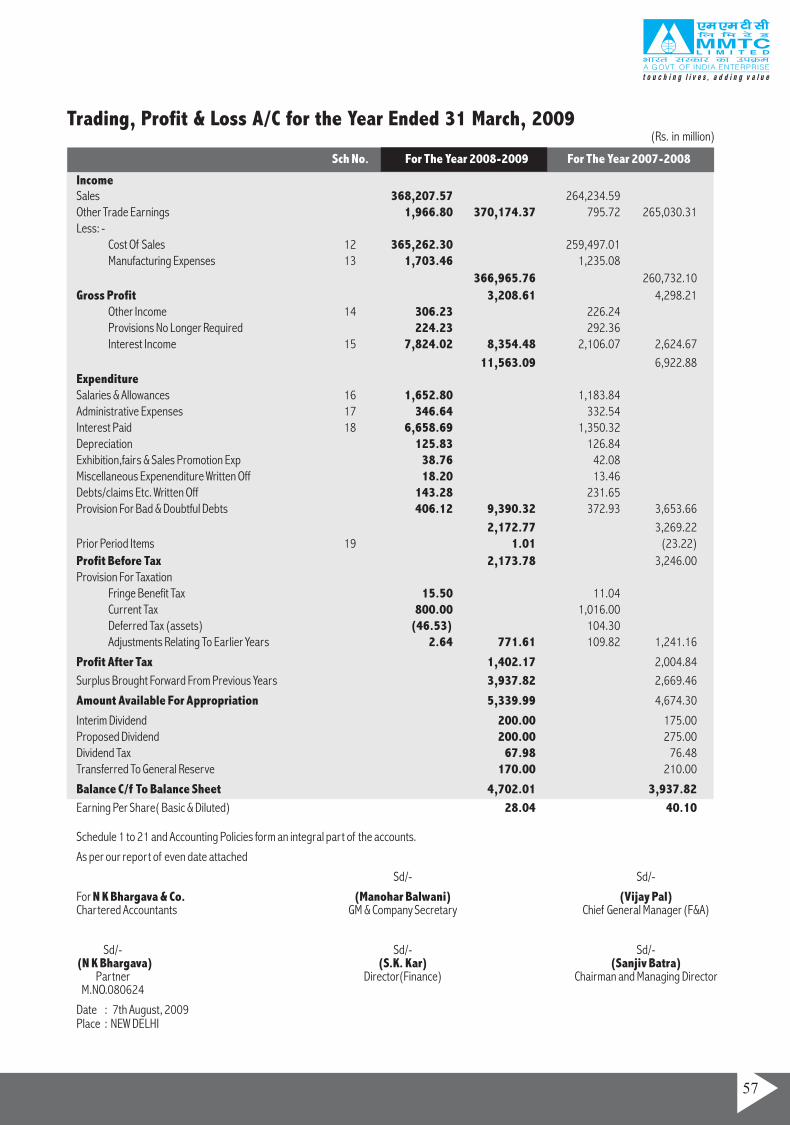
Trading, Profit & Loss A/C for the Year Ended 31 March, 2009
Schedule 1 to 21 and Accounting Policies form an integral part of the accounts.
As per our report of even date attached
Sd/- Sd/-
For N K Bhargava & Co. (Manohar Balwani) (Vijay Pal)Chartered Accountants Company Secretary Chief General Manager (F&A)
Sd/- Sd/- Sd/-(N K Bhargava) (S.K. Kar) (Sanjiv Batra)
Partner Director(Finance) Chairman and Managing DirectorM.NO.080624
Date :Place : NEW DELHI
GM &
7th August, 2009
(Rs. in million)
IncomeSales
Sch No. For The Year 2008-2009 For The Year 2007-2008
368,207.57 264,234.59 Other Trade Earnings 1,966.80 370,174.37 795.72 265,030.31Less: -
Cost Of Sales 12 365,262.30 259,497.01Manufacturing Expenses 13 1,703.46 1,235.08
366,965.76 260,732.10
Gross Profit 3,208.61 4,298.21Other Income 14 306.23 226.24 Provisions No Longer Required 224.23 292.36 Interest Income 15 7,824.02 8,354.48 2,106.07 2,624.67
11,563.09 6,922.88ExpenditureSalaries & Allowances 16 1,652.80 1,183.84 Administrative Expenses 17 346.64 332.54 Interest Paid 18 6,658.69 1,350.32 Depreciation 125.83 126.84Exhibition,fairs & Sales Promotion Exp 38.76 42.08 Miscellaneous Expenenditure Written Off 18.20 13.46 Debts/claims Etc. Written Off 143.28 231.65 Provision For Bad & Doubtful Debts 406.12 9,390.32 372.93 3,653.66
2,172.77 3,269.22Prior Period Items 19 1.01 (23.22)
Profit Before Tax 2,173.78 3,246.00Provision For Taxation
Fringe Benefit Tax 15.50 11.04 Current Tax 800.00 1,016.00Deferred Tax (assets) (46.53) 104.30Adjustments Relating To Earlier Years 2.64 771.61 109.82 1,241.16
Profit After Tax 1,402.17 2,004.84
Surplus Brought Forward From Previous Years 3,937.82 2,669.46
Amount Available For Appropriation 5,339.99 4,674.30
Interim Dividend 200.00 175.00Proposed Dividend 200.00 275.00 Dividend Tax 67.98 76.48Transferred To General Reserve 170.00 210.00
Balance C/f To Balance Sheet 4,702.01 3,937.82
Earning Per Share( Basic & Diluted) 28.04 40.10
57
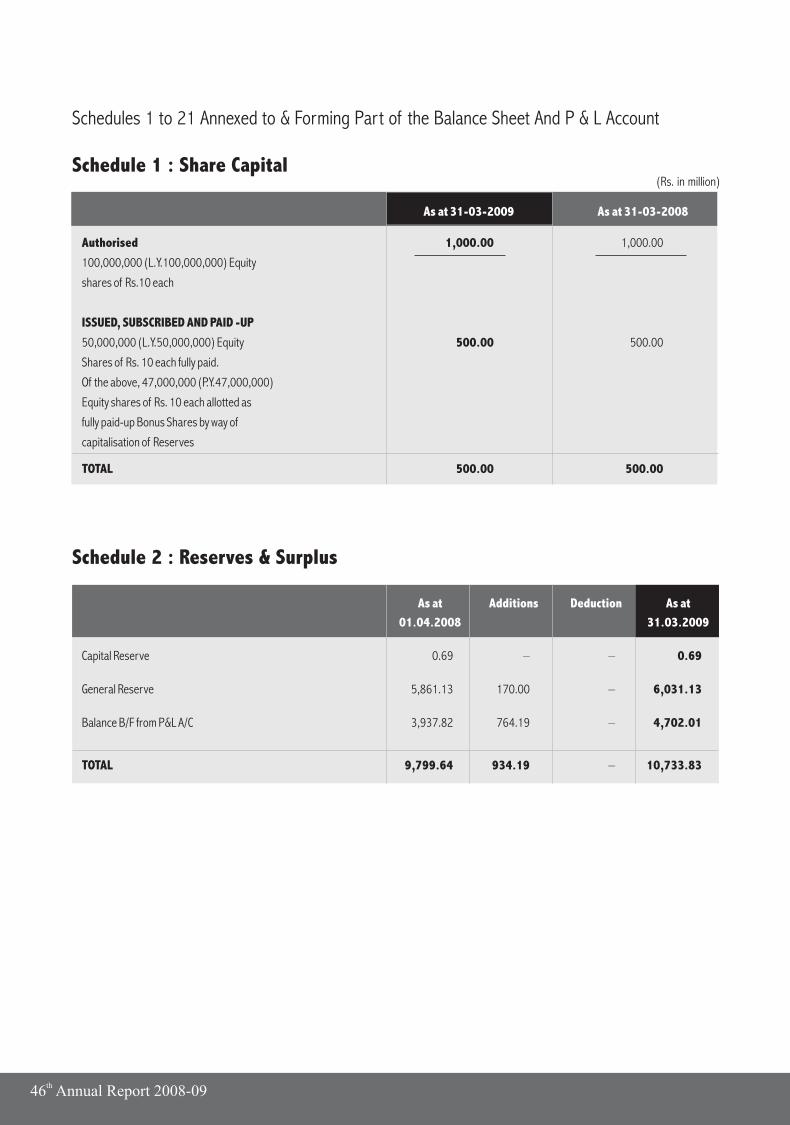
(Rs. in million)Schedule 1 : Share Capital
Schedule 2 : Reserves & Surplus
Authorised
As at 31-03-2009 As at 31-03-2008
1,000.00 1,000.00
100,000,000 (L.Y.100,000,000) Equity
shares of Rs.10 each
ISSUED, SUBSCRIBED AND PAID -UP
50,000,000 (L.Y.50,000,000) Equity 500.00 500.00
Shares of Rs. 10 each fully paid.
Of the above, 47,000,000 (P.Y.47,000,000)
Equity shares of Rs. 10 each allotted as
fully paid-up Bonus Shares by way of
capitalisation of Reserves
TOTAL 500.00 500.00
Capital Reserve 0.69 – – 0.69
–
–
–
As at Additions Deduction As at
01.04.2008 31.03.2009
General Reserve 5,861.13 170.00 6,031.13
Balance B/F from P&L A/C 3,937.82 764.19 4,702.01
TOTAL 9,799.64 934.19 10,733.83
Schedules 1 to 21 Annexed to & Forming Part of the Balance Sheet And P & L Account
th46 Annual Report 2008-09
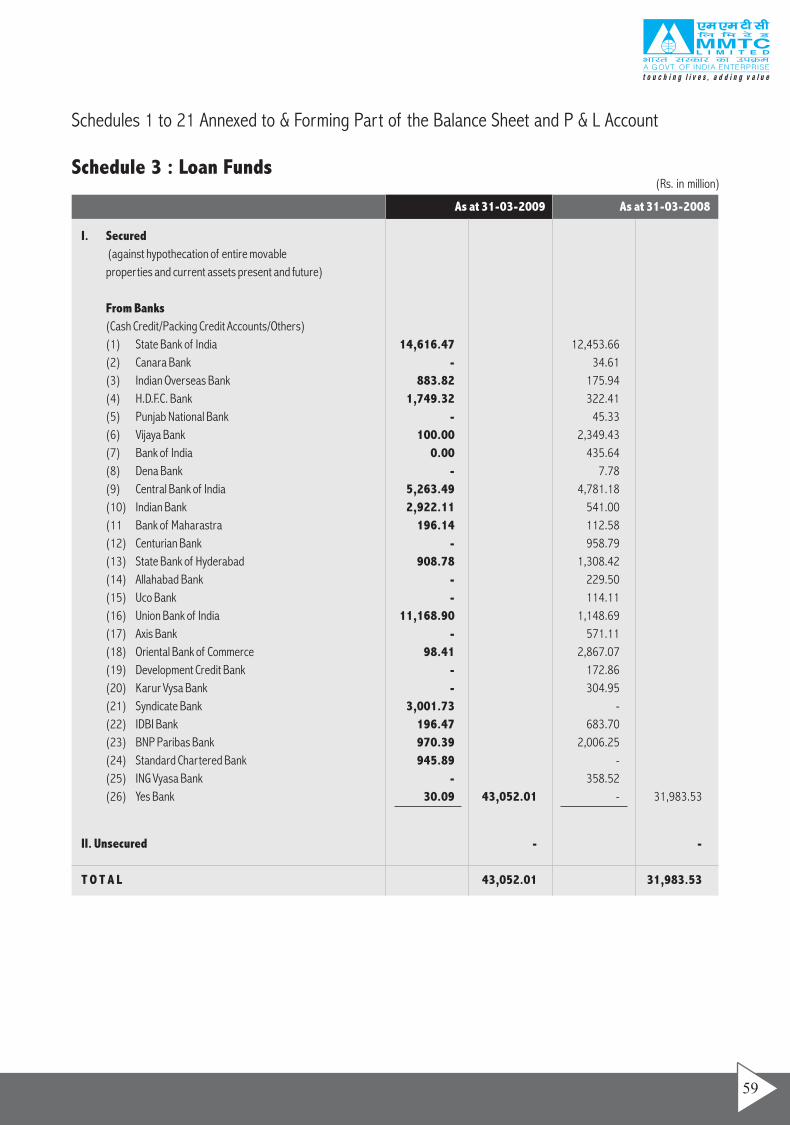
Schedules 1 to 21 Annexed to & Forming Part of the Balance Sheet and P & L Account
Schedule 3 : Loan Funds(Rs. in million)
I. Secured
As at 31-03-2009 As at 31-03-2008
(against hypothecation of entire movable
properties and current assets present and future)
From Banks
(Cash Credit/Packing Credit Accounts/Others)
(1) State Bank of India 14,616.47 12,453.66
(2) Canara Bank - 34.61
(3) Indian Overseas Bank 883.82 175.94
(4) H.D.F.C. Bank 1,749.32 322.41
(5) Punjab National Bank - 45.33
(6) Vijaya Bank 100.00 2,349.43
(7) Bank of India 0.00 435.64
(8) Dena Bank - 7.78
(9) Central Bank of India 5,263.49 4,781.18
(10) Indian Bank 2,922.11 541.00
(11 Bank of Maharastra 196.14 112.58
(12) Centurian Bank - 958.79
(13) State Bank of Hyderabad 908.78 1,308.42
(14) Allahabad Bank - 229.50
(15) Uco Bank - 114.11
(16) Union Bank of India 11,168.90 1,148.69
(17) Axis Bank - 571.11
(18) Oriental Bank of Commerce 98.41 2,867.07
(19) Development Credit Bank - 172.86
(20) Karur Vysa Bank - 304.95
(21) Syndicate Bank 3,001.73 -
(22) IDBI Bank 196.47 683.70
(23) BNP Paribas Bank 970.39 2,006.25
(24) Standard Chartered Bank 945.89 -
(25) ING Vyasa Bank - 358.52
(26) Yes Bank 30.09 43,052.01 - 31,983.53
II. Unsecured - -
T O T A L 43,052.01 31,983.53
59
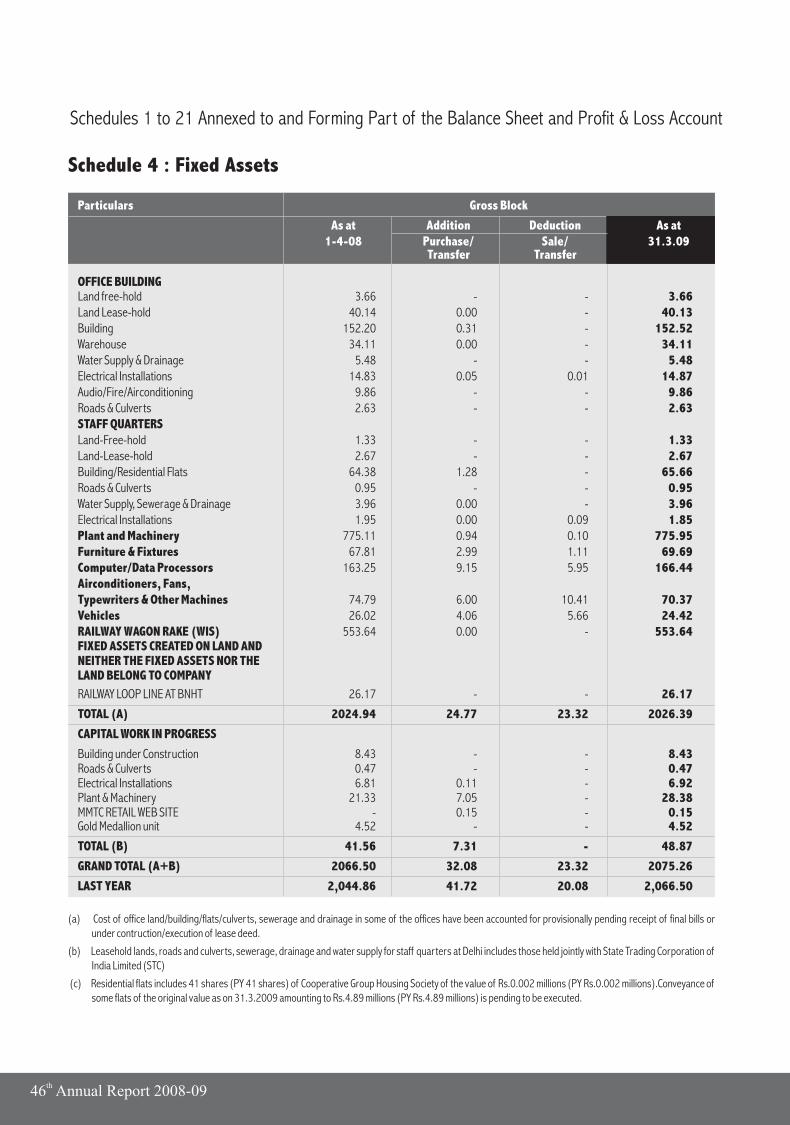
Schedule 4 : Fixed Assets
(a) Cost of office land/building/flats/culverts, sewerage and drainage in some of the offices have been accounted for provisionally pending receipt of final bills or under contruction/execution of lease deed.
(b) Leasehold lands, roads and culverts, sewerage, drainage and water supply for staff quarters at Delhi includes those held jointly with State Trading Corporation of India Limited (STC)
(c) Residential flats includes 41 shares (PY 41 shares) of Cooperative Group Housing Society of the value of Rs.0.002 millions (PY Rs.0.002 millions).Conveyance of some flats of the original value as on 31.3.2009 amounting to Rs.4.89 millions (PY Rs.4.89 millions) is pending to be executed.
Particulars Gross Block
As at Addition Deduction As at1-4-08 Purchase/ Sale/ 31.3.09
Transfer Transfer
OFFICE BUILDINGLand free-hold 3.66 - - 3.66Land Lease-hold 40.14 0.00 - 40.13Building 152.20 0.31 - 152.52Warehouse 34.11 0.00 - 34.11Water Supply & Drainage 5.48 - - 5.48Electrical Installations 14.83 0.05 0.01 14.87Audio/Fire/Airconditioning 9.86 - - 9.86Roads & Culverts 2.63 - - 2.63STAFF QUARTERSLand-Free-hold 1.33 - - 1.33Land-Lease-hold 2.67 - - 2.67Building/Residential Flats 64.38 1.28 - 65.66Roads & Culverts 0.95 - - 0.95Water Supply, Sewerage & Drainage 3.96 0.00 - 3.96Electrical Installations 1.95 0.00 0.09 1.85Plant and Machinery 775.11 0.94 0.10 775.95Furniture & Fixtures 67.81 2.99 1.11 69.69Computer/Data Processors 163.25 9.15 5.95 166.44Airconditioners, Fans,Typewriters & Other Machines 74.79 6.00 10.41 70.37Vehicles 26.02 4.06 5.66 24.42RAILWAY WAGON RAKE (WIS) 553.64 0.00 - 553.64FIXED ASSETS CREATED ON LAND AND NEITHER THE FIXED ASSETS NOR THE LAND BELONG TO COMPANY
RAILWAY LOOP LINE AT BNHT 26.17 - - 26.17
TOTAL (A) 2024.94 24.77 23.32 2026.39
CAPITAL WORK IN PROGRESS
Building under Construction 8.43 - - 8.43 Roads & Culverts 0.47 - - 0.47Electrical Installations 6.81 0.11 - 6.92Plant & Machinery 21.33 7.05 - 28.38MMTC RETAIL WEB SITE - 0.15 - 0.15Gold Medallion unit 4.52 - - 4.52
TOTAL (B) 41.56 7.31 - 48.87
GRAND TOTAL (A+B) 2066.50 32.08 23.32 2075.26
LAST YEAR 2,044.86 41.72 20.08 2,066.50
Schedules 1 to 21 Annexed to and Forming Part of the Balance Sheet and Profit & Loss Account
th46 Annual Report 2008-09
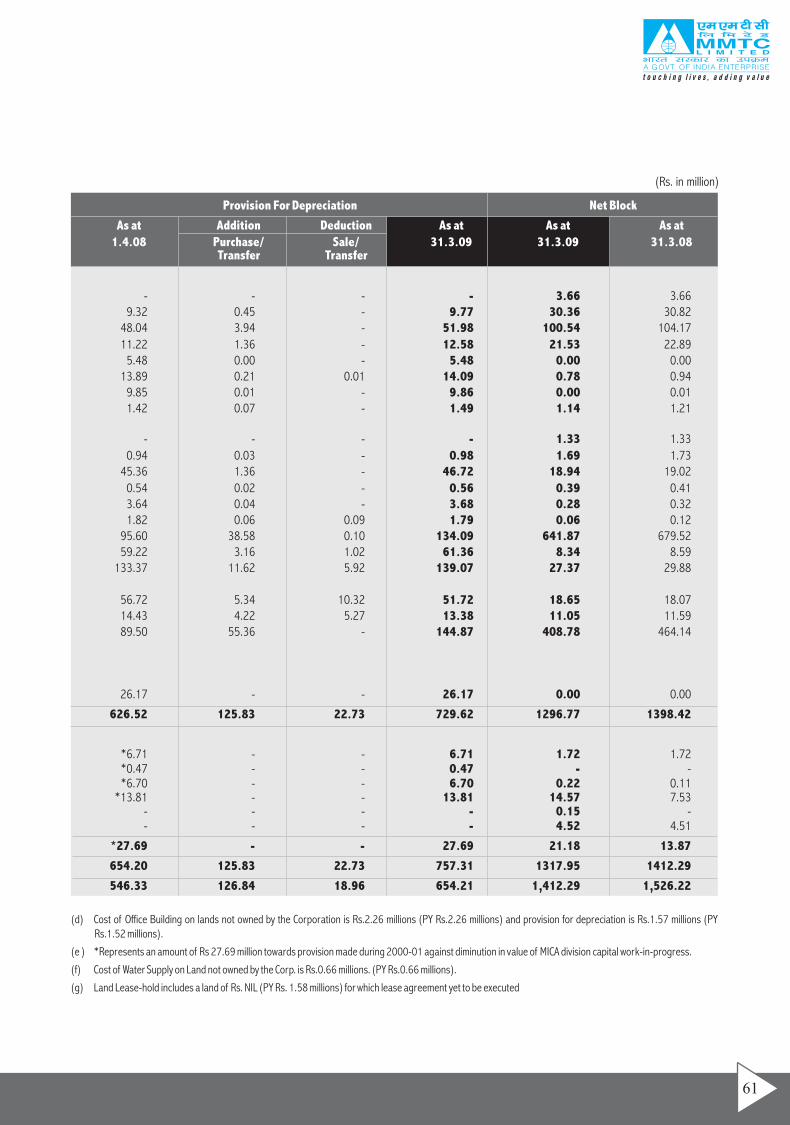
(Rs. in million)
(d) Cost of Office Building on lands not owned by the Corporation is Rs.2.26 millions (PY Rs.2.26 millions) and provision for depreciation is Rs.1.57 millions (PY Rs.1.52 millions).
(e ) *Represents an amount of Rs 27.69 million towards provision made during 2000-01 against diminution in value of MICA division capital work-in-progress.
(f) Cost of Water Supply on Land not owned by the Corp. is Rs.0.66 millions. (PY Rs.0.66 millions).
(g) Land Lease-hold includes a land of Rs. NIL (PY Rs. 1.58 millions) for which lease agreement yet to be executed
Provision For Depreciation Net Block
As at Addition Deduction As at As at As at1.4.08 Purchase/ Sale/ 31.3.09 31.3.09 31.3.08
Transfer Transfer
- - - - 3.66 3.66 9.32 0.45 - 9.77 30.36 30.82
48.04 3.94 - 51.98 100.54 104.1711.22 1.36 - 12.58 21.53 22.89
5.48 0.00 - 5.48 0.00 0.0013.89 0.21 0.01 14.09 0.78 0.94
9.85 0.01 - 9.86 0.00 0.011.42 0.07 - 1.49 1.14 1.21
- - - - 1.33 1.330.94 0.03 - 0.98 1.69 1.73
45.36 1.36 - 46.72 18.94 19.020.54 0.02 - 0.56 0.39 0.413.64 0.04 - 3.68 0.28 0.321.82 0.06 0.09 1.79 0.06 0.12
95.60 38.58 0.10 134.09 641.87 679.5259.22 3.16 1.02 61.36 8.34 8.59
133.37 11.62 5.92 139.07 27.37 29.88
56.72 5.34 10.32 51.72 18.65 18.0714.43 4.22 5.27 13.38 11.05 11.5989.50 55.36 - 144.87 408.78 464.14
26.17 - - 26.17 0.00 0.00
626.52 125.83 22.73 729.62 1296.77 1398.42
*6.71 - - 6.71 1.72 1.72*0.47 - - 0.47 - -*6.70 - - 6.70 0.22 0.11
*13.81 - - 13.81 14.57 7.53- - - - 0.15 -- - - - 4.52 4.51
*27.69 - - 27.69 21.18 13.87
654.20 125.83 22.73 757.31 1317.95 1412.29
546.33 126.84 18.96 654.21 1,412.29 1,526.22
61
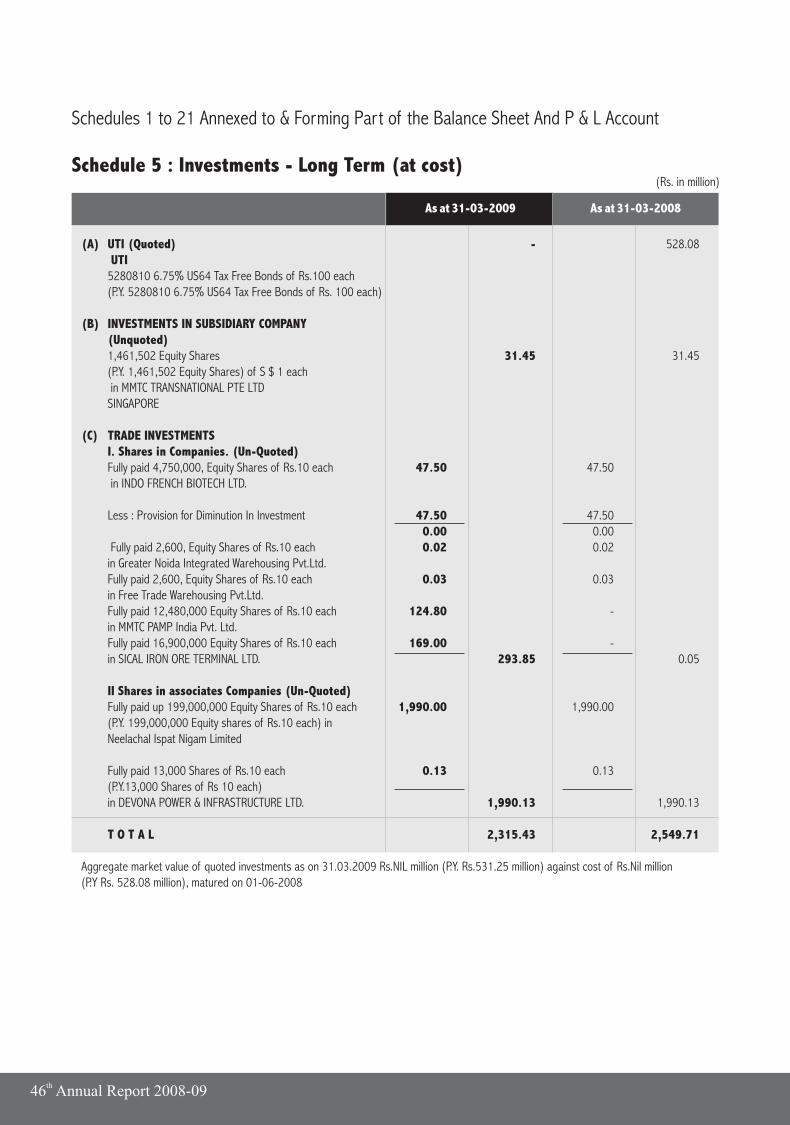
Schedule 5 : Investments - Long Term (at cost)(Rs. in million)
(A) UTI (Quoted)
As at 31-03-2009 As at 31-03-2008
- 528.08 UTI 5280810 6.75% US64 Tax Free Bonds of Rs.100 each(P.Y. 5280810 6.75% US64 Tax Free Bonds of Rs. 100 each)
(B) INVESTMENTS IN SUBSIDIARY COMPANY(Unquoted)1,461,502 Equity Shares 31.45 31.45(P.Y. 1,461,502 Equity Shares) of S $ 1 each in MMTC TRANSNATIONAL PTE LTD SINGAPORE
(C) TRADE INVESTMENTSI. Shares in Companies. (Un-Quoted)Fully paid 4,750,000, Equity Shares of Rs.10 each 47.50 47.50 in INDO FRENCH BIOTECH LTD.
Less : Provision for Diminution In Investment 47.50 47.50 0.00 0.00
Fully paid 2,600, Equity Shares of Rs.10 each 0.02 0.02in Greater Noida Integrated Warehousing Pvt.Ltd.Fully paid 2,600, Equity Shares of Rs.10 each 0.03 0.03in Free Trade Warehousing Pvt.Ltd.Fully paid 12,480,000 Equity Shares of Rs.10 each 124.80 -in MMTC PAMP India Pvt. Ltd.Fully paid 16,900,000 Equity Shares of Rs.10 each 169.00 - in SICAL IRON ORE TERMINAL LTD. 293.85 0.05
II Shares in associates Companies (Un-Quoted)Fully paid up 199,000,000 Equity Shares of Rs.10 each 1,990.00 1,990.00 (P.Y. 199,000,000 Equity shares of Rs.10 each) in Neelachal Ispat Nigam Limited
Fully paid 13,000 Shares of Rs.10 each 0.13 0.13 (P.Y.13,000 Shares of Rs 10 each)in DEVONA POWER & INFRASTRUCTURE LTD. 1,990.13 1,990.13
T O T A L 2,315.43 2,549.71
Aggregate market value of quoted investments as on 31.03.2009 Rs.NIL million (P.Y. Rs.531.25 million) against cost of Rs.Nil million(P.Y Rs. 528.08 million), matured on 01-06-2008
Schedules 1 to 21 Annexed to & Forming Part of the Balance Sheet And P & L Account
th46 Annual Report 2008-09
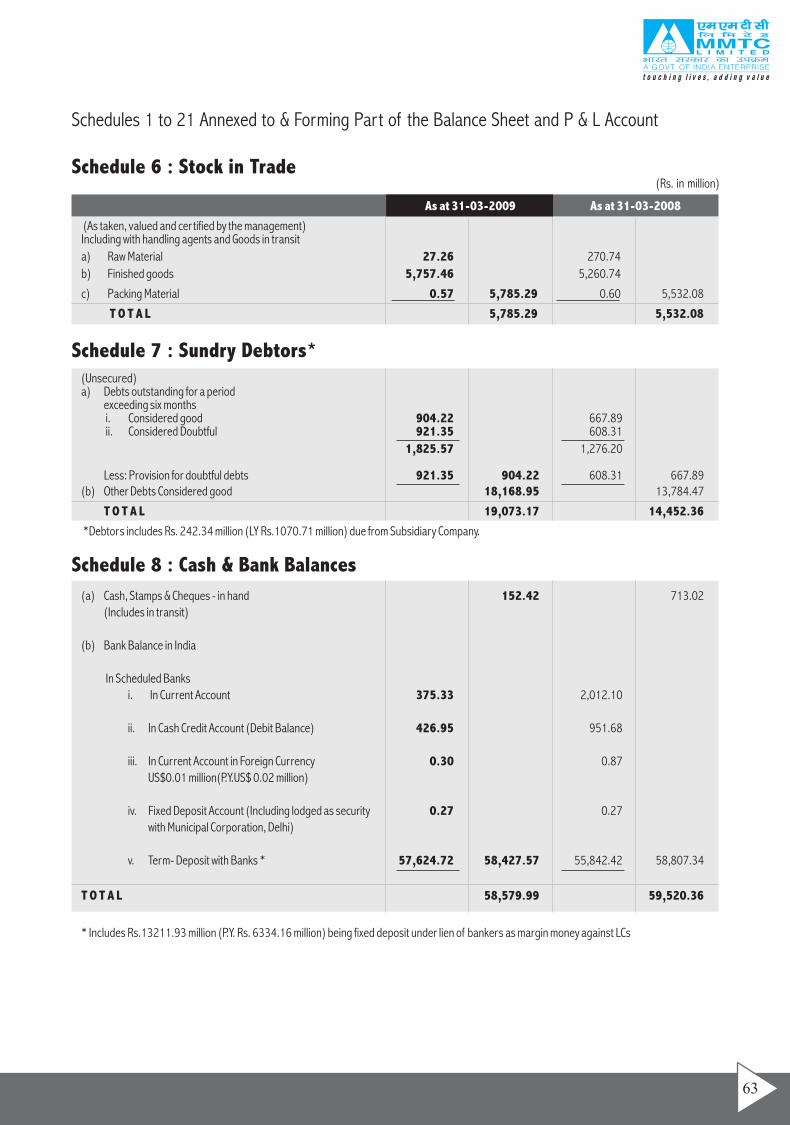
(Rs. in million)Schedule 6 : Stock in Trade
Schedule 7 : Sundry Debtors*(Unsecured)a) Debts outstanding for a period
exceeding six months i. Considered good 904.22 667.89 ii. Considered Doubtful 921.35 608.31
1,825.57 1,276.20
Less: Provision for doubtful debts 921.35 904.22 608.31 667.89(b) Other Debts Considered good 18,168.95 13,784.47
T O T A L 19,073.17 14,452.36
*Debtors includes Rs. 242.34 million (LY Rs.1070.71 million) due from Subsidiary Company.
Schedule 8 : Cash & Bank Balances
(a) Cash, Stamps & Cheques - in hand 152.42 713.02(Includes in transit)
(b) Bank Balance in India
In Scheduled Banksi. In Current Account 375.33 2,012.10
ii. In Cash Credit Account (Debit Balance) 426.95 951.68
iii. In Current Account in Foreign Currency 0.30 0.87US$0.01 million(P.Y.US$ 0.02 million)
iv. Fixed Deposit Account (Including lodged as security 0.27 0.27with Municipal Corporation, Delhi)
v. Term- Deposit with Banks * 57,624.72 58,427.57 55,842.42 58,807.34
T O T A L 58,579.99 59,520.36
* Includes Rs.13211.93 million (P.Y. Rs. 6334.16 million) being fixed deposit under lien of bankers as margin money against LCs
As at 31-03-2009 As at 31-03-2008
(As taken, valued and certified by the management)Including with handling agents and Goods in transit
a) Raw Material 27.26 270.74
b) Finished goods 5,757.46 5,260.74
c) Packing Material 0.57 5,785.29 0.60 5,532.08
T O T A L 5,785.29 5,532.08
Schedules 1 to 21 Annexed to & Forming Part of the Balance Sheet and P & L Account
63
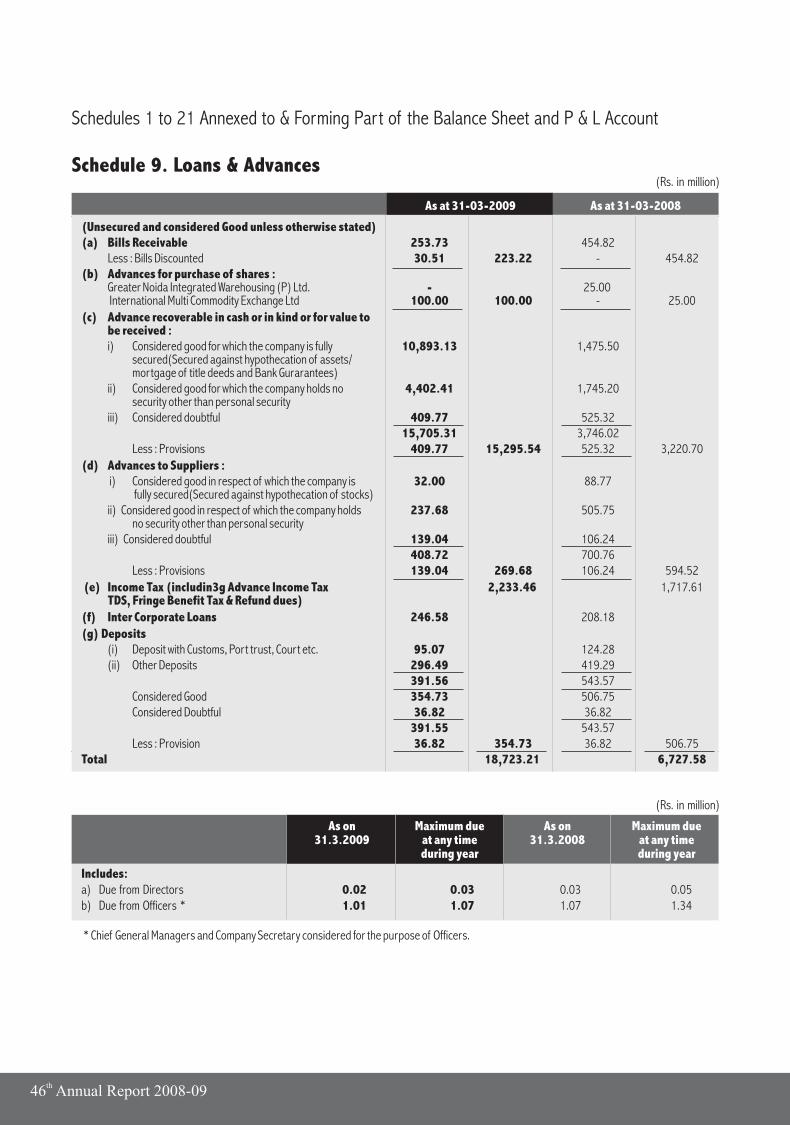
(Rs. in million)Schedule 9. Loans & Advances
(Rs. in million)
As at 31-03-2009 As at 31-03-2008
(Unsecured and considered Good unless otherwise stated) (a) Bills Receivable 253.73 454.82
Less : Bills Discounted 30.51 223.22 - 454.82(b) Advances for purchase of shares :
Greater Noida Integrated Warehousing (P) Ltd. - 25.00 International Multi Commodity Exchange Ltd 100.00 100.00 - 25.00
(c) Advance recoverable in cash or in kind or for value to be received : i) Considered good for which the company is fully 10,893.13 1,475.50
secured(Secured against hypothecation of assets/mortgage of title deeds and Bank Gurarantees)
ii) Considered good for which the company holds no 4,402.41 1,745.20security other than personal security
iii) Considered doubtful 409.77 525.3215,705.31 3,746.02
Less : Provisions 409.77 15,295.54 525.32 3,220.70
(d) Advances to Suppliers : i) Considered good in respect of which the company is 32.00 88.77
fully secured(Secured against hypothecation of stocks)ii) Considered good in respect of which the company holds 237.68 505.75
no security other than personal security iii) Considered doubtful 139.04 106.24
408.72 700.76 Less : Provisions 139.04 269.68 106.24 594.52
(e) Income Tax (includin3g Advance Income Tax 2,233.46 1,717.61TDS, Fringe Benefit Tax & Refund dues)
(f) Inter Corporate Loans 246.58 208.18
(g) Deposits (i) Deposit with Customs, Port trust, Court etc. 95.07 124.28 (ii) Other Deposits 296.49 419.29
391.56 543.57 Considered Good 354.73 506.75 Considered Doubtful 36.82 36.82
391.55 543.57Less : Provision 36.82 354.73 36.82 506.75
Total 18,723.21 6,727.58
Includes:a) Due from Directors 0.02 0.03 0.03 0.05b) Due from Officers * 1.01 1.07 1.07 1.34 * Chief General Managers and Company Secretary considered for the purpose of Officers.
As on Maximum due As on Maximum due31.3.2009 at any time 31.3.2008 at any time
during year during year
Schedules 1 to 21 Annexed to & Forming Part of the Balance Sheet and P & L Account
th46 Annual Report 2008-09
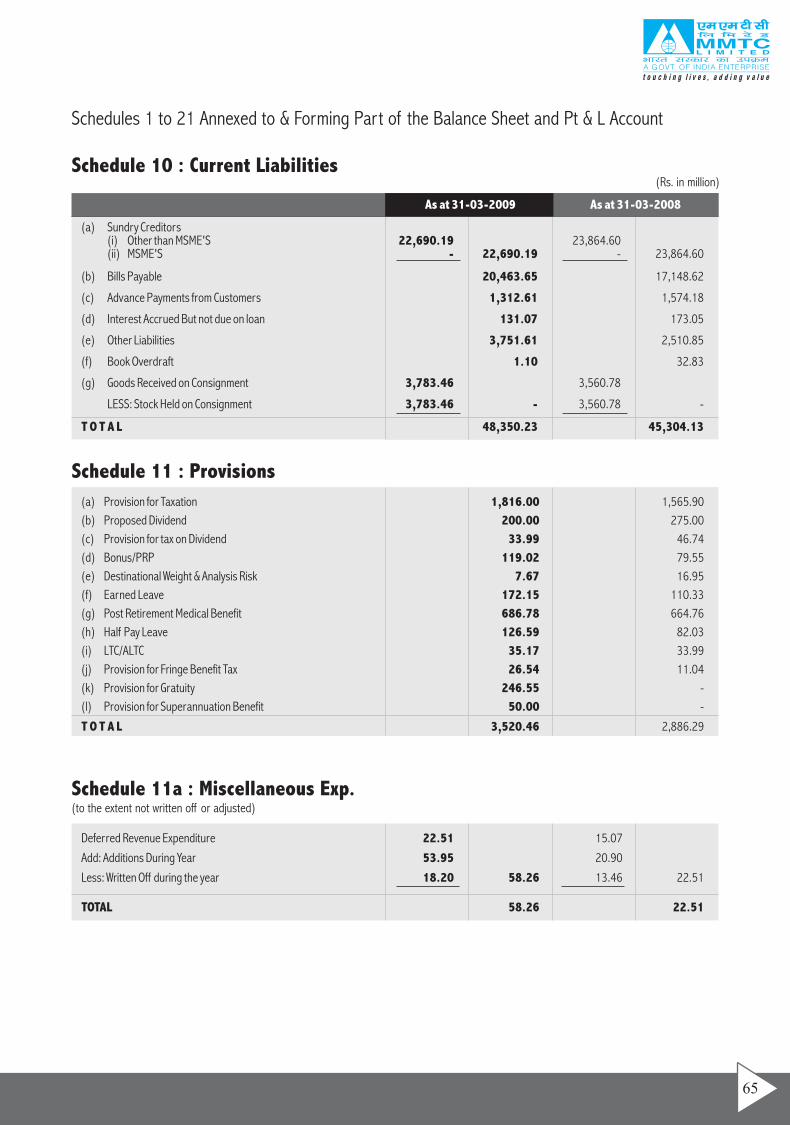
Schedules 1 to 21 Annexed to & Forming Part of the Balance Sheet and Pt & L Account
Schedule 11 : Provisions
Deferred Revenue Expenditure
Add: Additions During Year
Less: Written Off during the year
TOTAL
22.51 15.07
53.95 20.90
18.20 58.26 13.46 22.51
58.26 22.51
Schedule 11a : Miscellaneous Exp.(to the extent not written off or adjusted)
(a) Provision for Taxation 1,816.00 1,565.90
(b) Proposed Dividend 200.00 275.00
(c) Provision for tax on Dividend 33.99 46.74
(d) Bonus/PRP 119.02 79.55
(e) Destinational Weight & Analysis Risk 7.67 16.95
(f) Earned Leave 172.15 110.33
(g) Post Retirement Medical Benefit 686.78 664.76
(h) Half Pay Leave 126.59 82.03
(i) LTC/ALTC 35.17 33.99
(j) Provision for Fringe Benefit Tax 26.54 11.04
(k) Provision for Gratuity 246.55 -
(l) Provision for Superannuation Benefit 50.00 -
T O T A L 3,520.46 2,886.29
Schedule 10 : Current Liabilities(Rs. in million)
(a)
As at 31-03-2009 As at 31-03-2008
Sundry Creditors (i) Other than MSME'S 22,690.19 23,864.60 (ii) MSME'S - 22,690.19 - 23,864.60
(b) Bills Payable 20,463.65 17,148.62
(c) Advance Payments from Customers 1,312.61 1,574.18
(d) Interest Accrued But not due on loan 131.07 173.05
(e) Other Liabilities 3,751.61 2,510.85
(f) Book Overdraft 1.10 32.83
(g) Goods Received on Consignment 3,783.46 3,560.78
LESS: Stock Held on Consignment 3,783.46 - 3,560.78 -
T O T A L 48,350.23 45,304.13
65
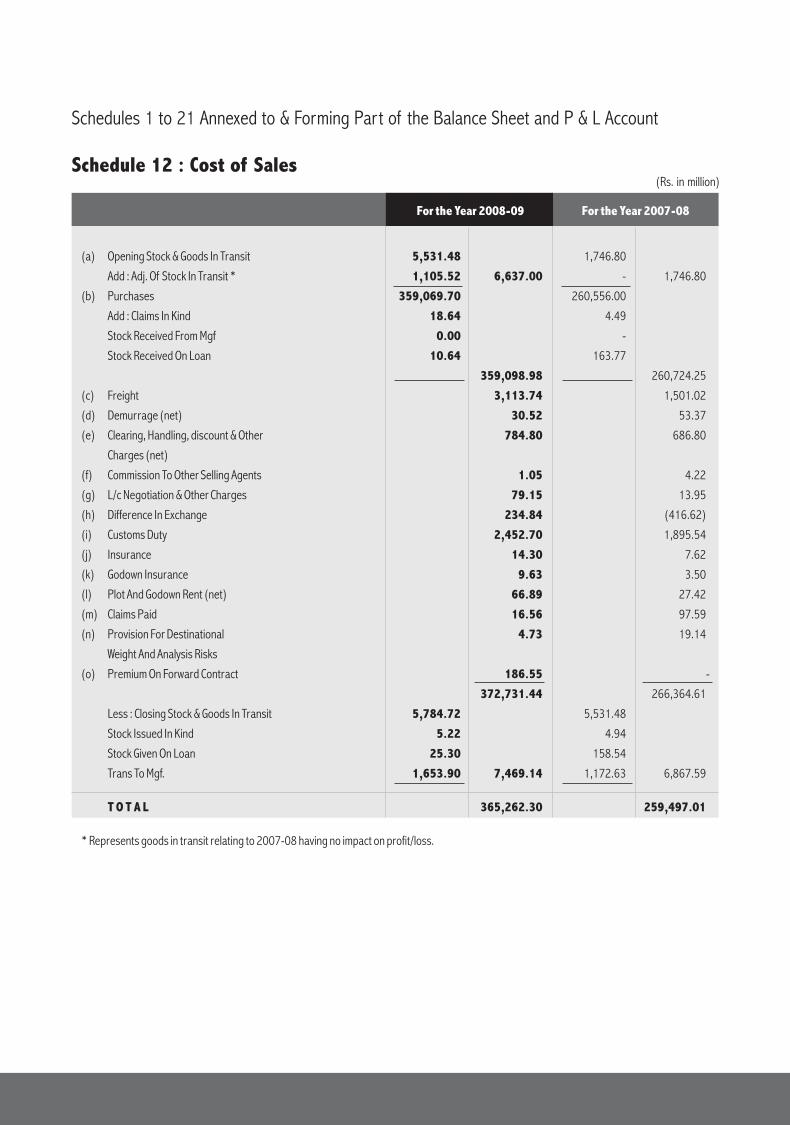
(Rs. in million)Schedule 12 : Cost of Sales
Schedules 1 to 21 Annexed to & Forming Part of the Balance Sheet and P & L Account
(a)
For the Year 2008-09 For the Year 2007-08
Opening Stock & Goods In Transit 5,531.48 1,746.80
Add : Adj. Of Stock In Transit * 1,105.52 6,637.00 - 1,746.80
(b) Purchases 359,069.70 260,556.00
Add : Claims In Kind 18.64 4.49
Stock Received From Mgf 0.00 -
Stock Received On Loan 10.64 163.77
359,098.98 260,724.25
(c) Freight 3,113.74 1,501.02
(d) Demurrage (net) 30.52 53.37
(e) Clearing, Handling, discount & Other 784.80 686.80
Charges (net)
(f) Commission To Other Selling Agents 1.05 4.22
(g) L/c Negotiation & Other Charges 79.15 13.95
(h) Difference In Exchange 234.84 (416.62)
(i) Customs Duty 2,452.70 1,895.54
(j) Insurance 14.30 7.62
(k) Godown Insurance 9.63 3.50
(l) Plot And Godown Rent (net) 66.89 27.42
(m) Claims Paid 16.56 97.59
(n) Provision For Destinational 4.73 19.14
Weight And Analysis Risks
(o) Premium On Forward Contract 186.55 -
372,731.44 266,364.61
Less : Closing Stock & Goods In Transit 5,784.72 5,531.48
Stock Issued In Kind 5.22 4.94
Stock Given On Loan 25.30 158.54
Trans To Mgf. 1,653.90 7,469.14 1,172.63 6,867.59
T O T A L 365,262.30 259,497.01
* Represents goods in transit relating to 2007-08 having no impact on profit/loss.
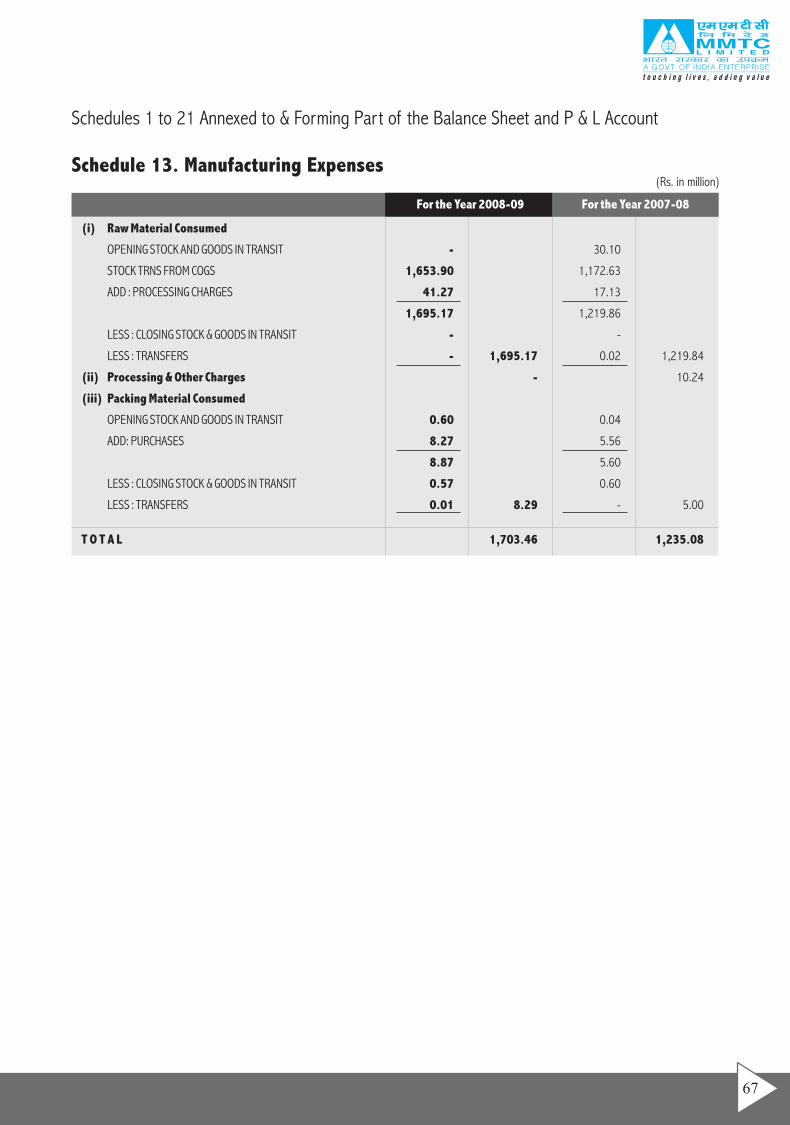
Schedules 1 to 21 Annexed to & Forming Part of the Balance Sheet and P & L Account
(Rs. in million)Schedule 13. Manufacturing Expenses
(i) Raw Material Consumed
OPENING STOCK AND GOODS IN TRANSIT - 30.10
STOCK TRNS FROM COGS 1,653.90 1,172.63
ADD : PROCESSING CHARGES 41.27 17.13
1,695.17 1,219.86
LESS : CLOSING STOCK & GOODS IN TRANSIT - -
LESS : TRANSFERS - 1,695.17 0.02 1,219.84
(ii) Processing & Other Charges - 10.24
(iii) Packing Material Consumed
OPENING STOCK AND GOODS IN TRANSIT 0.60 0.04
ADD: PURCHASES 8.27 5.56
8.87 5.60
LESS : CLOSING STOCK & GOODS IN TRANSIT 0.57 0.60
LESS : TRANSFERS 0.01 8.29 - 5.00
T O T A L 1,703.46 1,235.08
For the Year 2008-09 For the Year 2007-08
67
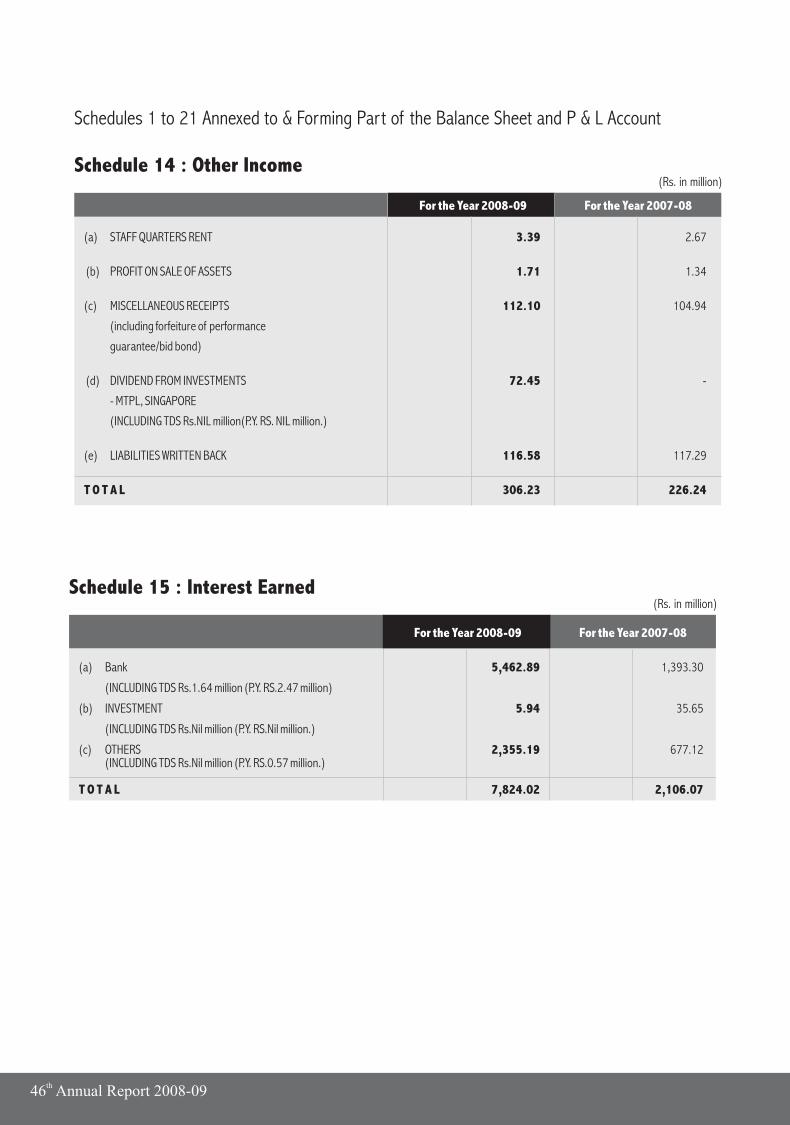
Schedules 1 to 21 Annexed to & Forming Part of the Balance Sheet and P & L Account
(Rs. in million)Schedule 14 : Other Income
(a) STAFF QUARTERS RENT 3.39 2.67
(b) PROFIT ON SALE OF ASSETS 1.71 1.34
(c) MISCELLANEOUS RECEIPTS 112.10 104.94
(including forfeiture of performance
guarantee/bid bond)
(d) DIVIDEND FROM INVESTMENTS 72.45 -
- MTPL, SINGAPORE
(INCLUDING TDS Rs.NIL million(P.Y. RS. NIL million.)
(e) LIABILITIES WRITTEN BACK 116.58 117.29
T O T A L 306.23 226.24
For the Year 2008-09 For the Year 2007-08
Schedule 15 : Interest Earned(Rs. in million)
(a) Bank
For the Year 2008-09 For the Year 2007-08
5,462.89 1,393.30
(INCLUDING TDS Rs.1.64 million (P.Y. RS.2.47 million)
(b) INVESTMENT 5.94 35.65
(INCLUDING TDS Rs.Nil million (P.Y. RS.Nil million.)
(c) OTHERS 2,355.19 677.12(INCLUDING TDS Rs.Nil million (P.Y. RS.0.57 million.)
T O T A L 7,824.02 2,106.07
th46 Annual Report 2008-09
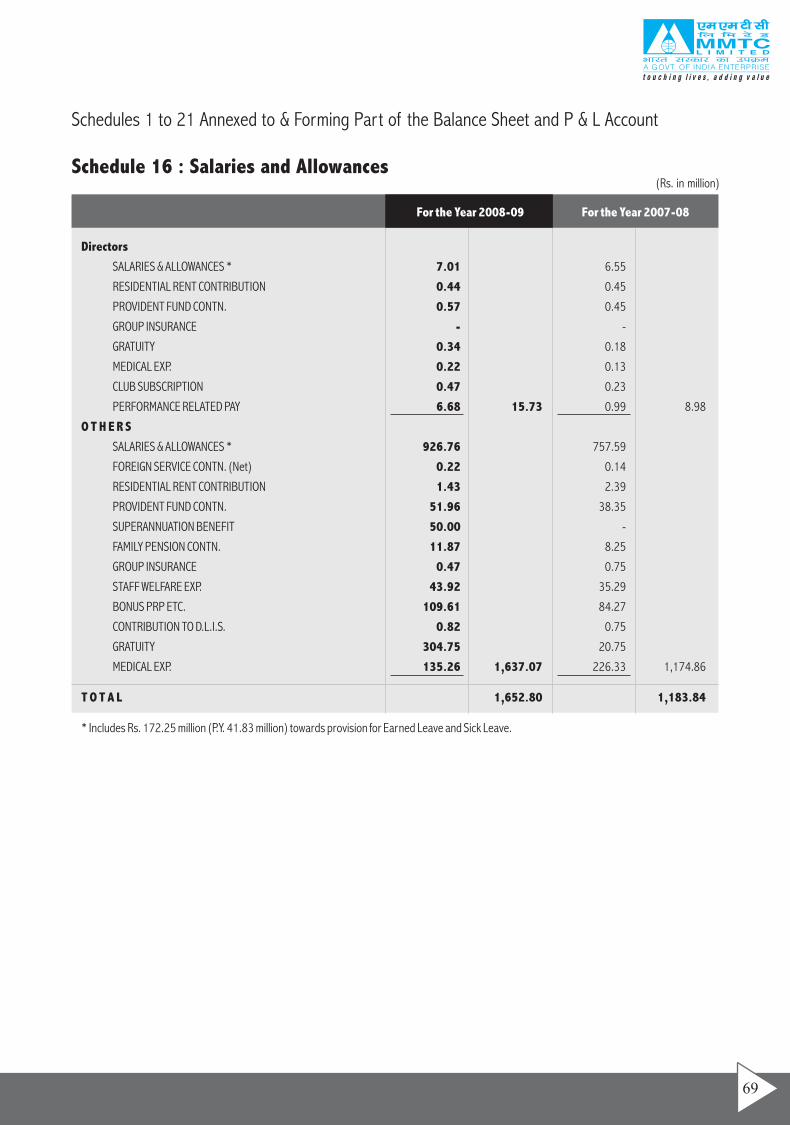
Schedule 16 : Salaries and Allowances(Rs. in million)
Schedules 1 to 21 Annexed to & Forming Part of the Balance Sheet and P & L Account
For the Year 2008-09 For the Year 2007-08
Directors
SALARIES & ALLOWANCES * 7.01 6.55
RESIDENTIAL RENT CONTRIBUTION 0.44 0.45
PROVIDENT FUND CONTN. 0.57 0.45
GROUP INSURANCE - -
GRATUITY 0.34 0.18
MEDICAL EXP. 0.22 0.13
CLUB SUBSCRIPTION 0.47 0.23
PERFORMANCE RELATED PAY 6.68 15.73 0.99 8.98
O T H E R S
SALARIES & ALLOWANCES * 926.76 757.59
FOREIGN SERVICE CONTN. (Net) 0.22 0.14
RESIDENTIAL RENT CONTRIBUTION 1.43 2.39
PROVIDENT FUND CONTN. 51.96 38.35
SUPERANNUATION BENEFIT 50.00 -
FAMILY PENSION CONTN. 11.87 8.25
GROUP INSURANCE 0.47 0.75
STAFF WELFARE EXP. 43.92 35.29
BONUS PRP ETC. 109.61 84.27
CONTRIBUTION TO D.L.I.S. 0.82 0.75
GRATUITY 304.75 20.75
MEDICAL EXP. 135.26 1,637.07 226.33 1,174.86
T O T A L 1,652.80 1,183.84
* Includes Rs. 172.25 million (P.Y. 41.83 million) towards provision for Earned Leave and Sick Leave.
69
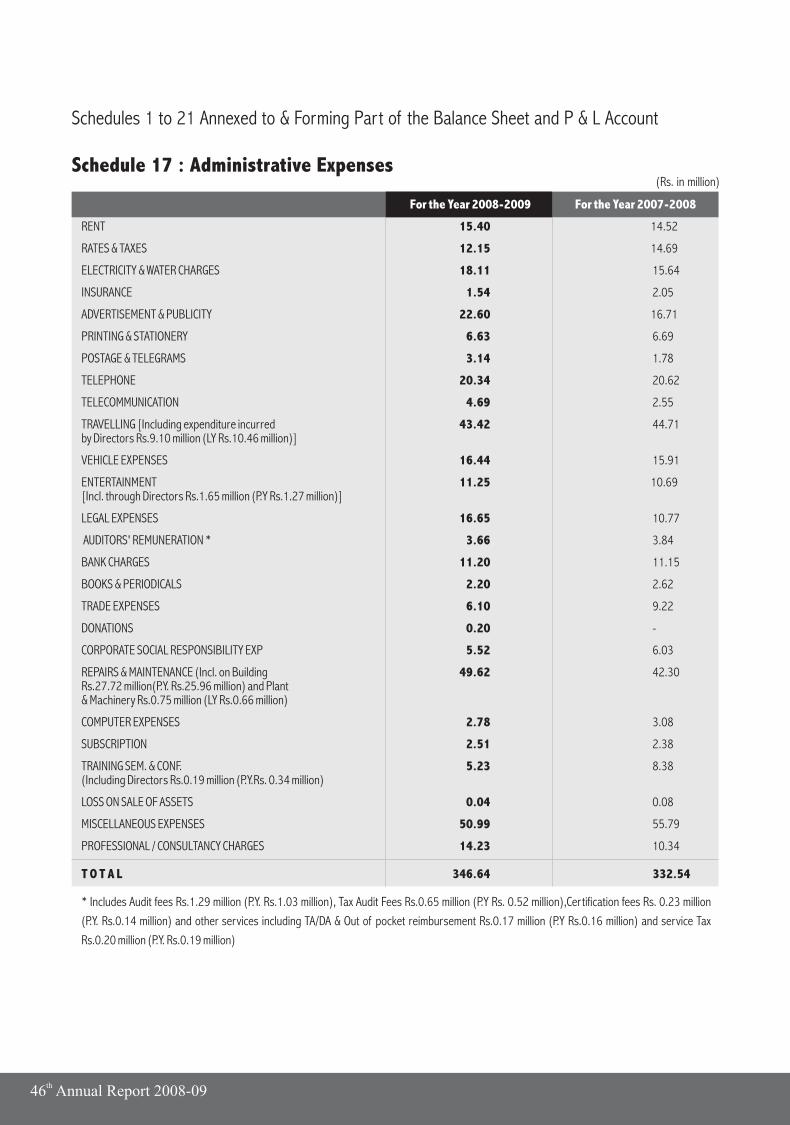
Schedule 17 : Administrative Expenses
Schedules 1 to 21 Annexed to & Forming Part of the Balance Sheet and P & L Account
(Rs. in million)
RENT 15.40 14.52
RATES & TAXES 12.15 14.69
ELECTRICITY & WATER CHARGES 18.11 15.64
INSURANCE 1.54 2.05
ADVERTISEMENT & PUBLICITY 22.60 16.71
PRINTING & STATIONERY 6.63 6.69
POSTAGE & TELEGRAMS 3.14 1.78
TELEPHONE 20.34 20.62
TELECOMMUNICATION 4.69 2.55
TRAVELLING [Including expenditure incurred 43.42 44.71by Directors Rs.9.10 million (LY Rs.10.46 million)]
VEHICLE EXPENSES 16.44 15.91
ENTERTAINMENT 11.25 10.69[Incl. through Directors Rs.1.65 million (P.Y Rs.1.27 million)]
LEGAL EXPENSES 16.65 10.77
AUDITORS' REMUNERATION * 3.66 3.84
BANK CHARGES 11.20 11.15
BOOKS & PERIODICALS 2.20 2.62
TRADE EXPENSES 6.10 9.22
DONATIONS 0.20 -
CORPORATE SOCIAL RESPONSIBILITY EXP 5.52 6.03
REPAIRS & MAINTENANCE (Incl. on Building 49.62 42.30Rs.27.72 million(P.Y. Rs.25.96 million) and Plant & Machinery Rs.0.75 million (LY Rs.0.66 million)
COMPUTER EXPENSES 2.78 3.08
SUBSCRIPTION 2.51 2.38
TRAINING SEM. & CONF. 5.23 8.38(Including Directors Rs.0.19 million (P.Y.Rs. 0.34 million)
LOSS ON SALE OF ASSETS 0.04 0.08
MISCELLANEOUS EXPENSES 50.99 55.79
PROFESSIONAL / CONSULTANCY CHARGES 14.23 10.34
T O T A L 346.64 332.54
* Includes Audit fees Rs.1.29 million (P.Y. Rs.1.03 million), Tax Audit Fees Rs.0.65 million (P.Y Rs. 0.52 million),Certification fees Rs. 0.23 million
(P.Y. Rs.0.14 million) and other services including TA/DA & Out of pocket reimbursement Rs.0.17 million (P.Y Rs.0.16 million) and service Tax
Rs.0.20 million (P.Y. Rs.0.19 million)
For the Year 2008-2009 For the Year 2007-2008
th46 Annual Report 2008-09
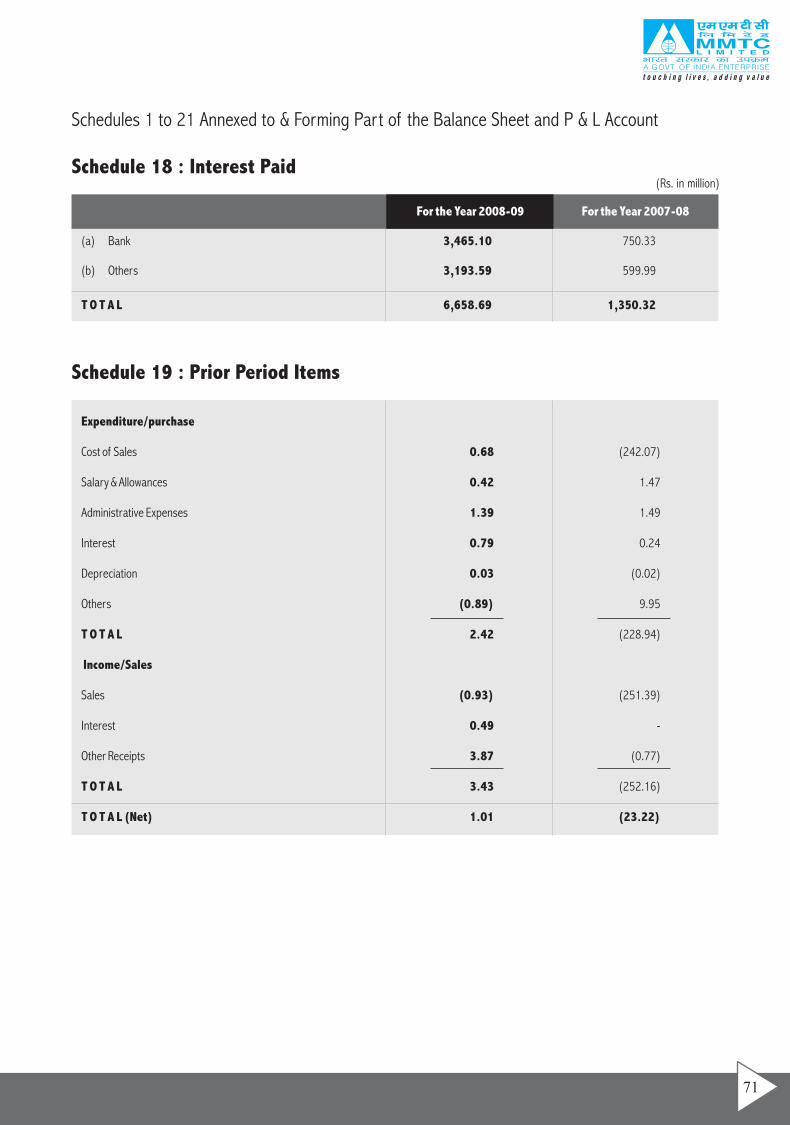
Schedules 1 to 21 Annexed to & Forming Part of the Balance Sheet and P & L Account
(Rs. in million)Schedule 18 : Interest Paid
Schedule 19 : Prior Period Items
Expenditure/purchase
Cost of Sales 0.68 (242.07)
Salary & Allowances 0.42 1.47
Administrative Expenses 1.39 1.49
Interest 0.79 0.24
Depreciation 0.03 (0.02)
Others (0.89) 9.95
T O T A L 2.42 (228.94)
Income/Sales
Sales (0.93) (251.39)
Interest 0.49 -
Other Receipts 3.87 (0.77)
T O T A L 3.43 (252.16)
T O T A L (Net) 1.01 (23.22)
(a)
For the Year 2008-09 For the Year 2007-08
Bank 3,465.10 750.33
(b) Others 3,193.59 599.99
T O T A L 6,658.69 1,350.32
71
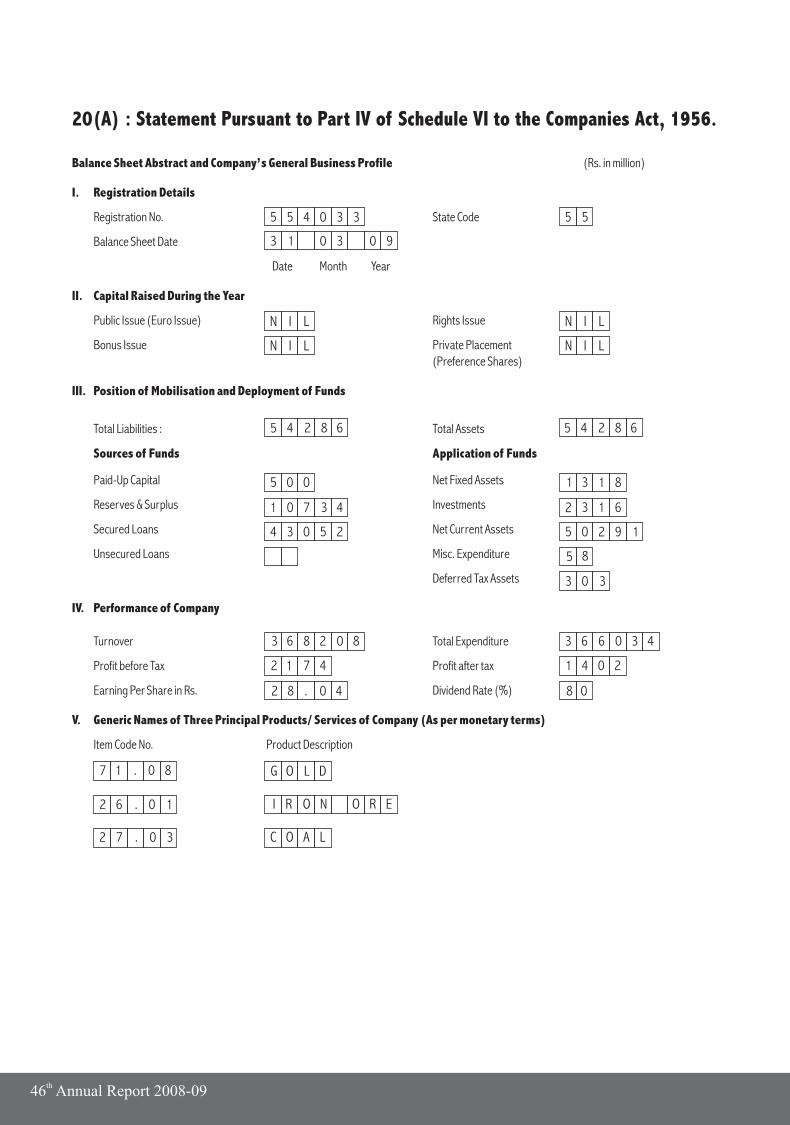
Balance Sheet Abstract and Company’s General Business Profile (Rs. in million)
I. Registration Details
Registration No. State Code
Balance Sheet Date
Date Month Year
II. Capital Raised During the Year
Public Issue (Euro Issue) Rights Issue
Bonus Issue Private Placement(Preference Shares)
III. Position of Mobilisation and Deployment of Funds
Total Liabilities : Total Assets
Sources of Funds Application of Funds
Paid-Up Capital Net Fixed Assets
Reserves & Surplus Investments
Secured Loans Net Current Assets
Unsecured Loans Misc. Expenditure
Deferred Tax Assets
IV. Performance of Company
Turnover Total Expenditure
Profit before Tax Profit after tax
Earning Per Share in Rs. Dividend Rate (%)
V. Generic Names of Three Principal Products/ Services of Company (As per monetary terms)
Item Code No. Product Description
20(A) : Statement Pursuant to Part IV of Schedule VI to the Companies Act, 1956.
5 55 5 4 0 3 3
3 1 0 3 0 9
N I L
N I L
N I L
N I L
5 4 2 8 6
5 0 0
1 0 7 3 4
4 3 0 5 2
1 3 1 8
2 3 1 6
5 0 2 9 1
5 8
3 0 3
3 6 8 2 0 8 3 6 6 0 3 4
1 4 0 2
8 0
2 1 7 4
2 8 . 0 4
7 1 . 0 8
I R O N O R E
G O L D
C O A L
2 6 . 0 1
2 7 . 0 3
5 4 2 8 6
th46 Annual Report 2008-09
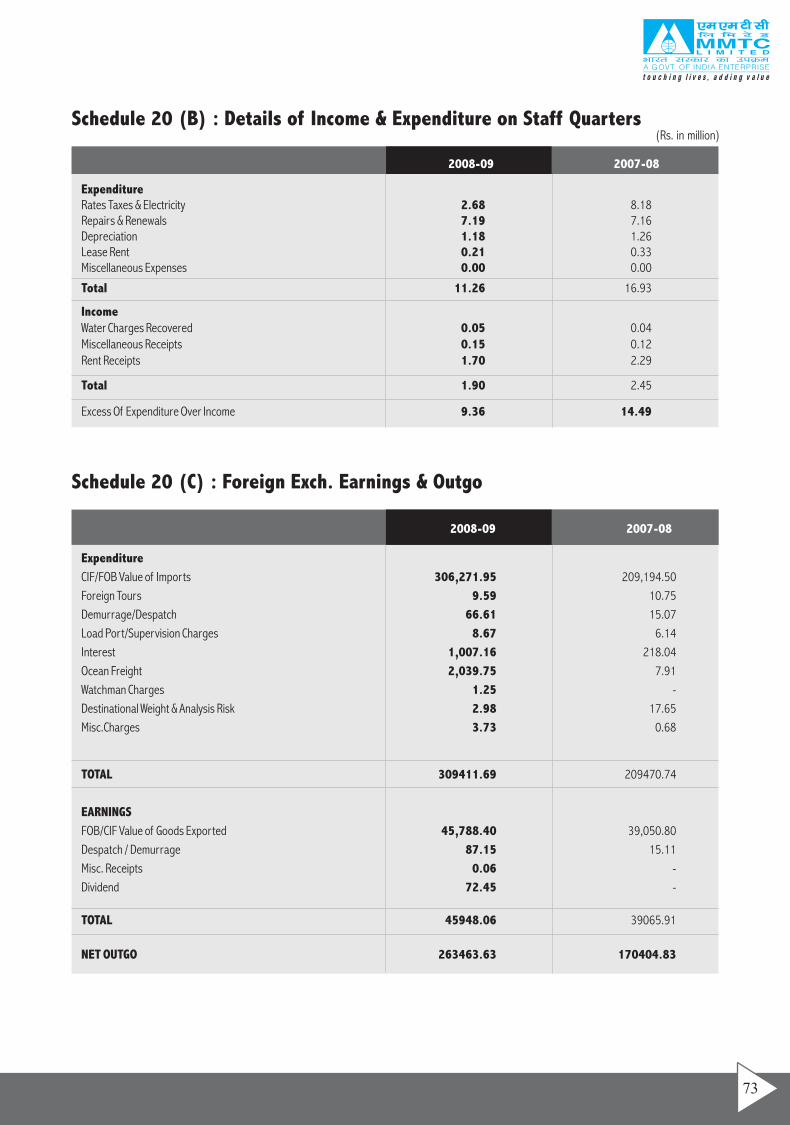
Schedule 20 (B) : Details of Income & Expenditure on Staff Quarters
Schedule 20 (C) : Foreign Exch. Earnings & Outgo
Expenditure
2008-09 2007-08
Rates Taxes & Electricity 2.68 8.18Repairs & Renewals 7.19 7.16Depreciation 1.18 1.26Lease Rent 0.21 0.33Miscellaneous Expenses 0.00 0.00
Total 11.26 16.93
Income Water Charges Recovered 0.05 0.04Miscellaneous Receipts 0.15 0.12Rent Receipts 1.70 2.29
Total 1.90 2.45
Excess Of Expenditure Over Income 9.36 14.49
Expenditure
2008-09 2007-08
CIF/FOB Value of Imports 306,271.95 209,194.50
Foreign Tours 9.59 10.75
Demurrage/Despatch 66.61 15.07
Load Port/Supervision Charges 8.67 6.14
Interest 1,007.16 218.04
Ocean Freight 2,039.75 7.91
Watchman Charges 1.25 -
Destinational Weight & Analysis Risk 2.98 17.65
Misc.Charges 3.73 0.68
TOTAL 309411.69 209470.74
EARNINGS
FOB/CIF Value of Goods Exported 45,788.40 39,050.80
Despatch / Demurrage 87.15 15.11
Misc. Receipts 0.06 -
Dividend 72.45 -
TOTAL 45948.06 39065.91
NET OUTGO 263463.63 170404.83
(Rs. in million)
73
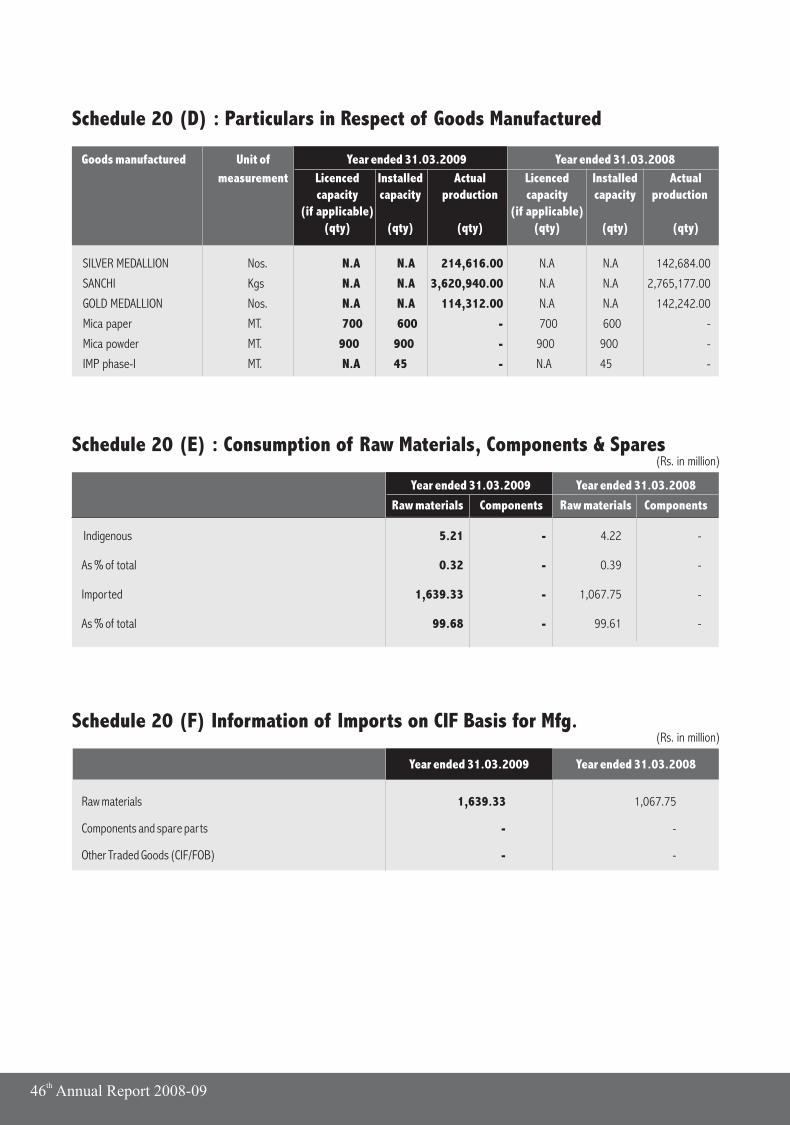
th46 Annual Report 2008-09
SILVER MEDALLION Nos. N.A N.A 214,616.00 N.A N.A 142,684.00
SANCHI Kgs N.A N.A 3,620,940.00 N.A N.A 2,765,177.00
GOLD MEDALLION Nos. N.A N.A 114,312.00 N.A N.A 142,242.00
Mica paper MT. 700 600 - 700 600 -
Mica powder MT. 900 900 - 900 900 -
IMP phase-I MT. N.A 45 - N.A 45 -
Schedule 20 (D) : Particulars in Respect of Goods Manufactured
Goods manufactured Unit of Year ended 31.03.2009 Year ended 31.03.2008
measurement Licenced Installed Actual Licenced Installed Actualcapacity capacity production capacity capacity production
(if applicable) (if applicable)(qty) (qty) (qty) (qty) (qty) (qty)
Schedule 20 (E) : Consumption of Raw Materials, Components & Spares(Rs. in million)
Year ended 31.03.2009 Year ended 31.03.2008
Raw materials Components Raw materials Components
Indigenous 5.21 - 4.22 -
As % of total 0.32 - 0.39 -
Imported 1,639.33 - 1,067.75 -
As % of total 99.68 - 99.61 -
Schedule 20 (F) Information of Imports on CIF Basis for Mfg.(Rs. in million)
Raw materials
Components and spare parts
Other Traded Goods (CIF/FOB)
Year ended 31.03.2009 Year ended 31.03.2008
1,639.33 1,067.75
- -
- -
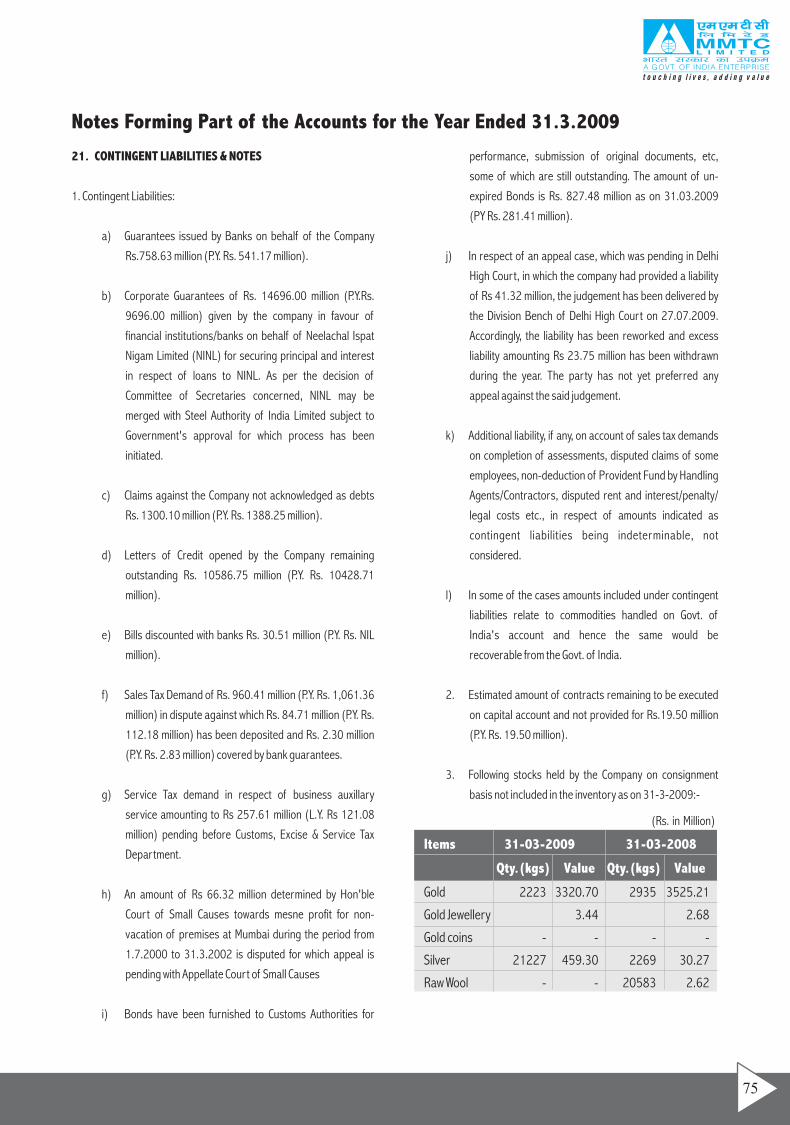
21. CONTINGENT LIABILITIES & NOTES
1. Contingent Liabilities:
a) Guarantees issued by Banks on behalf of the Company
Rs.758.63 million (P.Y. Rs. 541.17 million).
b) Corporate Guarantees of Rs. 14696.00 million (P.Y.Rs.
9696.00 million) given by the company in favour of
financial institutions/banks on behalf of Neelachal Ispat
Nigam Limited (NINL) for securing principal and interest
in respect of loans to NINL. As per the decision of
Committee of Secretaries concerned, NINL may be
merged with Steel Authority of India Limited subject to
Government's approval for which process has been
initiated.
c) Claims against the Company not acknowledged as debts
Rs. 1300.10 million (P.Y. Rs. 1388.25 million).
d) Letters of Credit opened by the Company remaining
outstanding Rs. 10586.75 million (P.Y. Rs. 10428.71
million).
e) Bills discounted with banks Rs. 30.51 million (P.Y. Rs. NIL
million).
f) Sales Tax Demand of Rs. 960.41 million (P.Y. Rs. 1,061.36
million) in dispute against which Rs. 84.71 million (P.Y. Rs.
112.18 million) has been deposited and Rs. 2.30 million
(P.Y. Rs. 2.83 million) covered by bank guarantees.
g) Service Tax demand in respect of business auxillary
service amounting to Rs 257.61 million (L.Y. Rs 121.08
million) pending before Customs, Excise & Service Tax
Department.
h) An amount of Rs 66.32 million determined by Hon'ble
Court of Small Causes towards mesne profit for non-
vacation of premises at Mumbai during the period from
1.7.2000 to 31.3.2002 is disputed for which appeal is
pending with Appellate Court of Small Causes
i) Bonds have been furnished to Customs Authorities for
performance, submission of original documents, etc,
some of which are still outstanding. The amount of un-
expired Bonds is Rs. 827.48 million as on 31.03.2009
(PY Rs. 281.41 million).
j) In respect of an appeal case, which was pending in Delhi
High Court, in which the company had provided a liability
of Rs 41.32 million, the judgement has been delivered by
the Division Bench of Delhi High Court on 27.07.2009.
Accordingly, the liability has been reworked and excess
liability amounting Rs 23.75 million has been withdrawn
during the year. The party has not yet preferred any
appeal against the said judgement.
k) Additional liability, if any, on account of sales tax demands
on completion of assessments, disputed claims of some
employees, non-deduction of Provident Fund by Handling
Agents/Contractors, disputed rent and interest/penalty/
legal costs etc., in respect of amounts indicated as
contingent liabilities being indeterminable, not
considered.
l) In some of the cases amounts included under contingent
liabilities relate to commodities handled on Govt. of
India's account and hence the same would be
recoverable from the Govt. of India.
2. Estimated amount of contracts remaining to be executed
on capital account and not provided for Rs.19.50 million
(P.Y. Rs. 19.50 million).
3. Following stocks held by the Company on consignment
basis not included in the inventory as on 31-3-2009:-
Notes Forming Part of the Accounts for the Year Ended 31.3.2009
Items 31-03-2009 31-03-2008
Qty.(kgs) Value Qty.(kgs) Value
Gold
Gold Jewellery
Gold coins - - - -
Silver
Raw Wool - -
2223 3320.70 2935 3525.21
3.44 2.68
21227 459.30 2269 30.27
20583 2.62
(Rs. in Million)
75
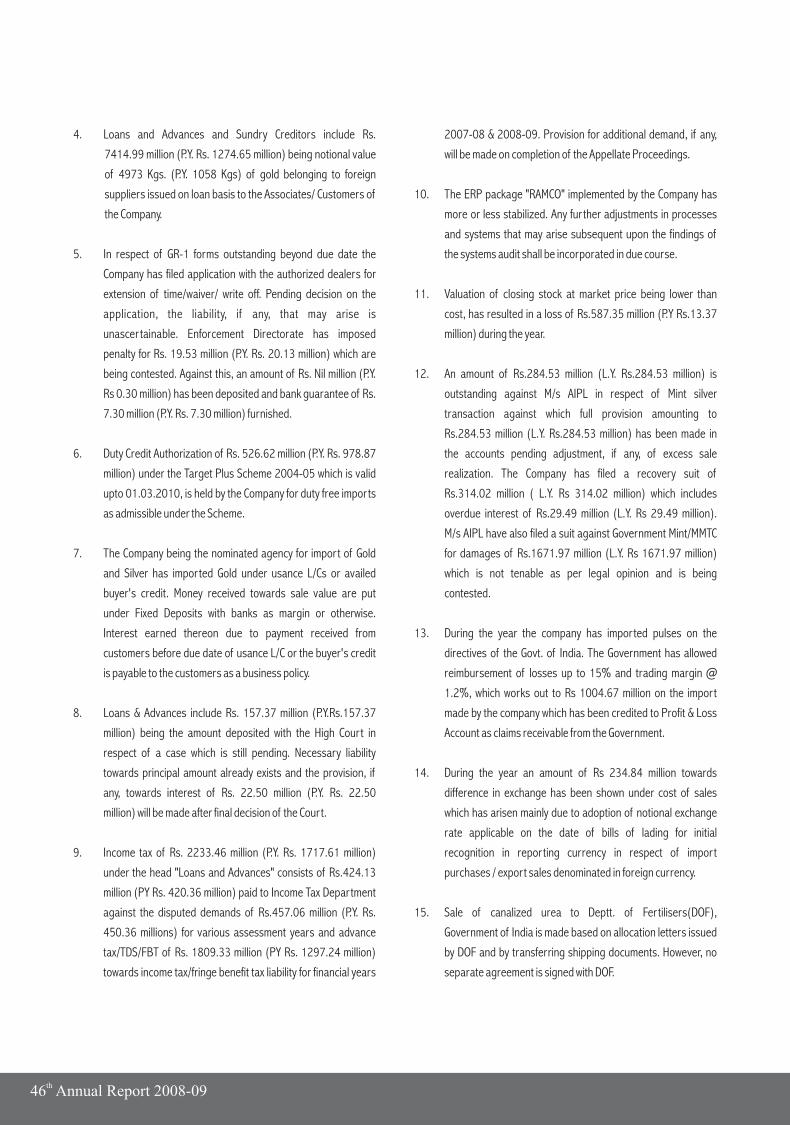
4. Loans and Advances and Sundry Creditors include Rs.
7414.99 million (P.Y. Rs. 1274.65 million) being notional value
of 4973 Kgs. (P.Y. 1058 Kgs) of gold belonging to foreign
suppliers issued on loan basis to the Associates/ Customers of
the Company.
5. In respect of GR-1 forms outstanding beyond due date the
Company has filed application with the authorized dealers for
extension of time/waiver/ write off. Pending decision on the
application, the liability, if any, that may arise is
unascertainable. Enforcement Directorate has imposed
penalty for Rs. 19.53 million (P.Y. Rs. 20.13 million) which are
being contested. Against this, an amount of Rs. Nil million (P.Y.
Rs 0.30 million) has been deposited and bank guarantee of Rs.
7.30 million (P.Y. Rs. 7.30 million) furnished.
6. Duty Credit Authorization of Rs. 526.62 million (P.Y. Rs. 978.87
million) under the Target Plus Scheme 2004-05 which is valid
upto 01.03.2010, is held by the Company for duty free imports
as admissible under the Scheme.
7. The Company being the nominated agency for import of Gold
and Silver has imported Gold under usance L/Cs or availed
buyer's credit. Money received towards sale value are put
under Fixed Deposits with banks as margin or otherwise.
Interest earned thereon due to payment received from
customers before due date of usance L/C or the buyer's credit
is payable to the customers as a business policy.
8. Loans & Advances include Rs. 157.37 million (P.Y.Rs.157.37
million) being the amount deposited with the High Court in
respect of a case which is still pending. Necessary liability
towards principal amount already exists and the provision, if
any, towards interest of Rs. 22.50 million (P.Y. Rs. 22.50
million) will be made after final decision of the Court.
9. Income tax of Rs. 2233.46 million (P.Y. Rs. 1717.61 million)
under the head "Loans and Advances" consists of Rs.424.13
million (PY Rs. 420.36 million) paid to Income Tax Department
against the disputed demands of Rs.457.06 million (P.Y. Rs.
450.36 millions) for various assessment years and advance
tax/TDS/FBT of Rs. 1809.33 million (PY Rs. 1297.24 million)
towards income tax/fringe benefit tax liability for financial years
2007-08 & 2008-09. Provision for additional demand, if any,
will be made on completion of the Appellate Proceedings.
10. The ERP package "RAMCO" implemented by the Company has
more or less stabilized. Any further adjustments in processes
and systems that may arise subsequent upon the findings of
the systems audit shall be incorporated in due course.
11. Valuation of closing stock at market price being lower than
cost, has resulted in a loss of Rs.587.35 million (P.Y Rs.13.37
million) during the year.
12. An amount of Rs.284.53 million (L.Y. Rs.284.53 million) is
outstanding against M/s AIPL in respect of Mint silver
transaction against which full provision amounting to
Rs.284.53 million (L.Y. Rs.284.53 million) has been made in
the accounts pending adjustment, if any, of excess sale
realization. The Company has filed a recovery suit of
Rs.314.02 million ( L.Y. Rs 314.02 million) which includes
overdue interest of Rs.29.49 million (L.Y. Rs 29.49 million).
M/s AIPL have also filed a suit against Government Mint/MMTC
for damages of Rs.1671.97 million (L.Y. Rs 1671.97 million)
which is not tenable as per legal opinion and is being
contested.
13. During the year the company has imported pulses on the
directives of the Govt. of India. The Government has allowed
reimbursement of losses up to 15% and trading margin @
1.2%, which works out to Rs 1004.67 million on the import
made by the company which has been credited to Profit & Loss
Account as claims receivable from the Government.
14. During the year an amount of Rs 234.84 million towards
difference in exchange has been shown under cost of sales
which has arisen mainly due to adoption of notional exchange
rate applicable on the date of bills of lading for initial
recognition in reporting currency in respect of import
purchases / export sales denominated in foreign currency.
15. Sale of canalized urea to Deptt. of Fertilisers(DOF),
Government of India is made based on allocation letters issued
by DOF and by transferring shipping documents. However, no
separate agreement is signed with DOF.
th46 Annual Report 2008-09
16. The proportionate forward premium of Rs.182.46 million (LY
Rs. 107.07 million) for imports and Rs.Nil million (L.Y. Rs.Nil
million ) for exports to be recognized in the Profit & Loss
Account of the subsequent accounting year in terms of the
provisions of Accounting Standard - 11 issued by the Institute
of Chartered Accountant of India.
17. In respect of forward exchange contracts outstanding as on
31.3.09 relating to firm commitments and highly probable
forecast transactions, the loss of Rs. Nil million (L.Y. loss of Rs.
36.11 million) has been recognized in the Profit & Loss
Account on the basis of changes in exchange rate at the close
of the year.
18. Adhoc liability of Rs.66.21 million (L.Y.Rs. 121.80 million) has
been made during the year towards pay revision of the
employees of staff cadre which has become due w.e.f.
01.01.2007 having regard to the wage revision of officers
already effected as per DPE guidelines. Further a liability of Rs
59.81 million towards perquisite & allowance from 26.11.08 to
31.03.09 and Rs 50.00 million towards superannuation
benefit w.e.f. 1.1.07 has been made during the year as per DPE
guidelines for wage revision.
19. During the year 2 kg gold valued at Rs. 2.24 million was short
received at Regional Office Bangalore while returning the
unsold jewellery on account of exhibition against which
provision for Rs 2.24 million has been made in the accounts.
Departmental action has been initiated against the erring
officials. Suit for recovery has been filed besides criminal
complaint.
20. A claim for Rs 20.62 million (LY Rs 20.62 million) against an
associate on account of damaged imported Polyester is
pending for which a provision of Rs 15.54 million (LY Rs 15.54
million)has been made after taking into account the EMD and
other payables amounting to Rs 5.08 million (LY Rs 5.08
million). The company has requested customs for
abandonment which is pending for adjudication.
21. The employees benefits provided by the Company as required
under Accounting Standard 15 (Revised) are as under:-
(i) Leave Encashment - Payable on separation to eligible
employees who have accumulated earned and half pay
leave. Encashment of accumulated earned leave is also
allowed leaving a minimum balance of 15 days twice in a
year.
(ii) Post Retirement Medical Benefit(PRMB) - Available to
retired employees at empanelled hospitals for inpatient
treatment and also for OPD treatment.
(iii) LTC/ALTC - Leave Travel Concession and ALTC is given to
all serving employees once in a block of two years by their
entitled class of travel.
Liability in respect of benefits in respect of Leave
Encashment, PRMB and LTC/ALTC are recognized on the
basis of actuarial valuation.
(iv) Gratuity - Gratuity is paid to all the employees on
retirement/separation based on the number of years of
service. The scheme is funded by the Company and is
managed by a separate Trust through LIC. In case of MICA
division employees the scheme is managed directly by the
company through LIC.
Other disclosures as required under AS - 15(Revised) on 'Employee
Benefits', in respect of defined benefit obligation are:
77
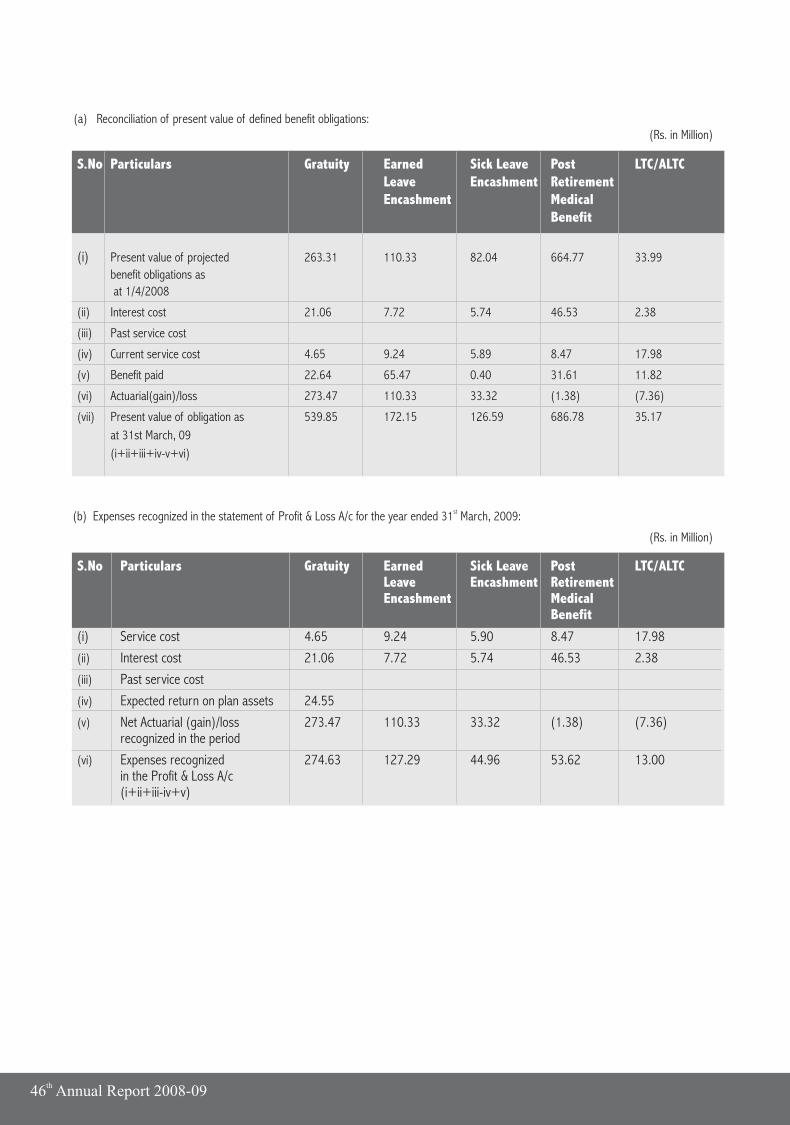
S.No Sick Leave Post LTC/ALTCLeave Encashment Retirement Encashment Medical
Benefit
(i)
Particulars Gratuity Earned
Present value of projected 263.31 110.33 82.04 664.77 33.99
benefit obligations as
at 1/4/2008
(ii) Interest cost 21.06 7.72 5.74 46.53 2.38
(iii) Past service cost
(iv) Current service cost 4.65 9.24 5.89 8.47 17.98
(v) Benefit paid 22.64 65.47 0.40 31.61 11.82
(vi) Actuarial(gain)/loss 273.47 110.33 33.32 (1.38) (7.36)
(vii) Present value of obligation as 539.85 172.15 126.59 686.78 35.17
at 31st March, 09
(i+ii+iii+iv-v+vi)
S.No Sick Leave Post LTC/ALTCLeave Encashment Retirement Encashment Medical
Benefit
(i)
Particulars Gratuity Earned
Service cost 4.65 9.24 5.90 8.47 17.98
(ii) Interest cost 21.06 7.72 5.74 46.53 2.38
(iii) Past service cost
(iv) Expected return on plan assets 24.55
(v) Net Actuarial (gain)/loss 273.47 110.33 33.32 (1.38) (7.36)recognized in the period
(vi) Expenses recognized 274.63 127.29 44.96 53.62 13.00in the Profit & Loss A/c (i+ii+iii-iv+v)
(a) Reconciliation of present value of defined benefit obligations:(Rs. in Million)
st(b) Expenses recognized in the statement of Profit & Loss A/c for the year ended 31 March, 2009:
(Rs. in Million)
th46 Annual Report 2008-09
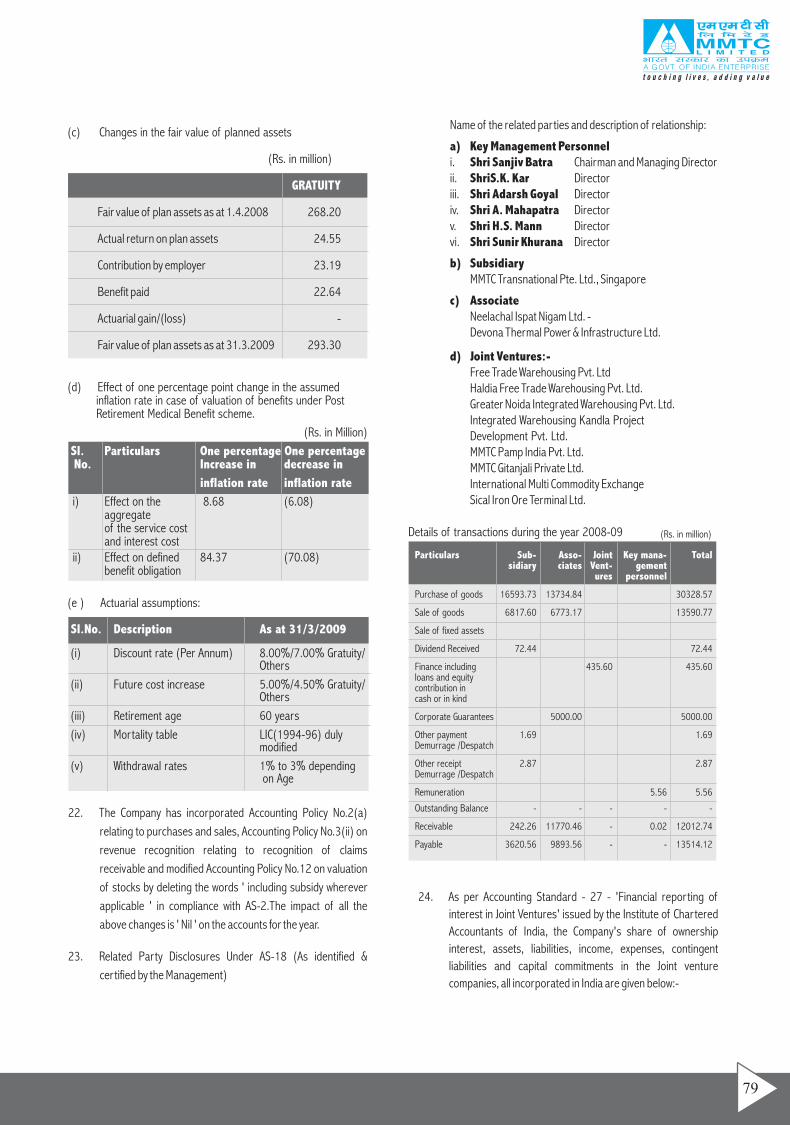
Name of the related parties and description of relationship:
a) Key Management Personneli. Shri Sanjiv Batra Chairman and Managing Directorii. ShriS.K. Kar Directoriii. Shri Adarsh Goyal Directoriv. Shri A. Mahapatra Director v. Shri H.S. Mann Directorvi. Shri Sunir Khurana Director
b) Subsidiary MMTC Transnational Pte. Ltd., Singapore
c) AssociateNeelachal Ispat Nigam Ltd. -Devona Thermal Power & Infrastructure Ltd.
d) Joint Ventures:-Free Trade Warehousing Pvt. LtdHaldia Free Trade Warehousing Pvt. Ltd.Greater Noida Integrated Warehousing Pvt. Ltd. Integrated Warehousing Kandla ProjectDevelopment Pvt. Ltd.MMTC Pamp India Pvt. Ltd.MMTC Gitanjali Private Ltd.International Multi Commodity ExchangeSical Iron Ore Terminal Ltd.
Particulars Sub- Asso- Joint Key mana- Totalsidiary ciates Vent- gement
ures personnel
Purchase of goods 16593.73 13734.84 30328.57
Sale of goods 6817.60 6773.17 13590.77
Sale of fixed assets
Dividend Received 72.44 72.44
Finance including 435.60 435.60 loans and equity contribution in cash or in kind
Corporate Guarantees 5000.00 5000.00
Other payment 1.69 1.69Demurrage /Despatch
Other receipt 2.87 2.87Demurrage /Despatch
Remuneration 5.56 5.56
Outstanding Balance - - - - -
Receivable 242.26 11770.46 - 0.02 12012.74
Payable 3620.56 9893.56 - - 13514.12
(Rs. in million)Details of transactions during the year 2008-09
24. As per Accounting Standard - 27 - 'Financial reporting of
interest in Joint Ventures' issued by the Institute of Chartered
Accountants of India, the Company's share of ownership
interest, assets, liabilities, income, expenses, contingent
liabilities and capital commitments in the Joint venture
companies, all incorporated in India are given below:-
22. The Company has incorporated Accounting Policy No.2(a)
relating to purchases and sales, Accounting Policy No.3(ii) on
revenue recognition relating to recognition of claims
receivable and modified Accounting Policy No.12 on valuation
of stocks by deleting the words ' including subsidy wherever
applicable ' in compliance with AS-2.The impact of all the
above changes is ' Nil ' on the accounts for the year.
23. Related Party Disclosures Under AS-18 (As identified &
certified by the Management)
(c) Changes in the fair value of planned assets
(Rs. in million)
Fair
GRATUITY
value of plan assets as at 1.4.2008 268.20
Actual return on plan assets 24.55
Contribution by employer 23.19
Benefit paid 22.64
Actuarial gain/(loss) -
Fair value of plan assets as at 31.3.2009 293.30
(d)
(Rs. in Million)
i) Effect on the 8.68 (6.08)aggregateof the service cost and interest cost
ii) Effect on defined 84.37 (70.08)benefit obligation
Effect of one percentage point change in the assumed inflation rate in case of valuation of benefits under Post Retirement Medical Benefit scheme.
Sl. Particulars One percentage One percentage No. Increase in decrease in
inflation rate inflation rate
(e ) Actuarial assumptions:
(i) Discount rate (Per Annum)
(ii) Future cost increase
(iii) Retirement age 60 years
(iv) Mortality table LIC(1994-96) duly modified
(v) Withdrawal rates 1% to 3% depending on Age
Sl.No. Description As at 31/3/2009
8.00%/7.00% Gratuity/ Others
5.00%/4.50% Gratuity/ Others
79
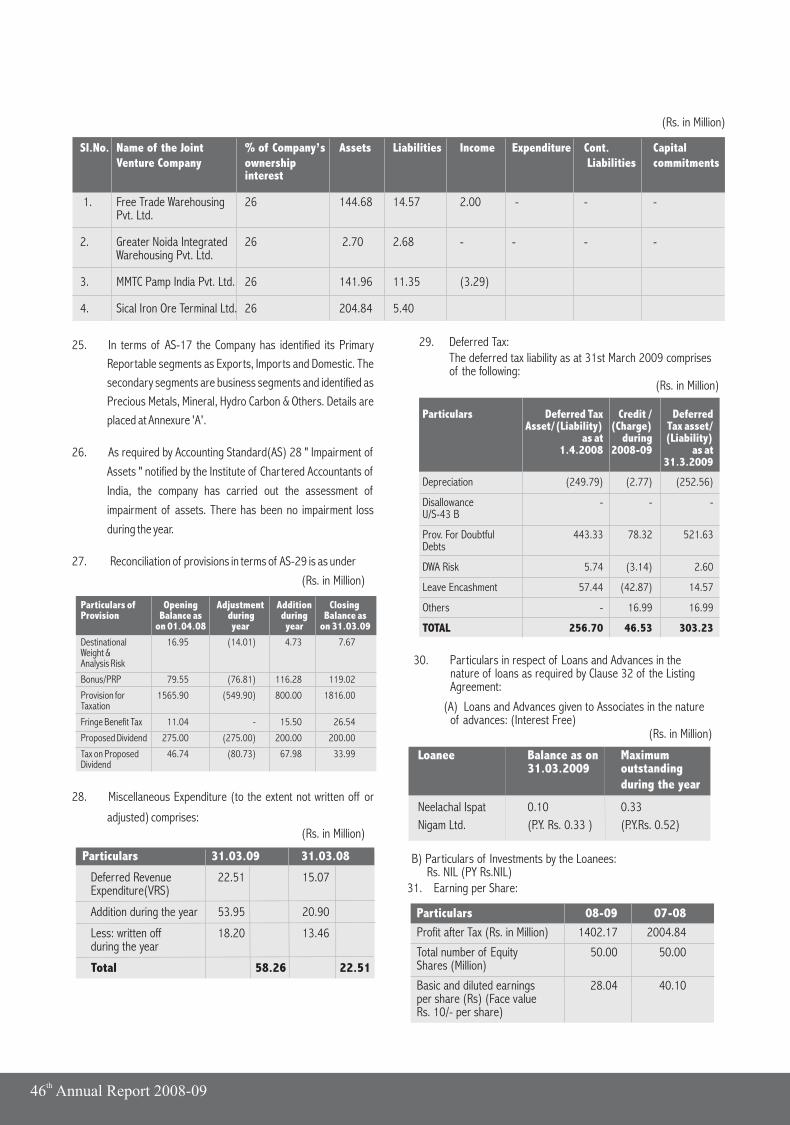
25. In terms of AS-17 the Company has identified its Primary
Reportable segments as Exports, Imports and Domestic. The
secondary segments are business segments and identified as
Precious Metals, Mineral, Hydro Carbon & Others. Details are
placed at Annexure 'A'.
26. As required by Accounting Standard(AS) 28 " Impairment of
Assets " notified by the Institute of Chartered Accountants of
India, the company has carried out the assessment of
impairment of assets. There has been no impairment loss
during the year.
27. Reconciliation of provisions in terms of AS-29 is as under
(Rs. in Million)
1.
Sl.No. Name of the Joint % of Venture Company ownership Liabilities commitments
interest
Company’s Assets Liabilities Income Expenditure Cont. Capital
Free Trade Warehousing 26 144.68 14.57 2.00 - - -Pvt. Ltd.
2. Greater Noida Integrated 26 2.70 2.68 - - - -Warehousing Pvt. Ltd.
3. MMTC Pamp India Pvt. Ltd. 26 141.96 11.35 (3.29)
4. Sical Iron Ore Terminal Ltd. 26 204.84 5.40
(Rs. in Million)
Particulars 31.03.09 31.03.08
Deferred Revenue 22.51 15.07Expenditure(VRS)
Addition during the year 53.95 20.90
Less: written off 18.20 13.46during the year
Total 58.26 22.51
(Rs. in Million)
Particulars of Opening Adjustment Addition Closing Provision Balance as during during Balance as
on 01.04.08 year year on 31.03.09
Destinational 16.95 (14.01) 4.73 7.67Weight & Analysis Risk
Bonus/PRP 79.55 (76.81) 116.28 119.02
Provision for 1565.90 (549.90) 800.00 1816.00Taxation
Fringe Benefit Tax 11.04 - 15.50 26.54
Proposed Dividend 275.00 (275.00) 200.00 200.00
Tax on Proposed 46.74 (80.73) 67.98 33.99Dividend
28. Miscellaneous Expenditure (to the extent not written off or
adjusted) comprises:
29. Deferred Tax: The deferred tax liability as at 31st March 2009 comprises of the following:
Particulars Deferred Tax Credit / DeferredAsset/(Liability) (Charge) Tax asset/
as at during (Liability)1.4.2008 2008-09 as at
31.3.2009
Depreciation (249.79) (2.77) (252.56)
Disallowance - - -U/S-43 B
Prov. For Doubtful 443.33 78.32 521.63Debts
DWA Risk 5.74 (3.14) 2.60
Leave Encashment 57.44 (42.87) 14.57
Others - 16.99 16.99
TOTAL 256.70 46.53 303.23
(Rs. in Million)
30. Particulars in respect of Loans and Advances in the nature of loans as required by Clause 32 of the Listing Agreement:
(A) Loans and Advances given to Associates in the nature of advances: (Interest Free)
(Rs. in Million)
Loanee Balance as on Maximum 31.03.2009 outstanding
during the year
Neelachal Ispat 0.10 0.33
Nigam Ltd. (P.Y. Rs. 0.33 ) (P.Y.Rs. 0.52)
B) Particulars of Investments by the Loanees: Rs. NIL (PY Rs.NIL)
31. Earning per Share:
Particulars 08-09 07-08
Profit after Tax (Rs. in Million) 1402.17 2004.84
Total number of Equity 50.00 50.00Shares (Million)
Basic and diluted earnings 28.04 40.10per share (Rs) (Face value Rs. 10/- per share)
th46 Annual Report 2008-09
Sd/-
(NK Bhargava)
PartnerM.No. 080624
Sd/-
( Manohar Balwani )
GM & Company Secretary
Sd/-
(Vijay Pal )
Chief General Manager (F&A)
Sd/-
( S K Kar )
Director (Finance)
Sd/-
( Sanjiv Batra )
Chairman and Managing Director
Place : New DelhiDate:7th August, 2009
32. Letters have been issued to parties for confirmation of
balances with the request to confirm or send comment by the
stipulated date failing which balance as indicated in the letter
would be taken as confirmed. Confirmation letters have been
received in a few cases. However, no adverse communication
received from any party.
33. There are no micro, small or medium enterprises to whom the
Company owes dues which are outstanding for more than 45
days as at 31st March, 2009.
34. Compliance of the Companies (Accounting Standard) Rules
2006 has been made. The Company has large number of
transactions and diversified activities, which may have put
operational constraints in strictly following the said rules. The
deviation if any, have been stated in the accounting policies of
the Company.
35. Whole time Directors are allowed usage of staff cars for
private purposes up to 12,000 km per annum as specified in
the contractual terms of appointment on payment of Rs. 400
per month.
36. Figures for the previous year have been regrouped / recasted
wherever considered necessary.
37. Accounting Policies, Schedules & Notes attached form an
integral part of the Accounts.
For N K Bhargava & Co.
Chartered Accountants
81
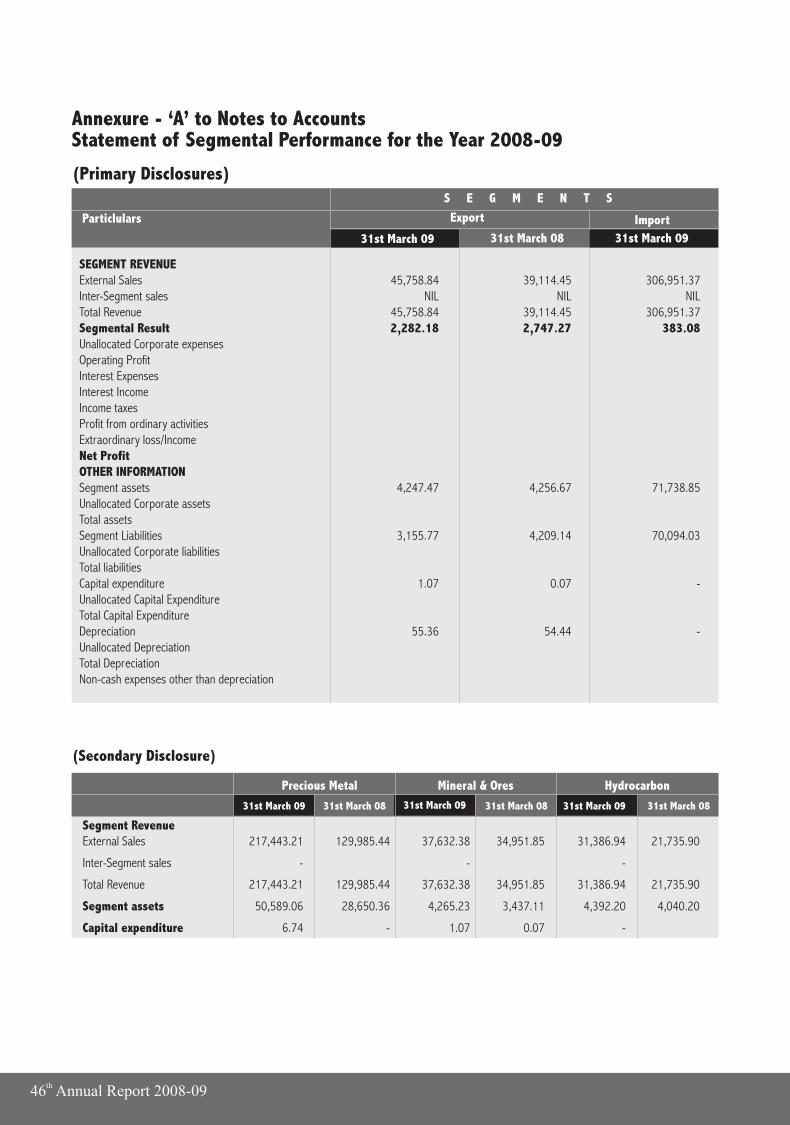
Annexure - ‘A’ to Notes to AccountsStatement of Segmental Performance for the Year 2008-09
(Primary Disclosures)
(Secondary Disclosure)
Particlulars
S E G M E N T S
Export Import
31st March 08
SEGMENT REVENUE External Sales 45,758.84 39,114.45 306,951.37 Inter-Segment sales NIL NIL NILTotal Revenue 45,758.84 39,114.45 306,951.37Segmental Result 2,282.18 2,747.27 383.08Unallocated Corporate expenses Operating Profit Interest Expenses Interest Income Income taxes Profit from ordinary activities Extraordinary loss/Income Net Profit OTHER INFORMATION Segment assets 4,247.47 4,256.67 71,738.85Unallocated Corporate assets Total assets Segment Liabilities 3,155.77 4,209.14 70,094.03Unallocated Corporate liabilities Total liabilities Capital expenditure 1.07 0.07 - Unallocated Capital Expenditure Total Capital Expenditure Depreciation 55.36 54.44 - Unallocated Depreciation Total Depreciation Non-cash expenses other than depreciation
31st March 0931st March 09 31st March 08 31st March 08 31st March 09 31st March 08
Precious Metal Mineral & Ores Hydrocarbon
External Sales
Inter-Segment sales - - -
Total Revenue 217,443.21 129,985.44 37,632.38 34,951.85 31,386.94 21,735.90
Segment assets 50,589.06 28,650.36 4,265.23 3,437.11 4,392.20 4,040.20
Capital expenditure 6.74 - 1.07 0.07 -
217,443.21 129,985.44 37,632.38 34,951.85 31,386.94 21,735.90
31st March 09 31st March 09
(Primary Disclosures)
Segment Revenue
th46 Annual Report 2008-09
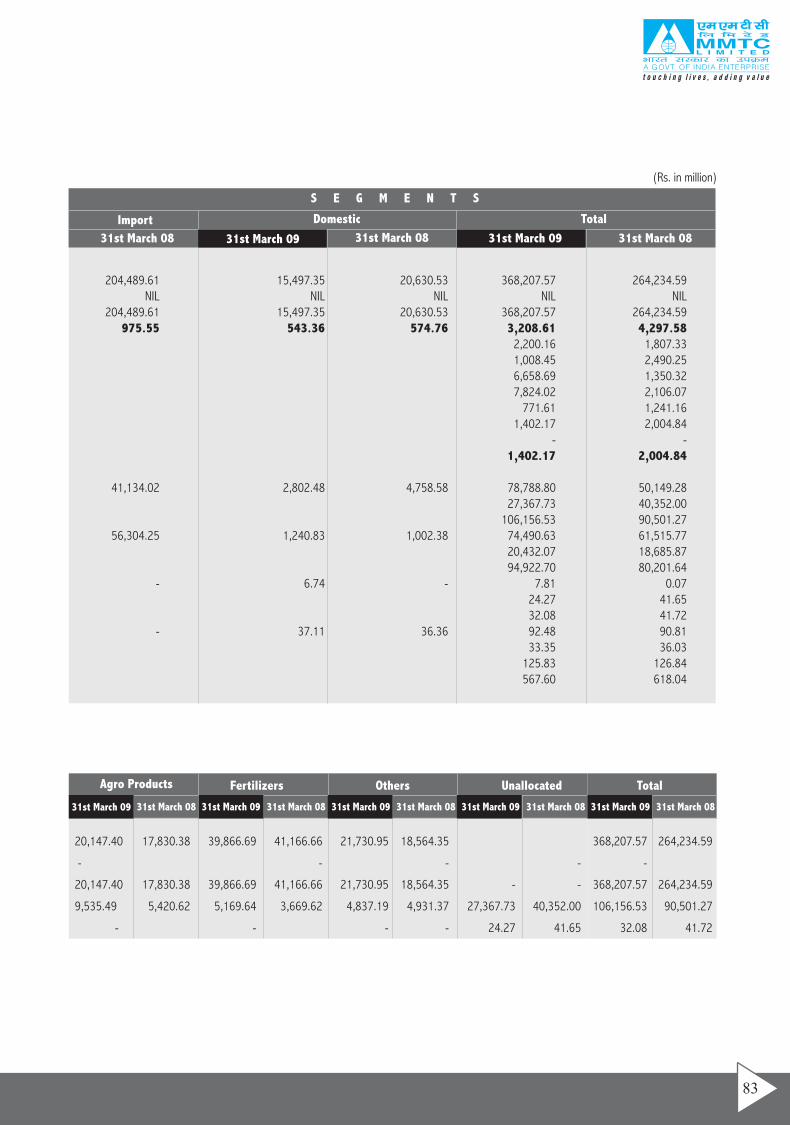
NIL NIL NIL NIL NIL
204,489.61 15,497.35 20,630.53 368,207.57 264,234.59 975.55 543.36 574.76 3,208.61 4,297.58
2,200.16 1,807.33 1,008.45 2,490.25
6,658.69 1,350.32 7,824.02 2,106.07
771.61 1,241.16 1,402.17 2,004.84 - -
1,402.17 2,004.84
41,134.02 2,802.48 4,758.58 78,788.80 50,149.2827,367.73 40,352.00
106,156.53 90,501.27 56,304.25 1,240.83 1,002.38 74,490.63 61,515.77
20,432.07 18,685.8794,922.70 80,201.64
- 6.74 - 7.81 0.0724.27 41.6532.08 41.72
- 37.11 36.36 92.48 90.8133.35 36.03
125.83 126.84567.60 618.04
204,489.61 15,497.35 20,630.53 368,207.57 264,234.59
(Rs. in million)
S E G M E N T S
Import
31st March 08 31st March 08 31st March 08
Total Domestic
Agro Products Fertilizers Others Unallocated Total
20,147.40 17,830.38 39,866.69 41,166.66 21,730.95 18,564.35 368,207.57 264,234.59
- - - - -
20,147.40 17,830.38 39,866.69 41,166.66 21,730.95 18,564.35 - - 368,207.57 264,234.59
9,535.49 5,420.62 5,169.64 3,669.62 4,837.19 4,931.37 27,367.73 40,352.00 106,156.53 90,501.27
- - - - 24.27 41.65 32.08 41.72
31st March 08
31st March 09 31st March 09
31st March 0931st March 0831st March 0931st March 0831st March 0931st March 0831st March 0931st March 0831st March 09
83
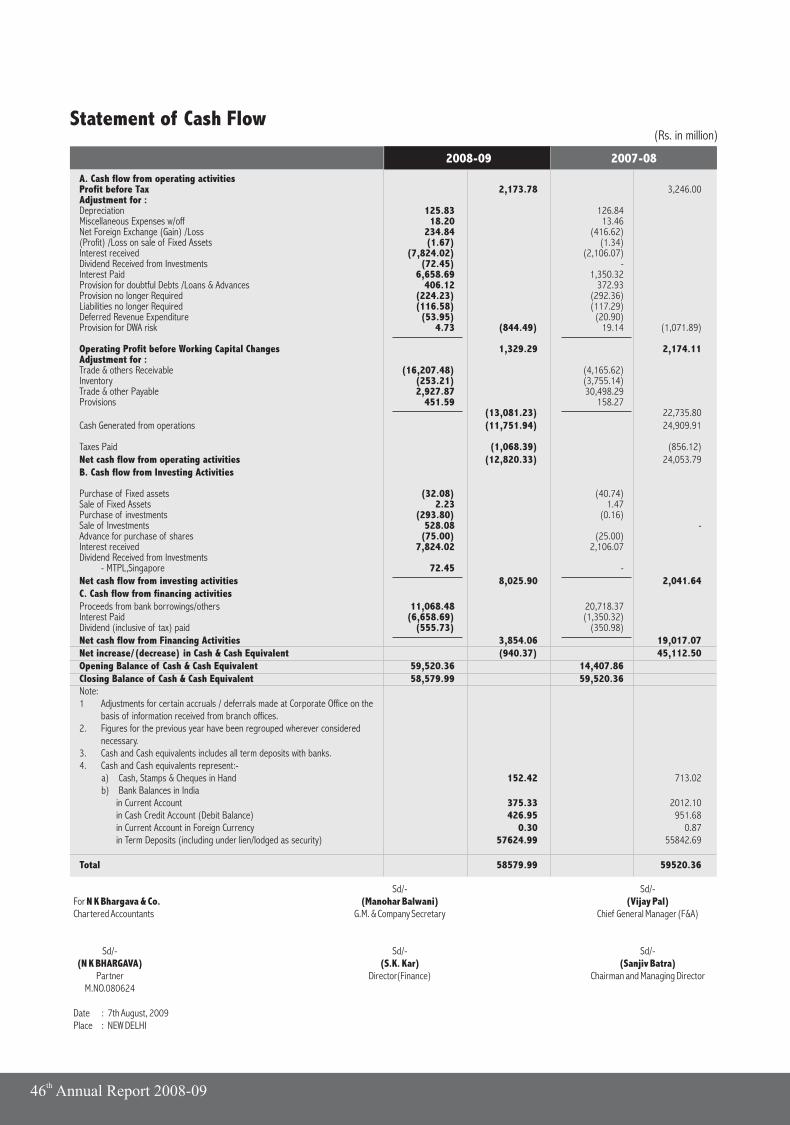
(Rs. in million)Statement of Cash Flow
Sd/- Sd/-For N K Bhargava & Co. (Manohar Balwani) (Vijay Pal)Chartered Accountants G.M. & Company Secretary Chief General Manager (F&A)
Sd/- Sd/- Sd/-(N K BHARGAVA) (S.K. Kar) (Sanjiv Batra)
Partner Director(Finance) Chairman and Managing DirectorM.NO.080624
Date : 7th August, 2009Place : NEW DELHI
A. Cash flow from operating activities Profit before Tax Adjustment for :Depreciation 125.83 126.84Miscellaneous Expenses w/off 18.20 13.46Net Foreign Exchange (Gain) /Loss 234.84 (416.62)(Profit) /Loss on sale of Fixed Assets (1.67) (1.34)Interest received (7,824.02) (2,106.07)Dividend Received from Investments (72.45) - Interest Paid 6,658.69 1,350.32Provision for doubtful Debts /Loans & Advances 406.12 372.93Provision no longer Required (224.23) (292.36)Liabilities no longer Required (116.58) (117.29)Deferred Revenue Expenditure (53.95) (20.90)Provision for DWA risk 4.73 (844.49) 19.14 (1,071.89)
Operating Profit before Working Capital Changes 1,329.29 2,174.11Adjustment for :Trade & others Receivable (16,207.48) (4,165.62)Inventory (253.21) (3,755.14)Trade & other Payable 2,927.87 30,498.29Provisions 451.59 158.27
(13,081.23) 22,735.80Cash Generated from operations (11,751.94) 24,909.91
Taxes Paid (1,068.39) (856.12)Net cash flow from operating activities (12,820.33) 24,053.79B. Cash flow from Investing Activities
Purchase of Fixed assets (32.08) (40.74)Sale of Fixed Assets 2.23 1.47Purchase of investments (293.80) (0.16)Sale of Investments 528.08 -Advance for purchase of shares (75.00) (25.00)Interest received 7,824.02 2,106.07Dividend Received from Investments
- MTPL,Singapore 72.45 -Net cash flow from investing activities 8,025.90 2,041.64C. Cash flow from financing activitiesProceeds from bank borrowings/others 11,068.48 20,718.37Interest Paid (6,658.69) (1,350.32)Dividend (inclusive of tax) paid (555.73) (350.98)Net cash flow from Financing Activities 3,854.06 19,017.07Net increase/(decrease) in Cash & Cash Equivalent (940.37) 45,112.50Opening Balance of Cash & Cash Equivalent 59,520.36 14,407.86 Closing Balance of Cash & Cash Equivalent 58,579.99 59,520.36 Note:1 Adjustments for certain accruals / deferrals made at Corporate Office on the
basis of information received from branch offices.2. Figures for the previous year have been regrouped wherever considered
necessary.3. Cash and Cash equivalents includes all term deposits with banks.4. Cash and Cash equivalents represent:-
a) Cash, Stamps & Cheques in Hand 152.42 713.02b) Bank Balances in India
in Current Account 375.33 2012.10in Cash Credit Account (Debit Balance) 426.95 951.68in Current Account in Foreign Currency 0.30 0.87in Term Deposits (including under lien/lodged as security) 57624.99 55842.69
Total 58579.99 59520.36
2,173.78 3,246.00
2008-09 2007-08
th46 Annual Report 2008-09
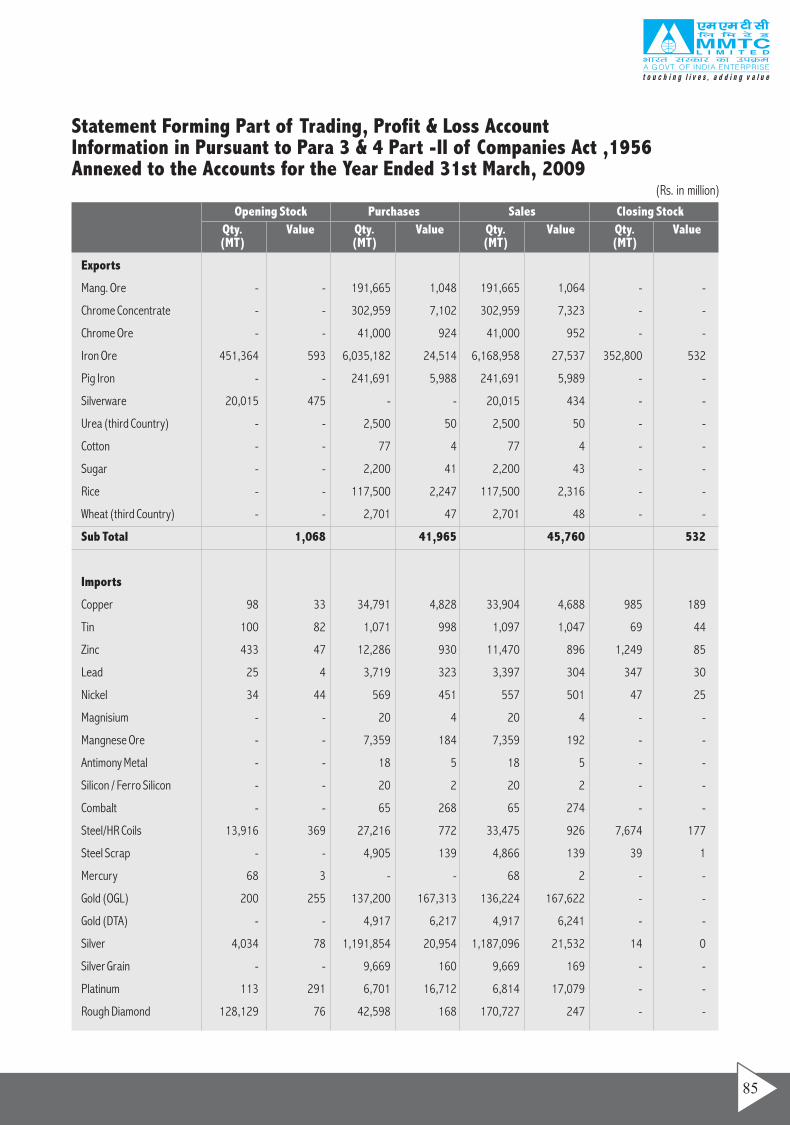
Statement Forming Part of Trading, Profit & Loss AccountInformation in Pursuant to Para 3 & 4 Part -II of Companies Act ,1956Annexed to the Accounts for the Year Ended 31st March, 2009
(Rs. in million)
Exports
Mang. Ore - - 191,665 1,048 191,665 1,064 - -
Chrome Concentrate - - 302,959 7,102 302,959 7,323 - -
Chrome Ore - - 41,000 924 41,000 952 - -
Iron Ore 451,364 593 6,035,182 24,514 6,168,958 27,537 352,800 532
Pig Iron - - 241,691 5,988 241,691 5,989 - -
Silverware 20,015 475 - - 20,015 434 - -
Urea (third Country) - - 2,500 50 2,500 50 - -
Cotton - - 77 4 77 4 - -
Sugar - - 2,200 41 2,200 43 - -
Rice - - 117,500 2,247 117,500 2,316 - -
Wheat (third Country) - - 2,701 47 2,701 48 - -
Sub Total 1,068 41,965 45,760 532
Imports
Copper 98 33 34,791 4,828 33,904 4,688 985 189
Tin 100 82 1,071 998 1,097 1,047 69 44
Zinc 433 47 12,286 930 11,470 896 1,249 85
Lead 25 4 3,719 323 3,397 304 347 30
Nickel 34 44 569 451 557 501 47 25
Magnisium - - 20 4 20 4 - -
Mangnese Ore - - 7,359 184 7,359 192 - -
Antimony Metal - - 18 5 18 5 - -
Silicon / Ferro Silicon - - 20 2 20 2 - -
Combalt - - 65 268 65 274 - -
Steel/HR Coils 13,916 369 27,216 772 33,475 926 7,674 177
Steel Scrap - - 4,905 139 4,866 139 39 1
Mercury 68 3 - - 68 2 - -
Gold (OGL) 200 255 137,200 167,313 136,224 167,622 - -
Gold (DTA) - - 4,917 6,217 4,917 6,241 - -
Silver 4,034 78 1,191,854 20,954 1,187,096 21,532 14 0
Silver Grain - - 9,669 160 9,669 169 - -
Platinum 113 291 6,701 16,712 6,814 17,079 - -
Rough Diamond 128,129 76 42,598 168 170,727 247 - -
Opening Stock Purchases Sales Closing Stock
Qty. Value Qty. Value Qty. Value Qty. Value(MT) (MT) (MT) (MT)
85
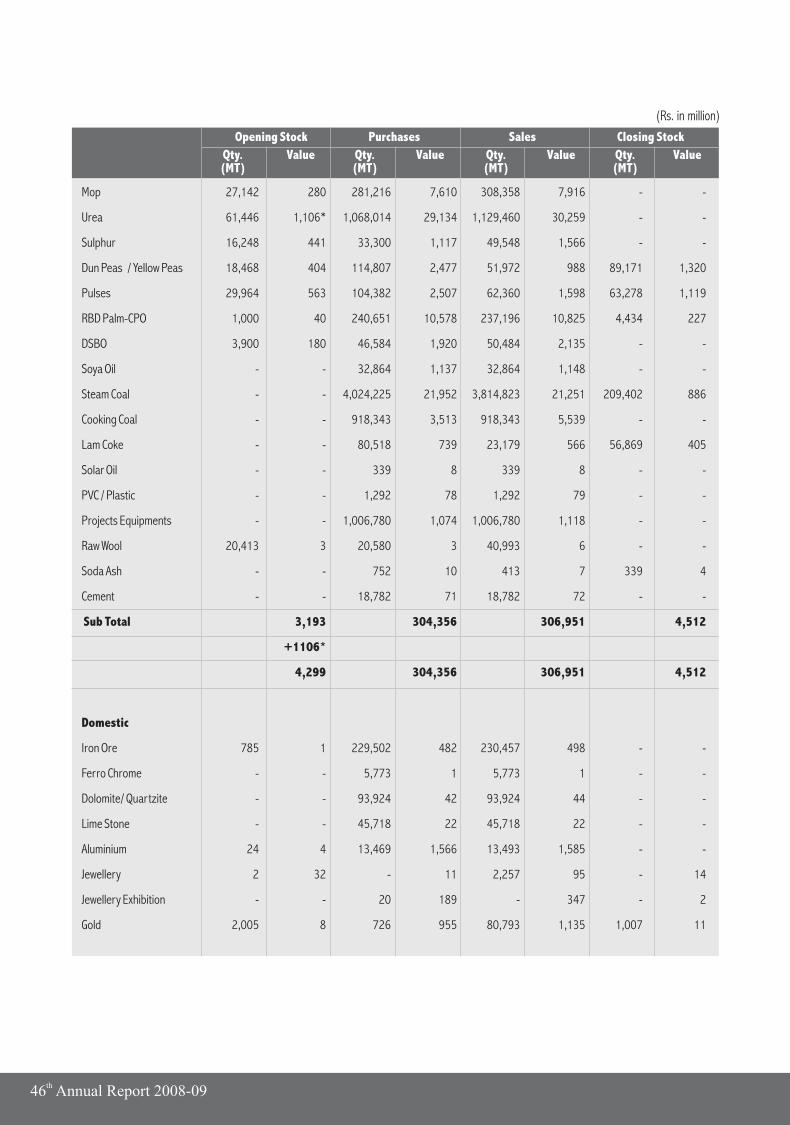
(Rs. in million)
Mop 27,142 280 281,216 7,610 308,358 7,916 - -
Urea 61,446 1,106* 1,068,014 29,134 1,129,460 30,259 - -
Sulphur 16,248 441 33,300 1,117 49,548 1,566 - -
Dun Peas / Yellow Peas 18,468 404 114,807 2,477 51,972 988 89,171 1,320
Pulses 29,964 563 104,382 2,507 62,360 1,598 63,278 1,119
RBD Palm-CPO 1,000 40 240,651 10,578 237,196 10,825 4,434 227
DSBO 3,900 180 46,584 1,920 50,484 2,135 - -
Soya Oil - - 32,864 1,137 32,864 1,148 - -
Steam Coal - - 4,024,225 21,952 3,814,823 21,251 209,402 886
Cooking Coal - - 918,343 3,513 918,343 5,539 - -
Lam Coke - - 80,518 739 23,179 566 56,869 405
Solar Oil - - 339 8 339 8 - -
PVC / Plastic - - 1,292 78 1,292 79 - -
Projects Equipments - - 1,006,780 1,074 1,006,780 1,118 - -
Raw Wool 20,413 3 20,580 3 40,993 6 - -
Soda Ash - - 752 10 413 7 339 4
Cement - - 18,782 71 18,782 72 - -
Sub Total 3,193 304,356 306,951 4,512
+1106*
4,299 304,356 306,951 4,512
Domestic
Iron Ore 785 1 229,502 482 230,457 498 - -
Ferro Chrome - - 5,773 1 5,773 1 - -
Dolomite/ Quartzite - - 93,924 42 93,924 44 - -
Lime Stone - - 45,718 22 45,718 22 - -
Aluminium 24 4 13,469 1,566 13,493 1,585 - -
Jewellery 2 32 - 11 2,257 95 - 14
Jewellery Exhibition - - 20 189 - 347 - 2
Gold 2,005 8 726 955 80,793 1,135 1,007 11
Opening Stock Purchases Sales Closing Stock
Qty. Value Qty. Value Qty. Value Qty. Value(MT) (MT) (MT) (MT)
th46 Annual Report 2008-09
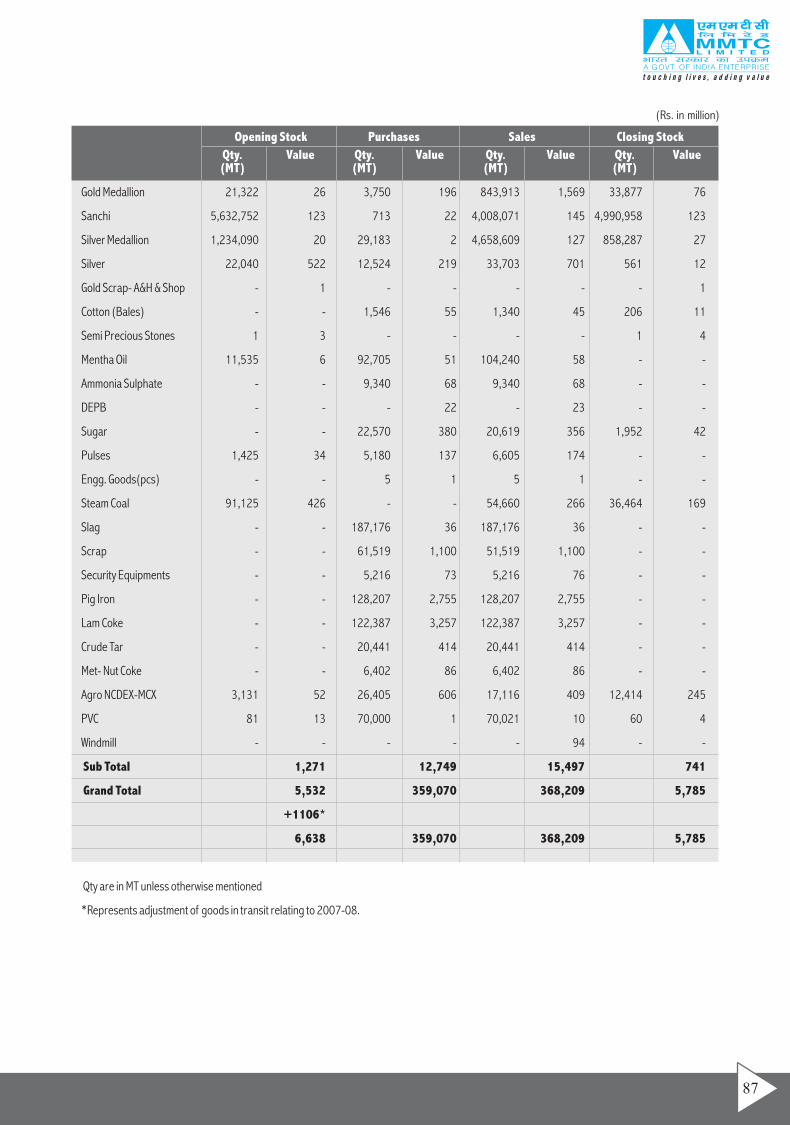
87
(Rs. in million)
Gold Medallion 21,322 26 3,750 196 843,913 1,569 33,877 76
Sanchi 5,632,752 123 713 22 4,008,071 145 4,990,958 123
Silver Medallion 1,234,090 20 29,183 2 4,658,609 127 858,287 27
Silver 22,040 522 12,524 219 33,703 701 561 12
Gold Scrap- A&H & Shop - 1 - - - - - 1
Cotton (Bales) - - 1,546 55 1,340 45 206 11
Semi Precious Stones 1 3 - - - - 1 4
Mentha Oil 11,535 6 92,705 51 104,240 58 - -
Ammonia Sulphate - - 9,340 68 9,340 68 - -
DEPB - - - 22 - 23 - -
Sugar - - 22,570 380 20,619 356 1,952 42
Pulses 1,425 34 5,180 137 6,605 174 - -
Engg. Goods(pcs) - - 5 1 5 1 - -
Steam Coal 91,125 426 - - 54,660 266 36,464 169
Slag - - 187,176 36 187,176 36 - -
Scrap - - 61,519 1,100 51,519 1,100 - -
Security Equipments - - 5,216 73 5,216 76 - -
Pig Iron - - 128,207 2,755 128,207 2,755 - -
Lam Coke - - 122,387 3,257 122,387 3,257 - -
Crude Tar - - 20,441 414 20,441 414 - -
Met- Nut Coke - - 6,402 86 6,402 86 - -
Agro NCDEX-MCX 3,131 52 26,405 606 17,116 409 12,414 245
PVC 81 13 70,000 1 70,021 10 60 4
Windmill - - - - - 94 - -
Sub Total 1,271 12,749 15,497 741
Grand Total 5,532 359,070 368,209 5,785
+1106*
6,638 359,070 368,209 5,785
Qty are in MT unless otherwise mentioned
*Represents adjustment of goods in transit relating to 2007-08.
Opening Stock Purchases Sales Closing Stock
Qty. Value Qty. Value Qty. Value Qty. Value(MT) (MT) (MT) (MT)
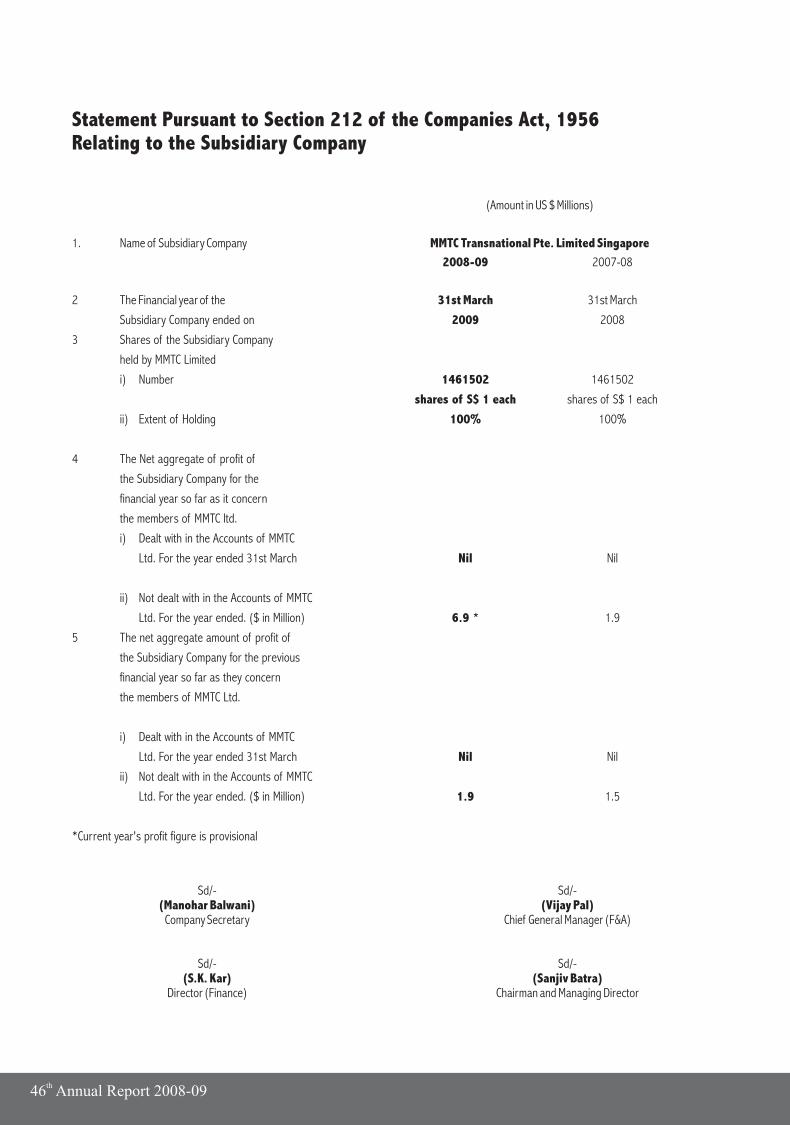
th46 Annual Report 2008-09
(Amount in US $ Millions)
MMTC Transnational Pte. Limited Singapore
2008-09 2007-08
2 The Financial year of the 31st March 31st March
Subsidiary Company ended on 2009 2008
3 Shares of the Subsidiary Company
held by MMTC Limited
i) Number 1461502 1461502
shares of S$ 1 each shares of S$ 1 each
ii) Extent of Holding 100% 100%
4 The Net aggregate of profit of
the Subsidiary Company for the
financial year so far as it concern
the members of MMTC ltd.
i) Dealt with in the Accounts of MMTC
Ltd. For the year ended 31st March Nil Nil
ii) Not dealt with in the Accounts of MMTC
Ltd. For the year ended. ($ in Million) 6.9 * 1.9
5 The net aggregate amount of profit of
the Subsidiary Company for the previous
financial year so far as they concern
the members of MMTC Ltd.
i) Dealt with in the Accounts of MMTC
Ltd. For the year ended 31st March Nil Nil
ii) Not dealt with in the Accounts of MMTC
Ltd. For the year ended. ($ in Million) 1.9 1.5
*Current year's profit figure is provisional
(Vijay Pal)
1. Name of Subsidiary Company
Sd/- Sd/-(Manohar Balwani)
Company Secretary Chief General Manager (F&A)
Sd/- Sd/-(S.K. Kar) (Sanjiv Batra)
Director (Finance) Chairman and Managing Director
Statement Pursuant to Section 212 of the Companies Act, 1956Relating to the Subsidiary Company
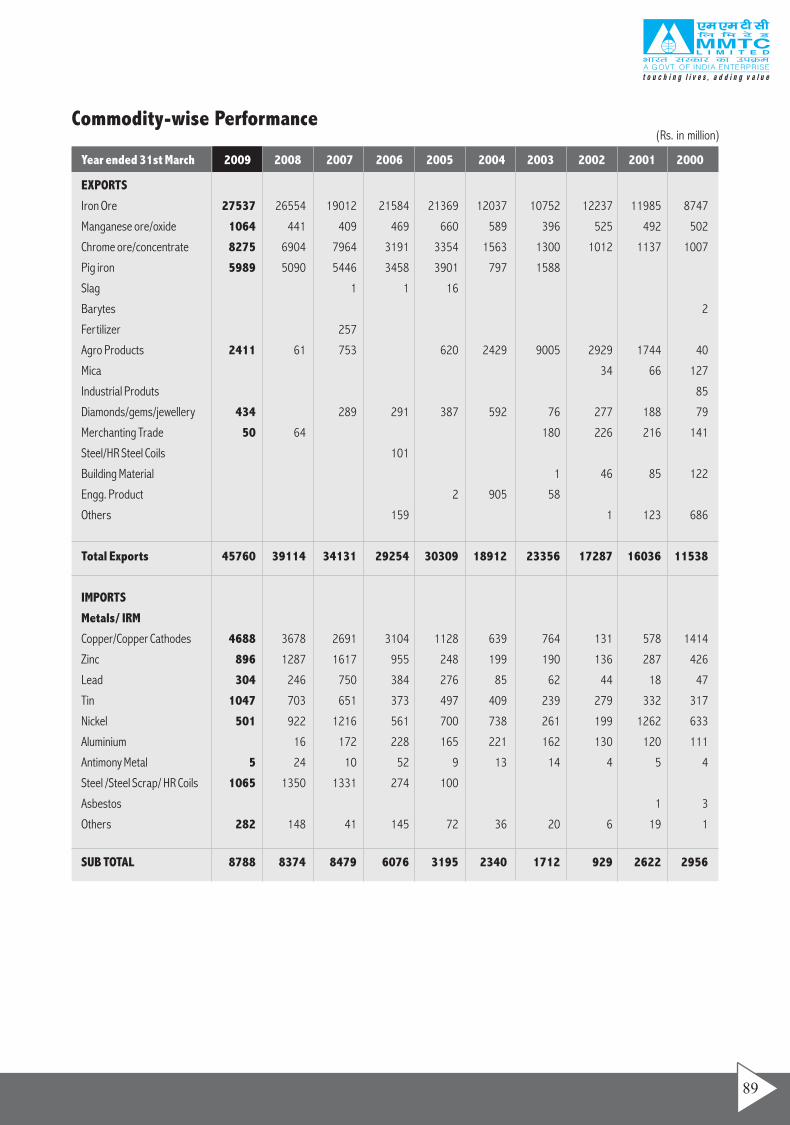
(Rs. in million)Commodity-wise Performance
Year ended 31st March 2009 2008 2007 2006 2005 2004 2003 2002 2001 2000
EXPORTS
Iron Ore 27537 26554 19012 21584 21369 12037 10752 12237 11985 8747
Manganese ore/oxide 1064 441 409 469 660 589 396 525 492 502
Chrome ore/concentrate 8275 6904 7964 3191 3354 1563 1300 1012 1137 1007
Pig iron 5989 5090 5446 3458 3901 797 1588
Slag 1 1 16
Barytes 2
Fertilizer 257
Agro Products 2411 61 753 620 2429 9005 2929 1744 40
Mica 34 66 127
Industrial Produts 85
Diamonds/gems/jewellery 434 289 291 387 592 76 277 188 79
Merchanting Trade 50 64 180 226 216 141
Steel/HR Steel Coils 101
Building Material 1 46 85 122
Engg. Product 2 905 58
Others 159 1 123 686
Total Exports 45760 39114 34131 29254 30309 18912 23356 17287 16036 11538
IMPORTS
Metals/ IRM
Copper/Copper Cathodes 4688 3678 2691 3104 1128 639 764 131 578 1414
Zinc 896 1287 1617 955 248 199 190 136 287 426
Lead 304 246 750 384 276 85 62 44 18 47
Tin 1047 703 651 373 497 409 239 279 332 317
Nickel 501 922 1216 561 700 738 261 199 1262 633
Aluminium 16 172 228 165 221 162 130 120 111
Antimony Metal 5 24 10 52 9 13 14 4 5 4
Steel /Steel Scrap/ HR Coils 1065 1350 1331 274 100
Asbestos 1 3
Others 282 148 41 145 72 36 20 6 19 1
SUB TOTAL 8788 8374 8479 6076 3195 2340 1712 929 2622 2956
89
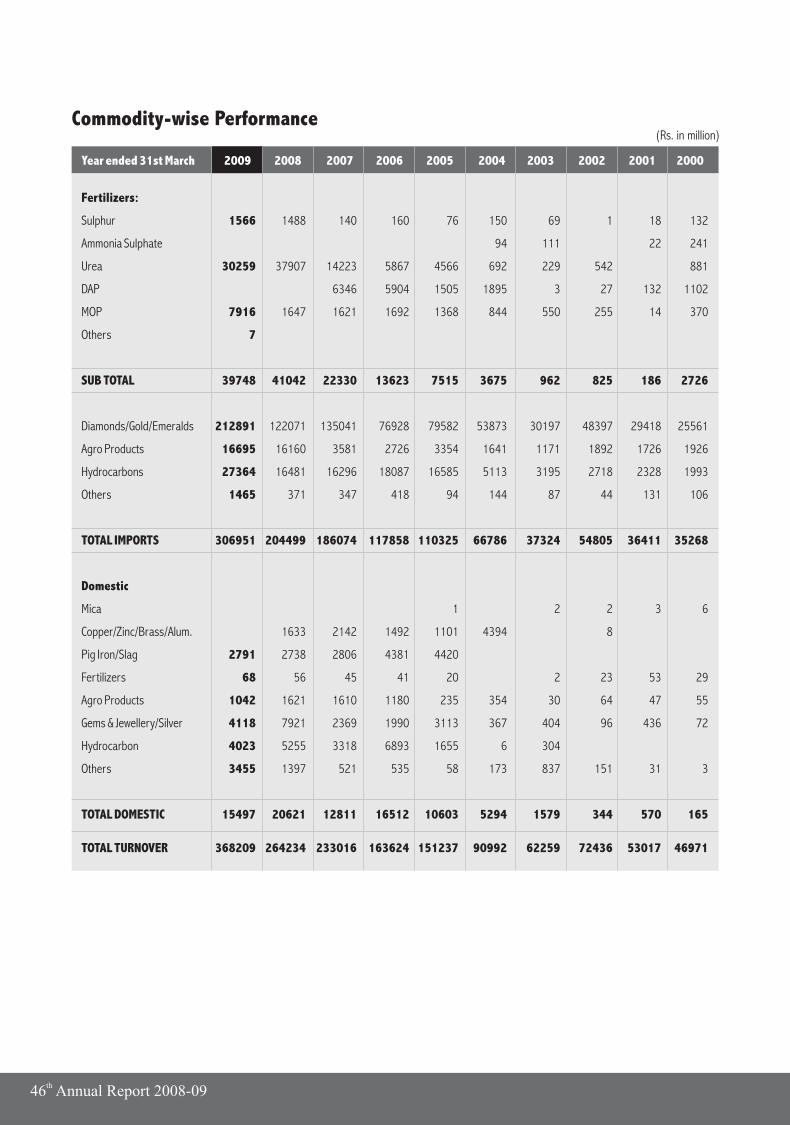
(Rs. in million)Commodity-wise Performance
Year ended 31st March 2009 2008 2007 2006 2005 2004 2003 2002 2001 2000
Fertilizers:
Sulphur 1566 1488 140 160 76 150 69 1 18 132
Ammonia Sulphate 94 111 22 241
Urea 30259 37907 14223 5867 4566 692 229 542 881
DAP 6346 5904 1505 1895 3 27 132 1102
MOP 7916 1647 1621 1692 1368 844 550 255 14 370
Others 7
SUB TOTAL 39748 41042 22330 13623 7515 3675 962 825 186 2726
Diamonds/Gold/Emeralds 212891 122071 135041 76928 79582 53873 30197 48397 29418 25561
Agro Products 16695 16160 3581 2726 3354 1641 1171 1892 1726 1926
Hydrocarbons 27364 16481 16296 18087 16585 5113 3195 2718 2328 1993
Others 1465 371 347 418 94 144 87 44 131 106
TOTAL IMPORTS 306951 204499 186074 117858 110325 66786 37324 54805 36411 35268
Domestic
Mica 1 2 2 3 6
Copper/Zinc/Brass/Alum. 1633 2142 1492 1101 4394 8
Pig Iron/Slag 2791 2738 2806 4381 4420
Fertilizers 68 56 45 41 20 2 23 53 29
Agro Products 1042 1621 1610 1180 235 354 30 64 47 55
Gems & Jewellery/Silver 4118 7921 2369 1990 3113 367 404 96 436 72
Hydrocarbon 4023 5255 3318 6893 1655 6 304
Others 3455 1397 521 535 58 173 837 151 31 3
TOTAL DOMESTIC 15497 20621 12811 16512 10603 5294 1579 344 570 165
TOTAL TURNOVER 368209 264234 233016 163624 151237 90992 62259 72436 53017 46971
th46 Annual Report 2008-09
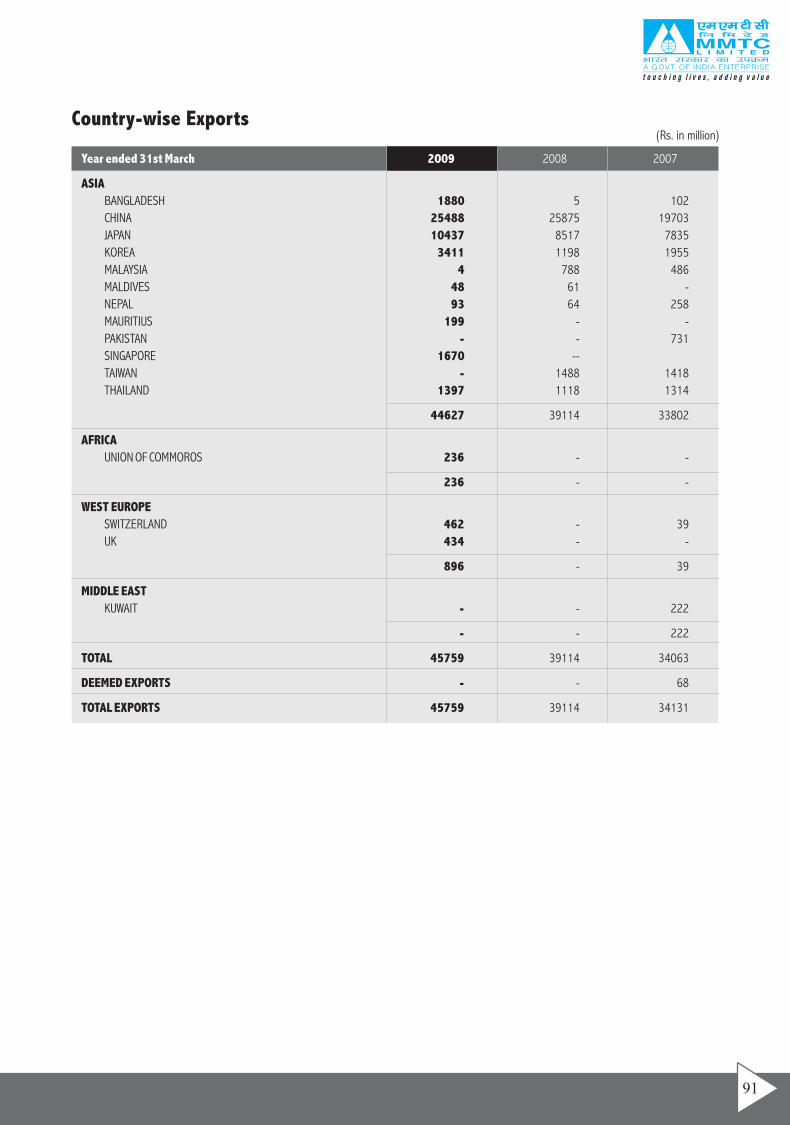
(Rs. in million)Country-wise Exports
Year ended 31st March 2009 2008 2007
ASIA
BANGLADESH 1880 5 102
CHINA 25488 25875 19703
JAPAN 10437 8517 7835
KOREA 3411 1198 1955
MALAYSIA 4 788 486
MALDIVES 48 61 -
NEPAL 93 64 258
MAURITIUS 199 - -
PAKISTAN - - 731
SINGAPORE 1670 --
TAIWAN - 1488 1418
THAILAND 1397 1118 1314
44627 39114 33802
AFRICA
UNION OF COMMOROS 236 - -
236 - -
WEST EUROPE
SWITZERLAND 462 - 39
UK 434 - -
896 - 39
MIDDLE EAST
KUWAIT - - 222
- - 222
TOTAL 45759 39114 34063
DEEMED EXPORTS - - 68
TOTAL EXPORTS 45759 39114 34131
91
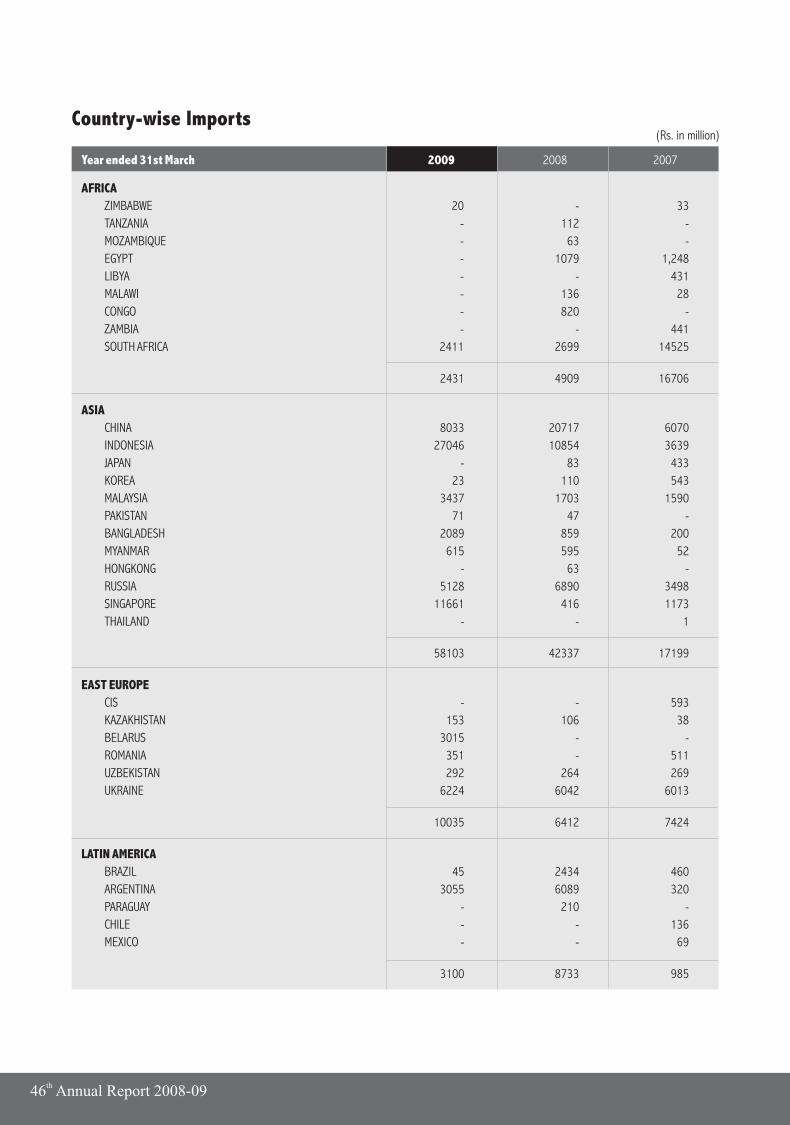
Year ended 31st March 2009 2008 2007
AFRICA
ZIMBABWE 20 - 33
TANZANIA - 112 -
MOZAMBIQUE - 63 -
EGYPT - 1079 1,248
LIBYA - - 431
MALAWI - 136 28
CONGO - 820 -
ZAMBIA - - 441
SOUTH AFRICA 2411 2699 14525
2431 4909 16706
ASIA
CHINA 8033 20717 6070
INDONESIA 27046 10854 3639
JAPAN - 83 433
KOREA 23 110 543
MALAYSIA 3437 1703 1590
PAKISTAN 71 47 -
BANGLADESH 2089 859 200
MYANMAR 615 595 52
HONGKONG - 63 -
RUSSIA 5128 6890 3498
SINGAPORE 11661 416 1173
THAILAND - - 1
58103 42337 17199
EAST EUROPE
CIS - - 593
KAZAKHISTAN 153 106 38
BELARUS 3015 - -
ROMANIA 351 - 511
UZBEKISTAN 292 264 269
UKRAINE 6224 6042 6013
10035 6412 7424
LATIN AMERICA
BRAZIL 45 2434 460
ARGENTINA 3055 6089 320
PARAGUAY - 210 -
CHILE - - 136
MEXICO - - 69
3100 8733 985
(Rs. in million)Country-wise Imports
th46 Annual Report 2008-09
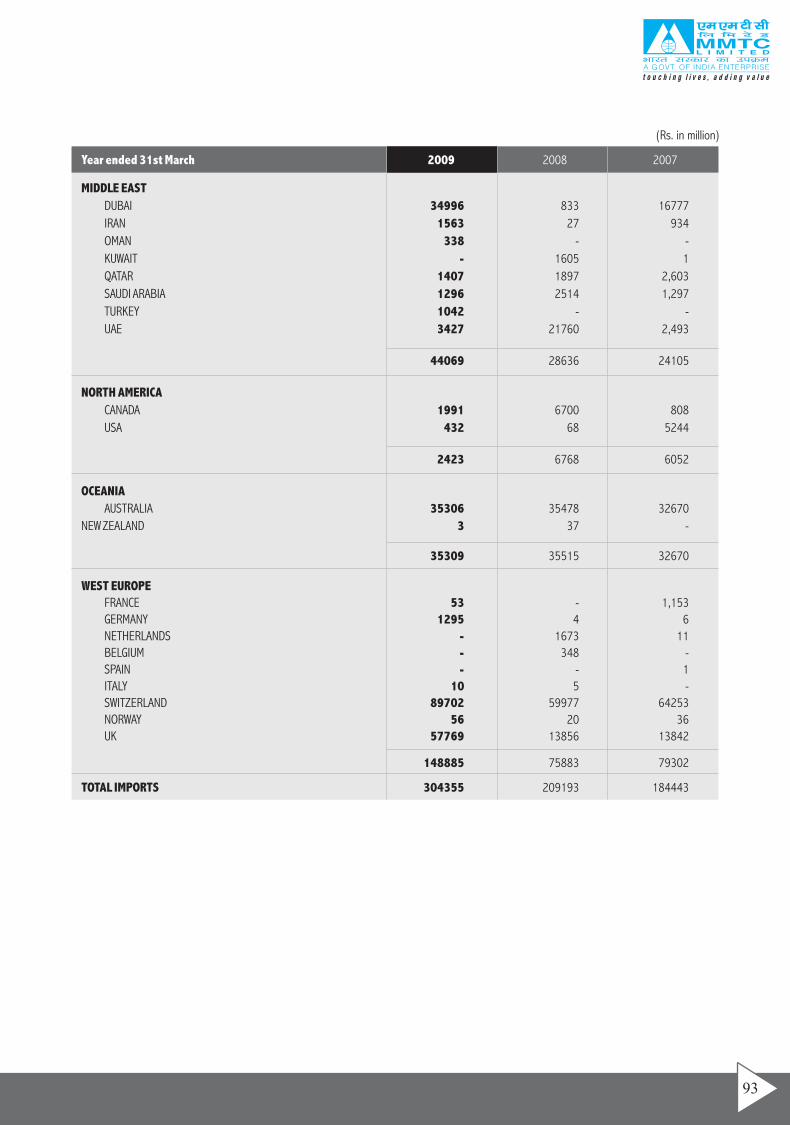
(Rs. in million)
Year ended 31st March 2009 2008 2007
MIDDLE EAST
DUBAI 34996 833 16777
IRAN 1563 27 934
OMAN 338 - -
KUWAIT - 1605 1
QATAR 1407 1897 2,603
SAUDI ARABIA 1296 2514 1,297
TURKEY 1042 - -
UAE 3427 21760 2,493
44069 28636 24105
NORTH AMERICA
CANADA 1991 6700 808
USA 432 68 5244
2423 6768 6052
OCEANIA
AUSTRALIA 35306 35478 32670
NEW ZEALAND 3 37 -
35309 35515 32670
WEST EUROPE
FRANCE 53 - 1,153
GERMANY 1295 4 6
NETHERLANDS - 1673 11
BELGIUM - 348 -
SPAIN - - 1
ITALY 10 5 -
SWITZERLAND 89702 59977 64253
NORWAY 56 20 36
UK 57769 13856 13842
148885 75883 79302
TOTAL IMPORTS 304355 209193 184443
93
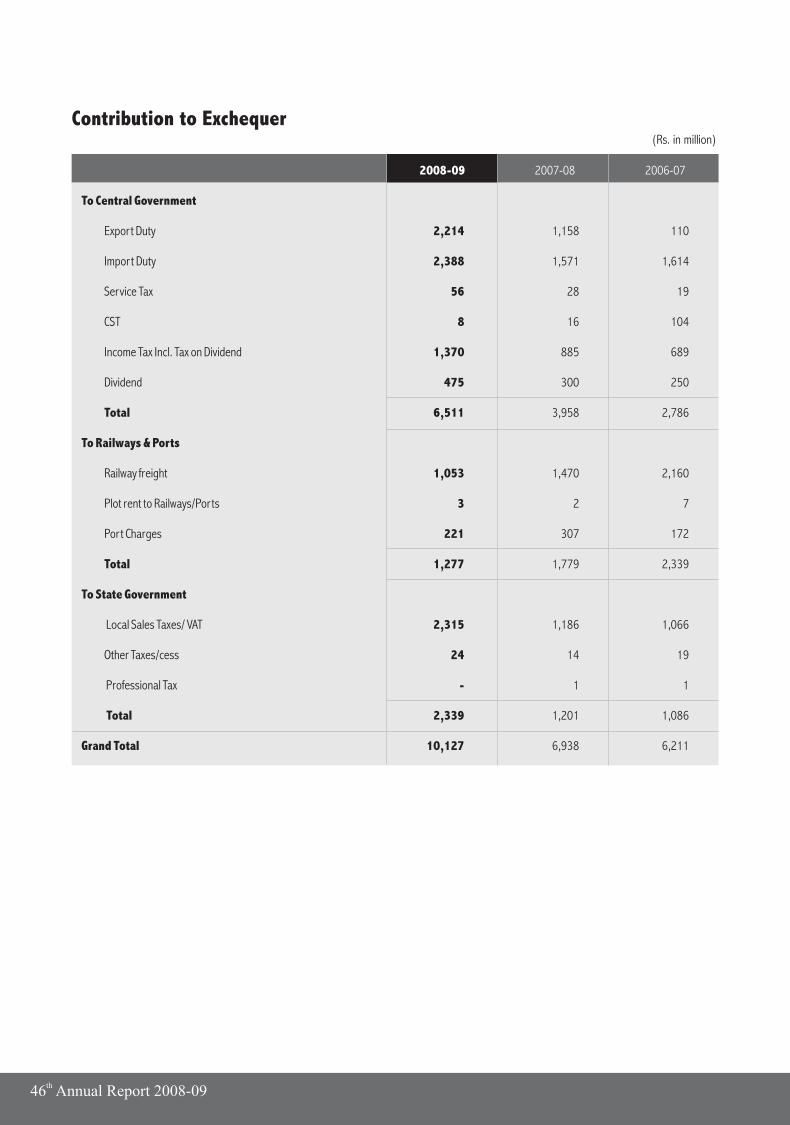
(Rs. in million)
Contribution to Exchequer
To Central Government
2008-09 2007-08 2006-07
Export Duty 2,214 1,158 110
Import Duty 2,388 1,571 1,614
Service Tax 56 28 19
CST 8 16 104
Income Tax Incl. Tax on Dividend 1,370 885 689
Dividend 475 300 250
Total 6,511 3,958 2,786
To Railways & Ports
Railway freight 1,053 1,470 2,160
Plot rent to Railways/Ports 3 2 7
Port Charges 221 307 172
Total 1,277 1,779 2,339
To State Government
Local Sales Taxes/ VAT 2,315 1,186 1,066
Other Taxes/cess 24 14 19
Professional Tax - 1 1
Total 2,339 1,201 1,086
Grand Total 10,127 6,938 6,211
th46 Annual Report 2008-09
financial statements
2008-09
MMTC Transnational PTE. LTD.Singapore
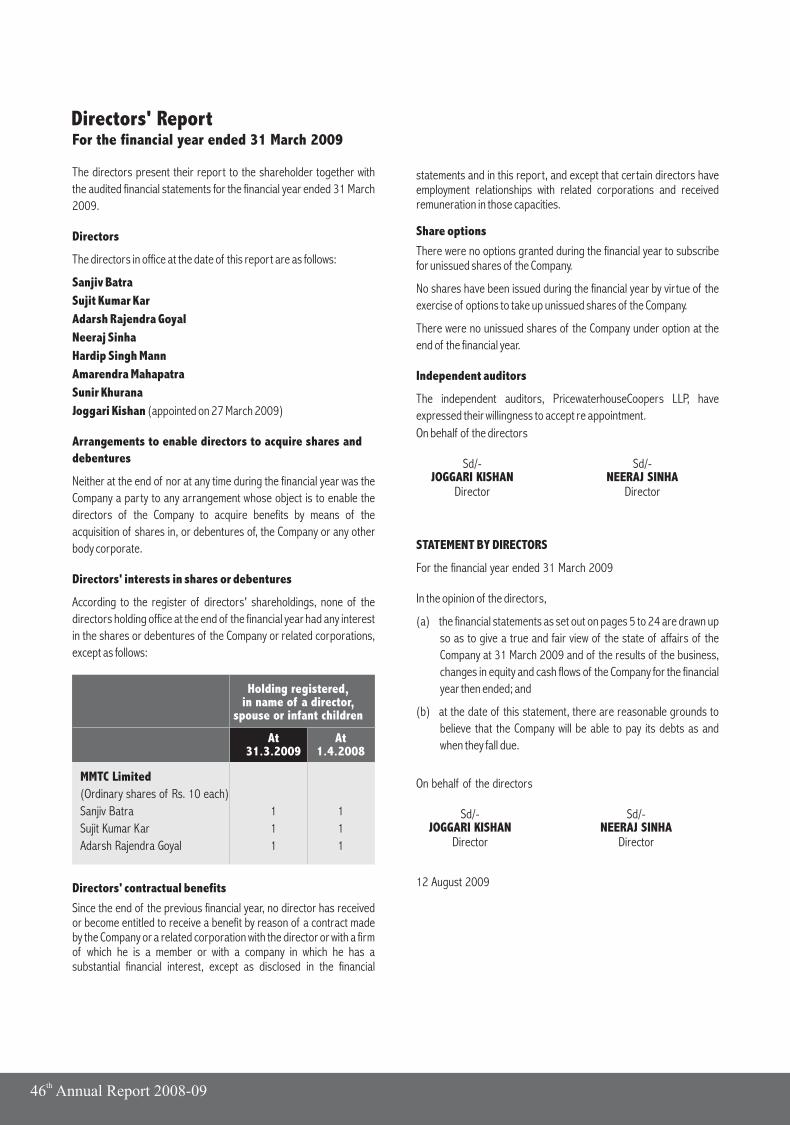
For the financial year ended 31 March 2009
statements and in this report, and except that certain directors have employment relationships with related corporations and received remuneration in those capacities.
Share options
There were no options granted during the financial year to subscribe for unissued shares of the Company.
No shares have been issued during the financial year by virtue of the
exercise of options to take up unissued shares of the Company.
There were no unissued shares of the Company under option at the
end of the financial year.
Independent auditors
The independent auditors, PricewaterhouseCoopers LLP, have
expressed their willingness to accept re appointment.
On behalf of the directors
STATEMENT BY DIRECTORS
For the financial year ended 31 March 2009
In the opinion of the directors,
(a) the financial statements as set out on pages 5 to 24 are drawn up
so as to give a true and fair view of the state of affairs of the
Company at 31 March 2009 and of the results of the business,
changes in equity and cash flows of the Company for the financial
year then ended; and
(b) at the date of this statement, there are reasonable grounds to
believe that the Company will be able to pay its debts as and
when they fall due.
On behalf of the directors
Sd/- Sd/-JOGGARI KISHAN NEERAJ SINHA
Director Director
Sd/- Sd/-JOGGARI KISHAN NEERAJ SINHA
Director Director
12 August 2009
The directors present their report to the shareholder together with
the audited financial statements for the financial year ended 31 March
2009.
Directors
The directors in office at the date of this report are as follows:
Sanjiv Batra
Sujit Kumar Kar
Adarsh Rajendra Goyal
Neeraj Sinha
Hardip Singh Mann
Amarendra Mahapatra
Sunir Khurana
Joggari Kishan (appointed on 27 March 2009)
Arrangements to enable directors to acquire shares and
debentures
Neither at the end of nor at any time during the financial year was the
Company a party to any arrangement whose object is to enable the
directors of the Company to acquire benefits by means of the
acquisition of shares in, or debentures of, the Company or any other
body corporate.
Directors' interests in shares or debentures
According to the register of directors' shareholdings, none of the
directors holding office at the end of the financial year had any interest
in the shares or debentures of the Company or related corporations,
except as follows:
Directors' contractual benefits
Since the end of the previous financial year, no director has received or become entitled to receive a benefit by reason of a contract made by the Company or a related corporation with the director or with a firm of which he is a member or with a company in which he has a substantial financial interest, except as disclosed in the financial
Directors' Report
MMTC Limited
(Ordinary shares of Rs. 10 each)
Sanjiv Batra 1 1
Sujit Kumar Kar 1 1
Adarsh Rajendra Goyal 1 1
Holding registered,in name of a director,
spouse or infant children
At At31.3.2009 1.4.2008
th46 Annual Report 2008-09
INDEPENDENT AUDITORS' REPORT TO THE SHAREHOLDER OF
MMTC TRANSNATIONAL PTE LTD
We have audited the financial statements of MMTC Transnational Pte
Ltd set out on pages 5 to 24, which comprise the balance sheet as at
31 March 2009, the income statement, statement of changes in
equity and cash flow statement for the financial year then ended, and a
summary of significant accounting policies and other explanatory
notes.
Management's Responsibility for the Financial Statements
Management is responsible for the preparation and fair presentation
of these financial statements in accordance with the provisions of the
Singapore Companies Act (Cap. 50) (the "Act") and Singapore
Financial Reporting Standards. This responsibility includes:
(a) devising and maintaining a system of internal accounting
control sufficient to provide a reasonable assurance that assets
are safeguarded against loss from unauthorised use or
disposition; and transactions are properly authorised and that
they are recorded as necessary to permit the preparation of
true and fair profit and loss accounts and balance sheets and to
maintain accountability of assets;
(b) selecting and applying appropriate accounting policies; and
(c) making accounting estimates that are reasonable in the
circumstances.
Auditors' Responsibility
Our responsibility is to express an opinion on these financial
statements based on our audit. We conducted our audit in accordance
with Singapore Standards on Auditing. Those Standards require that
we comply with ethical requirements and plan and perform the audit to
obtain reasonable assurance as to whether the financial statements
are free from material misstatement.
An audit involves performing procedures to obtain audit evidence
about the amounts and disclosures in the financial statements. The
procedures selected depend on the auditor's judgement, including
the assessment of the risks of material misstatement of the financial
statements, whether due to fraud or error. In making those risk
assessments, the auditor considers internal control relevant to the
entity's preparation and fair presentation of the financial statements
in order to design audit procedures that are appropriate in the
circumstances, but not for the purpose of expressing an opinion on
the effectiveness of the entity's internal control. An audit also includes
evaluating the appropriateness of accounting policies used and the
reasonableness of accounting estimates made by management, as
well as evaluating the overall presentation of the financial statements.
We believe that the audit evidence we have obtained is sufficient and
appropriate to provide a basis for our audit opinion.
Opinion
In our opinion,
(a) the financial statements of the Company are properly drawn up
in accordance with the provisions of the Act and Singapore
Financial Reporting Standards so as to give a true and fair view
of the state of affairs of the Company as at 31 March 2009, and
its results, changes in equity and cash flows for the financial year
ended on that date; and
(b) the accounting and other records required by the Act to be kept
by the Company have been properly kept in accordance with the
provisions of the Act.
Sd/-PricewaterhouseCoopers LLPPublic Accountants and Certified Public Accountants
Singapore, 12 Aug 2009
97
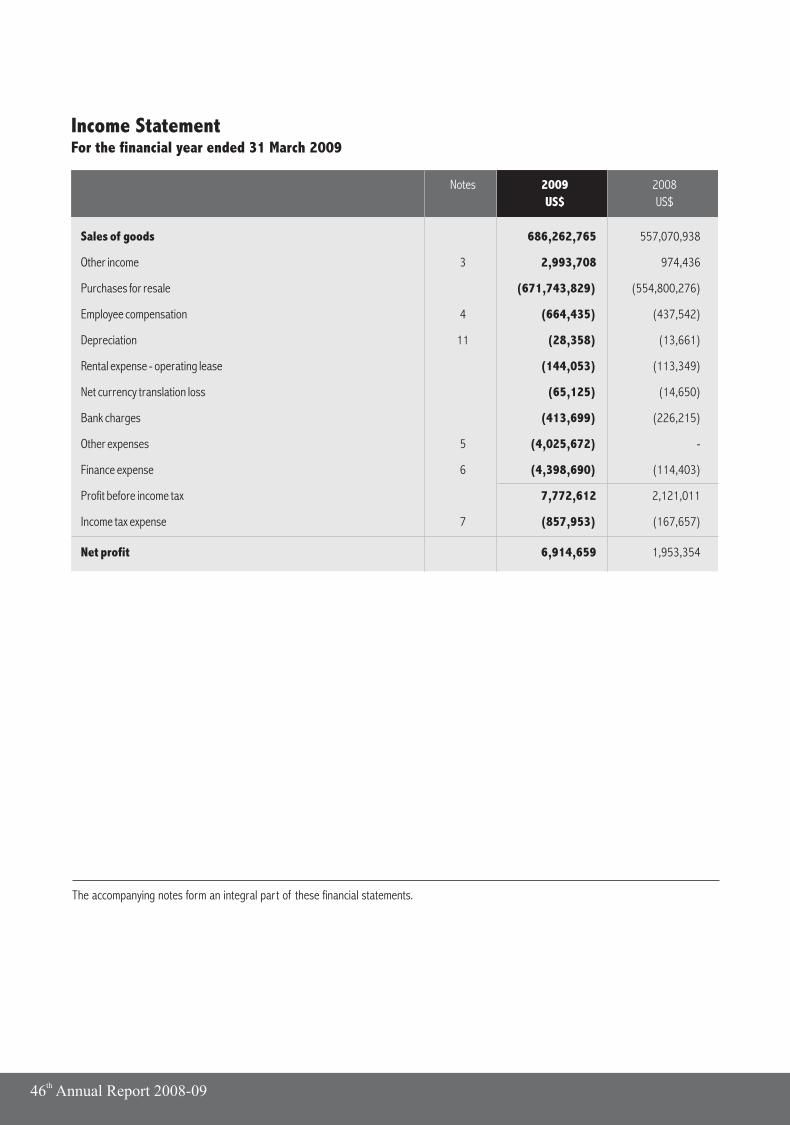
Sales of goods
Notes 2009 2008
US$ US$
686,262,765 557,070,938
Other income 3 2,993,708 974,436
Purchases for resale (671,743,829) (554,800,276)
Employee compensation 4 (664,435) (437,542)
Depreciation 11 (28,358) (13,661)
Rental expense - operating lease (144,053) (113,349)
Net currency translation loss (65,125) (14,650)
Bank charges (413,699) (226,215)
Other expenses 5 (4,025,672) -
Finance expense 6 (4,398,690) (114,403)
Profit before income tax 7,772,612 2,121,011
Income tax expense 7 (857,953) (167,657)
Net profit 6,914,659 1,953,354
Income StatementFor the financial year ended 31 March 2009
The accompanying notes form an integral part of these financial statements.
th46 Annual Report 2008-09
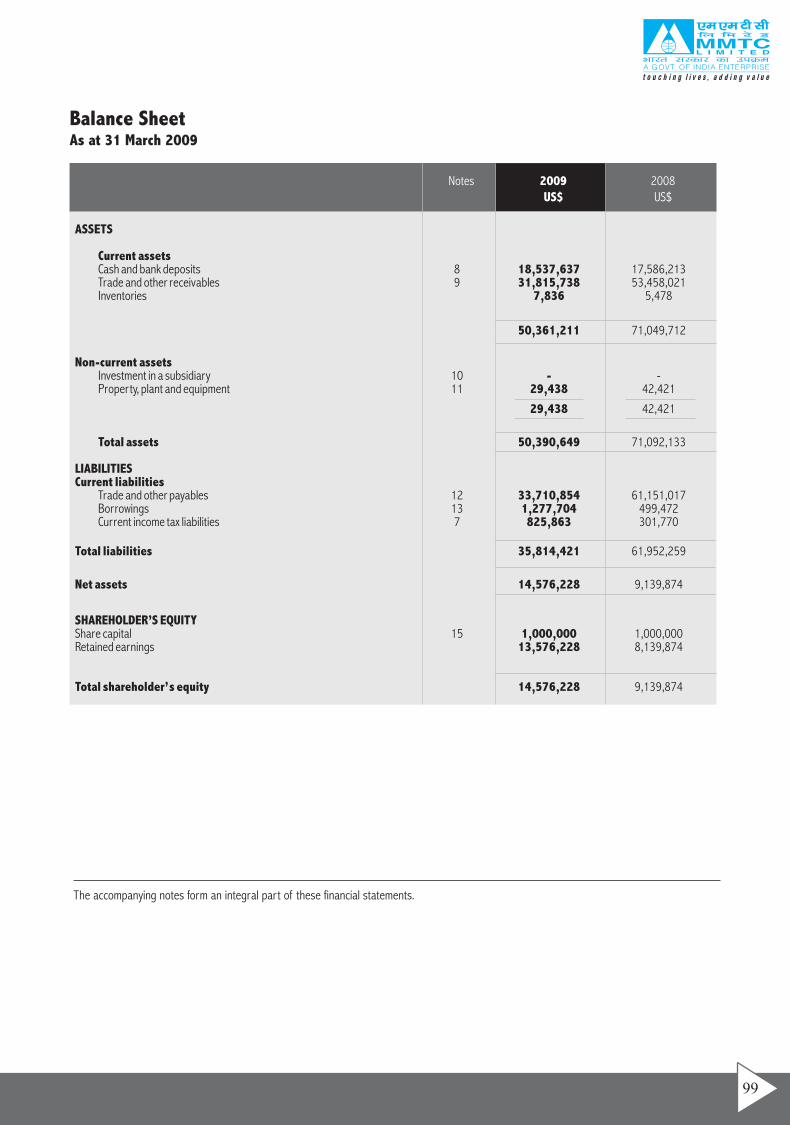
The accompanying notes form an integral part of these financial statements.
Balance SheetAs at 31 March 2009
Notes 2009 2008US$ US$
ASSETS
Current assetsCash and bank depositsTrade and other receivablesInventories
Non-current assetsInvestment in a subsidiary 10 - -Property, plant and equipment
Total assets
LIABILITIESCurrent liabilities
Trade and other payablesBorrowingsCurrent income tax liabilities
Total liabilities
Net assets
SHAREHOLDER’S EQUITYShare capitalRetained earnings
Total shareholder’s equity
8 18,537,637 17,586,2139 31,815,738 53,458,021
7,836 5,478
50,361,211 71,049,712
11 29,438 42,421
29,438 42,421
50,390,649 71,092,133
12 33,710,854 61,151,01713 1,277,704 499,4727 825,863 301,770
35,814,421 61,952,259
14,576,228 9,139,874
15 1,000,000 1,000,00013,576,228 8,139,874
14,576,228 9,139,874
99
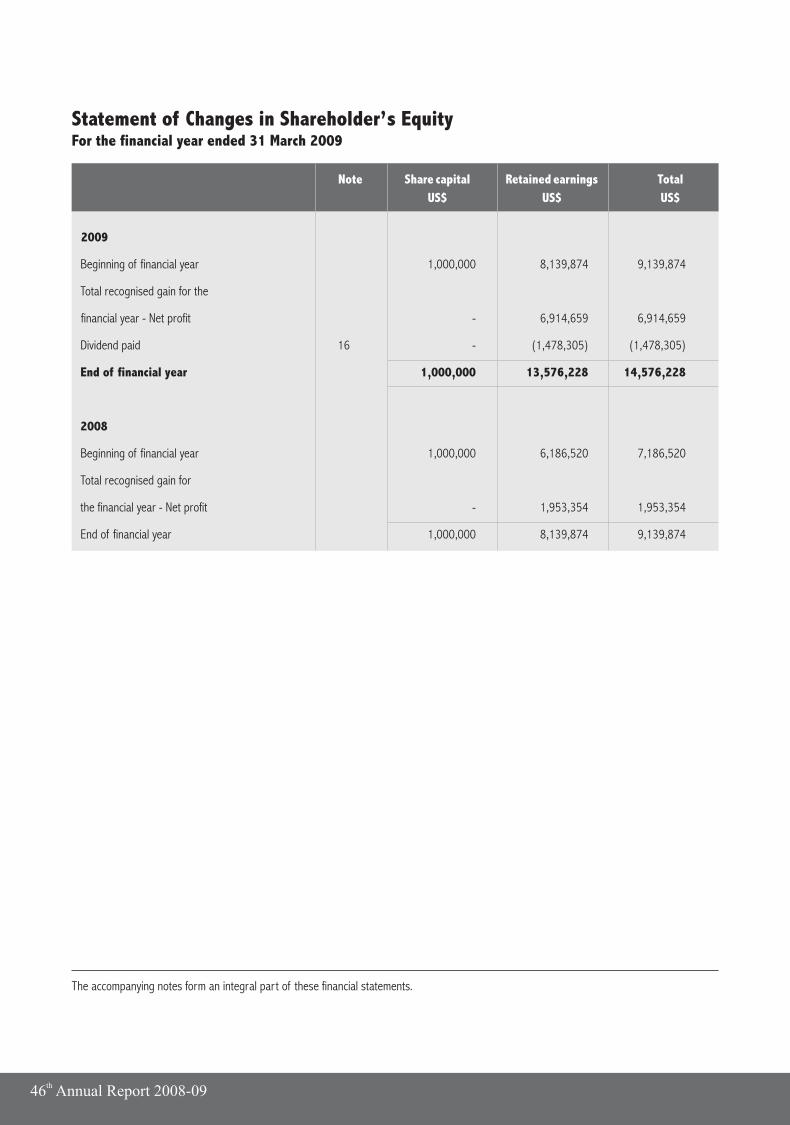
Statement of Changes in Shareholder’s EquityFor the financial year ended 31 March 2009
2009
Beginning of financial year 1,000,000 8,139,874 9,139,874
Total recognised gain for the
financial year - Net profit - 6,914,659 6,914,659
Dividend paid 16 - (1,478,305) (1,478,305)
End of financial year 1,000,000 13,576,228 14,576,228
2008
Beginning of financial year 1,000,000 6,186,520 7,186,520
Total recognised gain for
the financial year - Net profit - 1,953,354 1,953,354
End of financial year 1,000,000 8,139,874 9,139,874
Note Share capital Retained earnings Total
US$ US$ US$
The accompanying notes form an integral part of these financial statements.
th46 Annual Report 2008-09
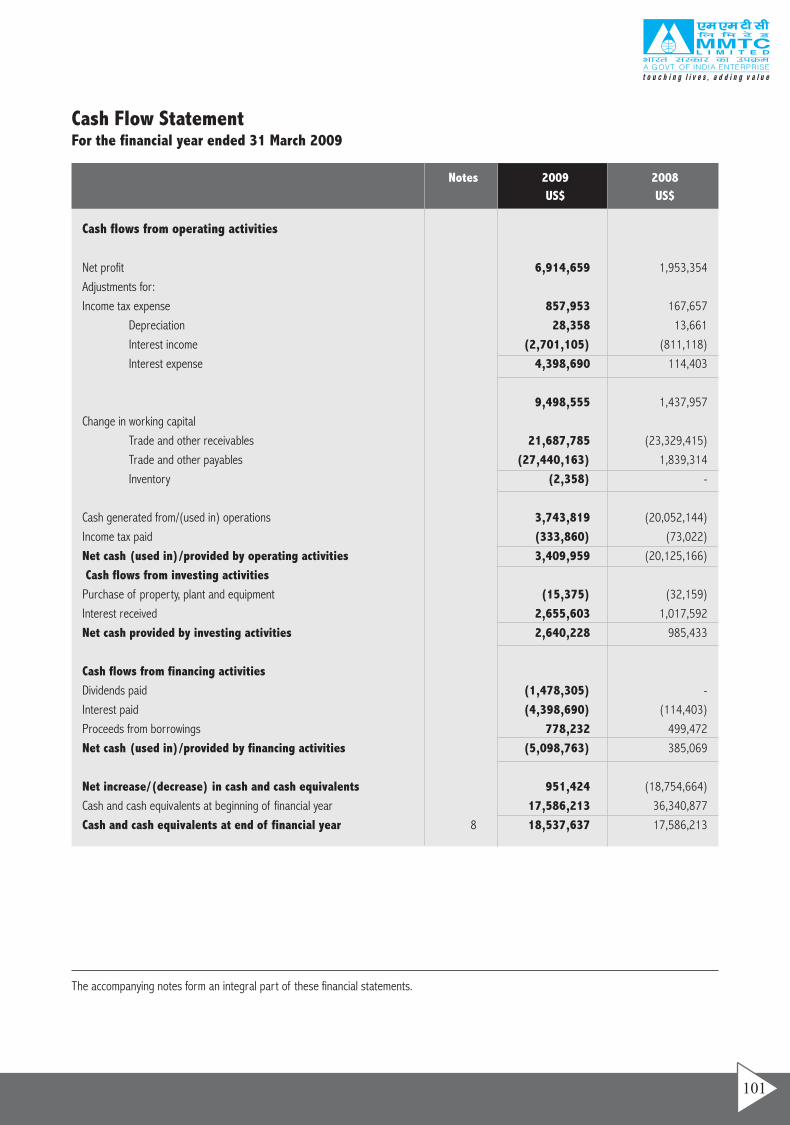
The accompanying notes form an integral part of these financial statements.
Cash Flow StatementFor the financial year ended 31 March 2009
Cash flows from operating activities
Net profit 6,914,659 1,953,354
Adjustments for:
Income tax expense 857,953 167,657
Depreciation 28,358 13,661
Interest income (2,701,105) (811,118)
Interest expense 4,398,690 114,403
9,498,555 1,437,957
Change in working capital
Trade and other receivables 21,687,785 (23,329,415)
Trade and other payables (27,440,163) 1,839,314
Inventory (2,358) -
Cash generated from/(used in) operations 3,743,819 (20,052,144)
Income tax paid (333,860) (73,022)
Net cash (used in)/provided by operating activities 3,409,959 (20,125,166)
Cash flows from investing activities
Purchase of property, plant and equipment (15,375) (32,159)
Interest received 2,655,603 1,017,592
Net cash provided by investing activities 2,640,228 985,433
Cash flows from financing activities
Dividends paid (1,478,305) -
Interest paid (4,398,690) (114,403)
Proceeds from borrowings 778,232 499,472
Net cash (used in)/provided by financing activities (5,098,763) 385,069
Net increase/(decrease) in cash and cash equivalents 951,424 (18,754,664)
Cash and cash equivalents at beginning of financial year 17,586,213 36,340,877
Cash and cash equivalents at end of financial year 8 18,537,637 17,586,213
Notes 2009 2008
US$ US$
101
For the financial year ended 31 March 2009Notes to the Financial Statements
These notes form an integral part of and should be read in
conjunction with the accompanying financial statements.
1. General information
The Company is incorporated and domiciled in Singapore. The
address of its registered office is 20 Cecil Street, #14-03/04
Equity Plaza, Singapore 049705.
The principal activities of the Company are trading in minerals, metals,
fertilizers, agricultural products, coal and hydrocarbon products,
jewellery and other commodities.
2. Significant accounting policies
2.1 Basis of preparation
The financial statements have been prepared in accordance
with Singapore Financial Reporting Standards ("FRS"). The
financial statements have been prepared under the historical
cost convention, except as disclosed in the accounting policies
below.
The preparation of these financial statements in conformity with
FRS requires management to exercise its judgement in the
process of applying the Company's accounting policies. It also
requires the use of certain critical accounting estimates and
assumptions. The management has assessed that there are no
estimates or judgements used that have a significant risk of
causing a material adjustment to the carrying amounts of assets
and liabilities within the next financial year.
Interpretations and amendments to published
standards effective in 2008
On 1 April 2008, the Company adopted the new or amended FRS
that are mandatory for application from that date. Changes to
the Company's accounting policies have been made as required,
in accordance with the relevant transitional provisions in the
respective FRS.
The following are the new or amended FRS that are relevant to the
Company:
FRS 107 Financial Instruments: Disclosures
Amendments to FRS 1 Presentation of Financial Statements -
Capital Disclosures
The adoption of the above new or amended FRS did not result in
any substantial changes to the Company's accounting policies.
Consolidated financial statements are not prepared as the
Company is a wholly owned subsidiary of MMTC Limited,
incorporated in India, which produces consolidated financial
statements for public use. The basis on which the subsidiary is
accounted for is disclosed in note 2.7. The registered office
address of MMTC Limited is Core - 1, Scope Complex, 7,
Institutional Area, Lodi Road, New Delhi, India - 110003.
2.2 Revenue recognition
Revenue comprises the fair value of the consideration received
or receivable for the sale of goods in the ordinary course of the
Company's activities. Revenue is presented, net of goods and
services tax, rebates and discounts.
Revenue is recognised as follows:
(a) Sale of goods
Revenue from the sale of goods is recognised when
products have been delivered in accordance with the
shipment terms.
(b) Interest income
Interest income is recognised using the effective interest
method.
2.3 Currency translation
These financial statements are presented in United States
Dollar, which is the functional currency of the Company.
Transactions denominated in a currency other than United
States Dollar ("foreign currency") are translated into United
States Dollar using the exchange rates prevailing at the dates of
the transactions. Currency translation differences resulting
from the settlement of such transactions and from the
translation at the closing rates at the balance sheet date of
monetary assets and liabilities denominated in foreign
currencies are recognised in the income statement.
2.4 Financial assets - loans and receivables
Loans and receivables include "cash and bank deposits" and
"trade and other receivables" in the balance sheet.
These financial assets are initially recognised at fair value and
subsequently carried at amortised cost using the effective
interest method. They are presented as current assets, except
for those maturing later than 12 months after the balance sheet
date which are presented as non-current assets.
th46 Annual Report 2008-09
The Company assesses at each balance sheet date whether
there is objective evidence that these financial assets are
impaired and recognises an allowance for impairment when
such evidence exists. Significant financial difficulties of the
debtor, probability that the debtor will enter bankruptcy and
default or significant delay in payments are objective evidence
that these financial assets are impaired.
Allowance for impairment is calculated as the difference
between the carrying amount and the present value of
estimated future cash flows, discounted at the original effective
interest rate.
2.5 Income taxes
Current income tax is recognised at the amount expected to be
paid to or recovered from the tax authorities.
Deferred income tax is recognised for all temporary differences
except when the deferred income tax arises from the initial
recognition of an asset or liability affects neither accounting nor
taxable profit or loss at the time of the transaction.
Current and deferred income tax is measured using the tax
rates and tax laws that have been enacted or substantively
enacted by the balance sheet date, and are recognised as
income or expenses in the income statement.
2.6 Inventories
Inventories, comprise goods held for resale, are stated at the
lower of cost and net realisable value. Cost is determined on a
specific identification method. Net realisable value is the
estimated selling price in the ordinary course of business less
selling expenses.
2.7 Investment in subsidiary
Subsidiaries are entities in which the Company has power to
govern the financial and operating policies, generally
accompanying a shareholding of more than one half of the
voting rights. The existence and effect of potential voting rights
that are currently exercisable or convertible are considered
when assessing whether the Company controls another entity.
Investments in subsidiaries are stated at cost less accumulated
impairment losses in the Company's balance sheet. Where an
indication of impairment exists, the carrying amount of the
investment is assessed and written down immediately to its
recoverable amount.
On disposal of an investment, the difference between net
disposal proceeds and the carrying amount of the investment is
taken to the income statement.
2.8 Property, plant and equipment
(a) Measurement
All property, plant and equipment are initially recognised at cost
and subsequently carried at cost less accumulated depreciation
and accumulated impairment losses.
The cost of an item of property, plant and equipment includes
its purchase price and any costs that are directly attributable to
bringing the asset to the location and condition necessary for it
to be capable of operating in the manner intended by
management.
(b) Depreciation
Depreciation on property, plant and equipment is calculated on
a reducing balance basis so as to write off the cost of property,
plant and equipment over their expected useful lives of 3 years.
The residual values and useful lives and depreciation method of
property, plant and equipment are adjusted as appropriate, at
each balance sheet date.
(c) Impairment
Where an indication of impairment exists, the carrying amount
of the asset is assessed and written down immediately to its
recoverable amount.
(d) Disposal
On disposal of an item of property, plant and equipment, the
difference between the net disposal proceeds and its carrying
amount is taken to the income statement.
2.9 Impairment of non-financial assets
Property, plant and equipment and investments in subsidiaries
are reviewed for impairment whenever there is any indication
that these assets may be impaired. If any such indication exists,
the recoverable amount (i.e. the higher of the fair value less cost
to sell and the value in use) of the asset is estimated to
determine the amount of impairment loss.
For the purpose of impairment testing of the assets,
recoverable amount is determined on an individual asset basis
unless the asset does not generate cash flows that are largely
independent of those from other assets. If this is the case,
recoverable amount is determined for the cash-generating unit
(CGU) to which the asset belongs.
If the recoverable amount of the asset (or CGU) is estimated to
103
be less than its carrying amount, the carrying amount of the
asset (or CGU) is reduced to its recoverable amount. The
impairment loss is recognised in the income statement.
An impairment loss for an asset is reversed if, and only if, there
has been a change in the estimates used to determine the
asset's recoverable amount since the last impairment loss was
recognised. The carrying amount of the asset is increased to its
revised recoverable amount, provided that this amount does
not exceed the carrying amount that would have been
determined (net of depreciation) had no impairment loss been
recognised for the asset in prior years. A reversal of impairment
loss for an asset is recognised in the income statement.
An impairment loss for an asset is reversed if, and only if, there
has been a change in the estimates used to determine the
asset's recoverable amount since the last impairment loss was
recognised. The carrying amount of an asset is increased to its
revised recoverable amount, provided that this amount does
not exceed the carrying amount that would have been
determined (net of amortisation or depreciation) had no
impairment loss been recognised for the asset in prior years. A
reversal of impairment loss for an asset is recognised in the
income statement.
2.10 Trade and other payables
Trade and other payables are initially measured at fair value,
and subsequently measured at amortised cost, using the
effective interest method.
2.11 Operating leases - as lessee
Leases of assets in which a significant portion of the risks and
rewards of ownership are retained by the lessor are classified
as operating leases. Payments made under operating leases
(net of any incentives received from the lessor) are taken to the
income statement on a straight-line basis over the period of the
lease.
When an operating lease is terminated before the lease period
has expired, any payment required to be made to the lessor by
way of penalty is recognised as an expense in the period in
which termination takes place.
2.12 Provisions for other liabilities and charges
Provisions for other liabilities and charges are recognised when
the Company has a present legal or constructive obligation as a
result of past events, it is more likely than not that an outflow of
resources will be required to settle the obligation and the
amount has been reliably estimated.
2.13 Employee compensation
(a) Defined contribution plans
Defined contribution plans are post-employment benefit plans
under which the Company pays fixed contributions into separate
entities such as the Central Provident Fund, on a mandatory,
contractual or voluntary basis. The Company has no further
payment obligations once the contributions have been paid. The
Company's contributions to defined contribution plans are
recognised as employee compensation expense when they are
due.
(b) Employee leave entitlement
Employee entitlements to annual leave are recognised when
they accrue to employees. A provision is made for the estimated
liability for annual leave as a result of services rendered by
employees up to the balance sheet date.
2.14 Cash and cash equivalents
Cash and cash equivalents include cash on hand, deposits with
financial institutions and bank overdrafts. Bank overdrafts are
shown within borrowings in current liabilities on the balance
sheet.
2.15 Borrowing costs
Borrowing costs are recognised in the income statement using
the effective interest method.
2.16 Fair value estimation of financial assets and liabilities
The fair values of current financial assets and liabilities carried
at amortised cost approximate their carrying amounts.
2.17 Borrowings
Borrowings are initially recognised at their fair values (net of
transaction costs) and subsequently carried at amortised cost.
Any difference between the proceeds (net of transaction costs)
and their redemption values is recognised in the income
statement over the period of the borrowings using the effective
interest method.
2.18 Dividends
Interim dividends are recorded in the financial year in which they
are declared payable. Final dividends are recorded during the
financial year in which the dividends are approved by the
shareholders.
th46 Annual Report 2008-09
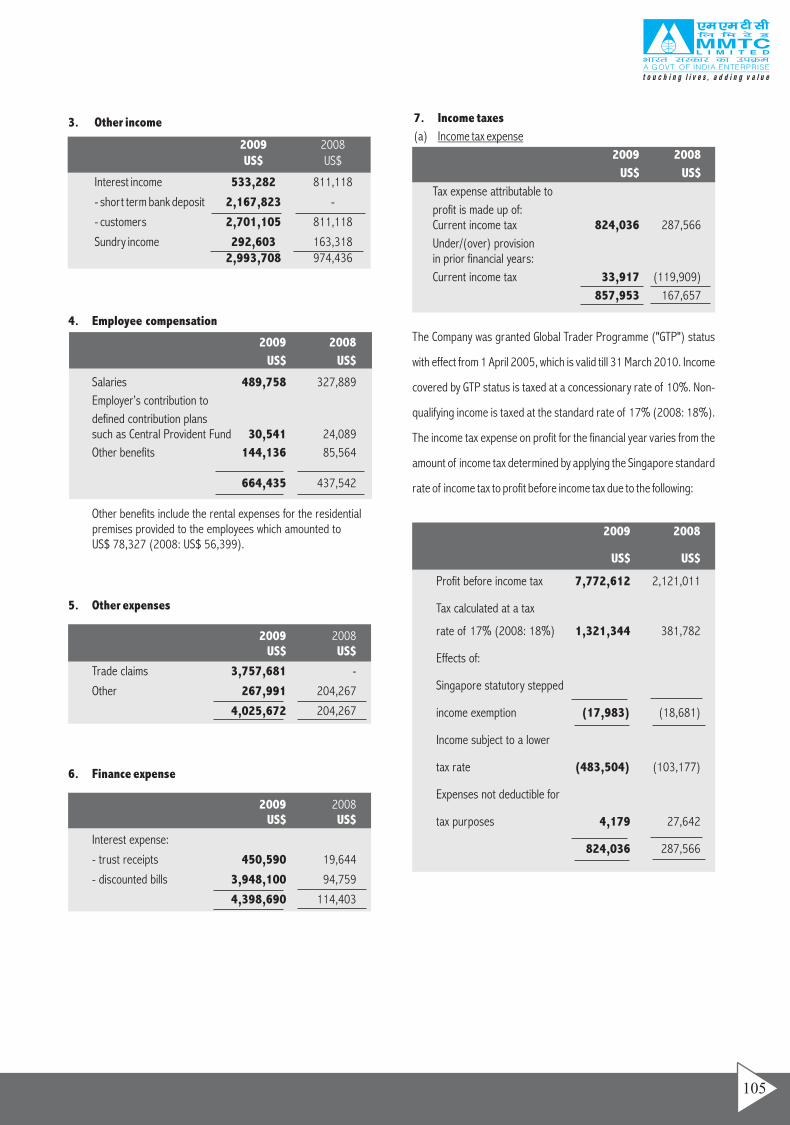
3. Other income
Interest income
2009 2008US$ US$
533,282 811,118
- short term bank deposit 2,167,823 -
- customers 2,701,105 811,118
Sundry income 292,603 163,3182,993,708 974,436
4. Employee compensation
Salaries
Employer’s contribution to
defined contribution planssuch as Central Provident Fund
Other benefits
Other benefits include the rental expenses for the residential premises provided to the employees which amounted toUS$ 78,327 (2008: US$ 56,399).
2009 2008
US$ US$
489,758 327,889
30,541 24,089
144,136 85,564
664,435 437,542
5. Other expenses
Trade claims 3,757,681 -
Other 267,991 204,267
4,025,672 204,267
2009 2008US$ US$
6. Finance expense
Interest expense:
- trust receipts 450,590 19,644
- discounted bills 3,948,100 94,759
4,398,690 114,403
2009 2008US$ US$
7. Income taxes
(a) Income tax expense
2009 2008
US$ US$
Tax expense attributable to
profit is made up of:Current income tax 824,036 287,566
Under/(over) provision in prior financial years:
Current income tax 33,917 (119,909)
857,953 167,657
The Company was granted Global Trader Programme ("GTP") status
with effect from 1 April 2005, which is valid till 31 March 2010. Income
covered by GTP status is taxed at a concessionary rate of 10%. Non-
qualifying income is taxed at the standard rate of 17% (2008: 18%).
The income tax expense on profit for the financial year varies from the
amount of income tax determined by applying the Singapore standard
rate of income tax to profit before income tax due to the following:
2009 2008
US$ US$
Profit before income tax 7,772,612 2,121,011
Tax calculated at a tax
rate of 17% (2008: 18%) 1,321,344 381,782
Effects of:
Singapore statutory stepped
income exemption (17,983) (18,681)
Income subject to a lower
tax rate (483,504) (103,177)
Expenses not deductible for
tax purposes 4,179 27,642
824,036 287,566
105
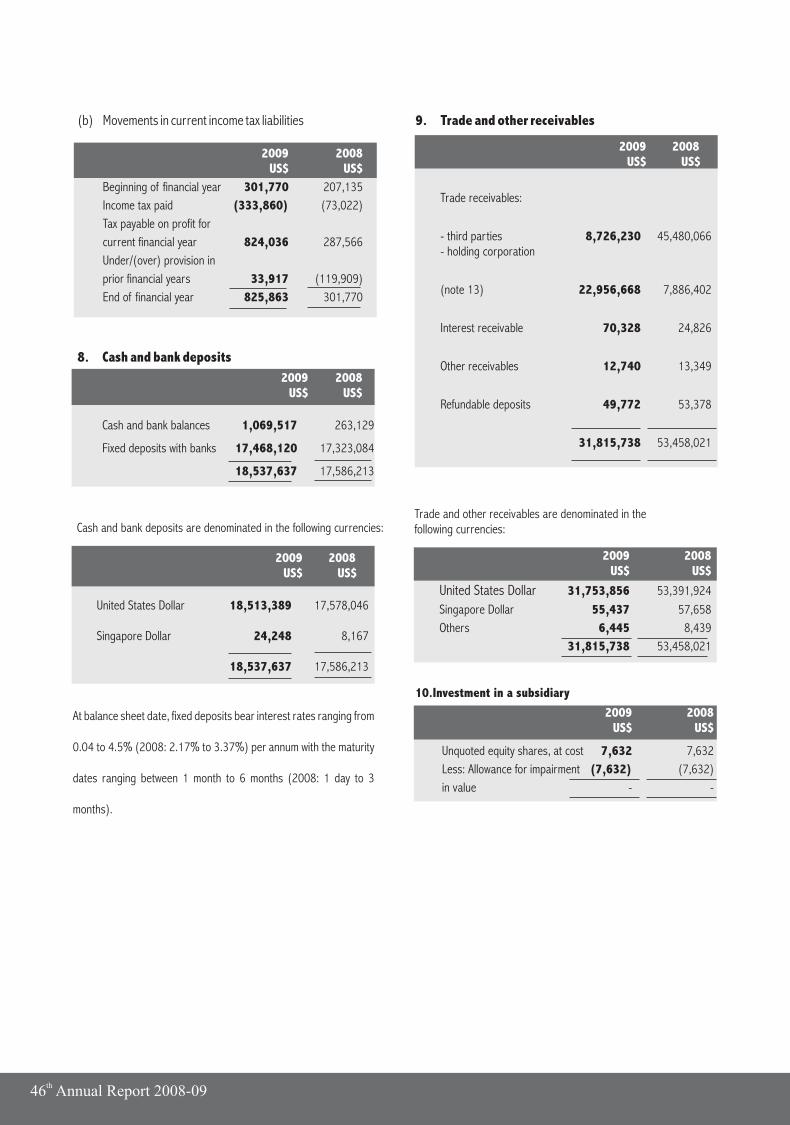
8. Cash and bank deposits
2009 2008US$ US$
Cash and bank balances 1,069,517 263,129
Fixed deposits with banks 17,468,120 17,323,084
18,537,637 17,586,213
Cash and bank deposits are denominated in the following currencies:
2009 2008US$ US$
United States Dollar 18,513,389 17,578,046
Singapore Dollar 24,248 8,167
18,537,637 17,586,213
At balance sheet date, fixed deposits bear interest rates ranging from
0.04 to 4.5% (2008: 2.17% to 3.37%) per annum with the maturity
dates ranging between 1 month to 6 months (2008: 1 day to 3
months).
9. Trade and other receivables
2009 2008US$ US$
Trade receivables:
- third parties 8,726,230 45,480,066- holding corporation
(note 13) 22,956,668 7,886,402
Interest receivable 70,328 24,826
Other receivables 12,740 13,349
Refundable deposits 49,772 53,378
31,815,738 53,458,021
2009 2008US$ US$
United States Dollar 31,753,856 53,391,924
Singapore Dollar 55,437 57,658
Others 6,445 8,439
31,815,738 53,458,021
Trade and other receivables are denominated in thefollowing currencies:
2009 2008US$ US$
Unquoted equity shares, at cost 7,632 7,632
Less: Allowance for impairment (7,632) (7,632)
in value - -
10.Investment in a subsidiary
(b) Movements in current income tax liabilities
2009 2008US$ US$
Beginning of financial year 301,770 207,135
Income tax paid (333,860) (73,022)
Tax payable on profit for
current financial year 824,036 287,566
Under/(over) provision in
prior financial years 33,917 (119,909)
End of financial year 825,863 301,770
th46 Annual Report 2008-09
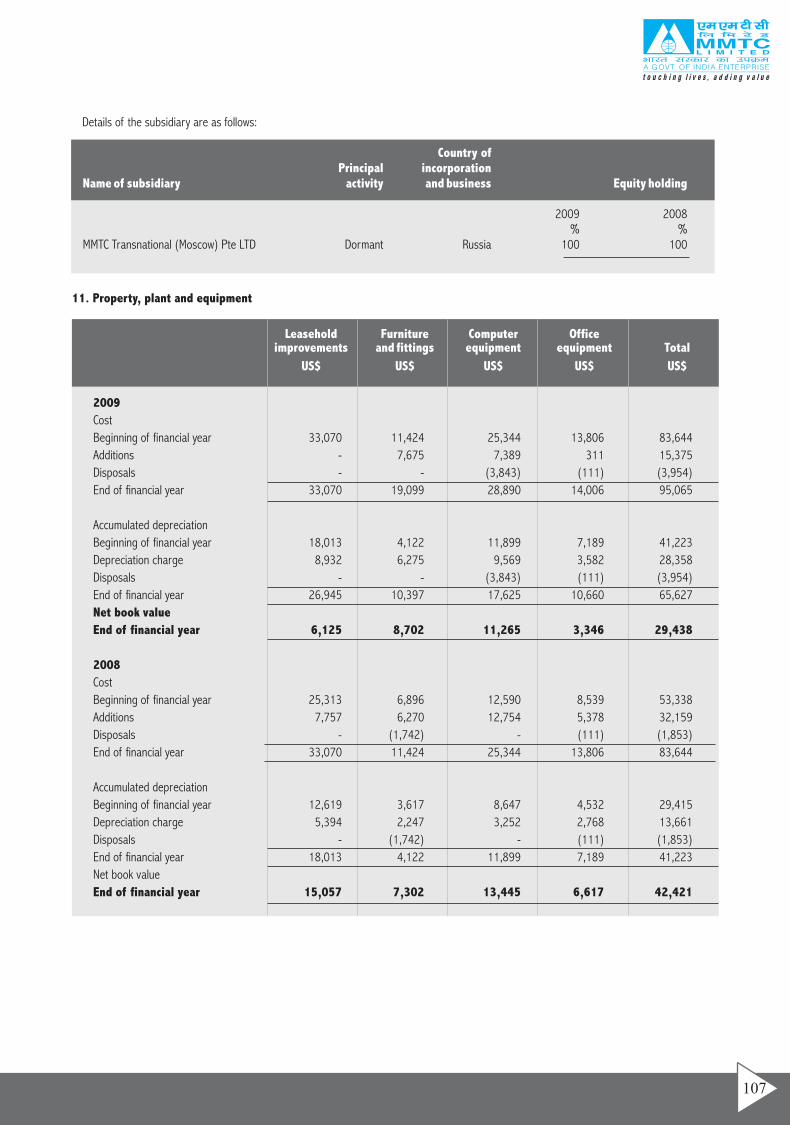
Leasehold Furniture Computer Officeimprovements and fittings equipment equipment Total
US$ US$ US$ US$ US$
2009
Cost
Beginning of financial year 33,070 11,424 25,344 13,806 83,644
Additions - 7,675 7,389 311 15,375
Disposals - - (3,843) (111) (3,954)
End of financial year 33,070 19,099 28,890 14,006 95,065
Accumulated depreciation
Beginning of financial year 18,013 4,122 11,899 7,189 41,223
Depreciation charge 8,932 6,275 9,569 3,582 28,358
Disposals - - (3,843) (111) (3,954)
End of financial year 26,945 10,397 17,625 10,660 65,627
Net book value
End of financial year 6,125 8,702 11,265 3,346 29,438
2008
Cost
Beginning of financial year 25,313 6,896 12,590 8,539 53,338
Additions 7,757 6,270 12,754 5,378 32,159
Disposals - (1,742) - (111) (1,853)
End of financial year 33,070 11,424 25,344 13,806 83,644
Accumulated depreciation
Beginning of financial year 12,619 3,617 8,647 4,532 29,415
Depreciation charge 5,394 2,247 3,252 2,768 13,661
Disposals - (1,742) - (111) (1,853)
End of financial year 18,013 4,122 11,899 7,189 41,223
Net book value
End of financial year 15,057 7,302 13,445 6,617 42,421
11. Property, plant and equipment
Details of the subsidiary are as follows:
2009 2008% %
MMTC Transnational (Moscow) Pte LTD Dormant Russia 100 100
Country ofPrincipal incorporation
Name of subsidiary activity and business Equity holding
107
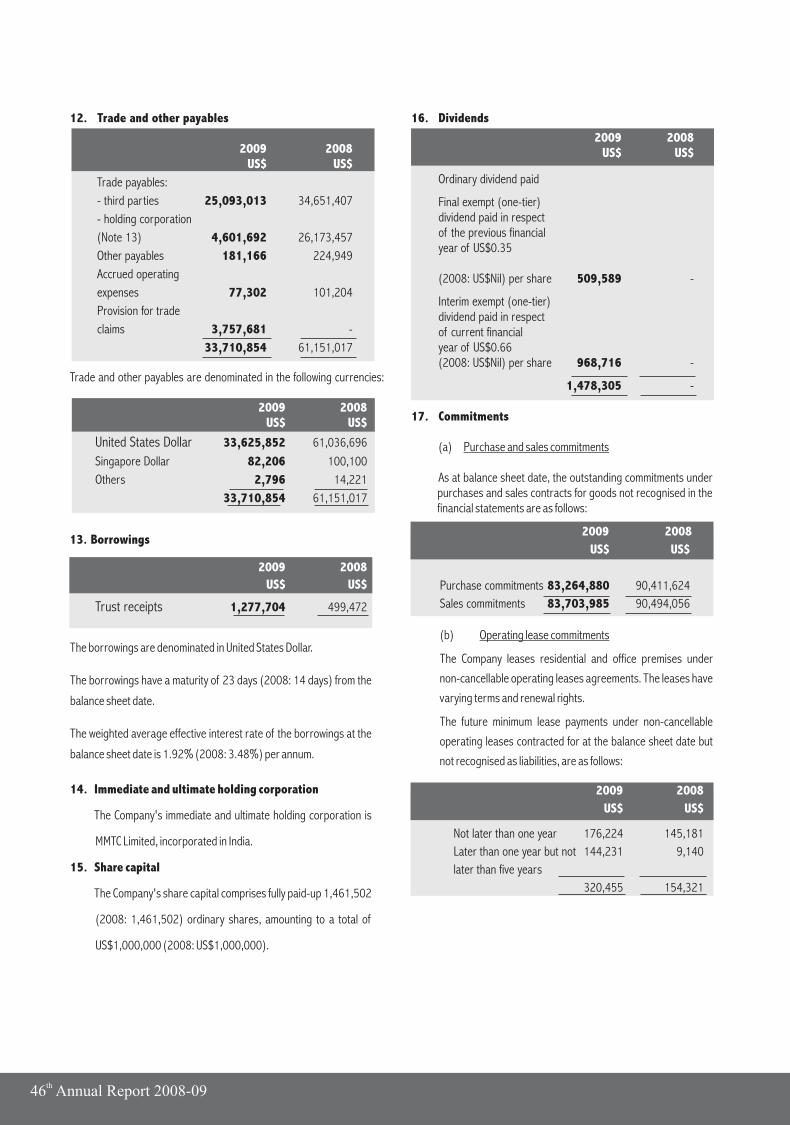
12. Trade and other payables
2009 2008US$ US$
Trade payables:
- third parties 25,093,013 34,651,407
- holding corporation
(Note 13) 4,601,692 26,173,457
Other payables 181,166 224,949
Accrued operating
expenses 77,302 101,204
Provision for trade
claims 3,757,681 -
33,710,854 61,151,017
Trade and other payables are denominated in the following currencies:
2009 2008US$ US$
United States Dollar 33,625,852 61,036,696
Singapore Dollar 82,206 100,100
Others 2,796 14,221
33,710,854 61,151,017
2009 2008
US$ US$
Trust receipts 1,277,704 499,472
13. Borrowings
The borrowings are denominated in United States Dollar.
The borrowings have a maturity of 23 days (2008: 14 days) from the
balance sheet date.
The weighted average effective interest rate of the borrowings at the
balance sheet date is 1.92% (2008: 3.48%) per annum.
14. Immediate and ultimate holding corporation
The Company's immediate and ultimate holding corporation is
MMTC Limited, incorporated in India.
15. Share capital
The Company's share capital comprises fully paid-up 1,461,502
(2008: 1,461,502) ordinary shares, amounting to a total of
US$1,000,000 (2008: US$1,000,000).
16. Dividends
2009 2008US$ US$
Ordinary dividend paid
Final exempt (one-tier) dividend paid in respectof the previous financial year of US$0.35
(2008: US$Nil) per share 509,589 -
Interim exempt (one-tier) dividend paid in respectof current financial year of US$0.66(2008: US$Nil) per share 968,716 -
1,478,305 -
17. Commitments
(a) Purchase and sales commitments
As at balance sheet date, the outstanding commitments under purchases and sales contracts for goods not recognised in the financial statements are as follows:
2009 2008
US$ US$
Purchase commitments
Sales commitments
83,264,880 90,411,624
83,703,985 90,494,056
(b) Operating lease commitments
The Company leases residential and office premises under
non-cancellable operating leases agreements. The leases have
varying terms and renewal rights.
The future minimum lease payments under non-cancellable
operating leases contracted for at the balance sheet date but
not recognised as liabilities, are as follows:
2009 2008
US$ US$
Not later than one year
Later than one year but not
later than five years
176,224 145,181
144,231 9,140
320,455 154,321
th46 Annual Report 2008-09
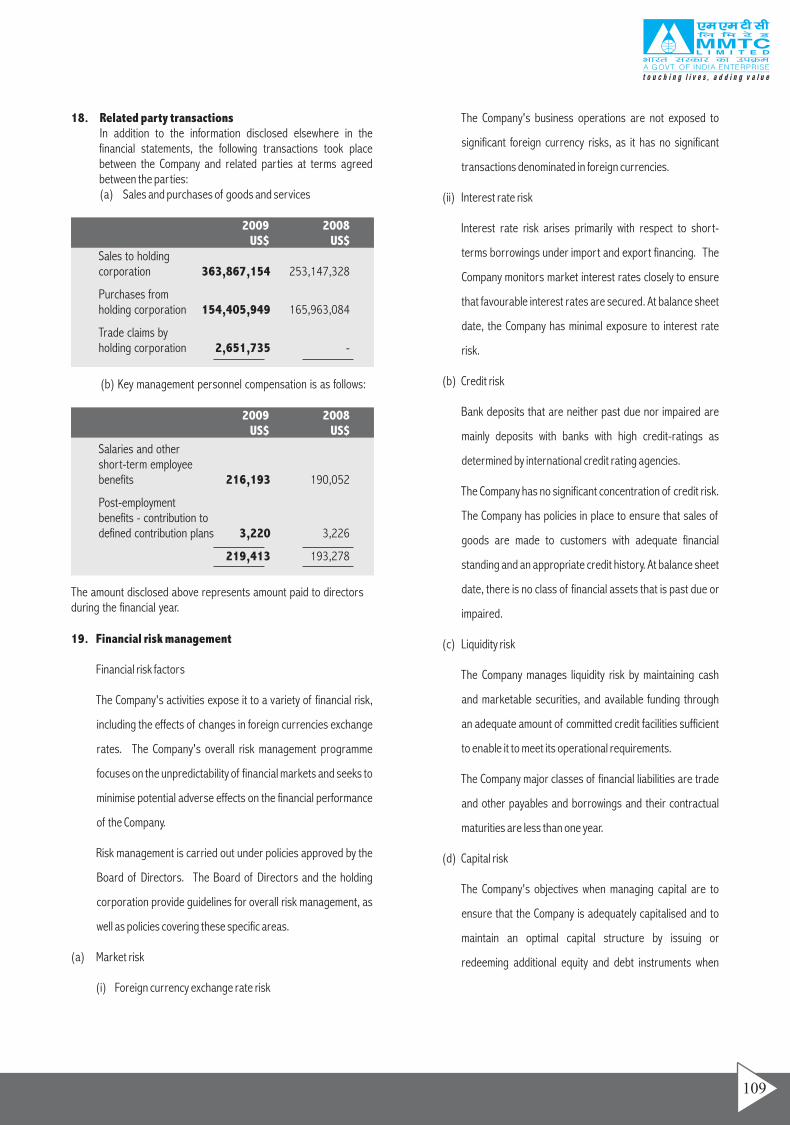
18. Related party transactions
(a) Sales and purchases of goods and services
In addition to the information disclosed elsewhere in the financial statements, the following transactions took place between the Company and related parties at terms agreed between the parties:
2009 2008US$ US$
Sales to holding corporation 363,867,154 253,147,328
Purchases from holding corporation 154,405,949 165,963,084
Trade claims by holding corporation 2,651,735 -
(b) Key management personnel compensation is as follows:
2009 2008US$ US$
Salaries and other short-term employee benefits 216,193 190,052
Post-employment benefits - contribution to defined contribution plans 3,220 3,226
219,413 193,278
The amount disclosed above represents amount paid to directors during the financial year.
19. Financial risk management
Financial risk factors
The Company's activities expose it to a variety of financial risk,
including the effects of changes in foreign currencies exchange
rates. The Company's overall risk management programme
focuses on the unpredictability of financial markets and seeks to
minimise potential adverse effects on the financial performance
of the Company.
Risk management is carried out under policies approved by the
Board of Directors. The Board of Directors and the holding
corporation provide guidelines for overall risk management, as
well as policies covering these specific areas.
(a) Market risk
(i) Foreign currency exchange rate risk
The Company's business operations are not exposed to
significant foreign currency risks, as it has no significant
transactions denominated in foreign currencies.
(ii) Interest rate risk
Interest rate risk arises primarily with respect to short-
terms borrowings under import and export financing. The
Company monitors market interest rates closely to ensure
that favourable interest rates are secured. At balance sheet
date, the Company has minimal exposure to interest rate
risk.
(b) Credit risk
Bank deposits that are neither past due nor impaired are
mainly deposits with banks with high credit-ratings as
determined by international credit rating agencies.
The Company has no significant concentration of credit risk.
The Company has policies in place to ensure that sales of
goods are made to customers with adequate financial
standing and an appropriate credit history. At balance sheet
date, there is no class of financial assets that is past due or
impaired.
(c) Liquidity risk
The Company manages liquidity risk by maintaining cash
and marketable securities, and available funding through
an adequate amount of committed credit facilities sufficient
to enable it to meet its operational requirements.
The Company major classes of financial liabilities are trade
and other payables and borrowings and their contractual
maturities are less than one year.
(d) Capital risk
The Company's objectives when managing capital are to
ensure that the Company is adequately capitalised and to
maintain an optimal capital structure by issuing or
redeeming additional equity and debt instruments when
109
necessary.
The Company monitors capital on the basis of the total
shareholder's equity as shown on the balance sheet.
The Company is not subject to any externally imposed
capital requirements.
20. New or revised accounting Standards and
Interpretations
Certain new standards, amendments and interpretations to
existing standards have been published and are mandatory for
the Company's accounting periods beginning on or after 1 April
2009 or later periods and which the Company has not early
adopted. The Company's assessment of the impact of adopting
those standards, amendments and interpretations that are
relevant to the Company is set out below:
FRS 1(R) Presentation of Financial Statements (effective for annual
periods beginning on or after 1 January 2009)
The revised standard requires:
• All changes in equity arising from transactions with owners
in their capacity as owners to be presented separately from
components of comprehensive income;
• Components of comprehensive income not to be included in
statement of changes in equity;
• Items of income and expenses and components of other
comprehensive income can be presented either in a single
statement of comprehensive income with subtotals, or in
two separate statements (a separate statement of profit
and loss followed by a statement of comprehensive
income);
• Presentation of restated balance sheet as at the beginning
of the comparative period when entities make restatements
or reclassifications of comparative information.
The revisions also include changes in the titles of some of the financial
statements primary statements.
The Company will apply the revised standard from 1 April 2009 and
provide comparative information that conforms to the requirements
of the revised standard. The key impact of the application of the
revised standard is the presentation of an additional primary
statement, the statement of comprehensive income.
21. Authorisation of financial statements
These financial statements were authorised for issue in accordance
with a resolution of the Board of Directors of MMTC Transnational Pte
Ltd on 12 August 2009.
th46 Annual Report 2008-09
consolidated financial statements
2008-09
MMTC Transnational PTE. LTD.Singapore
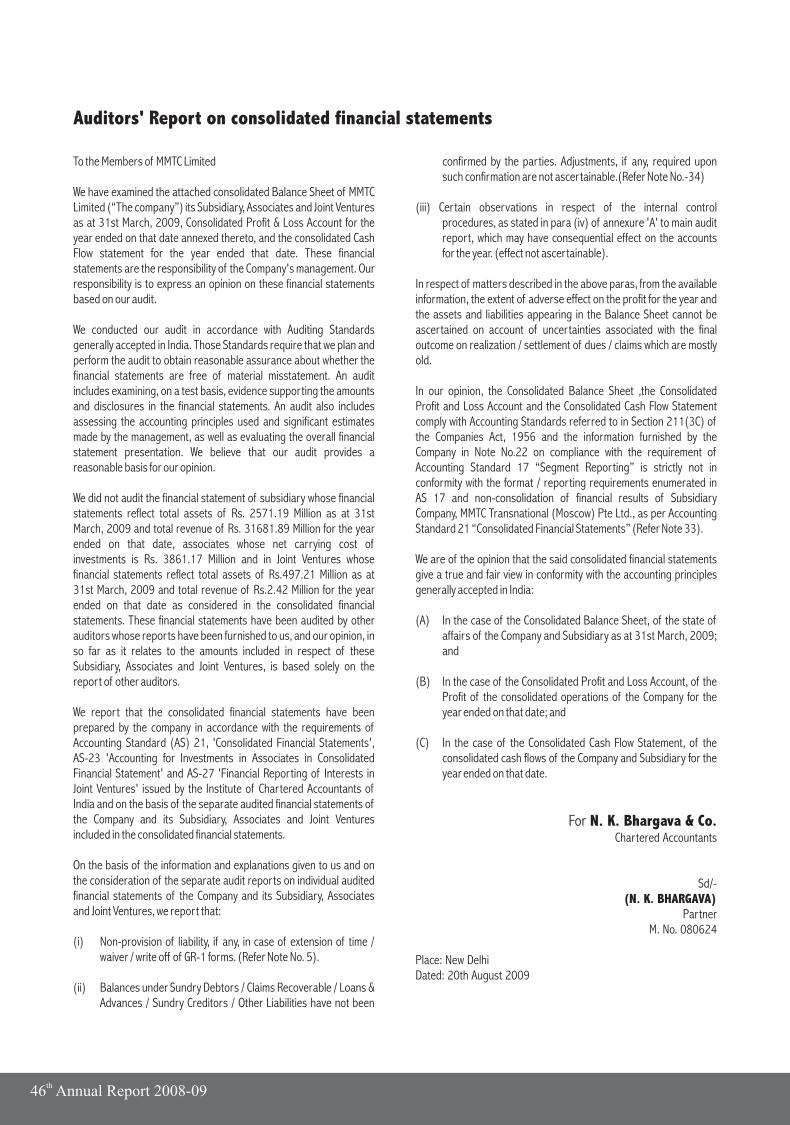
Auditors' Report on consolidated financial statements
To the Members of MMTC Limited
We have examined the attached consolidated Balance Sheet of MMTC Limited (“The company”) its Subsidiary, Associates and Joint Ventures as at 31st March, 2009, Consolidated Profit & Loss Account for the year ended on that date annexed thereto, and the consolidated Cash Flow statement for the year ended that date. These financial statements are the responsibility of the Company's management. Our responsibility is to express an opinion on these financial statements based on our audit.
We conducted our audit in accordance with Auditing Standards generally accepted in India. Those Standards require that we plan and perform the audit to obtain reasonable assurance about whether the financial statements are free of material misstatement. An audit includes examining, on a test basis, evidence supporting the amounts and disclosures in the financial statements. An audit also includes assessing the accounting principles used and significant estimates made by the management, as well as evaluating the overall financial statement presentation. We believe that our audit provides a reasonable basis for our opinion.
We did not audit the financial statement of subsidiary whose financial statements reflect total assets of Rs. 2571.19 Million as at 31st March, 2009 and total revenue of Rs. 31681.89 Million for the year ended on that date, associates whose net carrying cost of investments is Rs. 3861.17 Million and in Joint Ventures whose financial statements reflect total assets of Rs.497.21 Million as at 31st March, 2009 and total revenue of Rs.2.42 Million for the year ended on that date as considered in the consolidated financial statements. These financial statements have been audited by other auditors whose reports have been furnished to us, and our opinion, in so far as it relates to the amounts included in respect of these Subsidiary, Associates and Joint Ventures, is based solely on the report of other auditors.
We report that the consolidated financial statements have been prepared by the company in accordance with the requirements of Accounting Standard (AS) 21, 'Consolidated Financial Statements', AS-23 'Accounting for Investments in Associates in Consolidated Financial Statement' and AS-27 'Financial Reporting of Interests in Joint Ventures' issued by the Institute of Chartered Accountants of India and on the basis of the separate audited financial statements of the Company and its Subsidiary, Associates and Joint Ventures included in the consolidated financial statements.
On the basis of the information and explanations given to us and on the consideration of the separate audit reports on individual audited financial statements of the Company and its Subsidiary, Associates and Joint Ventures, we report that:
(i) Non-provision of liability, if any, in case of extension of time / waiver / write off of GR-1 forms. (Refer Note No. 5).
(ii) Balances under Sundry Debtors / Claims Recoverable / Loans & Advances / Sundry Creditors / Other Liabilities have not been
confirmed by the parties. Adjustments, if any, required upon such confirmation are not ascertainable.(Refer Note No.-34)
(iii) Certain observations in respect of the internal control procedures, as stated in para (iv) of annexure 'A' to main audit report, which may have consequential effect on the accounts for the year. (effect not ascertainable).
In respect of matters described in the above paras, from the available information, the extent of adverse effect on the profit for the year and the assets and liabilities appearing in the Balance Sheet cannot be ascertained on account of uncertainties associated with the final outcome on realization / settlement of dues / claims which are mostly old.
In our opinion, the Consolidated Balance Sheet ,the Consolidated Profit and Loss Account and the Consolidated Cash Flow Statement comply with Accounting Standards referred to in Section 211(3C) of the Companies Act, 1956 and the information furnished by the Company in Note No.22 on compliance with the requirement of Accounting Standard 17 “Segment Reporting” is strictly not in conformity with the format / reporting requirements enumerated in AS 17 and non-consolidation of financial results of Subsidiary Company, MMTC Transnational (Moscow) Pte Ltd., as per Accounting Standard 21 “Consolidated Financial Statements” (Refer Note 33).
We are of the opinion that the said consolidated financial statements give a true and fair view in conformity with the accounting principles generally accepted in India:
(A) In the case of the Consolidated Balance Sheet, of the state of affairs of the Company and Subsidiary as at 31st March, 2009; and
(B) In the case of the Consolidated Profit and Loss Account, of the Profit of the consolidated operations of the Company for the year ended on that date; and
(C) In the case of the Consolidated Cash Flow Statement, of the consolidated cash flows of the Company and Subsidiary for the year ended on that date.
For N. K. Bhargava & Co.Chartered Accountants
Sd/-(N. K. BHARGAVA)
Partner M. No. 080624
Place: New DelhiDated: 20th August 2009
th46 Annual Report 2008-09
ACCOUNTING POLICIES TO THE CONSOLIDATED BALANCE SHEETAND PROFIT AND LOSS ACCOUNT
1. BASIS OF PREPARATION OF FINANCIAL STATEMENT
(a) The financial statements are prepared according to the historical cost convention on accrual basis and in line with the fundamental accounting principles of prudence, consistency and materiality.
(b) The financial statements are reported in Indian Rupee and all values are rounded to the nearest million unless otherwise stated.
(c ) Statement of Compliance
The financial statements are prepared on the basis of generally accepted accounting principles in India, accounting standards issued by the Institute of Chartered Accountants of India and the provisions of the Companies Act, 1956 as amended from time to time.
2. PURCHASES AND SALES
a) Purchases and sales are booked where the company has entered into purchase/sale contract/agreement with the sellers/buyers or received allocation letter from Government, on performance of the contract/agreement/allocation either wholly or partly.
b) Gold/Silver sent by foreign suppliers on consignment basis:
i) Purchases include gold/silver withdrawn from consignment stock on outright purchase basis for sale to exporters, as per the scheme of Exim Policy being operated by the Company as a nominated agency.
ii) Purchase of Gold for domestic sale is accounted for on withdrawal from the consignment stock and fixation of price with the suppliers.
iii) Gold/silver withdrawn on loan basis where from consignment stock, are shown as loan given to parties and shown under Loans and Advances. The corresponding liability towards the stocks received from foreign suppliers is shown under Sundry Creditors. Loan/Sundry Creditors are adjusted when purchase and sales are booked.
iv) In the case of replenishment basis, gold/silver booked by exporter by paying margin money, purchase is booked after “fixing” the price with the foreign suppliers. However, sale is booked when quantity is actually delivered after completion of exports.
v) Consignment stocks held on behalf of foreign suppliers at the year end is suitably disclosed in the accounts. However, customs duty paid in respect of balance consignment stock is shown as prepaid expenses.
c) In respect of exports of Iron Ore/Manganese Ore where final sale value is ascertained on the basis of destinational weight and analysis results and such results are awaited, provision towards DWA risk is made @ 1% on the provisional sale value. In case of FOBT supplies where DWA risk on the purchase value is to the account of supplier provision @1% is made on the difference between sale value and purchase value.
d) Pending settlements, certain expenses/ gain/loss like dispatch earned/ demurrage payable etc. are accounted for on provisional basis.
3. REVENUE RECOGNITION
i) Revenue is recognized on accrual basis except in the following items which are accounted for on actual realization since relisability of such items is uncertain in accordance with the provisions of AS – 9 issued by ICAI:-
a) Tax credit, duty credit authorization under Target Plus scheme, REP/Advance Licenses, Service Tax refund, etc.
b) Decrees pending for execution/contested dues and interest thereon, if any:
c) Interest on overdue recoverables where realisability is uncertain.
d) Liquidated damages on suppliers/underwriters, refund of custom duty on account of survey shortage, and refund of income-tax/sales-tax/VAT and interest thereon.
Insurance claims are accounted for upon being accepted by the insurance company.
ii) Claims are recognized in the Profit & Loss Account on accrual basis including receivables from Govt. towards subsidy, cash incentives, reimbursement of losses etc. when it is not unreasonable to expect ultimate collection. Claims recognized but subsequently becoming doubtful are provided for through Profit & Loss Account.
4. PREPAID EXPENSES
Prepaid expenses upto Rs.5,000/- in each case are charged to revenue. Deposits upto Rs.1,000/- in each case with Government Department, Statutory Corporations, Electricity Boards and Local Bodies are also charged off to revenue.
5. FIXED ASSETS (a) All fixed assets are stated at historical cost less accumulated
depreciation and any impairment in value.
113
(b) The Company's expenditure toward construction/development of assets on land owned by the Government/Semi Government Authorities, is capitalized under heading “Fixed Assets created on Land and neither the Fixed Assets nor the Land belongs to the Company”.
6. DEPRECIATION
Depreciation is provided on straight line method at the rates approved by the Board of Directors, which are equal to or higher than those provided under schedule XIV of the Companies Act, 1956. Depreciation on assets acquired/disposed during the year is provided from/upto the month the asset is acquired/disposed. Depreciation includes amortisation of lease-hold land and Railway Wagon Rakes under WIS. Wooden partitions and temporary structures are fully depreciated in the year of purchase/erection. Moveable assets whose written down value at the beginning of the year and / or value in respect of purchases made during the year are less than Rs 10,000/- or less in each case, 100% depreciation is provided except retaining a nominal value of Re 1/-. The depreciation rates are as under:
Name of Assets Rate of Rate of Depreciation Depreciationas adopted as providedby Company in Sch.XIV
A. General Assets
Furniture & Fittings 10% 6.33%
Weigh bridges 10% 4.75%
Typewriters, Machines, Fans 12.5% 4.75%
& Office Equipment & AC Vehicles 20% 9.50%
Computers 20% 16.21%
Lease hold land As per lease agreement
Wagon Rakes As per agreement/Wagon Investment Scheme
Electrical installations 10% 1.63%excluding fans
Water supply, sewerage 10% 1.63%and drainage
Road and Culverts 2.5% 1.63%
Building and flats 2.5% 1.63%
Residential flats(ready built) 5% 1.63%
Warehouses/Godown 4% 1.63%
B. Manufacturing Unit's Assets
Factory Building 3.34% 3.34%
Electrical Installations 4.75% 4.75%
Water Supply 4.75% 4.75%
Plant & Machinery(General)
- Single Shift 4.75% 4.75%
- Double Shift 7.42% 7.42%
- Triple Shift 10.34% 10.34%
Plant & Machinery-ContinuousProcess(including Wind Mill) 5.28% 5.28%
C. “ Fixed Assets created on Over useful life of asset or Land and neither the five years whichever is less. the Fixed Assets nor the Land belongs to the Company “
D. All movable assets up to 100% for 100% for Rs.10,000/- Movable assets costing
assets costing Rs.5,000 orRs.10,000 or less each
less each
E. Goodwill is amortised over a period of five years.
7. INVESTMENTS
(i) Long term investments are valued at cost less provision for permanent diminution in value.
(ii) Current investments are valued at lower of cost and fair value.
8. FOREIGN CURRENCY TRANSACTIONS
a) Transactions with rupee payment countries in respect of non-convertible Indian currency are being treated as foreign exchange transactions.
b) Foreign currency monetary items (except overdue recoverable where realisibility is uncertain) are converted using the closing rate as defined in the AS-11 issued by the Institute of Chartered Accountants of India. Non-monetary items are reported using the exchange rate at the date of the transaction. The exchange difference gain/loss is recognized in the Trading, Profit and Loss account.
c) Liability in foreign currency relating to acquisition of fixed assets is converted using the closing rate as defined in AS 11 issued by the Institute of Chartered Accountants of India. The difference in exchange is recognized in the Trading, Profit & Loss Account.
d) In respect of forward exchange contracts, the premium / discount and loss/gain will be recognized as under:-
In respect of forward exchange contracts against existing underlying transactions, the premium / discount is recognized proportionately over the life of the contract. The loss/gain due to difference in exchange rate between (i) closing rate or the rate on the date of settlement if the transaction is settled during the year, and (ii) the exchange rate at later of the date of the inception of the forward contract or the last reporting date is recognised in the Trading, Profit & Loss Account for the year.
In respect of forward contracts relating to firm commitments and highly probable forecast transactions, loss due to exchange difference is recognized in the Trading, Profit & Loss Account in
th46 Annual Report 2008-09
the reporting period in which the exchange rate changes. Any profit or loss arising on renewal or cancellation of such contracts is recognized as income or expense for the period.
e) Investments in subsidiary company outside India are translated at the rate of exchange prevailing on the date of acquisition.
9. DEFFERED REVENUE EXPENDITURE
Payment of Ex-gratia and Notice pay on Voluntary Retirement is treated as Deferred Revenue Expenditure and charged to Profit & Loss Account over a period of five years in equal installments.
10. EMPLOYEE BENEFITS
(i) Provision for gratuity, leave encashment/availment, post retirement medical benefit and ALTC/LTC liability is made on the basis of actuarial valuation as per AS-15(Revised) issued by The Institute of Chartered Accountants of India.
(ii) Provident fund contribution is made to Provident Fund Trust on accrual basis.
11. PHYSICAL VERIFICATION OF STOCKS
Physical verification of stocks is undertaken once in a year and balances are arrived at after necessary adjustments till the end of the year. The stocks as physically verified are adopted as closing stocks and shortages/excesses suitably dealt with.
In some of the cases where stocks are lying with Handling Agent/SWC/CWC/Private Parties the stocks have been adopted on the basis of certificate given by the respective agencies.
12. VALUATION OF STOCKS
Inventories including Goods-in-Transit are valued at lower of the cost or realisable value as on 31st March. The method of valuation is as under:
a) EXPORTS
Cost of export stocks is arrived at after including direct expenses incurred upto the point at which the stocks are lying. Similarly the realisable value is derived by deducting from the market price the expenses to be incurred from that point to the stage where they are sold.
MINERAL ORES
The realisable value of ores is worked out at the minimum of the Fe/Mn contents of the grade of the ore as per export contract and is compared with the weighted average cost at weighted average Fe/Mn contents/weighted average moisture contents of the ore. The embedded stocks of Iron ore are excluded from inventory and hence not valued.
(b) IMPORTS
The cost of imported stocks is arrived at by working out the yearly regional weighted average cost except for Non-ferrous Metals where weighted average cost of remaining stock after including all expenses incurred upto the point at which they are lying is considered.
In case of cut & polished stones, medallions and jewellery (finished/semi finished) cost includes wastages and other direct manufacturing cost.
Gold/Silver purchased from foreign suppliers against booking by exporters under replenishment option and not delivered at the year end are shown as stocks of company and valued at cost.
(c) DOMESTIC
Packing material is valued at lower of the cost or realisable value as on 31st March.
(d) STOCK ON LOAN/FABRICATION
Stocks with fabricators are taken as the stocks of the company, till adjustments.
13. PRIOR PERIOD ADJUSTMENTS
Expenditure/income relating to previous year is shown in the accounts under the head “Prior Period Adjustment Account” as per the provisions of AS-5 (Net Profit or Loss for the period, Prior Period Items and Changes in Accounting Policies) issued by Institute of Chartered Accountants of India.
14. BORROWING COSTS
(i) Borrowing cost in ordinary course of business are recognized as an expense in the period in which these are incurred.
(ii) Borrowing costs that are attributable to the acquisition, construction of qualifying assets are capitalised as part of cost of such asset upto the date the assets are ready for their intended use. All other borrowing costs are recognised as an expense in the year in which they have been incurred.
15. DEFERRED TAX
Deferred tax is recognized, subject to consideration of prudence on timing differences representing the difference between the Taxable income and Accounting income that originate in one period and are capable of reversal in one or more subsequent periods. Deferred tax assets and liabilities are measured using tax rates and the tax laws that have been enacted or substantively enacted by the Balance Sheet date.
115
16. IMPAIRMENT OF ASSETS
An asset is treated as impaired when the carrying cost of assets exceeds its recoverable value and impairment loss is charged to Profit and Loss account in the year in which an asset is identified as impaired. The impairment loss recognized in prior accounting periods is reversed if there has been a change in the estimate of recoverable amount.
17. PROVISIONS, CONTINGENT LIABILITIES AND CONTINGENT ASSETS
(I) Provisions (a) Provisions for Doubtful Debts/Advances/Claims:
Provision for doubtful debts/advances/claims is made where there is uncertainty of realization irrespective of the period of its dues. For outstanding over three years (except Government dues) full provision is made unless the amount is considered recoverable. Debts/advances/ claims are written off when unrealisability is almost established.
(b) Others
Provision is recognized when
(i) the Company has a present obligation as a result of the past event.
(ii) a probable outflow of resources is expected to settle the obligation and a reliable estimate of the amount of the obligation can be made.
Reimbursement of the expenditure required to settle a provision is recognised as per contract provision or when it is virtually certain that reimbursement will be received.
Provisions are reviewed at each Balance Sheet date.
(II) Contingent liabilities and contingent assets
(i) Contingent liabilities are not recognized but are disclosed in the Notes to the Accounts.
(ii) Contingent assets are neither recognized nor disclosed in the financial statements.
18. TREATEMENT OF EXPENDITURE DURING PROJECT IMPLEMENTATION /CONSTRUCTION PERIOD
Expenditure during construction period is included under Pre-operative expenses and the same is being allocated to the r espect i ve f i xed assets on the complet ion of erection/installation.
19. OPERATING LEASES
Leases of assets in which a significant portion of the risks and rewards of ownership are retained by the lessor are classified
as operating leases. Payments made under operating leases (net of any incentives received from the lessor) are taken to the income statement on a straight line basis over the period of lease.
Contingent rents are recognized as an expense in the income statement in the financial year in which termination takes place.
When an operating lease is terminated before the lease period has expired, any payment required to be made to the lessor by way of penalty is recognized as an expense in the financial year in which termination takes place.
20. PRINCIPLES OF CONSOLIDATION
The Consolidated Financial Statements relate to MMTC Limited, its subsidiary Company and the interest of the Company in joint ventures, in the form of jointly controlled entities.
(a) The financial statements of the Parent Company and its Subsidiary are combined on a line by line basis by adding together the book values of like items of assets, liabilities, income and expenses, after fully eliminating intra group balances and intra group transactions resulting in unrealised profits or losses in accordance with Accounting Standard (AS) 21 “Consolidated Financial Statements” issued by the Institute of Chartered Accountants of India.
(b) In translating the financial statements of non-integral foreign subsidiary for incorporation of its financial statements, the following procedures is adopted:-
i) the assets and liabilities, both monetary and non-monetary, of the non-integral foreign subsidiary translated at the closing rate as defined in the AS-11 issued by the Institute of Chartered Accountants of India;
ii) income and expense items of the non-integral foreign subsidiary are translated at average exchange rate and
iii) all resulting exchange differences are accumulated in a foreign currency translation reserve until the disposal of the net investment.
(c) In case of Associates, where the Company, directly or indirectly through subsidiaries holds more than 20% of equity, have been accounted for using “Equity Method” of Accounting described by Accounting Standard (AS) 23 “Accounting for Investment in Associates in Consolidated Financial Statements” issued by the Institute of Chartered Accountants of India.
(d) The Company accounts for its share in the change in the net assets of the associates, post-acquisition, after eliminating unrealised profits and losses resulting from transactions between the company and its associates to the extent of its share, through its profit and loss account to the extent such change is attributable to the associates' profit and loss account and through its reserve for the balance, based on available information.
th46 Annual Report 2008-09
(e) The differences between the cost of investment in the associates and the share of net assets at the time of acquisition of shares in the associates is identified in the financial statements as Goodwill or Capital Reserve as the case may be.
(f) The Consolidated Financial Statements include the interest of the Company in Joint Venture Companies, which has been accounted for using the proportionate consolidation method of accounting and reporting whereby the Company's share of each of the assets, liabilities, income and expenses of a jointly controlled entity is considered as, separate line items in the Consolidated Financial Statements.
(g) As far as possible the Consolidated Financial Statement is prepared using uniform accounting policies for like transactions and other events in similar circumstances, and are presented in the same manner as the Companies Separate Financial Statements.
For N K Bhargava & CO.Chartered Accountants
Sd/- Sd/-(N K Bhargava) ( Manohar Balwani )
Partner GM and Company Secretary M.No.080624
Sd/-( Vijay Pal )
Chief General Manager (F&A)
Sd/- Sd/-(S K Kar) (Sanjiv Batra)
Director-Finance Chairman and Managing Director
Place: New DelhiDate: 20th August 2009
117
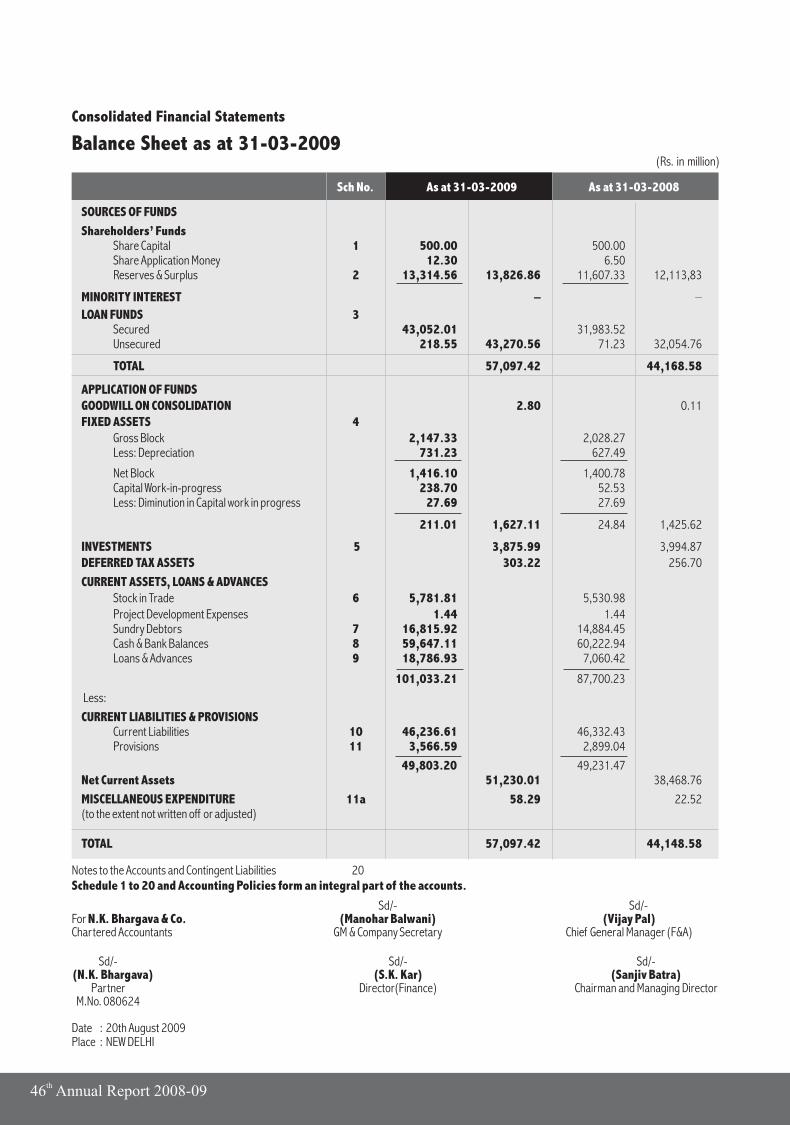
Balance Sheet as at 31-03-2009(Rs. in million)
Notes to the Accounts and Contingent Liabilities 20Schedule 1 to 20 and Accounting Policies form an integral part of the accounts.
Sd/- Sd/-For N.K. Bhargava & Co. (Manohar Balwani) (Vijay Pal)Chartered Accountants GM & Company Secretary Chief General Manager (F&A)
Sd/- Sd/- Sd/-(N.K. Bhargava) (S.K. Kar) (Sanjiv Batra)
Partner Director(Finance) Chairman and Managing DirectorM.No. 080624
Date : 20th August 2009Place : NEW DELHI
Consolidated Financial Statements
SOURCES OF FUNDS
Shareholders’ FundsShare Capital 1 500.00 500.00Share Application Money 12.30 6.50Reserves & Surplus 2 13,314.56 13,826.86 11,607.33 12,113,83
MINORITY INTEREST – –
LOAN FUNDS 3 Secured 43,052.01 31,983.52Unsecured 218.55 43,270.56 71.23 32,054.76
TOTAL 57,097.42 44,168.58
APPLICATION OF FUNDSGOODWILL ON CONSOLIDATION 2.80 0.11FIXED ASSETS 4
Gross Block 2,147.33 2,028.27Less: Depreciation 731.23 627.49
Net Block 1,416.10 1,400.78Capital Work-in-progress 238.70 52.53Less: Diminution in Capital work in progress 27.69 27.69
211.01 1,627.11 24.84 1,425.62
INVESTMENTS 5 3,875.99 3,994.87DEFERRED TAX ASSETS 303.22 256.70
CURRENT ASSETS, LOANS & ADVANCESStock in Trade 6 5,781.81 5,530.98Project Development Expenses 1.44 1.44Sundry Debtors 7 16,815.92 14,884.45Cash & Bank Balances 8 59,647.11 60,222.94Loans & Advances 9 18,786.93 7,060.42
101,033.21 87,700.23
Less:
CURRENT LIABILITIES & PROVISIONSCurrent Liabilities 10 46,236.61 46,332.43Provisions 11 3,566.59 2,899.04
49,803.20 49,231.47Net Current Assets 51,230.01 38,468.76
MISCELLANEOUS EXPENDITURE 11a 58.29 22.52(to the extent not written off or adjusted)
TOTAL 57,097.42 44,148.58
Sch No. As at 31-03-2009 As at 31-03-2008
th46 Annual Report 2008-09
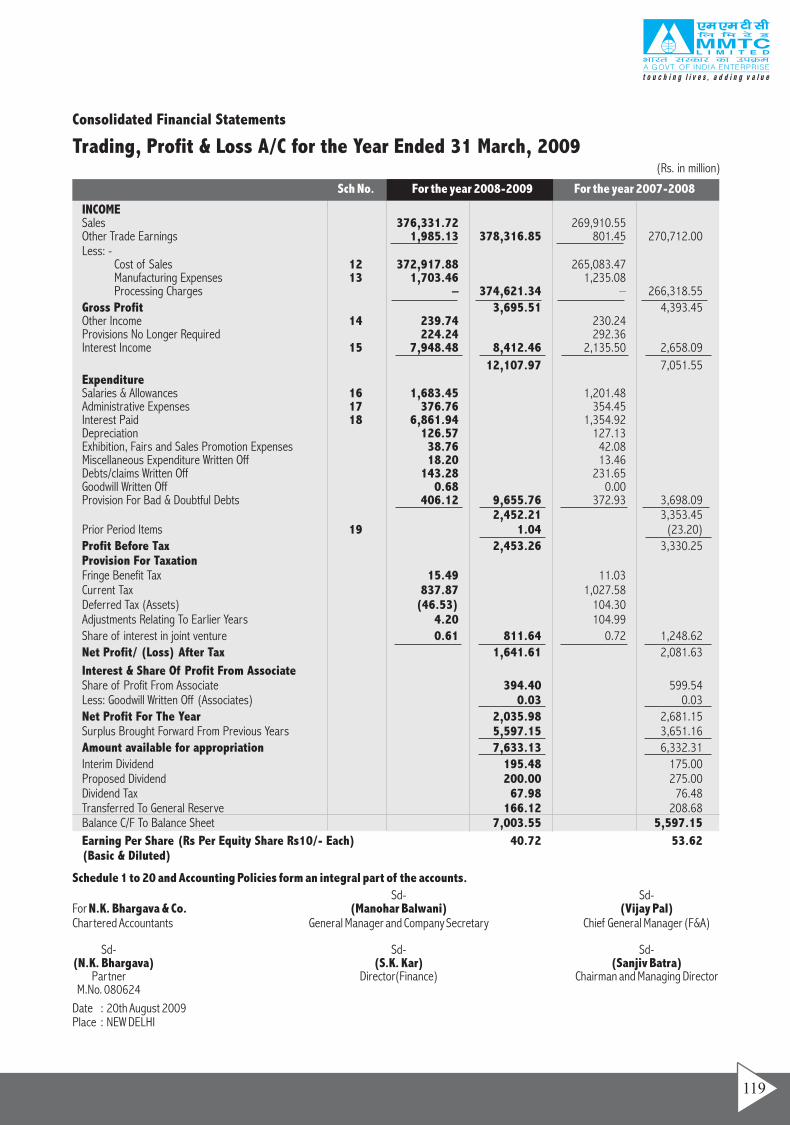
Trading, Profit & Loss A/C for the Year Ended 31 March, 2009(Rs. in million)
Consolidated Financial Statements
INCOMESales 376,331.72 269,910.55Other Trade Earnings 1,985.13 378,316.85 801.45 270,712.00Less: -
Cost of Sales 12 372,917.88 265,083.47Manufacturing Expenses 13 1,703.46 1,235.08Processing Charges – 374,621.34 – 266,318.55
Gross Profit 3,695.51 4,393.45Other Income 14 239.74 230.24Provisions No Longer Required 224.24 292.36Interest Income 15 7,948.48 8,412.46 2,135.50 2,658.09
12,107.97 7,051.55ExpenditureSalaries & Allowances 16 1,683.45 1,201.48Administrative Expenses 17 376.76 354.45Interest Paid 18 6,861.94 1,354.92Depreciation 126.57 127.13Exhibition, Fairs and Sales Promotion Expenses 38.76 42.08Miscellaneous Expenditure Written Off 18.20 13.46Debts/claims Written Off 143.28 231.65Goodwill Written Off 0.68 0.00Provision For Bad & Doubtful Debts 406.12 9,655.76 372.93 3,698.09
2,452.21 3,353.45Prior Period Items 19 1.04 (23.20)Profit Before Tax 2,453.26 3,330.25Provision For TaxationFringe Benefit Tax 15.49 11.03Current Tax 837.87 1,027.58Deferred Tax (Assets) (46.53) 104.30Adjustments Relating To Earlier Years 4.20 104.99Share of interest in joint venture 0.61 811.64 0.72 1,248.62Net Profit/ (Loss) After Tax 1,641.61 2,081.63
Interest & Share Of Profit From AssociateShare of Profit From Associate 394.40 599.54Less: Goodwill Written Off (Associates) 0.03 0.03Net Profit For The Year 2,035.98 2,681.15Surplus Brought Forward From Previous Years 5,597.15 3,651.16Amount available for appropriation 7,633.13 6,332.31Interim Dividend 195.48 175.00Proposed Dividend 200.00 275.00Dividend Tax 67.98 76.48Transferred To General Reserve 166.12 208.68Balance C/F To Balance Sheet 7,003.55 5,597.15
Earning Per Share (Rs Per Equity Share Rs10/- Each) 40.72 53.62(Basic & Diluted)
Sch No. For the year 2008-2009 For the year 2007-2008
Schedule 1 to 20 and Accounting Policies form an integral part of the accounts.
Sd- Sd-For N.K. Bhargava & Co. (Manohar Balwani) (Vijay Pal)Chartered Accountants General Manager and Company Secretary Chief General Manager (F&A)
Sd- Sd- Sd-(N.K. Bhargava) (S.K. Kar) (Sanjiv Batra)
Partner Director(Finance) Chairman and Managing DirectorM.No. 080624
Date : 20th August 2009 Place : NEW DELHI
119

Consolidated Financial Statements
Schedules 1 to 20 Annexed to & Forming Part of the Balance Sheet and Profit & Loss Account
(Rs. in million)Schedule 1 : Share Capital
Schedule 2 : Reserves & Surplus
Authorised
100,000,000 (P.Y.100,000,000)Equity shares of Rs.10/- each 1,000.00 1,000.00
Issued, Subscribed and Paid-up
50,000,000 (P.Y.50,000,000) Equity 500.00 500.00
Shares of Rs.10/- each fully paid.
Of the above, 47,000,000 (P.Y.47,000,000)
Equity shares of Rs. 10/- each allotted as
fully paid-up Bonus Shares by way of
capitalisation of Reserves
TOTAL 500.00 500.00
As at 31-03-2009 As at 31-03-2008
As at 1st April, 2008 96.79 – 6,043.99 (130.60) 5,597.15 11,607.33
Additions during the year :- – – 166.12 134.71 1,406.46 1,707.29
Deduction during the year :- – – – – – –
96.79 – 6,210.11 4.11 7,003.61 13,314.62
Share of Interest in Joint Ventures – – – – (0.06) (0.06)
TOTAL 96.79 – 6,210.11 4.11 7,003.55 13,314.56
Capital Self General Foreign Balance B/F Total
Reserve Insurance Reserve Currency From
Reserve Translation P&L A/C
Reserve
th46 Annual Report 2008-09
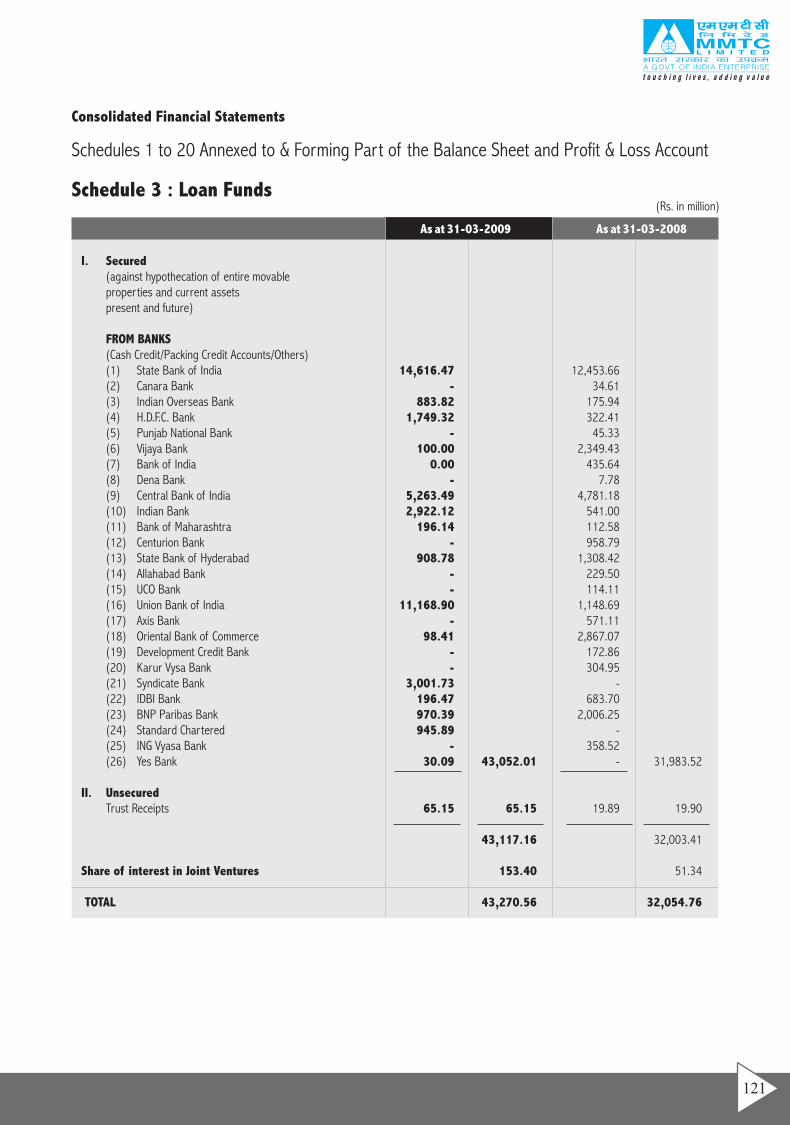
Consolidated Financial Statements
Schedule 3 : Loan Funds(Rs. in million)
I. Secured(against hypothecation of entire movableproperties and current assetspresent and future)
FROM BANKS (Cash Credit/Packing Credit Accounts/Others) (1) State Bank of India 14,616.47 12,453.66(2) Canara Bank - 34.61(3) Indian Overseas Bank 883.82 175.94(4) H.D.F.C. Bank 1,749.32 322.41(5) Punjab National Bank - 45.33(6) Vijaya Bank 100.00 2,349.43(7) Bank of India 0.00 435.64(8) Dena Bank - 7.78(9) Central Bank of India 5,263.49 4,781.18(10) Indian Bank 2,922.12 541.00(11) Bank of Maharashtra 196.14 112.58(12) Centurion Bank - 958.79(13) State Bank of Hyderabad 908.78 1,308.42 (14) Allahabad Bank - 229.50(15) UCO Bank - 114.11(16) Union Bank of India 11,168.90 1,148.69(17) Axis Bank - 571.11(18) Oriental Bank of Commerce 98.41 2,867.07(19) Development Credit Bank - 172.86(20) Karur Vysa Bank - 304.95(21) Syndicate Bank 3,001.73 -(22) IDBI Bank 196.47 683.70(23) BNP Paribas Bank 970.39 2,006.25(24) Standard Chartered 945.89 -(25) ING Vyasa Bank - 358.52(26) Yes Bank 30.09 43,052.01 - 31,983.52
II. UnsecuredTrust Receipts 65.15 65.15 19.89 19.90
43,117.16 32,003.41
Share of interest in Joint Ventures 153.40 51.34
TOTAL 43,270.56 32,054.76
As at 31-03-2009 As at 31-03-2008
Schedules 1 to 20 Annexed to & Forming Part of the Balance Sheet and Profit & Loss Account
121
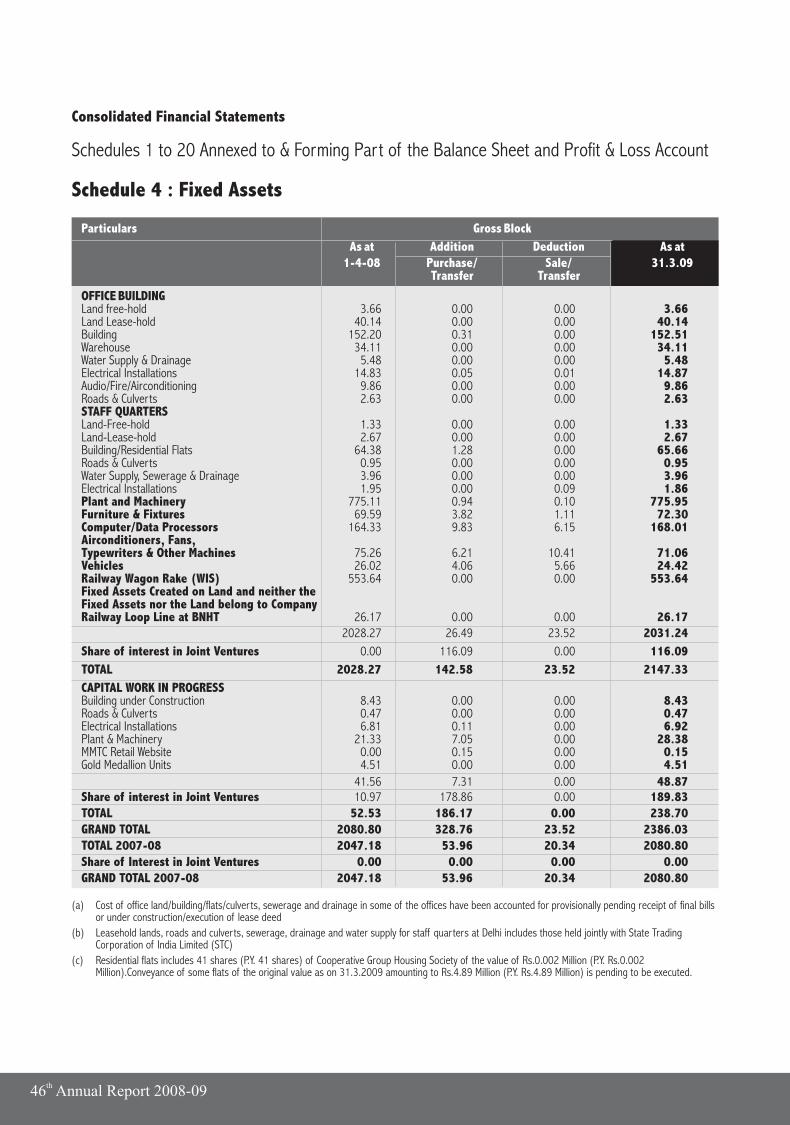
Schedule 4 : Fixed Assets
(a) Cost of office land/building/flats/culverts, sewerage and drainage in some of the offices have been accounted for provisionally pending receipt of final bills or under construction/execution of lease deed
(b) Leasehold lands, roads and culverts, sewerage, drainage and water supply for staff quarters at Delhi includes those held jointly with State Trading Corporation of India Limited (STC)
(c) Residential flats includes 41 shares (P.Y. 41 shares) of Cooperative Group Housing Society of the value of Rs.0.002 Million (P.Y. Rs.0.002 Million).Conveyance of some flats of the original value as on 31.3.2009 amounting to Rs.4.89 Million (P.Y. Rs.4.89 Million) is pending to be executed.
Particulars Gross Block
As at Addition Deduction As at1-4-08 Purchase/ Sale/ 31.3.09
Transfer Transfer
OFFICE BUILDINGLand free-hold 3.66 0.00 0.00 3.66Land Lease-hold 40.14 0.00 0.00 40.14Building 152.20 0.31 0.00 152.51Warehouse 34.11 0.00 0.00 34.11Water Supply & Drainage 5.48 0.00 0.00 5.48Electrical Installations 14.83 0.05 0.01 14.87Audio/Fire/Airconditioning 9.86 0.00 0.00 9.86Roads & Culverts 2.63 0.00 0.00 2.63STAFF QUARTERSLand-Free-hold 1.33 0.00 0.00 1.33Land-Lease-hold 2.67 0.00 0.00 2.67Building/Residential Flats 64.38 1.28 0.00 65.66Roads & Culverts 0.95 0.00 0.00 0.95Water Supply, Sewerage & Drainage 3.96 0.00 0.00 3.96 Electrical Installations 1.95 0.00 0.09 1.86Plant and Machinery 775.11 0.94 0.10 775.95 Furniture & Fixtures 69.59 3.82 1.11 72.30Computer/Data Processors 164.33 9.83 6.15 168.01Airconditioners, Fans, Typewriters & Other Machines 75.26 6.21 10.41 71.06Vehicles 26.02 4.06 5.66 24.42Railway Wagon Rake (WIS) 553.64 0.00 0.00 553.64Fixed Assets Created on Land and neither theFixed Assets nor the Land belong to CompanyRailway Loop Line at BNHT 26.17 0.00 0.00 26.17
2028.27 26.49 23.52 2031.24
Share of interest in Joint Ventures 0.00 116.09 0.00 116.09
TOTAL 2028.27 142.58 23.52 2147.33
CAPITAL WORK IN PROGRESSBuilding under Construction 8.43 0.00 0.00 8.43Roads & Culverts 0.47 0.00 0.00 0.47Electrical Installations 6.81 0.11 0.00 6.92Plant & Machinery 21.33 7.05 0.00 28.38MMTC Retail Website 0.00 0.15 0.00 0.15Gold Medallion Units 4.51 0.00 0.00 4.51
41.56 7.31 0.00 48.87Share of interest in Joint Ventures 10.97 178.86 0.00 189.83TOTAL 52.53 186.17 0.00 238.70GRAND TOTAL 2080.80 328.76 23.52 2386.03TOTAL 2007-08 2047.18 53.96 20.34 2080.80Share of Interest in Joint Ventures 0.00 0.00 0.00 0.00GRAND TOTAL 2007-08 2047.18 53.96 20.34 2080.80
Consolidated Financial Statements
Schedules 1 to 20 Annexed to & Forming Part of the Balance Sheet and Profit & Loss Account
th46 Annual Report 2008-09
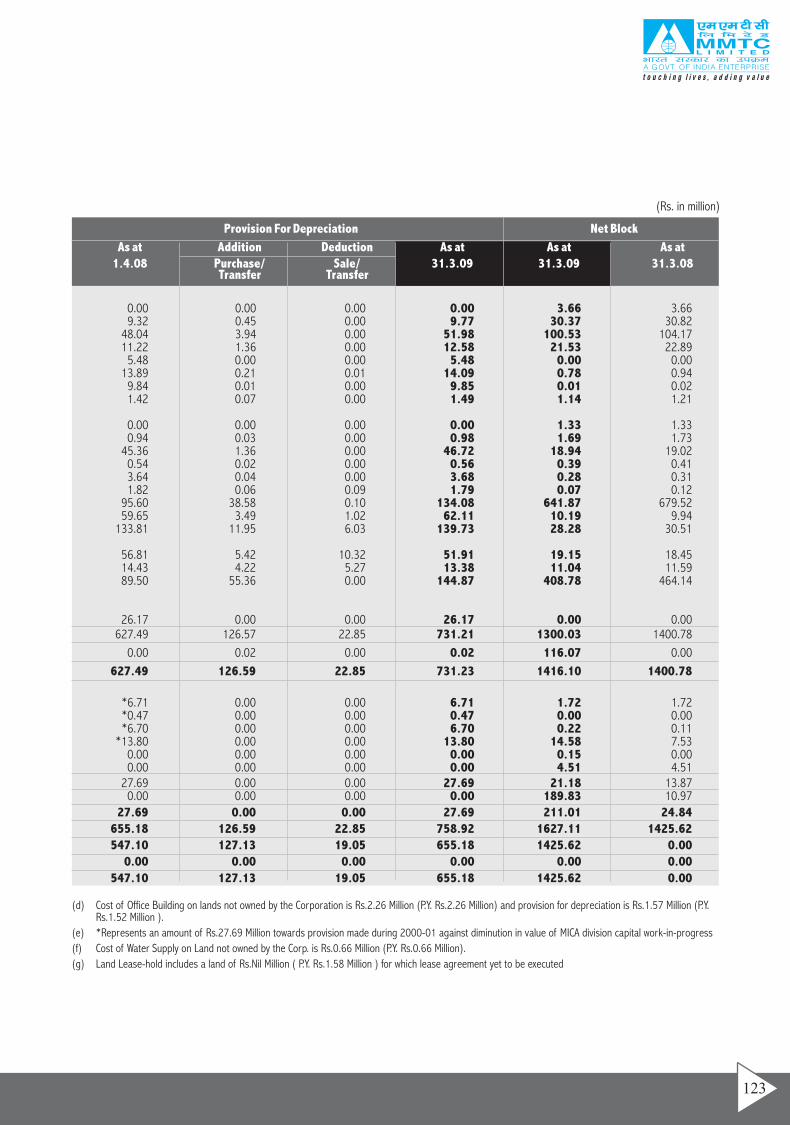
(Rs. in million)
(d) Cost of Office Building on lands not owned by the Corporation is Rs.2.26 Million (P.Y. Rs.2.26 Million) and provision for depreciation is Rs.1.57 Million (P.Y. Rs.1.52 Million ).
(e) *Represents an amount of Rs.27.69 Million towards provision made during 2000-01 against diminution in value of MICA division capital work-in-progress
(f) Cost of Water Supply on Land not owned by the Corp. is Rs.0.66 Million (P.Y. Rs.0.66 Million).
(g) Land Lease-hold includes a land of Rs.Nil Million ( P.Y. Rs.1.58 Million ) for which lease agreement yet to be executed
0.00 0.00 0.00 0.00 3.66 3.66 9.32 0.45 0.00 9.77 30.37 30.82
48.04 3.94 0.00 51.98 100.53 104.1711.22 1.36 0.00 12.58 21.53 22.89
5.48 0.00 0.00 5.48 0.00 0.0013.89 0.21 0.01 14.09 0.78 0.94
9.84 0.01 0.00 9.85 0.01 0.021.42 0.07 0.00 1.49 1.14 1.21
0.00 0.00 0.00 0.00 1.33 1.330.94 0.03 0.00 0.98 1.69 1.73
45.36 1.36 0.00 46.72 18.94 19.020.54 0.02 0.00 0.56 0.39 0.413.64 0.04 0.00 3.68 0.28 0.311.82 0.06 0.09 1.79 0.07 0.12
95.60 38.58 0.10 134.08 641.87 679.5259.65 3.49 1.02 62.11 10.19 9.94
133.81 11.95 6.03 139.73 28.28 30.51
56.81 5.42 10.32 51.91 19.15 18.4514.43 4.22 5.27 13.38 11.04 11.5989.50 55.36 0.00 144.87 408.78 464.14
26.17 0.00 0.00 26.17 0.00 0.00627.49 126.57 22.85 731.21 1300.03 1400.78
0.00 0.02 0.00 0.02 116.07 0.00
627.49 126.59 22.85 731.23 1416.10 1400.78
*6.71 0.00 0.00 6.71 1.72 1.72*0.47 0.00 0.00 0.47 0.00 0.00*6.70 0.00 0.00 6.70 0.22 0.11
*13.80 0.00 0.00 13.80 14.58 7.530.00 0.00 0.00 0.00 0.15 0.000.00 0.00 0.00 0.00 4.51 4.51
27.69 0.00 0.00 27.69 21.18 13.870.00 0.00 0.00 0.00 189.83 10.97
27.69 0.00 0.00 27.69 211.01 24.84655.18 126.59 22.85 758.92 1627.11 1425.62547.10 127.13 19.05 655.18 1425.62 0.00
0.00 0.00 0.00 0.00 0.00 0.00547.10 127.13 19.05 655.18 1425.62 0.00
Provision For Depreciation Net Block
As at Addition Deduction As at As at As at1.4.08 Purchase/ Sale/ 31.3.09 31.3.09 31.3.08
Transfer Transfer
123
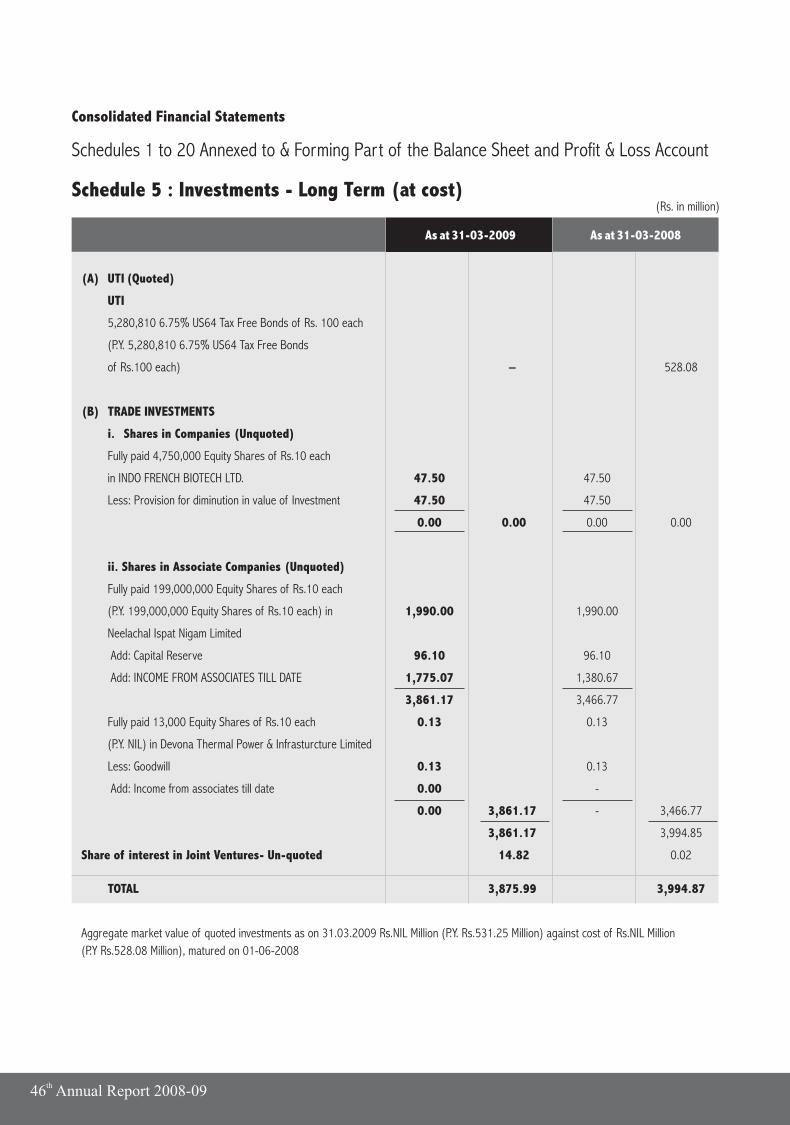
Consolidated Financial Statements
Schedules 1 to 20 Annexed to & Forming Part of the Balance Sheet and Profit & Loss Account
Schedule 5 : Investments - Long Term (at cost)(Rs. in million)
(A) UTI (Quoted)
UTI
5,280,810 6.75% US64 Tax Free Bonds of Rs. 100 each
(P.Y. 5,280,810 6.75% US64 Tax Free Bonds
of Rs.100 each) – 528.08
(B) TRADE INVESTMENTS
i. Shares in Companies (Unquoted)
Fully paid 4,750,000 Equity Shares of Rs.10 each
in INDO FRENCH BIOTECH LTD. 47.50 47.50
Less: Provision for diminution in value of Investment 47.50 47.50
0.00 0.00 0.00 0.00
ii. Shares in Associate Companies (Unquoted)
Fully paid 199,000,000 Equity Shares of Rs.10 each
(P.Y. 199,000,000 Equity Shares of Rs.10 each) in 1,990.00 1,990.00
Neelachal Ispat Nigam Limited
Add: Capital Reserve 96.10 96.10
Add: INCOME FROM ASSOCIATES TILL DATE 1,775.07 1,380.67
3,861.17 3,466.77
Fully paid 13,000 Equity Shares of Rs.10 each 0.13 0.13
(P.Y. NIL) in Devona Thermal Power & Infrasturcture Limited
Less: Goodwill 0.13 0.13
Add: Income from associates till date 0.00 -
0.00 3,861.17 - 3,466.77
3,861.17 3,994.85
Share of interest in Joint Ventures- Un-quoted 14.82 0.02
TOTAL 3,875.99 3,994.87
Aggregate market value of quoted investments as on 31.03.2009 Rs.NIL Million (P.Y. Rs.531.25 Million) against cost of Rs.NIL Million
(P.Y Rs.528.08 Million), matured on 01-06-2008
As at 31-03-2009 As at 31-03-2008
th46 Annual Report 2008-09
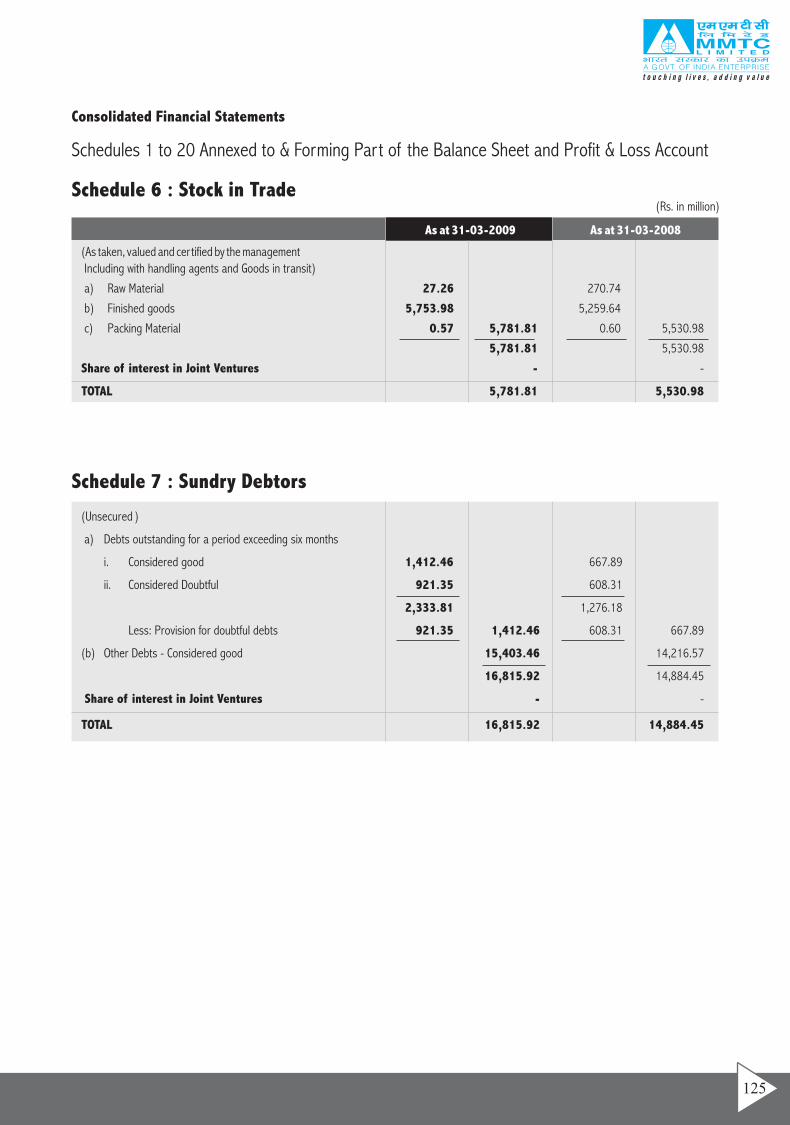
Schedule 7 : Sundry Debtors
(Unsecured )
a) Debts outstanding for a period exceeding six months
i. Considered good 1,412.46 667.89
ii. Considered Doubtful 921.35 608.31
2,333.81 1,276.18
Less: Provision for doubtful debts 921.35 1,412.46 608.31 667.89
(b) Other Debts - Considered good 15,403.46 14,216.57
16,815.92 14,884.45
Share of interest in Joint Ventures - -
TOTAL 16,815.92 14,884.45
(Rs. in million)Schedule 6 : Stock in Trade
Consolidated Financial Statements
Schedules 1 to 20 Annexed to & Forming Part of the Balance Sheet and Profit & Loss Account
(As taken, valued and certified by the management
Including with handling agents and Goods in transit)
a) Raw Material 27.26 270.74
b) Finished goods 5,753.98 5,259.64
c) Packing Material 0.57 5,781.81 0.60 5,530.98
5,781.81 5,530.98
Share of interest in Joint Ventures - -
TOTAL 5,781.81 5,530.98
As at 31-03-2009 As at 31-03-2008
125
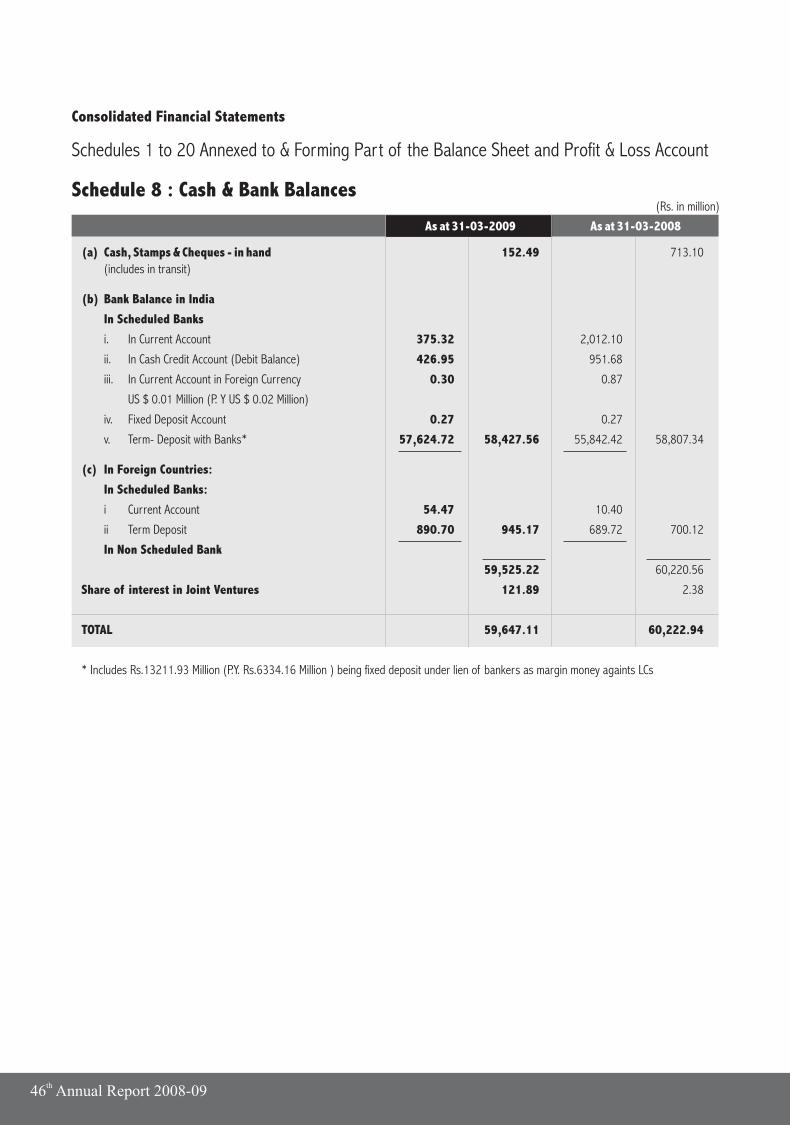
Schedule 8 : Cash & Bank Balances(Rs. in million)
Consolidated Financial Statements
Schedules 1 to 20 Annexed to & Forming Part of the Balance Sheet and Profit & Loss Account
(a) Cash, Stamps & Cheques - in hand 152.49 713.10
(includes in transit)
(b) Bank Balance in India
In Scheduled Banks
i. In Current Account 375.32 2,012.10
ii. In Cash Credit Account (Debit Balance) 426.95 951.68
iii. In Current Account in Foreign Currency 0.30 0.87
US $ 0.01 Million (P. Y US $ 0.02 Million)
iv. Fixed Deposit Account 0.27 0.27
v. Term- Deposit with Banks* 57,624.72 58,427.56 55,842.42 58,807.34
(c) In Foreign Countries:
In Scheduled Banks:
i Current Account 54.47 10.40
ii Term Deposit 890.70 945.17 689.72 700.12
In Non Scheduled Bank
59,525.22 60,220.56
Share of interest in Joint Ventures 121.89 2.38
TOTAL 59,647.11 60,222.94
* Includes Rs.13211.93 Million (P.Y. Rs.6334.16 Million ) being fixed deposit under lien of bankers as margin money againts LCs
As at 31-03-2009 As at 31-03-2008
th46 Annual Report 2008-09
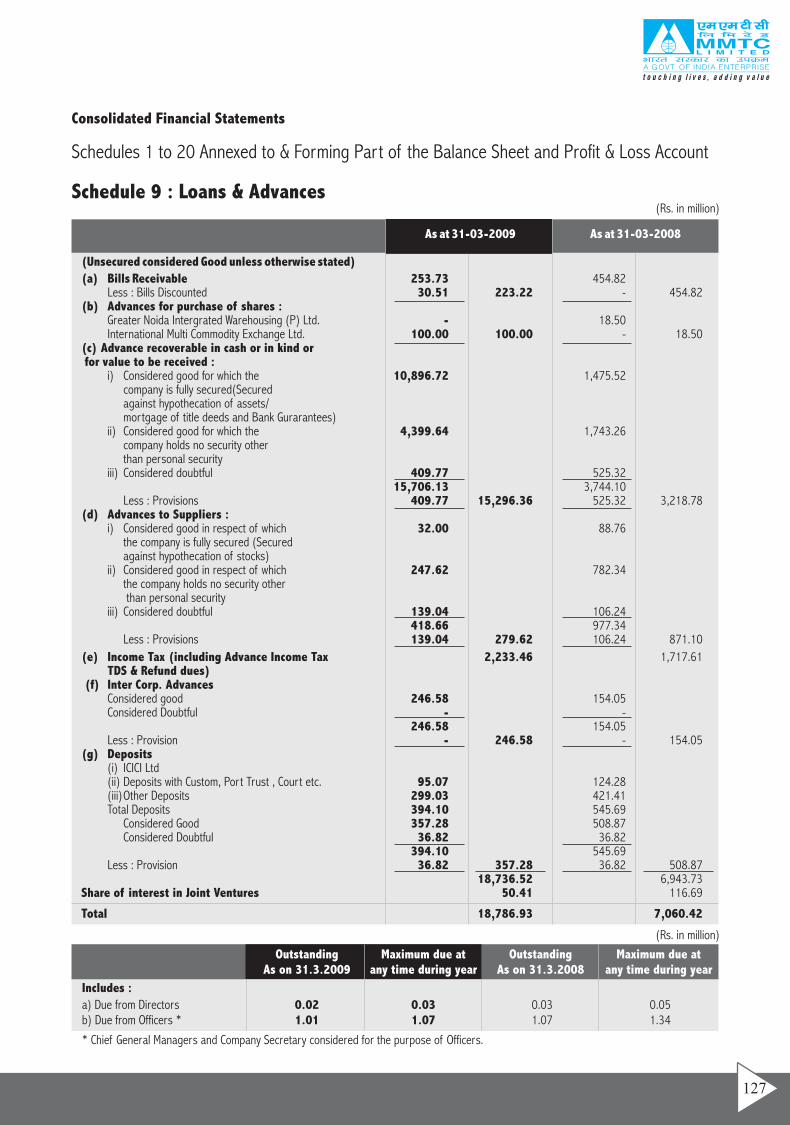
(Unsecured considered Good unless otherwise stated)
(a) Bills Receivable 253.73 454.82Less : Bills Discounted 30.51 223.22 - 454.82
(b) Advances for purchase of shares : Greater Noida Intergrated Warehousing (P) Ltd. - 18.50
International Multi Commodity Exchange Ltd. 100.00 100.00 - 18.50 (c) Advance recoverable in cash or in kind or for value to be received :
i) Considered good for which the 10,896.72 1,475.52company is fully secured(Secured against hypothecation of assets/ mortgage of title deeds and Bank Gurarantees)
ii) Considered good for which the 4,399.64 1,743.26company holds no security other than personal security
iii) Considered doubtful 409.77 525.32 15,706.13 3,744.10
Less : Provisions 409.77 15,296.36 525.32 3,218.78(d) Advances to Suppliers :
i) Considered good in respect of which 32.00 88.76 the company is fully secured (Securedagainst hypothecation of stocks)
ii) Considered good in respect of which 247.62 782.34 the company holds no security other than personal security
iii) Considered doubtful 139.04 106.24 418.66 977.34
Less : Provisions 139.04 279.62 106.24 871.10
(e) Income Tax (including Advance Income Tax 2,233.46 1,717.61TDS & Refund dues)
(f) Inter Corp. Advances Considered good 246.58 154.05Considered Doubtful - -
246.58 154.05 Less : Provision - 246.58 - 154.05
(g) Deposits (i) ICICI Ltd(ii) Deposits with Custom, Port Trust , Court etc. 95.07 124.28(iii)Other Deposits 299.03 421.41Total Deposits 394.10 545.69
Considered Good 357.28 508.87Considered Doubtful 36.82 36.82
394.10 545.69Less : Provision 36.82 357.28 36.82 508.87
18,736.52 6,943.73 Share of interest in Joint Ventures 50.41 116.69
Total 18,786.93 7,060.42
As at 31-03-2009 As at 31-03-2008
Consolidated Financial Statements
Schedules 1 to 20 Annexed to & Forming Part of the Balance Sheet and Profit & Loss Account
(Rs. in million)
(Rs. in million)
Schedule 9 : Loans & Advances
Includes :
a) Due from Directors 0.02 0.03 0.03 0.05b) Due from Officers * 1.01 1.07 1.07 1.34
* Chief General Managers and Company Secretary considered for the purpose of Officers.
Outstanding Maximum due at Outstanding Maximum due at As on 31.3.2009 any time during year As on 31.3.2008 any time during year
127
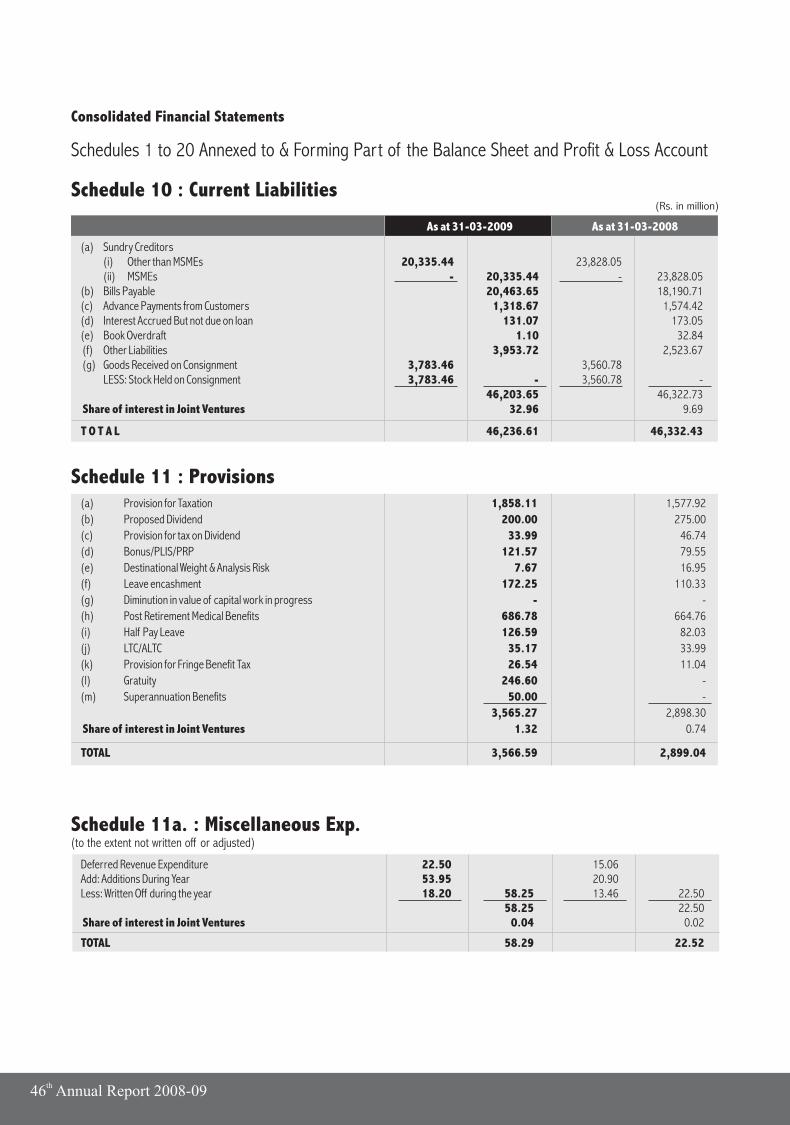
Consolidated Financial Statements
Schedules 1 to 20 Annexed to & Forming Part of the Balance Sheet and Profit & Loss Account
Schedule 10 : Current Liabilities
(a) Sundry Creditors (i) Other than MSMEs 20,335.44 23,828.05(ii) MSMEs - 20,335.44 - 23,828.05
(b) Bills Payable 20,463.65 18,190.71(c) Advance Payments from Customers 1,318.67 1,574.42(d) Interest Accrued But not due on loan 131.07 173.05(e) Book Overdraft 1.10 32.84 (f) Other Liabilities 3,953.72 2,523.67 (g) Goods Received on Consignment 3,783.46 3,560.78
LESS: Stock Held on Consignment 3,783.46 - 3,560.78 -46,203.65 46,322.73
Share of interest in Joint Ventures 32.96 9.69
T O T A L 46,236.61 46,332.43
As at 31-03-2009 As at 31-03-2008
Deferred Revenue Expenditure 22.50 15.06Add: Additions During Year 53.95 20.90Less: Written Off during the year 18.20 58.25 13.46 22.50
58.25 22.50 Share of interest in Joint Ventures 0.04 0.02
TOTAL 58.29 22.52
Schedule 11a. : Miscellaneous Exp.(to the extent not written off or adjusted)
(a) Provision for Taxation 1,858.11 1,577.92
(b) Proposed Dividend 200.00 275.00
(c) Provision for tax on Dividend 33.99 46.74
(d) Bonus/PLIS/PRP 121.57 79.55
(e) Destinational Weight & Analysis Risk 7.67 16.95
(f) Leave encashment 172.25 110.33
(g) Diminution in value of capital work in progress - -
(h) Post Retirement Medical Benefits 686.78 664.76
(i) Half Pay Leave 126.59 82.03
(j) LTC/ALTC 35.17 33.99
(k) Provision for Fringe Benefit Tax 26.54 11.04
(l) Gratuity 246.60 -
(m) Superannuation Benefits 50.00 -
3,565.27 2,898.30
Share of interest in Joint Ventures 1.32 0.74
TOTAL 3,566.59 2,899.04
Schedule 11 : Provisions
(Rs. in million)
th46 Annual Report 2008-09
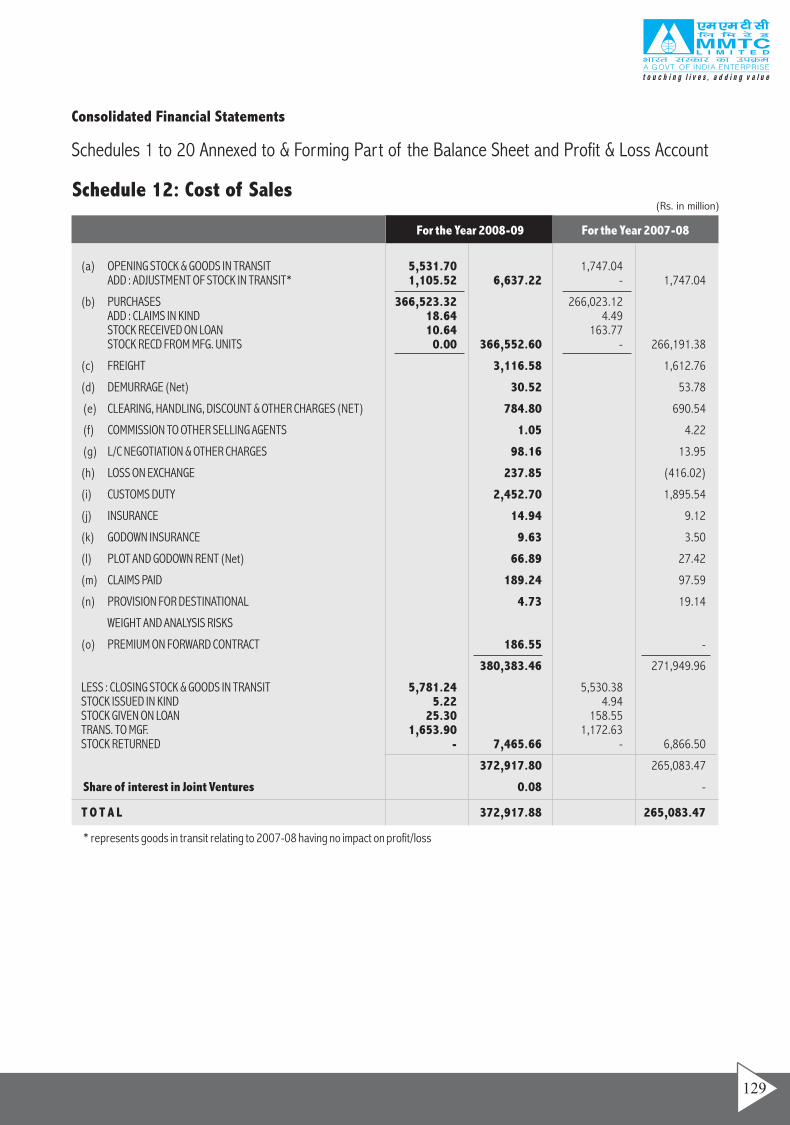
Consolidated Financial Statements
Schedules 1 to 20 Annexed to & Forming Part of the Balance Sheet and Profit & Loss Account
(Rs. in million)Schedule 12: Cost of Sales
(a) OPENING STOCK & GOODS IN TRANSIT 5,531.70 1,747.04 ADD : ADJUSTMENT OF STOCK IN TRANSIT* 1,105.52 6,637.22 - 1,747.04
(b) PURCHASES 366,523.32 266,023.12ADD : CLAIMS IN KIND 18.64 4.49 STOCK RECEIVED ON LOAN 10.64 163.77STOCK RECD FROM MFG. UNITS 0.00 366,552.60 - 266,191.38
(c) FREIGHT 3,116.58 1,612.76
(d) DEMURRAGE (Net) 30.52 53.78
(e) CLEARING, HANDLING, DISCOUNT & OTHER CHARGES (NET) 784.80 690.54
(f) COMMISSION TO OTHER SELLING AGENTS 1.05 4.22
(g) L/C NEGOTIATION & OTHER CHARGES 98.16 13.95
(h) LOSS ON EXCHANGE 237.85 (416.02)
(i) CUSTOMS DUTY 2,452.70 1,895.54
(j) INSURANCE 14.94 9.12
(k) GODOWN INSURANCE 9.63 3.50
(l) PLOT AND GODOWN RENT (Net) 66.89 27.42
(m) CLAIMS PAID 189.24 97.59
(n) PROVISION FOR DESTINATIONAL 4.73 19.14
WEIGHT AND ANALYSIS RISKS
(o) PREMIUM ON FORWARD CONTRACT 186.55 -
380,383.46 271,949.96
LESS : CLOSING STOCK & GOODS IN TRANSIT 5,781.24 5,530.38STOCK ISSUED IN KIND 5.22 4.94STOCK GIVEN ON LOAN 25.30 158.55 TRANS. TO MGF. 1,653.90 1,172.63 STOCK RETURNED - 7,465.66 - 6,866.50
372,917.80 265,083.47
Share of interest in Joint Ventures 0.08 -
T O T A L 372,917.88 265,083.47
* represents goods in transit relating to 2007-08 having no impact on profit/loss
For the Year 2008-09 For the Year 2007-08
129
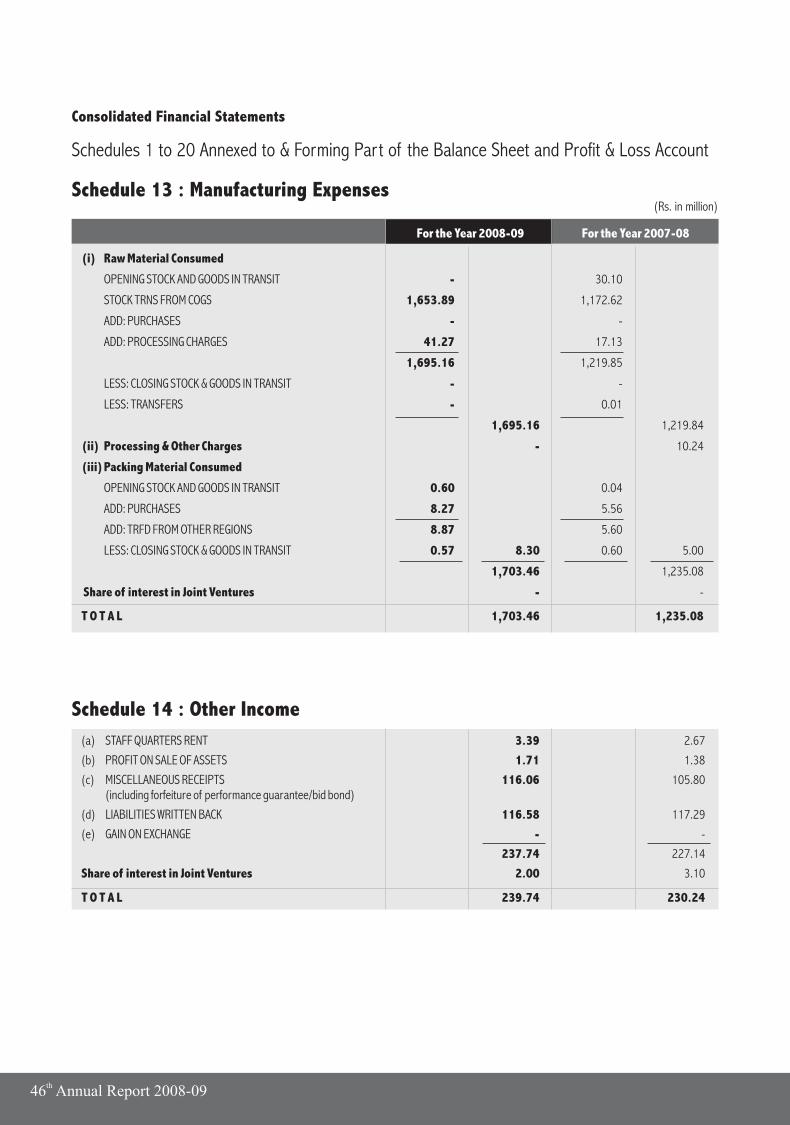
(a) STAFF QUARTERS RENT 3.39 2.67
(b) PROFIT ON SALE OF ASSETS 1.71 1.38
(c) MISCELLANEOUS RECEIPTS 116.06 105.80(including forfeiture of performance guarantee/bid bond)
(d) LIABILITIES WRITTEN BACK 116.58 117.29
(e) GAIN ON EXCHANGE - -
237.74 227.14
Share of interest in Joint Ventures 2.00 3.10
T O T A L 239.74 230.24
Schedule 14 : Other Income
(i) Raw Material Consumed
OPENING STOCK AND GOODS IN TRANSIT - 30.10
STOCK TRNS FROM COGS 1,653.89 1,172.62
ADD: PURCHASES - -
ADD: PROCESSING CHARGES 41.27 17.13
1,695.16 1,219.85
LESS: CLOSING STOCK & GOODS IN TRANSIT - -
LESS: TRANSFERS - 0.01
1,695.16 1,219.84
(ii) Processing & Other Charges - 10.24
(iii)Packing Material Consumed
OPENING STOCK AND GOODS IN TRANSIT 0.60 0.04
ADD: PURCHASES 8.27 5.56
ADD: TRFD FROM OTHER REGIONS 8.87 5.60
LESS: CLOSING STOCK & GOODS IN TRANSIT 0.57 8.30 0.60 5.00
1,703.46 1,235.08
Share of interest in Joint Ventures - -
T O T A L 1,703.46 1,235.08
For the Year 2008-09 For the Year 2007-08
(Rs. in million)Schedule 13 : Manufacturing Expenses
Consolidated Financial Statements
Schedules 1 to 20 Annexed to & Forming Part of the Balance Sheet and Profit & Loss Account
th46 Annual Report 2008-09
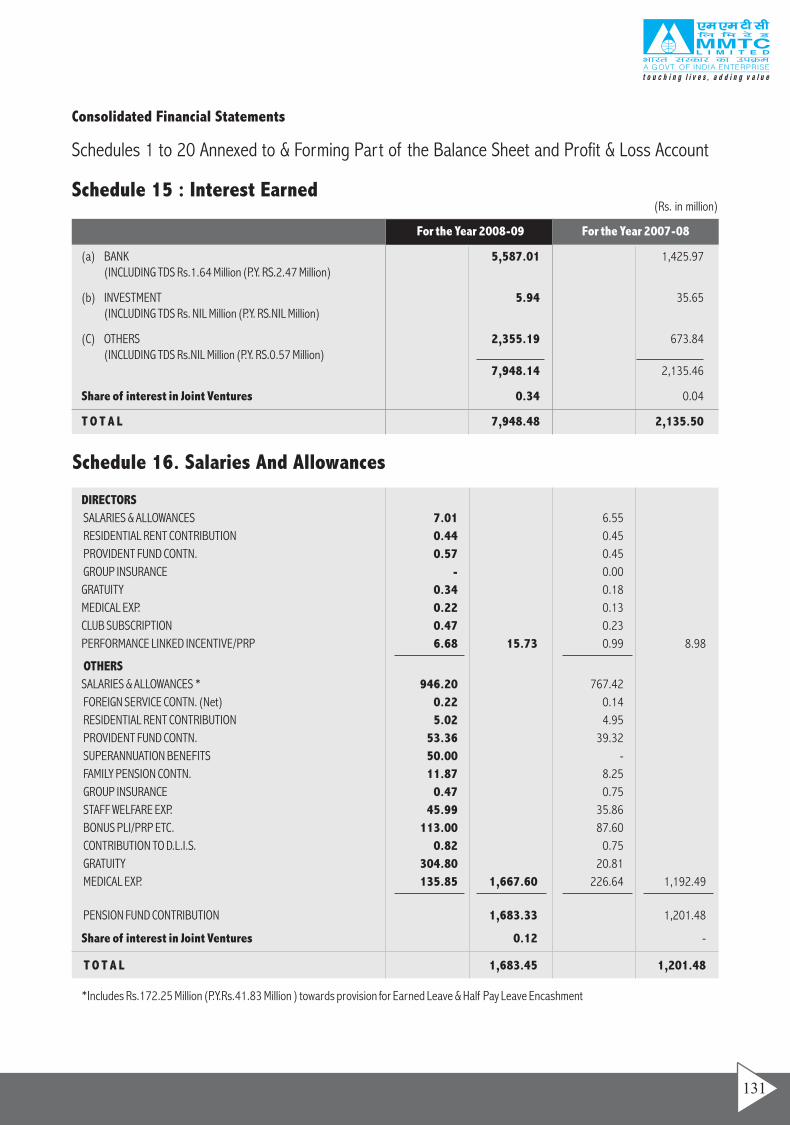
Schedule 15 : Interest Earned
Consolidated Financial Statements
Schedules 1 to 20 Annexed to & Forming Part of the Balance Sheet and Profit & Loss Account
(Rs. in million)
(a) BANK 5,587.01 1,425.97(INCLUDING TDS Rs.1.64 Million (P.Y. RS.2.47 Million)
(b) INVESTMENT 5.94 35.65 (INCLUDING TDS Rs. NIL Million (P.Y. RS.NIL Million)
(C) OTHERS 2,355.19 673.84(INCLUDING TDS Rs.NIL Million (P.Y. RS.0.57 Million)
7,948.14 2,135.46
Share of interest in Joint Ventures 0.34 0.04
T O T A L 7,948.48 2,135.50
For the Year 2008-09 For the Year 2007-08
Schedule 16. Salaries And Allowances
DIRECTORS
SALARIES & ALLOWANCES 7.01 6.55
RESIDENTIAL RENT CONTRIBUTION 0.44 0.45
PROVIDENT FUND CONTN. 0.57 0.45
GROUP INSURANCE - 0.00
GRATUITY 0.34 0.18
MEDICAL EXP. 0.22 0.13
CLUB SUBSCRIPTION 0.47 0.23
PERFORMANCE LINKED INCENTIVE/PRP 6.68 15.73 0.99 8.98
OTHERS
SALARIES & ALLOWANCES * 946.20 767.42
FOREIGN SERVICE CONTN. (Net) 0.22 0.14
RESIDENTIAL RENT CONTRIBUTION 5.02 4.95
PROVIDENT FUND CONTN. 53.36 39.32
SUPERANNUATION BENEFITS 50.00 -
FAMILY PENSION CONTN. 11.87 8.25
GROUP INSURANCE 0.47 0.75
STAFF WELFARE EXP. 45.99 35.86
BONUS PLI/PRP ETC. 113.00 87.60
CONTRIBUTION TO D.L.I.S. 0.82 0.75
GRATUITY 304.80 20.81
MEDICAL EXP. 135.85 1,667.60 226.64 1,192.49
PENSION FUND CONTRIBUTION 1,683.33 1,201.48
Share of interest in Joint Ventures 0.12 -
T O T A L 1,683.45 1,201.48
*Includes Rs.172.25 Million (P.Y.Rs.41.83 Million ) towards provision for Earned Leave & Half Pay Leave Encashment
131
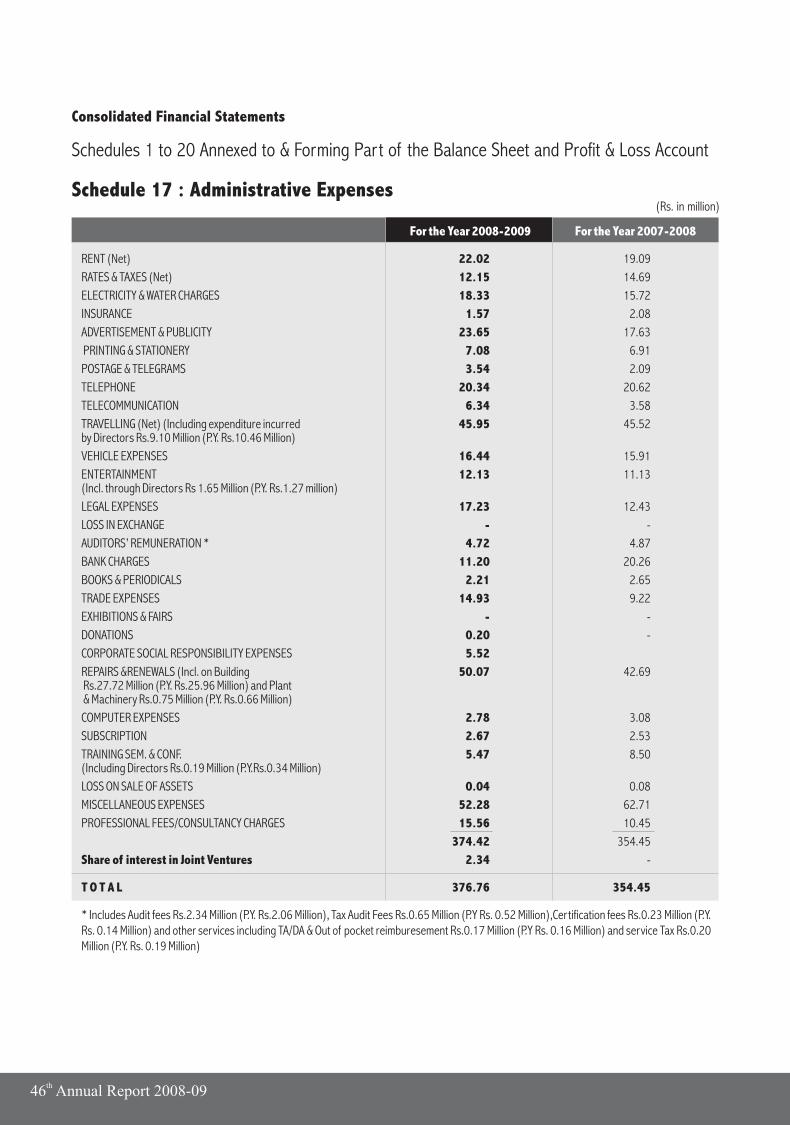
(Rs. in million)
Consolidated Financial Statements
Schedules 1 to 20 Annexed to & Forming Part of the Balance Sheet and Profit & Loss Account
Schedule 17 : Administrative Expenses
RENT (Net) 22.02 19.09
RATES & TAXES (Net) 12.15 14.69
ELECTRICITY & WATER CHARGES 18.33 15.72
INSURANCE 1.57 2.08
ADVERTISEMENT & PUBLICITY 23.65 17.63
PRINTING & STATIONERY 7.08 6.91
POSTAGE & TELEGRAMS 3.54 2.09
TELEPHONE 20.34 20.62
TELECOMMUNICATION 6.34 3.58
TRAVELLING (Net) (Including expenditure incurred 45.95 45.52by Directors Rs.9.10 Million (P.Y. Rs.10.46 Million)
VEHICLE EXPENSES 16.44 15.91
ENTERTAINMENT 12.13 11.13(Incl. through Directors Rs 1.65 Million (P.Y. Rs.1.27 million)
LEGAL EXPENSES 17.23 12.43
LOSS IN EXCHANGE - -
AUDITORS’ REMUNERATION * 4.72 4.87
BANK CHARGES 11.20 20.26
BOOKS & PERIODICALS 2.21 2.65
TRADE EXPENSES 14.93 9.22
EXHIBITIONS & FAIRS - -
DONATIONS 0.20 -
CORPORATE SOCIAL RESPONSIBILITY EXPENSES 5.52
REPAIRS &RENEWALS (Incl. on Building 50.07 42.69 Rs.27.72 Million (P.Y. Rs.25.96 Million) and Plant & Machinery Rs.0.75 Million (P.Y. Rs.0.66 Million)
COMPUTER EXPENSES 2.78 3.08
SUBSCRIPTION 2.67 2.53
TRAINING SEM. & CONF. 5.47 8.50(Including Directors Rs.0.19 Million (P.Y.Rs.0.34 Million)
LOSS ON SALE OF ASSETS 0.04 0.08
MISCELLANEOUS EXPENSES 52.28 62.71
PROFESSIONAL FEES/CONSULTANCY CHARGES 15.56 10.45
374.42 354.45
Share of interest in Joint Ventures 2.34 -
T O T A L 376.76 354.45
* Includes Audit fees Rs.2.34 Million (P.Y. Rs.2.06 Million), Tax Audit Fees Rs.0.65 Million (P.Y Rs. 0.52 Million),Certification fees Rs.0.23 Million (P.Y. Rs. 0.14 Million) and other services including TA/DA & Out of pocket reimburesement Rs.0.17 Million (P.Y Rs. 0.16 Million) and service Tax Rs.0.20 Million (P.Y. Rs. 0.19 Million)
For the Year 2008-2009 For the Year 2007-2008
th46 Annual Report 2008-09
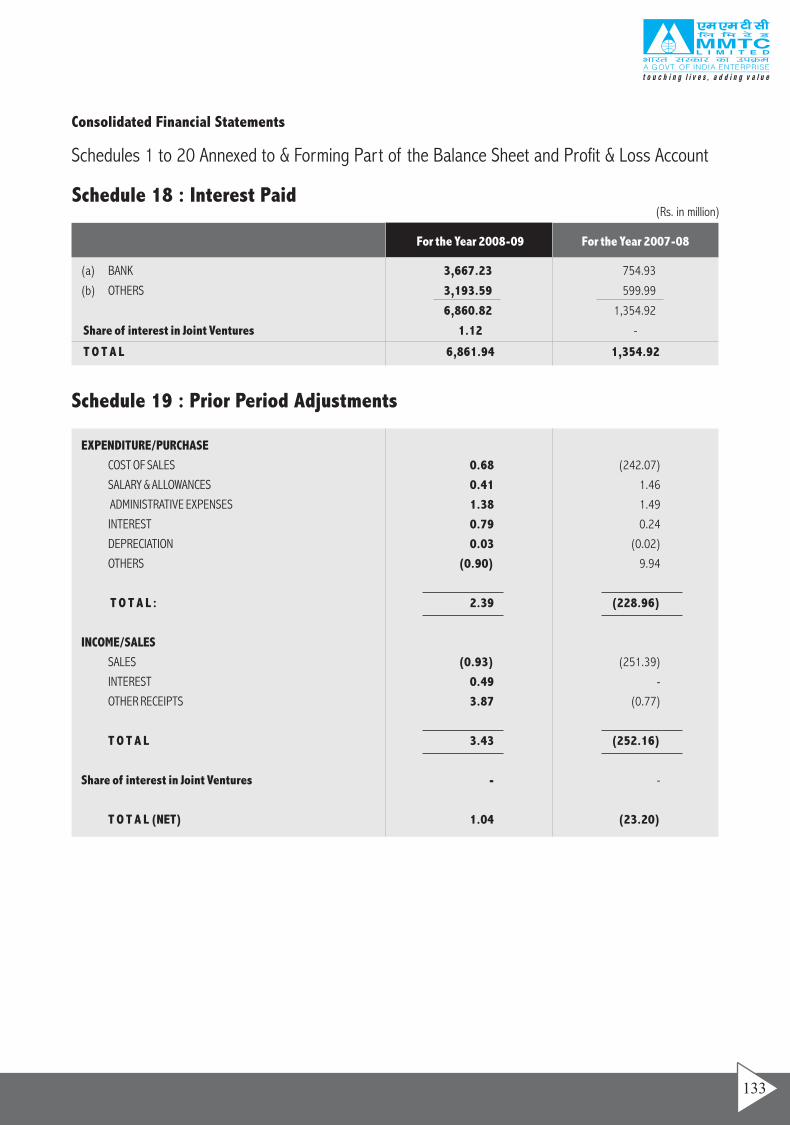
Consolidated Financial Statements
Schedules 1 to 20 Annexed to & Forming Part of the Balance Sheet and Profit & Loss Account
(a) BANK 3,667.23 754.93
(b) OTHERS 3,193.59 599.99
6,860.82 1,354.92
Share of interest in Joint Ventures 1.12 -
T O T A L 6,861.94 1,354.92
For the Year 2008-09 For the Year 2007-08
(Rs. in million)Schedule 18 : Interest Paid
EXPENDITURE/PURCHASE
COST OF SALES 0.68 (242.07)
SALARY & ALLOWANCES 0.41 1.46
ADMINISTRATIVE EXPENSES 1.38 1.49
INTEREST 0.79 0.24
DEPRECIATION 0.03 (0.02)
OTHERS (0.90) 9.94
T O T A L : 2.39 (228.96)
INCOME/SALES
SALES (0.93) (251.39)
INTEREST 0.49 -
OTHER RECEIPTS 3.87 (0.77)
T O T A L 3.43 (252.16)
Share of interest in Joint Ventures - -
T O T A L (NET) 1.04 (23.20)
Schedule 19 : Prior Period Adjustments
133
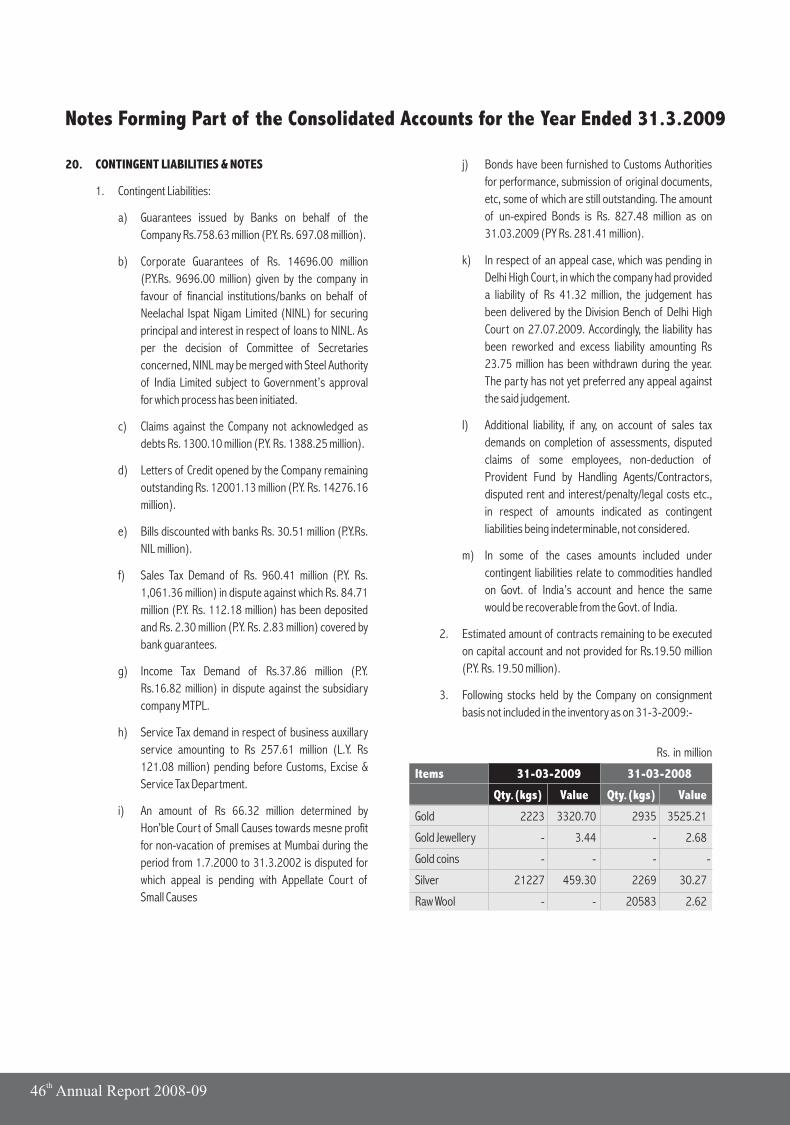
Notes Forming Part of the Consolidated Accounts for the Year Ended 31.3.2009
20. CONTINGENT LIABILITIES & NOTES
1. Contingent Liabilities:
a) Guarantees issued by Banks on behalf of the
Company Rs.758.63 million (P.Y. Rs. 697.08 million).
b) Corporate Guarantees of Rs. 14696.00 million
(P.Y.Rs. 9696.00 million) given by the company in
favour of financial institutions/banks on behalf of
Neelachal Ispat Nigam Limited (NINL) for securing
principal and interest in respect of loans to NINL. As
per the decision of Committee of Secretaries
concerned, NINL may be merged with Steel Authority
of India Limited subject to Government’s approval
for which process has been initiated.
c) Claims against the Company not acknowledged as
debts Rs. 1300.10 million (P.Y. Rs. 1388.25 million).
d) Letters of Credit opened by the Company remaining
outstanding Rs. 12001.13 million (P.Y. Rs. 14276.16
million).
e) Bills discounted with banks Rs. 30.51 million (P.Y.Rs.
NIL million).
f) Sales Tax Demand of Rs. 960.41 million (P.Y. Rs.
1,061.36 million) in dispute against which Rs. 84.71
million (P.Y. Rs. 112.18 million) has been deposited
and Rs. 2.30 million (P.Y. Rs. 2.83 million) covered by
bank guarantees.
g) Income Tax Demand of Rs.37.86 million (P.Y.
Rs.16.82 million) in dispute against the subsidiary
company MTPL.
h) Service Tax demand in respect of business auxillary
service amounting to Rs 257.61 million (L.Y. Rs
121.08 million) pending before Customs, Excise &
Service Tax Department.
i) An amount of Rs 66.32 million determined by
Hon’ble Court of Small Causes towards mesne profit
for non-vacation of premises at Mumbai during the
period from 1.7.2000 to 31.3.2002 is disputed for
which appeal is pending with Appellate Court of
Small Causes
j) Bonds have been furnished to Customs Authorities
for performance, submission of original documents,
etc, some of which are still outstanding. The amount
of un-expired Bonds is Rs. 827.48 million as on
31.03.2009 (PY Rs. 281.41 million).
k) In respect of an appeal case, which was pending in
Delhi High Court, in which the company had provided
a liability of Rs 41.32 million, the judgement has
been delivered by the Division Bench of Delhi High
Court on 27.07.2009. Accordingly, the liability has
been reworked and excess liability amounting Rs
23.75 million has been withdrawn during the year.
The party has not yet preferred any appeal against
the said judgement.
l) Additional liability, if any, on account of sales tax
demands on completion of assessments, disputed
claims of some employees, non-deduction of
Provident Fund by Handling Agents/Contractors,
disputed rent and interest/penalty/legal costs etc.,
in respect of amounts indicated as contingent
liabilities being indeterminable, not considered.
m) In some of the cases amounts included under
contingent liabilities relate to commodities handled
on Govt. of India’s account and hence the same
would be recoverable from the Govt. of India.
2. Estimated amount of contracts remaining to be executed
on capital account and not provided for Rs.19.50 million
(P.Y. Rs. 19.50 million).
3. Following stocks held by the Company on consignment
basis not included in the inventory as on 31-3-2009:-
Rs. in million
Gold 2223 3320.70 2935 3525.21
Gold Jewellery - 3.44 - 2.68
Gold coins - - - -
Silver 21227 459.30 2269 30.27
Raw Wool - - 20583 2.62
Items 31-03-2009 31-03-2008
Qty.(kgs) Value Qty.(kgs) Value
th46 Annual Report 2008-09
4. Loans and Advances and Sundry Creditors include Rs.
7414.99 million (P.Y. Rs. 1274.65 million) being notional
value of 4973 Kgs. (P.Y. 1058 Kgs) of gold belonging to
foreign suppliers issued on loan basis to the Associates/
Customers of the Company.
5. In respect of GR-1 forms outstanding beyond due date
the Company has filed application with the authorized
dealers for extension of time/waiver/ write off. Pending
decision on the application, the liability, if any, that may
arise is unascertainable. Enforcement Directorate has
imposed penalty for Rs. 19.53 million (P.Y. Rs. 20.13
million) which are being contested. Against this, an
amount of Rs. Nil million (P.Y. Rs 0.30 million) has been
deposited and bank guarantee of Rs. 7.30 million (P.Y. Rs.
7.30 million) furnished.
6. Duty Credit Authorization of Rs. 526.62 million (P.Y. Rs.
978.87 million) under the Target Plus Scheme 2004-05
which is valid upto 01.03.2010, is held by the Company
for duty free imports as admissible under the Scheme.
7. The Company being the nominated agency for import of
Gold and Silver has imported Gold under usance L/Cs or
availed buyer’s credit. Money received towards sale value
are put under Fixed Deposits with banks as margin or
otherwise. Interest earned thereon due to payment
received from customers before due date of usance L/C
or the buyer’s credit is payable to the customers as a
business policy.
8. Loans & Advances include Rs. 157.37 million
(P.Y.Rs.157.37 million) being the amount deposited with
the High Court in respect of a case which is still pending.
Necessary liability towards principal amount already
exists and the provision, if any, towards interest of Rs.
22.50 million (P.Y. Rs. 22.50 million) will be made after
final decision of the Court.
9. Income tax of Rs. 2233.46 million (P.Y. Rs. 1717.61
million) under the head “Loans and Advances” consists of
Rs.424.13 million (PY Rs. 420.36 million) paid to Income
Tax Department against the disputed demands of
Rs.457.06 million (P.Y. Rs. 450.36 millions) for various
assessment years and advance tax/TDS/FBT of Rs.
1809.33 million (PY Rs. 1297.24 million) towards income
tax/fringe benefit tax liability for financial years 2007-08 &
2008-09. Provision for additional demand, if any, will be
made on completion of the Appellate Proceedings.
10. The ERP package "RAMCO" implemented by the Company
has more or less stabilized. Any further adjustments in
processes and systems that may arise subsequent upon
the findings of the systems audit shall be incorporated in
due course.
11. Valuation of closing stock at market price being lower
than cost, has resulted in a loss of Rs.587.35 million (P.Y
Rs.13.37 million) during the year.
12. An amount of Rs.284.53 million (L.Y. Rs.284.53 million) is
outstanding against M/s AIPL in respect of Mint silver
transaction against which full provision amounting to
Rs.284.53 million (L.Y. Rs.284.53 million) has been made
in the accounts pending adjustment, if any, of excess sale
realization. The Company has filed a recovery suit of
Rs.314.02 million ( L.Y. Rs 314.02 million ) which includes
overdue interest of Rs.29.49 million( L.Y. Rs 29.49
million). M/s AIPL have also filed a suit against
Government Mint/MMTC for damages of Rs.1671.97
million ( L.Y. Rs 1671.97 million ) which is not tenable as
per legal opinion and is being contested.
13. During the year the company has imported pulses on the
directives of the Govt. of India. The Government has
allowed reimbursement of losses up to 15% and trading
margin @ 1.2%, which works out to Rs 1004.67 million
on the import made by the company which has been
credited to Profit & Loss Account as claims receivable
from the Government.
14. During the year an amount of Rs 237.85 million towards
difference in exchange has been shown under cost of
sales which has arisen mainly due to adoption of notional
exchange rate applicable on the date of bills of lading for
initial recognition in reporting currency in respect of
import purchases / export sales denominated in foreign
currency.
15. Sale of canalized urea to Deptt. of Fertilisers(DOF),
Government of India is made based on allocation letters
issued by DOF and by transferring shipping documents.
However, no separate agreement is signed with DOF.
16. The proportionate forward premium of Rs.182.46 million
(LY Rs. 107.07 million) for imports and Rs.Nil million (L.Y.
Rs.Nil million ) for exports to be recognized in the Profit &
Loss Account of the subsequent accounting year in terms
of the provisions of Accounting Standard – 11 issued by
the Institute of Chartered Accountant of India.
135
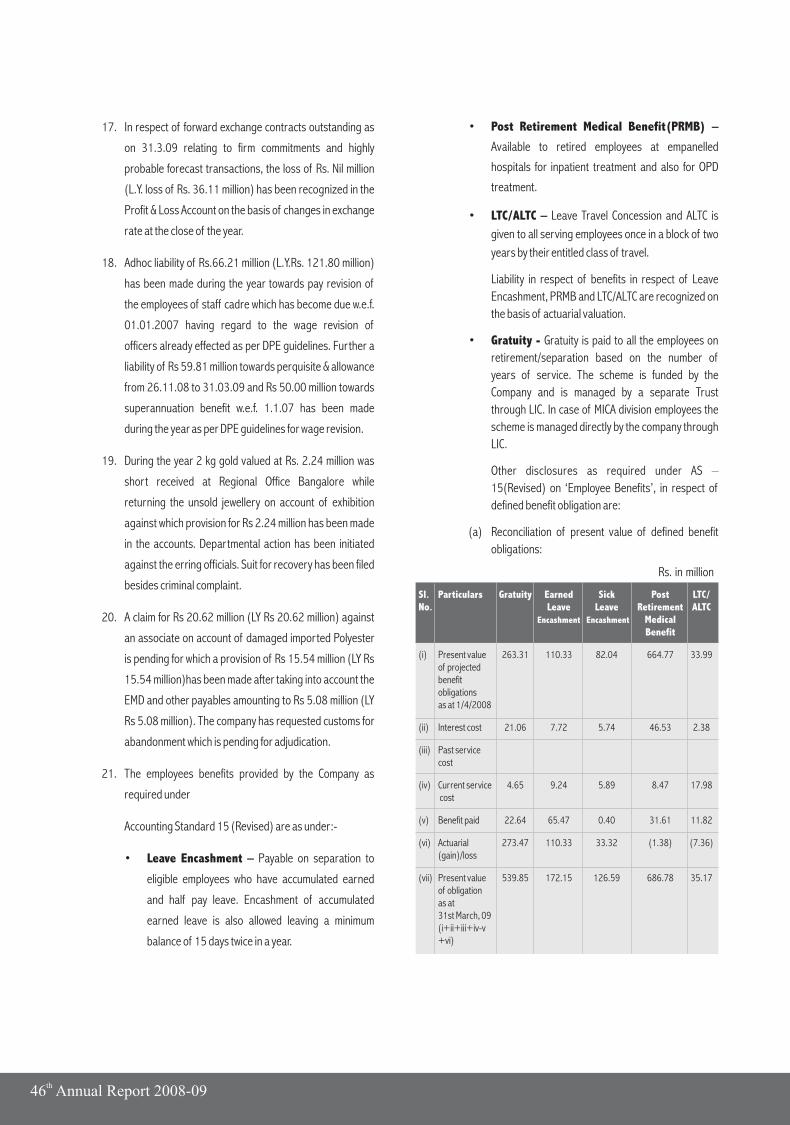
17. In respect of forward exchange contracts outstanding as
on 31.3.09 relating to firm commitments and highly
probable forecast transactions, the loss of Rs. Nil million
(L.Y. loss of Rs. 36.11 million) has been recognized in the
Profit & Loss Account on the basis of changes in exchange
rate at the close of the year.
18. Adhoc liability of Rs.66.21 million (L.Y.Rs. 121.80 million)
has been made during the year towards pay revision of
the employees of staff cadre which has become due w.e.f.
01.01.2007 having regard to the wage revision of
officers already effected as per DPE guidelines. Further a
liability of Rs 59.81 million towards perquisite & allowance
from 26.11.08 to 31.03.09 and Rs 50.00 million towards
superannuation benefit w.e.f. 1.1.07 has been made
during the year as per DPE guidelines for wage revision.
19. During the year 2 kg gold valued at Rs. 2.24 million was
short received at Regional Office Bangalore while
returning the unsold jewellery on account of exhibition
against which provision for Rs 2.24 million has been made
in the accounts. Departmental action has been initiated
against the erring officials. Suit for recovery has been filed
besides criminal complaint.
20. A claim for Rs 20.62 million (LY Rs 20.62 million) against
an associate on account of damaged imported Polyester
is pending for which a provision of Rs 15.54 million (LY Rs
15.54 million)has been made after taking into account the
EMD and other payables amounting to Rs 5.08 million (LY
Rs 5.08 million). The company has requested customs for
abandonment which is pending for adjudication.
21. The employees benefits provided by the Company as
required under
Accounting Standard 15 (Revised) are as under:-
• Leave Encashment – Payable on separation to
eligible employees who have accumulated earned
and half pay leave. Encashment of accumulated
earned leave is also allowed leaving a minimum
balance of 15 days twice in a year.
• Post Retirement Medical Benefit(PRMB) –
Available to retired employees at empanelled
hospitals for inpatient treatment and also for OPD
treatment.
• LTC/ALTC – Leave Travel Concession and ALTC is
given to all serving employees once in a block of two
years by their entitled class of travel.
Liability in respect of benefits in respect of Leave
Encashment, PRMB and LTC/ALTC are recognized on
the basis of actuarial valuation.
• Gratuity - Gratuity is paid to all the employees on
retirement/separation based on the number of
years of service. The scheme is funded by the
Company and is managed by a separate Trust
through LIC. In case of MICA division employees the
scheme is managed directly by the company through
LIC.
Other disclosures as required under AS –
15(Revised) on ‘Employee Benefits’, in respect of
defined benefit obligation are:
(a) Reconciliation of present value of defined benefit
obligations:
Rs. in million
Sl. Particulars Gratuity Earned Sick Post LTC/No. Leave Leave Retirement ALTC
Encashment Encashment MedicalBenefit
(i) Present value 263.31 110.33 82.04 664.77 33.99of projectedbenefitobligationsas at 1/4/2008
(ii) Interest cost 21.06 7.72 5.74 46.53 2.38
(iii) Past servicecost
(iv) Current service 4.65 9.24 5.89 8.47 17.98 cost
(v) Benefit paid 22.64 65.47 0.40 31.61 11.82
(vi) Actuarial 273.47 110.33 33.32 (1.38) (7.36)(gain)/loss
(vii) Present value 539.85 172.15 126.59 686.78 35.17of obligationas at 31st March, 09(i+ii+iii+iv-v+vi)
th46 Annual Report 2008-09
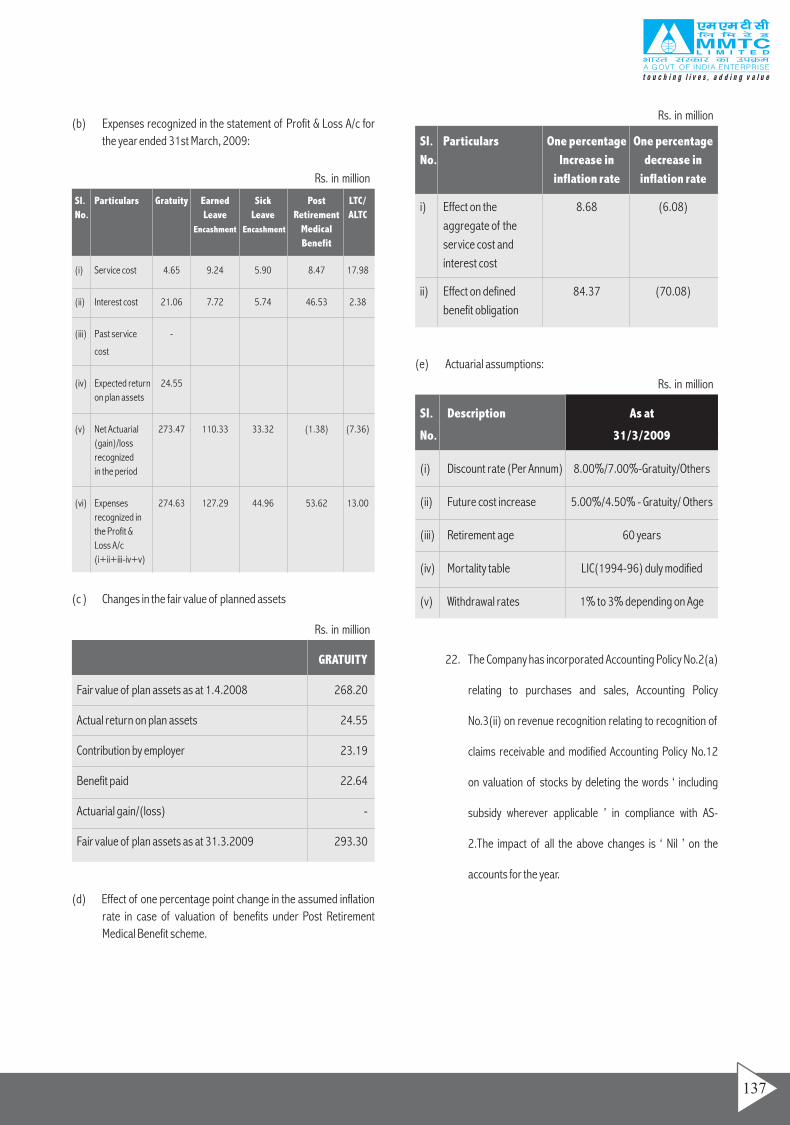
22. The Company has incorporated Accounting Policy No.2(a)
relating to purchases and sales, Accounting Policy
No.3(ii) on revenue recognition relating to recognition of
claims receivable and modified Accounting Policy No.12
on valuation of stocks by deleting the words ‘ including
subsidy wherever applicable ’ in compliance with AS-
2.The impact of all the above changes is ‘ Nil ’ on the
accounts for the year.
(b) Expenses recognized in the statement of Profit & Loss A/c for
the year ended 31st March, 2009:
(c ) Changes in the fair value of planned assets
(d) Effect of one percentage point change in the assumed inflation
rate in case of valuation of benefits under Post Retirement
Medical Benefit scheme.
Rs. in million
Rs. in million
(e) Actuarial assumptions:
Rs. in million
Rs. in million
Sl. Particulars Gratuity Earned Sick Post LTC/
No. Leave Leave Retirement ALTC
Encashment Encashment Medical
Benefit
(i) Service cost 4.65 9.24 5.90 8.47 17.98
(ii) Interest cost 21.06 7.72 5.74 46.53 2.38
(iii) Past service -
cost
(iv) Expected return 24.55
on plan assets
(v) Net Actuarial 273.47 110.33 33.32 (1.38) (7.36)
(gain)/loss
recognized
in the period
(vi) Expenses 274.63 127.29 44.96 53.62 13.00
recognized in
the Profit &
Loss A/c
(i+ii+iii-iv+v)
GRATUITY
Fair value of plan assets as at 1.4.2008 268.20
Actual return on plan assets 24.55
Contribution by employer 23.19
Benefit paid 22.64
Actuarial gain/(loss) -
Fair value of plan assets as at 31.3.2009 293.30
Sl. Particulars One percentage One percentage
No. Increase in decrease in
inflation rate inflation rate
i) Effect on the 8.68 (6.08)
aggregate of the
service cost and
interest cost
ii) Effect on defined 84.37 (70.08)
benefit obligation
Sl. Description As at
No. 31/3/2009
(i) Discount rate (Per Annum) 8.00%/7.00%-Gratuity/Others
(ii) Future cost increase 5.00%/4.50% - Gratuity/ Others
(iii) Retirement age 60 years
(iv) Mortality table LIC(1994-96) duly modified
(v) Withdrawal rates 1% to 3% depending on Age
137
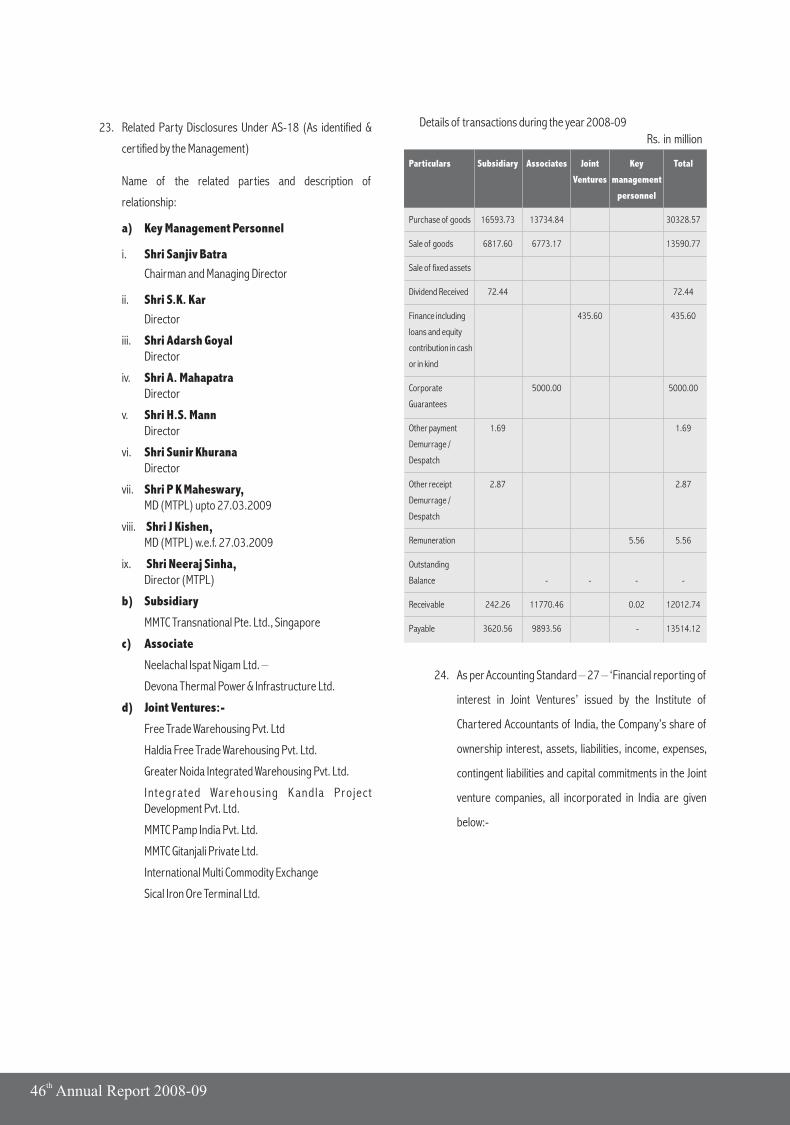
23. Related Party Disclosures Under AS-18 (As identified &
certified by the Management)
Name of the related parties and description of
relationship:
a) Key Management Personnel
i. Shri Sanjiv Batra
Chairman and Managing Director
ii. Shri S.K. Kar
Director
iii. Shri Adarsh GoyalDirector
iv. Shri A. MahapatraDirector
v. Shri H.S. MannDirector
vi. Shri Sunir KhuranaDirector
vii. Shri P K Maheswary,MD (MTPL) upto 27.03.2009
viii. Shri J Kishen,MD (MTPL) w.e.f. 27.03.2009
ix. Shri Neeraj Sinha,Director (MTPL)
b) Subsidiary
MMTC Transnational Pte. Ltd., Singapore
c) Associate
Neelachal Ispat Nigam Ltd. –
Devona Thermal Power & Infrastructure Ltd.
d) Joint Ventures:-
Free Trade Warehousing Pvt. Ltd
Haldia Free Trade Warehousing Pvt. Ltd.
Greater Noida Integrated Warehousing Pvt. Ltd.
Integrated Warehousing Kandla Project Development Pvt. Ltd.
MMTC Pamp India Pvt. Ltd.
MMTC Gitanjali Private Ltd.
International Multi Commodity Exchange
Sical Iron Ore Terminal Ltd.
Rs. in million
Details of transactions during the year 2008-09
24. As per Accounting Standard – 27 – ‘Financial reporting of
interest in Joint Ventures’ issued by the Institute of
Chartered Accountants of India, the Company’s share of
ownership interest, assets, liabilities, income, expenses,
contingent liabilities and capital commitments in the Joint
venture companies, all incorporated in India are given
below:-
Particulars Subsidiary Associates Joint Key Total
Ventures management
personnel
Purchase of goods 16593.73 13734.84 30328.57
Sale of goods 6817.60 6773.17 13590.77
Sale of fixed assets
Dividend Received 72.44 72.44
Finance including 435.60 435.60
loans and equity
contribution in cash
or in kind
Corporate 5000.00 5000.00
Guarantees
Other payment 1.69 1.69
Demurrage /
Despatch
Other receipt 2.87 2.87
Demurrage /
Despatch
Remuneration 5.56 5.56
Outstanding
Balance - - - -
Receivable 242.26 11770.46 0.02 12012.74
Payable 3620.56 9893.56 - 13514.12
th46 Annual Report 2008-09
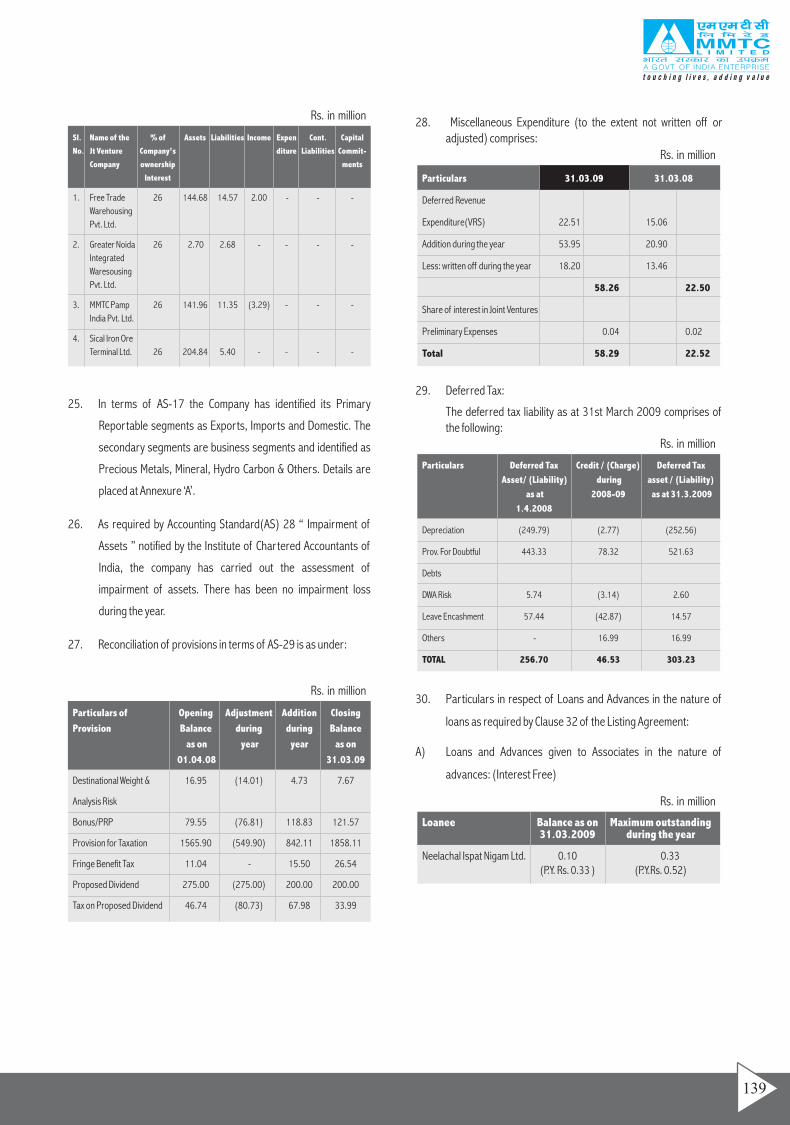
Rs. in million
28. Miscellaneous Expenditure (to the extent not written off or adjusted) comprises:
29. Deferred Tax:
The deferred tax liability as at 31st March 2009 comprises of the following:
30. Particulars in respect of Loans and Advances in the nature of
loans as required by Clause 32 of the Listing Agreement:
A) Loans and Advances given to Associates in the nature of
advances: (Interest Free)
25. In terms of AS-17 the Company has identified its Primary
Reportable segments as Exports, Imports and Domestic. The
secondary segments are business segments and identified as
Precious Metals, Mineral, Hydro Carbon & Others. Details are
placed at Annexure ‘A’.
26. As required by Accounting Standard(AS) 28 “ Impairment of
Assets ” notified by the Institute of Chartered Accountants of
India, the company has carried out the assessment of
impairment of assets. There has been no impairment loss
during the year.
27. Reconciliation of provisions in terms of AS-29 is as under:
Rs. in million
Rs. in million
Particulars Deferred Tax Credit / (Charge) Deferred Tax
Asset/ (Liability) during asset / (Liability)
as at 2008-09 as at 31.3.2009
1.4.2008
Depreciation (249.79) (2.77) (252.56)
Prov. For Doubtful 443.33 78.32 521.63
Debts
DWA Risk 5.74 (3.14) 2.60
Leave Encashment 57.44 (42.87) 14.57
Others - 16.99 16.99
TOTAL 256.70 46.53 303.23
Rs. in million
Loanee Balance as on Maximum outstanding 31.03.2009 during the year
Neelachal Ispat Nigam Ltd. 0.10 0.33(P.Y. Rs. 0.33 ) (P.Y.Rs. 0.52)
Rs. in million
Sl. Name of the % of Assets Liabilities Income Expen Cont. Capital
No. Jt Venture Company’s diture Liabilities Commit-
Company ownership ments
Interest
1. Free Trade 26 144.68 14.57 2.00 - - -
Warehousing
Pvt. Ltd.
2. Greater Noida 26 2.70 2.68 - - - -
Integrated
Waresousing
Pvt. Ltd.
3. MMTC Pamp 26 141.96 11.35 (3.29) - - -
India Pvt. Ltd.
4. Sical Iron Ore
Terminal Ltd. 26 204.84 5.40 - - - -
Particulars of Opening Adjustment Addition Closing
Provision Balance during during Balance
as on year year as on
01.04.08 31.03.09
Destinational Weight & 16.95 (14.01) 4.73 7.67
Analysis Risk
Bonus/PRP 79.55 (76.81) 118.83 121.57
Provision for Taxation 1565.90 (549.90) 842.11 1858.11
Fringe Benefit Tax 11.04 - 15.50 26.54
Proposed Dividend 275.00 (275.00) 200.00 200.00
Tax on Proposed Dividend 46.74 (80.73) 67.98 33.99
Particulars 31.03.09 31.03.08
Deferred Revenue
Expenditure(VRS) 22.51 15.06
Addition during the year 53.95 20.90
Less: written off during the year 18.20 13.46
58.26 22.50
Share of interest in Joint Ventures
Preliminary Expenses 0.04 0.02
Total 58.29 22.52
139
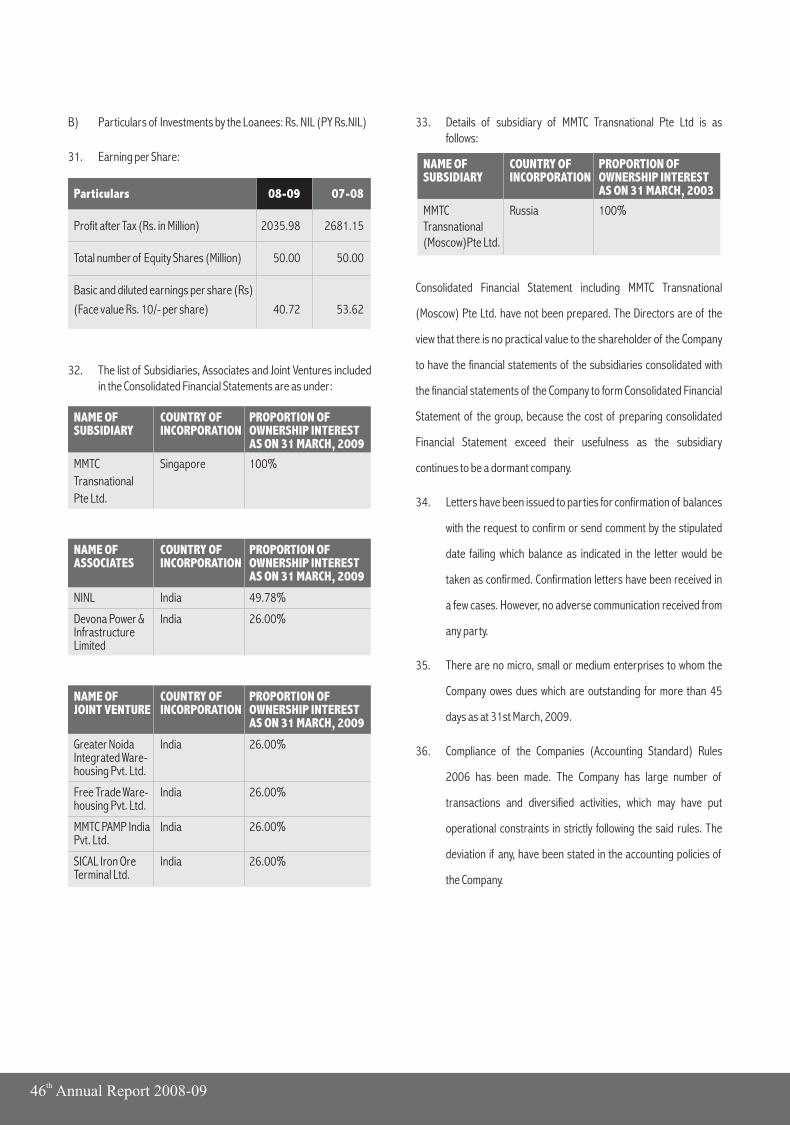
NAME OF COUNTRY OF PROPORTION OFSUBSIDIARY INCORPORATION OWNERSHIP INTEREST
AS ON 31 MARCH, 2009
MMTC Singapore 100%
Transnational
Pte Ltd.
B) Particulars of Investments by the Loanees: Rs. NIL (PY Rs.NIL)
31. Earning per Share:
32. The list of Subsidiaries, Associates and Joint Ventures included in the Consolidated Financial Statements are as under:
33. Details of subsidiary of MMTC Transnational Pte Ltd is as follows:
Consolidated Financial Statement including MMTC Transnational
(Moscow) Pte Ltd. have not been prepared. The Directors are of the
view that there is no practical value to the shareholder of the Company
to have the financial statements of the subsidiaries consolidated with
the financial statements of the Company to form Consolidated Financial
Statement of the group, because the cost of preparing consolidated
Financial Statement exceed their usefulness as the subsidiary
continues to be a dormant company.
34. Letters have been issued to parties for confirmation of balances
with the request to confirm or send comment by the stipulated
date failing which balance as indicated in the letter would be
taken as confirmed. Confirmation letters have been received in
a few cases. However, no adverse communication received from
any party.
35. There are no micro, small or medium enterprises to whom the
Company owes dues which are outstanding for more than 45
days as at 31st March, 2009.
36. Compliance of the Companies (Accounting Standard) Rules
2006 has been made. The Company has large number of
transactions and diversified activities, which may have put
operational constraints in strictly following the said rules. The
deviation if any, have been stated in the accounting policies of
the Company.
NAME OF COUNTRY OF PROPORTION OFASSOCIATES INCORPORATION OWNERSHIP INTEREST
AS ON 31 MARCH, 2009
NINL India 49.78%
Devona Power & India 26.00%InfrastructureLimited
NAME OF COUNTRY OF PROPORTION OFJOINT VENTURE INCORPORATION OWNERSHIP INTEREST
AS ON 31 MARCH, 2009
Greater Noida India 26.00%Integrated Ware-housing Pvt. Ltd.
Free Trade Ware- India 26.00%housing Pvt. Ltd.
MMTC PAMP India India 26.00%Pvt. Ltd.
SICAL Iron Ore India 26.00%Terminal Ltd.
NAME OF COUNTRY OF PROPORTION OFSUBSIDIARY INCORPORATION OWNERSHIP INTEREST
AS ON 31 MARCH, 2003
MMTC Russia 100%Transnational(Moscow)Pte Ltd.
Particulars 08-09 07-08
Profit after Tax (Rs. in Million) 2035.98 2681.15
Total number of Equity Shares (Million) 50.00 50.00
Basic and diluted earnings per share (Rs)
(Face value Rs. 10/- per share) 40.72 53.62
th46 Annual Report 2008-09
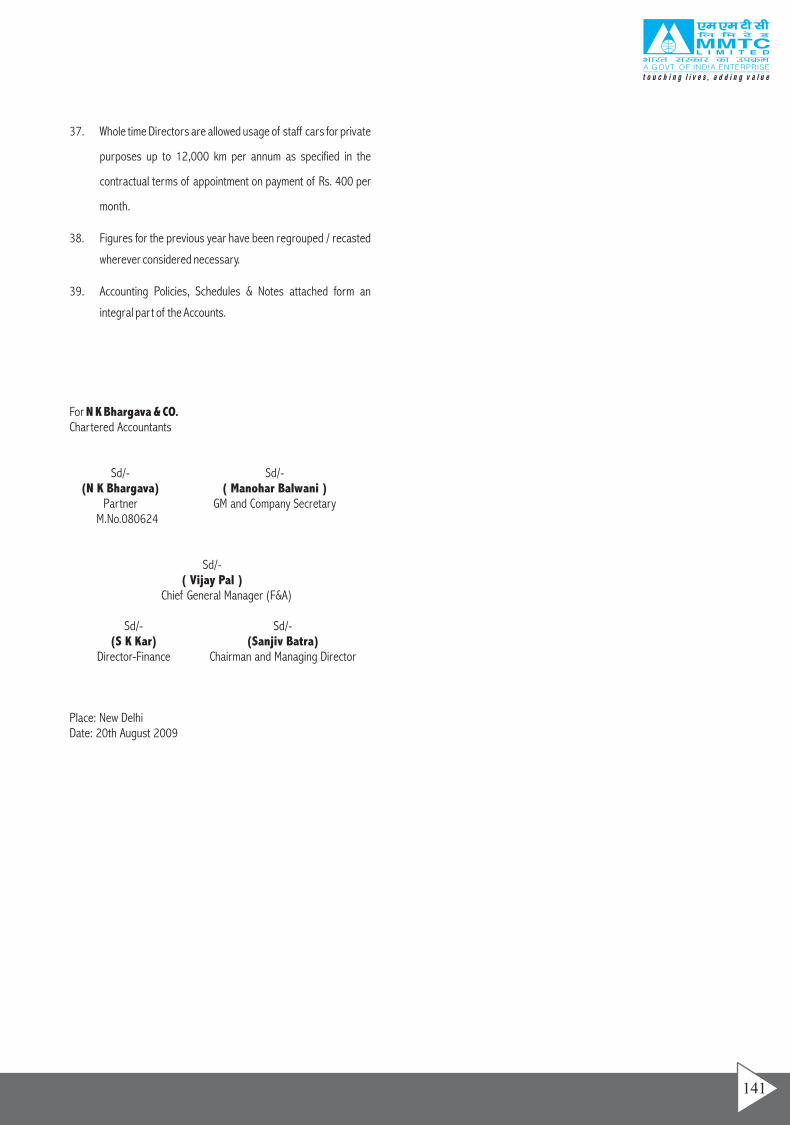
37. Whole time Directors are allowed usage of staff cars for private
purposes up to 12,000 km per annum as specified in the
contractual terms of appointment on payment of Rs. 400 per
month.
38. Figures for the previous year have been regrouped / recasted
wherever considered necessary.
39. Accounting Policies, Schedules & Notes attached form an
integral part of the Accounts.
For N K Bhargava & CO.Chartered Accountants
Sd/- Sd/-(N K Bhargava) ( Manohar Balwani )
Partner GM and Company Secretary M.No.080624
Sd/-( Vijay Pal )
Chief General Manager (F&A)
Sd/- Sd/-(S K Kar) (Sanjiv Batra)
Director-Finance Chairman and Managing Director
Place: New DelhiDate: 20th August 2009
141
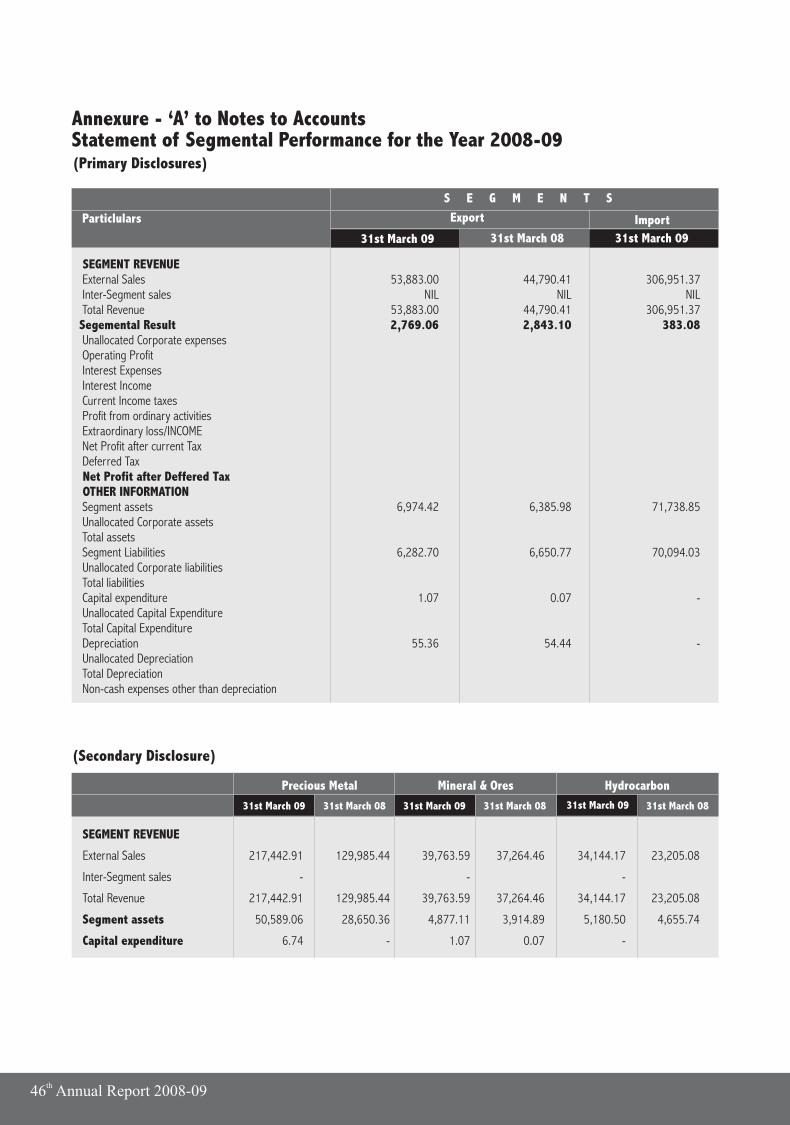
Annexure - ‘A’ to Notes to AccountsStatement of Segmental Performance for the Year 2008-09
(Primary Disclosures)
(Secondary Disclosure)
Particlulars
S E G M E N T S
Export Import
31st March 08
SEGMENT REVENUE External Sales 53,883.00 44,790.41 306,951.37 Inter-Segment sales NIL NIL NIL Total Revenue 53,883.00 44,790.41 306,951.37Segemental Result 2,769.06 2,843.10 383.08 Unallocated Corporate expenses Operating Profit Interest Expenses Interest Income Current Income taxes Profit from ordinary activities Extraordinary loss/INCOME Net Profit after current Tax Deferred Tax Net Profit after Deffered Tax OTHER INFORMATION Segment assets 6,974.42 6,385.98 71,738.85 Unallocated Corporate assets Total assets Segment Liabilities 6,282.70 6,650.77 70,094.03 Unallocated Corporate liabilities Total liabilities Capital expenditure 1.07 0.07 - Unallocated Capital Expenditure Total Capital Expenditure Depreciation 55.36 54.44 - Unallocated Depreciation Total Depreciation Non-cash expenses other than depreciation
31st March 0931st March 09 31st March 08 31st March 08 31st March 09 31st March 08
Precious Metal Mineral & Ores Hydrocarbon
SEGMENT REVENUE
External Sales 217,442.91 129,985.44 39,763.59 37,264.46 34,144.17 23,205.08
Inter-Segment sales - - -
Total Revenue 217,442.91 129,985.44 39,763.59 37,264.46 34,144.17 23,205.08
Segment assets 50,589.06 28,650.36 4,877.11 3,914.89 5,180.50 4,655.74
Capital expenditure 6.74 - 1.07 0.07 -
31st March 09 31st March 09
(Primary Disclosures)
th46 Annual Report 2008-09
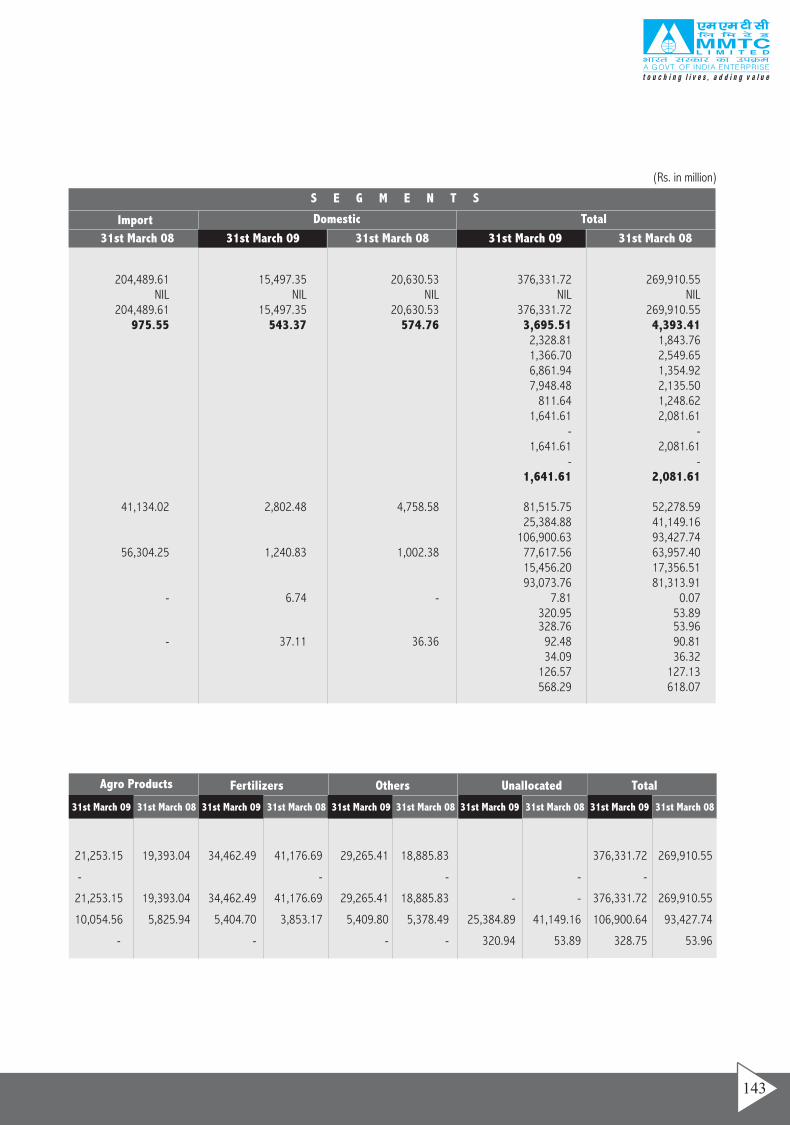
21,253.15 19,393.04 34,462.49 41,176.69 29,265.41 18,885.83 376,331.72 269,910.55
- - - - -
21,253.15 19,393.04 34,462.49 41,176.69 29,265.41 18,885.83 - - 376,331.72 269,910.55
10,054.56 5,825.94 5,404.70 3,853.17 5,409.80 5,378.49 25,384.89 41,149.16 106,900.64 93,427.74
- - - - 320.94 53.89 328.75 53.96
(Rs. in million)
S E G M E N T S
Import
31st March 08 31st March 08 31st March 08
Total Domestic
Agro Products Fertilizers Others Unallocated Total
31st March 08
31st March 09 31st March 09
31st March 0931st March 0831st March 0931st March 0831st March 0931st March 0831st March 0931st March 0831st March 09
204,489.61 15,497.35 20,630.53 376,331.72 269,910.55 NIL NIL NIL NIL NIL
204,489.61 15,497.35 20,630.53 376,331.72 269,910.55 975.55 543.37 574.76 3,695.51 4,393.41
2,328.81 1,843.76 1,366.70 2,549.656,861.94 1,354.92 7,948.48 2,135.50
811.64 1,248.62 1,641.61 2,081.61
- - 1,641.61 2,081.61
- - 1,641.61 2,081.61
41,134.02 2,802.48 4,758.58 81,515.75 52,278.59 25,384.88 41,149.16
106,900.63 93,427.74 56,304.25 1,240.83 1,002.38 77,617.56 63,957.40
15,456.20 17,356.51 93,073.76 81,313.91
- 6.74 - 7.81 0.07 320.95 53.89 328.76 53.96
- 37.11 36.36 92.48 90.8134.09 36.32
126.57 127.13568.29 618.07
143
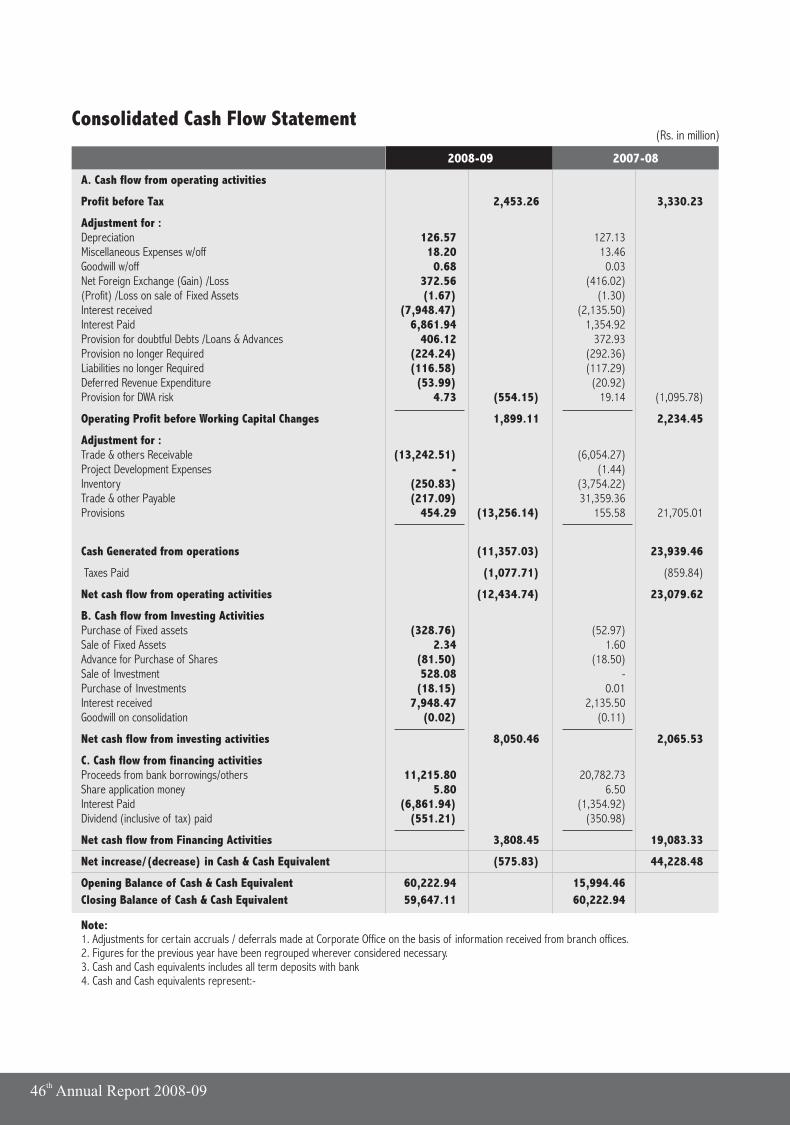
th46 Annual Report 2008-09
(Rs. in million)Consolidated Cash Flow Statement
A. Cash flow from operating activities
Profit before Tax 2,453.26 3,330.23
Adjustment for :Depreciation 126.57 127.13 Miscellaneous Expenses w/off 18.20 13.46 Goodwill w/off 0.68 0.03 Net Foreign Exchange (Gain) /Loss 372.56 (416.02)(Profit) /Loss on sale of Fixed Assets (1.67) (1.30)Interest received (7,948.47) (2,135.50)Interest Paid 6,861.94 1,354.92 Provision for doubtful Debts /Loans & Advances 406.12 372.93 Provision no longer Required (224.24) (292.36)Liabilities no longer Required (116.58) (117.29)Deferred Revenue Expenditure (53.99) (20.92)Provision for DWA risk 4.73 (554.15) 19.14 (1,095.78)
Operating Profit before Working Capital Changes 1,899.11 2,234.45
Adjustment for :Trade & others Receivable (13,242.51) (6,054.27)Project Development Expenses - (1.44)Inventory (250.83) (3,754.22)Trade & other Payable (217.09) 31,359.36 Provisions 454.29 (13,256.14) 155.58 21,705.01
Cash Generated from operations (11,357.03) 23,939.46
Taxes Paid (1,077.71) (859.84)
Net cash flow from operating activities (12,434.74) 23,079.62
B. Cash flow from Investing ActivitiesPurchase of Fixed assets (328.76) (52.97)Sale of Fixed Assets 2.34 1.60 Advance for Purchase of Shares (81.50) (18.50)Sale of Investment 528.08 - Purchase of Investments (18.15) 0.01 Interest received 7,948.47 2,135.50 Goodwill on consolidation (0.02) (0.11)
Net cash flow from investing activities 8,050.46 2,065.53
C. Cash flow from financing activitiesProceeds from bank borrowings/others 11,215.80 20,782.73 Share application money 5.80 6.50 Interest Paid (6,861.94) (1,354.92)Dividend (inclusive of tax) paid (551.21) (350.98)
Net cash flow from Financing Activities 3,808.45 19,083.33
Net increase/(decrease) in Cash & Cash Equivalent (575.83) 44,228.48
Opening Balance of Cash & Cash Equivalent 60,222.94 15,994.46
Closing Balance of Cash & Cash Equivalent 59,647.11 60,222.94
Note:1. Adjustments for certain accruals / deferrals made at Corporate Office on the basis of information received from branch offices.2. Figures for the previous year have been regrouped wherever considered necessary.3. Cash and Cash equivalents includes all term deposits with bank4. Cash and Cash equivalents represent:-
2008-09 2007-08
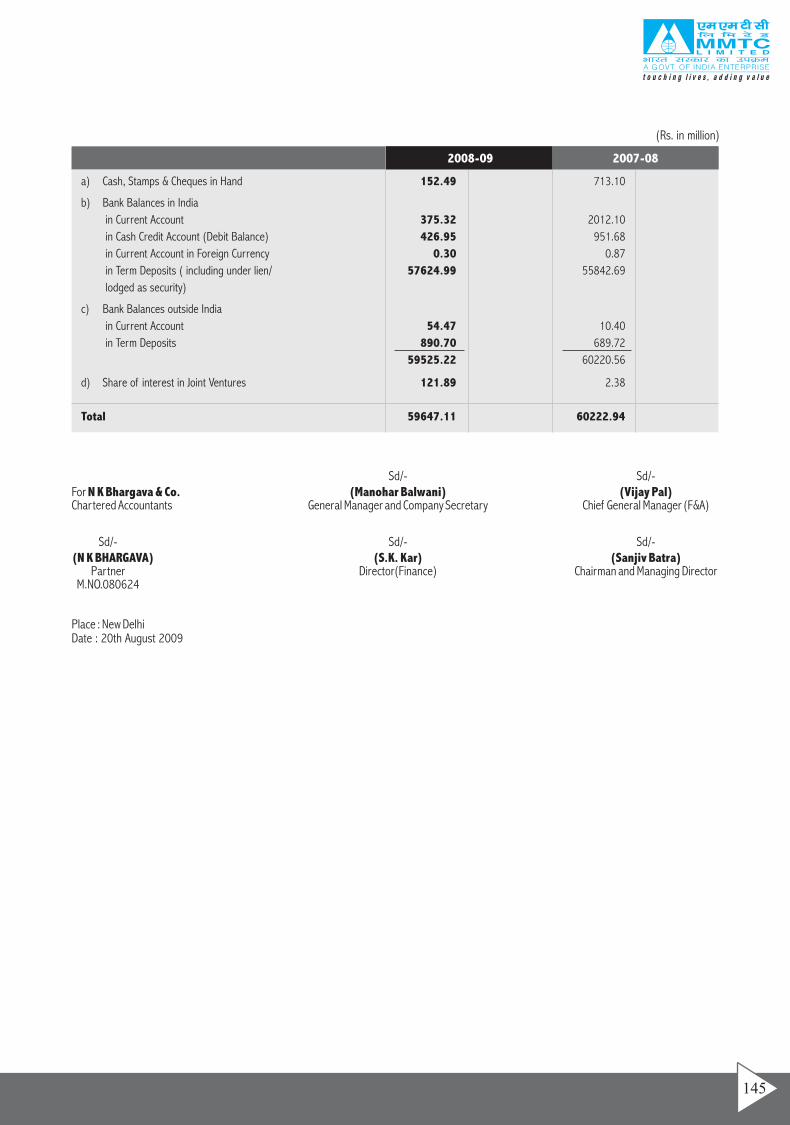
(Rs. in million)
a) Cash, Stamps & Cheques in Hand 152.49 713.10
b) Bank Balances in India
in Current Account 375.32 2012.10
in Cash Credit Account (Debit Balance) 426.95 951.68
in Current Account in Foreign Currency 0.30 0.87
in Term Deposits ( including under lien/ 57624.99 55842.69
lodged as security)
c) Bank Balances outside India
in Current Account 54.47 10.40
in Term Deposits 890.70 689.72
59525.22 60220.56
d) Share of interest in Joint Ventures 121.89 2.38
Total 59647.11 60222.94
2008-09 2007-08
Sd/- Sd/-For N K Bhargava & Co. (Manohar Balwani) (Vijay Pal)Chartered Accountants General Manager and Company Secretary Chief General Manager (F&A)
Sd/- Sd/- Sd/-(N K BHARGAVA) (S.K. Kar) (Sanjiv Batra)
Partner Director(Finance) Chairman and Managing DirectorM.NO.080624
Place : New DelhiDate : 20th August 2009
145
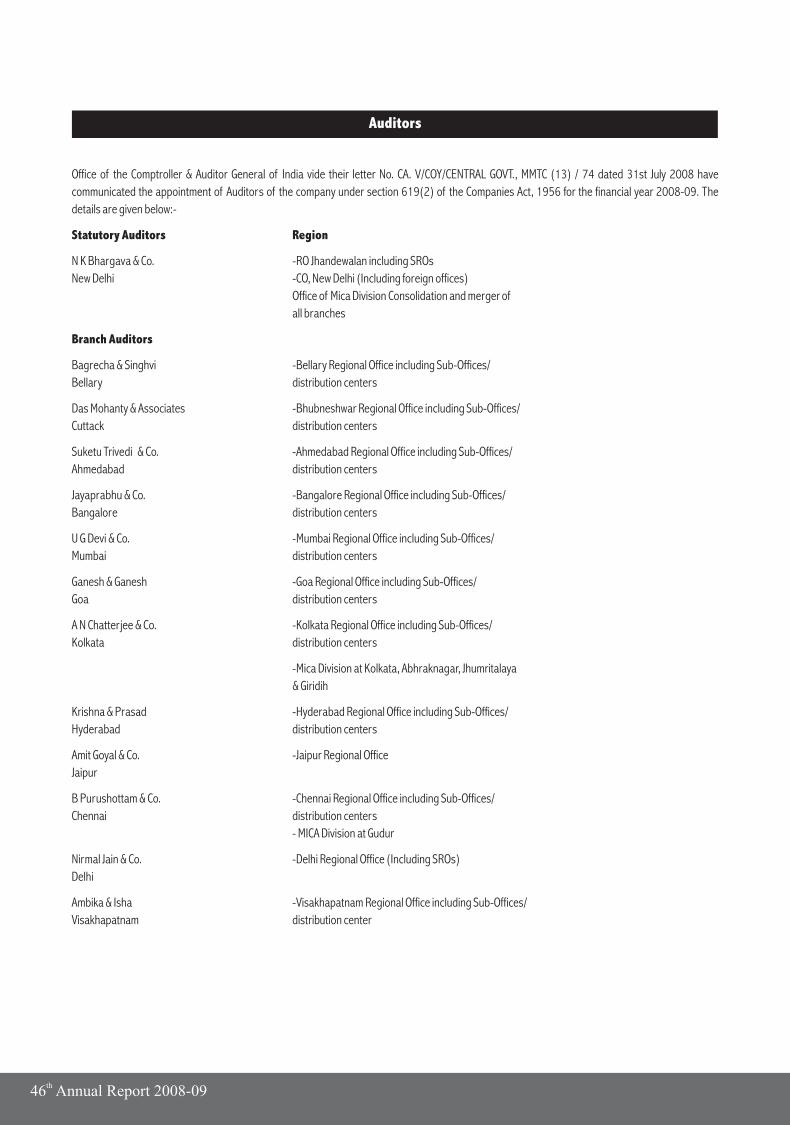
Office of the Comptroller & Auditor General of India vide their letter No. CA. V/COY/CENTRAL GOVT., MMTC (13) / 74 dated 31st July 2008 have
communicated the appointment of Auditors of the company under section 619(2) of the Companies Act, 1956 for the financial year 2008-09. The
details are given below:-
Statutory Auditors Region
N K Bhargava & Co. -RO Jhandewalan including SROs
New Delhi -CO, New Delhi (Including foreign offices)
Office of Mica Division Consolidation and merger of
all branches
Branch Auditors
Bagrecha & Singhvi -Bellary Regional Office including Sub-Offices/
Bellary distribution centers
Das Mohanty & Associates -Bhubneshwar Regional Office including Sub-Offices/
Cuttack distribution centers
Suketu Trivedi & Co. -Ahmedabad Regional Office including Sub-Offices/
Ahmedabad distribution centers
Jayaprabhu & Co. -Bangalore Regional Office including Sub-Offices/
Bangalore distribution centers
U G Devi & Co. -Mumbai Regional Office including Sub-Offices/
Mumbai distribution centers
Ganesh & Ganesh -Goa Regional Office including Sub-Offices/
Goa distribution centers
A N Chatterjee & Co. -Kolkata Regional Office including Sub-Offices/
Kolkata distribution centers
-Mica Division at Kolkata, Abhraknagar, Jhumritalaya
& Giridih
Krishna & Prasad -Hyderabad Regional Office including Sub-Offices/
Hyderabad distribution centers
Amit Goyal & Co. -Jaipur Regional Office
Jaipur
B Purushottam & Co. -Chennai Regional Office including Sub-Offices/
Chennai distribution centers
- MICA Division at Gudur
Nirmal Jain & Co. -Delhi Regional Office (Including SROs)
Delhi
Ambika & Isha -Visakhapatnam Regional Office including Sub-Offices/
Visakhapatnam distribution center
Auditors
th46 Annual Report 2008-09
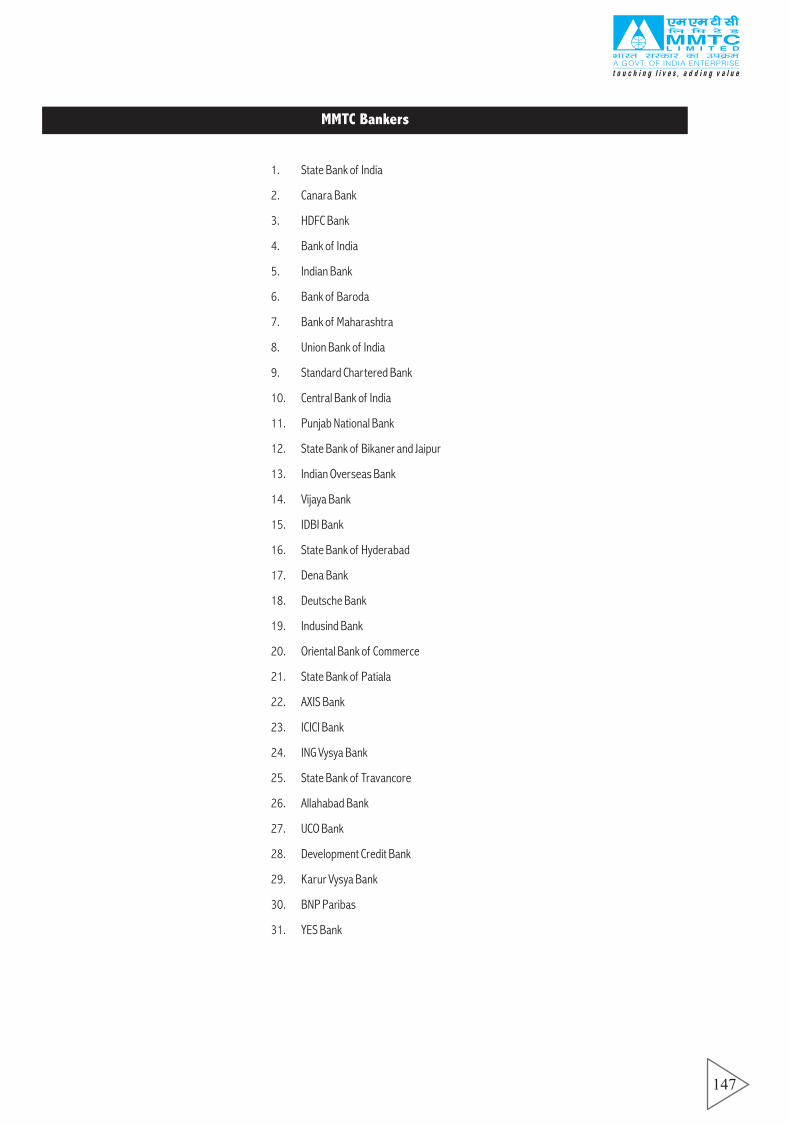
1. State Bank of India
2. Canara Bank
3. HDFC Bank
4. Bank of India
5. Indian Bank
6. Bank of Baroda
7. Bank of Maharashtra
8. Union Bank of India
9. Standard Chartered Bank
10. Central Bank of India
11. Punjab National Bank
12. State Bank of Bikaner and Jaipur
13. Indian Overseas Bank
14. Vijaya Bank
15. IDBI Bank
16. State Bank of Hyderabad
17. Dena Bank
18. Deutsche Bank
19. Indusind Bank
20. Oriental Bank of Commerce
21. State Bank of Patiala
22. AXIS Bank
23. ICICI Bank
24. ING Vysya Bank
25. State Bank of Travancore
26. Allahabad Bank
27. UCO Bank
28. Development Credit Bank
29. Karur Vysya Bank
30. BNP Paribas
31. YES Bank
MMTC Bankers
147
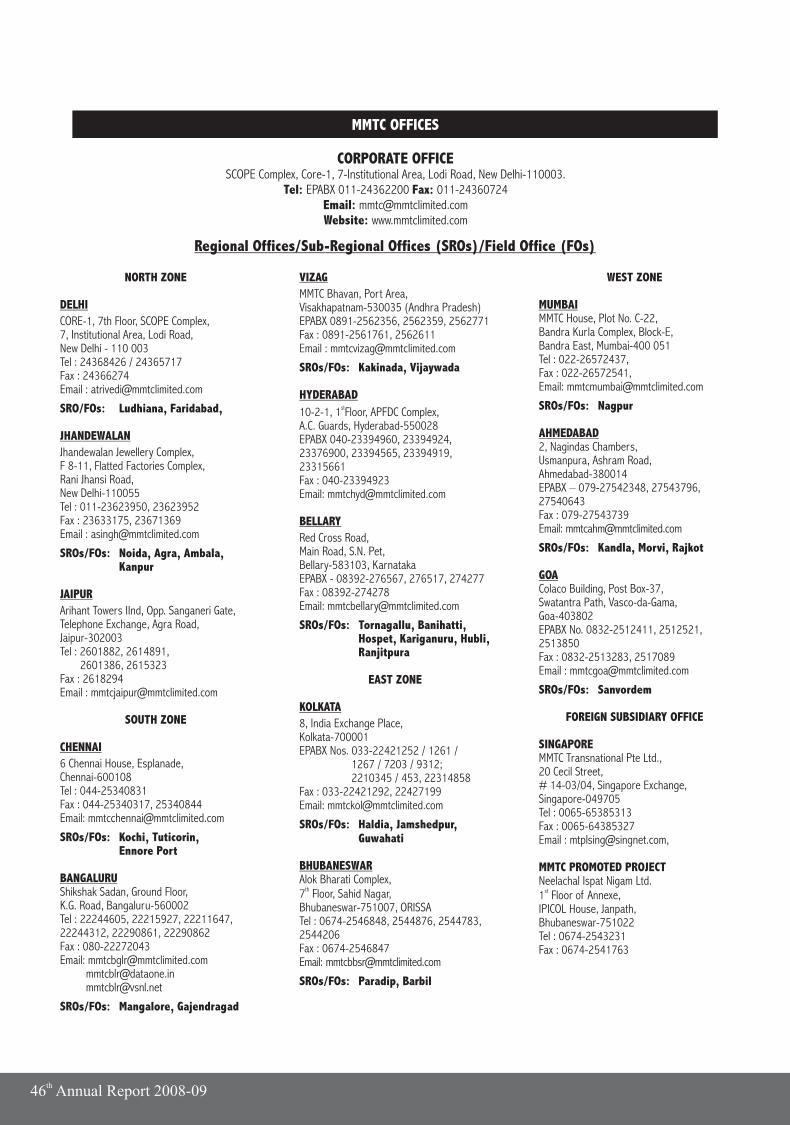
NORTH ZONE
DELHI
CORE-1, 7th Floor, SCOPE Complex,7, Institutional Area, Lodi Road,New Delhi - 110 003Tel : 24368426 / 24365717Fax : 24366274Email : [email protected]
SRO/FOs: Ludhiana, Faridabad,
JHANDEWALAN
Jhandewalan Jewellery Complex,F 8-11, Flatted Factories Complex,Rani Jhansi Road,New Delhi-110055Tel : 011-23623950, 23623952Fax : 23633175, 23671369Email : [email protected]
SROs/FOs: Noida, Agra, Ambala,Kanpur
JAIPUR
Arihant Towers IInd, Opp. Sanganeri Gate,Telephone Exchange, Agra Road,Jaipur-302003Tel : 2601882, 2614891, 2601386, 2615323Fax : 2618294Email : [email protected]
SOUTH ZONE
CHENNAI
6 Chennai House, Esplanade,Chennai-600108Tel : 044-25340831Fax : 044-25340317, 25340844Email: [email protected]
SROs/FOs: Kochi, Tuticorin,Ennore Port
BANGALURUShikshak Sadan, Ground Floor,K.G. Road, Bangaluru-560002Tel : 22244605, 22215927, 22211647, 22244312, 22290861, 22290862Fax : 080-22272043Email: [email protected] [email protected] [email protected]
SROs/FOs: Mangalore, Gajendragad
VIZAG
MMTC Bhavan, Port Area,Visakhapatnam-530035 (Andhra Pradesh)EPABX 0891-2562356, 2562359, 2562771Fax : 0891-2561761, 2562611Email : [email protected]
SROs/FOs: Kakinada, Vijaywada
HYDERABADst10-2-1, 1 Floor, APFDC Complex,
A.C. Guards, Hyderabad-550028EPABX 040-23394960, 23394924, 23376900, 23394565, 23394919, 23315661Fax : 040-23394923Email: [email protected]
BELLARY
Red Cross Road,Main Road, S.N. Pet,Bellary-583103, KarnatakaEPABX - 08392-276567, 276517, 274277Fax : 08392-274278Email: [email protected]
SROs/FOs: Tornagallu, Banihatti, Hospet, Kariganuru, Hubli, Ranjitpura
EAST ZONE
KOLKATA
8, India Exchange Place,Kolkata-700001EPABX Nos. 033-22421252 / 1261 / 1267 / 7203 / 9312; 2210345 / 453, 22314858Fax : 033-22421292, 22427199Email: [email protected]
SROs/FOs: Haldia, Jamshedpur,Guwahati
BHUBANESWARAlok Bharati Complex,
th7 Floor, Sahid Nagar,Bhubaneswar-751007, ORISSATel : 0674-2546848, 2544876, 2544783, 2544206Fax : 0674-2546847Email: [email protected]
SROs/FOs: Paradip, Barbil
WEST ZONE
MUMBAIMMTC House, Plot No. C-22,Bandra Kurla Complex, Block-E,Bandra East, Mumbai-400 051Tel : 022-26572437,Fax : 022-26572541,Email: [email protected]
SROs/FOs: Nagpur
AHMEDABAD2, Nagindas Chambers,Usmanpura, Ashram Road,Ahmedabad-380014EPABX – 079-27542348, 27543796, 27540643Fax : 079-27543739Email: [email protected]
SROs/FOs: Kandla, Morvi, Rajkot
GOAColaco Building, Post Box-37,Swatantra Path, Vasco-da-Gama,Goa-403802EPABX No. 0832-2512411, 2512521, 2513850Fax : 0832-2513283, 2517089Email : [email protected]
SROs/FOs: Sanvordem
FOREIGN SUBSIDIARY OFFICE
SINGAPOREMMTC Transnational Pte Ltd.,20 Cecil Street,# 14-03/04, Singapore Exchange, Singapore-049705Tel : 0065-65385313Fax : 0065-64385327Email : [email protected],
MMTC PROMOTED PROJECTNeelachal Ispat Nigam Ltd.
st1 Floor of Annexe,IPICOL House, Janpath,Bhubaneswar-751022Tel : 0674-2543231Fax : 0674-2541763
MMTC OFFICES
CORPORATE OFFICESCOPE Complex, Core-1, 7-Institutional Area, Lodi Road, New Delhi-110003.
Tel: EPABX 011-24362200 Fax: 011-24360724Email: [email protected]: www.mmtclimited.com
Regional Offices/Sub-Regional Offices (SROs)/Field Office (FOs)
th46 Annual Report 2008-09