Embed Size (px)
Citation preview
0
Corporate
Presentation
August, 2018
1
This presentation may contain financial or business projections regarding recent acquisitions, their
financial or business impact, management expectations and objectives regarding such acquisitions and
current management expectations on the operating and financial performance of The Company, based
on assumptions that, as of today, are considered valid. Financial and business projections are
estimates and do not constitute any declaration of historical facts. Words such as “anticipates”,
“could”, “may”, “can”, “plans”, “believes”, “estimates”, “expects”, “projects”, “pretends”, “probable”,
“will”, “should”, and any other similar expression or word with a similar meaning pretend to identify
such expressions as projections. It is uncertain if the anticipated events will happen and in case they
happen, the impact they may have in Alicorp’s or The Consolidated Company’s operating and financial
results. Alicorp does not assume any obligation to update any financial or business projections
included in this presentation to reflect events or circumstances that may happen.
2
Topics
Bolivia´s M&A Transaction [ 1 ]
Corporate Strategy [ 2 ]
Q2 2018 Financial Results [ 3 ]
Guidance 2018 [ 4 ]
Stock Performance [ 5 ]
Appendix [ 6 ]
3
Topics
Bolivia´s M&A Transaction [ 1 ]
Corporate Strategy [ 2 ]
Q2 2018 Financial Results [ 3 ]
Guidance 2018 [ 4 ]
Stock Performance [ 5 ]
Appendix [ 6 ]
4
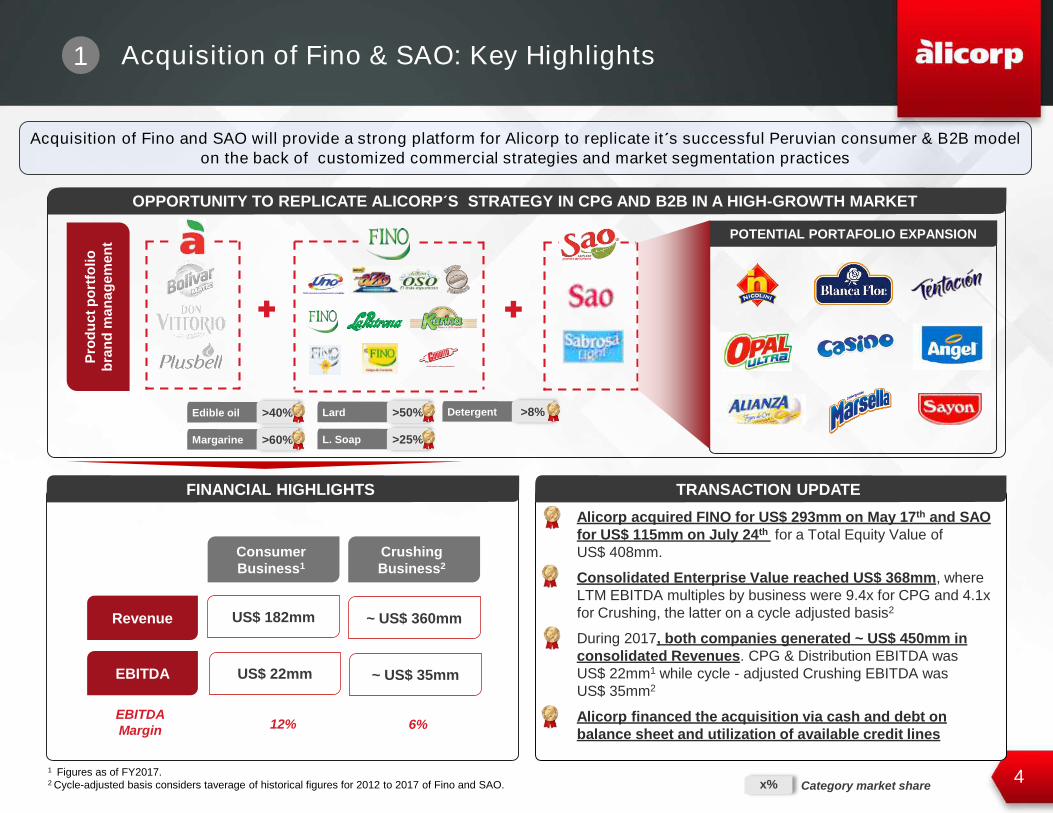
1 Acquisition of Fino & SAO: Key Highlights
Consumer
Business1
Revenue US$ 182mm
Crushing
Business2
EBITDA
~ US$ 360mm
US$ 22mm ~ US$ 35mm
EBITDA
Margin 6%12%
Acquisition of Fino and SAO will provide a strong platform for Alicorp to replicate it´s successful Peruvian consumer & B2B model
on the back of customized commercial strategies and market segmentation practices
Pro
du
ct
po
rtfo
lio
bra
nd
ma
na
ge
me
nt
FINANCIAL HIGHLIGHTS
OPPORTUNITY TO REPLICATE ALICORP´S STRATEGY IN CPG AND B2B IN A HIGH-GROWTH MARKET
Edible oil >40%
Margarine >60%
Lard >50%
L. Soap >25%
x% Category market share
▪ Alicorp acquired FINO for US$ 293mm on May 17th and SAO
for US$ 115mm on July 24th for a Total Equity Value of
US$ 408mm.
▪ Consolidated Enterprise Value reached US$ 368mm, where
LTM EBITDA multiples by business were 9.4x for CPG and 4.1x
for Crushing, the latter on a cycle adjusted basis2
▪ During 2017, both companies generated ~ US$ 450mm in
consolidated Revenues. CPG & Distribution EBITDA was
US$ 22mm1 while cycle - adjusted Crushing EBITDA was
US$ 35mm2
▪ Alicorp financed the acquisition via cash and debt on
balance sheet and utilization of available credit lines
TRANSACTION UPDATE
POTENTIAL PORTAFOLIO EXPANSION
1 Figures as of FY2017. 2 Cycle-adjusted basis considers taverage of historical figures for 2012 to 2017 of Fino and SAO.
Detergent >8%
5
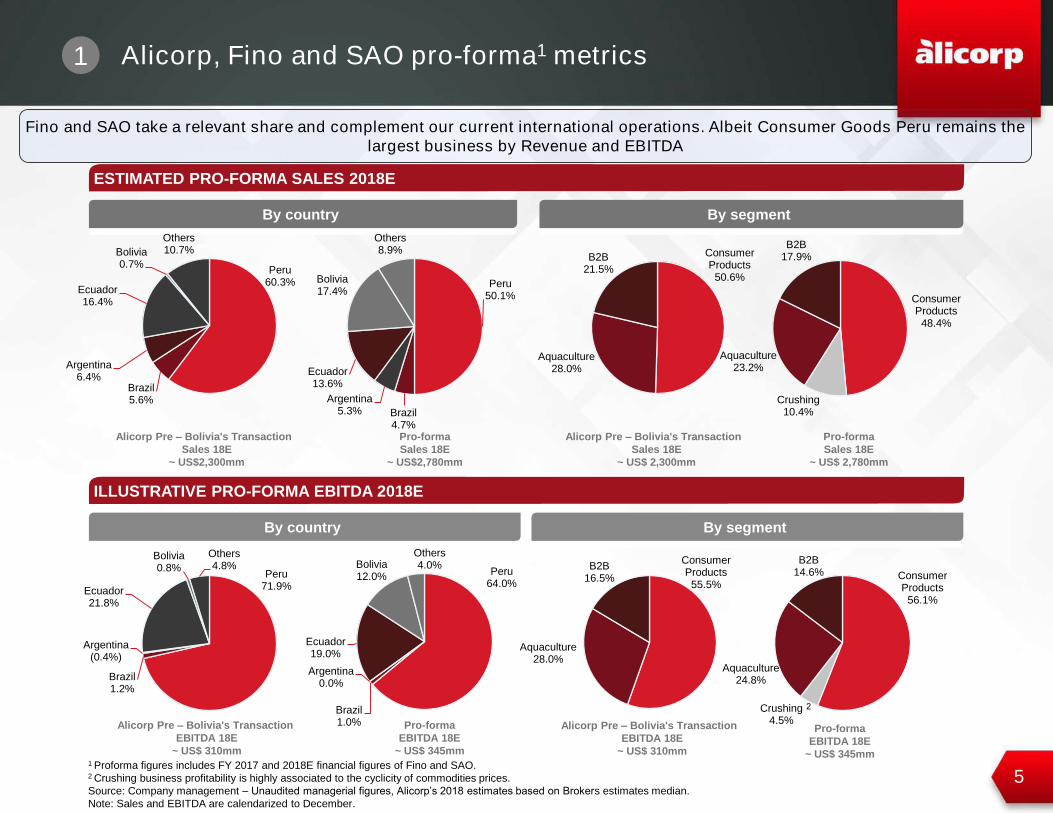
By country
ESTIMATED PRO-FORMA SALES 2018E
By segment
By country
ILLUSTRATIVE PRO-FORMA EBITDA 2018E
By segment
Alicorp Pre – Bolivia's Transaction
Sales 18E
~ US$2,300mm
Pro-forma
Sales 18E
~ US$2,780mm
1 Proforma figures includes FY 2017 and 2018E financial figures of Fino and SAO.2 Crushing business profitability is highly associated to the cyclicity of commodities prices.
Source: Company management – Unaudited managerial figures, Alicorp’s 2018 estimates based on Brokers estimates median.
Note: Sales and EBITDA are calendarized to December.
Alicorp Pre – Bolivia's Transaction
EBITDA 18E
~ US$ 310mm
Pro-forma
EBITDA 18E
~ US$ 345mm
Peru60.3%
Brazil5.6%
Argentina6.4%
Ecuador16.4%
Bolivia0.7%
Others10.7%
Peru50.1%
Brazil4.7%
Argentina5.3%
Ecuador13.6%
Bolivia17.4%
Others8.9%
Peru71.9%
Brazil1.2%
Argentina(0.4%)
Ecuador21.8%
Bolivia0.8%
Others4.8%
Peru64.0%
Brazil1.0%
Argentina0.0%
Ecuador19.0%
Bolivia12.0%
Others4.0%
Consumer Products
50.6%
Aquaculture28.0%
B2B21.5%
Consumer Products
48.4%
Crushing10.4%
Aquaculture23.2%
B2B17.9%
Consumer Products
55.5%
Aquaculture28.0%
B2B16.5% Consumer
Products56.1%
Crushing4.5%
Aquaculture24.8%
B2B14.6%
Alicorp Pre – Bolivia's Transaction
Sales 18E
~ US$ 2,300mm
Pro-forma
Sales 18E
~ US$ 2,780mm
Alicorp Pre – Bolivia's Transaction
EBITDA 18E
~ US$ 310mm
Pro-forma
EBITDA 18E
~ US$ 345mm
1 Alicorp, Fino and SAO pro-forma1 metrics
Fino and SAO take a relevant share and complement our current international operations. Albeit Consumer Goods Peru remains the
largest business by Revenue and EBITDA
2
6
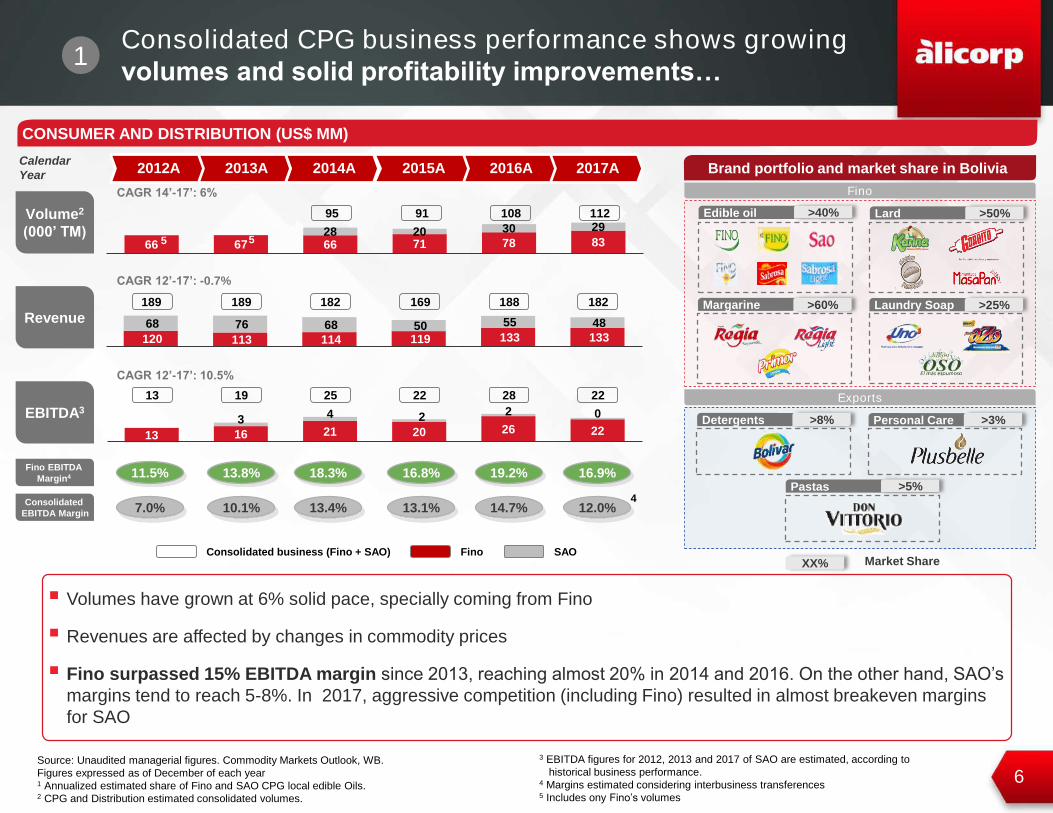
CONSUMER AND DISTRIBUTION (US$ MM)
120 113 114 119 133 133 68 76 68 50 55 48
Source: Unaudited managerial figures. Commodity Markets Outlook, WB.
Figures expressed as of December of each year1 Annualized estimated share of Fino and SAO CPG local edible Oils.2 CPG and Distribution estimated consolidated volumes.
13 16 21 20 26 223 4 2 2 0
2017A2016A2015A2014A2013ACalendar
Year2012A
CAGR 12’-17’: 10.5%
CAGR 12’-17’: -0.7%
▪ Volumes have grown at 6% solid pace, specially coming from Fino
▪ Revenues are affected by changes in commodity prices
▪ Fino surpassed 15% EBITDA margin since 2013, reaching almost 20% in 2014 and 2016. On the other hand, SAO’s
margins tend to reach 5-8%. In 2017, aggressive competition (including Fino) resulted in almost breakeven margins
for SAO
66 67 66 71 78 8328 20 30 29
CAGR 14’-17’: 6%
3 EBITDA figures for 2012, 2013 and 2017 of SAO are estimated, according to
historical business performance.4 Margins estimated considering interbusiness transferences5 Includes ony Fino’s volumes
7.0%
Revenue
EBITDA3
Volume2
(000’ TM)
10.1% 13.4% 14.7% 12.0%13.1%
11.5% 13.8% 18.3% 19.2% 16.9%16.8%
1Consolidated CPG business performance shows growing
volumes and solid profitability improvements…
13 19 25 22 28 22
189 189 182 169 188 182
91 108 11295
Consolidated business (Fino + SAO) Fino SAO
4
Fino EBITDA
Margin4
Consolidated
EBITDA Margin
Brand portfolio and market share in Bolivia
Fino
Margarine >60% Laundry Soap >25%
Edible oil >40% Lard >50%
Exports
Detergents >8% Personal Care >3%
Pastas >5%
XX% Market Share
5 5
7
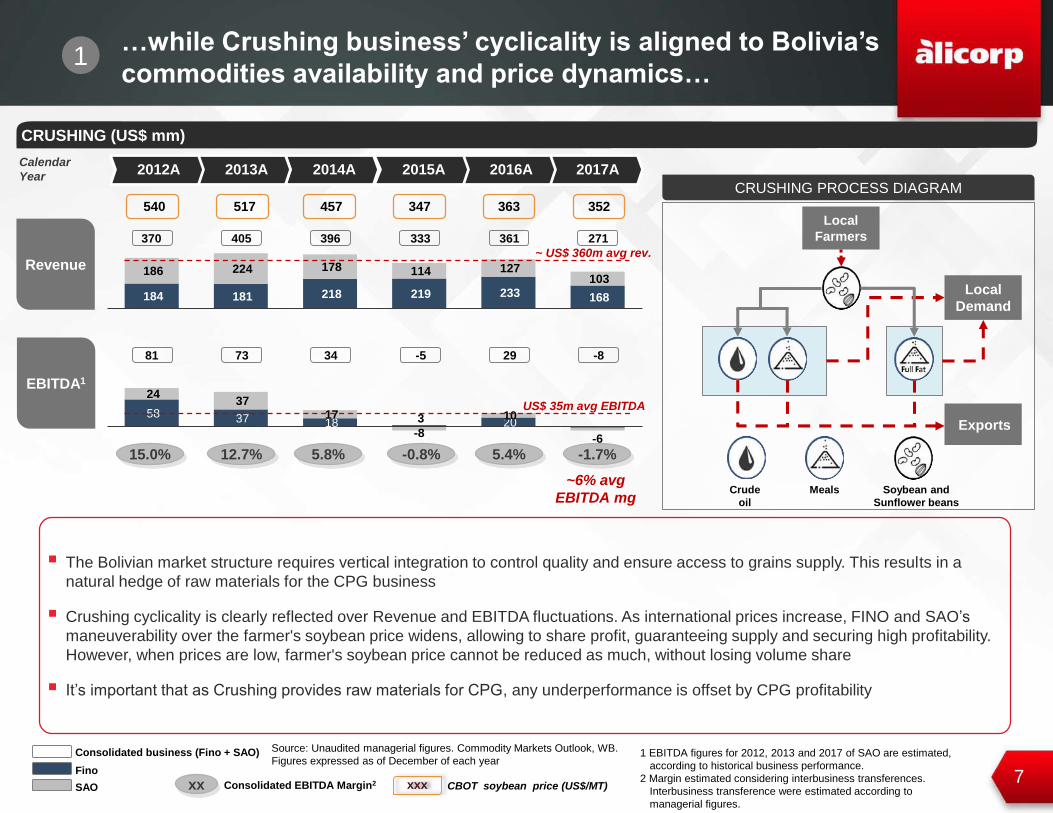
CRUSHING (US$ mm)
Source: Unaudited managerial figures. Commodity Markets Outlook, WB.
Figures expressed as of December of each year
184 181 218 219 233 168
186 224 178 114 127 103
~ US$ 360m avg rev.
58 37 18 3 20
24 37
17
-8
10
-6
2017A2016A2015A2014A2013ACalendar
Year2012A
517 457 347540 363 352
xxx CBOT soybean price (US$/MT)
US$ 35m avg EBITDA
~6% avg
EBITDA mg
▪ The Bolivian market structure requires vertical integration to control quality and ensure access to grains supply. This results in a
natural hedge of raw materials for the CPG business
▪ Crushing cyclicality is clearly reflected over Revenue and EBITDA fluctuations. As international prices increase, FINO and SAO’s
maneuverability over the farmer's soybean price widens, allowing to share profit, guaranteeing supply and securing high profitability.
However, when prices are low, farmer's soybean price cannot be reduced as much, without losing volume share
▪ It’s important that as Crushing provides raw materials for CPG, any underperformance is offset by CPG profitability
Consolidated EBITDA Margin2
1 EBITDA figures for 2012, 2013 and 2017 of SAO are estimated,
according to historical business performance.
2 Margin estimated considering interbusiness transferences.
Interbusiness transference were estimated according to
managerial figures.
Revenue
EBITDA1
15.0% 12.7% 5.8% 5.4% -1.7%-0.8%
xx
1…while Crushing business’ cyclicality is aligned to Bolivia’s
commodities availability and price dynamics…
CRUSHING PROCESS DIAGRAM
Local
Farmers
Local
Demand
Exports
Crude
oil
Meals Soybean and
Sunflower beans
370 405 396 333 361 271
81 73 34 -5 29 -8
Consolidated business (Fino + SAO)
Fino
SAO
8
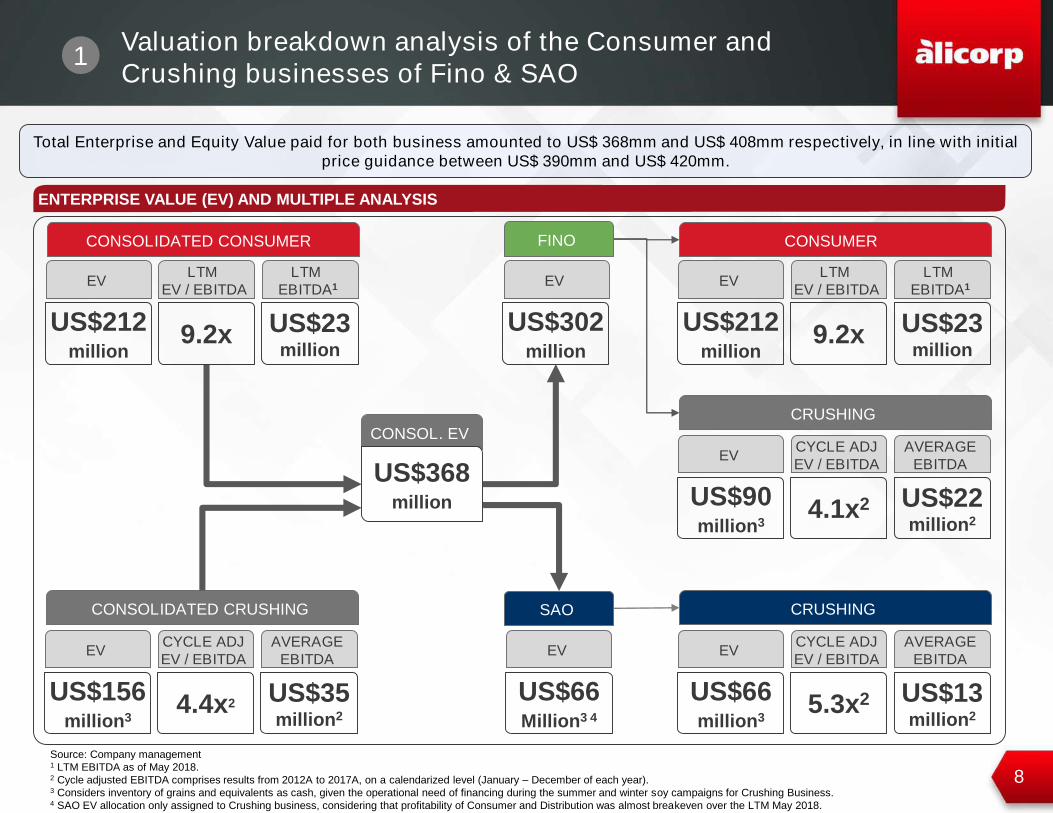
ENTERPRISE VALUE (EV) AND MULTIPLE ANALYSIS
SAO
FINO
CONSOL. EV
CRUSHING
CONSUMER
US$212million
EV
9.2x
LTM
EV / EBITDA
US$90million3
EV
4.1x2
CYCLE ADJ
EV / EBITDA
CRUSHING
US$66million3
EV
5.3x2
CYCLE ADJ
EV / EBITDA
US$23million
LTM
EBITDA1
US$22million2
AVERAGE
EBITDA
US$13million2
AVERAGE
EBITDA
CONSOLIDATED CONSUMER
US$212million
EV
9.2x
LTM
EV / EBITDA
US$23million
LTM
EBITDA1 EV
US$302million
US$66Million3 4
EV
CONSOLIDATED CRUSHING
US$156million3
EV
4.4x2
CYCLE ADJ
EV / EBITDA
US$35million2
AVERAGE
EBITDA
US$368million
1Valuation breakdown analysis of the Consumer and
Crushing businesses of Fino & SAO
Total Enterprise and Equity Value paid for both business amounted to US$ 368mm and US$ 408mm respectively, in line with initial
price guidance between US$ 390mm and US$ 420mm.
Source: Company management1 LTM EBITDA as of May 2018.2 Cycle adjusted EBITDA comprises results from 2012A to 2017A, on a calendarized level (January – December of each year).3 Considers inventory of grains and equivalents as cash, given the operational need of financing during the summer and winter soy campaigns for Crushing Business.4 SAO EV allocation only assigned to Crushing business, considering that profitability of Consumer and Distribution was almost breakeven over the LTM May 2018.
9
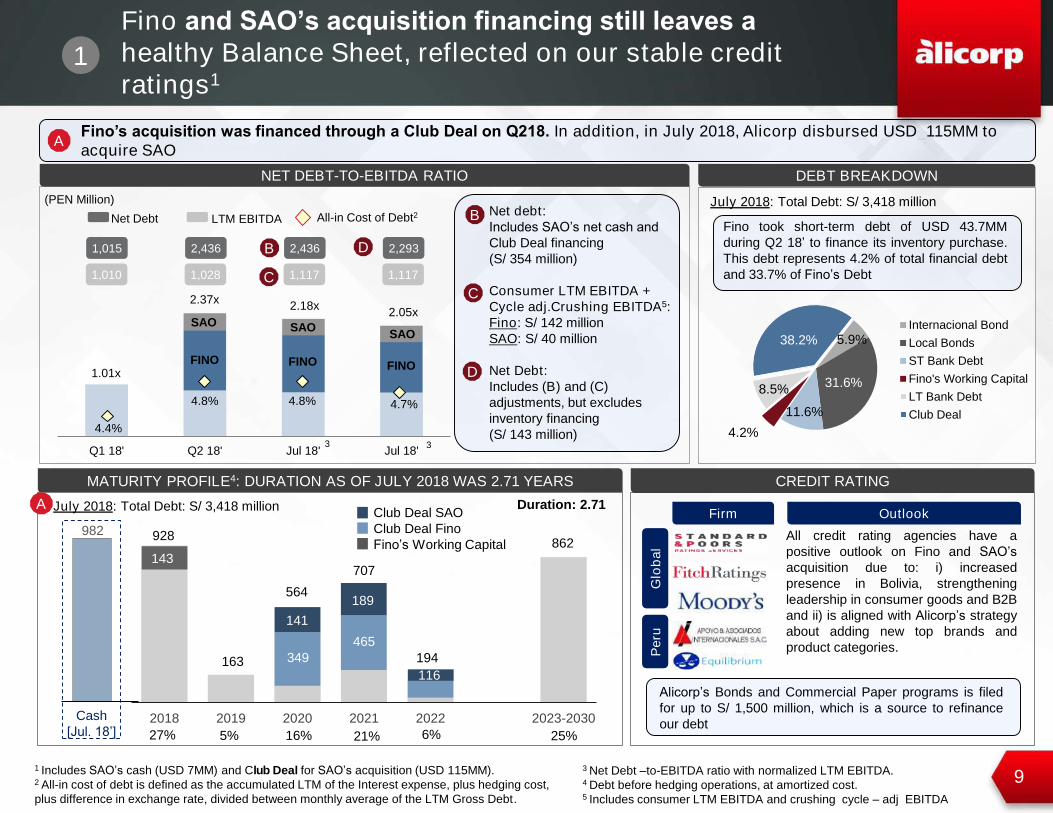
1.01x
2.37x2.18x
2.05x
Q1 18' Q2 18' Jul 18' Jul 18'
5.9%
31.6%
11.6%
4.2%
8.5%
38.2%
Internacional Bond
Local Bonds
ST Bank Debt
Fino's Working Capital
LT Bank Debt
Club Deal
Net debt:
Includes SAO’s net cash and
Club Deal financing
(S/ 354 million)
Consumer LTM EBITDA +
Cycle adj.Crushing EBITDA5:
Fino: S/ 142 million
SAO: S/ 40 million
Net Debt:
Includes (B) and (C)
adjustments, but excludes
inventory financing
(S/ 143 million)
163
564
2018 2019 2020 2021 2022 2023-2030
SAOSAO
3 Net Debt –to-EBITDA ratio with normalized LTM EBITDA.4 Debt before hedging operations, at amortized cost.5 Includes consumer LTM EBITDA and crushing cycle – adj EBITDA
Fino’s acquisition was financed through a Club Deal on Q218. In addition, in July 2018, Alicorp disbursed USD_115MM to
acquire SAOA
MATURITY PROFILE4: DURATION AS OF JULY 2018 WAS 2.71 YEARS
Duration: 2.71July 2018: Total Debt: S/ 3,418 million
982
Cash
[Jul. 18’]
928
27% 5% 16% 21% 25%6%
NET DEBT-TO-EBITDA RATIO DEBT BREAKDOWN
Club Deal SAO
Club Deal Fino
Fino’s Working Capital
707
189
141
194
A
July 2018: Total Debt: S/ 3,418 million
Fino took short-term debt of USD 43.7MM
during Q2 18’ to finance its inventory purchase.
This debt represents 4.2% of total financial debt
and 33.7% of Fino’s Debt
1 Includes SAO’s cash (USD 7MM) and Club Deal for SAO’s acquisition (USD 115MM). 2 All-in cost of debt is defined as the accumulated LTM of the Interest expense, plus hedging cost,
plus difference in exchange rate, divided between monthly average of the LTM Gross Debt.
(PEN Million)
349
465
116
Fino and SAO’s acquisition financing still leaves a
healthy Balance Sheet, reflected on our stable credit
ratings11
2,436
1,028
1,015
1,010
FINO
Net Debt LTM EBITDA All-in Cost of Debt2
2,293
1,117
B
C
B
C
3
2,436
1,117
D
3
D
862
CREDIT RATING
Glo
bal
Peru
Firm
143
All credit rating agencies have a
positive outlook on Fino and SAO’s
acquisition due to: i) increased
presence in Bolivia, strengthening
leadership in consumer goods and B2B
and ii) is aligned with Alicorp’s strategy
about adding new top brands and
product categories.
Outlook
Alicorp’s Bonds and Commercial Paper programs is filed
for up to S/ 1,500 million, which is a source to refinance
our debt
SAO
FINO FINO
SAOSAO
4.4%
4.8% 4.8% 4.7%
10
Consumer
products
Source: Company management
Note: Estimation by Integration Management Office
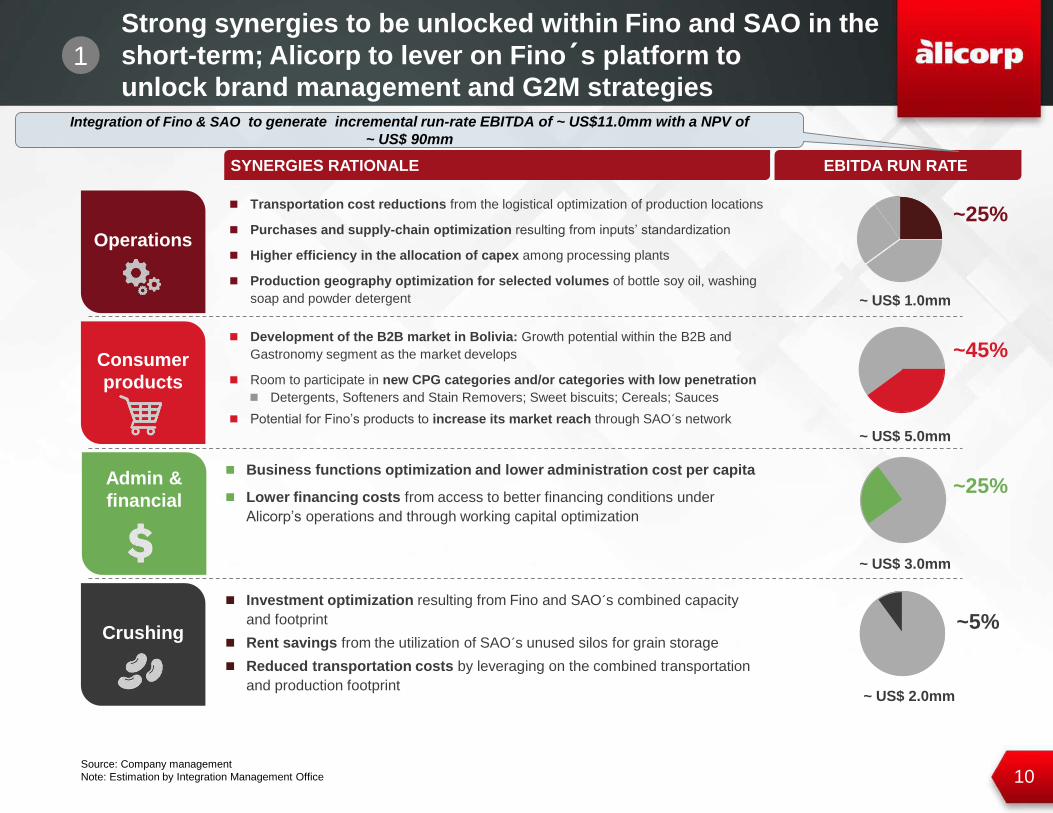
SYNERGIES RATIONALE EBITDA RUN RATE
Operations
~25%
~45%
Admin &
financial
Crushing~5%
Development of the B2B market in Bolivia: Growth potential within the B2B and
Gastronomy segment as the market develops
Room to participate in new CPG categories and/or categories with low penetration
Detergents, Softeners and Stain Removers; Sweet biscuits; Cereals; Sauces
Potential for Fino’s products to increase its market reach through SAO´s network
Transportation cost reductions from the logistical optimization of production locations
Purchases and supply-chain optimization resulting from inputs’ standardization
Higher efficiency in the allocation of capex among processing plants
Production geography optimization for selected volumes of bottle soy oil, washing
soap and powder detergent
Business functions optimization and lower administration cost per capita
Lower financing costs from access to better financing conditions under
Alicorp’s operations and through working capital optimization
Investment optimization resulting from Fino and SAO´s combined capacity
and footprint
Rent savings from the utilization of SAO´s unused silos for grain storage
Reduced transportation costs by leveraging on the combined transportation
and production footprint
1
Strong synergies to be unlocked within Fino and SAO in the
short-term; Alicorp to lever on Fino´s platform to
unlock brand management and G2M strategies
~ US$ 1.0mm
~ US$ 5.0mm
~ US$ 3.0mm
~ US$ 2.0mm
~25%
Integration of Fino & SAO to generate incremental run-rate EBITDA of ~ US$11.0mm with a NPV of
~ US$ 90mm
11
Topics
Bolivia´s M&A Transaction [ 1 ]
Corporate Strategy [ 2 ]
Q2 2018 Financial Results [ 3 ]
Guidance 2018 [ 4 ]
Stock Performance [ 5 ]
Appendix [ 6 ]
12
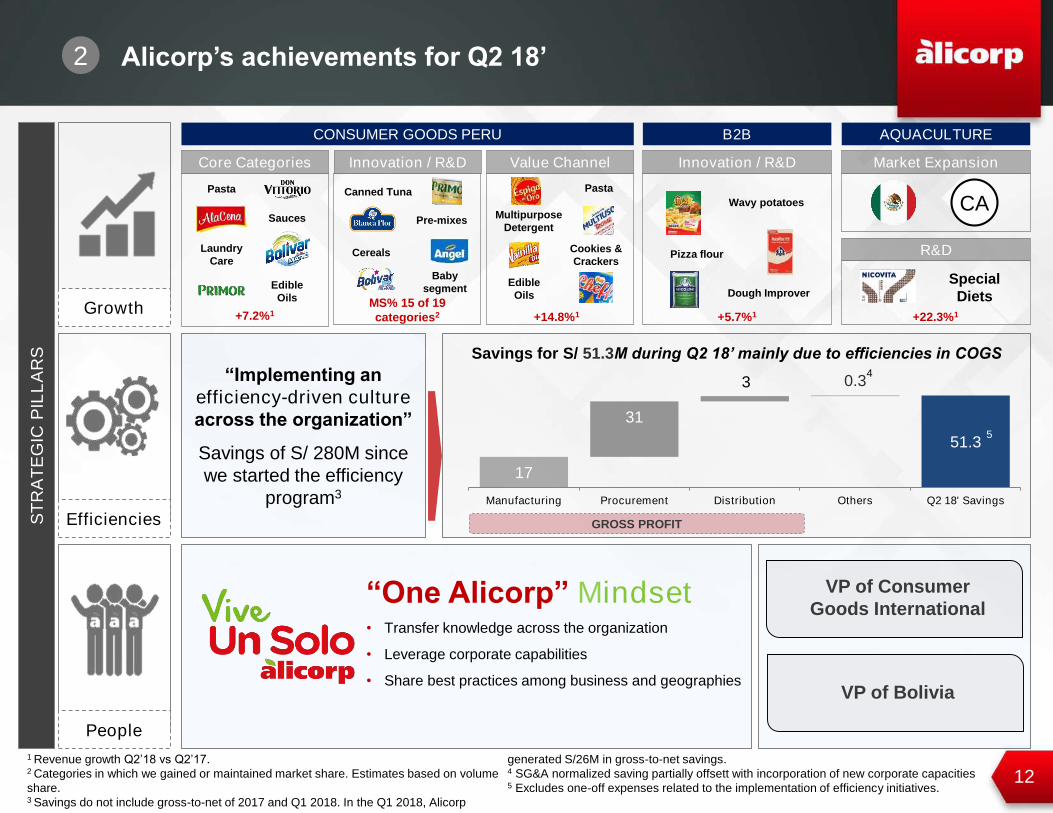
1 Revenue growth Q2’18 vs Q2’17.2 Categories in which we gained or maintained market share. Estimates based on volume
share.3 Savings do not include gross-to-net of 2017 and Q1 2018. In the Q1 2018, Alicorp
generated S/26M in gross-to-net savings.4 SG&A normalized saving partially offsett with incorporation of new corporate capacities5 Excludes one-off expenses related to the implementation of efficiency initiatives.
ST
RA
TE
GIC
PIL
LA
RS
“One Alicorp” Mindset• Transfer knowledge across the organization
• Leverage corporate capabilities
• Share best practices among business and geographies
“Implementing an
efficiency-driven culture
across the organization”
Savings of S/ 280M since
we started the efficiency
program3
Growth
2 Alicorp’s achievements for Q2 18’
GROSS PROFIT
3
Efficiencies
People
CONSUMER GOODS PERU B2B AQUACULTURE
Core Categories Value ChannelInnovation / R&D
Edible
Oils
Laundry
Care
Pasta
Sauces
+7.2%1MS% 15 of 19
categories2
Cereals
Pre-mixes
Baby
segment
Canned Tuna
+14.8%1
Multipurpose
Detergent
Cookies &
Crackers
Edible
Oils
Innovation / R&D Market Expansion
R&D
Special
Diets
17
51.3
31
3 0.3
Manufacturing Procurement Distribution Others Q2 18' Savings
Savings for S/ 51.3M during Q2 18’ mainly due to efficiencies in COGS
VP of Consumer
Goods International
VP of Bolivia
Pasta
5
Pizza flour
Dough Improver
Wavy potatoes CA
4
+5.7%1 +22.3%1
13
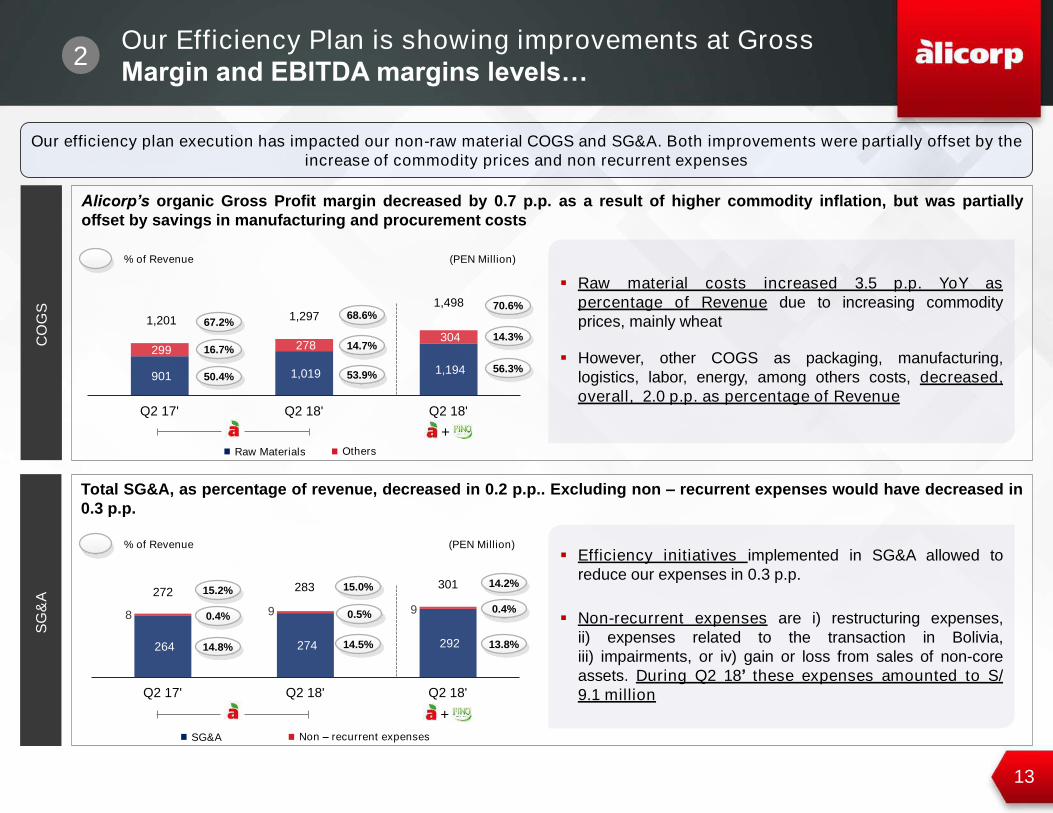
Our Efficiency Plan is showing improvements at Gross
Margin and EBITDA margins levels…2
Our efficiency plan execution has impacted our non-raw material COGS and SG&A. Both improvements were partially offset by the
increase of commodity prices and non recurrent expenses
CO
GS
▪ Raw material costs increased 3.5 p.p. YoY as
percentage of Revenue due to increasing commodity
prices, mainly wheat
▪ However, other COGS as packaging, manufacturing,
logistics, labor, energy, among others costs, decreased,
overall, 2.0 p.p. as percentage of Revenue
SG
&A
Alicorp’s organic Gross Profit margin decreased by 0.7 p.p. as a result of higher commodity inflation, but was partially
offset by savings in manufacturing and procurement costs
901 1,019 1,194
299 278 304
Q2 17' Q2 18' Q2 18'
% of Revenue (PEN Million)
1,2971,201
1,498
50.4%56.3%
16.7%
14.3%
67.2%
70.6%
53.9%
14.7%
68.6%
+
OthersRaw Materials
▪ Efficiency initiatives implemented in SG&A allowed to
reduce our expenses in 0.3 p.p.
▪ Non-recurrent expenses are i) restructuring expenses,
ii) expenses related to the transaction in Bolivia,
iii) impairments, or iv) gain or loss from sales of non-core
assets. During Q2 18’ these expenses amounted to S/
9.1 million
Total SG&A, as percentage of revenue, decreased in 0.2 p.p.. Excluding non – recurrent expenses would have decreased in
0.3 p.p.
264 274 292
8 9 9
Q2 17' Q2 18' Q2 18'
14.8%
0.4%
15.2%
13.8%
0.4%
14.2%
14.5%
0.5%
15.0%
Non – recurrent expensesSG&A
272301283
% of Revenue (PEN Million)
+
14
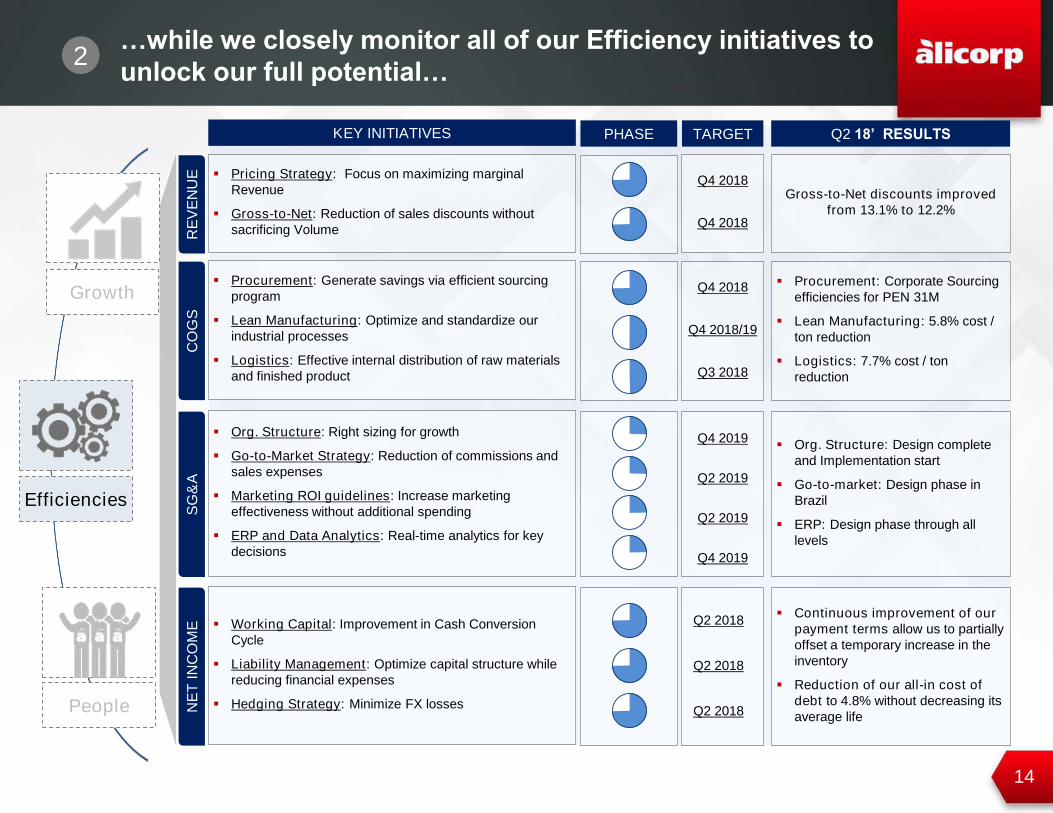
2…while we closely monitor all of our Efficiency initiatives to
unlock our full potential…
▪ Continuous improvement of our
payment terms allow us to partially
offset a temporary increase in the
inventory
▪ Reduction of our all-in cost of
debt to 4.8% without decreasing its
average life
Efficiencies
People
Growth
KEY INITIATIVES PHASE
NE
T I
NC
OM
ER
EV
EN
UE
CO
GS
SG
&A
▪ Pricing Strategy: Focus on maximizing marginal
Revenue
▪ Gross-to-Net: Reduction of sales discounts without
sacrificing Volume
▪ Procurement: Generate savings via efficient sourcing
program
▪ Lean Manufacturing: Optimize and standardize our
industrial processes
▪ Logistics: Effective internal distribution of raw materials
and finished product
▪ Org. Structure: Right sizing for growth
▪ Go-to-Market Strategy: Reduction of commissions and
sales expenses
▪ Marketing ROI guidelines: Increase marketing
effectiveness without additional spending
▪ ERP and Data Analytics: Real-time analytics for key
decisions
▪ Working Capital: Improvement in Cash Conversion
Cycle
▪ Liability Management: Optimize capital structure while
reducing financial expenses
▪ Hedging Strategy: Minimize FX losses
TARGET
Q4 2018
Q4 2018
Q4 2018
Q4 2018/19
Q3 2018
Q4 2019
Q2 2019
Q2 2019
Q4 2019
Q2 2018
Q2 2018
Q2 2018
Q2 18’ RESULTS
Gross-to-Net discounts improved
from 13.1% to 12.2%
▪ Procurement: Corporate Sourcing
efficiencies for PEN 31M
▪ Lean Manufacturing: 5.8% cost /
ton reduction
▪ Logistics: 7.7% cost / ton
reduction
▪ Org. Structure: Design complete
and Implementation start
▪ Go-to-market: Design phase in
Brazil
▪ ERP: Design phase through all
levels
15
Excl. corporate
expenses
EBITDA mg breakeven
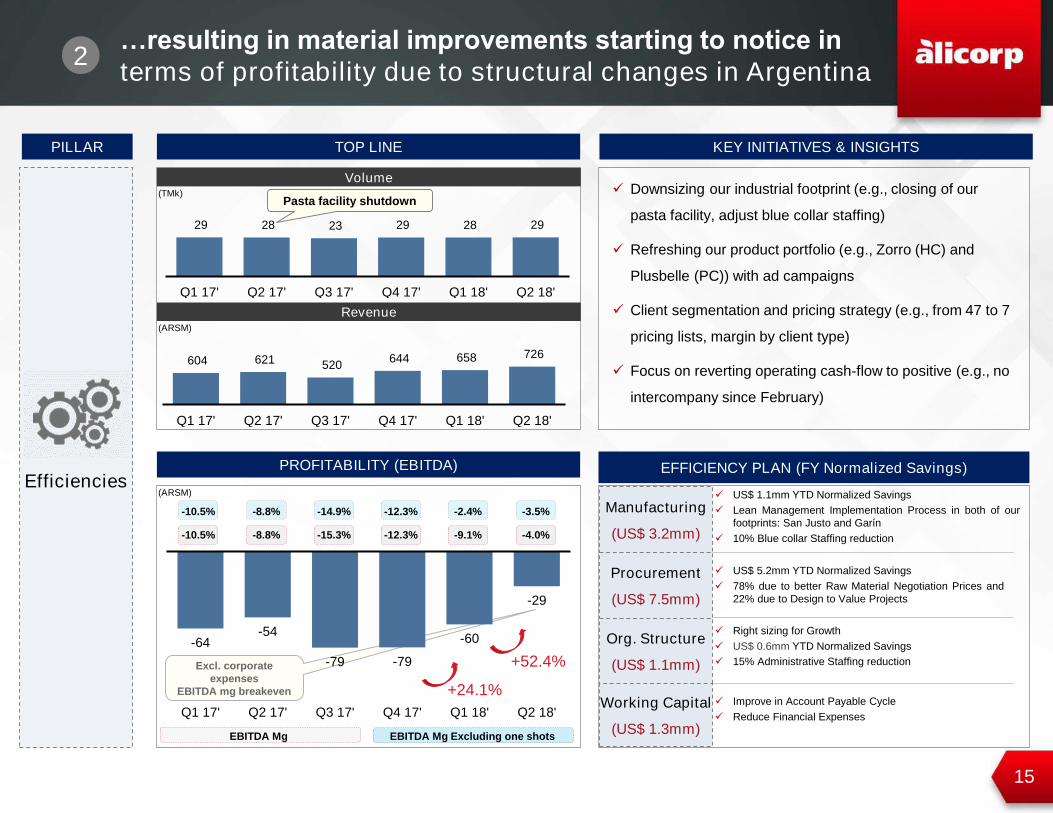
2…resulting in material improvements starting to notice in
terms of profitability due to structural changes in Argentina
PILLAR
Efficiencies
29 28 23 29 28 29
Q1 17' Q2 17' Q3 17' Q4 17' Q1 18' Q2 18'
TOP LINE KEY INITIATIVES & INSIGHTS
PROFITABILITY (EBITDA)
-64-54
-79 -79
-60
-29
Q1 17' Q2 17' Q3 17' Q4 17' Q1 18' Q2 18'
-3.5%-10.5% -8.8% -14.9% -12.3% -2.4%
604 621 520 644 658 726
Q1 17' Q2 17' Q3 17' Q4 17' Q1 18' Q2 18'
Volume
Revenue
EBITDA Mg
EFFICIENCY PLAN (FY Normalized Savings)
Manufacturing
(US$ 3.2mm)
Org. Structure
(US$ 1.1mm)
Procurement
(US$ 7.5mm)
Working Capital
(US$ 1.3mm)
✓ US$ 1.1mm YTD Normalized Savings
✓ Lean Management Implementation Process in both of our
footprints: San Justo and Garín
✓ 10% Blue collar Staffing reduction
✓ US$ 5.2mm YTD Normalized Savings
✓ 78% due to better Raw Material Negotiation Prices and
22% due to Design to Value Projects
✓ Right sizing for Growth
✓ US$ 0.6mm YTD Normalized Savings
✓ 15% Administrative Staffing reduction
✓ Improve in Account Payable Cycle
✓ Reduce Financial Expenses
(TMk)
(ARSM)
(ARSM)
✓ Downsizing our industrial footprint (e.g., closing of our
pasta facility, adjust blue collar staffing)
✓ Refreshing our product portfolio (e.g., Zorro (HC) and
Plusbelle (PC)) with ad campaigns
✓ Client segmentation and pricing strategy (e.g., from 47 to 7
pricing lists, margin by client type)
✓ Focus on reverting operating cash-flow to positive (e.g., no
intercompany since February)
+24.1%
+52.4%
Pasta facility shutdown
EBITDA Mg Excluding one shots
-4.0%-10.5% -8.8% -15.3% -12.3% -9.1%

16
Topics
Bolivia´s M&A Transaction [ 1 ]
Corporate Strategy [ 2 ]
Q2 2018 Financial Results [ 3 ]
Guidance 2018 [ 4 ]
Stock Performance [ 5 ]
Appendix [ 6 ]
17
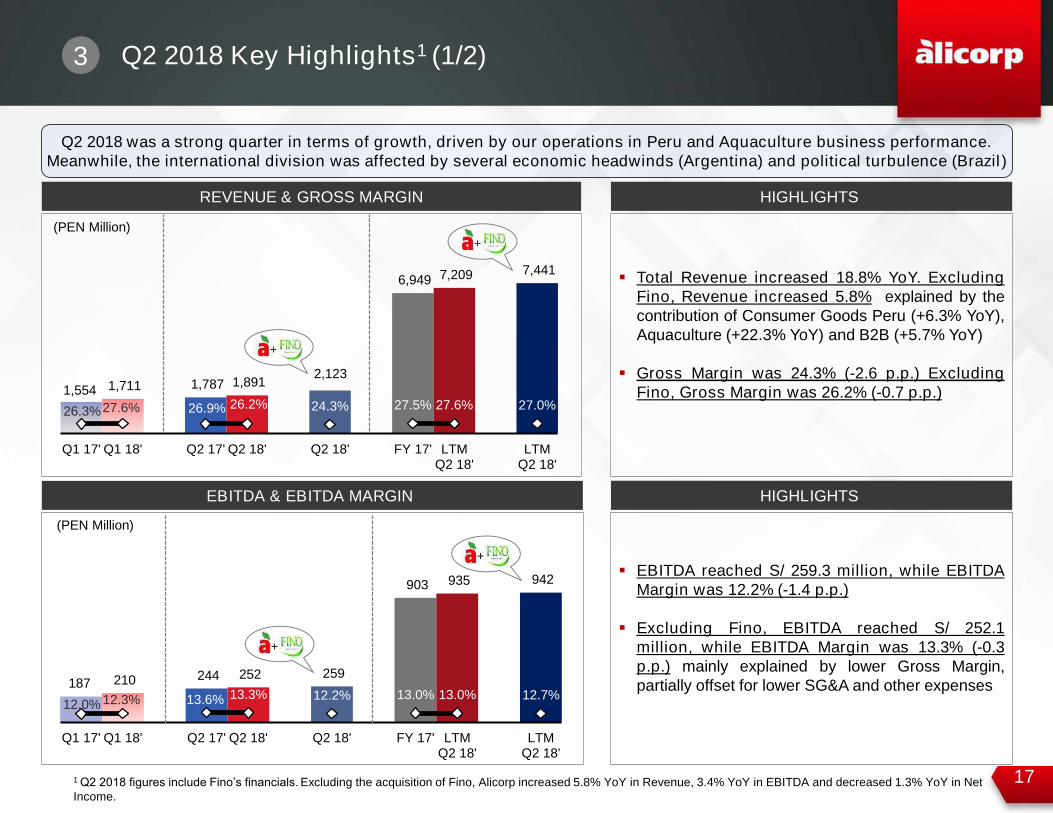
▪ EBITDA reached S/ 259.3 million, while EBITDA
Margin was 12.2% (-1.4 p.p.)
▪ Excluding Fino, EBITDA reached S/ 252.1
million, while EBITDA Margin was 13.3% (-0.3
p.p.) mainly explained by lower Gross Margin,
partially offset for lower SG&A and other expenses
1,554 1,711 1,787 1,891 2,123
6,949 7,209 7,441
26.3%27.6% 26.9% 26.2% 24.3% 27.5% 27.6% 27.0%
Q1 17' Q1 18' Q2 17' Q2 18' Q2 18' FY 17' LTMQ2 18'
LTMQ2 18'
187 210 244 252 259
903 935 942
12.0% 12.3% 13.6% 13.3% 12.2% 13.0% 13.0% 12.7%
Q1 17' Q1 18' Q2 17' Q2 18' Q2 18' FY 17' LTMQ2 18'
LTMQ2 18'
REVENUE & GROSS MARGIN
EBITDA & EBITDA MARGIN
3 Q2 2018 Key Highlights1 (1/2)
Q2 2018 was a strong quarter in terms of growth, driven by our operations in Peru and Aquaculture business performance.
Meanwhile, the international division was affected by several economic headwinds (Argentina) and political turbulence (Brazil)
(PEN Million)
(PEN Million)
▪ Total Revenue increased 18.8% YoY. Excluding
Fino, Revenue increased 5.8% explained by the
contribution of Consumer Goods Peru (+6.3% YoY),
Aquaculture (+22.3% YoY) and B2B (+5.7% YoY)
▪ Gross Margin was 24.3% (-2.6 p.p.) Excluding
Fino, Gross Margin was 26.2% (-0.7 p.p.)
HIGHLIGHTS
+
+
+
+
HIGHLIGHTS
1 Q2 2018 figures include Fino’s financials. Excluding the acquisition of Fino, Alicorp increased 5.8% YoY in Revenue, 3.4% YoY in EBITDA and decreased 1.3% YoY in Net
Income.
18
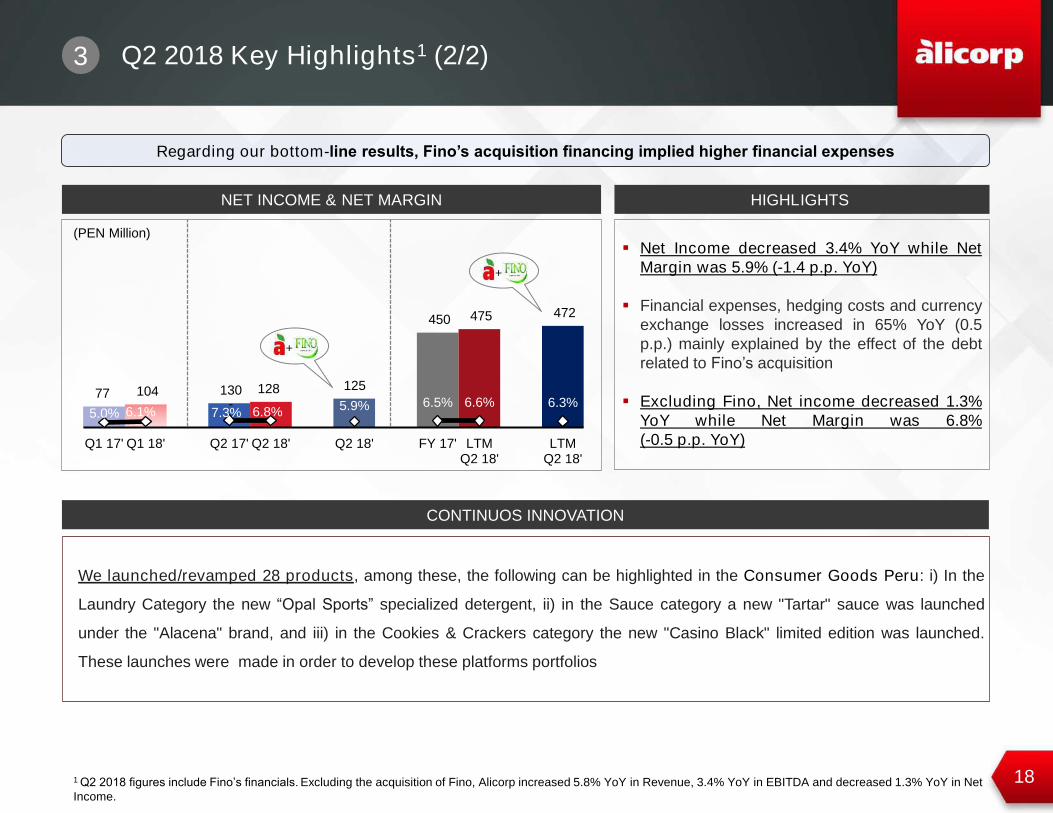
-77 104 130 128 125
450 475 472
5.0% 6.1% 7.3% 6.8% 5.9% 6.5% 6.6% 6.3%
Q1 17' Q1 18' Q2 17' Q2 18' Q2 18' FY 17' LTMQ2 18'
LTMQ2 18'
Q2 2018 Key Highlights1 (2/2)
NET INCOME & NET MARGIN
Regarding our bottom-line results, Fino’s acquisition financing implied higher financial expenses
(PEN Million)
▪ Net Income decreased 3.4% YoY while Net
Margin was 5.9% (-1.4 p.p. YoY)
▪ Financial expenses, hedging costs and currency
exchange losses increased in 65% YoY (0.5
p.p.) mainly explained by the effect of the debt
related to Fino’s acquisition
▪ Excluding Fino, Net income decreased 1.3%
YoY while Net Margin was 6.8%
(-0.5 p.p. YoY)
HIGHLIGHTS
+
+
We launched/revamped 28 products, among these, the following can be highlighted in the Consumer Goods Peru: i) In the
Laundry Category the new “Opal Sports” specialized detergent, ii) in the Sauce category a new "Tartar" sauce was launched
under the "Alacena" brand, and iii) in the Cookies & Crackers category the new "Casino Black" limited edition was launched.
These launches were made in order to develop these platforms portfolios
CONTINUOS INNOVATION
1 Q2 2018 figures include Fino’s financials. Excluding the acquisition of Fino, Alicorp increased 5.8% YoY in Revenue, 3.4% YoY in EBITDA and decreased 1.3% YoY in Net
Income.
3
19
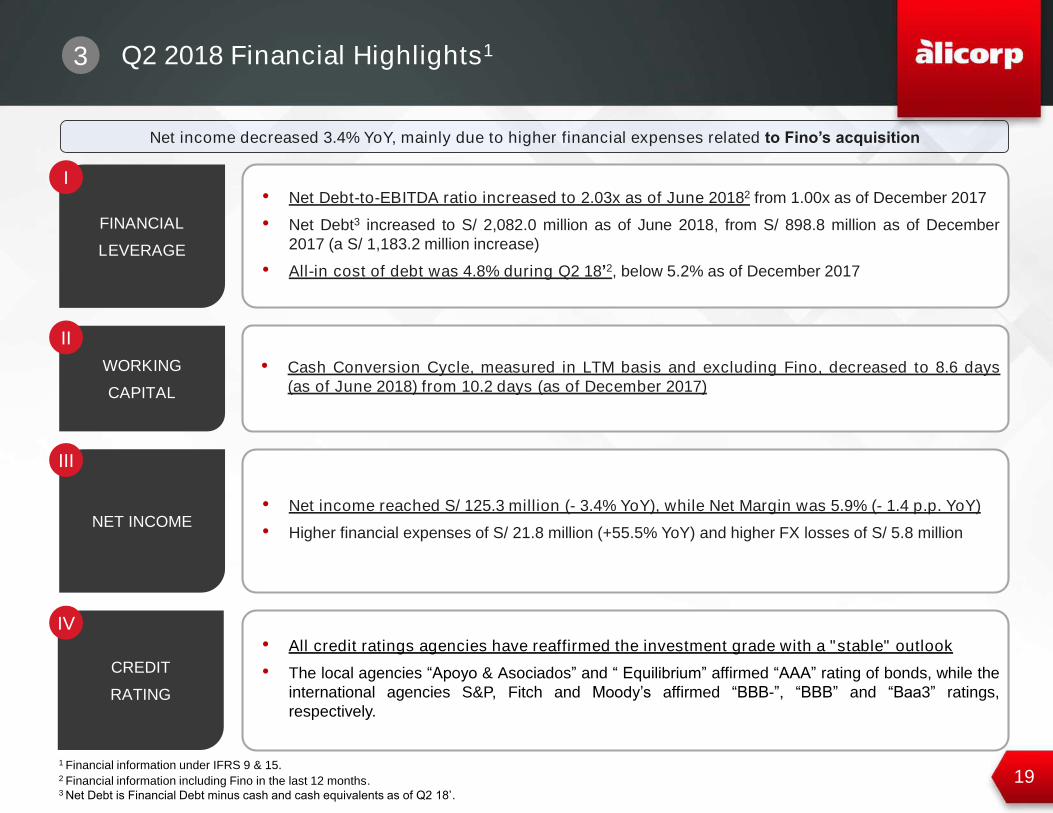
Net income decreased 3.4% YoY, mainly due to higher financial expenses related to Fino’s acquisition
WORKING
CAPITAL
• Cash Conversion Cycle, measured in LTM basis and excluding Fino, decreased to 8.6 days
(as of June 2018) from 10.2 days (as of December 2017)
II
NET INCOME• Net income reached S/ 125.3 million (- 3.4% YoY), while Net Margin was 5.9% (- 1.4 p.p. YoY)
• Higher financial expenses of S/ 21.8 million (+55.5% YoY) and higher FX losses of S/ 5.8 million
CREDIT
RATING
• All credit ratings agencies have reaffirmed the investment grade with a "stable" outlook
• The local agencies “Apoyo & Asociados” and “ Equilibrium” affirmed “AAA” rating of bonds, while the
international agencies S&P, Fitch and Moody’s affirmed “BBB-”, “BBB” and “Baa3” ratings,
respectively.
IV
• Net Debt-to-EBITDA ratio increased to 2.03x as of June 20182 from 1.00x as of December 2017
• Net Debt3 increased to S/ 2,082.0 million as of June 2018, from S/ 898.8 million as of December
2017 (a S/ 1,183.2 million increase)
• All-in cost of debt was 4.8% during Q2 18’2, below 5.2% as of December 2017
FINANCIAL
LEVERAGE
I
Q2 2018 Financial Highlights1
III
2 Financial information including Fino in the last 12 months.3 Net Debt is Financial Debt minus cash and cash equivalents as of Q2 18’.
1 Financial information under IFRS 9 & 15.
3
20
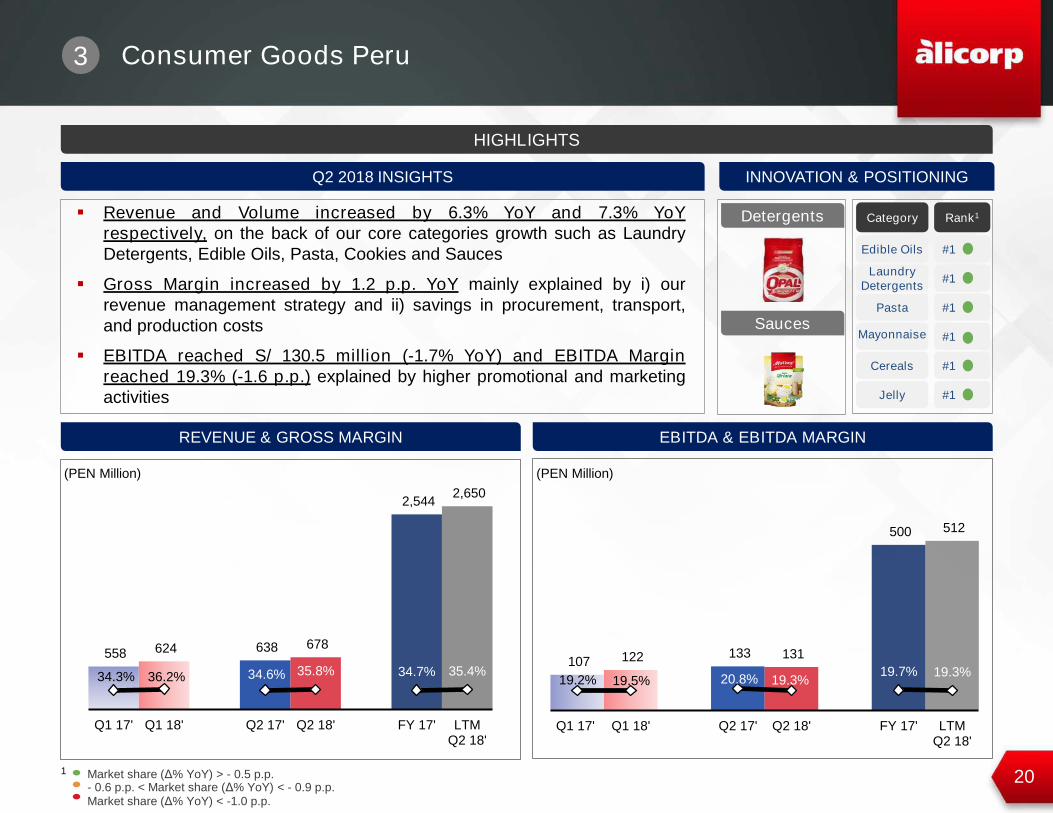
▪ Revenue and Volume increased by 6.3% YoY and 7.3% YoY
respectively, on the back of our core categories growth such as Laundry
Detergents, Edible Oils, Pasta, Cookies and Sauces
▪ Gross Margin increased by 1.2 p.p. YoY mainly explained by i) our
revenue management strategy and ii) savings in procurement, transport,
and production costs
▪ EBITDA reached S/ 130.5 million (-1.7% YoY) and EBITDA Margin
reached 19.3% (-1.6 p.p.) explained by higher promotional and marketing
activities
HIGHLIGHTS
REVENUE & GROSS MARGIN EBITDA & EBITDA MARGIN
Q2 2018 INSIGHTS
558 624 638 678
2,544 2,650
34.3% 36.2% 34.6% 35.8% 34.7% 35.4%
Q1 17' Q1 18' Q2 17' Q2 18' FY 17' LTMQ2 18'
Market share (Δ% YoY) > - 0.5 p.p. - 0.6 p.p. < Market share (Δ% YoY) < - 0.9 p.p. Market share (Δ% YoY) < -1.0 p.p.
INNOVATION & POSITIONING
Category Rank1
Edible Oils #1
#1
Pasta #1
#1
Cereals #1
Jelly #1
Laundry
Detergents
Mayonnaise
Consumer Goods Peru
1
(PEN Million) (PEN Million)
Sauces
Detergents
3
107 122 133 131
500 512
19.2% 19.5% 20.8% 19.3%19.7% 19.3%
Q1 17' Q1 18' Q2 17' Q2 18' FY 17' LTMQ2 18'
21
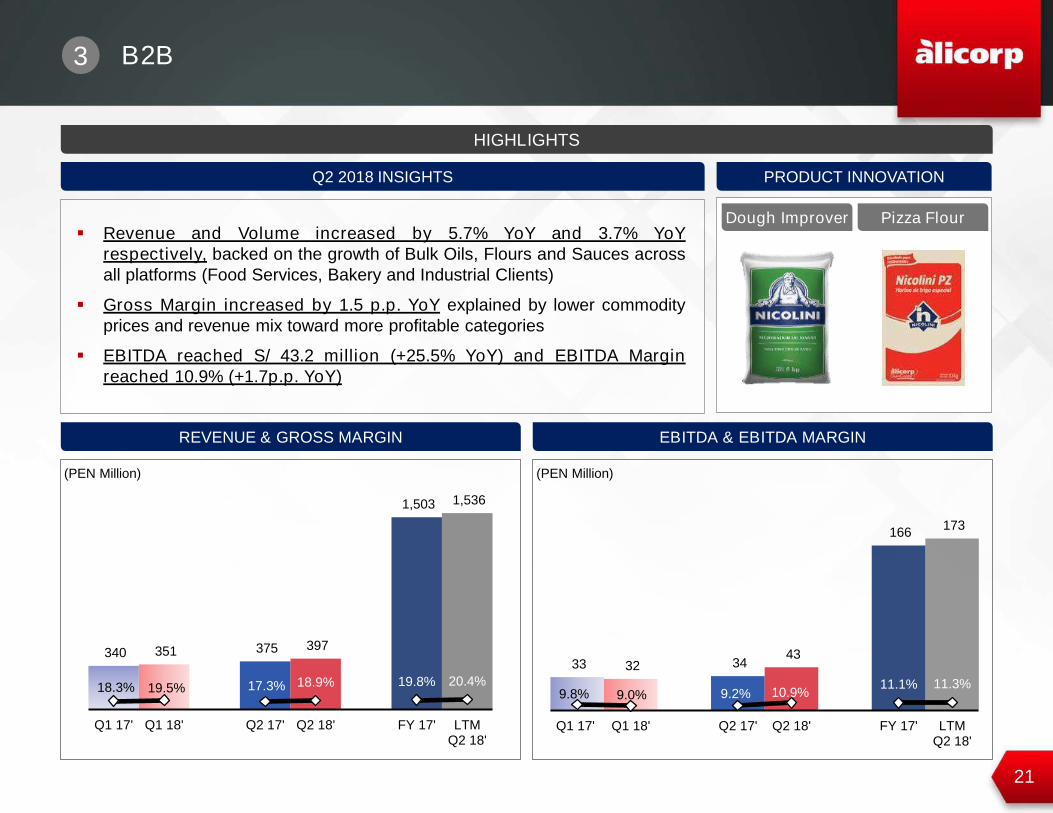
▪ Revenue and Volume increased by 5.7% YoY and 3.7% YoY
respectively, backed on the growth of Bulk Oils, Flours and Sauces across
all platforms (Food Services, Bakery and Industrial Clients)
▪ Gross Margin increased by 1.5 p.p. YoY explained by lower commodity
prices and revenue mix toward more profitable categories
▪ EBITDA reached S/ 43.2 million (+25.5% YoY) and EBITDA Margin
reached 10.9% (+1.7p.p. YoY)
HIGHLIGHTS
EBITDA & EBITDA MARGIN
PRODUCT INNOVATIONQ2 2018 INSIGHTS
REVENUE & GROSS MARGIN
Dough Improver
B2B
(PEN Million) (PEN Million)
Pizza Flour
340 351 375 397
1,503 1,536
18.3% 19.5% 17.3% 18.9% 19.8% 20.4%
Q1 17' Q1 18' Q2 17' Q2 18' FY 17' LTMQ2 18'
33 32 34 43
166 173
9.8% 9.0% 9.2% 10.9%11.1% 11.3%
Q1 17' Q1 18' Q2 17' Q2 18' FY 17' LTMQ2 18'
3
22
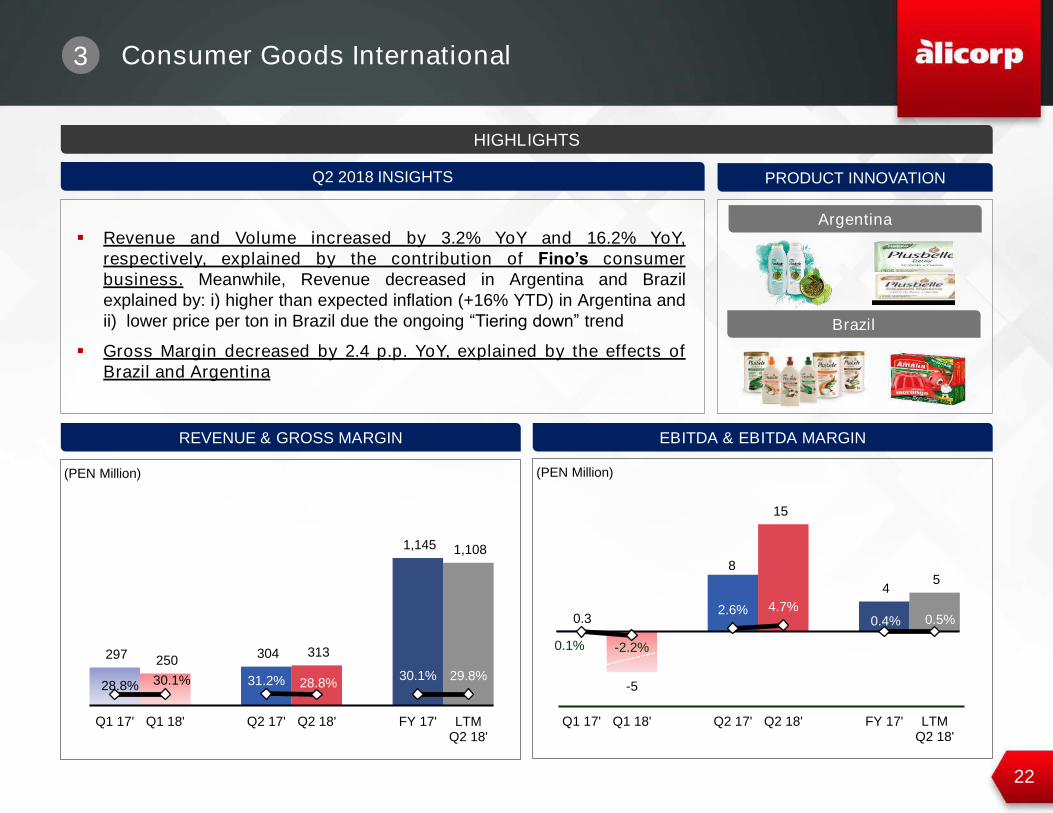
-5
8
15
4 5
0.1% -2.2%
2.6% 4.7%0.4% 0.5%
Q1 17' Q1 18' Q2 17' Q2 18' FY 17' LTMQ2 18'
▪ Revenue and Volume increased by 3.2% YoY and 16.2% YoY,
respectively, explained by the contribution of Fino’s consumer
business. Meanwhile, Revenue decreased in Argentina and Brazil
explained by: i) higher than expected inflation (+16% YTD) in Argentina and
ii) lower price per ton in Brazil due the ongoing “Tiering down” trend
▪ Gross Margin decreased by 2.4 p.p. YoY, explained by the effects of
Brazil and Argentina
HIGHLIGHTS
EBITDA & EBITDA MARGIN
PRODUCT INNOVATIONQ2 2018 INSIGHTS
297 250 304 313
1,145 1,108
28.8% 30.1% 31.2% 28.8%30.1% 29.8%
Q1 17' Q1 18' Q2 17' Q2 18' FY 17' LTMQ2 18'
REVENUE & GROSS MARGIN
Consumer Goods International
(PEN Million) (PEN Million)
0.3
Argentina
Brazil
3
23
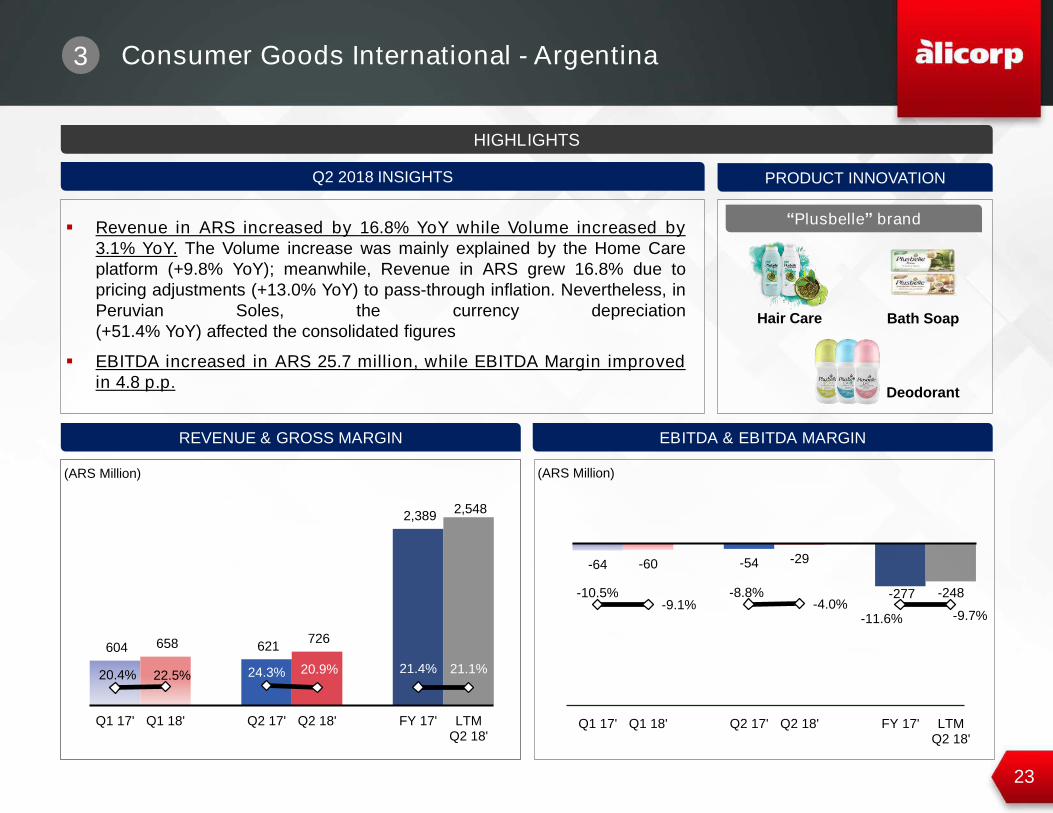
604 658 621 726
2,389 2,548
20.4% 22.5% 24.3% 21.4% 21.1%
Q1 17' Q1 18' Q2 17' Q2 18' FY 17' LTMQ2 18'
20.9%
▪ Revenue in ARS increased by 16.8% YoY while Volume increased by
3.1% YoY. The Volume increase was mainly explained by the Home Care
platform (+9.8% YoY); meanwhile, Revenue in ARS grew 16.8% due to
pricing adjustments (+13.0% YoY) to pass-through inflation. Nevertheless, in
Peruvian Soles, the currency depreciation
(+51.4% YoY) affected the consolidated figures
▪ EBITDA increased in ARS 25.7 million, while EBITDA Margin improved
in 4.8 p.p.
HIGHLIGHTS
EBITDA & EBITDA MARGIN
Q2 2018 INSIGHTS
REVENUE & GROSS MARGIN
Consumer Goods International - Argentina
(ARS Million) (ARS Million)
-64 -60 -54 -29
-277 -248 -10.5%-9.1%
-8.8%-4.0%
-11.6% -9.7%
Q1 17' Q1 18' Q2 17' Q2 18' FY 17' LTMQ2 18'
PRODUCT INNOVATION
“Plusbelle” brand
Hair Care Bath Soap
Deodorant
3
24
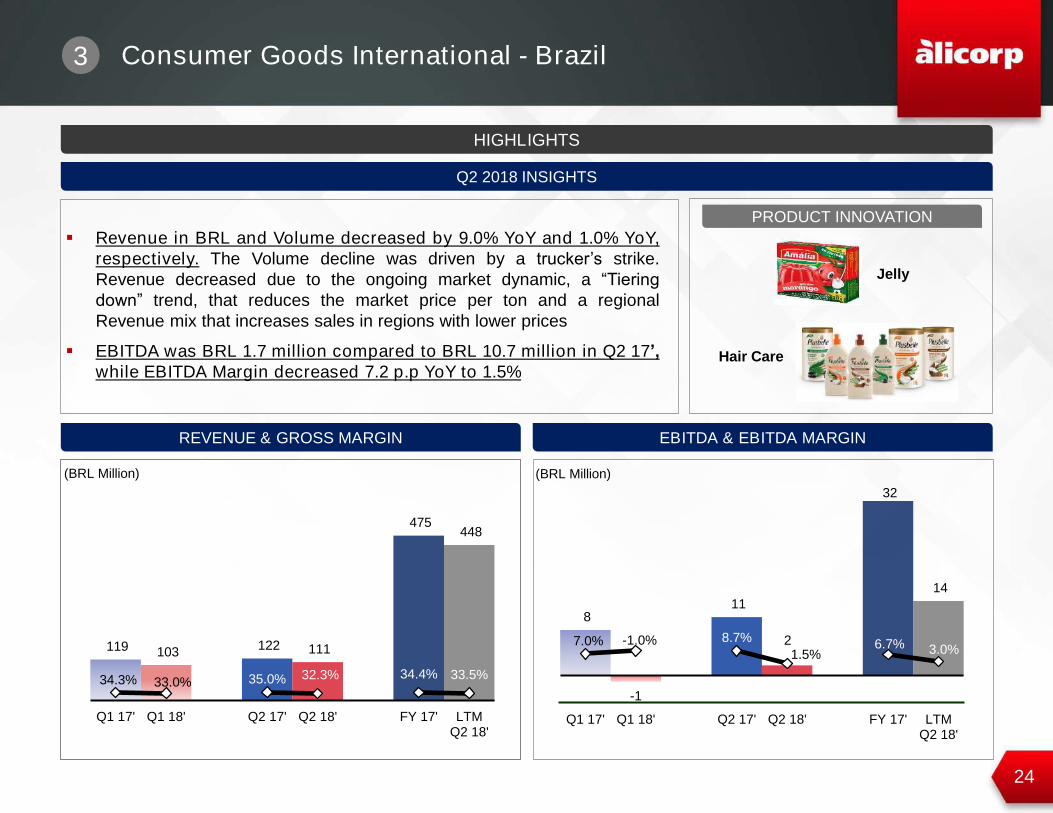
▪ Revenue in BRL and Volume decreased by 9.0% YoY and 1.0% YoY,
respectively. The Volume decline was driven by a trucker’s strike.
Revenue decreased due to the ongoing market dynamic, a “Tiering
down” trend, that reduces the market price per ton and a regional
Revenue mix that increases sales in regions with lower prices
▪ EBITDA was BRL 1.7 million compared to BRL 10.7 million in Q2 17’,
while EBITDA Margin decreased 7.2 p.p YoY to 1.5%
HIGHLIGHTS
EBITDA & EBITDA MARGIN
Q2 2018 INSIGHTS
119 103 122 111
475 448
34.3% 33.0% 35.0% 34.4% 33.5%
Q1 17' Q1 18' Q2 17' Q2 18' FY 17' LTMQ2 18'
32.3%
REVENUE & GROSS MARGIN
Consumer Goods International - Brazil
(BRL Million) (BRL Million)
8
-1
11
2
32
14
7.0% -1.0% 8.7%
1.5%6.7% 3.0%
Q1 17' Q1 18' Q2 17' Q2 18' FY 17' LTMQ2 18'
Hair Care
Jelly
PRODUCT INNOVATION
3
25
HIGHLIGHTS
BUSINESS INSIGHTS
EBITDA & EBITDA MARGINREVENUE & GROSS MARGIN
Consumer Goods International - Bolivia
(US$ Million) (US$ Million)
ALICORP BOLIVIA´S PORTFOLIO
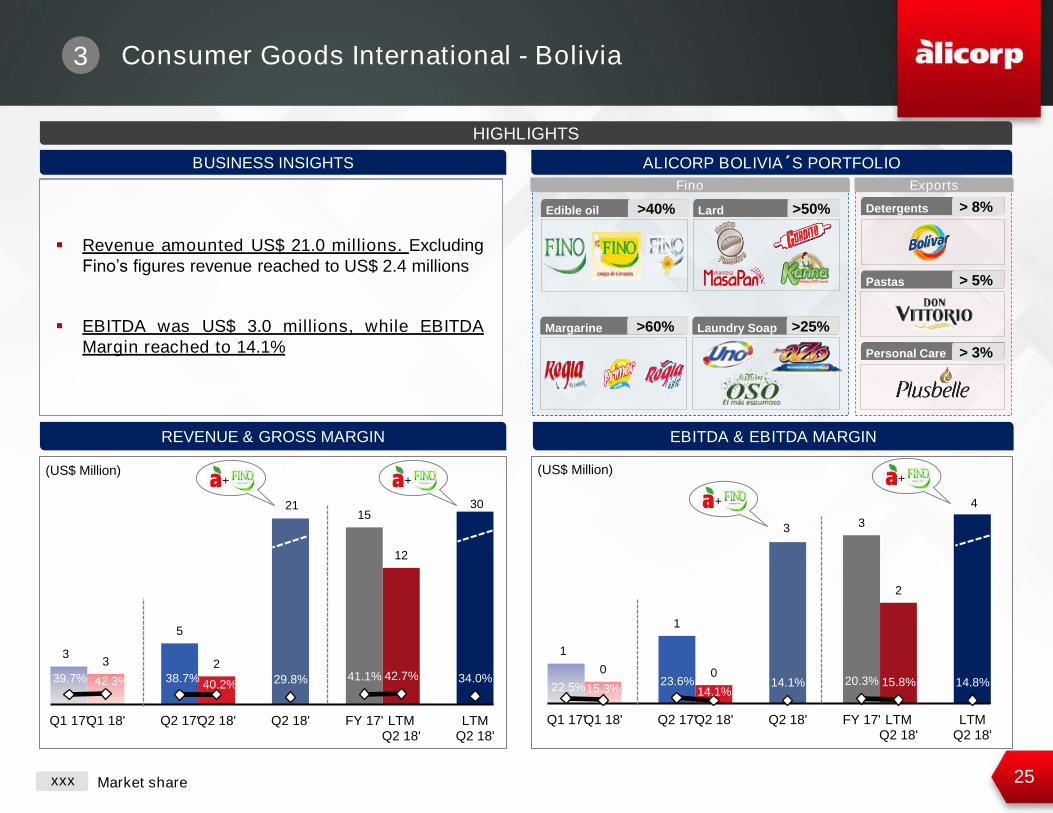
Edible oil Lard>40% >50%
Fino Exports
Margarine Laundry Soap>60% >25%
Detergents > 8%
Pastas > 5%
Personal Care > 3%
33
5
2
21 15
12
30
39.7% 42.3% 38.7%40.2% 29.8% 41.1% 42.7% 34.0%
Q1 17'Q1 18' Q2 17'Q2 18' Q2 18' FY 17' LTMQ2 18'
LTMQ2 18'
+
1
0
1
0
3 3
2
4
22.5%15.3%23.6%
14.1%14.1% 20.3% 15.8% 14.8%
Q1 17'Q1 18' Q2 17'Q2 18' Q2 18' FY 17' LTMQ2 18'
LTMQ2 18'
▪ Revenue amounted US$ 21.0 millions. Excluding
Fino’s figures revenue reached to US$ 2.4 millions
▪ EBITDA was US$ 3.0 millions, while EBITDA
Margin reached to 14.1%
Market share
+
+
+
xxx
3
26
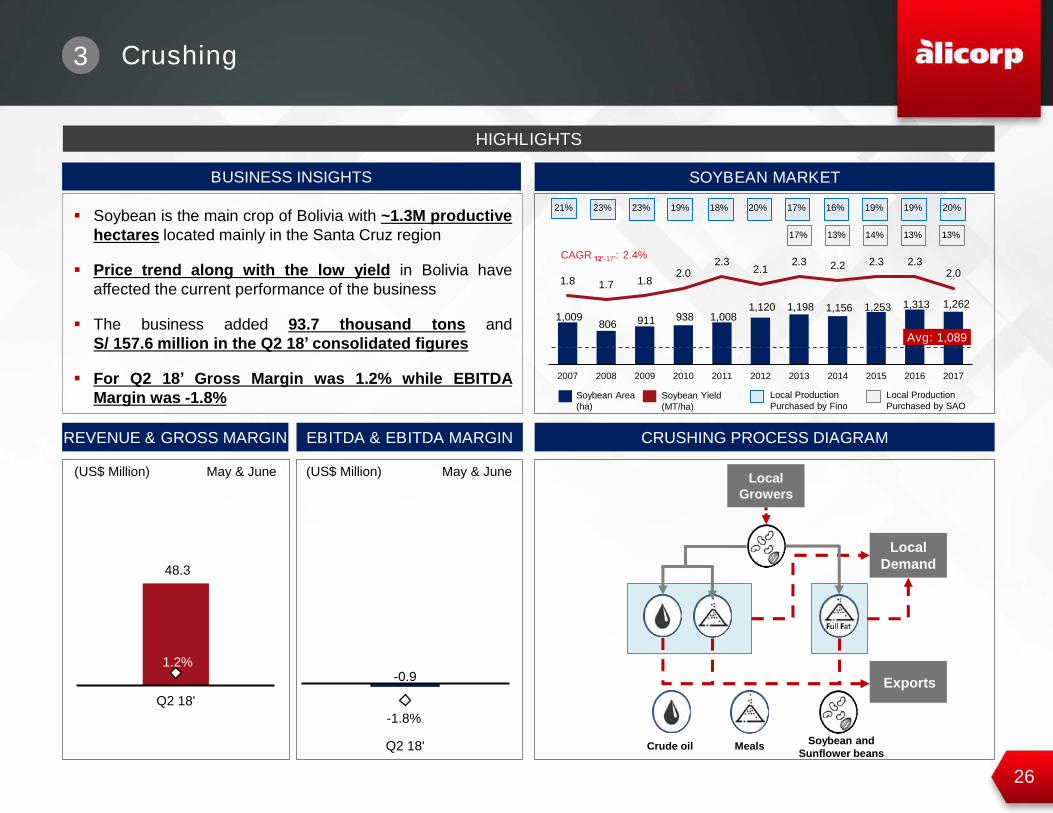
1,009 806 911 938 1,008
1,120 1,198 1,156 1,253 1,313 1,262
1.8 1.7 1.82.0
2.32.1
2.3 2.2 2.3 2.32.0
2007 2008 2009 2010 2011 2012 2013 2014 2015 2016 2017
HIGHLIGHTS
BUSINESS INSIGHTS
CRUSHING PROCESS DIAGRAMREVENUE & GROSS MARGIN
Crushing
(US$ Million)
SOYBEAN MARKET
EBITDA & EBITDA MARGIN
48.3
1.2%
Q2 18'
21% 23% 23% 19% 18% 20% 17% 16% 19% 19% 20%
17% 13% 14% 13% 13%
CAGR 12’-17’: 2.4%
Soybean Area
(ha)
Soybean Yield
(MT/ha)
Local Production
Purchased by Fino
Local Production
Purchased by SAO
Avg: 1,089
(US$ Million)
▪ Soybean is the main crop of Bolivia with ~1.3M productive
hectares located mainly in the Santa Cruz region
▪ Price trend along with the low yield in Bolivia have
affected the current performance of the business
▪ The business added 93.7 thousand tons and
S/ 157.6 million in the Q2 18’ consolidated figures
▪ For Q2 18’ Gross Margin was 1.2% while EBITDA
Margin was -1.8%
-0.9
-1.8%
Q2 18'
May & June May & June Local
Growers
Local
Demand
Exports
Crude oil MealsSoybean and
Sunflower beans
3
27
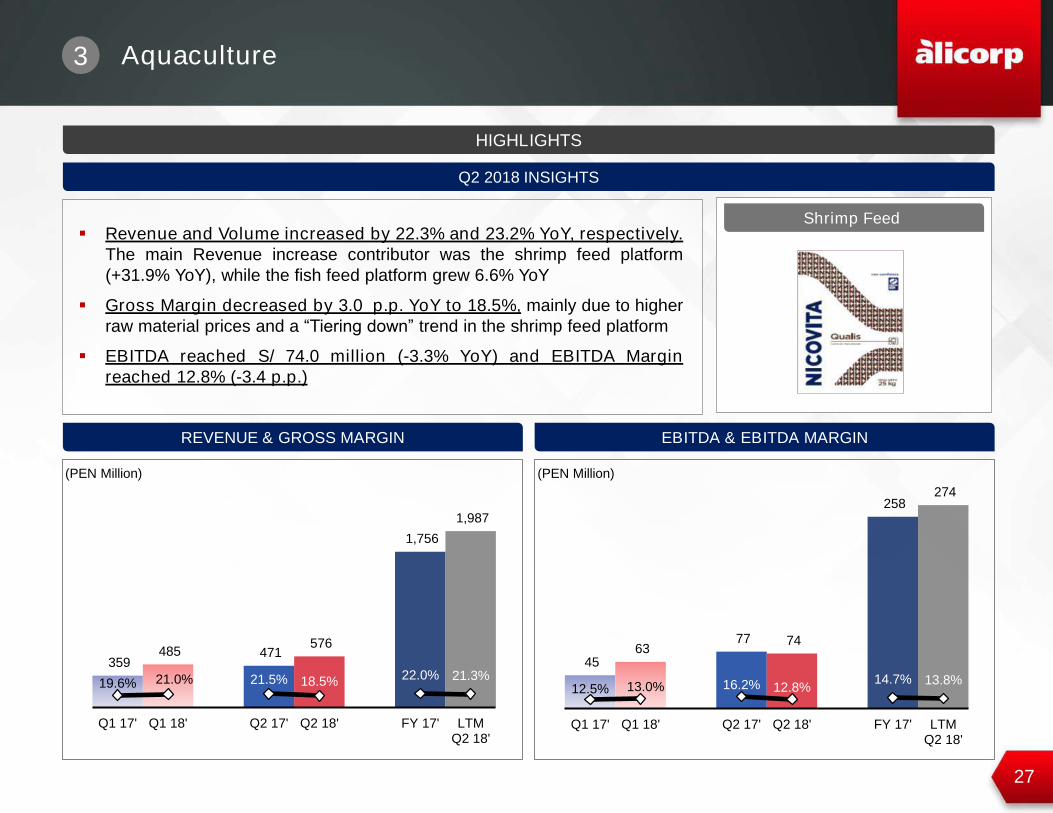
▪ Revenue and Volume increased by 22.3% and 23.2% YoY, respectively.
The main Revenue increase contributor was the shrimp feed platform
(+31.9% YoY), while the fish feed platform grew 6.6% YoY
▪ Gross Margin decreased by 3.0 p.p. YoY to 18.5%, mainly due to higher
raw material prices and a “Tiering down” trend in the shrimp feed platform
▪ EBITDA reached S/ 74.0 million (-3.3% YoY) and EBITDA Margin
reached 12.8% (-3.4 p.p.)
HIGHLIGHTS
Q2 2018 INSIGHTS
359 485 471
576
1,756
1,987
19.6% 21.0% 21.5% 18.5%22.0% 21.3%
Q1 17' Q1 18' Q2 17' Q2 18' FY 17' LTMQ2 18'
45 63
77 74
258 274
12.5% 13.0% 16.2% 12.8%14.7% 13.8%
Q1 17' Q1 18' Q2 17' Q2 18' FY 17' LTMQ2 18'
EBITDA & EBITDA MARGINREVENUE & GROSS MARGIN
Aquaculture
(PEN Million) (PEN Million)
Shrimp Feed
3
28
Topics
Bolivia´s M&A Transaction [ 1 ]
Corporate Strategy [ 2 ]
Q2 2018 Financial Results [ 3 ]
Guidance 2018 [ 4 ]
Stock Performance [ 5 ]
Appendix [ 6 ]
29
4 Updated Guidance for FY 2018
1 Previous estimate as of May 2018.2 Excludes excess cash3 New guidance includes financial figures of Fino and SAO since acquisition date and
expected year-to-go “figures 2018
4 2018E do not include EBITDA from synergies5 Proforma guidance includes FY financial figures of Fino and SAO
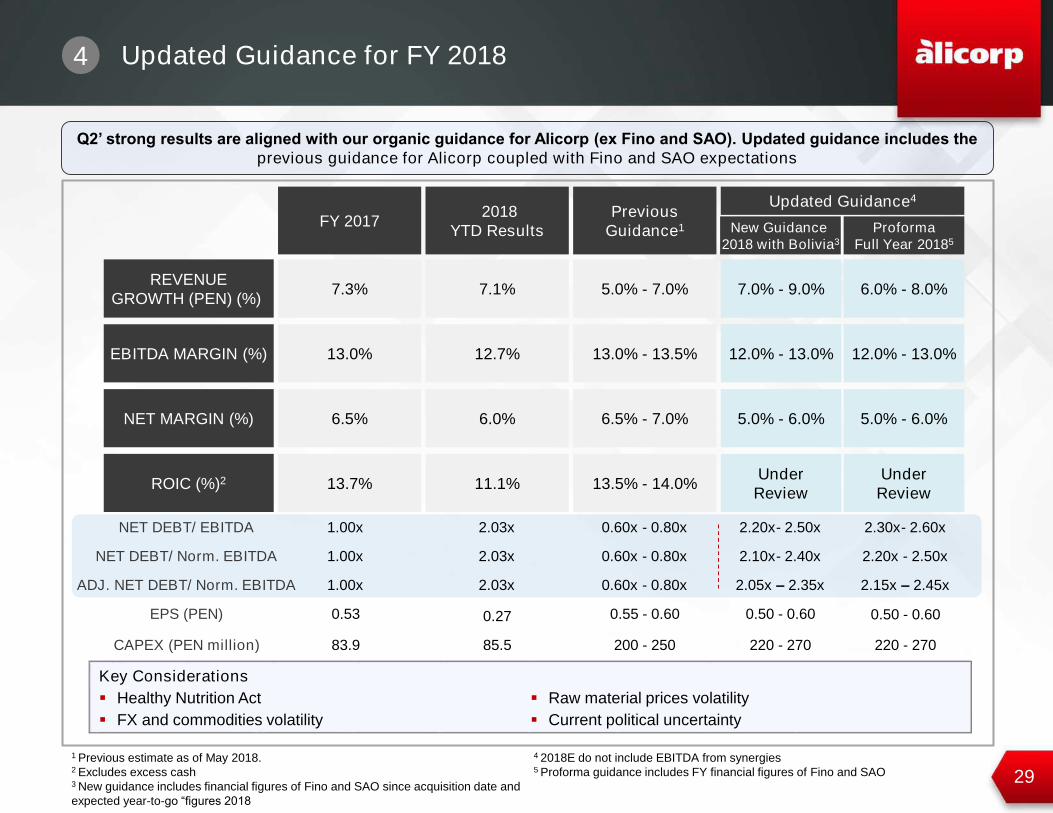
Q2’ strong results are aligned with our organic guidance for Alicorp (ex Fino and SAO). Updated guidance includes the
previous guidance for Alicorp coupled with Fino and SAO expectations
Key Considerations
▪ Healthy Nutrition Act
▪ FX and commodities volatility
▪ Raw material prices volatility
▪ Current political uncertainty
FY 2017
7.3%
13.0%
6.5%NET MARGIN (%)
13.7%ROIC (%)2
REVENUE
GROWTH (PEN) (%)
EBITDA MARGIN (%)
2018
YTD Results
7.1%
12.7%
6.0%
11.1%
Updated Guidance4
7.0% - 9.0%
12.0% - 13.0%
5.0% - 6.0%
Under
Review
Previous
Guidance1
5.0% - 7.0%
13.0% - 13.5%
6.5% - 7.0%
13.5% - 14.0%
New Guidance
2018 with Bolivia3
Proforma
Full Year 20185
6.0% - 8.0%
12.0% - 13.0%
5.0% - 6.0%
Under
Review
CAPEX (PEN million) 83.9 200 - 25085.5 220 - 270 220 - 270
EPS (PEN) 0.53 0.55 - 0.600.27 0.50 - 0.60 0.50 - 0.60
NET DEBT/ EBITDA 1.00x 0.60x - 0.80x2.03x 2.20x- 2.50x 2.30x- 2.60x
NET DEBT/ Norm. EBITDA 1.00x 0.60x - 0.80x2.03x 2.10x- 2.40x 2.20x - 2.50x
ADJ. NET DEBT/ Norm. EBITDA 1.00x 0.60x - 0.80x2.03x 2.05x – 2.35x 2.15x – 2.45x
30
4
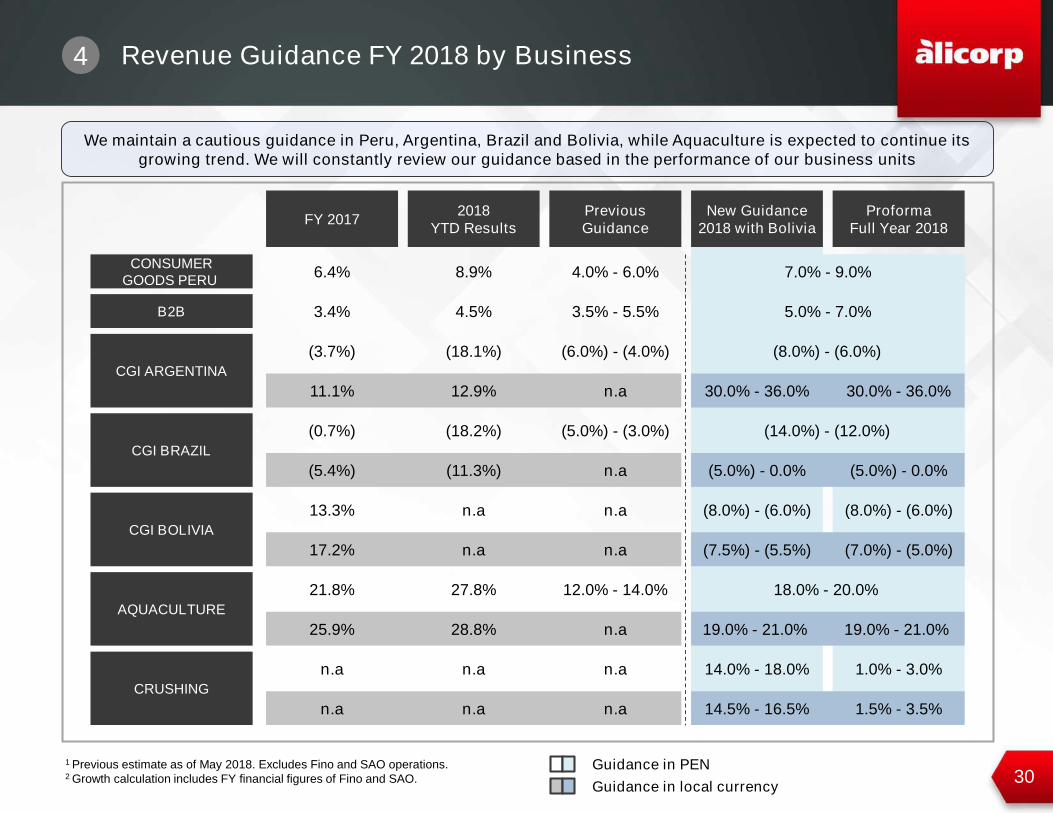
We maintain a cautious guidance in Peru, Argentina, Brazil and Bolivia, while Aquaculture is expected to continue its
growing trend. We will constantly review our guidance based in the performance of our business units
Revenue Guidance FY 2018 by Business
1 Previous estimate as of May 2018. Excludes Fino and SAO operations.2 Growth calculation includes FY financial figures of Fino and SAO.
CONSUMER
GOODS PERU
B2B
CGI ARGENTINA
FY 2017
CGI BRAZIL
CGI BOLIVIA
AQUACULTURE
CRUSHING
2018
YTD Results
Previous
Guidance
New Guidance
2018 with Bolivia
Proforma
Full Year 2018
6.4%
3.4%
(3.7%)
11.1%
(0.7%)
(5.4%)
13.3%
17.2%
21.8%
25.9%
n.a
n.a
8.9%
4.5%
(18.1%)
12.9%
(18.2%)
(11.3%)
n.a
n.a
27.8%
28.8%
n.a
n.a
4.0% - 6.0%
3.5% - 5.5%
(6.0%) - (4.0%)
n.a
(5.0%) - (3.0%)
n.a
n.a
n.a
12.0% - 14.0%
n.a
n.a
n.a
7.0% - 9.0%
5.0% - 7.0%
(8.0%) - (6.0%)
(7.5%) - (5.5%)
18.0% - 20.0%
19.0% - 21.0%
14.0% - 18.0%
(8.0%) - (6.0%)
(7.0%) - (5.0%)
19.0% - 21.0%
1.0% - 3.0%
(8.0%) - (6.0%)
30.0% - 36.0%
(14.0%) - (12.0%)
(5.0%) - 0.0%
30.0% - 36.0%
(5.0%) - 0.0%
1.5% - 3.5%14.5% - 16.5%
Guidance in PEN
Guidance in local currency
31
Topics
Bolivia´s M&A Transaction [ 1 ]
Corporate Strategy [ 2 ]
Q2 2018 Financial Results [ 3 ]
Guidance 2018 [ 4 ]
Stock Performance [ 5 ]
Appendix [ 6 ]
32
0 2 4 6 8 10 12 14
40
60
80
100
120
140
160
Jul-1
7
Aug-1
7
Sep-1
7
Oct-
17
No
v-1
7
De
c-1
7
Jan-1
8
Feb
-18
Ma
r-1
8
Apr-
18
Ma
y-1
8
Jun-1
8
ALICORC1 EPU IGBVL
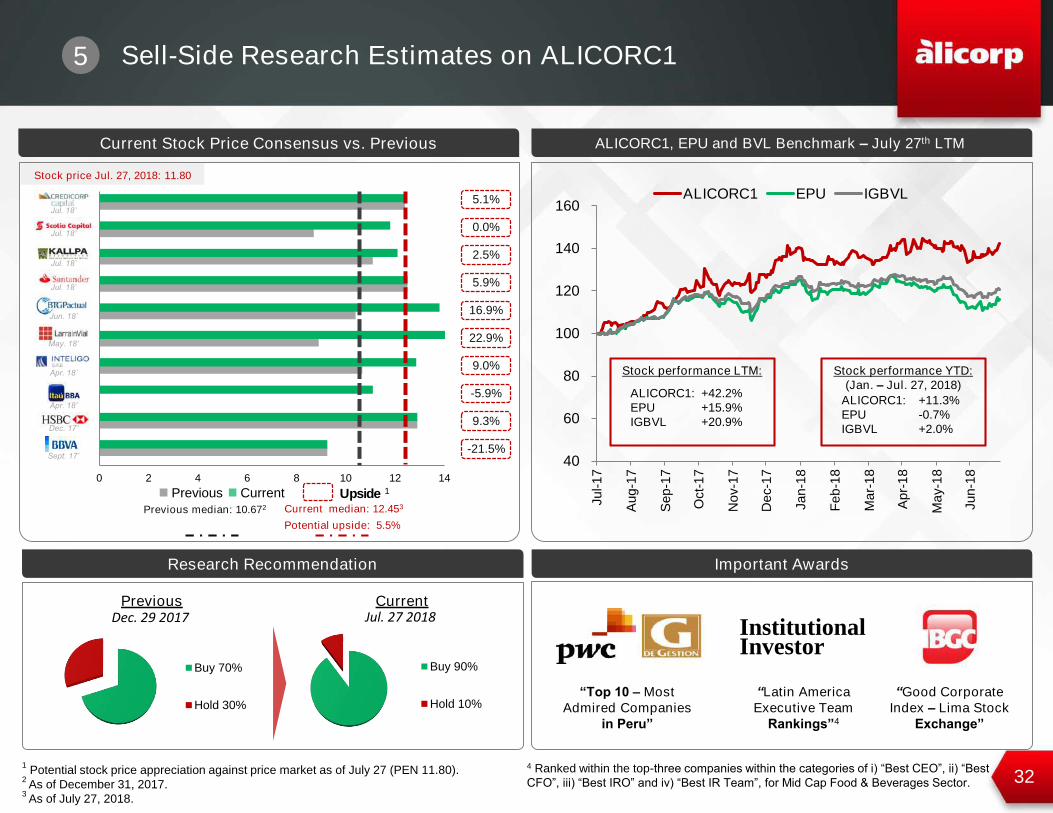
Buy 90%
Hold 10%
Research Recommendation Important Awards
Current Stock Price Consensus vs. Previous ALICORC1, EPU and BVL Benchmark – July 27th LTM
Sell-Side Research Estimates on ALICORC1
“Top 10 – Most
Admired Companies
in Peru”
“Latin America
Executive Team
Rankings”4
Stock price Jul. 27, 2018: 11.80
Previous Current Upside 1
Previous median: 10.672 Current median: 12.453
Potential upside: 5.5%
Stock performance LTM: Stock performance YTD:
(Jan. – Jul. 27, 2018)ALICORC1:
EPU
IGBVL
+42.2%
+15.9%
+20.9%
+11.3%
-0.7%
+2.0%
ALICORC1:
EPU
IGBVL
Buy 70%
Hold 30%
CurrentPreviousDec. 29 2017 Jul. 27 2018
Sept. 17’
Jul. 18’
Apr. 18’
Jul. 18’
Jul. 18’
May. 18’
Dec. 17’
Jun. 18’
Jul. 18’
0.0%
2.5%
5.9%
16.9%
9.3%
22.9%
9.0%
-5.9%
5.1%
-21.5%
Apr. 18’
1Potential stock price appreciation against price market as of July 27 (PEN 11.80).
2 As of December 31, 2017.
3 As of July 27, 2018.
4 Ranked within the top-three companies within the categories of i) “Best CEO”, ii) “Best
CFO”, iii) “Best IRO” and iv) “Best IR Team”, for Mid Cap Food & Beverages Sector.
InstitutionalInvestor
“Good Corporate
Index – Lima Stock
Exchange”
5
33
Topics
Bolivia´s M&A Transaction [ 1 ]
Corporate Strategy [ 2 ]
Q2 2018 Financial Results [ 3 ]
Guidance 2018 [ 4 ]
Stock Performance [ 5 ]
Appendix [ 6 ]
About Alicorp
35
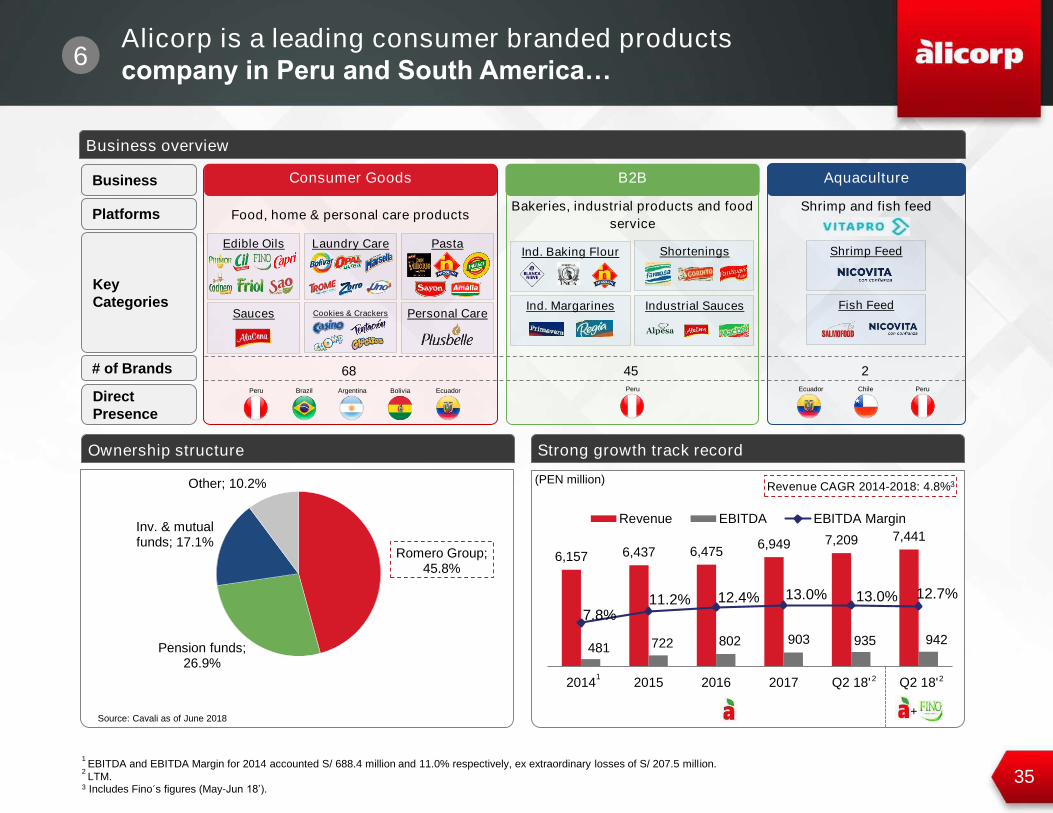
6,157 6,437 6,475 6,949 7,209 7,441
481 722 802 903 935 942
7.8% 11.2% 12.4% 13.0% 13.0% 12.7%
2014 2015 2016 2017 Q2 18' Q2 18'
Revenue EBITDA EBITDA Margin
Ownership structure
Business overview
Strong growth track record
(PEN million)
1 EBITDA and EBITDA Margin for 2014 accounted S/ 688.4 million and 11.0% respectively, ex extraordinary losses of S/ 207.5 million.
2 LTM.
3 Includes Fino´s figures (May-Jun 18’).
Source: Cavali as of June 2018
Revenue CAGR 2014-2018: 4.8%3
6Alicorp is a leading consumer branded products
company in Peru and South America…
1
Consumer Goods
Food, home & personal care products
Peru Brazil Argentina Ecuador
Edible Oils
Sauces
Laundry Care
Cookies & Crackers
Pasta
Personal Care
68
Fish Feed
Aquaculture
Shrimp and fish feed
Shrimp Feed
Ecuador PeruChile
2
B2B
Bakeries, industrial products and food
service
Peru
Industrial Sauces
Ind. Baking Flour
Ind. Margarines
Shortenings
45
Business
Platforms
Key
Categories
# of Brands
Direct
Presence
22
+
Bolivia
Romero Group; 45.8%
Pension funds; 26.9%
Inv. & mutual funds; 17.1%
Other; 10.2%
36
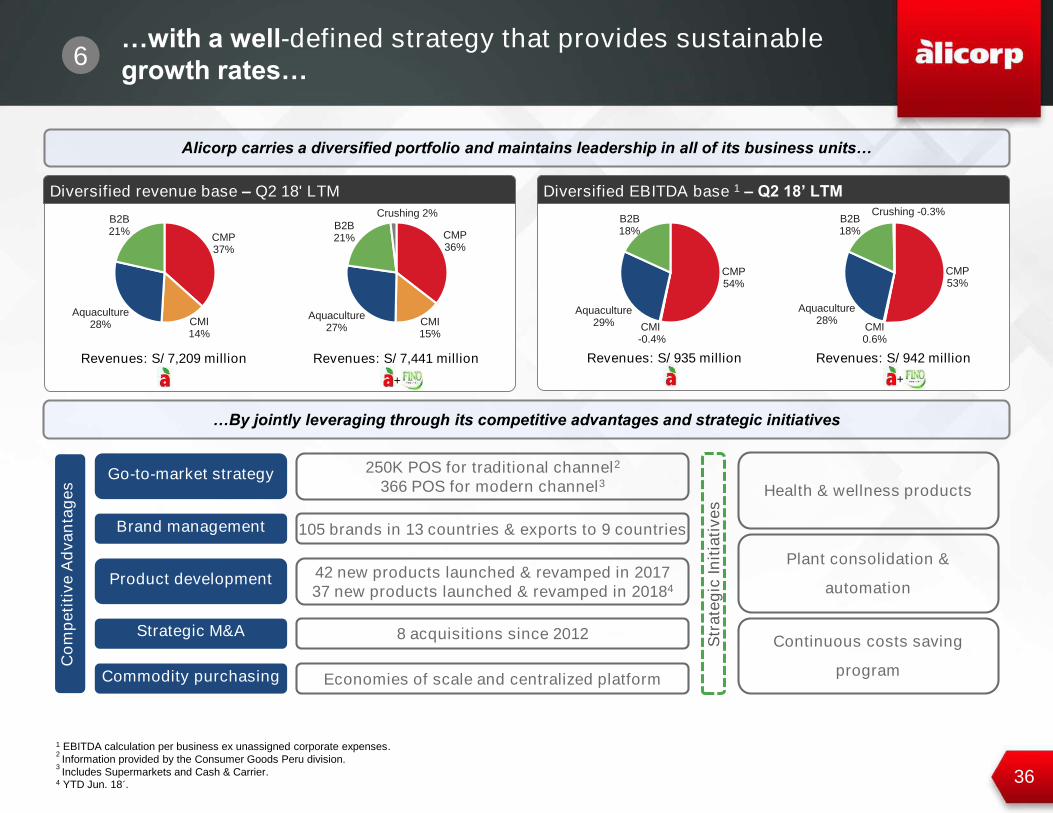
…By jointly leveraging through its competitive advantages and strategic initiatives
Diversified revenue base – Q2 18' LTM Diversified EBITDA base 1 – Q2 18’ LTM
Alicorp carries a diversified portfolio and maintains leadership in all of its business units…
1 EBITDA calculation per business ex unassigned corporate expenses.2 Information provided by the Consumer Goods Peru division.
3 Includes Supermarkets and Cash & Carrier.
4 YTD Jun. 18´.
6…with a well-defined strategy that provides sustainable
growth rates…
Commodity purchasing
Go-to-market strategy
Brand management
Strategic M&A
Product development
105 brands in 13 countries & exports to 9 countries
42 new products launched & revamped in 2017
37 new products launched & revamped in 20184
Economies of scale and centralized platform
250K POS for traditional channel2
366 POS for modern channel3
8 acquisitions since 2012
Health & wellness products
Plant consolidation &
automation
Continuous costs saving
program
Co
mp
eti
tive
Ad
va
nta
ge
s
Str
ate
gic
In
itia
tive
s
CMP36%
CMI 15%
Aquaculture27%
B2B21%
Crushing 2%
CMP37%
CMI 14%
Aquaculture28%
B2B21%
CMP53%
CMI 0.6%
Aquaculture28%
B2B18%
Crushing -0.3%
CMP54%
CMI-0.4%
Aquaculture29%
B2B18%
+
Revenues: S/ 7,209 million Revenues: S/ 7,441 million
+
Revenues: S/ 935 million Revenues: S/ 942 million
37
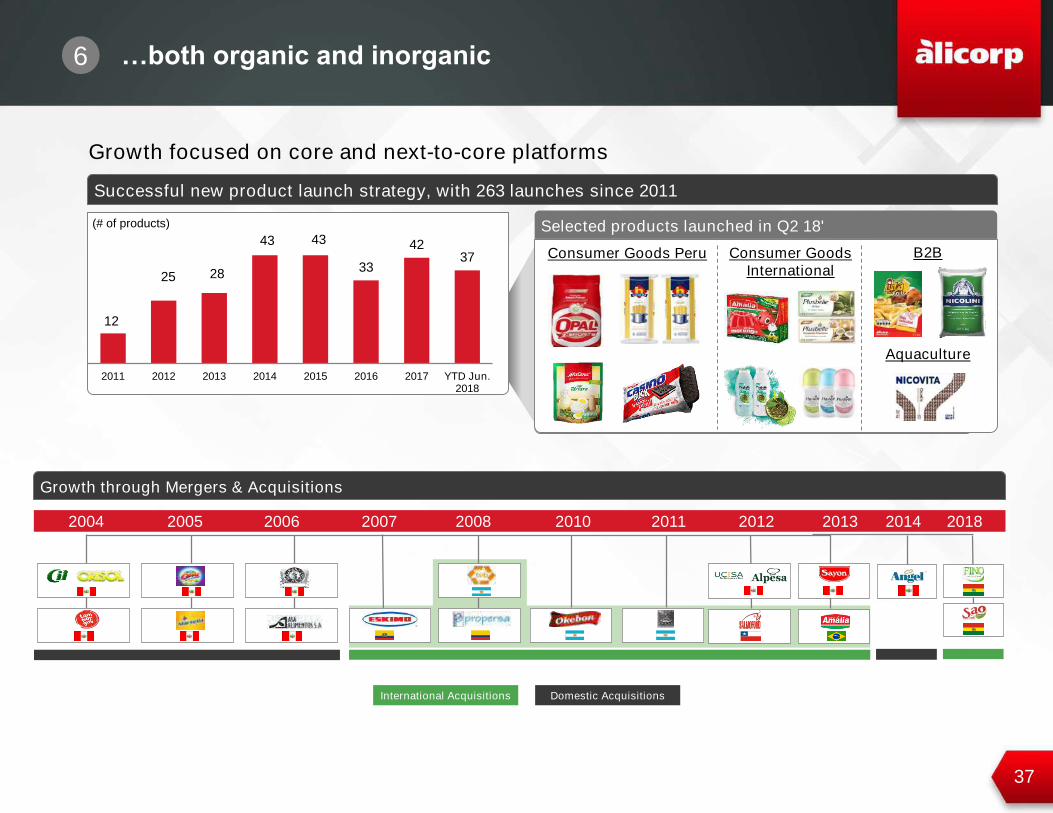
12
25 28
43 43
33
4237
2011 2012 2013 2014 2015 2016 2017 YTD Jun.2018
Selected products launched in Q2 18'
Successful new product launch strategy, with 263 launches since 2011
Growth focused on core and next-to-core platforms
(# of products)
Growth through Mergers & Acquisitions
20122004 2005 2006 2007 2008 2010 2011 2013 2014
Consumer Goods Peru Consumer Goods
International
Aquaculture
6 …both organic and inorganic
B2B
2018
International Acquisitions Domestic Acquisitions
38
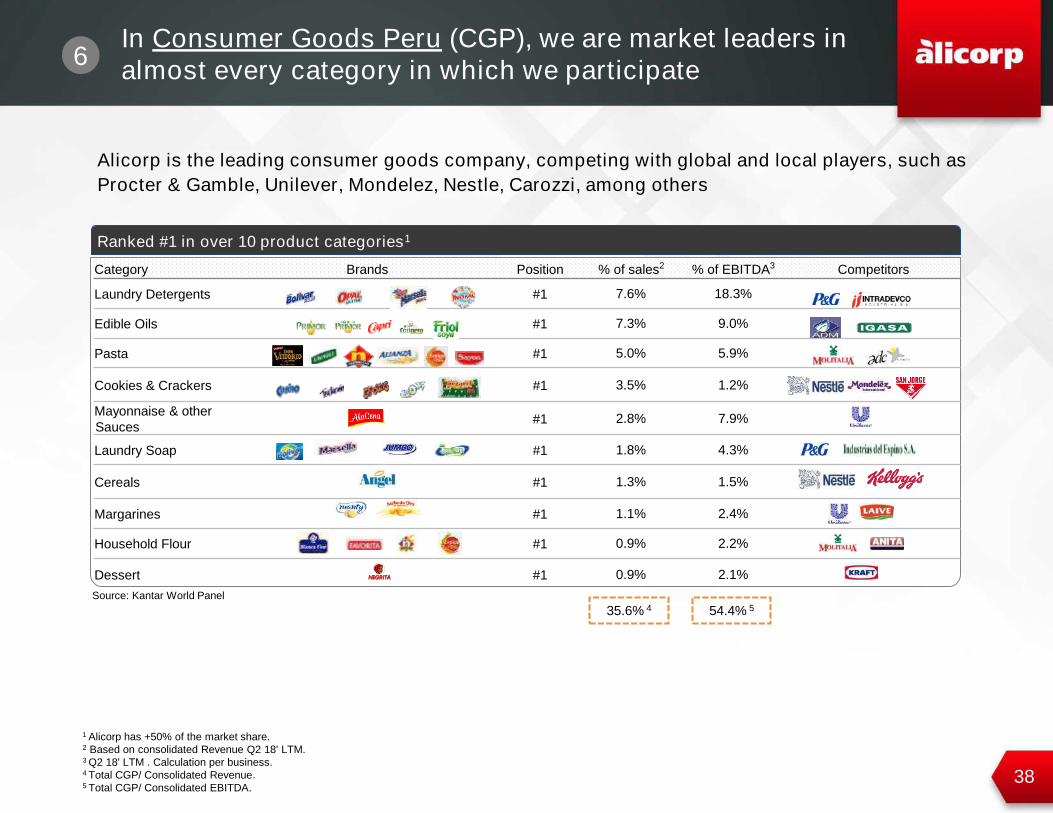
Category Brands Position % of sales2 % of EBITDA3 Competitors
Laundry Detergents #1 7.6% 18.3%
Edible Oils #1 7.3% 9.0%
Pasta #1 5.0% 5.9%
Cookies & Crackers #1 3.5% 1.2%
Mayonnaise & other
Sauces#1 2.8% 7.9%
Laundry Soap #1 1.8% 4.3%
Cereals #1 1.3% 1.5%
Margarines #1 1.1% 2.4%
Household Flour #1 0.9% 2.2%
Dessert #1 0.9% 2.1%
Alicorp is the leading consumer goods company, competing with global and local players, such as
Procter & Gamble, Unilever, Mondelez, Nestle, Carozzi, among others
Ranked #1 in over 10 product categories1
1 Alicorp has +50% of the market share.2 Based on consolidated Revenue Q2 18' LTM. 3 Q2 18' LTM . Calculation per business.4 Total CGP/ Consolidated Revenue.5 Total CGP/ Consolidated EBITDA.
35.6% 4 54.4% 5
6In Consumer Goods Peru (CGP), we are market leaders in
almost every category in which we participate
Source: Kantar World Panel
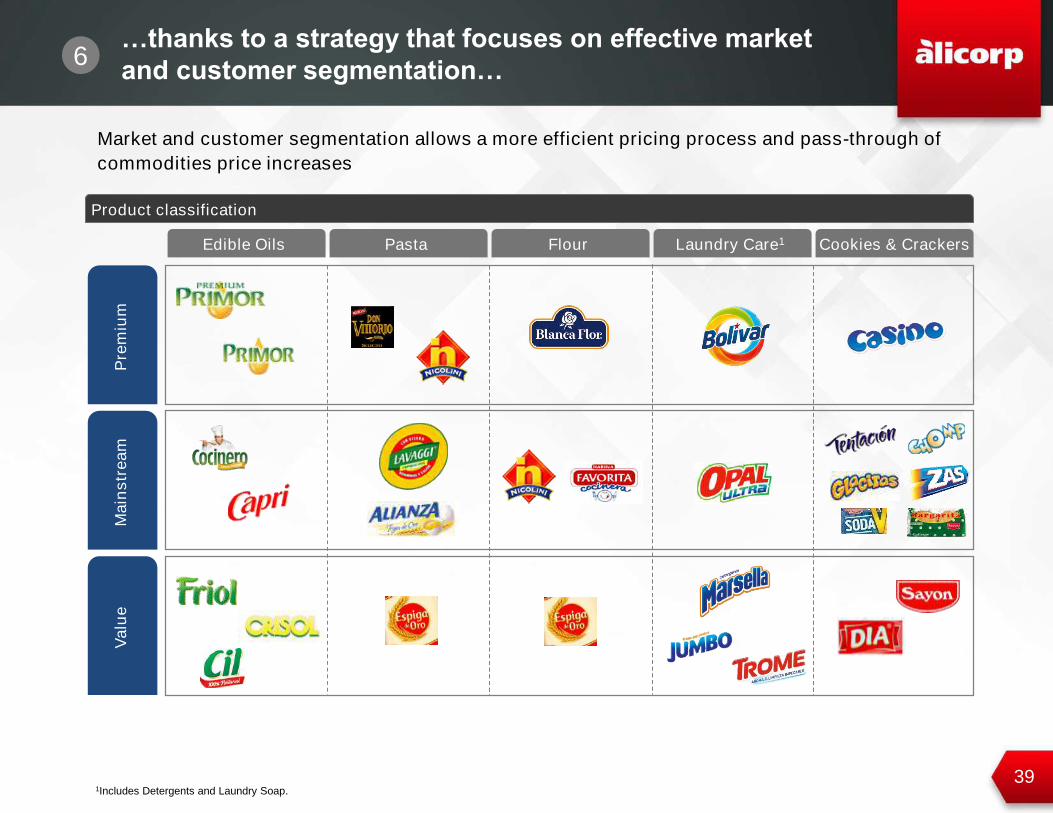
391Includes Detergents and Laundry Soap.
Pre
miu
mM
ain
str
ea
mV
alu
e
Market and customer segmentation allows a more efficient pricing process and pass-through of
commodities price increases
Product classification
Edible Oils Pasta Laundry Care1 Cookies & CrackersFlour
6…thanks to a strategy that focuses on effective market
and customer segmentation…
40
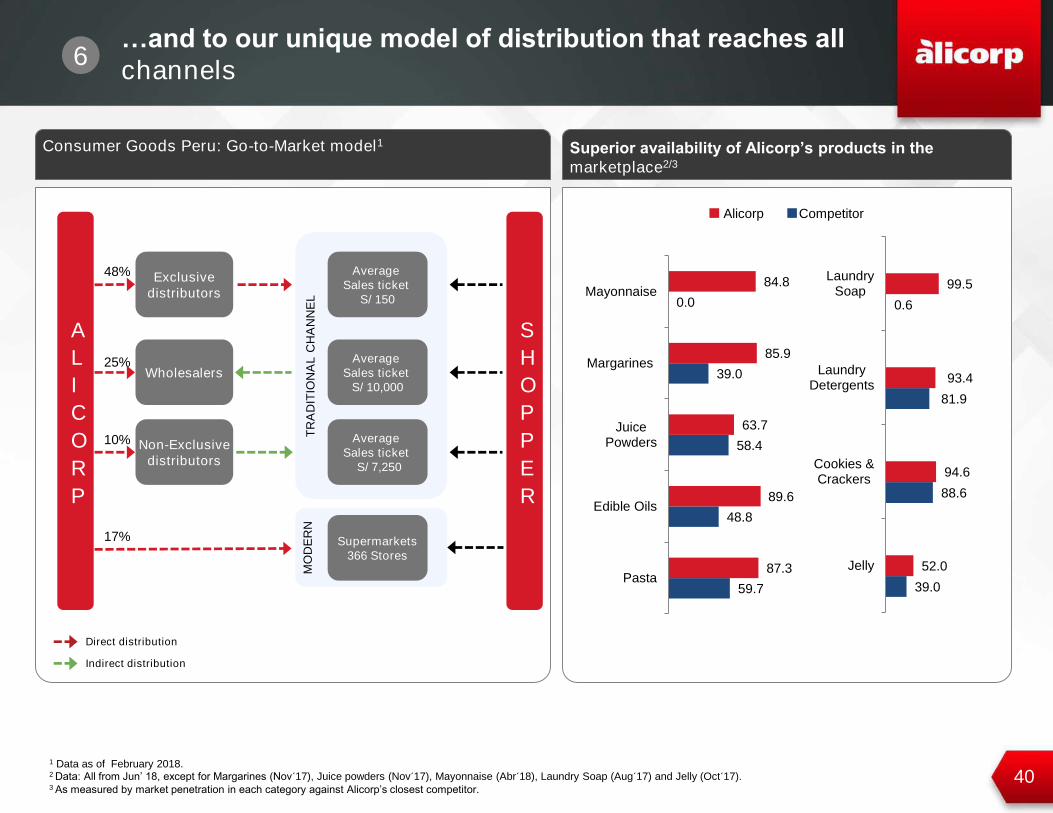
Consumer Goods Peru: Go-to-Market model1
1 Data as of February 2018.2 Data: All from Jun’ 18, except for Margarines (Nov´17), Juice powders (Nov´17), Mayonnaise (Abr´18), Laundry Soap (Aug´17) and Jelly (Oct´17).3 As measured by market penetration in each category against Alicorp’s closest competitor.
TR
AD
ITIO
NA
L C
HA
NN
EL
A
L
I
C
O
R
P
Average
Sales ticket
S/ 7,250
Average
Sales ticket
S/ 10,000
Non-Exclusive
distributors
Wholesalers
Direct distribution
Indirect distribution
S
H
O
P
P
E
R
25%
10%
17%
MO
DE
RN
Supermarkets
366 Stores
Average
Sales ticket
S/ 150
Exclusive
distributors
48%
Superior availability of Alicorp’s products in the
marketplace2/3
6…and to our unique model of distribution that reaches all
channels
Alicorp Competitor
59.7
48.8
58.4
39.0
0.0
87.3
89.6
63.7
85.9
84.8
Pasta
Edible Oils
JuicePowders
Margarines
Mayonnaise
39.0
88.6
81.9
0.6
52.0
94.6
93.4
99.5
Jelly
Cookies &Crackers
LaundryDetergents
LaundrySoap
41
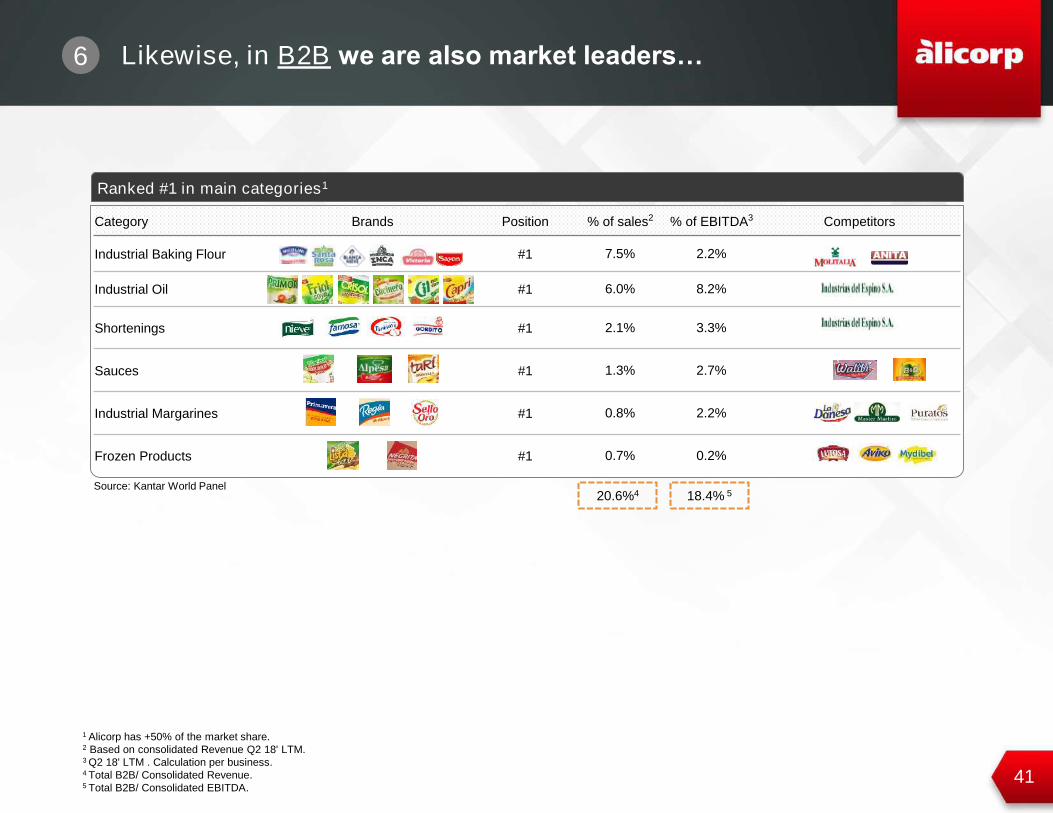
Category Brands Position % of sales2 % of EBITDA3 Competitors
Industrial Baking Flour #1 7.5% 2.2%
Industrial Oil #1 6.0% 8.2%
Shortenings #1 2.1% 3.3%
Sauces #1 1.3% 2.7%
Industrial Margarines #1 0.8% 2.2%
Frozen Products #1 0.7% 0.2%
Ranked #1 in main categories1
20.6%4 18.4% 5Source: Kantar World Panel
6 Likewise, in B2B we are also market leaders…
ACTUALIZADO
1 Alicorp has +50% of the market share.2 Based on consolidated Revenue Q2 18' LTM. 3 Q2 18' LTM . Calculation per business.4 Total B2B/ Consolidated Revenue.5 Total B2B/ Consolidated EBITDA.
42
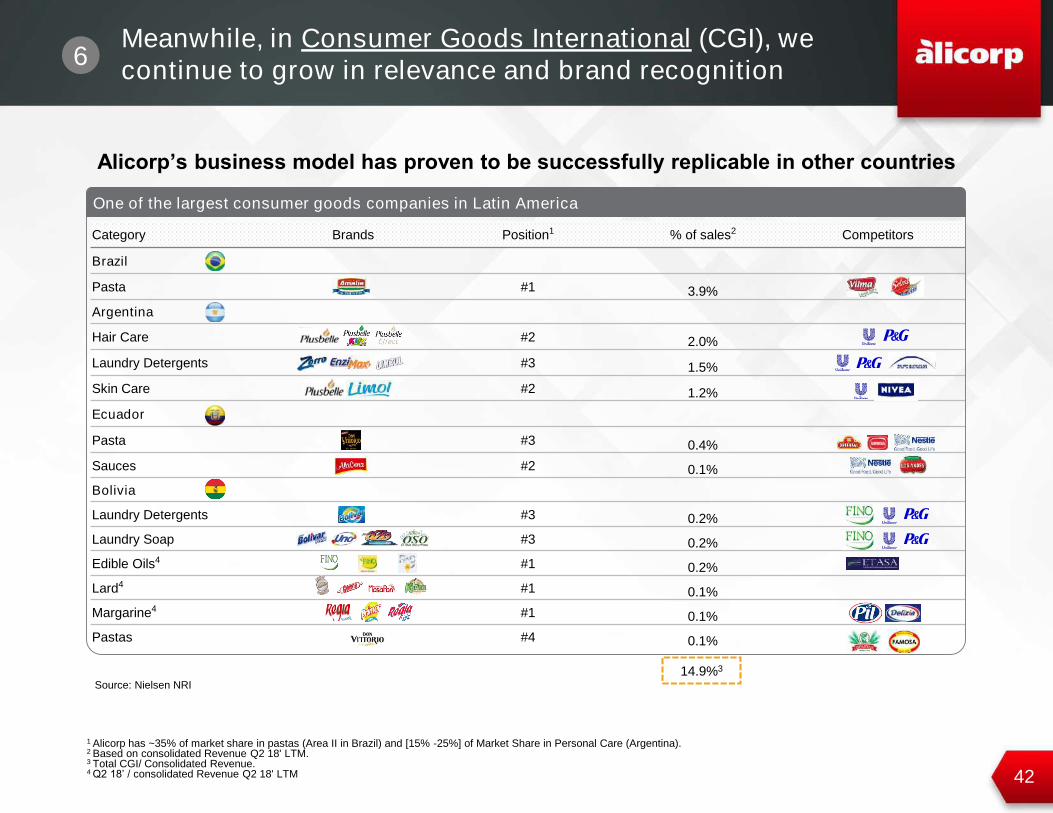
Category Brands Position1 % of sales2 Competitors
Brazil
Pasta #1 3.9%
Argentina
Hair Care #2 2.0%
Laundry Detergents #3 1.5%
Skin Care #2 1.2%
Ecuador
Pasta #3 0.4%
Sauces #2 0.1%
Bolivia
Laundry Detergents #3 0.2%
Laundry Soap #3 0.2%
Edible Oils4 #1 0.2%
Lard4 #1 0.1%
Margarine4 #1 0.1%
Pastas #4 0.1%
6Meanwhile, in Consumer Goods International (CGI), we
continue to grow in relevance and brand recognition
Alicorp’s business model has proven to be successfully replicable in other countries
1 Alicorp has ~35% of market share in pastas (Area II in Brazil) and [15% -25%] of Market Share in Personal Care (Argentina). 2 Based on consolidated Revenue Q2 18' LTM.3 Total CGI/ Consolidated Revenue.4 Q2 18’ / consolidated Revenue Q2 18' LTM
ACTUALIZADO
One of the largest consumer goods companies in Latin America
14.9%3
Source: Nielsen NRI
43
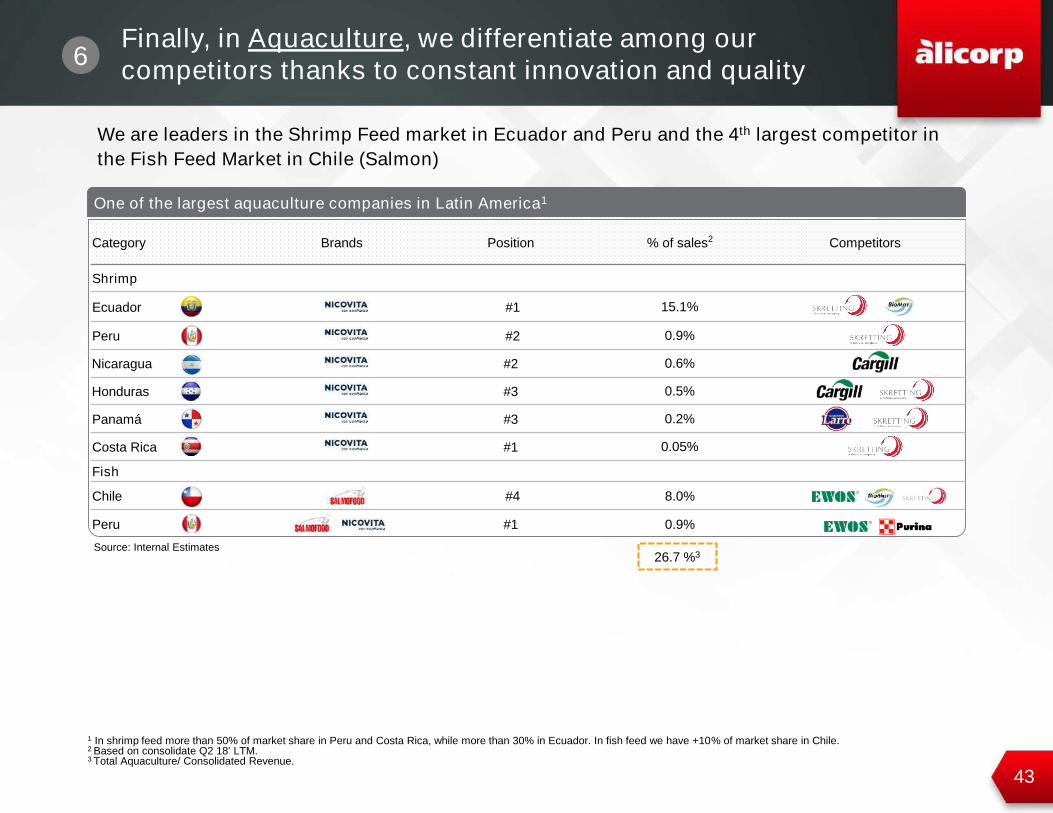
6Finally, in Aquaculture, we differentiate among our
competitors thanks to constant innovation and quality
Category Brands Position % of sales2 Competitors
Shrimp
Ecuador #1 15.1%
Peru #2 0.9%
Nicaragua #2 0.6%
Honduras #3 0.5%
Panamá #3 0.2%
Costa Rica #1 0.05%
Fish
Chile #4 8.0%
Peru #1 0.9%
One of the largest aquaculture companies in Latin America1
1 In shrimp feed more than 50% of market share in Peru and Costa Rica, while more than 30% in Ecuador. In fish feed we have +10% of market share in Chile.2 Based on consolidate Q2 18' LTM. 3 Total Aquaculture/ Consolidated Revenue.
Source: Internal Estimates
We are leaders in the Shrimp Feed market in Ecuador and Peru and the 4th largest competitor in
the Fish Feed Market in Chile (Salmon)
26.7 %3