Embed Size (px)
Citation preview

1
Corporate Purpose and Firm Ownership
Claudine Gartenberg1 University of Pennsylvania
George Serafeim Harvard Business School
June 1, 2019
Analyzing data from approximately 1.5 million employees across 1,100 established public and private US companies, we find that the strength of employee beliefs about their firm’s purpose is lower in public companies. This difference is most pronounced within the salaried middle and hourly ranks, rather than senior executives. Among public companies, purpose becomes progressively lower with more concentrated shareholders, especially among firms with high hedge fund ownership. These patterns can be partly explained by differences in CEO backgrounds and compensation: public firms, particularly those with strong shareholders, choose outsider CEOs at higher rates and pay them more relative to their employees. Our analyses suggest that these results are not driven solely by sorting effects, but appear attributable in part to the impact that firm owners have on their employees. In summary, shareholders appear to influence the strength of corporate purpose deep within organizations via the leadership and corporate practices they enable at the top.
Keywords: Corporate Purpose, Ownership, Leadership, Executive Compensation
1 Corresponding author: Claudine Gartenberg is an Assistant Professor of Management at the Wharton School, University of Pennsylvania, 3620 Locust Walk, SHDH 2035, Wharton School, Philadelphia PA 19104; email: [email protected]. George Serafeim is a Professor of Business Administration at Harvard Business School; 381 Morgan Hall, Harvard Business School, Boston, MA 02163; email: [email protected]. We would like to thank David Frieberg for excellent research assistance, and the Great Place to Work Institute, and particularly Amy Lyman, Ed Frauenheim and Marcus Erb for their support. This paper has benefitted from comments by participants at the Wharton Org Theory workshop, Strategy Research Forum, Strategy Science Conference, Academy of Management Strategy Division Executive Committee annual meeting, Oxford University, University of Rome, and Harvard Business School. We are solely responsible for any errors.

2
Introduction What drives differences in corporate purpose across firms? Purpose has drawn increasing attention
from policy makers, practitioners, and academics as an important foundation for strategy,
employee motivator, and means to articulate an organization’s broader social role (Chapman,
Edmans, Gosling, Hutton, and Mayer, 2017; Hollensbe et al. 2014; Oxford University and Ernst
and Young 2016; Bartlett and Ghoshal, 1994). Despite this growing attention, measurement
challenges have constrained empirical research, and it is only recently that the data to implement
large sample studies on purpose has become available. One recent study by Gartenberg, Prat and
Serafeim (2019) finds that firms with a strong sense of purpose – particularly among their middle-
ranked employees – experience better performance. Yet we know little about why certain firms
might be more or less effective in establishing a credible sense of purpose.2
To this end, we explore the link between corporate purpose and firm ownership. A firm’s
owners are the ultimate arbiters of the organization. Owners influence who is placed in
management positions and where they focus their attention. Owners affect a firm’s investment,
financing and governance choices (Trostel and Nichols 1982; Capron and Shen 2007; Asker,
Farre-Mensa and Ljungqvist 2014; Gilje and Taillard 2016), as well as its innovative direction
(Feldman, Kawano, Patel, Rao, Stevens and Edgerton, 2018; Bernstein 2015). As such, owners
have broad power to affect core aspects of the organization.
Moreover, the role of owners has important contemporary relevance. In recent years, much
attention has been placed on the ‘eclipse’ of the public corporation, as the number of public
companies has declined, and companies remain private for longer (Kahle and Stulz 2017; Doidge
2 We use the term “purpose” throughout this study. “Purpose” generally refers to the content of beliefs. In this study, however, we are interested in the strength of the beliefs, or “purposefulness,” and not the actual beliefs themselves. Similarly, when we refer to “meaning” within the workplace, we generally are interested in “meaningfulness,” or the strength, rather than the content, of meaning. For readability, we shorten “purposefulness” and “meaningfulness” to “purpose” and “meaning”, respectively.

3
et al. 2018). While much discussion has focused on the drivers of this decline, little attention has
been paid to what this phenomenon might mean for how these companies are managed. With this
paper, we seek to provide evidence on the management implications of this important recent
development.
Corporate purpose is an intrinsically imprecise concept that poses a challenge both to
define and measure. We define corporate purpose broadly as “a concrete goal or objective for the
firm that reaches beyond profit maximization,” the definition of purpose proposed by Henderson
and Van den Steen (2015). This definition is not explicitly pro-social, although corporate purpose
often is. Instead, it focusses on the broader contribution of the organization’s work beyond what
is captured in profit measures alone and is consistent with other common definitions of purpose
(e.g., Chapman et al., 2017).
We measure corporate purpose using the approach established by Gartenberg, Prat and
Serafeim (2019), by aggregating actual employee beliefs in the meaning and impact of their work,
rather than via announced corporate purpose statements that have been shown to be
inconsequential “cheap talk” (Guiso, Sapienza, and Zingales, 2015). The reasoning behind this
approach is as follows: as corporate purpose is implemented effectively, then the employees of the
organization should, collectively, believe that their work has greater meaning and impact. As such,
we infer the effectiveness corporate purpose of the entity via the strength of measured employee
beliefs.
Our evidence comes from a proprietary survey from the Great Place To Work Institute
(GPTW). This survey, to our knowledge, represents one of the largest data sources on the topic
available to researchers. This survey includes employees within more than a thousand
organizations between 2006 and 2016. These employees span the organizational hierarchy from

4
hourly workers up to executives. Respondents evaluate their workplaces along a series of
organizational dimensions, including workplace collegiality, management, and the nature of the
job itself. Critically, these responses allow us to circumvent corporate cheap talk and measure
actual employee beliefs. It also allows us to separate beliefs in purpose from general job
satisfaction.
Following Gartenberg, Prat and Serafeim (2019), we combine beliefs about the meaning
of work (“My work has special meaning: this is not just a job”; “I feel good about the ways we
contribute to the community”; “When I look at what we accomplish, I feel a sense of pride”; and
“I'm proud to tell others I work here.”) and clarity from management (e.g., “Management makes
its expectations clear”; “Management has a clear view of where the organization is going and
how to get there”) in our measure of corporate purpose. They find that these beliefs tend to co-
move among employees, and only together predict greater company performance. In supplemental
analyses, we corroborate our results using alternative measures of purpose. We obtain measures
of purpose for 1,509,797 employees across 1,108 firms. We aggregate this measure up to the firm-
year level to obtain corporate purpose.
We begin by reporting how corporate purpose differs across four types of firm owners:
public, and three types of private firms: private-equity owned, private subsidiaries of public firms,
and private (non-private equity). This first analysis yields four notable patterns. First, employees
of public firms have a lower sense of purpose than those of private firms. This difference is
significant, translating to more than a quarter standard deviation difference in purpose within the
sample as a whole. Second, the difference in purpose is driven by employees below the top of the
organization—the middle ranked salaried and hourly workers—rather than those at the senior
manager and executive ranks. This difference permits an interpretation of our results as “purpose

5
inequality”, the gap in purpose help by the top ranks and their subordinates. Third, the difference
in purpose (and purpose inequality) is more pronounced for public firms with large, concentrated
blocks of shareholders. In other words, firms with greater shareholder power have employees with
weaker purpose.
We then explore factors that can account for these patterns among public and private firms.
These factors include the background and compensation of the CEO and strategic actions taken by
management that differ across types. Among public firms, those with strong shareholder power
choose more outsider CEOs and pay them more relative to employees. We find that these factors
account for 30% of the difference in corporate purpose between public and private firms. Public
firms also differ in their strategic choices (e.g., mergers, layoffs, and divestitures), as well as
incentives and benefits, which we find collectively to explain an additional 10% of the difference
relative to private firms.
Given we lack a natural experiment, we are cautious about making causal claims regarding
the effect of ownership on corporate purpose. Specifically, we cannot definitively separate the
interpretation that weaker purpose reflects the match between owners and firms from the
interpretation that owners influence the levels of corporate purpose directly. However, we perform
lead-lag analyses and inverse probability weighting matching to test these alternative
interpretations. While we believe both these alternatives are at play in this setting, our results are
aligned more with an interpretation that owners influence the levels of corporate purpose through
their choices.
This study makes several contributions. First, we add to a growing stream of work on the
role of corporate purpose within firms (Chapman et al., 2017; Thakor and Quinn, 2013, Henderson
and Van den Steen, 2015). In doing so, we respond to a call from Hollensbee et al., (2014) for
6
empirical work on the topic. We also contribute to a recent resurgence of interest in the role of
firms in society (Hart and Zingales, 2017). This study is also part of a larger push within corporate
strategy to explore additional complex effects of firm boundaries (Ahuja and Novelli, 2017). Some
emphasize that boundaries have social effects as influencing social comparison groups (Nickerson
and Zenger, 2008) or as carriers of identity (Santos and Eisenhardt, 2005). Our study supports the
idea that firms are also carriers of purpose, and that that this purpose can be predicted, in part, by
ownership structure. This study also fits into work on corporate ownership that shows differences
between public and private firms (Capron and Shen 2007; Asker, Farre-Mensa and Ljungqvist
2014; Gilje and Taillard 2016; Bernstein 2015). Interestingly much of the research in this last area
has occurred outside management. Our work suggests that ownership drives more than financial
decisions and calls for further research focused on the implications of ownership for management.
Corporate Purpose
What Is Corporate Purpose?
Corporate purpose is an often-referenced idea within the business community, with public
discourse increasing five-fold between 1994 and 2016 (Oxford University and Ernst and Young
2016). Satya Nadella, Microsoft CEO who returned the company to its position as the world’s
most valuable technology company, attributed the turnaround to a renewed focus on purpose:
“I wanted to go back to the very genesis of this company: what is that sense of purpose
and drive that made us successful?... In ’92, we used to talk even about our mission
– for example as having a PC in every home and desk. Except by the end of the decade
itself, we had more or less achieved it. Then what? What’s next. And that’s when I

7
felt like we may have confused marketing slogans for our mission. So that’s why I
wanted to get back to that sense of purpose.”
Nadella characterize the importance of purpose as follows:
“The sense of purpose in mission and culture to me are the two pillars…for any
institution…So when we talk about our mission of empowering every person and
every organization on the planet to achieve more, [it] can't be just a set of words. It
has to in some sense capture the very essence of who we are in all of the decisions
we make, in the products we create and how we show up with our customers.”3
These statements reveal that purpose is a meaning-rich articulation of the role of the firm,
an articulation that must be believed and followed throughout the organization, rather than merely
exist within the top ranks of an organization. Given its inherent intangibility, purpose eludes a
settled definition for academic purposes. Purpose has often been defined with a social orientation.
Bartlett and Ghoshal (1994) define purpose as “the statement of a company’s moral response to its
broadly defined responsibilities, not an amoral plan for exploiting commercial opportunity.”
Thakor and Quinn (2013) similarly define it as “something that is perceived as producing a social
benefit over and above the tangible pecuniary payoff that is shared by the principal and the agent.”
The definition of purpose, however, need not include an explicit social orientation. Oxford
Dictionaries define purpose as “the reason for which something is done or created or for which
something exists.”4 We use the definition of Gartenberg, Prat and Serafeim (2019) that corporate
purpose is “a set of beliefs about the meaning of a firm’s work beyond quantitative measures of
financial performance.” This definition is similar to the one used in the Purposeful Company
3 https://www.cnet.com/news/microsofts-ceo-on-helping-a-faded-legend-find-a-sense-of-purpose/ https://www.inc.com/justin-bariso/in-1-short-sentence-satya-nadella-summed-up-what-makes-microsoft-different-from-apple-amazon.html 4 http://www.oxforddictionaries.com/us/definition/american_english/purpose, accessed 3/15/16.

8
Report—written by a consortium of academics studying purpose in businesses—as a company’s
“reason for being,”5 as well as Henderson and Van den Steen (2015)’s definition of “a concrete
goal or objective for the firm that reaches beyond profit maximization.”
How Might Purpose be Related to Firm Ownership?
Motivation
The structure of corporate ownership has been a topic of inquiry for decades. Starting with Berle
and Means (1932), literature asked the question what the separation of ownership and control, as
a result of the rise of the public corporation, might mean for the future of the corporation. More
recently, many business leaders argue that corporate ownership has important implications for how
they run their business and some express strong preferences for specific structures. For example,
Jack Ma, founder of Alibaba, famously said that “If I had another life, I would keep my company
private.”
Many CEOs of public companies suggest that their job becomes very different after going
public. For example, the CEO of Zulily, said that "I don't know that I had a full appreciation for
how much time I would spend on external communication. That requires a lot of discipline and
patience, when many founders would rather be focused on growing the business.” Michael Dell,
who took his namesake company private after 25 years on the public markets, says dealing with
investor relations took up 20 percent of his time as well.
Of course, not all private owners are the same. Some CEOs argue that private equity owners
can be even more complicated to manage than public investors. Jon Oringer, who founded photo
5 The Purposeful Company Interim Report, May 2016. http://www.biginnovationcentre.com/media/uploads/pdf/The%20Purposeful%20Company%20Interim%20Report.pdf, accessed 6/26/16.

9
database Shutterstock in 2003 and took it public nearly a decade later, argues that "If you are a
private company, especially if you have done multiple funding rounds, you have investors who
have been in your business different amounts of time and have different rights." That can get
complicated quickly, he says, whereas "being public, anyone can get in and out of the stock at any
time. That lets us focus on where we think the business should go."
Anecdotal evidence suggests that in public companies stock price fluctuations affect not
only investors but also employees. Market fluctuations could affect their perceptions of both own
net worth and how they are doing at work. On the day of Zulily's IPO, CEO Cavens sent a note to
his staff warning them not to let the stock price drive their emotional engagement. "When the stock
price goes up any given day, we are just not that much smarter," he wrote. "And similarly, when
it goes down any given day, we are not that much dumber." The message, which Cavens reiterated
every quarter, worked at first, but in months, when the stock sharply declined, the company
struggled with internal employee reassurance and external recruiting.
Some business leaders argue that the ownership structure is fundamentally linked to the
purpose of the corporation. For example, MailChimp co-founder Chestnut said that "I build things
and get to watch customers buy and use them--that's tremendously satisfying. Sometimes I see
companies build things I know are for investors--and what is the investor's purpose? Just to
increase wealth. That doesn't align with my mission." For him, even just considering investors
ahead of customers goes against the whole reason he started a business. As a result, MailChimp
has stayed private for 14 years. Ken Grossman, the founder of the craft brewer Sierra Nevada, tells
a similar story. He wrestled with the possibility of going public in the '90s, when many other fast-
growing independent brewers were doing so. "I felt that the fiduciary responsibilities to look out
for shareholders would constrain some of the things I wanted to do that might not provide the

10
greatest short-term gain, like doubling down on quality equipment or investing in green energy,”
he says. "The irony is that if I leveraged the company and went public, it would be easier to get
the resources I needed, but then I would have had different masters with different requirements."6
Similarly, at least since Mitt Romney, a founder of Bain Capital, ran for president in 2012,
there has been a recurring debate regarding the impact of private equity firms on their portfolio
firms. When KKR and Bain Capital purchased Toys “R” Us in 2005, one store manager noted, “it
changed the dynamic of how the store ran.” By 2007, 97 percent of the company’s operating profit
was earmarked to interest expense. The store manager noted, “They kept cutting payroll and
cutting payroll, expecting one person to do the job of two people.” When the company announced
its liquidation in 2017, it attributed its demise to competition from Amazon and Walmart. Others
noted, however, that its debt burden prevented it from investing in stores and employees. “Had
[Toys “R” Us and other bankrupt PE-owned retailers] remained publicly owned, they would have
had a much higher probability of being able to adapt, to invest, and to withstand” the challenging
retail conditions.7 Others dispute this characterization, noting that private ownership increase the
focus of firms and hence their quality.8
Evidence in the literature
As the discussion above suggests, purpose might be related to firm ownership for one of two
reasons. First, owners with different goals may choose different types of firms. Second, different
corporate ownership structures may change the way firms run and operate in ways that affect their
6 https://www.inc.com/magazine/201510/tom-foster/do-you-really-want-to-go-public.html, accessed January 7, 2019. 7 https://www.theatlantic.com/magazine/archive/2018/07/toys-r-us-bankruptcy-private-equity/561758/ , accessed January 7, 2019. https://www.fastcompany.com/90227917/toys-r-us-private-equity-and-stagnant-salaries , accessed January 7, 2019. 8 https://www.economist.com/briefing/2016/10/22/the-barbarian-establishment , accessed January 7, 2019.
11
purpose. In this section, we consider both the various types of owners, and how these types might
relate to corporate purpose.
Companies can be classified into two broad categories of ownership: whether the firm is
publicly listed or privately owned. Within these categories, there are additional differences among
owners. Among private firms, a firm can be owned by individuals such as the firm founders, by
an asset manager such as a private equity fund, or by a corporate parent that itself is a publicly
listed firm. Among public firms, ownership concentration can vary from extremely dispersed to
highly concentrated structures. Public firms can also differ along other dimensions of ownership
(e.g. growth vs value investors, retail vs institutional investors).
We focus here on ownership concentration for several reasons. First, dispersion of
ownership is the defining characteristic of the public corporation that spawned the interest in
corporate governance, management incentive plans, and agency theory (Berle and Means 1932,
Jensen and Meckling 1976). Second, past research has shown that the concentration of ownership,
in particular the presence of large blockholders, is associated with important characteristics such
as lower executive pay levels, higher investment, and lower accounting fraud (Edmans and
Holderness 2017). Third, a public corporation that has ownership concentrated in one or just a few
shareholders is effectively a private company, albeit with more liquidity of its shares. Therefore,
as ownership becomes more concentrated, all else equal, we might expect a public firm to become
more similar to a private firm. However, all else is not equal. In contrast to private owners that
tend to have much longer holding periods and limited liquidity of their shares, public owners tend
to hold the stock of a firm for shorter periods and their shares are traded in a liquid market. This
distinction suggests that although concentrated owners in public markets might yield influence on
12
the corporation, as private owners do, their influence might be focused more on current stock prices
and short-term earnings rather than on long-term profitability.
Evidence on differences across public and private firms
Past research suggests that corporate ownership affects firms’ strategic and financial choices (e.g.,
Asker, Farre-Mensa and Ljungqvist 2014; Gilje and Taillard 2016; Bernstein, 2015). Gilje and
Taillard (2016) study investment choices in the natural gas industry. They find that private firms
adjust their capital expenditures less compared to public firms in the face of changes in investment
opportunities, which they attribute to public firms having easier access to finance. Bernstein (2015)
studies innovation practices, and finds that after going public, the quality of internal innovation
declines and many skilled inventors leave the firm. However, public firms attract new human
capital and acquire external innovation suggesting that the structure of innovation changes.
Bharath, Dittmar and Sivadasan (2014) find that companies going private extensively restructure
their portfolio of plants, selling and closing plants more quickly than others. Asker, Ferra-Menza
and Ljungqvist (2014) find that, compared with private firms, public firms invest substantially less
and are less responsive to changes in investment opportunities, especially in industries in which
stock prices are most sensitive to earnings news. They attribute these findings to short-termist
pressures in public markets distorting investment decisions. Maksimovic, Phillips and Gordon
(2017) find, in contrast, that public firms respond more to demand shocks after going public and
are more productive than their matched private counterparts. This effect is stronger in industries
that are capital intensive and dependent on external financing.
The effects of ownership have received less attention within management research. Trostel
and Nichols (1982) is one of the few studies that provide evidence on the relation between whether

13
a firm is publicly listed or not and its business strategies and management processes. Using
interview methods, and data from roughly 20 companies, they do not find evidence that
management in private firms is less professional and formal than public firms. More recently and
in a substantially expanded global sample of 10,000 establishments, Bloom, Genakos, Sadun and
Van Reenen (2012) find that public and private equity firms have stronger management practices
than privately owned firms, particularly those that are founder-run.
Ownership concentration in public firms
In general, researchers agree that blockholders influence management behavior. McCahery et al.
(2016) provides evidence on the specific channels of voice that blockholders employ. In order of
frequency, they show that blockholders engage in discussions with top management, vote against
management, communicate with the board away from management, propose specific actions to
management, and aggressively question managers on conference calls.
In terms of operating effects, Brav et al. (2008) find that 13D filings, triggered when an
investor acquires more than 5% of a public company, lead to improvements in total payout, CEO
turnover, and operating performance. Brav et al. (2015) show that the performance improvements
result from higher plant-level productivity, which in turn stems from higher labor productivity—
despite working hours not rising and wages not falling. Brav et al. (2018) show that a 13D filing
is associated with a decline in R&D investment, but also an increase in both the number of future
patents and their quality (as measured by citations). However, this effect is not universal. Recent
work finds that the positive performance effect of blockholders is driven only by the largest
transactions, and that roughly 80% of firms experience no improvement in operating performance
and. insignificant negative long-term returns (deHaan, Larcker, McClure 2018).
14
Given this mixed evidence, we do not know how concentrated ownership will affect
corporate purpose. However, we expect that it will likely have a significant influence given that
its impact on management and governance practices.
Private firm owned by a Private Equity (PE) fund
A growing literature on PE fund ownership suggests that PE firms are managed differently
compared to other firms. Bernstein and Sheen (2016) analyze restaurant chain buyouts between
2002 and 2012 using health inspection records in Florida and find that restaurants become cleaner,
safer, and better maintained after the buyouts. PE targets slightly reduce employee headcount, and
lower menu prices. Because these changes to store-level operations require monitoring, training,
and better alignment of worker incentives, they suggest that PE firms improve management
practices throughout the organization. Bloom, Sadun and Van Reenen (2015) provide more direct
evidence on management practices that PE firms use. They find PE owned firms adopt more
modern management practices, such as lean manufacturing, and show stronger performance
related incentive practices. PE ownership is also associated with greater delegation of authority to
plant managers, especially in demand related activities such as sales and marketing and new
product introductions. The cross-sectional nature of their data does not permit them to distinguish
selection from treatment effects. That is, the superior management of PE owned firms could come
entirely from purchasing well-managed firms, rather than improving firms' management over time.
In contrast, Bernstein and Sheen (2016) observe smaller effects on franchised restaurants, a finding
that they use to claim a causal effect of PE ownership on corporate outcomes. Lerner, Sorensen
and Stromberg (2011) find some support that PE owned funds improve the innovation capacity of
firms, potentially relieving public firms from short-termist pressures. Following going private firm

15
patents get more cited, show no shifts in the fundamental nature of the research, and become more
concentrated in important areas of companies’ innovative portfolios. Davis et al. (2014) find that
PE buyouts lead to modest net job losses but large increases in gross job creation and destruction.
Buyouts also bring productivity gains at target firms, mainly through accelerated exit of less
productive establishments and greater entry of highly productive ones.
Overall, the evidence suggests that PE fund ownership is associated with different, and
generally more productive, ways of running a firm. However, what that effect might be on the way
employees experience the meaning of the work is a priori unclear.
Private firm owned by a Public Parent Company
Many public firms own other private firms that they choose to keep as separate private firms with
their own leadership structure. For example, Chesbrough (2003) studies 35 separate legal entities
created by Xerox between 1984 and 1998 to commercialize output from their research laboratories.
Keeping them as separate legal structures with their own management practices might allow a firm
to maintain a distinct culture thereby influencing its ability to be innovative (Christensen 1997).
This prediction is consistent with work on formal and real authority by Aghion and Tirole (1997),
or the property rights theory of Grossman and Hart (1986). Placing assets in a subsidiary limits the
parent’s exposure on the subsidiary’s debts to the value of the subsidiary’s assets. This implies
that the net loss to the parent when the project assets lose value is smaller than if the project were
run as a division inside the parent entity. This creates stronger incentives for the management of
the subsidiary to innovate but it also gives them more real authority over the subsidiary’s future
(Ayotte 2017).

16
Whether keeping a subsidiary as a separate legal entity is effective at insulating the firm
from the pressures of the parent company is unclear. If indeed this is effective, then we expect the
private firm to exhibit corporate purpose that is closer to other private firms. If it is not effective,
we expect those firms to exhibit a corporate purpose that is much closer to the one exhibited by
public firms.
In summary, ownership is strongly related to core strategic choices of companies. Further,
given anecdotal evidence, there is reason to believe ownership is related to the perceived purpose
of the firms, although the nature of this relationship is unknown. It is to this question that we now
turn.
Data and Research Design
Research Design
The aim of our study is to explore the relationship between firm ownership and corporate purpose.
For our measure of firm ownership, we first assign each firm in a given year to four top-level
categories: whether the firm is i) publicly traded, ii) a private subsidiary of a public firm, iii)
private-equity owned, and iv) privately owned, non-private equity. We then further subdivide our
largest category, public firms, by the degree of control of their top public shareholders. This
subdivision allows us to examine whether purpose (and purpose inequality) varies by the degree
of power held by their largest shareholders.
We divide our analysis into two parts. In the first part, we construct and then relate
measures of corporate purpose to various types of firm owners. For corporate purpose (whose
construction is described in detail below) we first measure it at the firm-year level, and then
disaggregate the measure by job level. This disaggregation allows us to explore which employees

17
are driving our differences and, specifically, whether ownership is related not only to corporate
purpose, but also to corporate “purpose inequality;” that is, the difference in purpose felt by the
top-ranked employees to the others within the organization.
Note that our research design is correlational: our setting does not provide a clean
experiment to isolate the causal impact of firm ownership on corporate purpose. As such, at the
end of this first part of our analysis, we provide a set of evidence, by no means definitive, on
whether the correlation between purpose and ownership reflects a sorting or a treatment effect.
In the second part of our analysis, we explore factors that may explain the purpose patterns
reported in the prior section. Specifically, we ask whether the characteristics of the CEO
(background and compensation) differ across types of firm owners, and whether those differences
can explain our results. We then ask whether actions taken by the CEO and top management—
both restructuring moves (M&A, layoffs, divestitures) and provision of employee benefits—also
can explain our results.
The goal of these two analyses together is to gain some large sample evidence on how
corporate purpose differs by firm ownership, as well as potential insight into whether those
differences are causal and the underlying reasons for the identified differences.
Data Description
The primary data for this study is compiled from applications to Fortune Magazine’s annual “100
Best Companies to Work For” list, administered by The Great Place to Work® Institute. The
applications comprise all submissions to the annual list, regardless of whether the companies were
successful. These data have been previously used by Gartenberg, Prat and Serafeim (2019), where
18
it is described in further depth, as well as Guiso, Sapienza and Zingales (2015), and Garrett,
Hoitash and Prawitt (2014).
All applicants are required to employ more than 1,000 workers in the US and to have
existed for seven years or longer. Since the submission process is costly for applicant companies,
our dataset comprises a self-selected sample whose management believes that they have a credible
chance of being included on the list and who place relatively greater value on human capital. One
potential concern is that sample selection may limit the generalizability of our results if public and
private firms differ in their levels of participation in a way that is also related to the strength of
their purpose. On the other hand, this sample may also be a conservative setting for our analysis
since these companies are more likely to aim for a sense of purpose among their employees relative
to the universe of firms, or at least the appearance of such. We consider potential sample bias in
the discussion section.
The application package to the list contains two sections: The Culture Audit Survey©
(CAS) and the Trust Index© employee survey (TI). The CAS includes structure and policy
information about the applying company, including industry and location of headquarters,
employee composition (e.g., numbers, age and tenures at different hierarchical levels), and pay
and benefit information. The TI, the main data of interest for our study, is a randomized employee
survey that captures employees’ beliefs about the workplace climate, including management
quality, coworker relationships, and the nature of their work. The survey is stratified by job level,
where the job levels include hourly employees, sales (commission-based) workers, middle
managers and supervisors, salaried professional and technical workers, and executives and senior

19
managers. The survey consists of 57 questions with responses range from 1 to 5 on a Likert-like
scale, where 1 corresponds to “almost always untrue” and 5 corresponds to “almost always true.”9
Our data agreement with the Institute provides access to all applications – both successful
and unsuccessful – from 2006 to 2016 (Table 1 Panel A). We combine summary information from
the CAS with TI survey data, which we aggregate up to the firm-year level. The sample includes
2,662 firm-year observations, aggregated from 1,509,797 survey responses from full time
employees, with a median level of 565 responses per firm.
We merge this dataset with the following additional data sources: Compustat to identify
the publicly-traded companies in our sample, CapitalIQ to identify private equity owners, Factset
for blockholder information on the public firms, and Execucomp for CEO compensation data.
Measure of Corporate Purpose
We base our purpose measure on an earlier study by Gartenberg, Prat and Serafeim (2019). They
run an exploratory factor analysis on the raw survey questions to identify bundles of beliefs that
co-vary among employees, and identify four factors that explain most of the variance. The factor
analysis is executed at the employee level using all individual survey responses for all full-time
employees of all for-profit firms (both public and private). As they do, we include 53 of the 57
questions, excluding four questions that are outcome measures of overall job satisfaction. While
Gartenberg, Prat and Serafeim (2019)’s sample stops at 2011, our sample extends to 2016 and
includes both public and private firms. Replicating their results on this expanded sample, the factor
analysis yields substantively the same four factors that explain most of the variation, including the
9 While our data agreement precludes us from releasing the full set of questions from the survey, a public description of the survey instrument can be found here: http://www.greatplacetowork.net/our-approach/what-is-a-great-workplace, accessed 6/25/16. Our four questions on purpose fall under the designated “Employee Pride” category.

20
factor that captures corporate purpose.10 To construct firm-year level measures, we follow their
approach and average the scores for each factor across all individuals within each firm in given
year.
Of the four identified factors, they dub one “Purpose-Clarity.” We, for expositional
simplicity, refer to this factor as “Corporate Purpose.” This factor includes beliefs in the meaning
of work combined with clarity from management. The four meaning-related questions are “My
work has special meaning: this is ‘not just a job’”, “When I look at what we accomplish, I feel a
sense of pride”, “I feel good about the ways we contribute to the community”, and “I'm proud to
tell others I work here.” The questions that relate to clarity focus on whether management provides
clear direction, job responsibilities, and tools that can be used to achieve the desired outcomes.
The two items with the highest loadings on this factor, aside from the four purpose questions, are
“Management has a clear view of where the organization is going and how to get there” and
“Management makes its expectations clear.” A third question, “I am given the resources and
equipment to do my job” also loads highly in this factor. Meaning and clarity matter in combination
in accordance with the construct of “meaningful work”, work that is “purposeful and significant”
(Pratt and Ashforth, 2003, pg. 311), in ways that purpose or clarity alone are not. See Gartenberg,
Prat and Serafeim (2019) for a more detailed discussion of this measure. They find that this factor,
and none of the other factors, positively predicts firm performance. Later in the paper, we substitute
this variable for other measures of purpose to assess how the results vary with the choice of purpose
measure.
10 Refer to their study for detailed descriptions of the other three factors, which they refer to as “management,” “purpose-camaraderie”, and “non-discrimination.” We later consider “Purpose-camaraderie,” as well as a composite index of the four meaning questions on their own, in the discussion section as alternative measures of corporate purpose.

21
Measures of Ownership
We sort firms into four top-level categories: public, private (non-PE owned), private (PE owned),
and private with public owners. We identify public firms by whether they have a corresponding
record in Compustat, private equity-owned firms by whether they are identified as such in
CapitalIQ, and public parent-owned firms by whether they self-identify as such in the Culture
Audit survey.
We identify the blockholder concentration data by merging our sample with Factset. We
allocate firms to two ownership concentration groups each year according to the percentage of
shares held by the top five investors in a firm. If the percentage of shares is higher (lower) than the
median then a firm is allocated to the high (low) ownership concentration group.
Control variables
We include the following control variables in our specifications: the natural logarithms of firm and
number of employees, as the sense of purpose may be related to the size of the firm and the
corresponding degree of bureaucracy required. We also include fixed effects for year, industry,
and the state in which the firm is headquartered, as all of these factors may influence the degree of
purpose within firms.11 Finally, we include controls for age and tenure brackets of the employees
to account for the fact that people of different age and tenure might systematically choose to work
for companies with different strengths of corporate purpose. These controls are also important to
include if, for example, some firms grow more quickly and attract new employees with weaker set
of beliefs about a firm’s corporate purpose.
11 Controlling for firm fixed effects is difficult in our setting because we observe few changes in ownership for the period and the firms in our sample and we do not have a good understanding of how fast changes in ownership might translate into changes in purpose. We leave this important question for future research.

22
Summary statistics
Table 1 contains summary statistics. As is apparent from this table, these are large, established
firms with two thirds of the observations represented by the following five industries:
manufacturing, financial services, retail, professional services, and IT.
<<< Insert Table 1 here >>>
Purpose and Firm Ownership
Empirical Specification
We estimate the relation between corporate purpose and ownership characteristics using an OLS
model, clustering standard errors at the firm level to account for serial correlation within a firm
over time. The model we estimate is:
Purposeit = a + b1 x Publicit + b2 x PrivatePublicit+b3 x PEi + b4 x Industryit + b5 x Yeart + b6 x Statet +
∑Firmcontrolsit + ∑Employeecontrolsit + ϵ23 (1)
where Purpose is the purpose-clarity factor for firm i in year t. Public is an indicator variable that
takes the value of one if the firm is publicly listed. PrivatePublic is an indicator variable that takes
the value of one if the firm is private but its ultimate owner is a public company. PE is an indicator
variable that takes the value of one if the firm is owned by a private equity fund. The omitted group
in the regression is private firms that are not owned either by public firms or private equity funds.
The coefficients b1 - b3 are our main estimates of interest. They represent the incremental increase
or decrease in purpose associated with the respective ownership structure relative to a firm that is
privately owned. State, Industry and Year represent the state of corporate headquarters, industry

23
and year fixed effects. Firm controls include the natural logarithm of total assets and employees.
Employee controls include employee age and tenure.
Purpose and Firm Ownership
Figure 1 shows the distribution of corporate purpose by ownership type. The top left figure shows
the histogram distribution of purpose for private (non-PE, no public owner) firms. Since this group
forms the comparison group against which we compare the other firms, we overlay the histogram
with the kernel density of this same distribution (the red line) in this and all subsequent figures.
This red line enables a visual comparison of the distribution of purpose in private (non-PE, no
public owner) to the other ownership types. The top right figure depicts the histogram distribution
of purpose for public firms. As can be seen in the comparison to the red line, the distribution is left
skewed, indicating that purpose is lower in public firms. The bottom two figures, private firms
with public owners (left) and private equity owned firms (right), also show that purpose is left
shifted for both of these types of firms.
<<< Insert Figure 1 here >>>
Table 2 presents the results of estimating model (1). Columns 1-3 introduce progressively
more control variables. In column 1, we control only for year fixed effects. In Column 2, we add
industry and state fixed effects as well as firm controls. In Column 3, we include employee
controls. In Column 1, the coefficients on the ownership variables do not obtain significance
except for the coefficient on PE owned firms. This changes in Column 2 where now the
coefficients on public firms, private firms owned by a public firm and PE owned firms are all
negative and significant. Moreover, the explanatory power of the model increases from 19.8 to
31.6% suggesting that industry membership and firm size are both important explanatory factors.

24
Adding employee controls changes the models little as the explanatory power increases to 32.7%,
and the coefficients on the ownership variables change very little, although the coefficient on PE
owned firms is now negative but insignificant. The coefficient on public firms is significant at the
1% level and that on private firms that are owned by a public firm at the 5% level. Larger firms
have stronger corporate purpose as the estimated coefficients on firm sales and employees are both
positive and significant.
Public and private firms differ systematically both in terms of size and sector membership.
Although we control for both sector fixed effects as well as firm size, we are worried that our
controls might not adequately mitigate these differences. To understand the robustness of our
results to a more balanced sample we implement a matching process where we implement exact
matching without replacement on year and sector membership and nearest neighbor on firm size.
In untabulated analysis using a smaller more balanced sample, the results are very similar where
public and private firms owned by public firms have significantly lower purpose compared to
private firms. Later in the paper we present more results from matched sample analysis.
<<< Insert Table 2 here >>>
Table 3 presents the same model as in Table 2 column 3 but now disaggregating corporate
purpose by job level. Several findings emerge. First, public firms have lower corporate purpose
across all job levels except for senior executives. Second and strikingly, the magnitude of the
coefficient increases monotonically as one goes down the organizational hierarchy. Executives in
public firms hold the same beliefs about corporate purpose as their peers in private firms but this
changes for middle management, even more so for professional staff and then even more for hourly
workers. This is true even when adjusting for standard deviations by job level: the point estimates
for executives (Column 1) represent 6% of a standard deviation and are statistically insignificant,

25
while the point estimates for middle managers, professional and hourly workers represent 17%,
24% and 32% of a standard deviation for purpose within each of these job levels, respectively, and
are all statistically significant at conventional levels.
We find a similar effect for private firms that are publicly owned. The trend is similar with
the estimated coefficient insignificant for senior executives (4% of a standard deviation in purpose)
and the most negative for hourly workers (29% of a standard deviation in purpose).
We can also think of these results in terms of “purpose inequality”: senior executives of
public firms experience a greater sense of purpose than their employees, and that inequality of
purpose is exacerbated the deeper one goes within the organization. This is not the case for private
companies. We show this explicitly in Appendix Table A1 by replacing corporate purpose as our
dependent variable with the delta of corporate purpose between executives and the remaining job
levels.
The final pattern in Table 3 is also interesting. The lower purpose previously reported in
Table 2 within private equity owned firms is driven primarily by executives, followed by middle
managers. The coefficients for professional staff and hourly workers are insignificant. In other
words, executives of private equity owned firms have a lower sense of corporate purpose relative
to those of privately owned (non-PE, not public owned) (p=0.013) or public firms (p=0.048), more
so than the remainder of the employees.
<<< Insert Table 3 here >>>
Ownership Concentration
So far, we have decomposed private firms to three different types, and kept public firms in
a single category. We now decompose public firms according to their level of ownership
concentration. Firms in the below median group of ownership concentration have 20% of the

26
shares held by top 5 investors while firms in the above median group have 34% of the shares held
by top 5 investors.
Figure 2 shows the histogram distributions of corporate purpose within public firms by
each of these four quartiles, overlaid with the distribution of corporate purpose within private firms
(the red line) for comparison purposes. The top left panel shows that public firms with the most
dispersed owners actually have higher purpose relative to private firms. This purpose progressively
falls as concentration increases, with the above median having notably lower purpose than private
firms.
<<< Insert Figure 2 and Table 4 here >>>
The multivariate analysis confirms these results. In Table 4 Panel A, we reproduce Table
2, but replace the Public indicator variable with two ownership concentration indicator variables.
Purpose is lower among firms with higher ownership concentration. Public firms in the low
concentration group exhibit no different purpose than private firms. In contrast, public firms in the
high concentration group exhibit the largest negative difference compared to private firms. Given
that firms with concentrated ownership might be firms where the founding family has a major
stake, we are interested to understand if the concentrated ownership effect is driven by institutional
investors or by family ownership. We construct an indicator variable taking the value of one for
all public firms where a family has more than 1% of the shares. Column 4 includes this indicator
variable and the estimated coefficient on it is positive but not significant. Interestingly, although
these firms tend to have concentrated ownership, if anything, corporate purpose is at least as high
as in private firms. The coefficients on the concentrated ownership indicators become even more
negative after we control for whether a public firm is a family firm. Altogether, the results in Table
4 show that corporate purpose decreases with concentrated ownership.
27
<<< Insert Table 4 here >>>
Table 4 Panel B further decomposes the high concentration variable based on whether there
is low or high hedge fund share ownership. We are interested in further understanding the
relationship between ownership concentration and purpose. The type of investors seems a primary
candidate in providing further evidence on the nature of this relationship. Specifically, we expect
for firms with concentrated ownership and high levels of hedge fund ownership the negative
relationship with corporate purpose to be stronger. This is because hedge funds are among the
most active investors when it comes to influencing management and governance processes.
Therefore, we decompose the indicator variable for high concentration to two indicators: one for
low and one for high hedge fund ownership. We find that the coefficient on the high hedge fund
ownership group is both larger in magnitude (i.e. more than double) and more statistically
significant. It is worth noting, that the coefficient on the indicator for high concentration but low
hedge fund ownership is also significant, suggesting that other types of investors are also driving
the previously documented relationship between ownership concentration and purpose.
Sorting or treatment effect?
Our findings are consistent with two distinct, although related, interpretations. The first
interpretation is that different types of owners choose different types of companies, and hence we
are reporting a sorting effect in the market for corporate control. The second interpretation is that
owners have a direct impact on the employees of their companies, and so our patterns capture the
treatment effect of companies under different types of corporate owners. We consider each of these
now.
28
Under the first interpretation, the patterns that we report reflect companies with higher
purpose choosing to remain private. Our findings would also suggest that, among public firms,
shareholders that take large positions in companies choose to invest in lower purpose companies.
This assortment may arise either because these companies have other attributes that attracts
powerful investors, or that investors – for whatever hard to identify reason – find lower purpose
an attractive attribute on its own. Under this interpretation, investors have no direct influence on
purpose of the company, and the differences strictly reflect a selection effect. Under the second
interpretation, owners have a direct impact on purpose. This effect could manifest as the impact of
these investors on the choices and culture of the company that directly influences the strength of
purpose felt by the employees. For example, if investors change the investment priorities of the
company, or the identity or focus of the management team, these changes could meaningfully
affect the employees.
Absent a convincing exogenous change to company ownership, it is impossible to
definitively separate these two effects. Moreover, from a theoretical perspective, it is implausible
to us that only one is present in our setting: it is much more likely that owners match to different
types of companies, and then influence the sense of purpose within those companies in different
ways. While we cannot separate these two interpretations, Table 4 Panel C shows our best attempt
to isolate a treatment effect in our setting. In this table, we replace the ownership categories with
lagged ownership and forward ownership throughout all specifications (hence our sample drops
by nearly half in this test). If a sorting effect is present, we expect purpose to lead ownership. If a
treatment effect is present, we expect ownership to lead purpose. Columns 1-3 show the results for
low and high concentration and columns 4-6 decompose the high concentration further into low
and high hedge fund ownership. Throughout all columns we find the that association between lag

29
ownership and purpose is stronger and statistically significant. Overall, the results in Panel C are
more consistent with a treatment effect being present in our setting.
Table 5, Panel A now examines the effect of blockholder concentration on corporate
purpose by job level. Overall, the results suggest that the decline in purpose with more
concentrated ownership reported in the prior table is not driven by senior executives, but instead
by their subordinates. Furthermore, the fall in purpose down the organization hierarchy noted in
Table 3 is driven by blockholder concentration. In other words, the “purpose inequality” of public
companies between senior and lower levels is most pronounced within firms with the most
concentrated shareholders. In fact, public firms with low blockholder concentration exhibit none
of the “purpose inequality” evident in the firms with concentrated shareholders, and are
indistinguishable from private firms. This result is inconsistent with the prediction that as public
ownership becomes more concentrated corporate purpose becomes more similar to the one found
in private firms. In fact, we find the opposite suggesting that public investors might be
systematically making different choices and influencing companies in different ways than private
investors when it comes to CEO characteristics and incentives and the choices that managers might
be making. Appendix Table A1 provides these inequality results directly.
Table 5 Panel B illustrates a more nuanced picture where within the firm group with high
ownership concentration having high hedge fund ownership is associated with lower purpose
across all levels in the organization, including executives. Table 5 Panel C replicates the lead/lag
analysis of Table 4 Panel C by job level. As with the prior analysis, we find that our results are
primarily driven by lagged ownership, rather than forward ownership. This pattern is consistent
with a treatment effect of ownership on corporate purpose.
<<< Insert Table 5 here >>>

30
Another potential explanation is that the results we document are driven by differences in
financial performance in those companies. For example, if some investors take concentrated
positions in badly performing companies and these companies have a low sense of purpose partly
due to frustration with bad financial performance, then financial performance operates as a
correlated omitted variable. This alternative explanation would also suggest that private firms in
our sample have better financial performance than public firms. We fail to find evidence consistent
with this alternative explanation in our data. Including return-on-sales (ROS), the only financial
performance variable include in the GPTW data, does not change our key results. However, the
financial performance explanation could also affect our results within public firms if for example,
hedge funds might choose to invest in struggling companies. To address this concern, we match
across types of ownership within industry and year based on financial performance as measured
by three periods of lagged return on assets and three periods of lagged revenue growth.
In Table 6 we estimate average treatment effects after applying inverse probability
weighted regression adjustment (IPWRA) matching that is often applied in studies of public health
to estimate treatment effects in populations. One advantage of the method compared to propensity
score matching is that it allows for multiple treatments (in our case, high and low ownership, and
hedge fund ownership), rather than a single dichotomous treatment variable.
The results of Table 6 show that our results are robust to IPWRA matching on prior
performance. Public firms with highly concentrated ownership continue to have lower purpose
compared to private firms, matching on past performance. This effect is magnified for firms with
high hedge fund ownership.
The results of the prior analysis provide the following insights. First, corporate purpose is
lower in public firms relative to their private counterparts, particularly private firms that are not
31
owned by either a private equity firm or public parent. Second, this result is driven by employees
below the top of the organization—middle managers, professional and hourly workers—and not
executives. Lastly, among public firms, purpose is progressively lower among firms with higher
shareholder concentration. This pattern is also driven by employees below the top of the
organization and not executives.
Role of CEO Characteristics
What might explain these patterns? In this section, we examine whether differences in corporate
leadership, in particular CEO characteristics, across private and public firms can account for the
difference in purpose among these firms. We focus on two categories of characteristics. First, we
explore compensation structure and in particular the gap between a CEO and average
compensation of employees inside the firm. Second, we examine the background of the CEO,
including whether he or she rose in the company through its low or mid-level ranks, and how long
the CEO has been at the company and in the role itself.
Table 6 Panel A provides summary statistics for the variables of interest. We note that we
have CEO-employee pay gap and CEO pay only for a subset of public firms and for none of the
private firms. Both measures decline as ownership concentration increases although the decline is
not monotonic. We note that because firm size also declines, these relations could be obscured by
firm size. Therefore, in the models we always control for firm size to ensure that our results are
not confounded by absence of appropriate controls for size.12
We find a large difference in whether the CEO was externally hired in C-suite vs internally
promoted from lower level of the organizations across private and public firms. Within public
12 To keep the sample constant in the multivariate analysis, we impute missing values of compensation at the mean, and include an indicate variable whether the data is imputed. These imputed values are not included in our panels of descriptive statistics.

32
firms, 34% of CEOs are internally promoted and started in middle management or lower levels.
Within private firms, in contrast, 54% of CEOs are internally promoted. Within public firms the
percentage declines as ownership concentration increases. The rate for the bottom portfolio is 39%
while the rate for the top is 28%. Within private firms, both firms owned by public companies and
PE-owned firms have much lower percentages at 27 and 28% respectively. In contrast, the
percentage is 65% for all other private firms.
Notably, these differences do not reflect differences in the number of years the CEO has
been in that position. Within public firms, the average CEO tenure is 9.6 years, a value that does
not decrease monotonically across the ownership concentration quartiles. Within private firms,
average CEO tenure is longer for PE-owned companies at 13.2 years. Similarly, we find no
differences in terms of CEO power, as reflected by whether the CEO is also the Chair of the Board.
Although, the percentage of holding both positions is much higher in public rather than in private
firms, it does not follow a meaningful patterns across types of public or private firms. In contrast,
average number of years in the organization is related to where the CEO started. The highest CEO
tenure as an employee is for purely private firms at 26.4 years and the lowest for private firms
owned by public companies at 18 years and declines with shareholder power, consistent with
internal promotion statistics.
Panel B includes these variables in the models to understand a) how those factors might be
related to corporate purpose and b) whether including them in the model mediates the effect of the
ownership variables. Columns 1-3 include the public indicator variable while Columns 4-6 include
the four ownership concentration indicators for public firms. Columns 1 and 4 are the baseline
reproducing the existing results from the previous tables and are presented for comparison
purposes. Columns 2 and 5 include the CEO position variables. Columns 3 and 6 add the CEO pay

33
and pay gap variables. The coefficient on whether the CEO has joined from mid or low-level ranks
is positive and significant at the 1% level across all models. Moreover, including it reduces the
magnitude of the coefficient on the public indicator variable by close to 30%. It also reduces the
magnitude of the coefficients on the ownership concentration variables by close to 20%. Adding
the CEO pay gap and pay variables further decreases the magnitude of the Public firm coefficient
although not by as much. These variables also load significantly in the models. Firms with higher
CEO to average employee pay gap have lower sense of purpose after controlling for average CEO
pay level (which is significantly and positively correlated with purpose). These results provide
support to the idea that in organizations where the CEO is higher paid employees are not
dissatisfied as long as they are also rewarded with proportionally higher pay.
The two variables that together explain substantial differences in purpose across
organizational owners are CEO-employee pay gap and whether the CEO joined at a middle or
lower organizational rank. In Panel A, however, these two variables do not appear to differ
substantially by the type of owner. One challenge in interpreting the descriptive statistics in Panel
A, however, is that each blockholder ownership group can represent companies that are very
different sizes, which we control for in our multivariate analysis in Panel B. To account for these
between-group differences, we create size-adjusted blockholder groups sorting firms first in size
quartiles and then within quartiles firms into the top and bottom ownership concentration. We find
that the CEO-employee pay gap does in fact increase with ownership concentration, and insider
CEOs decline, as we would expect.
<<< Insert Table 6 here >>>
Figures 3-5 provide graphical depictions of this result. Figure 3 provides a bin-scatter plot
of corporate purpose versus CEO-employee pay gap, and shows that purpose exhibits a strong
34
decline as the pay gap increases. We can also consider this result in terms of “purpose inequality”.
Figure 4 shows the relation between CEO-employee pay gap and purpose inequality: there is a
strong, positive relation between the two, suggesting that the firms which pay CEOs are more
relative to employees also have the largest gap in purpose between executives and their
subordinates. Figure 5 shows the difference in purpose between public firms with CEOs joining at
low or middle ranks, and those with outsider CEOs. This figure visually confirms the multivariate
results showing that firms with internally promoted CEOs have a stronger sense of purpose.
<<< Insert Figures 3, 4, and 5 here >>>
Overall, we conclude that CEO starting position and CEO-employee pay gap are likely
important determinants of purpose, mediating the relation between purpose and ownership. The
inclusion of CEO starting position and compensation together explains approximately 35% of the
difference in purpose between public and private firms.
The Role of Management Actions
We next explore whether critical actions taken by the management team can account for our
observed differences in purpose. These actions fall into two categories: restructuring activities
(mergers, divestitures, and layoffs) and compensation structure and benefits granted to employees.
In particular, we construct an index that sums five indicator variables for whether the firm offers
schedule benefits or family benefits. The schedule benefits index is composed of three variables:
option for compressed work week offered, flexible schedule program offers and telecommute
option offered. The family benefits index is composed of two variables: onsite childcare offered
and offsite childcare subsidized. We can think of the second category both as the incentives

35
provided to employees and also as a heuristic about how management considers splitting its surplus
between employees and owners.
Table 7 Panel A shows summary statistics for these variables. A few interesting
observations are worth highlighting. The percentage of firms that had a merger, layoff, and unions
is much higher at public rather than private firms. Within public firms and across ownership
concentration quartiles, the benefits index and the percentage of firms with ESOPs and unions
declines, although these relations could be driven by size differences. Within private firms, firms
that are not owned by public firms or PE funds exhibit significantly lower percentage of mergers,
layoffs, higher benefits index, and higher percentage of ESOPs. PE owned firms exhibit higher
variable compensation pay for both salaried and hourly workers consistent with PE funds
introducing stronger pay for performance incentive contracts.
Panel B presents the estimated models now including these variables. Columns and 1 and
3 present the baseline specifications for comparison purposes from Table 6. Columns 1-2 include
the public indicator variable while Columns 3-4 include instead the two ownership concentration
indicator variables. Including these additional variables further decreases the magnitude of the
coefficients on the ownership variables. However, they are still significant. Firms with recent
mergers exhibit significantly lower purpose while firms with higher benefits index and higher
variable pay exhibit stronger purpose. The rest of the variables, such as past layoffs, offering
ESOPs or presence of union are not correlated with purpose. As before, we conclude that including
management actions mediate the relation between purpose and ownership but they do not fully
explain that relation as the ownership variables are still significant in the models.
<<< Insert Table 7 here >>>

36
For our final analysis of this section, we disaggregate the analysis of Table 7 by job level.
Table 8 Panel A provides the results with all public firms together, and Panel B splits public firms
by blockholder concentration quartile. This table shows that the inclusion of management
restructuring and benefits almost completely explains purpose for middle managers, and explains
a substantial additional portion for the other job levels below the executive level.
<<< Insert Table 8 here >>>
In summary, the second half of our analysis provides the following insights. First, the CEO-
employee pay gap and background of the CEO collectively explain approximately 30% of the
difference between public and private firms. Second, the addition of management restructuring
actions and benefits explain an additional 5%, and more so for middle managers. We now turn to
a discussion of these results.
Discussion
In the first half of our analysis, we report markedly lower purpose in public firms, particularly
those with concentrated blockholders. These patterns are driven by subordinate employees within
the hierarchy, rather than executives and senior managers. In the second half of our analysis, we
show that these patterns can be substantially explained by the following differences among these
companies: first, companies with lower purpose are also those that bring in the CEOs from outside
the organization and pay them more relative to their employees. Second, companies with lower
purpose are those that recently underwent fundamental restructuring activities, such as mergers
and layoffs, and also offer their lower-level employees lower benefits and incentives.
In this we consider both the interpretation of our results, as well as their robustness.

37
Interpretation of our results
What might explain these results? In our view, much of these patterns are consistent with
the need for equity in organizations. As a recent article in Harvard Business Review contended, a
strong sense of purpose among employees and CEO-employee pay inequality are mutually
exclusive: “to avoid a corporate-purpose exercise being viewed by employees as a cynical joke
there are certain pre-conditions that must be met. The major ones are addressing excessive CEO
and senior executive pay, and treating employees and other stakeholders fairly.”13 According to
equity theory (e.g., Adams, 1963; Akerlof and Yellen, 1990), the perception of fairness,
particularly a consistent and understandable allocation of rewards to inputs, is a critical workplace
attribute, and that employees withdraw their effort in the face of perceived inequity.
A related question arises. If purpose leads to higher performance, as shown by Gartenberg,
Prat and Serafeim (2018), why would profit-motivated investors pursue actions associated with
lower purpose? Given our large sample research design, we cannot observe the specific intent of
these investors. However, these are several plausible reasons in our view why they might do so.
First, these investors may simply not be aware of the link between their actions and corporate
purpose. As we discussed, research studying how investors influence firms has found a wide
variety of outcomes from very positive to very negative ones. Purpose is hard to observe,
particularly among employees below the executive ranks, and investors may not be focused on
how their actions impact employees. Second and related to ease of observability, multitasking
challenges may lead investors to focus on more readily observable outcomes than purpose. For
example, if shareholders succeed in attracting an external CEO or pushing for a new acquisition,
13 https://hbr.org/2018/08/your-corporate-purpose-will-ring-hollow-if-the-companys-actions-dont-back-it-up
38
these acts are both easier to observe and communicate to their own constituents than the impact on
corporate purpose that may arise from these actions.
Alternatives and robustness
Several questions arise regarding the robustness of our analysis, to which we now turn.
Purpose Measure
So far we have focused our analysis using a purpose metric that measures employee beliefs both
about the purpose and meaning of the work but also about the clarity provided by management
towards that purpose, a measure identified by Gartenberg, Prat and Serafeim (2019) as one of two
purpose-related factors in an exploratory factor analysis and labeled Purpose-Clarity. We focused
on this measure because it strongly predicts firm performance, and varies substantially across
firms. For robustness, however, we look here at two alternative approaches to capturing purpose.
One alternative measure of purpose is what Gartenberg, Prat and Serafeim (2019) call
Purpose-Camaraderie, the second of two factors they identified in a factor analysis that concern
purpose. This measure includes the four purpose questions, listed in the introduction section,
together with questions on the degree of camaraderie between employees in the workplace. The
two items with the highest loadings on this question are i) whether employees have fun at work
and ii) whether they believe that there is a familial atmosphere among employees at work. The
other questions included in this factor similarly focus on workplace collegiality. Table 10 Panel A
presents the results. Columns 1 and 2 do not include the CEO characteristics and management
choice variables. These are included in Columns 3 and 4. Columns 1 and 3 include the public firm
indicator variable while Columns 2 and 4 include the four indicators for ownership concentration.

39
A few results are notable. As is the case with our primary measure of corporate purpose, public
firms and private firms owned by public companies also have lower purpose-camaraderie. Also,
public firms with more concentrated ownership have lower purpose-camaraderie. Controlling for
the CEO characteristics and management choice variables completely mediates the effect of the
ownership variables and all of the coefficients on them become insignificant. The coefficients on
the CEO joining the firm from low or mid ranks and on the benefits index continue to be positive
and significant. Perhaps the biggest difference is that the CEO-employee pay gap is not significant
anymore while the coefficient on layoffs is now negative and very significant.
A second alternative measure of purpose is the raw average of the four purpose questions in
the Trust Index survey. Panel B provides the results of our analysis using this “purpose index” as
our dependent variable. This analysis shows patterns that are broadly consistent with our findings.
Purpose is lower in public firms, and is particularly low in firms with concentrated blockholders.
Second, these patterns are substantially explained by the inclusion of CEO characteristics and
management actions. There are several differences, as with purpose-camaraderie, in which of the
CEO and management actions load. The pay gap is not significant using this measures, while years
in position and CEO as Chair are related to the purpose index. Also, layoffs are related to the
purpose index using this measure, and not mergers. Except for these differences, our patterns are
substantially the same.
Sample selection: is differential selection into survey driving results?
An alternative explanation to our results is sample selection bias. If for some reason, public
firms with lower purpose choose to participate in the GPTW survey compared to private firms then
our results could reflect this sample bias. Although, we cannot think why this might be likely, it is
certainly plausible. But even if this bias exists, it could explain only part of the differences in

40
purpose across firms with different forms of ownership. As Tables 6 and 7 show, part of the
difference in purpose is explained by leadership characteristics and managerial actions suggesting
that a sample selection bias is unlikely to account for the total difference.
Conclusion
This study shows that purpose differs substantially by nature of firm ownership, and that these
differences can be least partly explained by the choices and compensation of the CEOs. These
results are driven by employees below the executive and senior ranks and can therefore be thought
of in terms of “purpose inequality,” the difference in purpose between senior employees and their
subordinates. Interestingly, we find that lower corporate purpose—and correspondingly, higher
purpose inequality—is related to the CEO-worker pay gap. The greater the CEO is paid relative to
the employees, the lower the purpose within the organization.
This study raises several questions for future work. First, why owners implement the CEO
succession, compensation plans, and other choices that negatively influence purpose? Second, we
are only able to explain a small amount of the variation in purpose across firms. What are the other
first order factors that drive differences across firms? These are two of many questions on this
important topic that remain for future work.

41
References
Adams, J.S. “Towards an understanding of inequity.” The Journal of Abnormal and Social Psychology, 67, no. 5 (1963): 422.
Aghion, P. and Tirole, J. “Formal and real authority in organizations.” Journal of political economy, 105, no. 1 (1997): 1-29.
Ahuja, G. and Novelli, E. “Redirecting research efforts on the diversification–performance linkage: The search for synergy.” Academy of Management Annals, 11, no. 1 (2017): 342-390.
Akerlof, G.A. and Yellen, J.L. “The fair wage-effort hypothesis and unemployment.” The Quarterly Journal of Economics, 105, no. 2 (1990): 255-283.
Asker, J., Farre-Mensa, J. and Ljungqvist, A. “Corporate investment and stock market listing: A puzzle?” The Review of Financial Studies, 28, no. 2 (2014): 342-390.
Ayotte, K. “Subsidiary Legal Entities and Innovation.” The Review of Corporate Finance Studies, 6, no. 1 (2017): 39-67.
Bartlett, CA., and Ghoshal S. "Changing the role of top management: Beyond strategy to purpose." Harvard Business Review 72, no. 6 (1994): 79-88.
Berle, A. and Means, G. “Private property and the modern corporation.” New York: Mac-millan. (1932).
Bernstein, S., 2015. “Does going public affect innovation?.” The Journal of Finance, 70, no. 4 (2015): 1365-1403.
Bernstein, S. and Sheen, A., 2016. “The operational consequences of private equity buyouts: Evidence from the restaurant industry.” The Review of Financial studies, 29, no. 9 (2016): 2387-2418.
Bharath, S., Dittmar, A. and Sivadasan, J. “Do going-private transactions affect plant efficiency and investment?.” The Review of Financial Studies, 27, no. 7 (2014): 1929-1976.
Bloom, N., Genakos, C., Sadun, R. and Van Reenen, J. “Management practices across firms and countries.” Academy of Management Perspectives, 26, no. 1 (2012): 12-33.
Bloom, N., Sadun, R. and Van Reenen, J. “Do private equity owned firms have better management practices?” American Economic Review, 105, no. 5 (2015): 442-46.
Brav, A., Jiang, W., Partnoy, F. and Thomas, R., 2008. Hedge fund activism, corporate governance, and firm performance. The Journal of Finance, 63(4), pp.1729-1775.
Brav, A., Jiang, W. and Kim, H. “The real effects of hedge fund activism: Productivity, asset allocation, and labor outcomes.” The Review of Financial Studies, 28, no. 10 (2015a): 2723-2769.

42
Brav, A., Jiang, W., Ma, S. and Tian, X., 2018. How does hedge fund activism reshape corporate innovation? Journal of Financial Economics, 130(2), pp.237-264.
Capron, L. and Shen, J.C., 2007. “Acquisitions of private vs. public firms: Private information, target selection, and acquirer returns.” Strategic management journal, 28, no. 9 (2007): 891-911.
Chapman, C., Edmans, A., Gosling, T., Hutton, W., & Mayer, C. The Purposeful Company Executive Remuneration Report. (2017).
Christensen, C. “The innovator’s dilemma.” Harvard Business School Press, Cambridge, Mass. (1997).
Chesbrough, H. "Open innovation." Harvard Business Publishing (2003).
Cremers, K.M., Nair, V.B. and Wei, C. “Governance mechanisms and bond prices.” The Review of Financial Studies, 20, no. 5 (2007): 1359-1388.
deHaan, E., Larcker, D.F. and McClure, C.. “Long-Term Economic Consequences of Hedge Fund Activist Interventions.” Rock Center for Corporate Governance at Stanford University Working Paper, (236).
Davis, S.J., Haltiwanger, J., Handley, K., Jarmin, R., Lerner, J. and Miranda, J. “Private equity, jobs, and productivity.” American Economic Review, 104, no. 12 (2014): 3956-90.
Doidge, C., Kahle, K.M., Karolyi, G.A. and Stulz, R.M., 2018. “Eclipse of the public corporation or eclipse of the public markets?.” Journal of Applied Corporate Finance, 30, no. 1 (2018): 8-16.
Edmans, A. and Holderness, C.G. “Blockholders: A survey of theory and evidence.” (2017).
Ernst & Young, Oxford University Saϊd Business School. “The state of the debate on purpose in business.” EY Beacon Institute, May, 2016
Feldman, N.E., Kawano, L., Patel, E., Rao, N., Stevens, M. and Edgerton, J. “The Long and the Short of It: Do Public and Private Firms Invest Differently?” Working Paper (2018).
Garrett, J, Hoitash R, and Prawitt DF. “Trust and financial reporting quality.” Journal of Accounting Research. 52, no. 5 (2014): 1087-1125.
Gartenberg, C.M., Prat, A. and Serafeim, G. “Corporate purpose and financial performance.” Organization Science, 30 no. 1 (2019): 1-18.
Gilje, E.P. and Taillard, J.P. “Do private firms invest differently than public firms? Taking cues from the natural gas industry.” The Journal of Finance, 71, no. 4 (2016): 1733-1778.
Grossman, S.J. and Hart, O.D. “The costs and benefits of ownership: A theory of vertical and lateral integration.” Journal of political economy, 94, no. 4 (1986): 691-719.
Guiso, L, Sapienza P, and Zingales L. "The value of corporate culture." Journal of Financial Economics 117, no. 1 (2015): 60-76.
43
Hart, O. and Zingales, L. “Companies should maximize shareholder welfare not market value.” (2017).
Henderson, R, and Van den Steen E. "Why Do Firms Have “Purpose”? The Firm's Role as a Carrier of Identity and Reputation." The American Economic Review 105, no. 5 (2015): 326-330.
Hollensbe, E, Wookey C, Hickey L, George G, and Nichols CV. "Organizations with purpose." Academy of Management Journal 57, no. 5 (2014): 1227-1234.
Jensen, MC., and Meckling WH. "Theory of the firm: Managerial behavior, agency costs and ownership structure." Journal of Financial Economics 3.4 (1976): 305-360.
Kahle, K.M. and Stulz, R.M. “Is the US public corporation in trouble?” Journal of Economic Perspectives, 31, no. 3 (2017): 67-88.
Lerner, J., Sorensen, M. and Strömberg, P. “Private equity and long-run investment: The case of innovation.” The Journal of Finance, 66, no. 2 (2011): 445-477.
Maksimovic, V., Phillips, G.M. and Yang, L. “Do Public Firms Respond to Investment Opportunities More than Private Firms? The Impact of Initial Firm Quality.” National Bureau of Economic Research. No. w24104 (2017).
McCahery, J.A., Sautner, Z. and Starks, L.T. “Behind the scenes: The corporate governance preferences of institutional investors.” The Journal of Finance, 71, no. 6 (2016): 2905-2932.
Nickerson, JA., and Zenger TR. "Envy, comparison costs, and the economic theory of the firm." Strategic Management Journal 29, no. 13 (2008): 1429-1449.
Pratt, MG., and Ashforth BE. "Fostering meaningfulness in working and at work." Positive organizational scholarship: Foundations of a new discipline. (2003): 309-327.
Santos, F.M. and Eisenhardt, K.M. “Organizational boundaries and theories of organization.” Organization science, 16, no. 5 (2005): 491-508.
Thakor, AV., and Quinn RE. "The economics of higher purpose." ECGI-Finance Working Paper 395 (2013).
Trostel, A.O. and Nichols, M.L. “Privately-held and publicly-held companies: A comparison of strategic choices and management processes.” Academy of Management Journal, 25 no. 1 (1982): 47-62.
Wang, Z., Brush, T. and Ren, C., 2017. “How Do Blockholders Hurt the Firm? The Case of Cumulative Voting.” Academy of Management Proceedings, 2017, no. 1 (2017): 11152.

44
Figure 1: Corporate purpose by ownership type
Y axis represents corporate purpose relative to private (non-PE) companies.
-.1-.0
50
.05
Cor
pora
te p
urpo
se
Public Parent Public PEowner

45
Figure 2: Corporate purpose by job level
-.1-.0
50
.05
Cor
pora
te p
urpo
se
Execs Sales Mid mgr Prof/Tech Hourly
Public companies
-.1-.0
50
.05
Cor
pora
te p
urpo
se
Execs Sales Mid mgr Prof/Tech Hourly
Public parent
-.1-.0
50
.05
Cor
pora
te p
urpo
se
Execs Sales Mid mgr Prof/Tech Hourly
Private Equity

46
Figure 3: Corporate Purpose by Blockholder Concentration
Figure 4: Purpose by owner type
-.1-.0
50
.05
Cor
pora
te p
urpo
se
.1 .2 .3 .4 .5Pct shares held by top 5 shareholders
-.1-.0
50
.05
Cor
pora
te p
urpo
se
Public (Low conc) Public (High con-Low Hedge) Public (High conc-High Hedge)

47
Figure 5: Purpose by CEO-employee pay gap
Figure 6: Purpose gap versus pay gap
.05
.1.1
5.2
Exec
utive
-all s
ubor
dina
te p
urpo
se g
ap
3.5 4 4.5 5CEO-employee pay gap

48
Table 1: Summary Statistics
Panel A: Frequency by Year
Year No. Obs. 2006 324 2007 325 2008 304 2009 260 2010 241 2011 224 2012 197 2013 196 2014 204 2015 198 2016 189
Panel B: Frequency by Industry
Industry No. Obs. Advertising & Marketing 23 Aerospace 20 Agriculture 18 Biotechnology & Pharmaceuticals 84 Construction & Real Estate 190 Education & Training 19 Electronics 19 Engineering 2 Financial Services & Insurance 388 Health Care 124 Hospitality 179 Industrial Services 31 Information Technology 249 Manufacturing & Production 477 Media 59 Mining and Quarrying 5 Other 16 Professional Services 310 Retail 341 Telecommunications 51 Transportation 57

49
Panel C: Frequency by Ownership Type
Ownership Type No. Obs. Public 1,526 Private 1,136
Private only 814 Private w/ public owner 174 Private equity owner 148
Panel D:
Variable No. Obs. Mean Median q1 q3 Stand. Dev. Sales 2,662 10,716 2,383 644 8,298 42,690 Full-time employees 2,662 15,739 4,754 1,935 13,893 34,659 Corporate Purpose 2,662 -0.0075 0.0051 -0.1002 0.0993 0.1586
Panel A presents number of observations in our sample by year. Panel B presents number of observations in our sample by industry. Panel C presents number of observations in our sample by ownership type. Private only firms are not publicly listed, do not have institutional investors and are not owned by a public company. Private w/ public owner firms’ ultimate owners are publicly listed firms. Private equity owner firms’ ultimate owners are private equity firms. Panel D presents summary statistics for key variables. Sales is total worldwide revenue in latest fiscal year. Full-time employees are full-time employees.
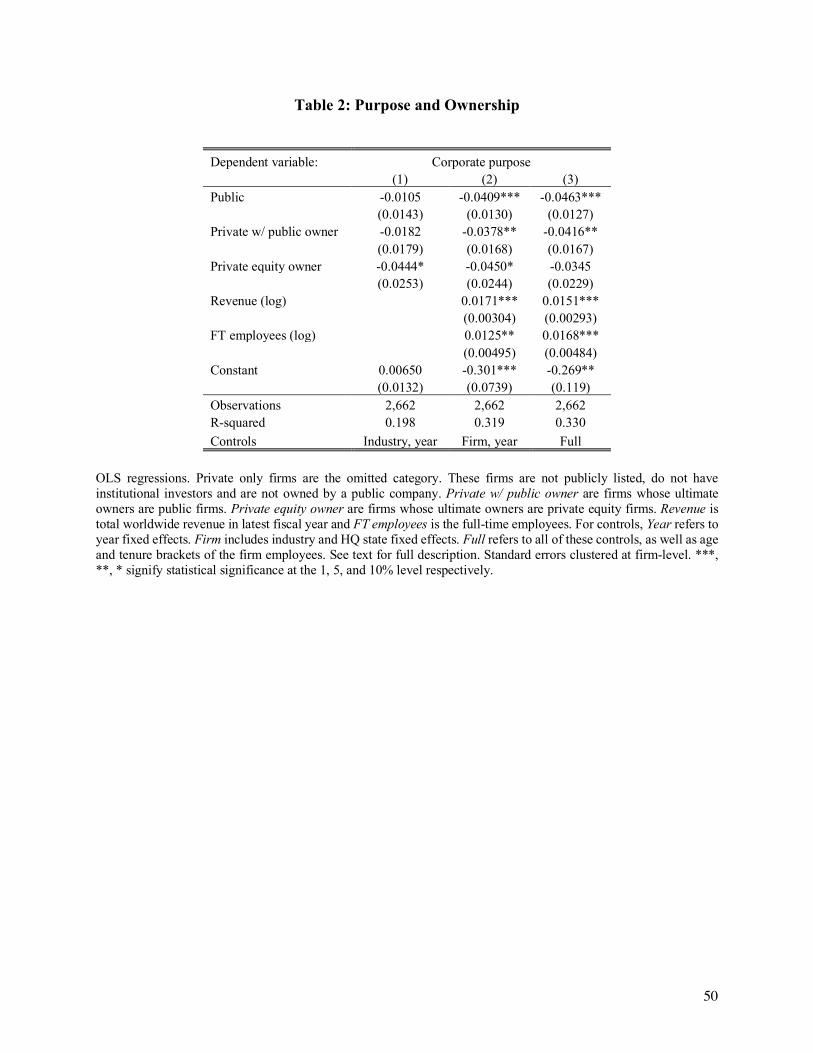
50
Table 2: Purpose and Ownership
Dependent variable: Corporate purpose (1) (2) (3) Public -0.0105 -0.0409*** -0.0463*** (0.0143) (0.0130) (0.0127) Private w/ public owner -0.0182 -0.0378** -0.0416** (0.0179) (0.0168) (0.0167) Private equity owner -0.0444* -0.0450* -0.0345 (0.0253) (0.0244) (0.0229) Revenue (log) 0.0171*** 0.0151*** (0.00304) (0.00293) FT employees (log) 0.0125** 0.0168*** (0.00495) (0.00484) Constant 0.00650 -0.301*** -0.269** (0.0132) (0.0739) (0.119) Observations 2,662 2,662 2,662 R-squared 0.198 0.319 0.330 Controls Industry, year Firm, year Full
OLS regressions. Private only firms are the omitted category. These firms are not publicly listed, do not have institutional investors and are not owned by a public company. Private w/ public owner are firms whose ultimate owners are public firms. Private equity owner are firms whose ultimate owners are private equity firms. Revenue is total worldwide revenue in latest fiscal year and FT employees is the full-time employees. For controls, Year refers to year fixed effects. Firm includes industry and HQ state fixed effects. Full refers to all of these controls, as well as age and tenure brackets of the firm employees. See text for full description. Standard errors clustered at firm-level. ***, **, * signify statistical significance at the 1, 5, and 10% level respectively.

51
Table 3: Purpose by Job Level and Ownership
Dependent variable: Corporate purpose Job level: Executives Sales Mid mgr Prof/Tech Hourly (1) (2) (3) (4) (5) Public -0.0147 -0.0344* -0.0308** -0.0502*** -0.0608*** (0.0131) (0.0202) (0.0127) (0.0138) (0.0125) Private w/ public owner -0.0134 -0.0446 -0.0490*** -0.0389** -0.0579*** (0.0218) (0.0353) (0.0180) (0.0193) (0.0178) Private equity owner -0.0528** 0.0113 -0.0369** -0.0282 -0.0299 (0.0218) (0.0341) (0.0177) (0.0235) (0.0227) Revenue (log) 0.0117*** 0.0121*** 0.0149*** 0.0141*** 0.0123*** (0.00310) (0.00456) (0.00301) (0.00322) (0.00266) FT employees (log) 0.0379*** 0.0114 0.0260*** 0.0156*** 0.0116** (0.00485) (0.00785) (0.00472) (0.00526) (0.00480) Constant -0.467** -0.103 -0.324*** -0.358*** -0.112 (0.185) (0.230) (0.119) (0.114) (0.132) Observations 2,611 2,107 2,638 2,612 2,641 R-squared 0.196 0.142 0.259 0.211 0.294 Controls Full Full Full Full Full
OLS regressions. Corporate purpose is calculated at each respective job level: executive, middle management, professional/technical, hourly and sales. See Table 2 for variable definitions. Standard errors clustered at firm-level. ***, **, * signify statistical significance at the 1, 5, and 10% level respectively.

52
Table 4: Purpose and Blockholder Ownership
Panel A: Role of Ownership Concentration
Dependent variable: Corporate purpose (1) (2) (3) (4) Public (low ownership) 0.0141 -0.0116 -0.0170 -0.0197 (0.0168) (0.0151) (0.0145) (0.0144) Public (high ownership) -0.0316** -0.0494*** -0.0544*** -0.0561*** (0.0136) (0.0124) (0.0122) (0.0123) Private w/ public owner -0.0166 -0.0277* -0.0304* -0.0303* (0.0169) (0.0158) (0.0156) (0.0156) Private equity owner -0.0430* -0.0376 -0.0267 -0.0266 (0.0245) (0.0239) (0.0224) (0.0224) Public family firm 0.0332 (0.0203) Constant 0.00430 -0.295*** -0.260** -0.261** (0.0114) (0.0755) (0.121) (0.122) Observations 2,662 2,662 2,662 2,662 R-squared 0.207 0.322 0.333 0.335 Controls Year Year Firm Full Full
OLS regressions. Low (high) ownership are calculated by above (below) median total ownership of top five investors. See Table 2 for variable definitions. Standard errors clustered at firm-level. ***, **, * signify statistical significance at the 1, 5, and 10% level respectively.
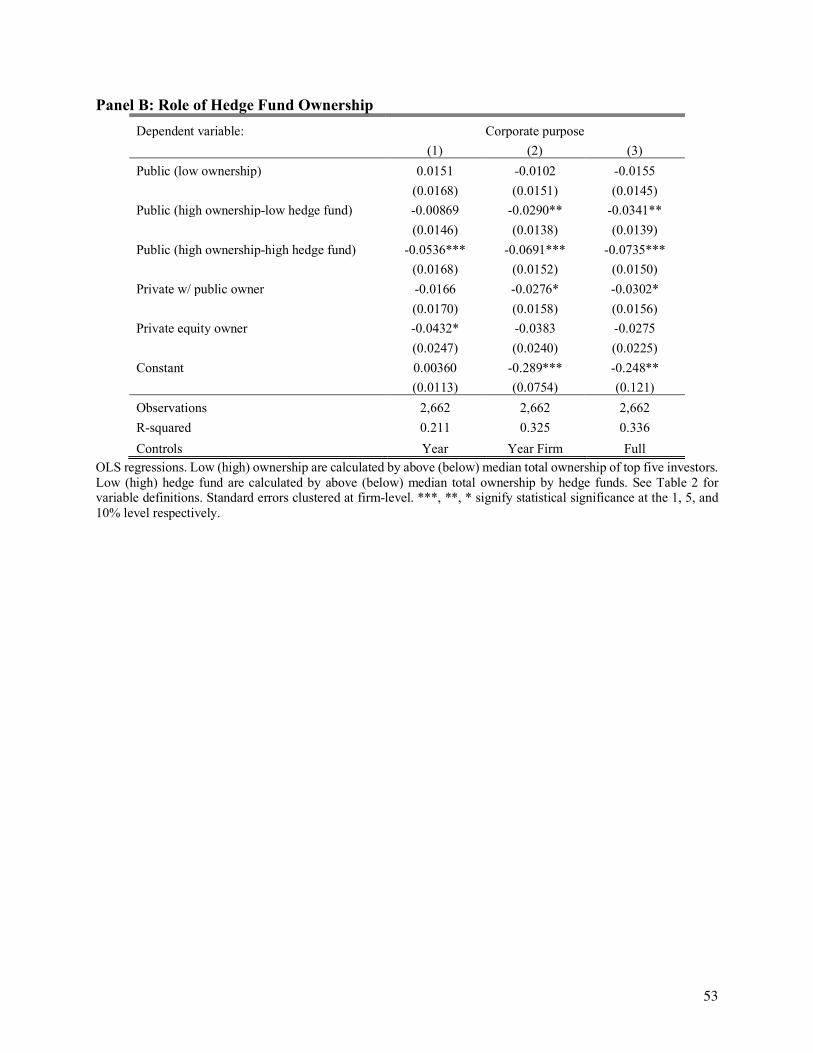
53
Panel B: Role of Hedge Fund Ownership
Dependent variable: Corporate purpose (1) (2) (3) Public (low ownership) 0.0151 -0.0102 -0.0155 (0.0168) (0.0151) (0.0145) Public (high ownership-low hedge fund) -0.00869 -0.0290** -0.0341** (0.0146) (0.0138) (0.0139) Public (high ownership-high hedge fund) -0.0536*** -0.0691*** -0.0735*** (0.0168) (0.0152) (0.0150) Private w/ public owner -0.0166 -0.0276* -0.0302* (0.0170) (0.0158) (0.0156) Private equity owner -0.0432* -0.0383 -0.0275 (0.0247) (0.0240) (0.0225) Constant 0.00360 -0.289*** -0.248** (0.0113) (0.0754) (0.121) Observations 2,662 2,662 2,662 R-squared 0.211 0.325 0.336 Controls Year Year Firm Full
OLS regressions. Low (high) ownership are calculated by above (below) median total ownership of top five investors. Low (high) hedge fund are calculated by above (below) median total ownership by hedge funds. See Table 2 for variable definitions. Standard errors clustered at firm-level. ***, **, * signify statistical significance at the 1, 5, and 10% level respectively.

54
Public C: Lead-lag Analyses
Dependent variable: Corporate purpose
Low / high concentration Low / high concentration
with hedge fund ownership (1) (2) (3) (4) (5) (6) Lag Public (low ownership) 0.0165 -0.0201 -0.0283 -0.0266 -0.0189 -0.0266 (0.0250) (0.0247) (0.0244) (0.0239) (0.0245) (0.0239) Public (high ownership) -0.0194 -0.0522** -0.0602** (0.0244) (0.0242) (0.0248) Public (high ownership-low hedge fund) -0.0372 -0.0317 -0.0372 (0.0235) (0.0230) (0.0235) Public (high ownership-high hedge fund) -0.0906*** -0.0805*** -0.0906*** (0.0293) (0.0291) (0.0293) Lead Public (low ownership) 0.00628 0.00964 0.00607 0.00913 0.0128 0.00913 (0.0288) (0.0273) (0.0264) (0.0266) (0.0273) (0.0266) Public (high ownership) -0.0312 -0.0167 -0.0215 (0.0238) (0.0221) (0.0227) Public (high ownership-low hedge fund) -0.00388 0.00159 -0.00388 (0.0264) (0.0256) (0.0264) Public (high ownership-high hedge fund) -0.0375 -0.0333 -0.0375 (0.0235) (0.0229) (0.0235) Other (Private) Private w/ public owner -0.0228 -0.0530 -0.0588 -0.0587 -0.0530 -0.0587 (0.0364) (0.0369) (0.0376) (0.0383) (0.0373) (0.0383) Private equity owner 0.00630 0.0207 0.0384 0.0408 0.0230 0.0408 (0.0390) (0.0475) (0.0387) (0.0392) (0.0482) (0.0392) Constant 0.0237 -0.110* -0.123 -0.222 -0.0827 -0.0737 (0.0190) (0.0634) (0.127) (0.135) (0.0603) (0.133) Observations 1,005 1,005 1,005 1,005 1,005 1,005 R-squared 0.224 0.447 0.467 0.477 0.455 0.477 Controls Year Year Firm Full Year Year Firm Full
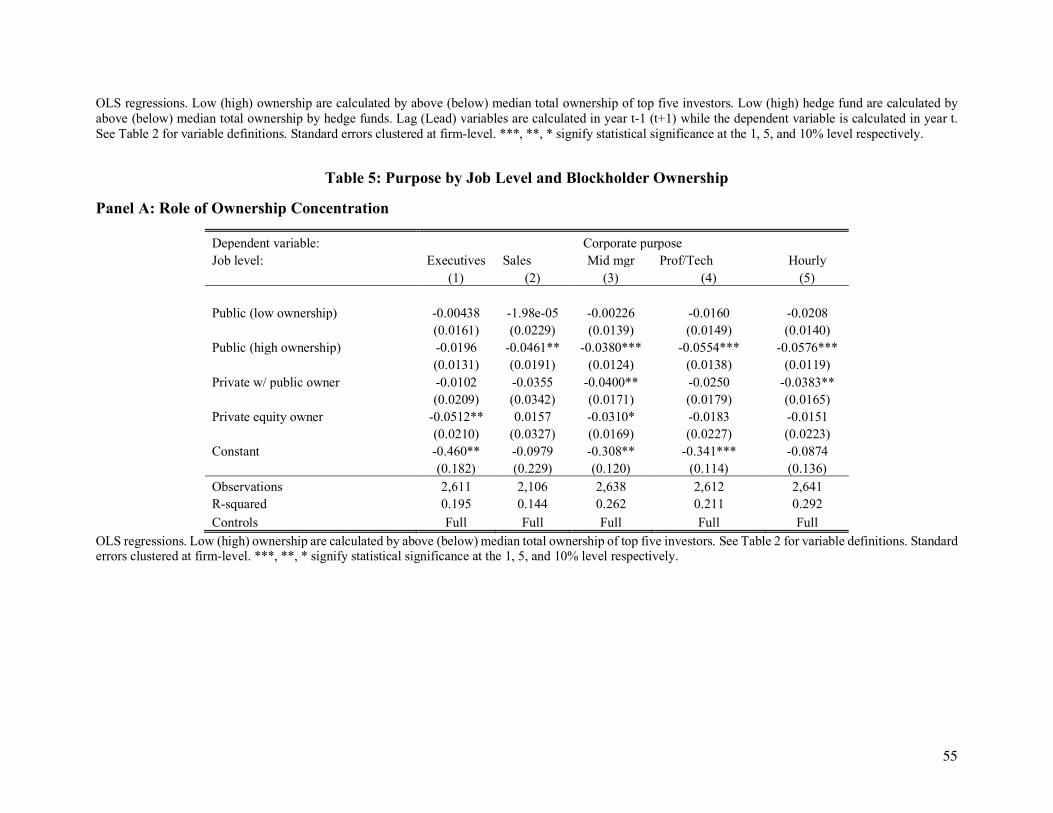
55
OLS regressions. Low (high) ownership are calculated by above (below) median total ownership of top five investors. Low (high) hedge fund are calculated by above (below) median total ownership by hedge funds. Lag (Lead) variables are calculated in year t-1 (t+1) while the dependent variable is calculated in year t. See Table 2 for variable definitions. Standard errors clustered at firm-level. ***, **, * signify statistical significance at the 1, 5, and 10% level respectively.
Table 5: Purpose by Job Level and Blockholder Ownership
Panel A: Role of Ownership Concentration
Dependent variable: Corporate purpose Job level: Executives Sales Mid mgr Prof/Tech Hourly (1) (2) (3) (4) (5) Public (low ownership) -0.00438 -1.98e-05 -0.00226 -0.0160 -0.0208 (0.0161) (0.0229) (0.0139) (0.0149) (0.0140) Public (high ownership) -0.0196 -0.0461** -0.0380*** -0.0554*** -0.0576*** (0.0131) (0.0191) (0.0124) (0.0138) (0.0119) Private w/ public owner -0.0102 -0.0355 -0.0400** -0.0250 -0.0383** (0.0209) (0.0342) (0.0171) (0.0179) (0.0165) Private equity owner -0.0512** 0.0157 -0.0310* -0.0183 -0.0151 (0.0210) (0.0327) (0.0169) (0.0227) (0.0223) Constant -0.460** -0.0979 -0.308** -0.341*** -0.0874 (0.182) (0.229) (0.120) (0.114) (0.136) Observations 2,611 2,106 2,638 2,612 2,641 R-squared 0.195 0.144 0.262 0.211 0.292 Controls Full Full Full Full Full
OLS regressions. Low (high) ownership are calculated by above (below) median total ownership of top five investors. See Table 2 for variable definitions. Standard errors clustered at firm-level. ***, **, * signify statistical significance at the 1, 5, and 10% level respectively.
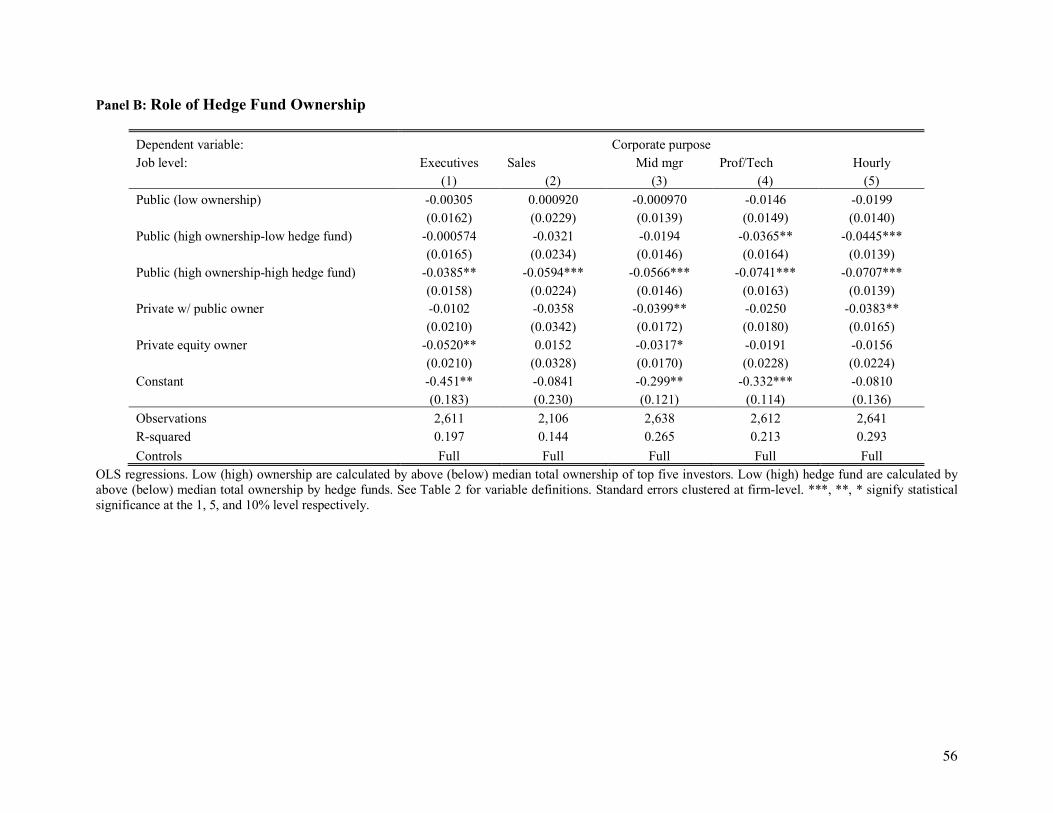
56
Panel B: Role of Hedge Fund Ownership
Dependent variable: Corporate purpose Job level: Executives Sales Mid mgr Prof/Tech Hourly (1) (2) (3) (4) (5) Public (low ownership) -0.00305 0.000920 -0.000970 -0.0146 -0.0199 (0.0162) (0.0229) (0.0139) (0.0149) (0.0140) Public (high ownership-low hedge fund) -0.000574 -0.0321 -0.0194 -0.0365** -0.0445*** (0.0165) (0.0234) (0.0146) (0.0164) (0.0139) Public (high ownership-high hedge fund) -0.0385** -0.0594*** -0.0566*** -0.0741*** -0.0707*** (0.0158) (0.0224) (0.0146) (0.0163) (0.0139) Private w/ public owner -0.0102 -0.0358 -0.0399** -0.0250 -0.0383** (0.0210) (0.0342) (0.0172) (0.0180) (0.0165) Private equity owner -0.0520** 0.0152 -0.0317* -0.0191 -0.0156 (0.0210) (0.0328) (0.0170) (0.0228) (0.0224) Constant -0.451** -0.0841 -0.299** -0.332*** -0.0810 (0.183) (0.230) (0.121) (0.114) (0.136) Observations 2,611 2,106 2,638 2,612 2,641 R-squared 0.197 0.144 0.265 0.213 0.293 Controls Full Full Full Full Full
OLS regressions. Low (high) ownership are calculated by above (below) median total ownership of top five investors. Low (high) hedge fund are calculated by above (below) median total ownership by hedge funds. See Table 2 for variable definitions. Standard errors clustered at firm-level. ***, **, * signify statistical significance at the 1, 5, and 10% level respectively.

57
Panel C: Lead-lag Analyses
Dependent variable: Corporate purpose Executives Sales Mid mgr Prof/Tech Hourly (1) (2) (3) (4) (5) Lagged Public (low ownership) -0.0139 -0.0675 0.00794 -0.0213 -0.0418* (0.0489) (0.0613) (0.0271) (0.0270) (0.0250) Public (high ownership) -0.0126 -0.0485 -0.0244 -0.0839*** -0.0632** (0.0499) (0.0593) (0.0268) (0.0269) (0.0253) Forward Public (low ownership) 0.00249 0.0484 -0.0207 -0.0167 0.0306 (0.0517) (0.0642) (0.0270) (0.0272) (0.0261) Public (high ownership) -0.0373 -0.00248 -0.0449* -0.0141 -0.0148 (0.0471) (0.0594) (0.0243) (0.0243) (0.0246) Other (Private) Private w/ public owner -0.0368 -0.000720 -0.0980** -0.0715* -0.0486 (0.0395) (0.0773) (0.0399) (0.0392) (0.0389) Private equity owner -0.0612 0.113* 0.0103 0.0539 0.0314 (0.0425) (0.0645) (0.0315) (0.0398) (0.0376) Constant -0.402** 0.0535 -0.253* -0.185 -0.0539 (0.163) (0.282) (0.132) (0.121) (0.154) Observations 981 774 993 980 994 R-squared 0.321 0.278 0.399 0.375 0.403 Controls Full Full Full Full Full
OLS regressions. Low (high) ownership are calculated by above (below) median total ownership of top five investors. Low (high) hedge fund are calculated by above (below) median total ownership by hedge funds. Lag (Lead) variables are calculated in year t-1 (t+1) while the dependent variable is calculated in year t. See Table 2 for variable definitions. Standard errors clustered at firm-level. ***, **, * signify statistical significance at the 1, 5, and 10% level respectively.

58
Table 6: IPWRA average treatment effect
Panel A: Difference by Ownership Concentration
Dependent variable: Corporate purpose Firm-wide Executives Sales Mid mgr Prof/Tech Hourly (1) (2) (3) (4) (5) (6) Public (low ownership) versus Private -0.0148 0.00789 0.0113 -0.00229 -0.0169 -0.0138 (0.0141) (0.0168) (0.0226) (0.0125) (0.0143) (0.0133) Public (high ownership) versus Private -0.0399*** -0.0207* -0.0270 -0.0337*** -0.0404*** -0.0447*** (0.0106) (0.0121) (0.0179) (0.0108) (0.0122) (0.0108) Observations 2,662 2,611 2,106 2,638 2,612 2,641 Controls Full Full Full Full Full Full
Panel B: Difference by Ownership Concentration and Investor Type
Dependent variable: Corporate purpose Firm-wide Executives Sales Mid mgr Prof/Tech Hourly (1) (2) (3) (4) (5) (6) Public (low ownership) versus Private -0.0152 0.00646 0.0110 -0.00278 -0.0172 -0.0146 (0.0136) (0.0162) (0.0227) (0.0124) (0.0142) (0.0134) Public (high ownership-low hedge fund) versus Private -0.0234** -0.00369 -0.00191 -0.0205* -0.0212 -0.0318*** (0.0114) (0.0139) (0.0197) (0.0120) (0.0136) (0.0115) Public (high ownership-high hedge fund) versus Private -0.0550*** -0.0209 -0.0848*** -0.0376*** -0.0522*** -0.0517*** (0.0120) (0.0168) (0.0253) (0.0125) (0.0137) (0.0124) Observations 2,662 2,611 2,106 2,638 2,612 2,641 Controls Full Full Full Full Full Full
Estimates from OLS regressions after implementing inverse probability weighted regression adjustments matching. Low (high) ownership are calculated by above (below) median total ownership of top five investors. Low (high) hedge fund are calculated by above (below) median total ownership by hedge funds. Lag (Lead) variables are calculated in year t-1 (t+1) while the dependent variable is calculated in year t. See Table 2 for variable definitions. Standard errors clustered at firm-level. ***, **, * signify statistical significance at the 1, 5, and 10% level respectively.

59
Table 7: Purpose and CEO Characteristics
Panel A: Summary Statistics
Ownership CEO-employee pay
gap CEO pay CEO joined in mid or low ranks
CEO years in position
CEO also Chair of Board
CEO years in company
Mean Stand. Dev. Mean Stand. Dev. Mean Stand. Dev. Mean Stand. Dev. Mean Stand. Dev. Mean Stand. Dev. Public 4.11 0.9597 8.53 0.7241 0.3390 0.4735 9.63 8.45 0.4095 0.4919 20.73 11.11 Blockholder ownership
Low ownership 4.11 0.9858 8.55 0.7589 0.3873 0.4875 9.20 8.28 0.4722 0.4996 22.56 11.34 High ownership 4.09 0.9066 8.53 0.7680 0.2831 0.4509 10.31 8.64 0.3813 0.4861 19.09 10.50
Private N/A N/A N/A N/A 0.5399 0.4986 10.82 9.30 0.2441 0.4297 24.17 10.62 Private only N/A N/A N/A N/A 0.6462 0.4784 10.94 9.15 0.2359 0.4248 26.39 9.86 Private w/ public owner N/A N/A N/A N/A 0.2652 0.4427 8.26 6.85 0.2652 0.4427 18.01 10.04 Private equity owner N/A N/A N/A N/A 0.2770 0.4490 13.15 11.68 0.2568 0.4383 19.42 10.88
Table shows mean values and standard deviations for key variables ownership types and blockholder ownership. Blockholder ownership is calculated by total ownership of top five investors. CEO-employee pay gap is the ratio of CEO pay to average employee compensation within the firm, calculated as the difference in the log values of compensation. CEO joined in mid or low ranks identifies firms with CEOs who joined the firm in a non-executive or upper management position. CEO years in position is the number of years the CEO has held the position of CEO. CEO also Chair of Board identifies CEOs who are also the Chair of the Board. CEO years in company is the number of years the CEO has been at the company, regardless of position held.
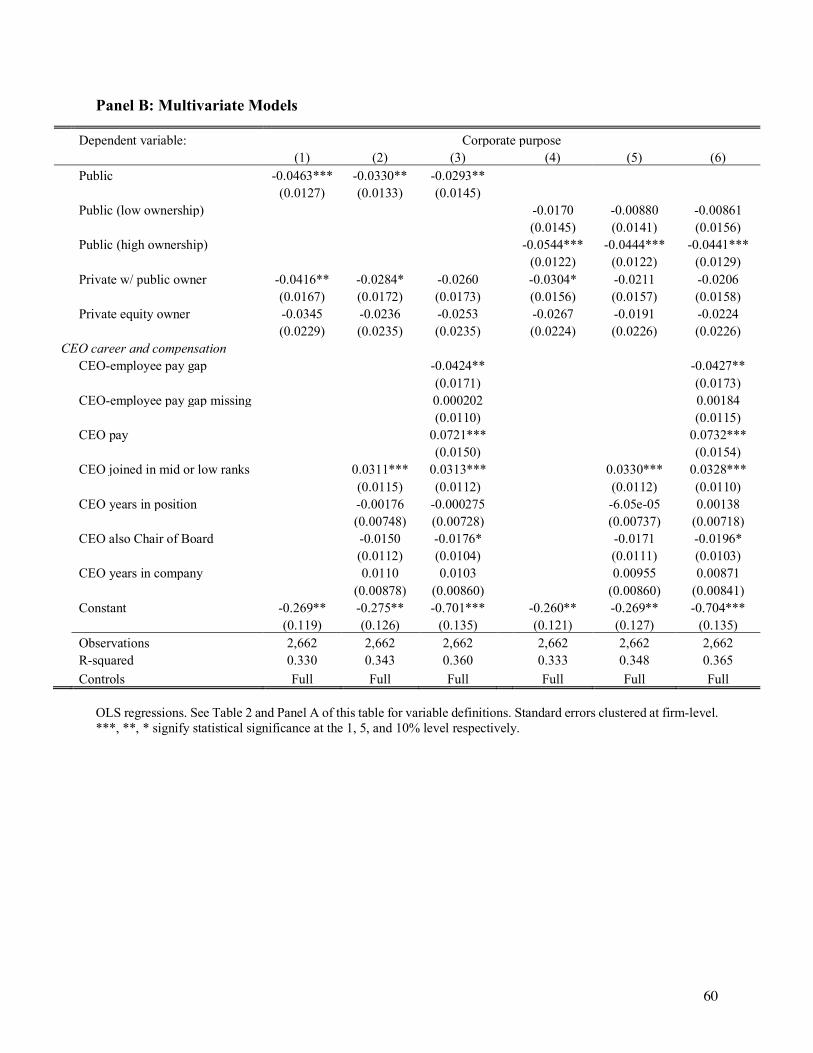
60
Panel B: Multivariate Models
Dependent variable: Corporate purpose (1) (2) (3) (4) (5) (6) Public -0.0463*** -0.0330** -0.0293** (0.0127) (0.0133) (0.0145) Public (low ownership) -0.0170 -0.00880 -0.00861 (0.0145) (0.0141) (0.0156) Public (high ownership) -0.0544*** -0.0444*** -0.0441*** (0.0122) (0.0122) (0.0129) Private w/ public owner -0.0416** -0.0284* -0.0260 -0.0304* -0.0211 -0.0206 (0.0167) (0.0172) (0.0173) (0.0156) (0.0157) (0.0158) Private equity owner -0.0345 -0.0236 -0.0253 -0.0267 -0.0191 -0.0224 (0.0229) (0.0235) (0.0235) (0.0224) (0.0226) (0.0226) CEO career and compensation CEO-employee pay gap -0.0424** -0.0427** (0.0171) (0.0173) CEO-employee pay gap missing 0.000202 0.00184 (0.0110) (0.0115) CEO pay 0.0721*** 0.0732*** (0.0150) (0.0154) CEO joined in mid or low ranks 0.0311*** 0.0313*** 0.0330*** 0.0328*** (0.0115) (0.0112) (0.0112) (0.0110) CEO years in position -0.00176 -0.000275 -6.05e-05 0.00138 (0.00748) (0.00728) (0.00737) (0.00718) CEO also Chair of Board -0.0150 -0.0176* -0.0171 -0.0196* (0.0112) (0.0104) (0.0111) (0.0103) CEO years in company 0.0110 0.0103 0.00955 0.00871 (0.00878) (0.00860) (0.00860) (0.00841) Constant -0.269** -0.275** -0.701*** -0.260** -0.269** -0.704*** (0.119) (0.126) (0.135) (0.121) (0.127) (0.135) Observations 2,662 2,662 2,662 2,662 2,662 2,662 R-squared 0.330 0.343 0.360 0.333 0.348 0.365 Controls Full Full Full Full Full Full
OLS regressions. See Table 2 and Panel A of this table for variable definitions. Standard errors clustered at firm-level. ***, **, * signify statistical significance at the 1, 5, and 10% level respectively.
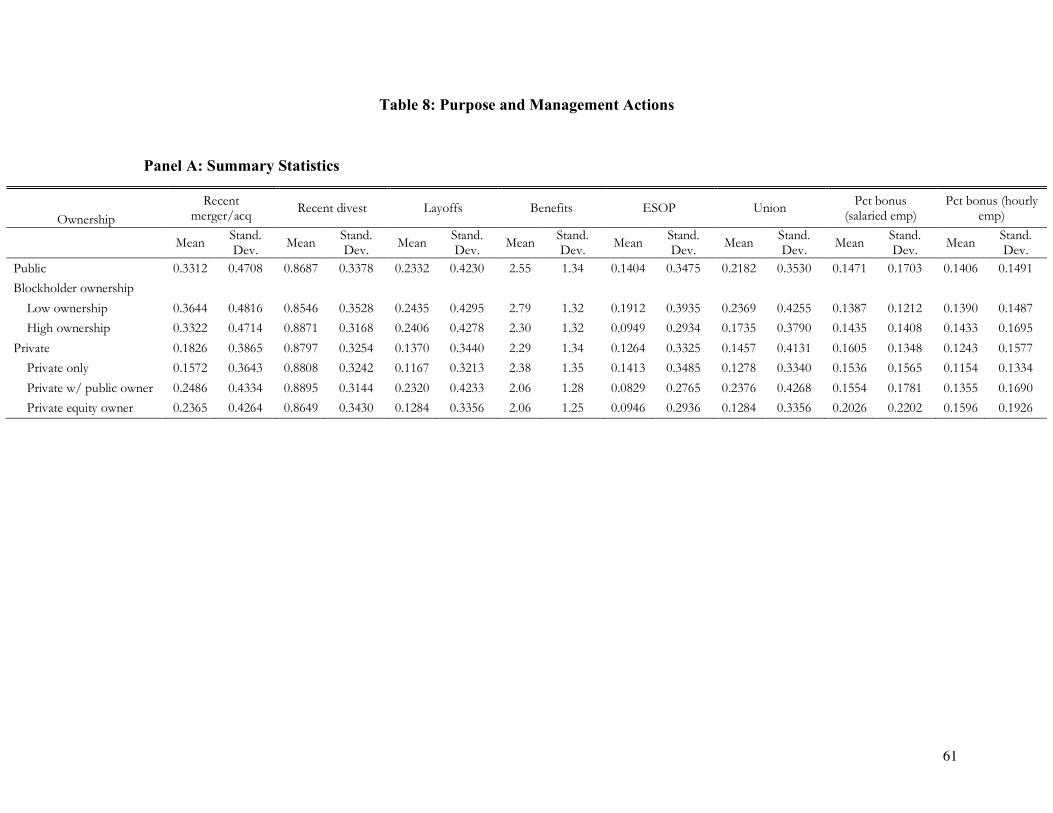
61
Table 8: Purpose and Management Actions
Panel A: Summary Statistics
Ownership Recent
merger/acq Recent divest Layoffs Benefits ESOP Union Pct bonus (salaried emp)
Pct bonus (hourly emp)
Mean Stand. Dev. Mean Stand.
Dev. Mean Stand. Dev. Mean Stand.
Dev. Mean Stand. Dev. Mean Stand.
Dev. Mean Stand. Dev. Mean Stand.
Dev. Public 0.3312 0.4708 0.8687 0.3378 0.2332 0.4230 2.55 1.34 0.1404 0.3475 0.2182 0.3530 0.1471 0.1703 0.1406 0.1491 Blockholder ownership
Low ownership 0.3644 0.4816 0.8546 0.3528 0.2435 0.4295 2.79 1.32 0.1912 0.3935 0.2369 0.4255 0.1387 0.1212 0.1390 0.1487 High ownership 0.3322 0.4714 0.8871 0.3168 0.2406 0.4278 2.30 1.32 0.0949 0.2934 0.1735 0.3790 0.1435 0.1408 0.1433 0.1695
Private 0.1826 0.3865 0.8797 0.3254 0.1370 0.3440 2.29 1.34 0.1264 0.3325 0.1457 0.4131 0.1605 0.1348 0.1243 0.1577 Private only 0.1572 0.3643 0.8808 0.3242 0.1167 0.3213 2.38 1.35 0.1413 0.3485 0.1278 0.3340 0.1536 0.1565 0.1154 0.1334 Private w/ public owner 0.2486 0.4334 0.8895 0.3144 0.2320 0.4233 2.06 1.28 0.0829 0.2765 0.2376 0.4268 0.1554 0.1781 0.1355 0.1690 Private equity owner 0.2365 0.4264 0.8649 0.3430 0.1284 0.3356 2.06 1.25 0.0946 0.2936 0.1284 0.3356 0.2026 0.2202 0.1596 0.1926
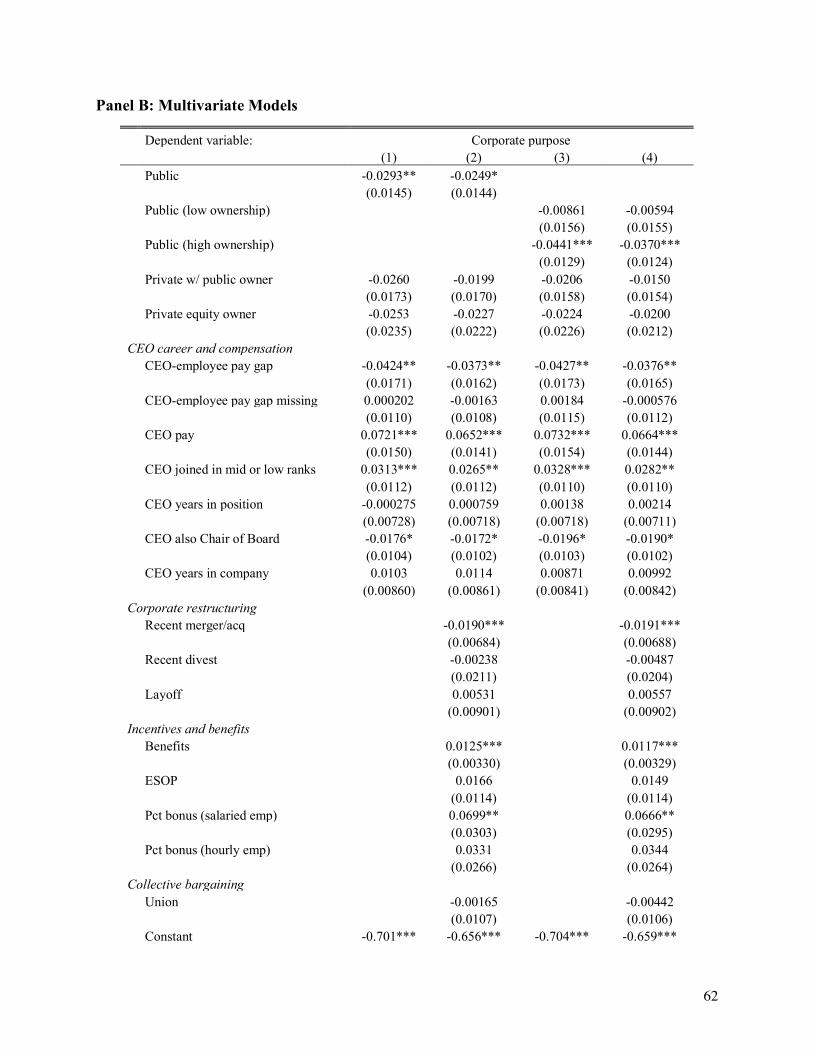
62
Panel B: Multivariate Models
Dependent variable: Corporate purpose (1) (2) (3) (4) Public -0.0293** -0.0249* (0.0145) (0.0144) Public (low ownership) -0.00861 -0.00594 (0.0156) (0.0155) Public (high ownership) -0.0441*** -0.0370*** (0.0129) (0.0124) Private w/ public owner -0.0260 -0.0199 -0.0206 -0.0150 (0.0173) (0.0170) (0.0158) (0.0154) Private equity owner -0.0253 -0.0227 -0.0224 -0.0200 (0.0235) (0.0222) (0.0226) (0.0212) CEO career and compensation CEO-employee pay gap -0.0424** -0.0373** -0.0427** -0.0376** (0.0171) (0.0162) (0.0173) (0.0165) CEO-employee pay gap missing 0.000202 -0.00163 0.00184 -0.000576 (0.0110) (0.0108) (0.0115) (0.0112) CEO pay 0.0721*** 0.0652*** 0.0732*** 0.0664*** (0.0150) (0.0141) (0.0154) (0.0144) CEO joined in mid or low ranks 0.0313*** 0.0265** 0.0328*** 0.0282** (0.0112) (0.0112) (0.0110) (0.0110) CEO years in position -0.000275 0.000759 0.00138 0.00214 (0.00728) (0.00718) (0.00718) (0.00711) CEO also Chair of Board -0.0176* -0.0172* -0.0196* -0.0190* (0.0104) (0.0102) (0.0103) (0.0102) CEO years in company 0.0103 0.0114 0.00871 0.00992 (0.00860) (0.00861) (0.00841) (0.00842) Corporate restructuring Recent merger/acq -0.0190*** -0.0191*** (0.00684) (0.00688) Recent divest -0.00238 -0.00487 (0.0211) (0.0204) Layoff 0.00531 0.00557 (0.00901) (0.00902) Incentives and benefits Benefits 0.0125*** 0.0117*** (0.00330) (0.00329) ESOP 0.0166 0.0149 (0.0114) (0.0114) Pct bonus (salaried emp) 0.0699** 0.0666** (0.0303) (0.0295) Pct bonus (hourly emp) 0.0331 0.0344 (0.0266) (0.0264) Collective bargaining Union -0.00165 -0.00442 (0.0107) (0.0106) Constant -0.701*** -0.656*** -0.704*** -0.659***

63
(0.135) (0.132) (0.135) (0.132) Observations 2,662 2,662 2,662 2,662 R-squared 0.360 0.377 0.365 0.381 Controls Full Full Full Full
OLS regressions. See Table 2 and Table 6 Panel A for variable definitions. Recent merger/acq is 0/1 indicator if the company indicates that it has completed a merger or acquisition over the past three to four years. Recent divest is 0/1 indicator if the company indicates it has divested any units over the past three to four years. Layoffs is 0/1 indicator if a company has had a single or combination of layoffs that has reduced the number of employees by 5% of more over the past five years. Benefits is index of indicators whether the company has the following benefits: offers a compressed work week, a flexible work schedule program, telecommute opportunities, onsite childcare and offsite subsidized childcare. ESOP identifies if a company offers an Employee Stock Ownership Plan. Pct bonus is the proportion of total annual salary (base salary and bonus) that is bonus for salaried employees. Union identifies if a company has employees that are covered by a union contract. Standard errors clustered at firm-level. ***, **, * signify statistical significance at the 1, 5, and 10% level respectively.
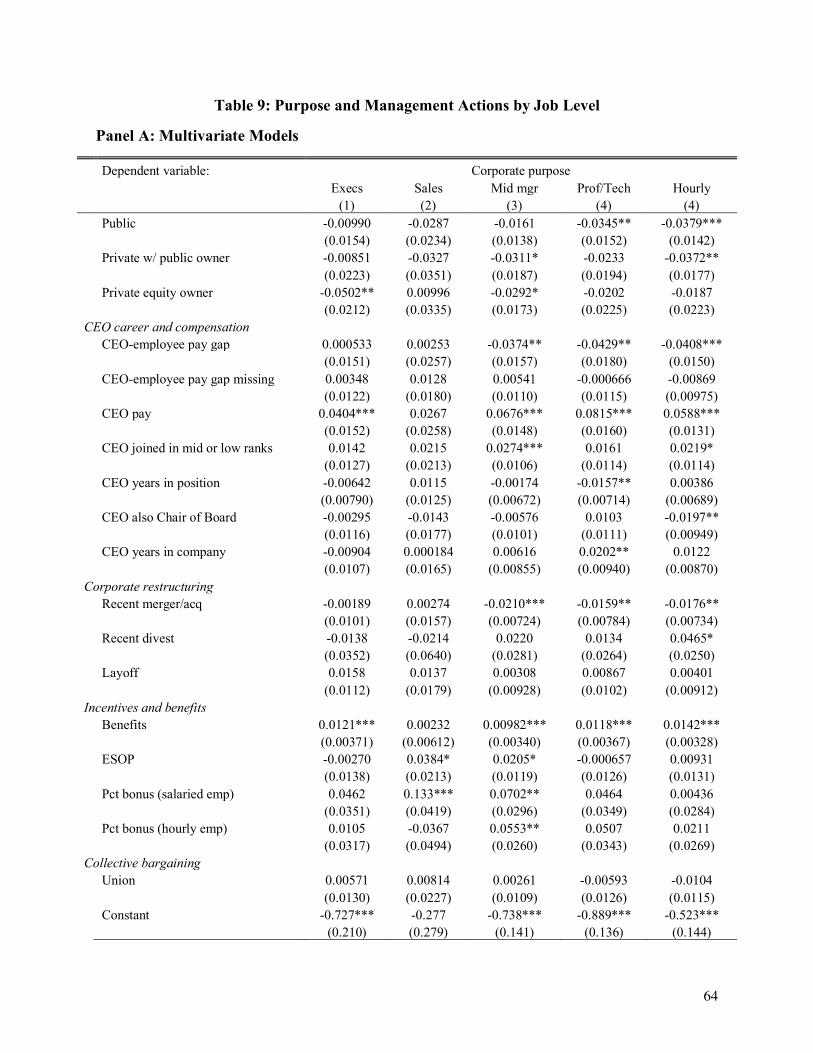
64
Table 9: Purpose and Management Actions by Job Level
Panel A: Multivariate Models
Dependent variable: Corporate purpose Execs Sales Mid mgr Prof/Tech Hourly (1) (2) (3) (4) (4) Public -0.00990 -0.0287 -0.0161 -0.0345** -0.0379*** (0.0154) (0.0234) (0.0138) (0.0152) (0.0142) Private w/ public owner -0.00851 -0.0327 -0.0311* -0.0233 -0.0372** (0.0223) (0.0351) (0.0187) (0.0194) (0.0177) Private equity owner -0.0502** 0.00996 -0.0292* -0.0202 -0.0187 (0.0212) (0.0335) (0.0173) (0.0225) (0.0223) CEO career and compensation CEO-employee pay gap 0.000533 0.00253 -0.0374** -0.0429** -0.0408*** (0.0151) (0.0257) (0.0157) (0.0180) (0.0150) CEO-employee pay gap missing 0.00348 0.0128 0.00541 -0.000666 -0.00869 (0.0122) (0.0180) (0.0110) (0.0115) (0.00975) CEO pay 0.0404*** 0.0267 0.0676*** 0.0815*** 0.0588*** (0.0152) (0.0258) (0.0148) (0.0160) (0.0131) CEO joined in mid or low ranks 0.0142 0.0215 0.0274*** 0.0161 0.0219* (0.0127) (0.0213) (0.0106) (0.0114) (0.0114) CEO years in position -0.00642 0.0115 -0.00174 -0.0157** 0.00386 (0.00790) (0.0125) (0.00672) (0.00714) (0.00689) CEO also Chair of Board -0.00295 -0.0143 -0.00576 0.0103 -0.0197** (0.0116) (0.0177) (0.0101) (0.0111) (0.00949) CEO years in company -0.00904 0.000184 0.00616 0.0202** 0.0122 (0.0107) (0.0165) (0.00855) (0.00940) (0.00870) Corporate restructuring Recent merger/acq -0.00189 0.00274 -0.0210*** -0.0159** -0.0176** (0.0101) (0.0157) (0.00724) (0.00784) (0.00734) Recent divest -0.0138 -0.0214 0.0220 0.0134 0.0465* (0.0352) (0.0640) (0.0281) (0.0264) (0.0250) Layoff 0.0158 0.0137 0.00308 0.00867 0.00401 (0.0112) (0.0179) (0.00928) (0.0102) (0.00912) Incentives and benefits Benefits 0.0121*** 0.00232 0.00982*** 0.0118*** 0.0142*** (0.00371) (0.00612) (0.00340) (0.00367) (0.00328) ESOP -0.00270 0.0384* 0.0205* -0.000657 0.00931 (0.0138) (0.0213) (0.0119) (0.0126) (0.0131) Pct bonus (salaried emp) 0.0462 0.133*** 0.0702** 0.0464 0.00436 (0.0351) (0.0419) (0.0296) (0.0349) (0.0284) Pct bonus (hourly emp) 0.0105 -0.0367 0.0553** 0.0507 0.0211 (0.0317) (0.0494) (0.0260) (0.0343) (0.0269) Collective bargaining Union 0.00571 0.00814 0.00261 -0.00593 -0.0104 (0.0130) (0.0227) (0.0109) (0.0126) (0.0115) Constant -0.727*** -0.277 -0.738*** -0.889*** -0.523*** (0.210) (0.279) (0.141) (0.136) (0.144)

65
Observations 2,602 2,098 2,629 2,603 2,632 R-squared 0.219 0.154 0.302 0.253 0.328 Controls Full Full Full Full Full
Panel B: Multivariate Models with Blockholder Ownership
Dependent variable: Corporate purpose Execs Sales Mid mgr Prof/Tech Hourly (1) (2) (3) (4) (4) Public (low ownership) -0.00339 -0.00117 0.00413 -0.00799 -0.00493 (0.0172) (0.0252) (0.0145) (0.0154) (0.0149) Public (high ownership) -0.0157 -0.0432** -0.0259** -0.0409*** -0.0374*** (0.0145) (0.0208) (0.0127) (0.0143) (0.0129) Private w/ public owner -0.00697 -0.0263 -0.0270 -0.0139 -0.0246 (0.0211) (0.0339) (0.0174) (0.0177) (0.0160) Private equity owner -0.0495** 0.0132 -0.0270* -0.0139 -0.00987 (0.0202) (0.0322) (0.0162) (0.0214) (0.0214) CEO career and compensation CEO-employee pay gap 0.000295 0.00142 -0.0372** -0.0432** -0.0408*** (0.0152) (0.0260) (0.0159) (0.0182) (0.0152) CEO-employee pay gap missing 0.00433 0.0133 0.00494 -0.00181 -0.0125 (0.0123) (0.0185) (0.0114) (0.0120) (0.0105) CEO pay 0.0409*** 0.0286 0.0682*** 0.0829*** 0.0603*** (0.0154) (0.0262) (0.0152) (0.0163) (0.0133) CEO joined in mid or low ranks 0.0148 0.0234 0.0289*** 0.0186* 0.0251** (0.0127) (0.0211) (0.0104) (0.0112) (0.0112) CEO years in position -0.00588 0.0125 -0.000555 -0.0141** 0.00553 (0.00791) (0.0124) (0.00668) (0.00707) (0.00680) CEO also Chair of Board -0.00362 -0.0163 -0.00750 0.00777 -0.0228** (0.0116) (0.0177) (0.0101) (0.0111) (0.00939) CEO years in company -0.00968 -0.00183 0.00473 0.0191** 0.0113 (0.0107) (0.0165) (0.00855) (0.00940) (0.00859) Corporate restructuring Recent merger/acq -0.00187 0.00281 -0.0211*** -0.0161** -0.0181** (0.0101) (0.0157) (0.00725) (0.00788) (0.00734) Recent divest -0.0148 -0.0242 0.0204 0.0103 0.0433* (0.0352) (0.0643) (0.0277) (0.0256) (0.0246) Layoff 0.0159 0.0138 0.00311 0.00871 0.00385 (0.0112) (0.0180) (0.00929) (0.0102) (0.00911) Incentives and benefits Benefits 0.0118*** 0.00117 0.00909*** 0.0109*** 0.0135*** (0.00373) (0.00619) (0.00340) (0.00366) (0.00329) ESOP -0.00334 0.0355* 0.0187 -0.00242 0.00757 (0.0139) (0.0214) (0.0120) (0.0125) (0.0131) Pct bonus (salaried emp) 0.0448 0.129*** 0.0684** 0.0427 0.00187 (0.0352) (0.0414) (0.0293) (0.0344) (0.0277) Pct bonus (hourly emp) 0.0111 -0.0360 0.0565** 0.0524 0.0220 (0.0316) (0.0489) (0.0260) (0.0341) (0.0268)

66
Collective bargaining Union 0.00464 0.00400 0.000343 -0.00974 -0.0146 (0.0130) (0.0227) (0.0108) (0.0125) (0.0113) Constant -0.728*** -0.279 -0.734*** -0.887*** -0.520*** (0.209) (0.278) (0.141) (0.134) (0.145) Observations 2,602 2,098 2,629 2,603 2,632 R-squared 0.219 0.157 0.305 0.255 0.329 Controls Full Full Full Full Full
OLS regressions. See Tables 2, 6 and 7 for variable definitions. Standard errors clustered at firm-level. ***, **, * signify statistical significance at the 1, 5, and 10% level respectively.

67
Table 10: Alternative measures of corporate purpose
Panel A: Purpose Camaraderie
Dependent variable: Purpose-Camaraderie (1) (2) (3) (4) Public -0.0676*** -0.0335 (0.0205) (0.0207) Public (low ownership) -0.0201 0.00594 (0.0204) (0.0201) Public (high ownership) -0.0389** 0.00166 (0.0196) (0.0194) Private w/ public owner -0.0947*** -0.0650** -0.0526* -0.0313 (0.0314) (0.0299) (0.0297) (0.0284) Private equity owner -0.0177 0.00603 0.00508 0.0219 (0.0350) (0.0341) (0.0336) (0.0326) CEO career and compensation CEO-employee pay gap -0.00285 -0.00154 (0.0218) (0.0219) CEO-employee pay gap missing -0.00743 -0.0211 (0.0154) (0.0152) CEO pay -0.000732 -0.000599 (0.0217) (0.0217) CEO joined in mid or low ranks 0.0305* 0.0345** (0.0156) (0.0156) CEO years in position 0.0262*** 0.0270*** (0.00976) (0.00980) CEO also Chair of Board -0.0415*** -0.0448*** (0.0136) (0.0137) CEO years in company 0.00938 0.0110 (0.0145) (0.0145) Corporate restructuring Recent merger/acq -0.00640 -0.00782 (0.0104) (0.0104) Recent divest 0.0432 0.0404 (0.0357) (0.0361) Layoff -0.0527*** -0.0536*** (0.0139) (0.0140) Incentives and benefits Benefits 0.0378*** 0.0382*** (0.00494) (0.00506) ESOP 0.0193 0.0192 (0.0172) (0.0171) Pct bonus (salaried emp) 0.0254 0.0283 (0.0408) (0.0414) Pct bonus (hourly emp) -0.00954 -0.0109 (0.0358) (0.0355) Collective bargaining Union -0.0257 -0.0293
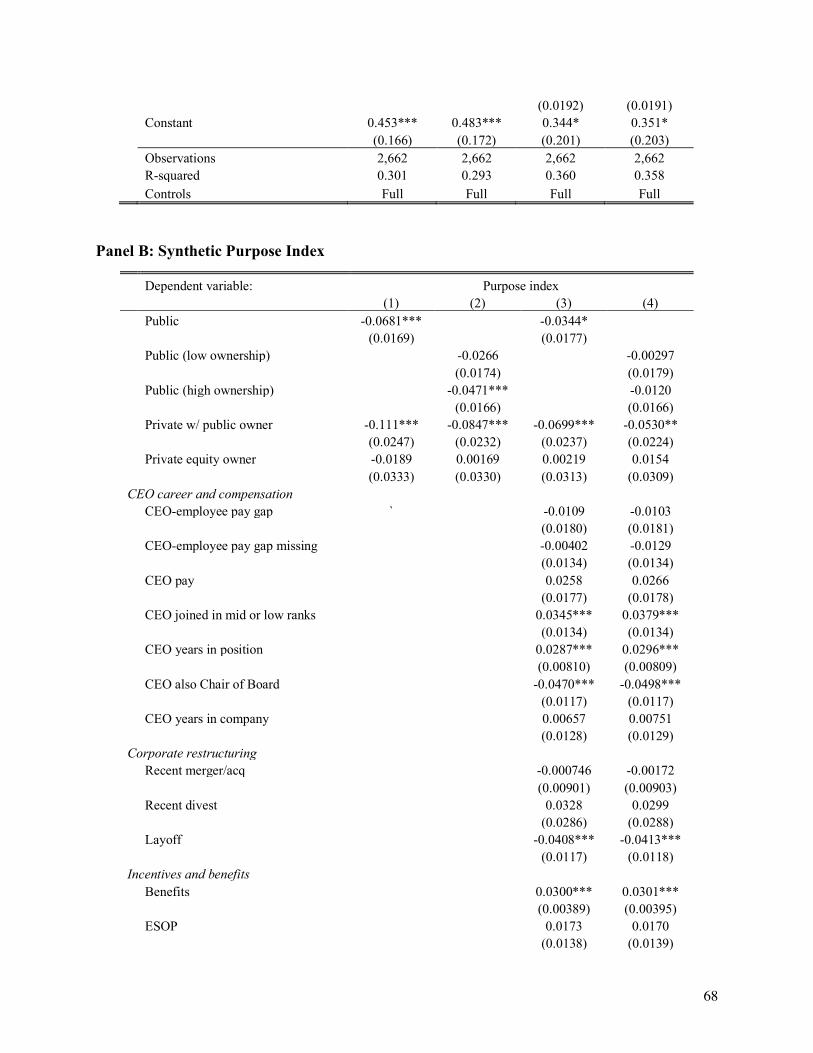
68
(0.0192) (0.0191) Constant 0.453*** 0.483*** 0.344* 0.351* (0.166) (0.172) (0.201) (0.203) Observations 2,662 2,662 2,662 2,662 R-squared 0.301 0.293 0.360 0.358 Controls Full Full Full Full
Panel B: Synthetic Purpose Index
Dependent variable: Purpose index (1) (2) (3) (4) Public -0.0681*** -0.0344* (0.0169) (0.0177) Public (low ownership) -0.0266 -0.00297 (0.0174) (0.0179) Public (high ownership) -0.0471*** -0.0120 (0.0166) (0.0166) Private w/ public owner -0.111*** -0.0847*** -0.0699*** -0.0530** (0.0247) (0.0232) (0.0237) (0.0224) Private equity owner -0.0189 0.00169 0.00219 0.0154 (0.0333) (0.0330) (0.0313) (0.0309) CEO career and compensation CEO-employee pay gap ` -0.0109 -0.0103 (0.0180) (0.0181) CEO-employee pay gap missing -0.00402 -0.0129 (0.0134) (0.0134) CEO pay 0.0258 0.0266 (0.0177) (0.0178) CEO joined in mid or low ranks 0.0345*** 0.0379*** (0.0134) (0.0134) CEO years in position 0.0287*** 0.0296*** (0.00810) (0.00809) CEO also Chair of Board -0.0470*** -0.0498*** (0.0117) (0.0117) CEO years in company 0.00657 0.00751 (0.0128) (0.0129) Corporate restructuring Recent merger/acq -0.000746 -0.00172 (0.00901) (0.00903) Recent divest 0.0328 0.0299 (0.0286) (0.0288) Layoff -0.0408*** -0.0413*** (0.0117) (0.0118) Incentives and benefits Benefits 0.0300*** 0.0301*** (0.00389) (0.00395) ESOP 0.0173 0.0170 (0.0138) (0.0139)

69
Pct bonus (salaried emp) 0.0772** 0.0778* (0.0392) (0.0397) Pct bonus (hourly emp) -0.0154 -0.0159 (0.0342) (0.0338) Collective bargaining Union -0.0281* -0.0315* (0.0169) (0.0169) Constant 4.493*** 4.516*** 4.221*** 4.222*** (0.155) (0.160) (0.174) (0.177) Observations 2,662 2,662 2,662 2,662 R-squared 0.288 0.281 0.349 0.347 Controls Full Full Full Full
Purpose-camaraderie is a factor that contains the four questions on purpose with together with questions on the degree of camaraderie between employees in the workplace received from the GPTW Institute survey. Purpose index is the raw average of four purpose questions in the Trust Index survey. OLS regressions. See Tables 2, 6 and 7 for variable definitions. Standard errors clustered at firm-level. ***, **, * signify statistical significance at the 1, 5, and 10% level respectively.

70
Appendix Tables and Figures Table A1: Purpose Gap and Ownership
Dependent variable: Corporate purpose gap between level and executive level Job level: Mid mgr Prof/tech Hourly Sales (1) (2) (3) (4) Public 0.0205 0.0410*** 0.0481*** -0.00823 (0.0127) (0.0145) (0.0157) (0.0284) Private w/ public owner 0.0340 0.0278 0.0374 0.00448 (0.0219) (0.0253) (0.0257) (0.0534) Private equity owner -0.0288 -0.0451 -0.0384 -0.110** (0.0231) (0.0317) (0.0295) (0.0552) Revenue (log) -0.00403 -0.00156 0.000451 -0.000857 (0.00350) (0.00332) (0.00383) (0.00678) FT employees (log) 0.0148*** 0.0253*** 0.0283*** 0.0335*** (0.00568) (0.00595) (0.00663) (0.0113) Constant -0.151 -0.138 -0.421* -0.282 (0.200) (0.168) (0.224) (0.377) Observations 2,611 2,587 2,609 2,081 R-squared 0.071 0.090 0.122 0.078 Controls Full Full Full Full
See Table 2 for variable definitions. Standard errors clustered at firm-level. ***, **, * signify statistical significance at the 1, 5, and 10% level respectively.
Table A2: Purpose Gap and Blockholder Ownership
Dependent variable: Corporate purpose gap between level and executive level Job level: Mid mgr Prof/tech Hourly Sales (1) (2) (3) (4) Public (low ownership) 2.04e-05 0.00791 0.0153 -0.0125 (0.0151) (0.0166) (0.0190) (0.0297) Public (high ownership) 0.0256* 0.0361** 0.0442*** 0.0110 (0.0144) (0.0159) (0.0170) (0.0290) Private w/ public owner 0.0277 0.0123 0.0214 0.0104 (0.0209) (0.0240) (0.0245) (0.0506) Private equity owner -0.0330 -0.0569* -0.0505* -0.104* (0.0225) (0.0312) (0.0287) (0.0530) Constant -0.161 -0.159 -0.441* -0.276 (0.204) (0.175) (0.231) (0.380) Observations 2,611 2,587 2,609 2,081 R-squared 0.072 0.089 0.121 0.078 Controls Full Full Full Full
See Tables 2, and 3 for variable definitions. Standard errors clustered at firm-level. ***, **, * signify statistical significance at the 1, 5, and 10% level respectively.

71
Table A3: Purpose Gap, CEO Characteristics, and Management Actions
Dependent variable: Corporate purpose gap between level and executive level Mid mgr Prof/Tech Hourly Sales (1) (2) (3) (4) Public (low ownership) -0.00874 -0.00387 -0.00318 -0.00901 (0.0174) (0.0191) (0.0210) (0.0317) Public (high ownership) 0.0142 0.0214 0.0244 0.0146 (0.0163) (0.0180) (0.0190) (0.0317) Private w/ public owner 0.0194 0.00670 0.0120 0.00546 (0.0214) (0.0249) (0.0258) (0.0506) Private equity owner -0.0345 -0.0591** -0.0545** -0.0962* (0.0214) (0.0300) (0.0275) (0.0515) CEO career and compensation CEO-employee pay gap 0.0362* 0.0439* 0.0437** -0.0159 (0.0187) (0.0226) (0.0213) (0.0305) CEO-employee pay gap missing 0.00525 0.0175 0.0229 -0.0110 (0.0134) (0.0152) (0.0155) (0.0242) CEO pay -0.0279 -0.0405* -0.0227 0.0334 (0.0184) (0.0209) (0.0210) (0.0324) CEO joined in mid or low ranks -0.00791 0.00548 -0.00681 0.0205 (0.0170) (0.0188) (0.0184) (0.0327) CEO years in position 0.00407 0.0190* -0.00461 -0.0144 (0.0102) (0.0109) (0.0110) (0.0188) CEO also Chair of Board 0.000111 -0.0169 0.0176 0.0121 (0.0132) (0.0153) (0.0157) (0.0271) CEO years in company -0.0182 -0.0338* -0.0237 -0.0265 (0.0161) (0.0180) (0.0169) (0.0274) Corporate restructuring Recent merger/acq 0.0236* 0.0165 0.0182 -0.00363 (0.0124) (0.0140) (0.0133) (0.0251) Recent divest -0.0461 -0.0311 -0.0691 -0.0369 (0.0442) (0.0419) (0.0500) (0.0834) Layoff 0.0277** 0.0221 0.0255* 0.00305 (0.0131) (0.0141) (0.0149) (0.0259) Incentives and benefits Benefits 0.00328 0.000997 -0.000676 0.0128 (0.00398) (0.00450) (0.00470) (0.00886) ESOP -0.0190 -0.00412 -0.00967 -0.0477* (0.0159) (0.0178) (0.0183) (0.0282) Pct bonus (salaried emp) -0.0295 0.0358 0.0521 -0.119* (0.0358) (0.0555) (0.0407) (0.0621) Pct bonus (hourly emp) -0.0757* -0.0935* -0.0394 -0.0241 (0.0425) (0.0548) (0.0467) (0.0771) Collective bargaining Union 0.00869 0.0247 0.0214 0.00351 (0.0143) (0.0180) (0.0174) (0.0344) Constant 0.0179 0.132 -0.245 -0.409 (0.232) (0.216) (0.265) (0.436)

72
Observations 2,602 2,098 2,629 2,603 R-squared 0.084 0.102 0.136 0.086 Controls Full Full Full Full
See Tables 2, 3, and 6 for variable definitions. Standard errors clustered at firm-level. ***, **, * signify statistical significance at the 1, 5, and 10% level respectively.