Embed Size (px)
Citation preview
Correction of Photon Attenuation and CollimatorResponse for a Body-Contouring SPECT/CTImaging SystemYoungho Seo, PhD1; Kenneth H. Wong, PhD2; Mingshan Sun, MS3; Benjamin L. Franc, MD1;Randall A. Hawkins, MD, PhD1,2; and Bruce H. Hasegawa, PhD1–3
1Department of Radiology, University of California, San Francisco, California; 2Joint Graduate Group in Bioengineering,University of California, San Francisco and Berkeley, California; and 3Department of Nuclear Engineering, University ofCalifornia, Berkeley, California
111In-Capromab pendetide imaging is indicated for postpros-tatectomy patients at risk for residual or recurrent disease.However, this study is complicated by relatively long times fortumor uptake and background washout that require imaging tobe performed several days after radiopharmaceutical adminis-tration. In addition, 111In-capromab pendetide demonstrates up-take in normal structures that produce images that are inter-preted best using correlation with anatomic imaging. Finally, thevisual quality of radionuclide imaging can be improved withcorrections for photon attenuation and for the geometric re-sponse of the radionuclide collimator. Therefore, we have eval-uated the advantages of using a commercially available dual-modality SPECT/CT system. In this article, we evaluate a noveliterative reconstruction algorithm using the SPECT/CT data ob-tained from phantoms and 111In-capromab pendetide patientstudies. Methods: Phantom data acquired with the dual-headSPECT camera were reconstructed using both filtered back-projection (FBP) and an iterative maximum-likelihood expecta-tion maximization (MLEM) algorithm incorporating correctionsfor (a) attenuation coefficient at the effective energy of theradionuclide (either 99mTc or 111In) and (b) collimator responsebased on experimentally measured depth-dependent spatialresolution of the camera. The collimator response model usedthe coregistered CT image to estimate the source–target dis-tances produced by the patient-contouring logic of the SPECTcamera. Spatial resolution was measured using SPECT imagesof 2 line sources and uniformity from a uniform cylindric tank.Clinical 111In-capromab pendetide SPECT/CT data were ac-quired according to the radiopharmaceutical manufacturer’sprotocol. Region-of-interest (ROI) analysis of a transverse sliceat the level of the sacral base produced mean, median, maxi-mum, and minimum counts per pixel for bone marrow andsurrounding soft-tissue ROIs. Ratios of the mean capromabpendetide uptake within marrow to uptake within soft tissuewere compared for images reconstructed with FBP versus thatobtained from the MLEM method with photon attenuation andcollimator response corrections. Results: The source–targetdistances reconstructed from the patient-specific CT image
agreed well with the corresponding values recorded manuallyfrom the camera display unit. This information was incorporatedinto the iterative reconstruction algorithms and improved thequality of SPECT images from phantoms and patients versusSPECT images reconstructed without the depth-dependent col-limator response model. Qualitatively, SPECT images recon-structed with corrections for photon attenuation and collimatorresponse showed less background activity and improved targetcontrast compared with those images reconstructed with FBP.The target-to-background ratio (marrow uptake-to-soft-tissueuptake) was significantly better using MLEM reconstructionthan with FBP when mean uptake values were measured. Con-clusion: A priori anatomic data can be used to enhance thequality of the SPECT image when reconstructed using iterativetechniques (e.g., MLEM) that use the CT data to produce apatient-specific attenuation map and a collimator responsemodel based on the body contour produced during the SPECTacquisition.
Key Words: dual-modality SPECT/CT; iterative reconstruction;attenuation correction; collimator model; 111In; capromab pen-detide; prostate cancer
J Nucl Med 2005; 46:868–877
Radionuclide imaging, including SPECT and PET, isfinding increasing roles in the detection and staging ofcancer. Moreover, the interpretation of oncologic studieswith nuclear medicine often is enhanced by the availabilityof anatomic information from CT and MRI that helps theinterpreter to differentiate uptake of the tracer due to thedisease process from that associated with normal physio-logic function. Correlated anatomic information also im-proves the differentiation of primary and metastatic diseaseto improve staging and to guide treatment-planning deci-sions. For these reasons, dual-modality techniques that com-bine CT with either SPECT or PET recently have gainedacceptance for several clinical applications, including thosein oncologic imaging. SPECT/CT (1) and PET/CT (2) fa-cilitate functional–structural correlation by producingcoregistered functional and anatomic images during a single
Received Apr. 13, 2004; revision accepted Dec. 15, 2004.For correspondence contact: Youngho Seo, PhD, Department of Radiol-
ogy, University of California, San Francisco, 185 Berry St., Suite 350, SanFrancisco, CA 94107-1739.
E-mail: [email protected]
868 THE JOURNAL OF NUCLEAR MEDICINE • Vol. 46 • No. 5 • May 2005
by on June 19, 2018. For personal use only. jnm.snmjournals.org Downloaded from
patient procedure. In addition, SPECT/CT (1) and PET/CT(2) also use the correlated CT image to produce high-quality, patient-specific attenuation maps that can be usedfor attenuation correction to improve both the visual qualityand the quantitative accuracy of the radionuclide imagedata.
Dual-modality imaging has had its greatest impact in theform of combined PET/CT of cancer using 18F-FDG. Theseprocedures take advantage of the high avidity of malignanttissues for FDG, the high-sensitivity of PET for imaging18F-FDG distributions in vivo, and the excellent imagequality and fast scan speeds afforded by modern multisliceCT scanners (3). SPECT/CT systems now are availablecommercially, but its use has been moderated by the limitednumber of radiolabeled oncologic agents clinically availablefor single-photon imaging. Nevertheless, significant effortshave been devoted to the development of tumor-specificantibodies that can be labeled with single-photon emittersfor radionuclide imaging. 111In is commonly used as aradiolabel for tumor-specific antibodies since its physicalhalf-life (67.3 h) is compatible with the tumor uptake andbackground washout times of these agents. However, 111Inemits 2 �-rays having energies centered around 171 and 245keV, which requires SPECT to be performed with a medi-um-energy collimator that compromises spatial resolutionand geometric efficiency. For these reasons, SPECT studiesof cancer using 111In must be designed in a way that takesthese features into account so that the resulting images havethe highest possible quality for visual interpretation.
111In-Capromab pendetide (111In-ProstaScint; CytogenCorp.) now is available for imaging assessments of prostatecancer staging and recurrence (4). This application repre-sents the type of study in which traditional SPECT of thisagent is complicated by both the low counting rate and thelimited spatial resolution contributed by the medium-energycollimator of the scintillation camera and by nonspecificradionuclide uptake. Several investigators (4,5) have foundthat interpretation of 111In-capromab pendetide is aided sig-nificantly by the addition of correlated anatomic informa-tion that improves differentiation of normal uptake fromthat associated with disease. In addition, the correlatedanatomic information also provides landmarks that can beused to guide biopsy or targeted treatment with brachyther-apy or intensity-modulated radiation therapy (6).
In this article, we present techniques of reconstructingphantom and patient images of 111In-capromab pendetideusing a commercial dual-modality SPECT/CT system man-ufactured by GE Healthcare (Discovery VH). The combinedSPECT/CT system facilitates image fusion by generatingboth the SPECT and the CT images without having to moveor reposition a phantom or a patient during the study. Thecoregistered CT image also can be used to obtain a patient-specific attenuation map that can be incorporated into iter-ative SPECT reconstruction algorithms (7,8), such as max-imum-likelihood expectation maximization (MLEM) (9,10)
or ordered-subsets expectation maximization (OSEM) (11)for correction of photon attenuation in the radionuclide data.
Since 111In emits �-rays at 2 energies (i.e., 171 and 245keV), the reconstruction process, in theory, requires sepa-rate attenuation maps to be calculated and applied to theradionuclide data collected at each photon energy. How-ever, in this study, we derive a single attenuation map fromthe x-ray data that is calculated at the “effective” photonenergy of 111In and that can be applied to pooled radionu-clide data from the 2 �-ray photopeaks. In addition, sincethe 111In-capromab pendetide images are obtained with amedium-energy collimator that can compromise spatial res-olution, the iterative reconstruction techniques incorporate adepth-dependent collimator response model to improve thespatial resolution characteristics, and potentially the quan-titative accuracy, of the reconstructed image. The process ofcalculating the depth-dependent collimator response is com-plicated by the use of patient contouring by the DiscoveryVH for radionuclide imaging, especially because the systemdoes not record the radius of rotation as a function ofrotation angle during the acquisition. Since this informationis needed for the depth-dependent collimator responsemodel (12,13), we have calculated the radius of rotationfrom the correlated CT data produced by the Discovery VH.The overall goal of this study is focused on using theSPECT/CT data acquired with the Discovery VH system tocorrect the radionuclide data for photon attenuation using asingle attenuation map and to implement a depth-dependentcollimator response correction that includes body-contourinformation. These techniques are applied to 111In-capromabpendetide images acquired from patient volunteers enrolledin an on-going clinical protocol that uses SPECT/CT toimprove both image quality and quantitative accuracy of111In-capromab pendetide imaging performed with the com-bined SPECT/CT system.
MATERIALS AND METHODS
Overview and Goals of StudyIn this article, we present techniques of reconstructing phantom
and patient images using a commercial dual-modality SPECT/CTsystem manufactured by GE Healthcare with a general goal ofimproving cancer staging with 111In-capromab pendetide imaging.The technical goal of our study focuses on corrections of photonattenuation and depth-dependent collimator response using pa-tient-specific anatomic information derived from the coregisteredCT image using the Discovery VH Hawkeye SPECT/CT system.Finally, we present preliminary patient images and quantitativemeasurements from an on-going clinical 111In-capromab pendetidestudy that demonstrates the role of iteratively reconstructedSPECT images having corrections for photon attenuation andcollimator response derived from the coregistered CT image.
EquipmentThis study used the Discovery VH Hawkeye SPECT/CT system
with a 25.4-mm-thick NaI(Tl) crystal manufactured by GE Health-care installed in the nuclear medicine clinic in the Department ofRadiology at University of California, San Francisco (UCSF),
DUAL-MODALITY SPECT/CT IMAGING OF 111IN • Seo et al. 869
by on June 19, 2018. For personal use only. jnm.snmjournals.org Downloaded from
Long/Moffitt Hospital. The system includes an x-ray tube anddetector arrays that are offset along the axial direction from the 2scintillation cameras. The radial positions of the x-ray tube anddetector array are fixed with respect to the axis of rotation, but theradial position of the rotating scintillation cameras can vary toenable automatic body contouring during the acquisition of theradionuclide image.
In addition, the study used a personal computer running Win-dows XP (Microsoft Corp.) for image display and fusion. Tomo-graphic image reconstruction was performed using a dual-proces-sor (2.66-GHz Intel Xeon) computer under a Linux operatingsystem (Rad Hat, Inc.) with a GNU Compiler Collection (“gcc”)version 3.2.3 (Free Software Foundation, Inc.) and Intel C Com-piler (“icc”) version 8.0 (Intel Corp.) with appropriate optimizationmethods used for SPECT image reconstruction.
Acquisition ProtocolsAll SPECT data in this study were acquired using a 128 � 128
matrix with a 3.45-mm pixel size and with patient contouring. Inmost phantom and patient studies, the SPECT acquisition wasperformed with 60 stops at 30–60 s per stop for a 360° rotation ofthe dual-head camera.
The CT acquisition, which was common to every SPECT/CTstudy in this article, was performed using a 256 � 256 matrix anda 10-mm slice thickness over an angular extent of approximately215° (i.e., equal to 180° plus the x-ray fan angle). The CT datawere acquired at 140 kVp and 2.5 mA. The CT acquisition tookapproximately 15 min and was performed after the SPECT acqui-sition. The CT reconstruction was performed using a filteredbackprojection (FBP) algorithm provided by the manufacturer.
Attenuation Map GenerationTo reconstruct the SPECT images with attenuation correction,
CT-derived attenuation maps that are radionuclide and objectspecific were generated using 2 different methods: one methoddeveloped by our group and the other provided by the cameramanufacturer. SPECT images reconstructed using attenuationmaps from the 2 methods then were compared to evaluate therelative characteristics of these techniques. The 2 methods useddifferent energy-calibration techniques but used a FBP algorithmprovided by the manufacturer to produce the x-ray–based attenu-ation maps using x-ray projection data acquired using the protocoldescribed.
The first method acquired calibration measurements of a bonemineral densitometry phantom with elliptic cross-section havingdimensions of 275-mm long axis, 215-mm short axis, and 45-mmthickness (Mindways) that contained 4 smaller cylindric chambersfilled with aqueous solutions of K2HPO4 with known chemicalcompositions and densities. The K2HPO4 concentrations in these 4small cylinders ranged from 50 to 200 mg/mL. After the calibra-tion phantom was imaged and reconstructed, the CT numbers foreach cylindric chamber were extracted from the tomograms andwere plotted versus their known linear attenuation coefficients(14). These values were plotted with a piecewise linear calibrationcurve that could be used to convert the CT numbers from thepatient to their corresponding energy-corrected linear attenuationcoefficients on a pixel-by-pixel basis to produce an object-specificattenuation map. This technique can be used directly to produce anattenuation map for radionuclides emitting �-rays of a singleenergy (e.g., 99mTc at 140 keV). However, this method must bemodified to calculate an attenuation map for 111In, which emits 2�-rays of different energies. In this case, the attenuation map for
111In was calculated using a technique developed by Wong et al.(15), in which the effective attenuation coefficient for photons of2 different energies from a single radionuclide is expressed by:
�eff �ln(exp[��1x] � � exp[��2x]) � ln(1 � �)
�x, Eq. 1
where �1 and �2 are attenuation coefficients for each �-energy, �is the ratio of the branching ratios, and x is the thickness of themedium through which the �-rays pass. The linear attenuationcoefficients �1 and �2 are also obtained from tabulated values (14),with � calculated from the branching ratios (i.e., 94%, 90.2%) ofthe 171- and 245-keV �-rays (i.e., � � 94%/90.2% � 1.042).Wong et al. observed that for 111In, the effective linear attenuationcoefficient �eff is relatively constant as a function of object thick-ness x, thereby producing an attenuation map at a single effectiveenergy at Eeff � 210 keV that can be applied to pooled dataacquired from 111In.
The second method used the calibration technique provided bythe manufacturer (GE Healthcare) to automatically generate anattenuation map based on the CT image data acquired from thepatient. The version of the software available at the time of thisstudy generates an attenuation map that compensates only for ahigher energy peak (245 keV) of the 2 �-ray energies of 111In. Anewer version of software now is available from the manufacturerthat produces an attenuation map that accounts for both photonenergies of 111In (16). The 2 methods of generating the attenuationmap were compared using an acrylic resolution phantom withcylindric holes (3- to 36-mm diameter) and contained within awater-filled cylindric container. CT images of the resolution phan-tom were acquired with the resulting x-ray data and used togenerate attenuation maps using 2 different methods as described.We chose this phantom for comparing the different 111In attenua-tion map–generation techniques because it provides 2 materials(acrylic, water) with linear attenuation coefficients that were dif-ferent from one another but both similar to that of soft tissue. Inaddition, the phantom had a geometry from which linear attenua-tion coefficients can be easily compared when linear pixel profilesare extracted from the reconstructed CT tomographic image. Weused the CT reconstruction algorithms provided by the manufac-turer to produce CT images used in this comparison study.
Collimator Response Correction with Body-ContouringAdjustment
The depth-dependent spatial resolution response was measuredexperimentally for 111In imaging using the GE medium-energycollimator (model VPC-5) and for 99mTc point sources with the GElow-energy, high-resolution collimator (LEHR; model VPC-45).These measurements were performed by placing a small drop ofthe radionuclide in a syringe needle cap to form small cylindricsources having approximately 2 mm both in diameter and inheight. Planar images (500,000 counts each) of the small sourcewere acquired at different source–collimator distances in 20-mmincrements ranging from 206.3 to 396.3 mm from the collimatorsurface. At each distance, a profile was defined across the point-spread function and fitted with a gaussian distribution using linearleast-squares regression to extract the SD as a function of thesource–collimator distance. The SD function was used to modelthe depth-dependent collimator blurring in the iterative SPECTreconstruction algorithm.
The Discovery VH uses patient contouring to acquire theSPECT data with the best possible spatial resolution but does not
870 THE JOURNAL OF NUCLEAR MEDICINE • Vol. 46 • No. 5 • May 2005
by on June 19, 2018. For personal use only. jnm.snmjournals.org Downloaded from
record the radius of rotation during the acquisition process. How-ever, the depth-dependent collimator response correction requiresthat the distance between the center of rotation of the SPECTcameras and the detector surface is known, so the appropriatewidth of the blurring function can be applied at a specific point inthe object. The body-contouring orbit of the SPECT camera alsocannot be estimated only from preset geometric parameters andmust be derived from the anatomic characteristics of the patient.Therefore, we estimated the radius of rotation at each angularposition of the scintillation cameras by extracting the patientcontour from the coregistered CT image. This was performed bycollapsing the entire 128 CT slices that cover the extent of thepatient body into a single slice image from which the maximumextent of the body could be defined over the SPECT camera’s fieldof view. These values then were incorporated into the iterativereconstruction algorithm to estimate the source–collimator dis-tances generated by the body-contouring logic of the SPECTcamera for each frame of the SPECT acquisition to correctlyimplement the depth-dependent collimator response model. Theestimated contouring trajectory of the SPECT camera was verifiedby comparing it to the actual camera trajectory recorded manuallyfrom the system display unit during the acquisition from an an-thropomorphic cardiac-torso phantom (Data Spectrum, Inc.).
Reconstruction AlgorithmsThe SPECT images from the phantom and clinical studies were
reconstructed using both FBP and iterative MLEM reconstructionmethods. The FBP reconstruction included a Butterworth filterwith a 0.5 Nyquist cutoff frequency for imaging 99mTc and aHanning filter with a 0.85 Nyquist cutoff frequency for imaging111In. The SPECT data reconstructed using the MLEM algorithmincorporated photon attenuation and system-specific collimatorresponse corrections that accounted for body-contouring duringthe SPECT acquisition.
One of the goals of this study was to quantify the spatialresolution and uniformity of the images reconstructed with FBPversus those reconstructed with MLEM, including corrections forphoton attenuation and collimator response. However, it is wellknown that the spatial resolution and signal-to-noise ratio (SNR)characteristics (and therefore the uniformity) of the images recon-structed with MLEM change as a function of iteration number. Tomake a reasonably fair comparison between the results from FBPversus those from MLEM, we reconstructed the MLEM imagesusing the number of iterations that produced images that mostclosely matched the SNR characteristics of those reconstructedusing FBP. In this study, the analysis of the SNR characteristicsversus iteration number of the MLEM algorithm was performedfor both 99mTc and for 111In.
The SNR versus iteration analysis for 99mTc was performed byacquiring emission data from a uniform cylindric phantom (180mm in diameter) filled with an aqueous solution of 99mTc-pertech-netate (65 MBq). The SPECT data were acquired as 128 � 128matrices with a LEHR collimator for approximately 60 min (i.e.,60 stops at 60 s per stop) using a 360° rotation of the dual-headcamera. The image data were reconstructed using (a) FBP, (b)MLEM without any corrections, (c) MLEM with photon attenua-tion correction only, (d) MLEM with collimator response andbody-contouring corrections only, and (e) MLEM with correctionsfor photon attenuation, collimator response, and patient contour-ing. The SNR was assessed quantitatively by computing the sta-tistical mean of pixel values as signal and the SD of pixel values
as noise on a region of interest (ROI) that contained 1,340 pixelswithin the uniformity phantom. The same SNR calculation wasrepeated for 12 sequential tomographic slices from the same regionof SPECT data. The statistical mean of the 12 SNR values from theSPECT acquisition was plotted against with the MLEM iterationnumber. To compare the SNR characteristics of the SPECT-recon-structed image using FBP versus that using MLEM reconstruction,we calculated the SNR value from the FBP-reconstructed imageusing the same ROI that was used to analyze the data from theMLEM reconstructions and included the result as a constant valueat each iteration number in the same plot that was described earlier.
To analyze the SNR characteristics versus MLEM iterationnumber for 111In, we acquired SPECT projection data of an an-thropomorphic torso phantom (Data Spectrum) in which the livercompartment (1.2 L) contained approximately 130 MBq of 111In(0.108 MBq/mL). Five repetitive SPECT acquisitions were per-formed using a 128 � 128 matrix with a medium-energy collima-tor with 60 stops at 30 s per stop (approximately 30-min acquisi-tion time) and a 360° rotation of the dual-head camera. Imageswere reconstructed using FBP and then using MLEM with correc-tions for attenuation, collimator response, and contouring. TheSNR was assessed quantitatively by computing the statistical meanof pixel values as signal and the SD of pixel values as noise on aROI with 374 pixels within a uniform region of the liver compart-ment. The same SNR calculation was repeated for 4 sequentialtomographic slices in the same SPECT reconstructed images. Thesame procedure to calculate the SNR was repeatedly performed forthe 5 SPECT acquisitions using the same phantom. The mean ofthe 4 SNR values from a single SPECT acquisition was used torepresent an average SNR for the SPECT uniformity data andplotted against the MLEM iteration number. The statistical meanof 20 SNR values from 4 tomographic slices of all 5 SPECTacquisitions was plotted against the MLEM iteration number. Tocompare the SNR characteristics of the SPECT image using FBPversus that using MLEM, we calculated the SNR ratio from theFBP-reconstructed image using the same ROI that was used in theSNR versus the MLEM iteration number analysis and includedthat result as a constant value at each iteration number in the sameplot that was described earlier.
Phantom MeasurementsPhantom measurements were performed to evaluate the validity
of our MLEM reconstruction method with corrections for photonattenuation, collimator response, and body-contouring corrections.This was performed by (a) measuring field uniformity and spatialresolution and (b) verifying the improvement in target-to-back-ground ratio from MLEM-reconstructed SPECT images acquiredwith body contouring in comparison with that acquired with aconventional circular-orbit SPECT acquisition.
The system uniformity of the SPECT image was assessed byacquiring emission data from a uniform cylindric phantom (180mm in diameter) filled with an aqueous solution of 99mTc-pertech-netate (65 MBq) at a concentration of 0.033 MBq/mL. The SPECTdata were acquired as 128 � 128 matrices with a LEHR collimatorfor approximately 60 min (i.e., 60 stops at 60 s per stop) using a360° rotation of the dual-head camera. The image data werereconstructed using both FBP and MLEM with corrections forphoton attenuation, collimator response, and patient contouring.The image uniformity was assessed quantitatively by comparinglinear profiles of pixel values in the reconstructed images. Weassessed the merged images formed by adding 12 sequential to-
DUAL-MODALITY SPECT/CT IMAGING OF 111IN • Seo et al. 871
by on June 19, 2018. For personal use only. jnm.snmjournals.org Downloaded from
mographic slices representing a total thickness of 41.4 mm. Wethen extracted the linear profiles over 128 pixels in the horizontaldirection crossing the center of the summed reconstructed images.
The system spatial resolution of the SPECT camera was mea-sured using two 25.4- mm-long 20-gauge syringe needles to formline sources containing approximately 55 and 75 MBq of 99mTc-pertechnetate, respectively. The line sources were placed parallelto each other and directly on the patient table with a separation of70 mm. SPECT data were acquired as 128 � 128 matrices with aLEHR collimator with 60 stops at 30 s per stop (approximately30-min acquisition time) with a 360° rotation of the dual-headcamera. Although we used the body contouring to acquire thesedata, the actual camera trajectory during the acquisition was lim-ited because the SPECT camera could not move closer thanapproximately 120 mm from the center of rotation, and the SPECTcamera was limited to a minimum source–detector distance ofapproximately 210 mm due to the need to clear the outer extent ofthe patient table. Images were reconstructed using both FBP andMLEM with corrections for photon attenuation, collimator re-sponse, and body contouring. Line profiles were used to extract thepoint-spread functions from the reconstructed line source images.We then calculated the full width at half maximum (FWHM) of agaussian function fit to the extracted point-spread function.
The target-to-background ratios obtained using body contouringversus that obtained with the circular orbit were verified by imag-ing the liver compartment of the anthropomorphic phantom. In thisstudy, the liver compartment (1.2 L) was filled with an aqueoussolution of 111In at a concentration of 0.11 MBq/mL. In addition,2 water-filled spheric inserts were placed in the liver compartment.The larger sphere (19 mL) contained 6 MBq of 111In (i.e., 0.32MBq/mL), whereas the smaller sphere (5 mL) contained 4 MBq of111In (i.e., 0.80 MBq/mL). The radionuclide concentrations in theliver compartment and 2 sphere inserts were configured to mimicthe radionuclide concentrations typical of those found in a humansubject with prostate cancer (17). We acquired 2 sets of SPECTdata with the same acquisition parameters used for the SNR versusiteration analysis, with the first acquired with body contouring andthe other acquired with a circular orbit having a radius of 312 mm.Images were reconstructed using MLEM with corrections of pho-ton attenuation and collimator response. The target-to-backgroundratio was adopted as a quantitative metric to compare these 2reconstructed images. The target activity was measured by placinga circular ROI with 24 pixels on the image of a small sphericinsert. The background activity was measured by placing an irreg-ular ROI with 104 pixels adjacent to the edge of the small sphericinsert. These ROIs were used to calculate the target-to-backgroundratio for these SPECT data.
Preliminary Clinical Studies111In-Capromab pendetide studies of patient volunteers were
performed with the Discovery VH SPECT/CT system using thetechniques developed from the phantom studies. The patient stud-ies used SPECT and CT data from patients referred to the UCSFNuclear Medicine Clinic for 111In-capromab pendetide imaging.All volunteers enrolled in this study signed informed consentapproved by our institutional Committee on Human Research.Data from these patients were processed and archived according tothe HIPAA (Health Insurance Portability and Accountability Actof 1996) requirements. The patient protocol was not modified fromthe acquisition procedure recommended by the 111In-capromabpendetide vendor (Cytogen Corp.). For the clinical 111In-capromab
pendetide SPECT/CT, we administered approximately 200 MBqof 111In to each patient and acquired image data approximately93 h after injection. The SPECT data were acquired in a 128 � 128format using a medium-energy collimator with an acquisition timeof approximately 60 min (i.e., 60 stops at 60 s per stop) with a 360°rotation of the dual-head camera. After completion of the 111In-capromab pendetide study, the correlated SPECT and CT datawere reconstructed using algorithms provided by the camera man-ufacturer and were interpreted following the normal clinical pro-tocol. In addition, the SPECT and CT data were transferred to anoff-line computer for processing and reconstruction for this exper-imental protocol. The experimental protocol included reconstruc-tion of the SPECT data using 40 iterations of a MLEM methodwith corrections for photon attenuation, collimator response, andbody contouring. In addition, as part of the experimental study, wegathered information on the patient’s prostate cancer history, in-cluding the prostate-specific antigen level and treatment history forthose patients with recurrent prostate disease.
We performed a preliminary study to quantify the target-to-background ratio of 111In-capromab pendetide uptake in the regionof the bone marrow and a region of soft tissue surrounding thebone marrow. The measurement was performed using transaxialSPECT images of 111In-capromab pendetide at the level of thesacral base and reconstructed using both the FBP and a MLEMiterative reconstruction that included corrections for photon atten-uation, collimator response, and patient contouring. To obtain asemiquantitative measure of activity within the bone marrow forcomparison with background activity in the soft tissues, ROIs wereselected manually around the iliac wings, including cortical andtrabecular bone on transaxial projections using the coregistered CTimage as a template. ROIs for soft tissue were defined around themuscles of the posterior hip in a similar manner. These ROIs wereused to produce ratios of the activity within normal bone marrow(target) to the activity localized to soft tissue (background).
RESULTS
Photon Attenuation Map Generation and Comparisonin 2 Methods
We derived attenuation maps for 111In from the coregis-tered CT image using both the effective energy method (Eq.1) and the algorithm provided by the manufacturer as part ofthe Discovery VH system. The CT-derived 111In attenuationmaps in units of inverse centimeters (cm�1) for the acrylichot-lesion resolution phantom (holes of 3- to 36-mm diam-eter) are displayed in Figure 1 as derived from these 2methods. These data show that the absolute values of linearattenuation coefficients in water differ by approximately6%, whereas the shapes of the 2 attenuation profiles aresimilar. The result is consistent with the published tabulatedvalues (14); for example, linear attenuation coefficients forwater are 0.135 cm�1 for 210 keV (the effective energy of111In) and 0.127 cm�1 for 245 keV (the energy on which themanufacturer’s algorithm is based). The reconstructedSPECT images using either attenuation map yielded visu-ally similar results in both phantom and patient images. Inaddition, the quantitative values should be more accurate inSPECT images reconstructed using attenuation maps cali-
872 THE JOURNAL OF NUCLEAR MEDICINE • Vol. 46 • No. 5 • May 2005
by on June 19, 2018. For personal use only. jnm.snmjournals.org Downloaded from
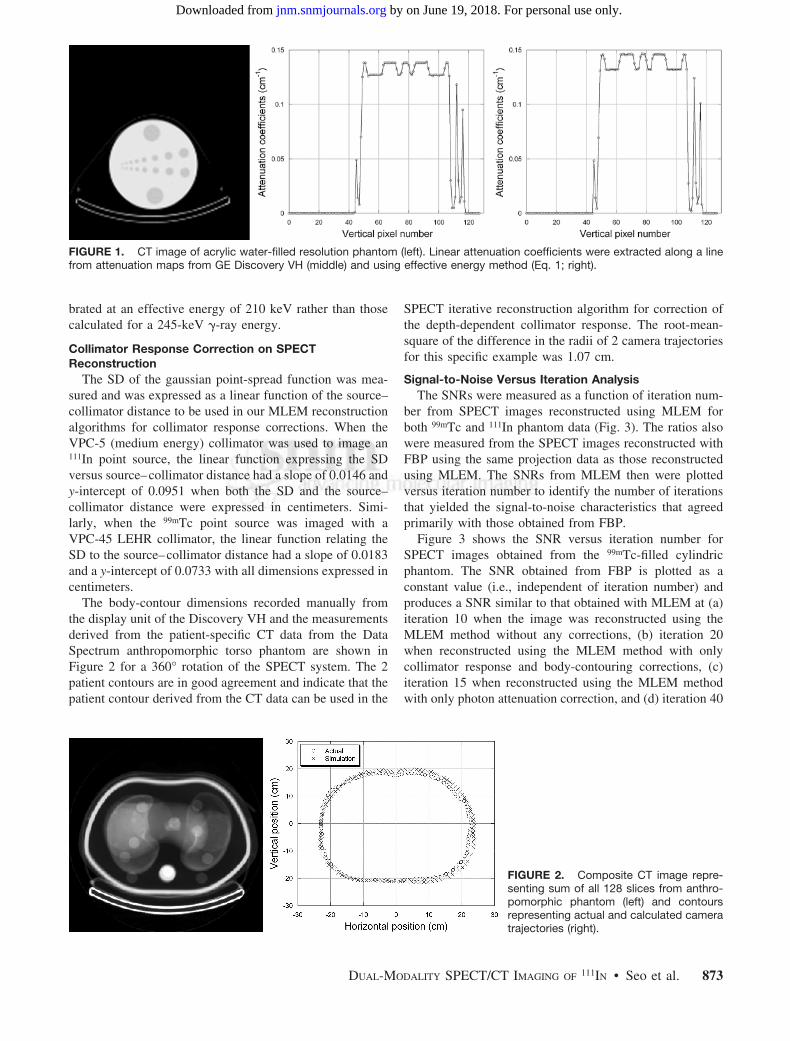
brated at an effective energy of 210 keV rather than thosecalculated for a 245-keV �-ray energy.
Collimator Response Correction on SPECTReconstruction
The SD of the gaussian point-spread function was mea-sured and was expressed as a linear function of the source–collimator distance to be used in our MLEM reconstructionalgorithms for collimator response corrections. When theVPC-5 (medium energy) collimator was used to image an111In point source, the linear function expressing the SDversus source–collimator distance had a slope of 0.0146 andy-intercept of 0.0951 when both the SD and the source–collimator distance were expressed in centimeters. Simi-larly, when the 99mTc point source was imaged with aVPC-45 LEHR collimator, the linear function relating theSD to the source–collimator distance had a slope of 0.0183and a y-intercept of 0.0733 with all dimensions expressed incentimeters.
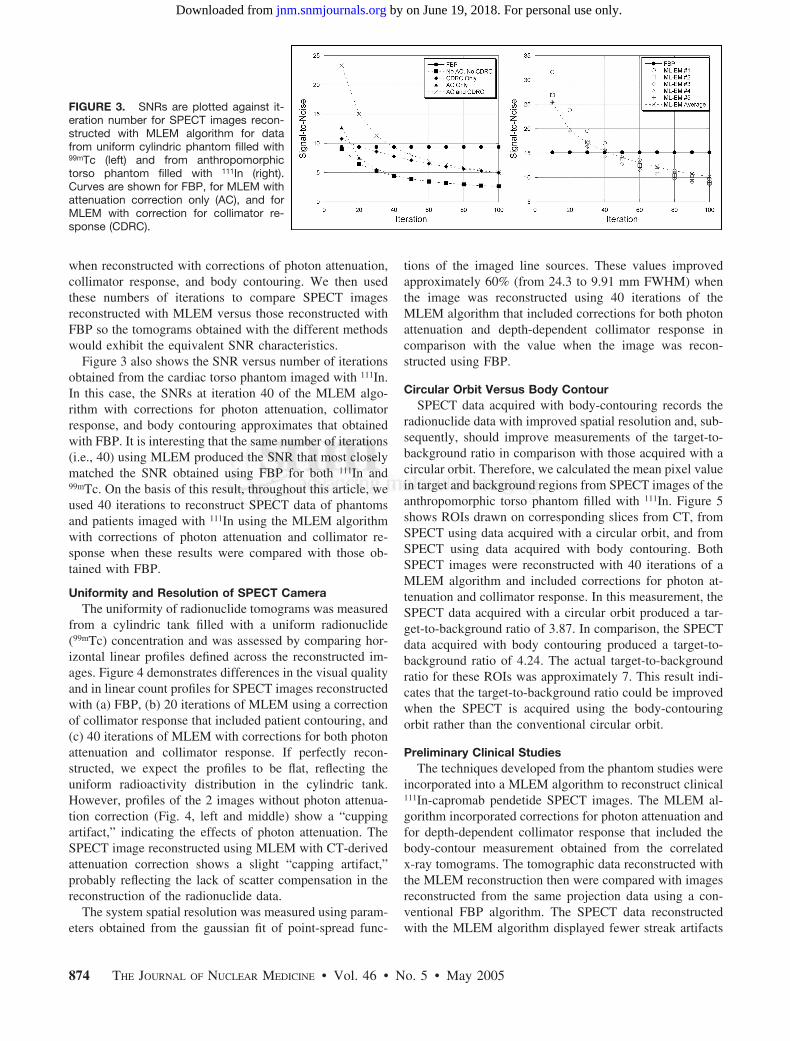
The body-contour dimensions recorded manually fromthe display unit of the Discovery VH and the measurementsderived from the patient-specific CT data from the DataSpectrum anthropomorphic torso phantom are shown inFigure 2 for a 360° rotation of the SPECT system. The 2patient contours are in good agreement and indicate that thepatient contour derived from the CT data can be used in the
SPECT iterative reconstruction algorithm for correction ofthe depth-dependent collimator response. The root-mean-square of the difference in the radii of 2 camera trajectoriesfor this specific example was 1.07 cm.
Signal-to-Noise Versus Iteration AnalysisThe SNRs were measured as a function of iteration num-
ber from SPECT images reconstructed using MLEM forboth 99mTc and 111In phantom data (Fig. 3). The ratios alsowere measured from the SPECT images reconstructed withFBP using the same projection data as those reconstructedusing MLEM. The SNRs from MLEM then were plottedversus iteration number to identify the number of iterationsthat yielded the signal-to-noise characteristics that agreedprimarily with those obtained from FBP.
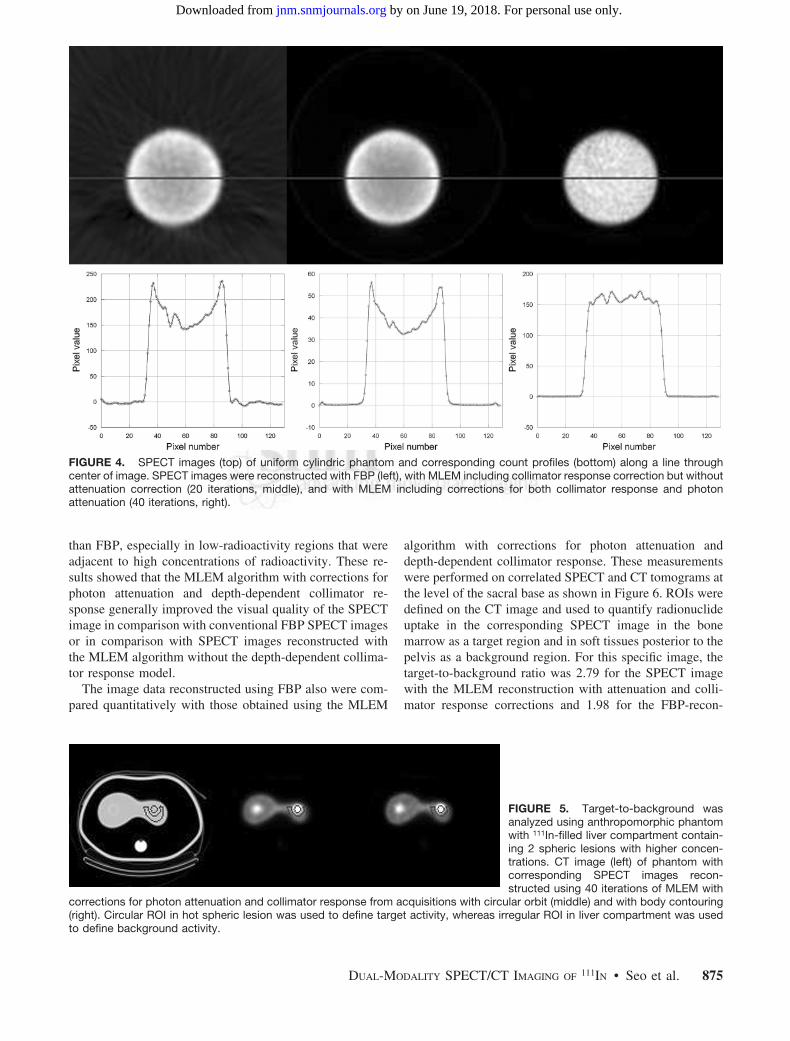
Figure 3 shows the SNR versus iteration number forSPECT images obtained from the 99mTc-filled cylindricphantom. The SNR obtained from FBP is plotted as aconstant value (i.e., independent of iteration number) andproduces a SNR similar to that obtained with MLEM at (a)iteration 10 when the image was reconstructed using theMLEM method without any corrections, (b) iteration 20when reconstructed using the MLEM method with onlycollimator response and body-contouring corrections, (c)iteration 15 when reconstructed using the MLEM methodwith only photon attenuation correction, and (d) iteration 40
FIGURE 1. CT image of acrylic water-filled resolution phantom (left). Linear attenuation coefficients were extracted along a linefrom attenuation maps from GE Discovery VH (middle) and using effective energy method (Eq. 1; right).
FIGURE 2. Composite CT image repre-senting sum of all 128 slices from anthro-pomorphic phantom (left) and contoursrepresenting actual and calculated cameratrajectories (right).
DUAL-MODALITY SPECT/CT IMAGING OF 111IN • Seo et al. 873
by on June 19, 2018. For personal use only. jnm.snmjournals.org Downloaded from
when reconstructed with corrections of photon attenuation,collimator response, and body contouring. We then usedthese numbers of iterations to compare SPECT imagesreconstructed with MLEM versus those reconstructed withFBP so the tomograms obtained with the different methodswould exhibit the equivalent SNR characteristics.
Figure 3 also shows the SNR versus number of iterationsobtained from the cardiac torso phantom imaged with 111In.In this case, the SNRs at iteration 40 of the MLEM algo-rithm with corrections for photon attenuation, collimatorresponse, and body contouring approximates that obtainedwith FBP. It is interesting that the same number of iterations(i.e., 40) using MLEM produced the SNR that most closelymatched the SNR obtained using FBP for both 111In and99mTc. On the basis of this result, throughout this article, weused 40 iterations to reconstruct SPECT data of phantomsand patients imaged with 111In using the MLEM algorithmwith corrections of photon attenuation and collimator re-sponse when these results were compared with those ob-tained with FBP.
Uniformity and Resolution of SPECT CameraThe uniformity of radionuclide tomograms was measured
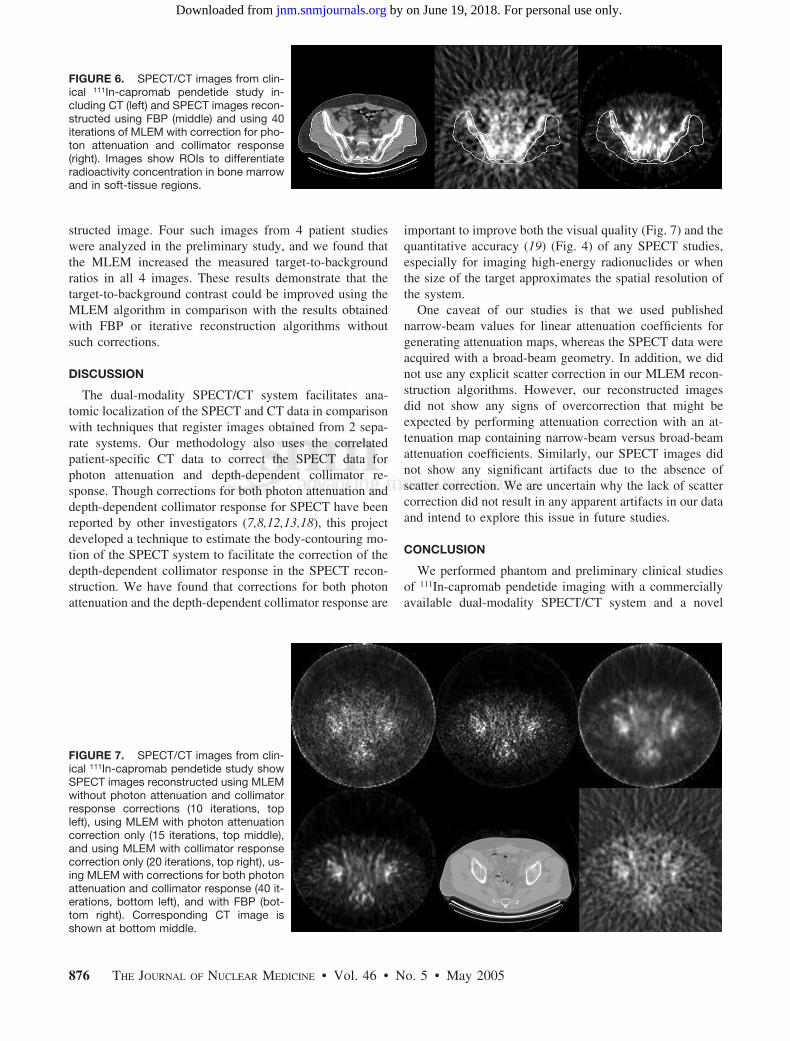
from a cylindric tank filled with a uniform radionuclide(99mTc) concentration and was assessed by comparing hor-izontal linear profiles defined across the reconstructed im-ages. Figure 4 demonstrates differences in the visual qualityand in linear count profiles for SPECT images reconstructedwith (a) FBP, (b) 20 iterations of MLEM using a correctionof collimator response that included patient contouring, and(c) 40 iterations of MLEM with corrections for both photonattenuation and collimator response. If perfectly recon-structed, we expect the profiles to be flat, reflecting theuniform radioactivity distribution in the cylindric tank.However, profiles of the 2 images without photon attenua-tion correction (Fig. 4, left and middle) show a “cuppingartifact,” indicating the effects of photon attenuation. TheSPECT image reconstructed using MLEM with CT-derivedattenuation correction shows a slight “capping artifact,”probably reflecting the lack of scatter compensation in thereconstruction of the radionuclide data.
The system spatial resolution was measured using param-eters obtained from the gaussian fit of point-spread func-
tions of the imaged line sources. These values improvedapproximately 60% (from 24.3 to 9.91 mm FWHM) whenthe image was reconstructed using 40 iterations of theMLEM algorithm that included corrections for both photonattenuation and depth-dependent collimator response incomparison with the value when the image was recon-structed using FBP.
Circular Orbit Versus Body ContourSPECT data acquired with body-contouring records the
radionuclide data with improved spatial resolution and, sub-sequently, should improve measurements of the target-to-background ratio in comparison with those acquired with acircular orbit. Therefore, we calculated the mean pixel valuein target and background regions from SPECT images of theanthropomorphic torso phantom filled with 111In. Figure 5shows ROIs drawn on corresponding slices from CT, fromSPECT using data acquired with a circular orbit, and fromSPECT using data acquired with body contouring. BothSPECT images were reconstructed with 40 iterations of aMLEM algorithm and included corrections for photon at-tenuation and collimator response. In this measurement, theSPECT data acquired with a circular orbit produced a tar-get-to-background ratio of 3.87. In comparison, the SPECTdata acquired with body contouring produced a target-to-background ratio of 4.24. The actual target-to-backgroundratio for these ROIs was approximately 7. This result indi-cates that the target-to-background ratio could be improvedwhen the SPECT is acquired using the body-contouringorbit rather than the conventional circular orbit.
Preliminary Clinical StudiesThe techniques developed from the phantom studies were
incorporated into a MLEM algorithm to reconstruct clinical111In-capromab pendetide SPECT images. The MLEM al-gorithm incorporated corrections for photon attenuation andfor depth-dependent collimator response that included thebody-contour measurement obtained from the correlatedx-ray tomograms. The tomographic data reconstructed withthe MLEM reconstruction then were compared with imagesreconstructed from the same projection data using a con-ventional FBP algorithm. The SPECT data reconstructedwith the MLEM algorithm displayed fewer streak artifacts
FIGURE 3. SNRs are plotted against it-eration number for SPECT images recon-structed with MLEM algorithm for datafrom uniform cylindric phantom filled with99mTc (left) and from anthropomorphictorso phantom filled with 111In (right).Curves are shown for FBP, for MLEM withattenuation correction only (AC), and forMLEM with correction for collimator re-sponse (CDRC).
874 THE JOURNAL OF NUCLEAR MEDICINE • Vol. 46 • No. 5 • May 2005
by on June 19, 2018. For personal use only. jnm.snmjournals.org Downloaded from
than FBP, especially in low-radioactivity regions that wereadjacent to high concentrations of radioactivity. These re-sults showed that the MLEM algorithm with corrections forphoton attenuation and depth-dependent collimator re-sponse generally improved the visual quality of the SPECTimage in comparison with conventional FBP SPECT imagesor in comparison with SPECT images reconstructed withthe MLEM algorithm without the depth-dependent collima-tor response model.
The image data reconstructed using FBP also were com-pared quantitatively with those obtained using the MLEM
algorithm with corrections for photon attenuation anddepth-dependent collimator response. These measurementswere performed on correlated SPECT and CT tomograms atthe level of the sacral base as shown in Figure 6. ROIs weredefined on the CT image and used to quantify radionuclideuptake in the corresponding SPECT image in the bonemarrow as a target region and in soft tissues posterior to thepelvis as a background region. For this specific image, thetarget-to-background ratio was 2.79 for the SPECT imagewith the MLEM reconstruction with attenuation and colli-mator response corrections and 1.98 for the FBP-recon-
FIGURE 4. SPECT images (top) of uniform cylindric phantom and corresponding count profiles (bottom) along a line throughcenter of image. SPECT images were reconstructed with FBP (left), with MLEM including collimator response correction but withoutattenuation correction (20 iterations, middle), and with MLEM including corrections for both collimator response and photonattenuation (40 iterations, right).
FIGURE 5. Target-to-background wasanalyzed using anthropomorphic phantomwith 111In-filled liver compartment contain-ing 2 spheric lesions with higher concen-trations. CT image (left) of phantom withcorresponding SPECT images recon-structed using 40 iterations of MLEM with
corrections for photon attenuation and collimator response from acquisitions with circular orbit (middle) and with body contouring(right). Circular ROI in hot spheric lesion was used to define target activity, whereas irregular ROI in liver compartment was usedto define background activity.
DUAL-MODALITY SPECT/CT IMAGING OF 111IN • Seo et al. 875
by on June 19, 2018. For personal use only. jnm.snmjournals.org Downloaded from
structed image. Four such images from 4 patient studieswere analyzed in the preliminary study, and we found thatthe MLEM increased the measured target-to-backgroundratios in all 4 images. These results demonstrate that thetarget-to-background contrast could be improved using theMLEM algorithm in comparison with the results obtainedwith FBP or iterative reconstruction algorithms withoutsuch corrections.
DISCUSSION
The dual-modality SPECT/CT system facilitates ana-tomic localization of the SPECT and CT data in comparisonwith techniques that register images obtained from 2 sepa-rate systems. Our methodology also uses the correlatedpatient-specific CT data to correct the SPECT data forphoton attenuation and depth-dependent collimator re-sponse. Though corrections for both photon attenuation anddepth-dependent collimator response for SPECT have beenreported by other investigators (7,8,12,13,18), this projectdeveloped a technique to estimate the body-contouring mo-tion of the SPECT system to facilitate the correction of thedepth-dependent collimator response in the SPECT recon-struction. We have found that corrections for both photonattenuation and the depth-dependent collimator response are
important to improve both the visual quality (Fig. 7) and thequantitative accuracy (19) (Fig. 4) of any SPECT studies,especially for imaging high-energy radionuclides or whenthe size of the target approximates the spatial resolution ofthe system.
One caveat of our studies is that we used publishednarrow-beam values for linear attenuation coefficients forgenerating attenuation maps, whereas the SPECT data wereacquired with a broad-beam geometry. In addition, we didnot use any explicit scatter correction in our MLEM recon-struction algorithms. However, our reconstructed imagesdid not show any signs of overcorrection that might beexpected by performing attenuation correction with an at-tenuation map containing narrow-beam versus broad-beamattenuation coefficients. Similarly, our SPECT images didnot show any significant artifacts due to the absence ofscatter correction. We are uncertain why the lack of scattercorrection did not result in any apparent artifacts in our dataand intend to explore this issue in future studies.
CONCLUSION
We performed phantom and preliminary clinical studiesof 111In-capromab pendetide imaging with a commerciallyavailable dual-modality SPECT/CT system and a novel
FIGURE 6. SPECT/CT images from clin-ical 111In-capromab pendetide study in-cluding CT (left) and SPECT images recon-structed using FBP (middle) and using 40iterations of MLEM with correction for pho-ton attenuation and collimator response(right). Images show ROIs to differentiateradioactivity concentration in bone marrowand in soft-tissue regions.
FIGURE 7. SPECT/CT images from clin-ical 111In-capromab pendetide study showSPECT images reconstructed using MLEMwithout photon attenuation and collimatorresponse corrections (10 iterations, topleft), using MLEM with photon attenuationcorrection only (15 iterations, top middle),and using MLEM with collimator responsecorrection only (20 iterations, top right), us-ing MLEM with corrections for both photonattenuation and collimator response (40 it-erations, bottom left), and with FBP (bot-tom right). Corresponding CT image isshown at bottom middle.
876 THE JOURNAL OF NUCLEAR MEDICINE • Vol. 46 • No. 5 • May 2005
by on June 19, 2018. For personal use only. jnm.snmjournals.org Downloaded from
SPECT iterative reconstruction method. The correlated CTscan was used to produce a patient-specific attenuation mapthat accounts for the dual-photon nature of the 111In spec-trum and also was used to define the body outline so that thegeometric response of the collimator could be corrected inSPECT data acquired with body contouring. Using thetechniques presented in this article, a SPECT/CT system,such as the GE Discovery VH Hawkeye, is capable ofimproving the visual quality of 111In-capromab pendetideSPECT images for prostate cancer detection and staging incomparison with a stand-alone SPECT system using con-ventional reconstruction algorithms.
ACKNOWLEDGMENTS
The authors gratefully acknowledge expert technical ad-vice from Aharon Peretz and Eyal Shai at GE HealthcareGlobal Nuclear Medicine and from Barbara Rogers andJohn Wolodzko at Cytogen Corp. This work is supported bythe National Cancer Institute (grant R21 CA86893), theUniversity of California Industry–University CooperativeResearch Program (grant bio 02-10296), and GE Health-care.
REFERENCES
1. Hasegawa BH, Wong KH, Iwata K, et al. Dual-modality imaging of cancer withSPECT/CT. Technol Cancer Res Treat. 2002;1:449–458.
2. Townsend DW, Carney JP, Yap JT, Hall NC. PET/CT today and tomorrow.J Nucl Med. 2004;45(suppl 1):4S–14S.
3. Seibert JA. X-ray imaging physics for nuclear medicine technologists. Part 1.Basic principles of x-ray production. J Nucl Med Technol. 2004;32:139–147.
4. Haseman MK, Rosenthal SA, Polascik TJ. Capromab pendetide imaging ofprostate cancer. Cancer Biother Radiopharm. 2000;15:131–140.
5. Schettino CJ, Kramer EL, Noz ME, et al. Impact of fusion of indium-111capromab pendetide volume data sets with those from MRI or CT in patients withrecurrent prostate cancer. AJR. 2004;183:519–524.
6. Ellis RJ, Kim EY, Conant R, et al. Radioimmunoguided imaging of prostatecancer foci with histopathological correlation. Int J Radiat Oncol Biol Phys.2001;49:1281–1286.
7. Gullberg GT, Huesman RH, Malko JA, Pelc NJ, Budinger TF. An attenuatedprojector-backprojector for iterative SPECT reconstruction. Phys Med Biol. 1985;30:799–816.
8. Blankespoor SC, Wu X, Kalki K, et al. Attenuation correction of SPECT usingx-ray CT on an emission-transmission CT system: myocardial perfusion assess-ment. IEEE Trans Nucl Sci. 1996;43:2263–2274.
9. Shepp LA, Vardi Y. Maximum likelihood reconstruction for emission tomogra-phy. IEEE Trans Med Imaging. 1982;MI-1:113–122.
10. Lange K, Carson R. EM reconstruction algorithms for emission and transmissiontomography. J Comput Assist Tomogr. 1984;8:306–316.
11. Hudson HM, Larkin RS. Accelerated image reconstruction using ordered subsetsof projection data. IEEE Trans Med Imaging. 1994;13:601–609.
12. Xia W, Lewitt R, Edholm P. Fourier correction for spatially variant collimatorblurring in SPECT. IEEE Trans Med Imaging. 1995;14:100–115.
13. van Elmbt L, Walrand S. Simultaneous correction of attenuation and distance-dependent resolution in SPECT: an analytical approach. Phys Med Biol. 1993;38:1207–1217.
14. Berger MJ, Hubbell JH, Seltzer SM, Coursey JS, Zucker DS. XCOM: PhotonCross Sections Database. Gaithersburg, MD: National Institute of Standards andTechnology. 1999. Available at: http://physics.nist.gov/PhysRefData/Xcom/Text/XCOM.html. 1999. Accessed December 15, 2004.
15. Wong KH. Multi-Modality Imaging for Improved Staging of Prostate Cancer[dissertation]. San Francisco and Berkeley, CA: Joint Graduate Group in Bio-engineering, University of California; 2002.
16. Wilk M, Yuzefovich I, Carmi R, Shrem Y. Practical multi-peak attenuationcorrection with CT data [abstract]. J Nucl Med. 2002;43(suppl):221P.
17. Sodee DB, Ellis RJ, Samuels MA, et al. Prostate cancer and prostate bed SPECTimaging with ProstaScint: semiquantitative correlation with prostatic biopsyresults. Prostate. 1998;37:140–148.
18. Tsui BM, Gullberg GT, Edgerton ER, et al. Correction of nonuniform attenuationin cardiac SPECT imaging. J Nucl Med. 1989;30:497–507.
19. Da Silva AJ, Tang HR, Wu MC, Hasegawa BH. Absolute quantitation ofmyocardial activity in phantoms. IEEE Trans Nucl Sci. 1999;46:659–666.
DUAL-MODALITY SPECT/CT IMAGING OF 111IN • Seo et al. 877
by on June 19, 2018. For personal use only. jnm.snmjournals.org Downloaded from

2005;46:868-877.J Nucl Med. Youngho Seo, Kenneth H. Wong, Mingshan Sun, Benjamin L. Franc, Randall A. Hawkins and Bruce H. Hasegawa SPECT/CT Imaging SystemCorrection of Photon Attenuation and Collimator Response for a Body-Contouring
http://jnm.snmjournals.org/content/46/5/868This article and updated information are available at:
http://jnm.snmjournals.org/site/subscriptions/online.xhtml
Information about subscriptions to JNM can be found at:
http://jnm.snmjournals.org/site/misc/permission.xhtmlInformation about reproducing figures, tables, or other portions of this article can be found online at:
(Print ISSN: 0161-5505, Online ISSN: 2159-662X)1850 Samuel Morse Drive, Reston, VA 20190.SNMMI | Society of Nuclear Medicine and Molecular Imaging
is published monthly.The Journal of Nuclear Medicine
© Copyright 2005 SNMMI; all rights reserved.
by on June 19, 2018. For personal use only. jnm.snmjournals.org Downloaded from