Embed Size (px)
Citation preview
Available online at www.sciencedirect.com J O U R N A L O F
www.elsevier.com/jflm
Journal of Forensic and Legal Medicine 15 (2008) 89–95
FORENSIC
AND LEGAL
MEDICINE
Original Communication
Correlation of foot length with height and weight in school age children
Theodoros B Grivas MD, PhD (Orthopaedic Surgeon),Constantinos Mihas MD, MSc (General Practioner, Biostatistician) *,
Angeliki Arapaki BSc (Math), MSc (Biostatistician),Elias Vasiliadis MD (Orthopaedic Surgeon)
‘‘Thriassio” General Hospital, 19600 Athens, Greece
Received 6 August 2006; received in revised form 10 May 2007; accepted 23 May 2007Available online 10 September 2007
Abstract
Even though the forensic value of the correlation between foot length and human height and weight has been studied, there is a lack ofstudies regarding this subject in school age children. The aim of this study is to evaluate this relationship in a large sample of juveniles ina European country (Greece). The sample of the study consisted of 5093 children (average age: 11.47 ± 2.71 years), who were examinedduring school period from 1996 to 2005. The Harris–Beath Mat for footprinting was the device used for measuring foot length. Statisticalanalysis included univariate and multivariate linear regression models. All statistical models were found to be significant and indicatedthat both right and left foot length were independent predictors of either height or weight. From all models fitted, the model having thegreater predictive value was described by the formula: height (cm) = 34.113 + 3.716 � (right foot length (cm)) + 1.558 (if girl) +2.499 � (age(years)), R2 = 0.852. It was also found that the models which contained right rather than left foot length as an explanatoryvariable predicted more accurately both height and weight. The results of this study suggest that foot length can estimate the stature andweight of a juvenile, especially after adjusting for age and sex.� 2007 Elsevier Ltd and FFLM. All rights reserved.
Keywords: Foot; Length; Height; Weight; Children; Forensic
1. Introduction
The anatomic parameters of human body such asheight, weight and the size of some specific parts of it havebeen thoroughly studied in literature for various pur-poses.1–10 However, it seems that the correlation betweensome of those parameters in order to estimate humanheight and weight has not been studied in particular.
The development of the human foot and the age inwhich its size approaches that of the mature human skele-ton constitute points of interest. The acquisition of themean values and of the standard deviations of those vari-ables might be useful in treating surgical pathologies such
1752-928X/$ - see front matter � 2007 Elsevier Ltd and FFLM. All rights res
doi:10.1016/j.jflm.2007.05.007
* Corresponding author. Tel.: +30 6942 612454; fax: +30 2105 534529.E-mail address: [email protected] (C. Mihas).
as talipes equinavarus, flat foot or varus metatarsal. andother familiar or acquired abnormalities in a way that itcan help making a treatment decision.6
The rise of criminality in modern societies – involvingchildren very often – is a fact.11 As a result, the elaborationof studies which can help the criminologists’ worksbecomes an essential priority. The search for many lostchildren creates a new challenge in modern criminology.Most of the times, the authorities are obliged to work withnothing more than a foot imprint as evidence.
The usage of specific anatomic parameters such asheight, weight and foot length, which can be easily accessedby many health authorities, might lead – with the help ofproper statistical analysis – to the production of linearequations which could calculate an estimated value foreither the height or the weight, should the foot length bealready known.4,7,8,12–14
erved.
90 T.B Grivas et al. / Journal of Forensic and Legal Medicine 15 (2008) 89–95
The amount of modern studies concerning the forensicvalue of measurements of basic anthropological dimensionsand especially the correlation between the foot length andthe human height and weight is not impressive.1,4,7,12–15
The interesting detail which is stressed in the above publi-cations is the simplicity of foot length as criminological evi-dence, the easiness of measuring as well as the satisfactoryprecision with which the human body weight and heightare estimated. At the same time, other publications connectthe length of foot bones with weight and height, thus help-ing in the identification of dead due to mass destruc-tions,2,16–18 while other studies underline the forensicvalue of clothes and especially footwear, as they can helpin the identification of individuals in criminologicalissues.7,12,13,19 The difficulties in the criminological workbecause of the bad situation of the body and the absenceof fingerprints when the death is violent can be overcomeby the measurement of foot length.13 The correlation offoot length with weight and height seems to exist even indead foetuses, thus estimating with satisfactory precisionembryonic body dimensions, even the age of the foetus.5
The absence of studies concerning the forensic value offoot length in juveniles in a large sample from a Europeancountry led us to conduct this study the aim of which is toestimate height and weight in school age children using atleast a foot imprint.
2. Methods
2.1. The team of participating examiners
The team of the participating examiners consisted of theresearch team and of the ‘‘Thriassio” general hospitalhealth visitors department. The teachers of the childrenmay contribute to that last process occasionally, dependingon the situation. The participation of female health visitorsfacilitated the participation of older girls. The health visi-tors also helped the younger pupils who couldn’t self serve.
2.2. The license
The Orthopaedics department required permission fromthe administrative council of the hospital, which acted offi-cially in order to acquire permission from the ministry ofeducation. The last was necessary in order to enter andwork in the schools.
2.3. The material
The material consisted of two parts: The animate (stu-dents of the schools) and the inanimate (the protocol whichwas used, the application and approval form signed by theparents, the letter to the parents for re-examination of theirchildren, the tools such as the height and weight measurerand the Harris–Beath mat for foot printing.19,20) All theHelsinki declarations (1975) had been considered. Theapplication and approval agreement printed form was
delivered two days earlier to the students, in order to returnit signed by their parents.
The stature was measured using a metal scale while theweight measurer was an electronic one, accurate to within500 g. Both instruments (metal scale and electronic weightmeasurer) carried the CE21 mark, meeting all the essentialhealth and safety requirements set out in European UnionDirectives. The students wore light clothing when theywere measured. The metric system which was used wasthe European standard with increments in cm and kg,respectively. Foot length was the maximum distancebetween the most anterior and posterior projecting partof the footprint on the Harris–Beath Mat and was mea-sured with a sliding caliper. Both of the feet were measuredin all of the participants.
The schools that the investigation team was authorisedto visit were 90 primary and 36 high schools with a totalof 21,234 students in various municipalities near ThriassioHospital, Elefsina, Attica, Greece. This an urban, industri-alized suburb not far away (�20 km) from Athens.
The sample size was assessed prior to the start of thestudy by power analysis which showed that a number of4203 participants would be adequate to detect two-sidedmean differences of 0.5% in foot length and could achievestatistical power 90% at a probability level of 0.05. In addi-tion, the authors increased this number by 25% to a total of5254 in order to counter for potential low response. Thesample should also follow the age and sex distributionaccording to national census,22 in order to be representa-tive of the population studied.
The students were examined during school period(September to May) from 1996 to 2005. The presence ofthe teachers was very useful, in order for the study proce-dure to be successful. The examination rooms were com-fortable, illuminated, clean and heated classrooms, withenough chairs and tables for the students and the examin-ers. Curtains were placed in order to protect the studentsfrom indiscrete colleagues.
2.4. The data processing
Two different assistants performed height, weight and(right and left) foot length measurements. In order to assessthe intra- and inter- observer error of measurements, thefirst 100 children who participated to the study were exam-ined by the two different assistants in the same day. Thesame children were re-examined two days after the firstmeasurement by the same assistants. The coefficient of reli-ability (R) was then calculated using the formula:
R ¼ 1�
PD2
2N
� �
SD2
0@
1A, where D is the difference between the
two measurements (of the same examiner for calculatingintra-observer reliability, or of the two examiners for calcu-lating inter-observer reliability), N is the sample size (100 inour case) and SD is the standard deviation of all measure-ments. All coefficients which tested the intra- and inter-

T.B Grivas et al. / Journal of Forensic and Legal Medicine 15 (2008) 89–95 91
observer reliability for the three aforementioned anthropo-metric characteristics exceeded 0.95, securing the reliabilityof the measurements. The same procedure was performedfour times during the study and the results were similar.The normality of the data was verified with the Shapiro–Wilk test for normal data. The statistical analysis includedthree steps; firstly, a Student’s t-test was conducted in orderto compare the independent variables (age, right footlength, left foot length) as well as the dependent variables(height, weight) between the two genders. Secondly, themagnitude of the linear correlation between the indepen-dent and the dependent variables was estimated by calcu-lating the Pearson r correlation coefficient. Thirdly, fourunivariate (2 dependent � 2 main independent variables)and four multivariate regression models (2 for the twodependent variables � 2 main independent variables,adjusting for age and sex) were constructed. The overallsignificance of the model was based on the calculation ofF statistic, whereas, the t statistic was estimated for eachvariable added in the multivariate model. The best modelwas chosen according to the values of R2 statistic. R2 isthe proportion of variation in the dependent variable pre-dicted by the independent variable(s). The R2 is used tocompare the linear regression models which have thesame amount of independent variables, whereas, theadjusted R2 is used to compare the explanatory valueof regression models with the same dependent and differ-ent amount of independent variables. After the mainanalysis was performed, a reference sample of 51 (1%of our main sample) was retained from the same popula-tion, keeping the same age and sex distribution in orderto test the reliability of the formulae produced. Regres-sion functions using the characteristics of those individu-als were separately calculated producing estimated weightand height. The mean estimated characteristics were com-pared with the real ones using Student’s t-test. All statis-tics were considered significant if p-value was less than0.05.
The Data were analyzed using STATAtrade (Version 9.0,Stata Corporation, College station, TX 77845, 800-782-8272).
3. Results
The sample of the study consisted of 5093 children (2535boys, 49.77%, 2558 girls, 50.23%). The response ratio was96.93%. The average age of the sample was 11.47 ± 2.71years.
The descriptive statistics such as the means and stan-dard deviations for the dependent variables (height,weight) as well as the independent variables (age, rightfoot length, left foot length) are classified by sex andare shown in Table 1. According to the results, a signif-icant difference was found in right and left foot lengthbetween the two genders. The age, height and weightdid not differ significantly.
The simple bivariate Pearson r correlations between thedependent and independent variables are shown for bothgenders in Table 2. All coefficients were statistically signif-icant (p < 0.001) and indicated a linear relationshipbetween the variables. The relationships described wererather strong, not falling below 0.733. The relationshipbetween right and left foot length and height was strongerin boys than in girls (0.903, 0.898 vs. 0.855, 0.856, respec-tively). The above difference was also found regarding thetwo main independent variables and weight (0.818, 0.808vs. 0.756, 0.757, respectively).
The scatter-plot matrix describing all possible relation-ships between the independent and dependent variables foreach gender is shown in Fig. 1. The linear relationship whichwas calculated using Pearson r in Table 2 is described graph-ically in those matrices. Four univariate linear regressionmodels were constructed. The dependent variables wereheight and weight, whereas, the independent variables wereright and left foot length. All models were found to be statis-tically significant (F-test p-value < 0.001). The results of theunivariate linear regression models are shown in Table 3.
The formulae which were produced after the univariatelinear regression modelling in order to estimate height andweight when sex and age are unknown are the following:
Height:
Height ðcmÞ ¼ 17:369þ 5:879� ðright foot length ðcmÞÞ;¼ 17:592þ 5:861� ðlight foot length ðcmÞÞ:
Weight:
Weight ðkgÞ ¼ �71:142þ 5:259� ðright foot length ðcmÞÞ;¼ �70:385þ 5:217� ðleft foot length ðcmÞÞ:
In order to estimate height and weight using the rightand left foot length adjusting for sex and age, four newmultivariate linear regression models were constructed.The results of the multivariate modelling are shown inTable 4. The formulae produced by multivariate linearregression modelling when the sex and age of the childare known are:
Height:
Boys:
Height ðcmÞ ¼ 34:113þ 3:716� right foot length ðcmÞþ 2:499� ðage ðyearsÞÞ¼ 33:869þ 3:689� left foot length ðcmÞÞþ 2:533� ðage ðyearsÞÞ:
Girls:
Height ðcmÞ ¼ 34:113þ 3:716� ðright foot length ðcmÞÞþ 1:558þ 2:499� ðage ðyearsÞÞ
¼ 33:869þ 3:689� ðleft foot length ðcmÞÞþ 1:774þ 2:533� ðage ðyearsÞÞ:
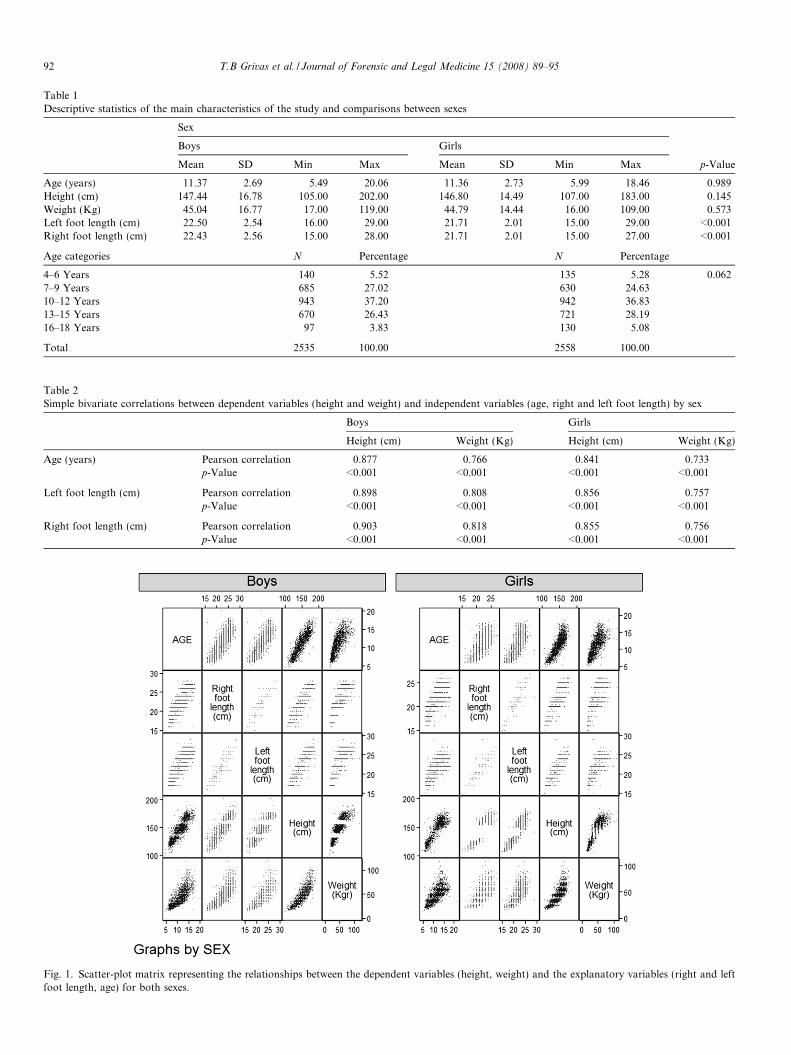
Table 1Descriptive statistics of the main characteristics of the study and comparisons between sexes
Sex
Boys Girls
Mean SD Min Max Mean SD Min Max p-Value
Age (years) 11.37 2.69 5.49 20.06 11.36 2.73 5.99 18.46 0.989Height (cm) 147.44 16.78 105.00 202.00 146.80 14.49 107.00 183.00 0.145Weight (Kg) 45.04 16.77 17.00 119.00 44.79 14.44 16.00 109.00 0.573Left foot length (cm) 22.50 2.54 16.00 29.00 21.71 2.01 15.00 29.00 <0.001Right foot length (cm) 22.43 2.56 15.00 28.00 21.71 2.01 15.00 27.00 <0.001
Age categories N Percentage N Percentage
4–6 Years 140 5.52 135 5.28 0.0627–9 Years 685 27.02 630 24.6310–12 Years 943 37.20 942 36.8313–15 Years 670 26.43 721 28.1916–18 Years 97 3.83 130 5.08
Total 2535 100.00 2558 100.00
Table 2Simple bivariate correlations between dependent variables (height and weight) and independent variables (age, right and left foot length) by sex
Boys Girls
Height (cm) Weight (Kg) Height (cm) Weight (Kg)
Age (years) Pearson correlation 0.877 0.766 0.841 0.733p-Value <0.001 <0.001 <0.001 <0.001
Left foot length (cm) Pearson correlation 0.898 0.808 0.856 0.757p-Value <0.001 <0.001 <0.001 <0.001
Right foot length (cm) Pearson correlation 0.903 0.818 0.855 0.756p-Value <0.001 <0.001 <0.001 <0.001
Fig. 1. Scatter-plot matrix representing the relationships between the dependent variables (height, weight) and the explanatory variables (right and leftfoot length, age) for both sexes.
92 T.B Grivas et al. / Journal of Forensic and Legal Medicine 15 (2008) 89–95
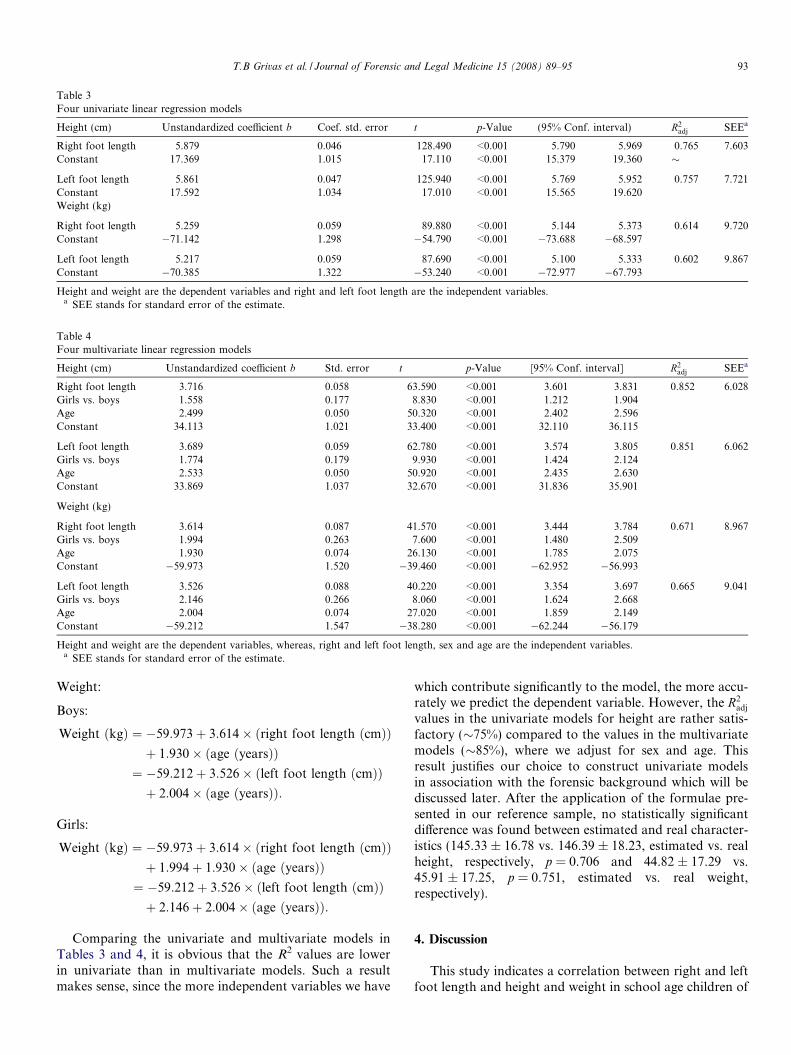
Table 3Four univariate linear regression models
Height (cm) Unstandardized coefficient b Coef. std. error t p-Value (95% Conf. interval) R2adj SEEa
Right foot length 5.879 0.046 128.490 <0.001 5.790 5.969 0.765 7.603Constant 17.369 1.015 17.110 <0.001 15.379 19.360 �
Left foot length 5.861 0.047 125.940 <0.001 5.769 5.952 0.757 7.721Constant 17.592 1.034 17.010 <0.001 15.565 19.620Weight (kg)
Right foot length 5.259 0.059 89.880 <0.001 5.144 5.373 0.614 9.720Constant �71.142 1.298 �54.790 <0.001 �73.688 �68.597
Left foot length 5.217 0.059 87.690 <0.001 5.100 5.333 0.602 9.867Constant �70.385 1.322 �53.240 <0.001 �72.977 �67.793
Height and weight are the dependent variables and right and left foot length are the independent variables.a SEE stands for standard error of the estimate.
Table 4Four multivariate linear regression models
Height (cm) Unstandardized coefficient b Std. error t p-Value [95% Conf. interval] R2adj SEEa
Right foot length 3.716 0.058 63.590 <0.001 3.601 3.831 0.852 6.028Girls vs. boys 1.558 0.177 8.830 <0.001 1.212 1.904Age 2.499 0.050 50.320 <0.001 2.402 2.596Constant 34.113 1.021 33.400 <0.001 32.110 36.115
Left foot length 3.689 0.059 62.780 <0.001 3.574 3.805 0.851 6.062Girls vs. boys 1.774 0.179 9.930 <0.001 1.424 2.124Age 2.533 0.050 50.920 <0.001 2.435 2.630Constant 33.869 1.037 32.670 <0.001 31.836 35.901
Weight (kg)
Right foot length 3.614 0.087 41.570 <0.001 3.444 3.784 0.671 8.967Girls vs. boys 1.994 0.263 7.600 <0.001 1.480 2.509Age 1.930 0.074 26.130 <0.001 1.785 2.075Constant �59.973 1.520 �39.460 <0.001 �62.952 �56.993
Left foot length 3.526 0.088 40.220 <0.001 3.354 3.697 0.665 9.041Girls vs. boys 2.146 0.266 8.060 <0.001 1.624 2.668Age 2.004 0.074 27.020 <0.001 1.859 2.149Constant �59.212 1.547 �38.280 <0.001 �62.244 �56.179
Height and weight are the dependent variables, whereas, right and left foot length, sex and age are the independent variables.a SEE stands for standard error of the estimate.
T.B Grivas et al. / Journal of Forensic and Legal Medicine 15 (2008) 89–95 93
Weight:
Boys:
Weight ðkgÞ ¼ �59:973þ 3:614� ðright foot length ðcmÞÞþ 1:930� ðage ðyearsÞÞ
¼ �59:212þ 3:526� ðleft foot length ðcmÞÞþ 2:004� ðage ðyearsÞÞ:
Girls:
Weight ðkgÞ ¼ �59:973þ 3:614� ðright foot length ðcmÞÞþ 1:994þ 1:930� ðage ðyearsÞÞ¼ �59:212þ 3:526� ðleft foot length ðcmÞÞþ 2:146þ 2:004� ðage ðyearsÞÞ:
Comparing the univariate and multivariate models inTables 3 and 4, it is obvious that the R2 values are lowerin univariate than in multivariate models. Such a resultmakes sense, since the more independent variables we have
which contribute significantly to the model, the more accu-rately we predict the dependent variable. However, the R2
adj
values in the univariate models for height are rather satis-factory (�75%) compared to the values in the multivariatemodels (�85%), where we adjust for sex and age. Thisresult justifies our choice to construct univariate modelsin association with the forensic background which will bediscussed later. After the application of the formulae pre-sented in our reference sample, no statistically significantdifference was found between estimated and real character-istics (145.33 ± 16.78 vs. 146.39 ± 18.23, estimated vs. realheight, respectively, p = 0.706 and 44.82 ± 17.29 vs.45.91 ± 17.25, p = 0.751, estimated vs. real weight,respectively).
4. Discussion
This study indicates a correlation between right and leftfoot length and height and weight in school age children of
94 T.B Grivas et al. / Journal of Forensic and Legal Medicine 15 (2008) 89–95
an urban area in Greece. This study underlines this relationand quantifies it as a linear equation formula. The determi-nation of height and weight by using a footprint as evi-dence from a crime scene can be extremely useful toforensic scientists and criminologists in search of a lostchild not only because a suspect or – more often in children– a victim can be indicated but also because an attestationcan be supported.7,12
According to our findings, a significant relationshipbetween height, weight and foot length was found, eitherregardless or adjusting for sex and age. The large size ofthe sample adds to the power of the analysis and makesour study the largest of its kind in this age group. Otherauthors have also written on this subject but never inschool age children.7,8,12,13
Even though the results of our study suggest the linearrelationship between foot length and stature, genetic, nutri-tional, environmental and behavioral factors play also asubstantial role.23,24
Bavdekar et al. and Ashizawa et al. found a strongerrelationship between foot length and weight in Indian chil-dren up to two years.25,26 This difference might exist due todifferent age, nutrition patterns and environment.
The different growth pattern in boys and girls due tohormonal reasons results to a different skeletal maturityduring adolescence.27,28 Girls show a higher growth ratebetween 10 and 15 years old, whereas, boys follow after3–4 years. This fact coincides with the results of our study,since either the left or right foot length differ significantlybetween boys and girls leading us to the construction ofa multivariate model adjusting for sex.
The characteristics of our sample differed from otherstudies, mainly because of the different age of our sam-ple.7,8,12,13 Therefore, any comparisons regarding theregression formulae with those studies might be arbitrary.The relationship between right and left foot length andheight was stronger compared to weight (R2 = 0.851,0.852 vs. 0.671, 0.665).
Although the adjusted R2 values for these modelsclearly reflect a strong relationship between foot/bootlength and stature, individual 95% prediction limits foreven the best models are ±86 mm (3.4 in.). This suggeststhat models estimating stature from foot/shoe-printsmay be useful in the development of subject descriptionsearly in a case but, because of their imprecision, maynot always be helpful in excluding individual suspectsfrom consideration.
Not only the adjusted R2 values for the multivariatemodels indicate a significant relationship between footlength and height and weight but the best individual 95%prediction for height may vary for ±6.028 cm as it isderived from the standard error of the estimate (SEE)shown in Table 4. Even though this variance is better thanthose described in other studies,12 it is still big enough notto be useful during a trial for example. However, it can behelpful during the initial investigation of a case from thepolice authorities.
Based on the same results, it is evident that the modelswhich contain foot length, age and sex predict better theheight and weight than the univariate models containingonly foot length. It should be stressed, however, that theconstruction of univariate linear regression models wasnot an unjustified choice. The sample of that study con-tained other variables which could contribute to a moredescriptive linear regression model. Such variables wereparents’ weight and height. The reason that those variableswere not used was the specific aim of that study. The aim ofthis study was not just to describe somatometric character-istics given all the candidate independent variables for apaediatric research for example. Rather, it was mainlyforensic because evidence from a crime scene may bescarce, for example only a footprint.
All in all, prediction of body height and weight in chil-dren from various crime scene evidence has serious pros-pect for forensic science. In our study, it is shown thateven a single clue like a footprint can predict the statureand weight of a child with satisfactory accuracy. The inter-national literature regarding this subject is rather limited,at least in this age group. This study adds new data con-cerning this sensitive social group.
References
1. Barker SL, Scheuer JL. Predictive value of human footprints in aforensic context. Med Sci Law 1998;38:341–6.
2. Cheng JC, Leung SS, Chiu BS, et al. Can we predict body height fromsegmental bone length measurements? A study of 3647 children. J
Pediatr Orthop 1998;18:387–93.3. Cheng JC, Leung SS, Leung AK, et al. Change of foot size with
weightbearing. A study of 2829 children 3 to 18 years of age. Clin
Orthop 1997;342:123–31.4. Jasuja OP, Manjula. Estimation of stature from footstep length.
Forensic Sci Int 1993;61:1–5.5. Mandarim-de-Lacerda CA. Foot length growth related to crown-
rump length, gestational age and weight in human staged fresh fetuses.An index for anatomical and medical use. Surg Radiol Anat
1990;12:103–7.6. Grivas TB, Dounis E, Kyritsis G, et al. Foot length in children 2-12
years old in Athens. Iatriki 1987;51:501–6 (In Greek).7. Ozden H, Balci Y, Demirustu C, et al. Stature and sex estimate using
foot and shoe dimensions. Forensic Sci Int 2005;147(2–3):181–4. Jan29.
8. Sanli SG, Kizilkanat ED, Boyan N, et al. Stature estimation based onhand length and foot length. Clin Anat 2005;18(8):589–96.
9. Coughlin MJ, Shurnas PS. Hallux rigidus: demographics, etiology,and radiographic assessment. Foot Ankle Int 2003;24:731–43.
10. Kulthanan T, Techakampuch S, Bed ND. A study of footprints inathletes and non-athletic people. J Med Assoc Tha 2004;87:788–93.
11. Sourander A, Elonheimo H, Niemela S, et al. Childhood predictors ofmale criminality: a prospective population-based follow-up study fromage 8 to late adolescence. J Am Acad Child Adolesc Psychiatry
2006;45(5):578–86.12. Gordon CC, Buikstra JE. Linear models for the prediction of stature
from foot and boot dimensions. J Forensic Sci 1992;37:771–82.13. Jasuja OP, Singh J, Jain M. Estimation of stature from foot and shoe
measurements by multiplication factors: a revised attempt. Forensic
Sci Int 1991;50:203–15.14. Winkelmann W. Use of footprints, especially forefoot prints, from the
forensic viewpoint. Z Rechtsmed 1987;99:121–8.
T.B Grivas et al. / Journal of Forensic and Legal Medicine 15 (2008) 89–95 95
15. Ozaslan A, Iscan MY, Ozaslan I, et al. Estimation of stature frombody parts. Forensic Sci Int 2003;132(1):40–5.
16. Owsley DW, Mann RW. Positive identification based on radiographicexamination of the leg and foot. A case report. J Am Podiatr Med
Assoc 1989;79:511–3.17. Rich J, Dean DE, Cheung YY. Forensic implications of the foot and
ankle. J Foot Ankle Surg 2003;42:221–5.18. Zviagin VN, Eremenko EA. Determination of some somatic body
dimensions by osteometric foot measurements. Sud Med Ekspert
2004;47:29–33.19. Grivas TB, Dounis E, Kyritsis G, et al. A study of shoe wear and
association with foot morphology and functionality in children. Info
Orthopaedics and Traumatology 2001;22:14–8 (In Greek).20. Grivas TB, Efstathiou P, Dounis E, et al. The study of foot
dimensions using the Harris–Beath mat in Hellenic Army. Greek
Orthopaedics and Traumatology. 1987;38:222–8 (In Greek).21. European Commission. Enterprise. CE Marking. Available from:
<http://ec.europa.eu/enterprise/newapproach/legislation/guide/docu-ment/chap07.pdf>. (Last accessed on 7 May 2007).
22. General Secretariat of National Statistical Service of Greece. Greece infigures. [Updated 2006]. Available from: <http://www.statistics.gr/eng_tables/hellas_in_numbers_eng.pdf> (last accessed on 7 May 2007).
23. Malina RM. Physical activity and training: effects on statureand adolescent growth spurt. Med Sci Sports Exerc 1994;26:759–66.
24. Benefice E, Garnier D, Ndiaye G. High levels of habitual physicalactivity in west African adolescent girls and relationship to matura-tion, growth, and nutritional status: results from a 3-year prospectivestudy. Am J Hum Biol 2001;13:808–20.
25. Bavdekar SB, Sathe S, Jani P. Prediction of weight of Indian childrenaged upto two years based on foot-length: implications for emergencyareas. Indian Pediatr 2006;43(2):125–30.
26. Ashizawa K, Kumakura C, Kusumoto A, et al. Relative foot size andshape to general body size in Javanese, Filipinas and Japanese withspecial reference to habitual footwear types. Ann Hum Biol
1997;24(2):117–29.27. Grivas TB, Vasiliadis E, Mouzakis V, et al. Association
between adolescent idiopathic scoliosis prevalence and age atmenarche in different geographic latitudes. Scoliosis
2006;1(1):9.28. Stavlas P, Grivas TB, Michas C, et al. The evolution of foot
morphology in children between 6 and 17 years of age: a cross-sectional study based on footprints in a Mediterranean population. J
Foot Ankle Surg 2005;44(6):424–8.