Embed Size (px)
Citation preview

Journal 0/ Glaciology, Vo!. 35, No. 121, 1989
SURFACE ROUGHNESS AND BULK HEAT TRANSFER ON A GLACIER: COMPARISON WITH EDDY CORRELATION
By D. SCOTT MUNRO·
(Cooperative Institute for Research in Environmental Sciences, University of Colorado,
Boulder, Colorado 80309-0449, U.S.A.)
ABSTRACT. More than lOO simultaneously measured profiles of wind speed and temperature were analyzed to determine the aerodynamic and thermal roughness lengths of glacier ice. The results proved to be extremely se nsitive to measurement height, which is difficult to define precisely on the hummocky terrain of a glacier. Therefore, aerodynamic roughness lengths were estimated from the microtopography of the surface, yielding 2.46 mm for ice, and 5.5 mm for snow. Despite the indeterminate nature of the profile analysis, it did support the view that the thermal roughness length must decrease as the roughness Reynolds number increases, a relationship which has been modelled in the literature. Good agreement between bulk-transfer estimates and eddy-correlation measurements of fhe sensible heat-flux density on melting ice and snow was obtained by combining the aerodynamic roughness length with a suitable model for thermal roughness length.
INTRODUCTION
The bulk aerodynamic method provides the most practical means of estimating the sensible heat component of ice and snow melt because the only data requirements are wind speed and temperature measurements at one height above the surface. Extreme precision is not required, so thermograph data can be useful. Robust instrumentation can thus be used to allow continued application of the method over long time periods under difficult field conditions.
There remains, however, much uncertainty about bulk-transfer theory, particularly the calculation of exchange coefficients (Kuhn, 1979; Moore, 1983; Braithwaite, 1988; Hay and Fitzharris, 1988). The problem stems from the variety of conclusions about how to treat stability effects and, in particular, the large range of reported roughness lengths (Inoue, 1989a). Seldom does one find a si tuation in which the bulk- transfer procedure can be compared with a good independent method, particularly if one is dealing with a glacier site.
Such a comparison was available for this study, in the form of eddy-correlation measurements. Attempts to calcu late suitable bu lk-transfer coefficients, to obtain agreement between the two methods, showed that accurate roughness-length estimates are by far the most important requirement. Therefore, they are the focus of this paper.
THEORETICAL BACKGROUND
Eddy correlation (Oke, 1987) is the most direct procedure for measuring the sensible heat-flux density, QH:
(I)
·Present address: Department of Geography, University of Toronto, Erindale Campus, Mississauga, Ontario L5L I C6, Canada.
where p is the air density, cp is the specific heat of air at constant pressure, w' and T are the respective deviations of vertical velocity and temperature from their mean values. The method is quite accurate if proper care is taken with sensor design, and field deployment. It is not a convenient method because it uses delicate sensors which require constant care in the field. There is always a substantial risk of damage during bad weather, which can occur unexpectedly in the mountainous surroundings of glacier sites.
The bulk-transfer procedure is preferred over melting ice and snow because the required instrumentation is simple to deploy and to maintain, thus allowing long periods of unattended use in most weather conditions. The theory can be developed from an expression analogous to Equation (I):
(2)
in which u. is the friction velocity, or wind-speed scaler, and T. is a temperature scaler. They are estimated from wind-speed and temperature profiles by taking logarithms of the heights, and adding a suitable stability correction.
If the surface is melting ice, or snow, the scalers can also be estimated from the wind speed, uz ' and temperature, T z, measured at height = above the ground:
[In(z/zo) + az/ L]
kL
[In(=/ =t) + az/ L]
where k is von Karmim's constant (0.41), are, respectively, the roughness lengths for temperature. The empirical constant, a, stability correction, which varies according the Monin-obukhov length scale, L:
L
(3a)
(3b)
and Zo and Zt wind speed and is part of the to the value of
(4)
where g is the gravitational acceleration and T is the absolute temperature of the air between the surface and the measurement height.
The bulk-transfer formula for sensible heat exchange is obtained by substituting Equation (3) into Equation (2):
[In(z/ zo) + az/ L] (In(=/ =t) + az/ L] (5)
The inherent assumption that surface temperature is O°C for melting ice and snow eliminates a difficult measurement problem. There remains, however, a procedural problem in that the accurate calculation of L requires a priori knowledge of u* and QH. Also, it has been assumed that the stability corrections for wind speed and temperature are
343

Journal of Glaciology
similar, a view which is not universally shared, but against which there is not very compelling evidence (Moore, 1983).
Many investigators prefer to avoid the use of L altogether (Moo re, 1983; Marcus, 1985; Hay and Fitzharris, 1988), expressing stability in terms of the bulk Richardson number, because it can be evaluated directly from windspeed and temperature data. The Monin--0bukhov length is retained here because much of the good stability-analysis work is expressed in terms of L (Dyer, 1974), and the formulation is preferred by many others, particularly those who work with eddy correlation (8anke and others, 1976; Inoue, 1989a). The problem of requiring a priori knowledge is circumvented by iteration, an approach which has been successfully applied elsewhere (8erkowicz and Prahm, 1982; Lee, 1986). In the first iteration, Equations (3a) and (5) are evaluated for the neutral case, where z/ L = O. The results are used to calculate the first estimate of L, which is applied to the subsequent evaluation of u* and Qw The cycle is repeated until no significant change occurs, a condition which is satisfied in five iterations (Table I). Most of the correction occurs in the second iteration.
TABLE 1. ITERATIVE EVALUATION OF QH (W m- 2)
FROM EQUATION (5), TAKING <X ; 5 FOR TWO zo' Zt VALUES
Iteration zo' Zt = 0.06 mm zo' Zt = 0.6 mm
I 55.9 108.8 2 45 .6 93.3 3 44.8 92.5 4 44.7 92.4 5 44.7 92.4
The effect of the stability correction, taking <X; 5 (Dyer, 1974), is to reduce QH to approximately 80% of the neutral flux estimate in both of the iteration sequences shown (Table I). Thus, such variation as there is in the <X
literature signifies a relatively small uncertainty in QH' The two sets of flux densities differ by a factor of two, however, reflecting the order of magnitude difference in the values of Zo and Zt. Roughness lengths reported from various ice and snow studies vary by at least an order of magnitude (Moore, 1983; Marcus, 1985) and, as noted by Inoue (1989a), can do so even for a single study. This inspires very little confidence in using borrowed values, so it seems best to obtain new values, either from profile data, or from microtopographic informat ion.
Profile estimates of the roughness lengths begin with the log-linear equation, in the form expressed by Webb (1970):
(6a)
(6b)
where Yu ; Llu/ Ll{ln z), Yt ; LlT/Ll(ln z) and X = lIz/Ll{ln z ). Plots of Yu and Y t against X can be fitted by linear regression (Fig. I) , so Y u ; u*/k and Y t ; T* /k at X = O. It follows that Equation (2) can be evaluated from profile data without knowledge of either <X or L.
Given the scalers, roughness lengths are obtained by re-arranging Equation (3):
kuZ z In Zo In z - -+ <X- (7a)
u* L
kTz z In Zt In z - -+ <X -. (7b)
T* L
Correction for stability is obtained by re-arranging Equation (6) to solve for <x/ Land substituting the solution into Equation (7):
344
1.5
!?' 1.0 .. E ..... >-~
0.5
a
0+~....-r-r ....... "I"""I"""
1.0 .... .u .... ,:-
0 . 5
b
o 0.5 X[m]
1.0
Fig. 1. Example of (a) wind speed. alld (b) temperatureprofile analysis for 13.00 h. 25 August 1971.
kuz -=-[kYu _ I] In Zo In z - + (8a) u* X u*
kTz - [kY t ] In Zt In Z - + ~T.-l (8b) T*
Each measurement height , z, is associated with one or more sets of X and Y, depending upon the number of measurements taken . The plot in Figure I is based upon four measurements, so it yields six roughness lengths per profile from which to co mpute an ave rage.
It is rare in ice and snow studies to have access to the precise instrumentation required for the evaluation of Equation (8). Therefore, some investigators have used Lettau's (1969) method of roughness-element description to estimate zo:
0 .5h*s/ S (9)
where h* is an effective height for the roughness elements, S is their density, or frequency per unit area, and s is the silhouette area of roughness elements measured in a vertical plane perpendicular to the wind direction. An equivalent expression does not exist for z t because it is a function of the flow (Owen and Thompson, 1963), which is characterized by the roughness Rey nolds number, Re*; UHo/v, where v is the kinematic viscosity of the air. Various attempts to model In(=t/ 20) as a function of Re* have been described (Owen and Thompson, 1963; Garratt and Hicks, 1973; Andreas, 1987).
The idea that 20 can be computed from microtopographic information seems suspicious to those who prefer to trust instrumentation, leaving Equation (9) as a method of last resort. It will be shown here that such trust may be misplaced when measurements are taken close to the surface, as they are here, and that Equation (9), combined with a suitable model for In(ztl zo) ' is likely to provide the simplest, most accurate approach to dealing with the roughness-length problem.

EXPERIMENTAL DETAILS
Micrometeorological data were collected at two sites on Peyto Glacier during three summers. One site was the exposed ice of the glacier tongue, which exhibits a distinctive grain, aligned parallel to the ice flow. The grain is imparted by a continuous cover of elongated ice hummocks, of various sizes, the long axes of which point down the glacier tongue. The other site was a ripe snow cover in the upper basin of the glacier, described by Fohn (1973) as comprising sun cups, where there appeared to be no preferred orientation to the pattern. Katabatic forces are important, even dominant at times, in establishing the surface-wind regime (Munro and Davies, (977). Therefore, down-slope winds which blow approximately parallel to the direction of the ice grain are common over the glacier tongue, particularly during anticyclonic weather conditions (Stenning and others, 1981).
Data were first collected in 1971, when detailed temperature and wind-profile measurements were made at the ice site to determine boundary-layer thickness and stability relationships. The instruments were mounted on independent masts located 10 m apart across the ice grain. The sensors were a sensitive anemometer system (Model 106, Thornthwaite Associates, U.S.A.), with a precision of ±I% of indicated wind speed, and a ventilated thermometer system (modified design of Lourence and Pruitt (1969», with a precision of ±0.01°C. The data were collected on strip charts and subsequently digitized.
Among more than 600 profiles collected, only 122 were found to have sufficient resolution for boundary-layer analysis, so they are the basis of the roughness-length estimates reported here. Munro and Davis (1977) found that in such cases only the first four measurement levels, at 0.25, 0.5, 0.75, and I m above the ice, were positioned within the boundary layer, so the application of Equation (8) is restricted to these levels. Later, Munro and Davies (1978) found equality between the stability corrections for temperature and wind speed, with ex = 4.5, a value which is close to the number 5 quoted by Dyer (1974) as being typical of findings in stable conditions .
Simultaneous bulk-transfer and eddy-correlation measurements were made at the ice site in 1987, and at the snow site in 1988. Instruments were mounted at I m above the surface, a height which corresponds with expected boundary-layer thickness. Wind speed was measured with a contact closure anemometer (Model 014A, Campbell Scientific, U.S.A.) to ± 1.5% of the measured speed, while temperature was measured with a resistance thermometer (Model 207, Campbell Scientific, U.S.A.) to a precision of ±O.I°C. Temperature and wind-speed measurements were repeated at 5 m above the ice and 4 m above the snow. The data were processed by a compact data logger (Model CR 21 X, Campbell Scientific, U.S.A.) and recorded on tape at hourly intervals.
The same type of data logger was used to record eddy correlation data taken at I m above the surface, using a commercially available sensor (Model CA 27, Campbell Scientific, U.s.A.), which follows the design of Campbell and Unsworth (1979). The I m height was chosen as a compromise between being far enough away from the surface to sense all significant eddy fluctuation, and close enough to be within the boundary layer. A 5 Hz sampling rate was chosen, the fastest which could be accommodated by the data logger, and 5 min averages were stored on tape . They were averaged further in the subsequent data analysis to produce hourly sensible heat-flux values against which to compare the bulk-transfer estimates.
Although eddy correlation can be precise to within ±IO%, it is subject to systematic error (Tanner, (988) . The sampling rate may be too slow to sense all the turbulence, thus reducing Qw This is mitigated by locating the sensor as far away from the surface as possible, though the maximum distance possible here was only I m. Both sites were located on gently sloping surfaces, where the mean vertical wind speed can deviate from zero, thus changing QH from its true value. The decision to record 5 min averages may have filtered out significant error from this source. Weather presented a problem, as only 71 h of eddycorrelation data were collected over the ice before a summer storm stopped operation of the equipment. The
MU/zro: Sur face roughness and bulk heat transfer
same situation occurred at the snow site after just 6 h of data collection.
Microtopographic data were also collected on the ice in 1971 by conducting a micro-relief survey on a 20 m by 20 m grid, aligned with the ice grain. Elevations were leveled at 0.5 m intervals across the grain, and I m intervals along the grain, to establish a zero reference level for the instrument masts. The grid also serves as an excellent data source for roughness-length work because it comprised transects which can be analysed either across the grain, or along the grain of the ice. Detailed snow-surface measurements were made near the snow site in 1970 by Fohn (1973), who represented the sun cups as sine waves and calculated Zo accordingly.
Other methods of collecting microtopographic data were tried in 1987 and 1988. One consisted of laying down a 5 m long aluminium pole across the ice grain, the direction most likely to be perpendicular to the wind, and allowing it to melt into position for a few days. Then 30 measurements of the height of the ice surface, relative to the centre line of the pole, were taken at equal intervals along the length of the pole. The pole was subsequently moved to five other sites, where the procedure was repeated. This was not attempted on the snow in 1988, but the pattern of ripe snow stood out clearly in photographs of the instrumentation. Because instrument dimensions are known quantities, it was found that a typical size and density could be assigned to the sun cups by comparing them to the instruments.
RESULTS AND DISCUSSION
Mean roughness lengths obtained from wind-speed and temperature profile analysis were found to be extremely sensltlve to measurement height (Fig. 2). The effect of adding 0.1 m to each :: in Equations (7) and (8) is to increase Zo and Zt by an order of magnitude. The corresponding effect upon the sensible heat flux is to double the value of QH' Ice hummocks can easily have a local relief of 0.3 m, or more, thus making it impossible to define a zero reference by eye with sufficient accuracy for profile work. Even if one can set a zero reference from a micro-relief survey, as was done in this case, there is no assurance that it represents the zero level for the flow, which responds to surface conditions far up-wind of the limits of the micro-relief survey.
.... E E ..
4
3
N 2 o
N
1
I I I I
I I
I I
I I :
I /
400
300
.... N
'E ~
200 "";; CJ
100
O~~~rT~~-r~~~-r~~~~O
o 0.1 0.2
Height Correction [m]
Fig. 2. Effect 0/ height correction on Zo (dashed line). Zt
(dotted line). and QH (solid line).
345
Journal of Glaciology
The zero-referencing problem has also been noted in Antarctica by Inoue (l989b), who consequently did not use measurements closer than I m to the surface. Such a strategy cannot be employed here because the katabatic wind layer on Peyto Glacier is thin by comparison with that of the Antarctic Plateau, so all the useful measurements are in the first meter above the ice. Zero referencing is not so critical for bulk-transfer work, where an error of 0.1 m in a I m measurement height causes only a 3% change in QH' It is crucial to have accurate roughness lengths, however, and therefore important to see what can be done with microtopographic data .
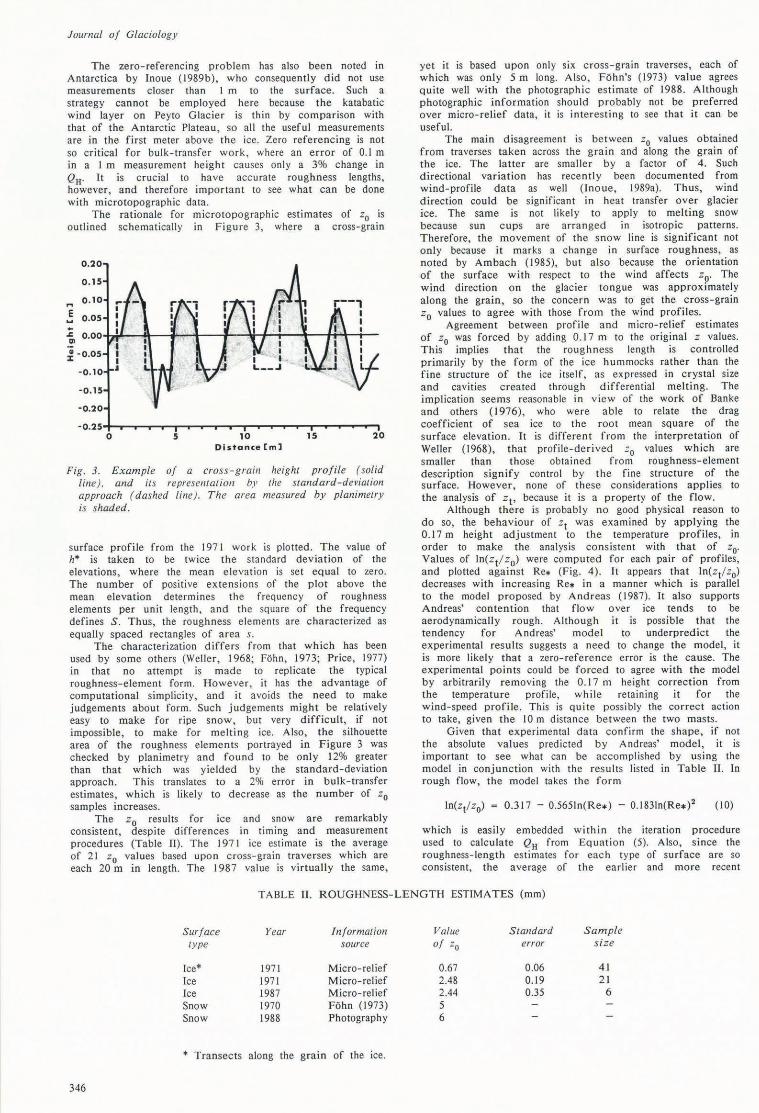
The rationale for microtopographic estimates of Zo is outlined schematically in Figure 3, where a cross-grain
0.20
0.15
0.10
E 0.05 .. ~ O.OO~~--~---i~-+--~~--~+-~--~--~~r-T---
~ -0.05
-0.10
-0.15
-0.20
-O. 25+....,....-r"""T"""T"""'T"""'T--..--.--r-r-..-..-..-..-~ ........ -r .............. ..., o 5 10
Distance [m] 15 20
Fig. 3. Example of a cross -grain height profile (solid line), and it, represelllatioll by the standard-deviation approach ( dashed line ). The area measured by planimetry is shaded.
surface profile from the 197 I work is plotted. The value of h* is taken to be twice the standard deviation of the elevations, where the mean elevation is set equal to zero. The number of positive extensions of the plot above the mean elevation determines th e frequency of roughness elements per unit length , and the square of the frequency defines S. Thus, the roughness elements are characterized as equally spaced rectangles of area s.
The characterization differs from that which has been used by some others (Weller, 1968; Fohn, 1973; Price, 1977) in that no attempt is made to replicate the typical roughness-element form. However, it has the advantage of computational simplicity, and it avoids the need to make judgements about form . Such judgements might be relatively easy to make for ripe snow, but very difficult, if not impossible, to make for melting ice. Also, the silhouette area of the roughness elements portrayed in Figure 3 was checked by planimetry and found to be only 12% greater than that which was yielded by the standard-deviation approach. This translates to a 2% error in bulk-transfer estimates, which is likely to decrease as the number of Zo samples increases .
The Zo results for ice and snow are remarkably consistent, despite differences in timing and measurement procedures (Table 11). The 1971 ice estimate is the average of 21 Zo values based upon cross-grain traverses which are each 20 m in length. The 1987 value is virtually the same ,
yet it is based upon only six cross-grain traverses, each of which was only 5 m long. Also, F6hn's (1973) value agrees quite well with the photographic estimate of 1988. Although photographic information should probably not be preferred over micro-relief data, it is interesting to see that it can be useful.
The main disagreement is between Zo values obtained from traverses taken across the grain and along the grain of the ice. The latter are smaller by a factor of 4. Such directional variation has recently been documented from wind-profile data as well (Inoue, 1989a). Thus, wind direction could be significant in heat transfer over glacier ice. The same is not likely to apply to melting snow because sun cups are arranged in isotropic patterns. Therefore, the movement of the s now line is significant not only because it marks a change in surface roughness, as noted by Ambach (1985), but also because the orientation of the surface with respect to the wind affects zOo The wind direction on the glacier tongue was approximately along the grain, so the concern was to get the cross-grain Zo values to agree with those from the wind profiles.
Agreement between profile and micro-relief estimates of Zo was forced by adding 0. 17 m to the original z values. This implies that the roughness length is controlled primarily by the form of the ice hummocks rather than the fine structure of the ice itself, as expressed in crystal size and cavItIes created through differential melting. The implication seems reasonable in view of the work of Banke and others (1976), who were able to relate the drag coefficient of sea ice to the root mean square of the surface elevation. It is different from the interpretation of Weller (1968), that profile-deri ved '::0 values which are smaller than those obtained from roughness-element description signify control by the fine structure of the surface. However, none of these considerations applies to the analysis of Zt' because it is a property of the flow .
Although there is probably no good physical reason to do so, the behaviour of Zt was examined by applying the 0.17 m height adjustment to the temperature profiles, in order to make the analysis consistent with that of zOo
Values of In(z t/ zo) were computed for each pair of profiles, and plotted against Re* (Fig . 4). It appears that In(zt l zo) decreases with increasing Re* in a manner which is parallel to the model proposed by Andreas (1987). It also supports Andreas' contention that flow over ice tends to be aerodynamically rough . Although it is possible that the tendency for Andreas' model to underpredict the experimental results suggests a need to change the model, it is more likely that a zero-reference error is the cause. The experimental points could be forced to agree with the model by arbitrarily removing the 0 . 17 m height correction from the temperature profile, while retammg it for the wind-speed profile. This is qu i te possi bly the correct action to take, given the 10 m distance be tween the two masts.
Given that experimental data confirm the shape, if not the absolute values predicted by Andreas' model, it is important to see what can be accomplished by using the model in conjunction with the res ults listed in Table 11. In rough flow, the model takes the form
(10)
which is easily embedded within the iteration procedure used to calculate QH from Equation (5). Also, since the roughness-length estimates for each type of surface are so consistent, the average of the earlier and more recent
TABLE n. ROUGHNESS-LENGTH ESTIMATES (mm)
Surf ace Year Information Value Standard Sample type source of Zo error s ize
Ice* 1971 Micro-relief 0.67 0.06 41 Ice 1971 Micro-relief 2.48 0.19 21 Ice 1987 Micro-relief 2.44 0.35 6 Snow 1970 Fohn (1973) 5 Snow 1988 Photography 6
* Transects along the grain of the ice.
346

102 • • •• ••
101 , .... .;. 10°
.. . .,~C:
1()1 • -0
N ~102 N
C
•
•
• 107~--~~--~----r---~~~
10-1
Fig. 4. Experimelltal results 0/ the III( :::t/zo) aI/a lysis (dots) compared with the AI/dreas ( 1987) predictiol/ ( lil/e plot).
estimates is used, giving 2.46 mm for ice and 5.5 mm for snow. The commonly accepted value, a = 5, is used for stability corrections.
On the whole, excellent agreement between bulk transfer and eddy correlation is achieved, though it is unfortunate to have so few data points for snow (Fig. 5). A few of the eddy-correlation values are low, even to the point of a reversal in sign . Although such small values could be the result of measuremen t error, say a lack of response to high-frequency turbule nce in very stable flow, it may also be the consequence of a collapse, or thinning of the boundary layer due to low-level wind maxima (Munro and Davies, 1977). The smallest values, relative to those predicted by bulk transfer, occurred during a very warm 4 h period , when stability may have been particularly strong. Similar behaviour has been documented in Antarctica by Inoue (l989a), who has suggested both the presence of low-level wind maxima and lack of response to high-frequency turbulence as likel y causes.
If the values which see m to be the consequence of anomalous flow conditions are dropped from the comparison, there is only a small bias in th e bulk-transfer results over ice, though the root-mean-square e rror shows that there are s ubstantial differences for individual comparisons (Table HI). The effect of boundary-layer thinning cannot easily be seen in bulk-transfer values because Equation (5) is not very sensitive to anomalies in the flow s tructure. It may even con tinue to provide reasonable QH estimates provided thinning does not extend all the way to the surface. Nevertheless, there is good reaso n for concern about measurement height in relation to boundary-layer thickness . The use of 5 m measurements over ice results in a s ubstantial overestimate of QH (Table IIJ). The comparison was not made over snow because only six samples were available.
The effect of changing the rough ness length is also shown in Table Ill, taking Zo = 0.67 a long the grain of the ice surface. The bias , though substantial, is not as large as one might expect in view of Figure 2 because as Zo decreases so does Re* . The result is larger Zt values which compensate to some exten t for the change in :::0' Therefore, one should not be too concerned about the small errors in Zo which might arise from variance between the standard-
MUl/ro: Sur/ace roughl/ess and bulk heat transfer
200
..... N
'E
~ .... C 0 .. 100 g
GI .. .. 0 u 50 >-
"CJ "CJ w
O~~-----------------------
• -50~----~----~-----r----.,
o 50 100 150 200
Bul k Transfe r [W m-2 ]
Fig. 5. CompariSOI/ 0/ eddy correlatioll alld bulk-transfer estimates 0/ QH over ice (solid symbols) alld Sl/OW (open symbols). Square symbols del/Ole suspected cases 0/ anomalous /Iow conditiolls . Straight-line plot sholVs 1: 1 relationship.
TABLE Ill. BULK TRANSFER COMPARED WITH EDDY CORRELA TION OVER ICE
Mean eddy-correlation value of 67 samples
Height
m
5 5 5 5
lee Zo
2.46 0.67 3.08 1.84
2.46 0.67 3.08 1.84
1/
MBE
0.9 -6.0
1.9 -D.5
13.4 7.2
14.2 12.2
60.6 W m- 2
RMSE
18.6 17.6 18.6 18.1
22.0 16.8 22.8 21.0
The mean bias error, MBE = I (Q~. - QE VII, where the i=l ( (
prime refers to the bulk-transfer value. The root-meansquare error,
RMSE [
11
I (Q~ -i=l (
deviation approach to roughness-element description and the true profile of the surface, because the modelling scheme for QH is inherently conservative. This point is illustrated in Table Ill, where Zo values of 3.08 and 1.84 correspond to a ±25% change in the cross-grain roughness length, twice the difference noted with respect to the analysis portrayed in Figure 3. Yet the mean bias error is within 2 W m- 2 in each case.
347

Journal oJ Glaciology
CONCLUSIONS
The microtopographic approach to roughness-length estimation makes the tacit assumption that Zo depends principally upon the surface form, an assumption which is probably reasonable for any rigid surface. This view is preferred by Andreas (1987), and supported by the results of Banke and others (1976). Since the method is simple to apply, it would be interesting to see roughness-element description employed at more glacier sites, to see how consistent the results might be. The extremes in the Zo values for snow reported by Moore (1983) were all derived from profile data which , in addition to the uncertainty of sampling, suffer the problems of dealing with stability and height definition . Although one ma y argue about how to best represent surface form, roughness-element description is essentially a problem in sampling.
Even though Andreas (1987) derived his model for use over sea ice, its usefulness for glacier snow and ice is not surprising, given that it depends upon the properties of the air and the flow itself. A Iso, because it is easy to incorporate the model into any bulk-transfer computation scheme, there is no good reason to use a fixed value for Zt . Thus, questions about the thermal-roughness length should not concern the size of '::t relative to zo' but rather the validity of the Andreas model. The model seems valid according to the results presented here, but the sample is small, so further validation studies would be useful. It is especially important in this regard for micrometeorologists to include microtopographic measurements in their work, as Weller (1968) did, so that the two approaches may be reconciled.
Because the instrumentation is simple, bulk transfer is likely to remain the method of choice over melting ice and snow. It is probably a good choice provided it is used in conjunction with microtopographic data, obtained from a suitable sampling scheme. Sampling has not been a strong feature of this study because the importance of good microtopographic data came to be appreciated only as other aspects of the work were completed. It is a weakness which is common to studies of this kind , a problem which must be addressed in the future.
ACKNOWLEDGEMENTS
The work is supported by the Natural Sciences and Engineering Research Council of Canada. Institutional support from McMaster University , the University of Toronto, the University of Colorado and especially National Hydrology Research Institute, Environment Canada, has been vital to the work. Gratitude is also expressed to Parks Canada for granting permission to work at the site. Research assistance was provided by D. Chisholm, K . Munro, B. Alberton, A. Munro, and T. Bain .
REFERENCES
Ambach, W. 1985. Characteristics of the heat balance of the Greenland ice sheet for modelling. 1. Glaciol., 31(107), 3-12.
Andreas, E .L. 1987. A theory for the scala roughness and the scala transfer coefficients over snow and sea ice. Boundary Layer Meteorol., 38(1-2), 159-184.
Banke, E.G., S.D. Smith, and RJ. Anderson. 1976. Recent measurements of wind stress on Arctic sea ice. 1. Fish. Res. Board Can. , 33(10), 2307-2317.
Berkowicz, R . and L.P. Prahm. 1982. Evaluation of the profile method for estimation of surface fluxes of momentum and heat. Atmos. Environ. , 16, 2809-2819.
Braithwaite, R.J . 1988. Correspondence. Estimating glacier melt from bulk-exchange coefficients. 1. Glaciol., 34(118), 365-366.
Campbell , G .S. and M.H. Unsworth . 1979. An inexpensive sonic anemometer for eddy correlation . 1. Appl. Meteorol., 18, 1072-1077.
Dyer, A.J. 1974. A review of flux-profile relationships. Boundary-Layer Meteorol ., 7, 363-372.
F6hn, P.M.B. 1973. Short-term snow melt and ablation derived from heat- and mass-balance measurements. 1. Glaciol ., 12(65), 275-289.
Garratt, J.R. and B.B. Hicks. 1973 . Momentum, heat and water vapour transfer to and from natural and artificial surfaces. Q . J . R . MeteOl·ol. Soc., 99, 680-687 .
Hay, J.E. and B.B. Fitzharris. 1988. Estimating glacier melt from bulk-exchange coefficients. 1. Glaciol ., 34(117), 145-153.
Inoue, I. 1989a. Surface drag over the snow surface of the Antarctic Plateau. I. Factors controlling surface drag over the katabatic wind region. J. Geophys. Res., 94, 2207-2217 .
Inoue, I. 1989b. Surface drag over the snow surface of the Antarctic Plateau. 2. Seasonal change of surface drag in the katabatic wind region . 1 . Geophys. Res., 94, 2219-2224.
Kuhn, M. 1979. On the computation of heat transfer coefficients from energy-balance gradients on a glacier. 1. Glaciol., 22(87), 263-272.
Lee, C.B. 1986. Simple model and climatological aspects of the structure of the convective boundary layer. Atmos. Environ., 20, 705-714 .
Lettau, H.H. 1969. Note on aerodynamic roughness parameter estimation on the basis of roughness element description . J. Appl. Meteorol ., 8, 828-832.
Lourence, F.J. and W.O. Pruitt . 1969. A psychrometer system for micro meteorology profile determination. J. Appl. Meteorol. , 8, 492-498.
Marcus, M.G ., R .D. Moore, and I.F. Owens. 1985. Short-term estimates of surface energy transfers and ablation on the lower Franz losef Glacier, South Westland, New Zealand. N. Z. 1. Geol. Geophys ., 28(3), 559-567.
Moore, R.D. 1983. On the use of bulk aerodynamic formulae over melting snow. Nord. Hydrol., 14(4), 193-206.
Munro, D.S. and I .A . Davies . 1977 . An experimental study of the glacier boundary laye r over melting ice. 1. Glaciol. , 18(80) , 425-436.
Munro, D.S. and I.A. Davies. 1978. On fitting the log-linear model to wind speed and temperature profiles over a melting glacier. Boundary -Layer Meteorol., 15, 423-437.
Oke, T.R. 1987. Boundary layer climates. London, Methuen.
Owen, P.R. and W.R. Thompson . 1963. Heat transfer across rough surfaces. J . Fluid Mech. , 15, 321-334.
Price, A.G . 1977. Snowmelt runoff processes in a subarctic area. McGil/ Sub- Arct ic Research Paper 29 .
Stenning, A.J., C.E. Banfield, and G.J. Young. 1981. Synoptic controls over katabatic layer characteristics above a melting glacier. lnt. 1. Climatal. , I, 309-324 .
Tanner, B.O. 1988. Use requirements for Bowen ratio and eddy correlation determination of evapotranspiration. In Proceedings oJ the 1988 Speciality ConJerence oJ the Irrigation and Drainage Division . American Society oJ Civil Engineers, July 19-21 , 1988, Lincoln , Nebraska. New York, American Society of Civil Engineers, 1-12.
Webb, E.K. 1970. Profile relatio nships, the log-linear range and extension to strong stability. Q. 1. R. Meteorol . Soc., 96, 67-90.
Weller, G.E. 1968. The heat budget and heat transfer processes in Antarctic plateau ice and sea ice. ANARE Sci. Rep., Ser . A ( 4), Glaciol . Publ . 102.
MS. received 30 March 1989
348