Embed Size (px)
Citation preview
1© Corrugated Packaging Alliance, February 2010
Prepared for:
Prepared by: PE-Americas andFiveWindsInternational
Corrugated Packaging Life-cycle Assessment Summary Report
2© Corrugated Packaging Alliance, February 2010
The Corrugated Packaging Alliance is a corrugated industry initiative jointly sponsored by the American Forest & Paper Association (AF&PA), the Association of Independent Corrugated Converters (AICC), and the Fibre Box Association (FBA). For more information visit www.corrugated.org, www.afandpa.org, www.aiccbox.org, www.fibrebox.org.
1© Corrugated Packaging Alliance, February 2010
CORRUGATED PACKAGING LIFE-CYCLE ASSESSMENT SUMMARY REPORT
The Corrugated Packaging Alliance (CPA) initiated a life-cycle assessment (LCA) to evaluate the
environmental impact of corrugated packaging products. With such an LCA study, the CPA and its constituent
associations can assist others in understanding and communicating the environmental footprint and
environmental benefits associated with using corrugated. At the same time, this study helps describe the
environmental impacts of corrugated’s different life-cycle stages in relation to overall environmental
performance, and the potential environmental benefits of process improvements. Beyond the operations
of a single manufacturing site or package specification, the study evaluates the environmental
performance of an industry-average corrugated product throughout its entire life cycle.
What is an LCA?
An LCA is a standardized, scientific method for systematic analysis of flows (e.g., mass and energy)
associated with the life cycle of a specific product, technology, service or manufacturing process system.
In the case of a product system, the life cycle includes raw materials acquisition, manufacturing, use
and end-of-life (EoL) management. According to the International Organization for Standardization (ISO)
14040/44 standards, an LCA study consists of four phases:
1. Goal and scope (framework and objective of the study);
2. Life-cycle inventory (input/output analysis of mass and energy flows from operations along the
product’s value chain);
3. Life-cycle impact assessment (evaluation of environmental relevance, e.g., global warming potential);
and
4. Interpretation (e.g., optimization potential).
Goal and Scope
The goal and scope stage outlines the rationale of the study, anticipated use of study results, boundary
conditions, data requirements and assumptions to analyze the product system under consideration, and
other similar technical specifications for the study. The goal of the study is based upon specific questions
that the study seeks to answer, the target audience and stakeholders involved, and the intended use
for the study’s results. The scope of the study defines the systems boundary in terms of technological,
geographical and temporal coverage of the study; attributes of the product system; and the level of detail
and complexity addressed.
2© Corrugated Packaging Alliance, February 2010
Goal
The goal of this study was to conduct an LCA for a U.S. industry-average corrugated product to:
• Better understand the environmental performance of an average corrugated product related to all
life-cycle stages,
• Benchmark and demonstrate the environmental sustainability performance of corrugated products
as packaging material, and
• Respond to customer and public demands for environmental information.
The intent of the study was to generate results that can be publicly communicated in formats consistent
with public databases (e.g., U.S. LCI database, maintained by the National Renewable Energy Laboratory
(NREL)) and best practices of ISO 14040/44. As per ISO guidelines, the study was reviewed by a third-party
panel before release to external stakeholders.
Since this is the first LCA conducted at the U.S. corrugated industry level, its primary purpose was to
identify areas where focused improvements will yield maximum results. The initial public release of data
is intended to populate the U.S. LCI database, the EPA and the GreenBlue COMPASS tool.
The study provides a useful perspective for different stakeholder groups, such as the corrugated
industry, consumers, retailers, packaging specifiers and buyers, waste recyclers, government agencies,
nongovernmental organizations, LCA practitioners and media. This study is not a comparative study
in and of itself; however, it may enable future comparative studies. Other studies will need to employ
a functional unit consistent with the goal and scope of this study, and can achieve specific results by
scaling the input and output data appropriately.

3© Corrugated Packaging Alliance, February 2010
Scope
The general scope of the project to achieve the stated goal includes identification of the average corrugated
product to be assessed, the boundary of the study, impact categories considered and data collection
procedures (cut-off criteria, background data, allocation procedures, etc.).
The scope of this study was developing a “cradle-to-cradle” LCA of the 2006 U.S. industry-average
corrugated product. The average basis weight of the U.S. industry mix1 is 138.6 lb/thousand square feet
(msf).2 The functional unit (basis for comparison) used in this study is 1 kg of U.S. average corrugated
product. The average “use” of an industry-average corrugated product is as secondary packaging of
products for shipping.3
1 FBA [2007] — Fibre Box Association Industry Annual Report 20072 138.6 lb per msf = 0.677 kg per m2 3 Please note that the study is representative of any kind of corrugated product.
Summary of System Boundaries
Included Excluded
Raw materials and ancillary inputs (e.g., wood and
paper pulp, pulping and bleaching chemicals, wood
fiber production (forestry))
Capital equipment and maintenance
Energy (e.g., extraction, processing and
transportation fuels; purchased electricity)
Maintenance and operation of support equipment
Internal generation of electricity and steam
as well as cogeneration
Transportation of employees
Processing of materials
Operation of primary production equipment
Waste
Transportation of raw and ancillary materials
Overhead (heating, lighting) of
manufacturing facilities
Internal transportation of materials
Post-use processes (transportation, sorting,
baling, etc.)

4© Corrugated Packaging Alliance, February 2010
The LCA model is broken into four primary life-cycle stages:
• Containerboard: Production of the containerboard (liner and medium). This includes virgin fiber
production (all related forestry operations), transportation from forest to mill and mill to converting
plant, recycled input, and energies and chemicals needed during mill operation.
• Converting: All impacts associated with efforts needed for converting of corrugated board to a final
product (folding, cutting, gluing and printing), which includes energies, chemicals, glue, starch, inks,
etc., and handling of waste streams.
• Transport: Transportation of final corrugated product to final customer (transport-in-use phase).
• End-of-life (EoL): EoL covers the efforts and impacts for disposal (landfill and incineration) of
old corrugated containers (OCC) not recovered for recycling.
System Scope and Life-cycle Phases for U.S. Average Corrugated Product Summary of System Boundaries
Forestry End-of-lifeContainerboard
millsConverting
plants
Landfillincineration
Emissions to air, water and soil(waste)
RecyclingRaw materials, coatings, adhesives,
sodium sulfate, soda, etc.Energy, fuels, electricity, etc.
Transport tocustomer-use phase
Figure 1.
CPPAGENL9055
System boundary for corrugated product manufacturing

5© Corrugated Packaging Alliance, February 2010
Data Sources
• The study used primary data for containerboard mills and converting plants, and existing data sets
to model the environmental emissions of fiber production, transportation, recovery processes, EoL
and ancillary processes. Wherever possible, this study is based on primary data collected from
Corrugated Packaging Alliance (CPA) member companies and their respective production sites. In
cases where primary data was not available, secondary data obtained from literature, previous LCI
studies and life-cycle databases were used for the assessment.
• Fiber production processes were modeled as per the Consortium for Research on Renewable
Industrial Materials’ CORRIM II study of U.S. Pacific Northwest and Southeast forestry operations.
Pulp and paper input data was sourced from Fisher International; mill output data is based on a
semi-annual industry survey conducted by the American Forest & Paper Association (AF&PA) and the
National Council for Air and Stream Improvement (NCASI). Data for this portion of the study includes
53 containerboard mills representing 29 million metric tons per year, nearly 90 percent of the 2006
production volume. Converting plants were surveyed by the Fibre Box Association (FBA). The study
includes data from 162 converting plants representing 9.6 million metric (mm) tons per year,
approximately 45 percent of production volume. These plants include a sample of complete
corrugating plants, sheet feeders and sheet plants producing a wide array of corrugated products.
The considered converting plants represent the current state of the art and therefore can be
considered representative of the industry. The LCA model was created using the GaBi 4 software
system for LCA, developed by PE INTERNATIONAL. The databases contained in the GaBi software
provide the LCI data for the raw and process materials used in the background system.
• EoL is modeled using AF&PA and U.S. EPA statistics. It is assumed as documented that 78 percent
of the 2006 U.S. corrugated product was recovered for additional use while the remaining
22 percent was disposed in the 2006 average U.S. municipal solid waste system. This system
includes 18.5 percent of disposed corrugated (equals approximately 4 percent of overall) going to
incineration for energy recovery. Of the corrugated products landfilled, 55 percent (as measured
by carbon content) is sequestered for more than 100 years.4 Carbon content that is not
sequestered for longer than 100 years is assumed to degrade under aerobic and
anaerobic conditions; the carbon is converted into CO2 and CH4. Of the CH4 from landfill gas, it
is assumed that 59 percent is captured and combusted for energy recovery.5
4 The “100 year” reference is a commonly accepted practice by LCA practitioners. It is also used by the World Resources Institute (WRI).5 For a more detailed description of the EoL parameters, please see the 2006 EPA report “Solid Waste Management and Greenhouse
Gases – A Life-cycle Assessment of Emissions and Sinks” [EPA 2006].
6© Corrugated Packaging Alliance, February 2010
Critical Review
This study was conducted with the participation of a Critical Review Panel to ensure that it was completed
to the requirements of ISO 14040 series standards and industry best practices. Athena Sustainable
Materials Institute was commissioned to lead the critical review in accordance with ISO 14040/44 (2006),
in collaboration with co-reviewers. The review panel comprised the following experts: Mr. Jamie Meil,
Athena Institute; Martha Stevenson, private consultant – formerly of GreenBlue Institute; Dr. Michael Deru,
U.S. National Renewable Energy Laboratory; Dr. Jim Wilson, Oregon State University; and Dr. Lindita Bushi,
Athena Institute.
Life-cycle Inventory
The life-cycle inventory (LCI) is merely a list of input and output flows with no environmental relevance.
LCA characterizes the flows and describes their potential effects on the environment. The inventory stage
qualitatively and quantitatively documents the materials and energy used (the “inputs”) as well as the
products, by-products and environmental releases in terms of emissions to the environment and wastes
to be treated (the “outputs”) for the product system being studied. The LCI data can be used on its own
to understand total emissions, wastes and resource use associated with the material or product being
studied; to improve production or product performance through benchmarking; or it can be further
analyzed and interpreted to provide insights into the potential environmental impacts from the system
(life-cycle impact assessment (LCIA) and interpretation).

7© Corrugated Packaging Alliance, February 2010
Importance of Impact Assessment
An LCI quantifies the inputs (raw materials, energy, etc.) and outputs (emissions, waste, toxicity, etc.)
generated by a process or industry. This information is vital, but can be misleading without
a full impact assessment. For example, 1,600 kg of CO2 shown in a sample inventory seems highly
significant compared with just 2.5 kg of CFC-11; but an impact assessment shows the smaller amount of CFC
would have a far greater negative effect on the environment. Without analyzing the actual potential
environmental impact, one might wrongly conclude that the CO2 was a more important reduction goal.
Inventories provide important numbers, but impact assessment tells what matters most, and becomes a
meaningful baseline for improvement.
Figure 2.
Global warming, ozone depletion, summer smog, acidification, eutrophication, human-toxicity, eco-toxicity, land use, resource consumption (materials and energy carriers)
Impact assessment
Life-cycleinventory
Life-cycle steps/ elements
Life-cycle phases
Emissions waste
Resources
Raw material extraction
Production of intermediates
Production of main products
UtilizationRecycling, recovery,
disposition …
Output
Input
Output
Input
Output
Input
Output
Input
Output
Input
8© Corrugated Packaging Alliance, February 2010
Impact Assessment Results
Life-cycle impact assessment (LCIA) results were calculated for 1 kg of final corrugated product for global
warming potential (GWP), acidification potential (AP), eutrophication potential (EP) and photochemical
ozone creation potential (POCP)/smog potential. Primary energy demand (PE)6 also is reported and
focused on non-renewable only. Results were calculated using both CML and TRACI methods.
As shown in Figure 3, manufacture of containerboard is the dominant life-cycle stage for PE, AP, EP and
POCP/smog. Approximately 35 percent of PE is related to combustion of fossil fuels in containerboard
mills. EP, AP and smog also are mainly influenced by the use of fossil fuels (manufacturing and
transportation of final product) and electricity.
While handling of the corrugated product at EoL plays a minor role for PE, AP, EP and POCP/smog
formation, it is a significant life-cycle stage for GWP. This effect is mainly related to conversion of a share
of the carbon content of corrugated to methane and carbon dioxide when it is landfilled. GWP includes
all greenhouse gas-relevant emissions stemming from the supply and combustion of fossil fuels, as well
as supply of renewable fuels and any other relevant emissions. The GHG emissions associated with
fiber mix and biomass supply (as additional energy sources) are related to the use of fossil-based
energy sources (transportation, saw mills, etc.) or fertilizers used when growing wood. GWP represents
the net CO2-equivalent value for the materials needed for production of 1 kg of corrugated product. The
CO2 uptake7 related to virgin fiber is accounted for in this value as well as 0.418 kg of recycled fiber used
by U.S. containerboard mills.
Containerboard production is characterized by a water throughput of 43.2 kg per 1.11 kg of container-
board, but the net water consumption8 only accounts for ~4.9 kg per 1.11 kg of containerboard (or 1 kg of
corrugated product).
6 PE is not an impact but is included in this section as it is also a sum value indicating the total amount of energy extracted from earth or based on renewable resources. The CML and TRACI impact methodologies have been selected for this study. CML and TRACI are models commonly used in Europe (CML) and the U.S. (TRACI) to assess potential environmental impacts in LCA work. As they do not include consumption of renewable energy sources but an index of the consumption of fossil fuels, the focus in this study is on PE from non-renewable sources (fossil).
7 The carbon uptake related to the use of biomass as a fuel also is considered in this study by handling the combustion of biomass as carbon-neutral.
8 The net water consumption is the difference of the water entering the mills and released either to wastewater treatment plants or direct to the environment. It is the sum of water retained in containerboard, evaporation and water content of waste streams.

9© Corrugated Packaging Alliance, February 2010
Corrugated product
PE non-renewable [MJ] 2.16 12.62 5.39 20.17 1.53 -0.41 21.29
-0.88 1.04 0.33 0.49 0.11 0.42 1.01
0.08 0.37 0.08 0.53 0.01 0.00 0.53
6.68E-05 2.22E-04 6.75E-05 3.56E-04 3.68E-06 1.26E-06 3.61E-04
1.45E-06 3.20E-06 1.02E-06 5.68E-06 7.34E-08 5.65E-08 5.81E-06
Fiberproduction
Container-board
production
Convertingplant
Corrugatedproduct
TRACI, acidification air[mol H+-equivalent]
TRACI, smog air[kg NO
X-equivalent]
Life-cycle total
Total Life-cycle Impacts in Studied Impact Categories; Broken Down by Life-cycle Stage
Figure 3.
TRACI, eutrophication air and water [kg N-equivalent]
Global warming potential (GWP 100 years) [kg CO
2-equivalent]
Manufacturing of corrugated product
Transport-in- use phase
End-of-life (EoL)
Life-cycletotal
Figure 3 shows the total life-cycle impacts in studied impact categories, plus PE, and broken down by
life-cycle stage.
The overall net GWP of 1 kg U.S. average corrugated product within the assumed boundary conditions over
the total life-cycle results is approximately 1 kg of CO2-equivalent.
Approximately 0.42 kg of CO2-equivalent is related to the disposal of 1 kg of OCC. Without any recycling,
100 percent of the OCC would be handled by either landfill or incineration, and the CO2 impacts would be
around 2.0 kg. This is based on the fact that approximately 40 percent of the methane emissions from
landfill operations are directly released to the environment.
The negative value of the GWP in the fiber production results from the use of biomass as raw material.
Since biomass absorbs CO2 in its growth phase via photosynthesis, the production of biomass represents
a net CO2 sink.
10© Corrugated Packaging Alliance, February 2010
25
20
15
10
5
0
-5
Prim
ary
Ene
rgy
Dem
and
— N
on-r
enew
ab
le [M
J]
Fiberproduction
Containerboardproduction
Convertingplant
Transport-in-use phase EoL
Life-cycletotal
Primary Energy Demand (in MJ) Non-renewable (fossil) — 1 kg product over life cycle
Figure 4.
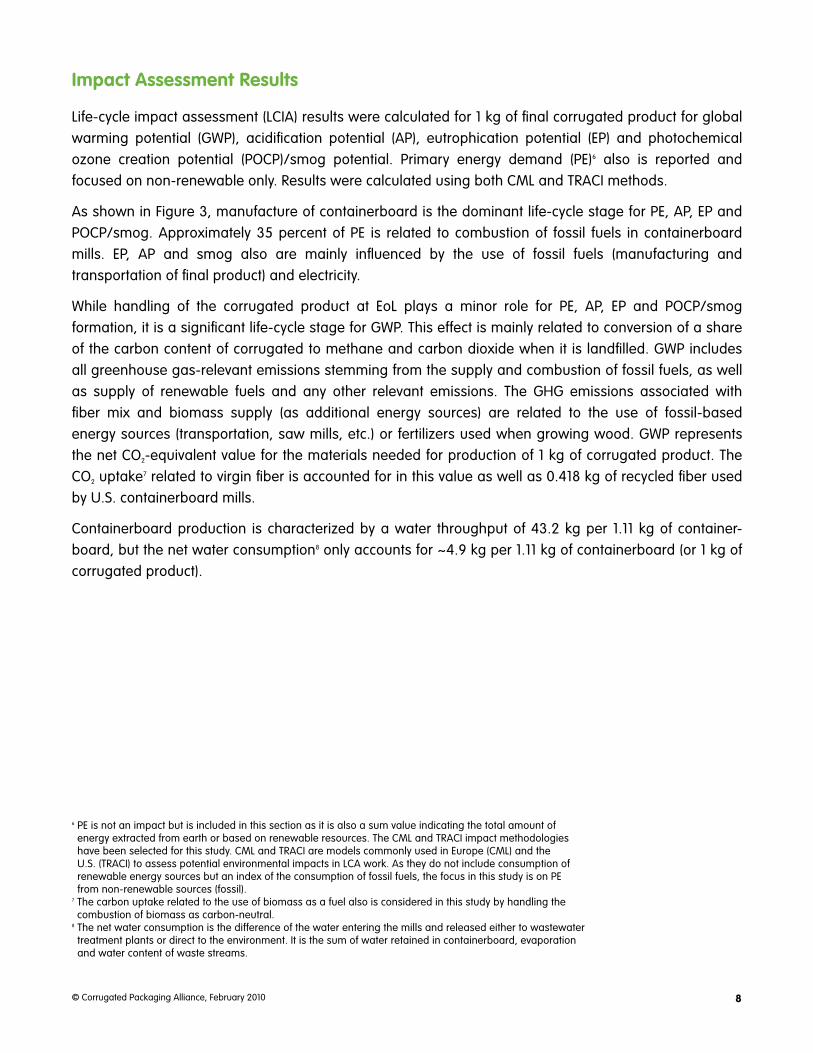
Figure 4 shows that containerboard production accounts for more than half the PE, and for most when
combined with converting. Very little PE is allocated to fiber production, transport-in-use or EoL.
PE — non-renewable: The quantity of non-renewable (fossil) energy resources directly withdrawn from
the hydrosphere, atmosphere or geosphere, or energy source without any anthropogenic change.
11© Corrugated Packaging Alliance, February 2010
1.50
1.00
0.50
0.00
-0.50
-1.00
GW
P (k
g C
O2-
equi
vale
nt)
Fiberproduction
Containerboardproduction
Convertingplant
Transport-in-use phase EoL
Life-cycletotal
Figure 5.
Global Warming Potential (in kg CO
2-equivalent) — 1 kg product over life cycle
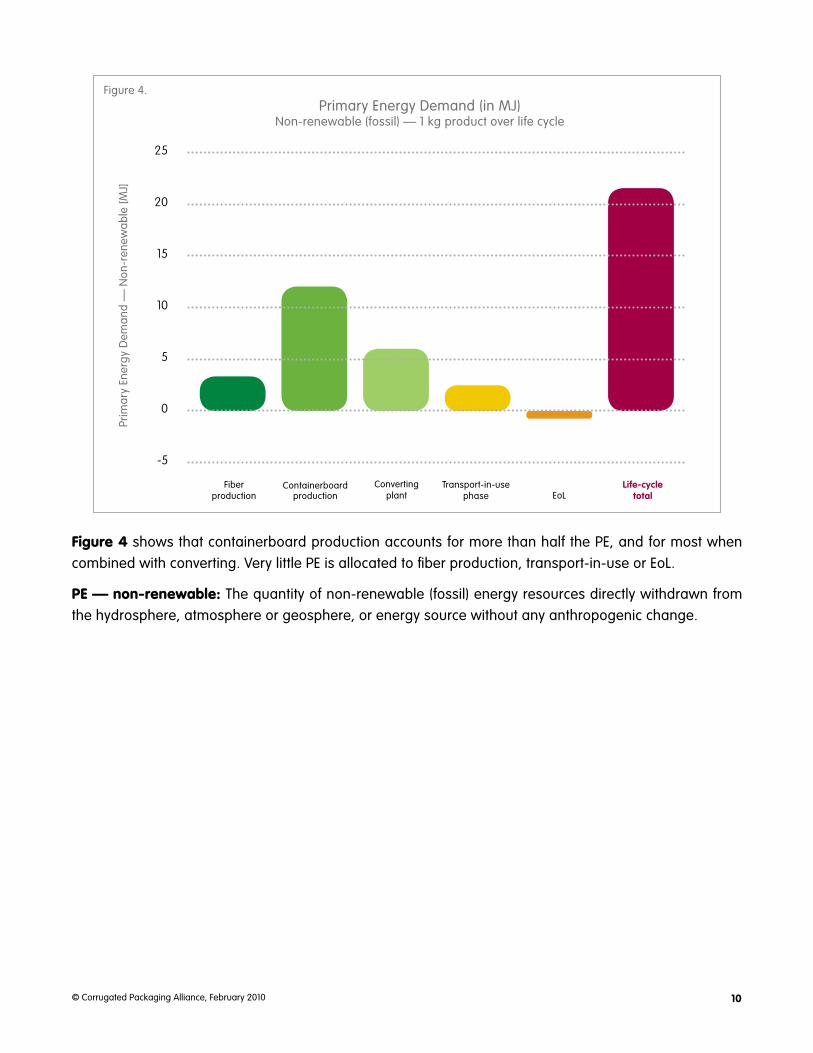
Figure 5 shows that fiber production (which includes growth and harvesting of trees) has a net CO2 sink
due to carbon sequestration. Most GWP from the corrugated life cycle is generated in containerboard
production. Converting and EoL also contribute to GWP.
GWP: Increased warming of the troposphere due to anthropogenic greenhouse gases (GHG), e.g., from the
burning of fossil fuels.
Figure 5a.
Trace gases in the atmosphere
UV radiation
Infrared radiation
Absorption
Reflection
CO2 CH
4
CFCs
Greenhouse Effect
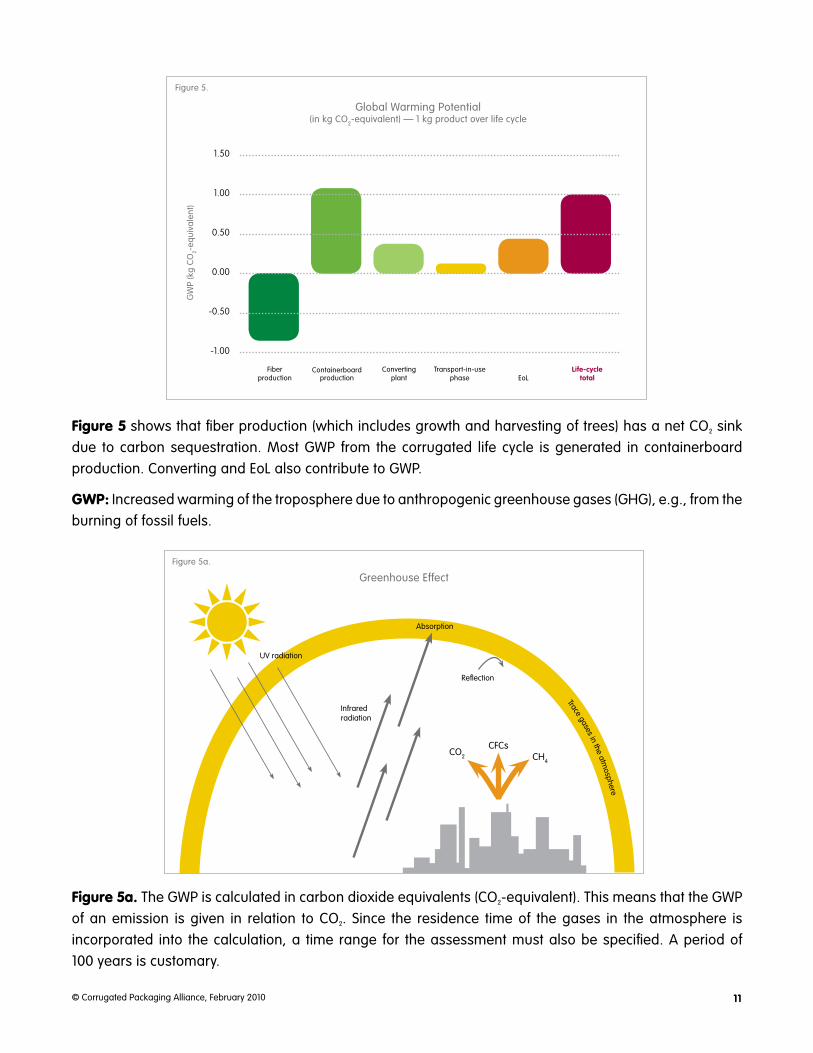
Figure 5a. The GWP is calculated in carbon dioxide equivalents (CO2-equivalent). This means that the GWP
of an emission is given in relation to CO2. Since the residence time of the gases in the atmosphere is
incorporated into the calculation, a time range for the assessment must also be specified. A period of
100 years is customary.
12© Corrugated Packaging Alliance, February 2010
4.00E-04
3.50E-04
3.00E-04
2.50E-04
2.00E-04
1.50E-04
1.00E-04
Eutr
ophi
catio
n Po
tent
ial (
kg N
-eq
uiva
lent
)
Fiberproduction
Containerboardproduction
Convertingplant
Transport-in-use phase EoL
Life-cycletotal
Figure 6.Eutrophication Potential
(TRACI, in N-equivalent) — 1 kg product over life cycle
0.00E+00
5.00E-05
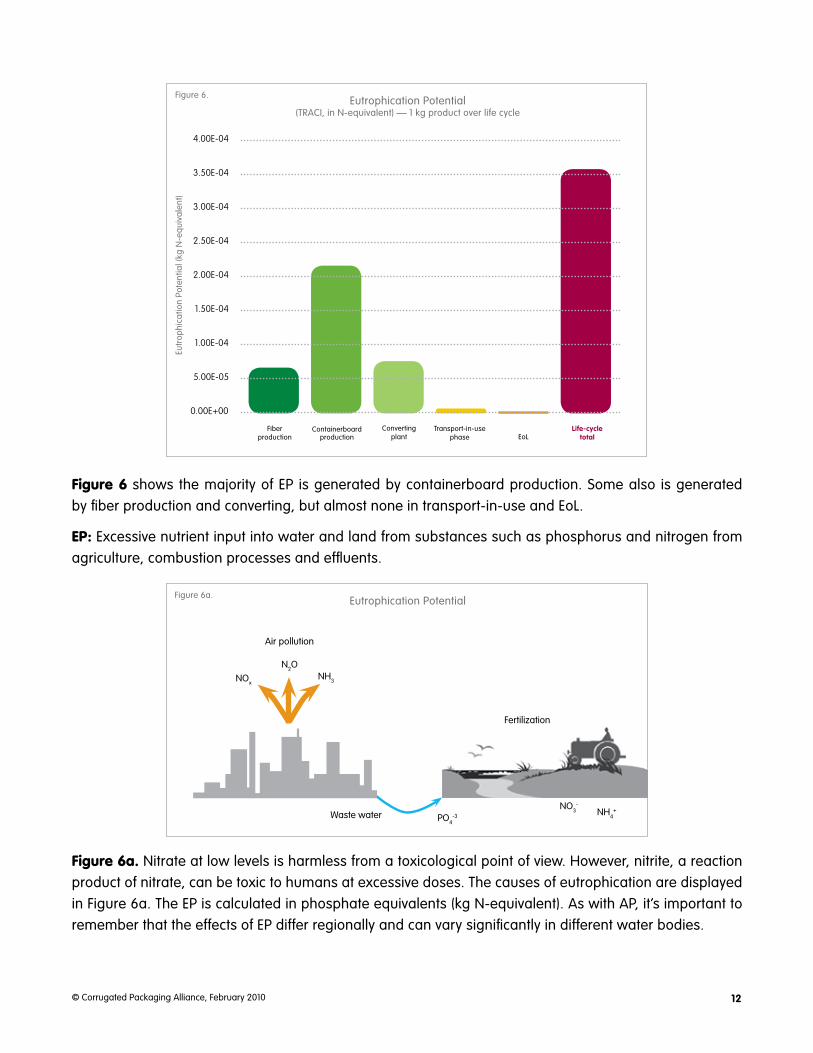
Figure 6 shows the majority of EP is generated by containerboard production. Some also is generated
by fiber production and converting, but almost none in transport-in-use and EoL.
EP: Excessive nutrient input into water and land from substances such as phosphorus and nitrogen from
agriculture, combustion processes and effluents.
Figure 6a.
NOx
NH3
N2O
Air pollution
Fertilization
NO3
-
NH4
+Waste water PO
4-3
Eutrophication Potential
Figure 6a. Nitrate at low levels is harmless from a toxicological point of view. However, nitrite, a reaction
product of nitrate, can be toxic to humans at excessive doses. The causes of eutrophication are displayed
in Figure 6a. The EP is calculated in phosphate equivalents (kg N-equivalent). As with AP, it’s important to
remember that the effects of EP differ regionally and can vary significantly in different water bodies.
13© Corrugated Packaging Alliance, February 2010
0.60
0.50
0.40
0.30
0.20
Aci
difi
catio
n Po
tent
ial (
mol
H+-e
qui
vale
nt)
Fiberproduction
Containerboardproduction
Convertingplant
Transport-in-use phase EoL
Life-cycletotal
Figure 7.
Acidification Potential (TRACI, in mol H+-equivalent) — 1 kg product over life cycle
0.00
0.10
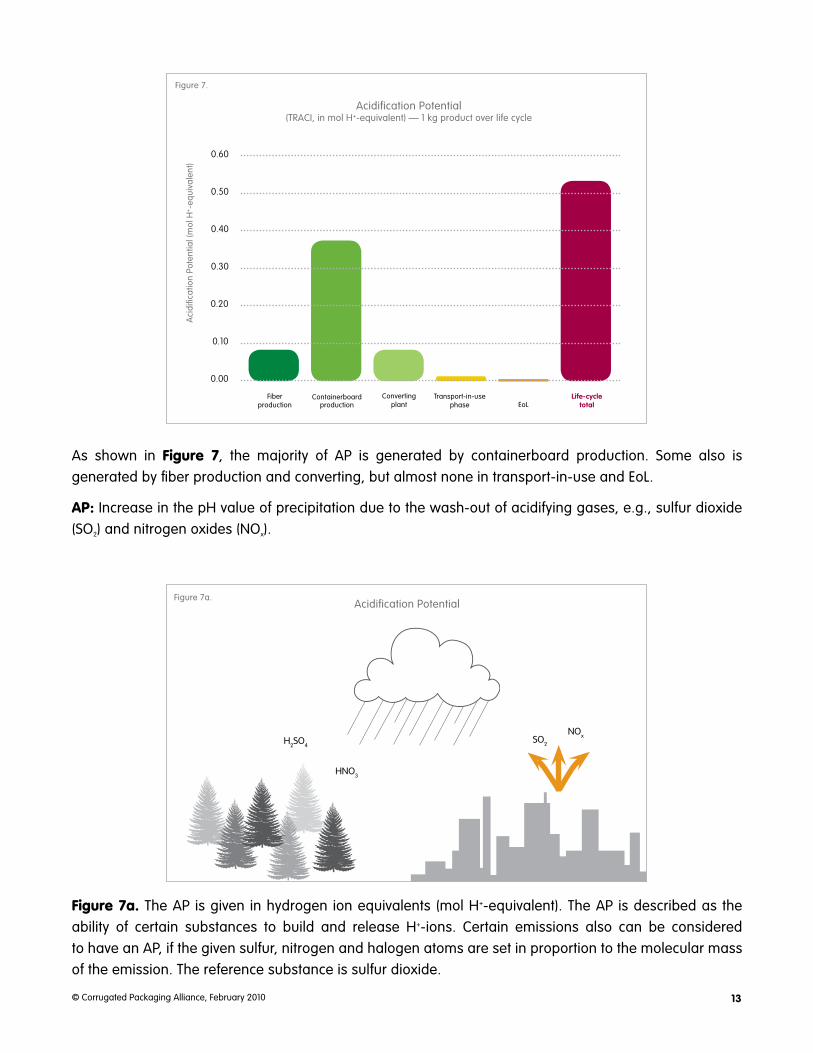
As shown in Figure 7, the majority of AP is generated by containerboard production. Some also is
generated by fiber production and converting, but almost none in transport-in-use and EoL.
AP: Increase in the pH value of precipitation due to the wash-out of acidifying gases, e.g., sulfur dioxide
(SO2) and nitrogen oxides (NOx).
Figure 7a.
SO2
NOx
H2SO
4
HNO3
Acidification Potential
Figure 7a. The AP is given in hydrogen ion equivalents (mol H+-equivalent). The AP is described as the
ability of certain substances to build and release H+-ions. Certain emissions also can be considered
to have an AP, if the given sulfur, nitrogen and halogen atoms are set in proportion to the molecular mass
of the emission. The reference substance is sulfur dioxide.
14© Corrugated Packaging Alliance, February 2010
7.00E-06
6.00E-06
5.00E-06
4.00E-06
3.00E-06
2.00E-06
POC
P/Sm
og P
oten
tial (
kg N
Ox-
equi
vale
nt)
Fiberproduction
Containerboardproduction
Convertingplant
Transport-in-use phase EoL
Life-cycletotal
Figure 8.Photochemical Ozone Creation Potential (POCP)/Smog Potential
(TRACI, in kg NOx-equivalent) — 1 kg product over life cycle
0.00E+00
1.00E-06
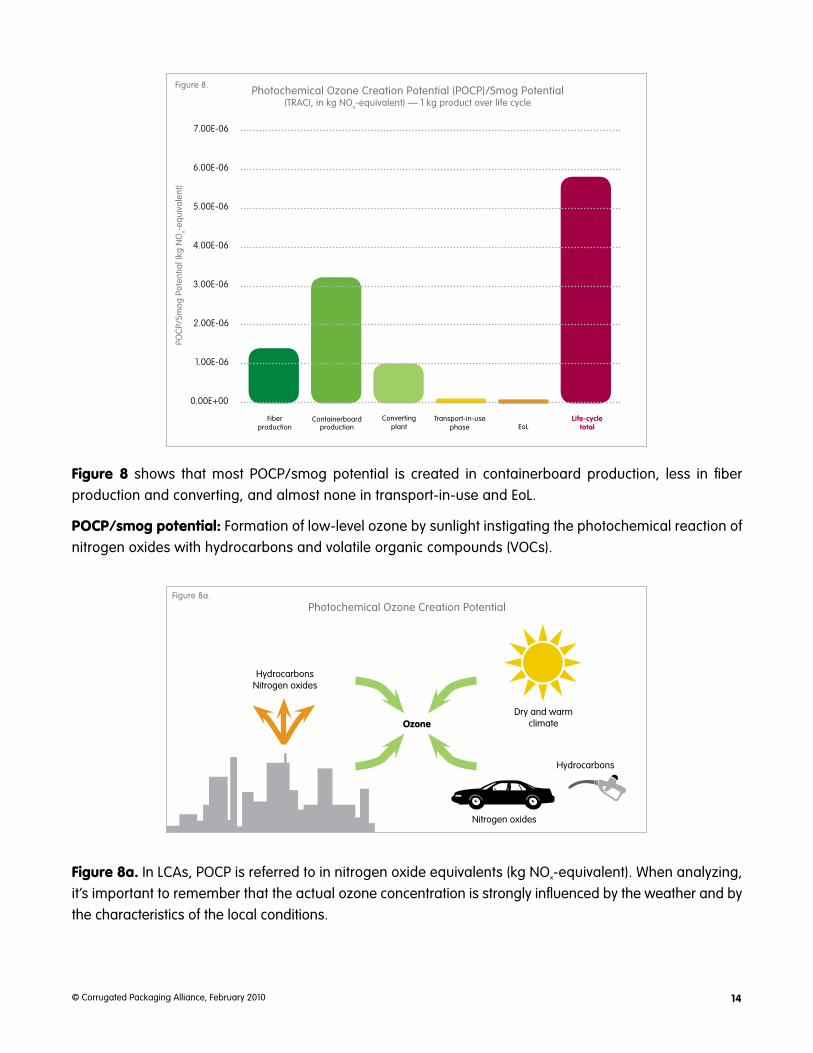
Figure 8 shows that most POCP/smog potential is created in containerboard production, less in fiber
production and converting, and almost none in transport-in-use and EoL.
POCP/smog potential: Formation of low-level ozone by sunlight instigating the photochemical reaction of
nitrogen oxides with hydrocarbons and volatile organic compounds (VOCs).
Figure 8a.
HydrocarbonsNitrogen oxides
Dry and warm climate
Nitrogen oxides
Hydrocarbons
Ozone
Photochemical Ozone Creation Potential
Figure 8a. In LCAs, POCP is referred to in nitrogen oxide equivalents (kg NOx-equivalent). When analyzing,
it’s important to remember that the actual ozone concentration is strongly influenced by the weather and by
the characteristics of the local conditions.
15© Corrugated Packaging Alliance, February 2010
Influence of EoL Situation on Life-cycle Performance
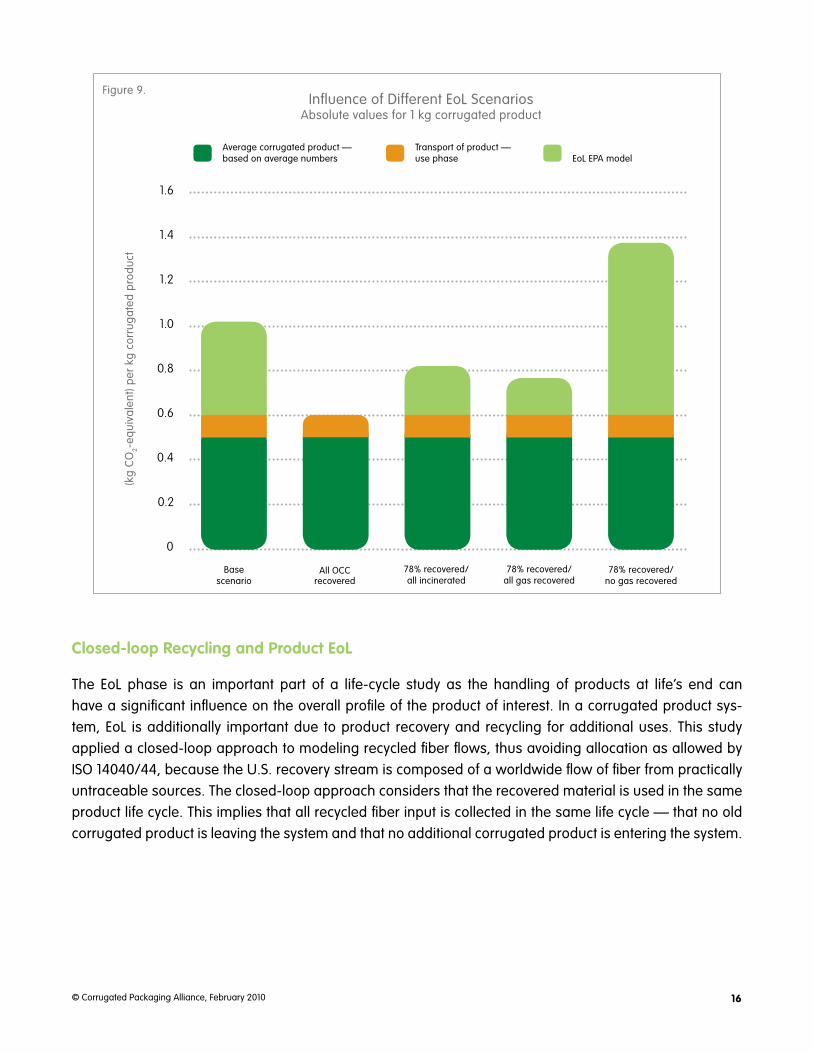
As shown in Figure 9, the EoL stage has a significant influence on overall climate change; so different
EoL scenarios were simulated to show the influence on overall performance. The following scenarios
were assessed:
• Base: 78 percent recovery rate/59 percent of landfill gas recovered
• All recovered: All corrugated product recovered, nothing to landfill/incineration
• 78 percent recovered/all incinerated: 78 percent recovery rate/all non-recovered incinerated
• 78 percent recovered/all gas recovered: 78 percent recovery rate/all landfill gas recovered
• 78 percent recovered/no gas recovered: 78 percent recovery rate/no landfill gas recovered
The handling of OCC has a significant influence on overall performance. For example, if no corrugated
were incinerated or landfilled at the EoL stage, the overall GWP would decrease by about 40 percent. Also,
landfill gas recovery has a significant influence. Please note that 47.5 percent of the recovered landfill gas
is combusted on-site, and no combustion emissions have been assigned to recovered landfill gas, which
is used as a product at this point (not flared). The influence on the energy mix of recovered fiber input into
containerboard mills has not been assessed. The sensitivity analysis is based on the same energy mix of
fossil and renewable energy input into containerboard mills.
Considering these assumptions, the analysis clearly indicates that the EoL stage is of relatively high
importance and the overall profile may be significantly reduced by managing the EoL stages of
corrugated products.
16© Corrugated Packaging Alliance, February 2010
1.6
1.4
1.2
1.0
0.8
0.6
0.4
(kg
CO
2-eq
uiva
lent
) per
kg
cor
rug
ate
d p
rod
uct
Figure 9.Influence of Different EoL Scenarios
Absolute values for 1 kg corrugated product
0
0.2
Base scenario
All OCC recovered
78% recovered/ all incinerated
78% recovered/ all gas recovered
78% recovered/ no gas recovered
Average corrugated product — based on average numbers
Transport of product — use phase EoL EPA model
Closed-loop Recycling and Product EoL
The EoL phase is an important part of a life-cycle study as the handling of products at life’s end can
have a significant influence on the overall profile of the product of interest. In a corrugated product sys-
tem, EoL is additionally important due to product recovery and recycling for additional uses. This study
applied a closed-loop approach to modeling recycled fiber flows, thus avoiding allocation as allowed by
ISO 14040/44, because the U.S. recovery stream is composed of a worldwide flow of fiber from practically
untraceable sources. The closed-loop approach considers that the recovered material is used in the same
product life cycle. This implies that all recycled fiber input is collected in the same life cycle — that no old
corrugated product is leaving the system and that no additional corrugated product is entering the system.

17© Corrugated Packaging Alliance, February 2010
Closed-loop Recycling and EoLFigure 10.
Corrugated product manufacturing
Transport-in-use
EoL
78% OCC recovery
22% landfill or incineration
Paperboard products
Other paper products
Export
60.1% (average 0.418 kg/1 kg of average corrugated product)
15.7%
3.5%
20.7%
1 kg corrugated product
1 kg corrugated product
Source: AF&PA 2006 Statistical Highlights
As per the AF&PA statistics, 78 percent of the U.S. shipments (old corrugated containers (OCC)) was recovered
in 2006. Of the fiber recovered, 0.418 kg (dry weight) per 1 kg corrugated board was recycled in container-
board mills. The remaining recovered fibers were recycled in other mills, going into products other than
corrugated, with the remainder of the fiber being exported. This prevents recovered corrugated material
from going to landfill operations or incineration. Therefore, no environmental effect is related to the recovered
OCC and as such it is modeled as “recycled in other system” with no credits or burdens assigned. Landfill,
incineration and landfill gas capture processes are modeled as per U.S. EPA municipal solid waste studies.

18© Corrugated Packaging Alliance, February 2010
Figure 11.
Where OCC Goes
Net exports
Other
Newsprint
Tissue
Packaging and converting
Recycled paperboard
Containerboard
60.1%
20.7%
15.7%
1.2%
0.0%
0.7%
1.6%
Source: AF&PA 2006 Statistical Highlights
Biogenic Carbon Handling
The “carbon neutrality” of renewable or “bio-based” materials must be considered when discussing
GWP or GHG emissions within the corrugated product system. The carbon content of biomass is
based on carbon dioxide uptake from the atmosphere and therefore the CO2 emissions related
to combustion of bio-based carbon must be considered as carbon-neutral. This fact is widely recognized
in the scientific and policy communities. As such, the GHG emissions associated with fiber mix and
biomass supply (as additional energy sources) are related to the use of fossil-based energy sources
(transportation, saw mills, etc.) or fertilizers used when growing wood. Since this share is based on fossil
energy resources, it cannot be considered carbon-neutral. The same logic applies to the GHG-relevant
emissions associated with combustion of fossil fuels or production of fossil-based electricity and steam.
However, the renewable nature of fiber biomass substantially reduces the overall carbon footprint of
a typical containerboard mill. Sixty-four percent of the energy used in containerboard mills in 2006 was
generated by biomass combustion, thus significantly reducing the mill CO2 emissions from what they
would have been if 100 percent fossil fuels had been used to generate that power.
19© Corrugated Packaging Alliance, February 2010
Interpretation
The following conclusions may reasonably be made based on the results of this study:
• Paper mills drive the life-cycle profiles — For all impact categories, material and energy flows
from paper mills dominate the results. Environmental impacts are dominated by energy demands at
the mill. Bio-based energy (e.g., hog-fuel, liquor, etc.) substantially reduces GWP contribution from
mills, but does not eliminate mills’ GWP contribution due to the use of fossil fuels. Energy sourcing is
a management option open to mill operators that can have a substantial effect on the environmen-
tal impacts. Increased use of bio-based energy sources will further reduce the overall use of fossil
energy and GWP impacts from mills, although there are numerous factors that must be considered
in the energy-sourcing decisions (e.g., availability and price).
• Transportation of final product does not define profile — Long-distance transportation scenarios
(based on national averages) were modeled yet still represented a minor influence on overall life-
cycle impacts for all impact categories.
• EoL is only important with respect to GWP — EoL as modeled (based on 2006 industry
average) demonstrates that it is only important in relation to GWP. Other life-cycle impact indicators
show little or no response from the EoL stage. The EoL effect on GWP is mainly related to methane
generated but not captured from landfill operations. The sensitivity analysis on different EoL
management scenarios clearly shows that increasing recovery, increasing efforts to capture
methane, or increasing the percentage of disposed corrugated materials that are incinerated for
energy recovery have the potential to improve overall environmental performance.
The Corrugated Packaging Alliance (CPA) is a corrugated-industry initiative jointly sponsored by the American Forest & Paper Association (AF&PA), the Association of Independent Corrugated Converters (AICC), and the Fibre Box Association (FBA). Its purpose is to address industrywide issues that cannot be fully accomplished by individual members alone. For more information visit www.corrugated.org.
The corrugated LCA was conducted by Five Winds International and PE-Americas.
20© Corrugated Packaging Alliance, February 2010
ADDENDUM
Critical Review
Five Winds International and PE-Americas were commissioned by the Corrugated Packaging Alliance
(CPA), an alliance between American Forest & Paper Association, the Fibre Box Association and the
Association of Independent Corrugated Converters to conduct a “cradle-to-cradle” LCA of a U.S. industry-
average corrugated product.
Athena Sustainable Materials Institute was commissioned in May 2008 to lead the critical review in
accordance with ISO 14040/44 (2006), in collaboration with co-reviewers of interested parties. The review
panel included the following experts:
• Mr. Jamie Meil, Athena Institute — review panel chairman
• Dr. Lindita Bushi, Athena Institute
• Dr. Michael Deru, U.S. National Renewable Energy Laboratory
• Martha Stevenson, private consultant – formerly of GreenBlue Institute
• Dr. Jim Wilson, Department of Wood Science and Engineering, Oregon State University
The review process entailed the following steps:
1. Meet, review and comment on the study goal and scope document
2. Review and comment on initial study results
3. Review and comment on the draft final study results and supporting report
At each milestone, the review process considered whether the following study elements were met:
1. The methods used to carry out the LCA are consistent with the ISO 14040 series of international
LCA standards
2. The methods used to carry out the study are scientifically and technically valid
3. The data used are appropriate and reasonable in relation to the goal of the study
4. The interpretation(s) reflect the limitations identified and the goal of the study
5. The study report is transparent
The critical review panel found the study methodology, the resulting LCI data and its interpretation to
be consistent with the guidelines for LCA studies as set down by ISO 14040/44 and properly addresses
the goal and scope of the study. See Appendix F in the full report for the panel‘s detailed remarks and
their recommendations for future iterations of the study. The full report is available on the CPA Web site,
www.corrugated.org.
Jamie MeilThe Athena InstituteReview Panel Chair

21© Corrugated Packaging Alliance, February 2010
For more information, visit the Corrugated Packaging Alliance at www.corrugated.org.
22© Corrugated Packaging Alliance, February 2010
www.corrugated.org
30% total recycled fiber