Embed Size (px)
Citation preview
POLICYFORUM2014
Corruption in India: Bridging Academic Evidence and
Policy Options
Sandip Sukhtankar Dartmouth College, BREAD and J-PAL
Milan Vaishnav
Carnegie Endowment for International Peace
India Policy Forum July 15–16, 2014
NCAER | National Council of Applied Economic Research 11 IP Estate, New Delhi 110002
Tel: +91-11-23379861–63, www.ncaer.org
NCAER | Quality . Relevance . Impact


Corruption in India: Bridging Academic Evidence and
Policy Options*
Sandip Sukhtankar** Dartmouth College, BREAD and J-PAL
Milan Vaishnav***
Carnegie Endowment for International Peace
India Policy Forum
July 15–16, 2014
Abstract
Corruption has become an increasingly salient issue in India today, spawning enormous interest from the media as well as a large amount of academic research. Yet, there is a large gap between what has captured the media’s attention, the policy options under discussion, and the actual evidence base drawn from empirical research on corruption. We attempt to bridge this gap by directly addressing the particular challenges that corruption in India poses. Academic evidence supports the popular perception that corruption is widespread and endemic. However, we find that the costs of day-to-day corruption are just as large, if not larger, than those of the “scams” that dominate headlines. Further, we find that there is very little evidence to support the idea that greater transparency, information, and community based efforts have a significant impact on reducing corruption on their own. This is also true for some technological interventions, although those interventions – like direct benefit transfers – that bypass middlemen and corrupt officials have a much greater scope for success, as do interventions that transfer bargaining power to citizens and beneficiaries. We find much to commend in the sensible and wide-ranging legislative agenda to combat corruption, including the Right to Service and Public Procurement bills. However, what is most important for combating corruption is not the law on paper but the implementation of the law; the binding constraint, as always, is the government’s desire and ability to punish corrupt officials and politicians.
JEL classification: D4, D73, H10, H40, H83, K42, O10. Keywords: Corruption, India, policy. *Preliminary draft. Please do not circulate beyond the NCAER’s preparations for the India Policy Forum 2014, for which this paper has been prepared.

Sandip Sukhtankar and Milan Vaishnav 1
1. Introduction
Corruption in India is a topic which seems to never fall out of fashion. From as far back as Kautilya’s Arthashastra in the 4th century B.C. to the 2G telecommunications spectrum scam in the contemporary period, corruption is widely perceived to be an endemic phenomenon in the Indian subcontinent.
Yet, by any measure, the salience of corruption in the public policy discourse in India has ratcheted up in recent years. This is, in part, a reflection of a series of high-profile “scams” which plagued the recently departed United Progressive Alliance (UPA) government. Recently, citizen anger with venality has risen to new heights. In 2011, India saw a groundswell of popular protest in which tens of thousands of citizens joined in anti-corruption demonstrations after a series of high-profile scandals implicated ruling politicians and their cronies in billions of dollars of graft—from the Commonwealth Games to 2G, and from “Coal-gate” to Adarsh Housing Society. This simmering discontent, of course, later gave rise to a new political formation—the Aam Aadmi Party (AAP) —which burst onto the political scene with a pledge to clean up government.
While the AAP’s star has dimmed in recent months, the anti-corruption mood in India today arguably helped propel the Bharatiya Janata Party’s (BJP) Narendra Modi and his National Democratic Alliance (NDA) government into power in the 2014 general election. Indeed, Modi consistently invoked the fight against corruption on the campaign trail, telling huge crowds that the Congress government stood for the “ABCD of corruption,” listing numerous scams in which the party and/or family members of the Nehru-Gandhi dynasty were implicated: "A for Adarsh, B for Bofors, C for CWG and D for Damad Ka Karobaar (‘son-in-law's business,’ a reference to corruption allegations lodged against Robert Vadra, the son-in-law of Congress president Sonia Gandhi).”
A post-election analysis conducted by the Centre for the Study of Developing Societies (CSDS) suggests that anti-corruption sentiment may have contributed to the BJP’s winning an outright majority in parliament, the first time any party has done so in three decades (and the first time in history such a feat was accomplished by a party other than the Congress). According to CSDS’ 2014 National Election Study, only concerns over price rise/inflation and economic development outranked corruption in the minds of voters when asked to name the issue which most determined their vote.
In this paper, we try and bridge the gap between evidence and policy when it comes to understanding the causes and consequences of corruption in India and formulating solutions to address its spread. This gap exists for several reasons.
For starters, corruption is by its very nature difficult to objectively measure. Most corrupt transactions transpire out of public view and the parties involved have incentives to keep it that way. What emerges from media reporting is, by definition, ex post and often sensationalist in nature; there is an obvious selection bias in what the media chooses to report.
Second, while there are, of course, many established theories of corruption emanating from the social science literature; these have produced markedly divergent predictions about both the causes and consequences of corruption. In particular, overall theory is ambiguous about whether corruption is bad for the economy. An old literature suggests that corruption “greases the wheels” of the economy by providing incentives
2 India Policy Forum 2014
for bureaucrats to work harder, and also by allowing firms and individuals to get around costly and inefficient red-tape and regulations (Leff 1964; Huntington 1968). Another strand predicts that corruption may have no efficiency effects, only redistributive ones: for example, if the most efficient firm is the one that can pay the highest bribes to officials in order to obtain contracts/licenses from the government, then there is no efficiency consequence, just a transfer from the government to the corrupt official (Lui 1985).
On the other hand, there are a number of theoretical reasons why corruption might negatively affect efficiency and economic and political development. Continuing the example above, the secrecy inherent in corruption might mean that firms connected to the bureaucrat – not necessarily the most efficient ones – obtain contracts/licenses (Shleifer and Vishny 1993). Meanwhile, not all rules and regulations are inefficient, and in cases where individual willingness/ability to pay diverges from what is considered socially good, corruption will not be optimal (Banerjee 1997). For example, being able to drive a car is a reasonable requirement for obtaining a driver’s license, and bribing to get around this rule might reduce social welfare. Further, bribery might increase bureaucrats’ incentives to create inefficient red-tape in the first place (Banerjee 1997).
The industrial organization of corruption may also matter. Suppose a firm needs multiple clearances to set up a project, and if a number of decentralized corrupt agents act as independent monopolists, they will charge bribes that are “too high” and create an inefficient entry barrier (Shleifer and Vishny 1993). Additionally, the type of corruption that involves straight theft might distort optimal public finance (Niehaus and Sukhtankar 2013b). Finally, the presence of widespread corruption in the economy might incentivize rent-seeking rather than productive activities (Murphy, Shleifer, and Vishny 1991).
Fortunately, one recent bright spot from academia is the development of a burgeoning empirical literature on corruption in India that tests many of these theoretical predictions. These studies have produced a vast amount of knowledge about both the political economy of corruption as well as the relative effectiveness of various solutions in addressing this scourge.
However, much of this scholarly work has not filtered down into the policy domain. While there are several excellent recent reviews of research on corruption drawing on a wide array of settings (Pande 2007; Olken and Pande 2012; Banerjee, Hanna, and Mullainathan 2013), corruption in India poses particular challenges that these surveys do not explicitly address. For example, archaic campaign finance laws result in candidates turning to illicit means to raise funds for elections (Kapur and Vaishnav 2013; Sukhtankar 2012); moreover, electoral accountability mechanisms proven to check corruption in other contexts (Ferraz and Finan 2011) fail in India where criminal and corrupt politicians thrive (Aidt et al. 2013; Banerjee and Pande 2009; Vaishnav 2012). Furthermore, many such reviews do not produce explicit recommendations for formulating better public policy.
These various misalignments have created a great deal of confusion. Despite the increasing salience of corruption in India and the heated political rhetoric the subject arouses, there is a large gap between what has captured the media’s attention, the policy options under discussion, and the actual evidence base from empirical research on corruption. To give one example, the conventional wisdom holds that corruption in politics or in public works program is often the result of information asymmetries. Yet,
Sandip Sukhtankar and Milan Vaishnav 3
multiple studies actually show that information provision is largely ineffective in producing better governance outcomes, at least in isolation (Banerjee et al 2010a, Niehaus and Sukhtankar 2013b, Ravallion et al 2013).
The objective of this paper is to make a modest contribution toward a more optimal alignment. To do so, the paper is comprised of three main parts. In part I (section 2), we categorize corruption in India and draw on research from both economics and political science to describe the magnitudes, causes, and consequences of various types of corruption.
In part II (section 3), we compile and describe an illustrative list of major “scams” that were uncovered in the past decade and a half (roughly after the year 2000). While these scandals have generated and dominated headlines, the actual details of what transpired and what consequences result are often overlooked in the media frenzy. Moreover, while these scams attract a lot of media attention, there is little academic research on these cases. By examining the precise details, we attempt to derive lessons from common aspects across these scams.
Finally, part III (section 4) discusses broad strategies for combating corruption, describes major recent anti-corruption legislation either passed or under discussion, and explores academic evidence as well as a conceptual framework that might predict the effectiveness of both broad strategies and particular legislation in combatting corruption.
It is important to note that our focus with respect to parts I and III is on academic research that has rigorously evaluated causal relationships with the best quality data and information possible. Given the vastness of the literature on corruption in India, we were compelled to narrow our parameters in this way. Furthermore, with an eye towards distilling the major takeaways of this literature and extracting the core policy prescriptions that emerge, we have generally tried to avoid discussions of empirical methodology. In so doing, we follow a template similar to that pursued by Muralidharan (2013) in his review of education in India.
2. Varieties of Corruption: Magnitudes, Causes, and Consequences
We begin by defining corruption and dividing it into categories. The common academic definition is the broad “misuse of public office for private gain” (Bardhan 1997). This definition encompasses many varieties of corruption, and we group these varieties into the following conceptual categories for ease of analysis:
1. Bribes to obtain government services like ration cards/passports
2. Bribes to bypass fines/ regulations
3. Kickbacks from procurement in government
4. Bribes paid to obtain contracts/ licenses/ other rents
5. Pure theft/ embezzlement from government/ beneficiaries
6. Shirking/ not showing up to work
7. Electoral corruption
4 India Policy Forum 2014
For each category, we ask: what actual academic evidence do we have for the scale/scope of corruption; how would corruption of this type distort allocations in theory; and what evidence do we have on whether it actually affects economic and political outcomes in India? The justification for the categorization is based on theoretical predictions of the consequences of each type.
2.1. Bribes to obtain government services/ documents
We begin with a category of corruption that a majority of Indians have likely experienced: the payment of bribes to obtain routine government services and documents such as ration cards, driver’s licenses, passports, residence and caste certificates, etc. Transparency International notes that 54% of urban respondents who had contact with nine common government service organizations had to pay a bribe to obtain the service (Transparency International 2011 South Asia Barometer). The popular website www.ipaidabribe.com was started in part because of the commonality of this type of experience, and although the self-reports collected there are not representative, the site claims millions of visits and tens of thousands of reports from six hundred cities and towns across India. Popular resentment against this type of corruption has led to the introduction of the Right to Service legislation, although the bill is still languishing in the Lok Sabha.1
Theoretically, this type of corruption likely comes under the rubric of “corruption without theft,” where officials pass on the official price of the good/service to the government but charge additional fees/ bribes that they keep (Shleifer and Vishny 1993). Under this scenario officials need to artificially restrict the quantity of service provided so that they can charge the higher overall price. Further social and efficiency consequences are likely to arise from the “wrong” people – from the point of view of society – getting the document or service: for example, bad drivers getting licenses, rich people getting Below Poverty Line (BPL) cards, etc. Of course, if bribes simply serve as user fees or “speed money” to incentivize bureaucrats to work faster, but don’t allow the “bad” types to obtain services or documents, the negative consequences might be mitigated.
Recent empirical work provides us with good evidence on the extent and consequences of this type of corruption. Bertrand et al. (2007) followed 822 applicants for driver’s licenses in Delhi. As predicted by theory, bureaucrats artificially restrict licenses and create red tape in order to charge applicants more than official fees and clear the market: government officials seem to arbitrarily fail applicants taking the official driving test, as the authors find that failure on this test is uncorrelated with actual driving ability as measured by an independent driving test. Accordingly, applicants must make multiple trips to obtain licenses, and end up paying 2.5 times the official fees for the license.
These bribes do not simply represent a transfer from applicants to bureaucrats, but are actually harmful to society: 71% of license getters do not take the licensing exam, and most damningly 62% of license getters failed the independent driving test. Further, the authors experimentally manipulate willingness to pay (private value) by offering a random subset of study subjects a substantial bonus if they obtain their
1 Right of Citizens for Time Bound Delivery of Goods and Services and Grievance Redressal Bill, 2011.
Sandip Sukhtankar and Milan Vaishnav 5
licenses quickly. They find that the licensing process is very responsive to private value, but not to social value: those offered a bonus were much more likely to both get a license but also to be unable to drive when compared to the control group.
A similar story of extra-statutory fees and the “wrong” people getting government services and benefits holds true for Below Poverty Line (BPL) cards. These cards entitle households to a range of welfare benefits, most importantly, to subsidized food under the Targeted Public Distribution System (TPDS). Niehaus et al (2013) surveyed 14,074 households in rural Karnataka to learn about the process for obtaining BPL cards. They found that bribery is widespread: 75% of households reported paying bribes to obtain the cards, although the average payment above official fees was small: Rs. 14.
More importantly, however, they found that 48% of households are misclassified. Seventy percent of households that were ineligible to receive BPL cards – based on criteria such as owning a vehicle, color TV, gas connection, or more than 5 acres of land – had a card (type 1 error), and worryingly, 13% of eligible households did not (type 2 error). Overall, statutory eligibility was much more strongly correlated with income than actual ownership of cards, suggesting that reasonable targeting rules were perverted by the corrupt allocation process.2
Two studies in Delhi (Peisakhin and Pinto 2010; Peisakhin 2012) found similar arbitrariness and restriction in the provision of ration cards (required for TPDS benefits) as well as voter ID cards, although these results must be viewed with caution given the small and non-representative samples (86 and 121 individuals respectively in one slum and university area). For study subjects, it was practically impossible to obtain these documents without paying a bribe or resorting to a Right to Information request. We discuss these studies further in section 4.
2.2. Bribes to bypass fines/regulations
Few studies are able to empirically document bribe-giving by firms in order to bypass fines or other regulatory action because such behavior is an example of “collusive corruption.” In other words, when a firm pays a regulator a bribe to subvert or circumvent existing regulation, neither the bribe-giver nor bribe-taker has an incentive to publicize this transaction (Bardhan 1997).
However, a recent paper by Duflo et al. (2013) breaks new ground. In most markets in which the state plays a regulatory function, regulated firms themselves often choose and pay for the “third-party” audits meant to monitor compliance. This naturally creates a conflict of interest: the firm has an interest in an audit that paints the firm in a good light, while the auditor has an interest in satisfying the client in order to maintain business. This creates an incentive for rampant corrupt behavior although it need not necessarily have an adverse direct impact on economic efficiency.
In the context of a third-party audit experiment involving pollutant-emitting plants in the state of Gujarat, the authors uncover systematic evidence of corruption in
2 Besley, Pande and Rao (2007) examine data from four south Indian states and find that while local-level politicians target BPL cards to households which are relatively disadvantaged on average, households in which politicians themselves are living are much more likely to possess BPL cards.
6 India Policy Forum 2014
the audit reporting for plants in the control group that is those plants that are audited by firms selected and paid for by the plants themselves. When auditors were hired and paid by the firms they were auditing, 29% of auditors falsely reported pollution below the regulatory standard (even though actual emissions were above the standard). For control group emitters, auditors reported that only seven percent of plants violated the government standard when in reality 59 percent were emitting more than the standard.
2.3. Kickbacks from procurement in government
The third category of corruption is kickbacks emanating from government procurement. In many developing countries, government procurement is perceived to be rife with corruption. For instance, government agents might grant firms contracts in exchange for bribes or kickbacks, which could result not just in economic distortions but also efficiency losses. If an agent awards an infrastructure contract to a firm for reasons independent of firm quality, it is possible that the firm is unqualified to execute the contract faithfully or will shirk in order to recoup the financial loss incurred by the bribe payment. A 2014 survey of “Global Economic Crime” by the accounting firm PwC found that the industry reporting the greatest degree of procurement fraud was government/state-owned enterprises. Furthermore, the other high ranking industries—infrastructure, energy, and transport—all require close interaction with government entities (PwC 2014).
In India, corruption in public procurement is a well-identified obstacle to improving the country’s investment climate (UNODC 2012). To our knowledge, however, there has only been one rigorous empirical study of corruption in government of India procurement practices. In the context of a study on the introduction of electronic procurement, Lewis-Faupel et al. (2013) examine the tendering process for manual procurement drawing on a random sample of road contracts issued by the state of Uttar Pradesh. As the authors note, manual procurement is subject to corruption on several grounds. Because documentation is not public and exists only in written form, the government can provide private information to favored bidders that would give them a competitive advantage or use its discretionary authority to disqualify bidders on spurious grounds. Indeed, the authors find there is little competition for public sector road-building contracts because many firms are disqualified on “technical” grounds. Indeed, in 95 percent of cases the government only ended up evaluating a single firm’s financial bid. Where there are multiple initial bidders, in the case of any technical disqualification, the authors report that “all but one bidder are disqualified 100 percent of the time.” The pattern of disqualification is consistent, the authors argue, with corrupt officials rigging the procurement process to favor a pre-determined winner.
2.4. Misallocation of contracts/licenses/jobs/etc.
There is a burgeoning literature on politicians manipulating the targeting of goods, services, licenses, jobs or other transfers in order to reap electoral benefits. Whether these activities are “corrupt” in a narrow sense can be debated; distributive transfers in this realm are variously referred to as pork, clientelism, or patronage. Stokes et al. (2013) provide a conceptual framework for differentiating across these types of transfers, but what is common to all is that they are non-programmatic. Non-programmatic distribution implies that transfers are either not guided by formalized,

Sandip Sukhtankar and Milan Vaishnav 7
public criteria or that whatever public criteria do exist are subverted by private or partisan metrics (Ibid). The use and abuse of discretionary power to target goods on political lines can have negative welfare effects through of variety of mechanisms. First, it can entail a misallocation of public resources. Politicians may privilege the distribution of certain goods or benefits not on the basis of demonstrated demand or need, but rather because of the ease with which they can be targeted. Second, political targeting can create opportunities for quid pro quos and corruption. Thus, it can shape private incentives for rent seeking. Finally, such misallocation can weaken institutions and erode trust in government by politicizing government distribution.
As Golden and Min (2013) argue in a recent review of the literature on distributive politics around the world, existing studies generally fall into three categories: (1) studies of whether politicians target goods to “core” or “swing” voters; (2) studies of political favoritism in the allocation of public sector goods on ethnic, religious or other demographic lines; (3) and studies of electoral business cycles. There is a fourth category—studies assessing the electoral impact to targeted benefits—but our brief review of the literature on India below focuses on studies belonging to the first three categories.
Core/swing
There is little disagreement with the notion that politicians disburse government-provided goods on the basis of political criteria in order to enhance their electoral prospects. Rather, the debate in the literature is over how politicians target such goods. In the comparative literature, there have been two, opposing models put forward to explain the nature of such targeting.
One set of studies finds that politicians will direct benefits to their core supporters (Cox and McCubbins 1986) for a variety of reasons: because they are more easily identifiable; because of strong partisan preferences; or because such supporters can be most efficiently mobilized. On the other hand, some studies find the exact opposite: parties prefer to target resources towards “swing” or “pivotal” voters (Lindbeck and Weibull 1987; Dixit and Londregan 1996). Proponents of this view argue that parties do not need to waste scarce resources on rewarding core supporters who, at the end of the day, have no credible “exit” option.
The evidence is decidedly mixed; some studies find support for core voter bias (Ansolabehere and Snyder 2003; Chen 2013) while others report findings in favor of the "swing" hypothesis (Stein and Bickers 1994; Dahlberg and Johansson 2002; Stokes 2005). Recent contributions to the literature find that parties target turnout rather than votes, which can lead to divergent empirical predictions (Nichter 2008). Others find that the nature of the targeting depends on the type of good being targeted (Diaz-Cayeros et al. forthcoming).
In India, several studies have examined the political targeting of publicly provided goods. Arulampalam et al. (2009) examined the disbursement of central grants to states over two decades (1974-1997). The authors find that states which are politically aligned with the central government in Delhi but were “swing” states in the prior Vidhan Sabha and Lok Sabha elections received nearly 20 percent higher central grants than a state which was unaligned and not a swing state.
Yet not all central transfers to the states originate from the same pot of money. Exploiting this fact, Khemani (2007) compares discretionary transfers from the centre
8 India Policy Forum 2014
to the states emanating from the Planning Commission versus rule-bound transfers from the Finance Commission. While the latter do not appear to be given on a political basis—indeed, state governments unaligned with the centre receive more funding—plan transfers are statistically more likely to go to aligned state governments. The comparison demonstrates the manner in which constitutional rules, carried out in the case by an independent agency, can curtail the most obvious political biases on targeting.
Cole (2009) studies the provision of credit from public sector banks and finds that they make significantly more loans in districts where the ruling party barely won or lost then previous election (and, hence, can be considered “swing” electoral districts) compared to either core or opposition areas. This targeting is restricted to public sector banks, whose loans can presumably be manipulated by politicians, and does not appear to influence private sector lending.
Finally, a paper by Sircar and Vaishnav (2013) studies patterns of public school construction in the southern Indian state of Tamil Nadu over the period of 1977 to 2007. The authors find that the ruling party at the state level tends to invest in school construction in “core” electoral constituencies, or those which voted most in favor of the ruling party or alliance. However, the effect is not uniform across time. In election years in which there was a high percentage of exceptionally close electoral contests, the ruling coalition is constrained by electoral realities and primarily targets “swing” constituencies.
Because these studies are not easily comparable, it is difficult to offer generalizable conclusions, other than the fact that partisan targeting of government-provided goods is rampant. For starters, these studies look at different transfers in different contexts and over different periods of time. In line with the recent literature outside of India on distributive politics, effects are likely to be highly conditional on the electoral context as well as on the nature of the transfer.
Favoritism
The core-swing debate represents, of course, just one axis along which politicians can target benefits. They can also demonstrate favoritism, not necessarily along partisan lines, but instead according to social cleavages such as ethnicity, caste, religion, culture, heritage, race, etc. In many countries around the world, ethnicity is often politicians’ preferred mode of targeting and there is, of course, a large literature on ethnic favoritism. Scholars such as Fearon (1999), Caselli and Coleman (2013), and Franck and Rainer (2012) demonstrate how politicians often use ethnicity as a way of targeting co-ethnic supporters—redistributing resources toward their own members—while excluding those are from different ethnic groups.
Dynamics of ethnic favoritism have been well documented in the case in India (Chandra 2004).3 For instance, Banerjee and Somanathan (2007) use Census data on the availability of village amenities to map variation in public goods provision at the level of parliamentary constituencies. Using data from the 1971 Census, the authors find
3 Kramon and Posner (2013) strike a cautionary note, however, documenting how the conclusions one draws about who benefits from government allocation decisions can vary, based on the good or benefit one studies. Using data from Africa, the authors demonstrate that evidence of “favoritism” is contingent on the good selected for study since governments can target various groups using multiple types of goods or transfers.

Sandip Sukhtankar and Milan Vaishnav 9
a strong correlation between group identities and access to public goods. Traditionally privileged upper caste Brahmins had a better access to most—though not all— public goods (such as public schools and piped water). On the other hand, areas with higher proportions of Muslims, a historically disadvantaged minority in India, as well as two groups at the bottom of the traditional social hierarchy, Scheduled Castes and Scheduled Tribes, lacked such access.
Using the 1991 census, the authors explore changes over the two decade period. They uncover strong evidence of convergence when it comes to access to basic public goods, but only with respect to Scheduled Castes. Scheduled Caste areas benefit from a dramatic expansion of rural welfare spending and close the access gap with the upper castes, but the same does is not true for Scheduled Tribes or Muslims. The authors conclude that this is a product of increased political assertiveness on the part of the Scheduled Caste community and the rise of pro-SC political parties (such as the Bahujan Samaj Party) which influenced the targeting of welfare spending. During this period, India’s tribals and Muslims enjoyed no such influential political patrons across India.
Betancourt and Gleason (2000) report complimentary cross-sectional evidence from the 1981 Census. The availability of health and education inputs is negatively correlated with the proportion of SCs and Muslims living in a district. However, the authors point out that much of the variation is soaked up by unobserved state characteristics (state fixed effects) which do not differ across districts within a state.
There have also been studies carried out at the panchayat level to assess favoritism in the distribution of benefits with more disaggregated data. One study by Besley, Pande and Rao (2005), using data from four south Indian states, finds that politicians do exhibit group preferences in distributing government benefits (in their case, Below Poverty Line (BPL) cards) although such biases can be mitigated by the information environment and politician education.
There is now a very sizeable subset of the ethnic favoritism literature that uses reservation of constituencies for women and minorities (such as Scheduled Castes and Scheduled Tribes) to detect whether and how identity-based political selection criteria affect the distribution of benefits. This large literature has produced mixed findings.
In one of the first empirical studies using panel data, Pande (2003) found that political reservation for SCs and STs in Indian states increased the redistribution of resources in favor of these two groups. In other words, mandated political representation worked to channel government funds to the groups whom affirmative action was supposed to benefit. Since the response of political reservation in a given state to demographic changes operates with a lag, Pande is able to disentangle the effects of changes in political representation versus underlying demographic shifts.4
In West Bengal, Bardhan et al. (2010) find that villages where the village president (pradhan) was reserved for Scheduled Castes saw increased benefits for the village at large, and SCs in particular. But others have not found such impacts. For instance, Dunning and Nilekani (2013) find no evidence of Scheduled Caste politicians favoring their own when it comes to allocating developmental funds, drawing on original survey data from Bihar, Karnataka, and Rajasthan. Rather, the authors find that
4 Chin and Prakash (2011), using state level data and an identical identification strategy to Pande (2003), finds that increasing the share of seats reserved for Scheduled Tribes significantly reduces poverty while increasing the share of seats reserved for Scheduled Castes has no impact.
10 India Policy Forum 2014
when politicians have incentives to distribute goods along partisan lines, such cross-cutting partisan ties weaken the distributive impact of caste reservation. Data from 80 village councils in the state of Karnataka analyzed by Palaniswamy and Krishnan (2008) reveals that there are strong biases in the village-level allocation of fiscal grants to village councils. These biases often work against the interests of reserved communities. For example, villages represented by councilors from the SC and ST communities received significantly fewer funds than similar villages represented by OBCs or other dominant castes. The authors point to this targeting failure as an example of elite capture.
More recent work by Jensenius (2013) using rich data on development indicators from 1971-2001 from more than 3000 state assembly constituencies finds that Scheduled Caste reservations have not had much impact on development outcomes in constituencies reserved for SCs. The author focuses on the state rather than the local level given that it is the states that have primary responsibility for most developmental functions (and, furthermore, village reservations have only been in practice since the mid-1990s).5 The author concludes: “30 years of quotas for SCs have had no systematic development effect at the constituency-level. Seen in combination with results of no development effect at the state-level and village-level, there can be little remaining doubt that the electoral quotas for SCs have not had a direct, aggregate effect on the socio-economic development of the SC community in India.” Based on qualitative data, she argues this is because of the electoral incentives provided by the quota system (which favor a bias towards the median voter, who is often not an SC) as well as norms about party nominations and socializing behavior.
Since there are no political reservations for religious minorities, Bhalotra et al. (2013) use a regression discontinuity design to study the impact of religious identity on development outcomes. Exploiting close state assembly elections in which Muslim legislators narrowly won (or lost) elections, the authors demonstrate that increasing Muslim political representation improves health and education outcomes in the legislator’s district but that there is no evidence of religious favoritism per se; Muslim households do not benefit more from Muslim political representation than households from other religious groups.
Research on reservation for women generally finds that female leaders, in office due to random rotation of electoral reservations (in the case of panchayat elections) or quasi-randomly due to the closeness of elections, results in policy choices more in line with women’s interests (Chattopadhyay and Duflo 2004; Clots-Figures 2011; Clots-Figures 2012; Bhalotra and Clots-Figures 2014).
In sum, there do appear to be strong ethnic biases in the targeting of fiscal resources and other benefits. However, these biases are not universal and appear to be conditional on a range of possible factors, from partisan mobilization to demographic size. Furthermore, given that fiscal resources are not always highly correlated with policy outcomes, this disjuncture could actually mitigate the impact of ethnic bias.
5 One possible objection to this study design is that most transfers in India (above the village level) are channeled through districts, which are administrative units, rather than electoral constituencies, which are political ones. In India, there is no clean overlap between the two. To the extent we observe the former rather than the latter, it might be difficult to detect effects at the constituency level.
Sandip Sukhtankar and Milan Vaishnav 11
Political business cycle
The third strand of the literature on misallocation of government resources centers on political business cycles. There is a large social science literature dating back to Nordhaus (1975) concerning fluctuations in government intervention tied to the vagaries of the political-electoral cycle. Nordhaus (1975) and later Rogoff and Sibert (1988) and Rogoff (1990) argued that incumbent governments will manipulate economic policy to provide higher consumption to voters in an effort to improve its standing in advance of elections. Manipulation of policy on account of a political calendar can have myriad efficiency costs. For instance, if politicians ramp up spending prior to elections to woo voters, this could result in leakage if spending cannot be adequately absorbed or is poorly targeted. Second, excess spending around elections has opportunity costs in terms of resources rendered unavailable later in a government’s term due to fiscal constraints. Finally, changes in the composition of spending towards sectors that are “friendly” and visible to consumers (i.e. voters) could hamper public investment over the long run.
Political business cycle models, despite their diverse focus, generate an identical empirical prediction: they all predict that government policy outcomes will move in concert with electoral cycles (Brender and Drazen 2005). This basic insight spawned a large empirical literature on electorally timed policy manipulation across a range of developed and developing countries.
More recent entries in this literature explore conditional effects. For instance, Shi and Svensson (2006) find that political budget cycles are large in developing countries but small or nonexistent in developed countries (a related study by Brender and Drazen 2005 find they are prevalent in new, but not old, democracies). Furthermore, the size of political budget cycles depends on institutional features of the country, such as corruption and the information environment.6 Drazen and Eslava (2010) argue that because voters value some types of spending more than others, it is not the overall quantum of spending that necessarily moves with the electoral cycle but the composition of spending.7
What have scholars found in an Indian context? Khemani (2004) studies disaggregated central transfers to Indian state governments. She finds that there is a political business cycle when it comes to capital investment. Interestingly she finds evidence for a cyclical pattern of expenditures on road construction—which she claims is suggestive of strategic placement of investment goods at election time.
Using annual data on central government finances, Chaudhuri and Dasgupta (2005) find that that the center’s economic policies are responsive to election timing but are largely insensitive to government type. Kaushik and Pal (2012) look not at central transfers but the extent to which political factors color the allocation of state
6 A subnational study by Akhmedov and Zhuravskaya (2004) using regional data from Russia finds that electoral business cycles are particularly robust for public goods like health and education projects because these are highly visible and suitable for credit claiming. However, the effects are conditional; the magnitude of the cycle decreases with government transparency, level of regional democracy, and voter awareness. 7 Using data from Colombia, the authors find that most categories of investment spending exhibit pre-election expansions, while some components of current spending contract. Voters reward incumbents who increase investment sending, but only to the extent that they do so without running large election-year deficits.

12 India Policy Forum 2014
revenue budgets for development expenditures (following Drazen and Eslava 2010). Using panel data from 1971 to 2005, the authors find that the greater the extent of ruling party “strongholds” there are in a state, the higher proportion of revenue budget allocated for developmental expenditure. A related study by Saez and Sinha (2010) analyzing state-level developmental expenditures from 1980 to 2000 also finds evidence of electoral business cycles.
Cole’s (2009) study of agricultural credit, in addition to studying targeting, also tests for electoral cycles. The author finds evidence of clear electoral manipulation in the provision of agricultural credit, especially from public sector banks. As Cole notes, the magnitudes are quite significant: “the estimated effect of 5-10 percent higher levels of credit in election years is substantially larger than the average annual growth rate of credit.” The economic losses on account of political manipulation are sizeable. The electorally linked boom in agricultural credit is associated with significantly higher loan default rates yet has no relationship with improvements in agricultural output.
Min and Golden (2014) test whether electoral cycles are present in the theft of electricity in India’s largest state, Uttar Pradesh. The authors hypothesize that state politicians will pressure public sector electricity companies to essentially “allow” more theft in advance of state elections in order to boost public support. Indeed, their analysis demonstrates that theft is greatest in state election years. Power theft is particularly concentrated in areas with greatest tube well intensity, which suggests that politicians are rewarding large farmers, a key interest group. As a baseline, transmission and distribution (T&D) losses in Uttar Pradesh (which is a proxy for theft and loss) hover around 30 percent, but the authors find that losses are 3 percentage points higher, on average, in election years.
Finally, Sircar and Vaishnav’s (2013) study of public school construction in Tamil Nadu also uncovers evidence of an electoral business cycle at work. This paper differs from others in this category because the authors conceptually distinguish between ex post vote rewarding and ex ante vote buying or vote mobilizing. They suggest that local public works construction, or other forms of “pork barrel,” is a blunt instrument for attracting or mobilizing voters but can be a valuable mechanism by which parties can induce support through a system of credible rewarding after the elections are over. This implies that while construction will operate on an electoral business cycle, it will likely spike following rather than before elections. Indeed, they find that the vast majority of school construction (95 percent) undertaken by the Tamil Nadu state government occurs within the first two years of a new government’s term.
In sum, the literature from India uncovers strong evidence of political business cycles. In line with theoretical predictions, expenditures are concentrated in areas where voters are most likely to derive direct benefit.
2.5. Pure theft/ embezzlement from government/ beneficiaries
This fifth category of corruption is variously described as leakage, diversion, or embezzlement. In its simplest form, the government tries to send benefits of some kind – money, food, medicines – to recipients, and officials in charge of delivery simply steal them rather than delivering them to the poor. Late Prime Minister Rajiv Gandhi once famously estimated that only 15% of benefits disbursed by the government of India actually reach the poor. In addition, overbilling the government for benefits in the name
Sandip Sukhtankar and Milan Vaishnav 13
of fake recipients also falls under this category. Thus, theft can be from both beneficiaries, which directly harms them (“underpayment”), and from the government, which harms taxpayers in general (“overreporting”).
Embezzlement has distortionary consequences for optimal public finance. First, it might make seemingly progressive public programs regressive, if officials are generally richer than beneficiaries and taxpayers (Olken 2006). Second, it affects optimal rules for the allocation of public funds: without corruption, governments would simply equate the marginal social costs of raising funds to the marginal social benefits of delivery, but with embezzlement the marginal social benefits need to be adjusted by the fraction of funds that actually reach the poor (Niehaus and Sukhtankar 2013b).
In addition, leakage may have systemic negative consequences too: officials may allocate time towards activities focused on embezzlement (Murphy, Shleifer, and Vishny 1991), rather than implementing public programs as they are meant too. On the other hand, these rents may keep officials incentivized to implement programs.
Recent empirical work provides evidence on leakage from at least the two largest welfare programs, NREGS and TPDS. The methods used in these studies are straightforward: they involve comparing official records of disbursements of benefits against beneficiary surveys. Of course, beneficiary recall and misreporting are concerns with this methodology, and so precise levels must be viewed with caution.
Niehaus and Sukhtankar (2013a,b) surveyed about 3,000 listed NREGS beneficiary households in three districts in Orissa and one in Andhra Pradesh, comparing official records of disbursements of NREGS wages against beneficiary reports in original surveys. The results are disheartening, to say the least: about 70-80% of the NREGS labor budget is embezzled before it gets to beneficiaries. This corruption directly hurts beneficiaries, as the work they do is not correctly remunerated, and their wages are underpaid. It also hurts taxpayers, through over-reporting of work done, as the exchequer pays out far more than intended.
In addition, government efforts to increase benefits – the statutory wage in this case – are entirely thwarted, as none of the increase is passed on to beneficiaries. The authors show that with this kind of corruption, a program that is meant to set market wages instead ends up being a price-taker: beneficiaries are just paid the prevailing market wage in the area.
It is important to keep in mind that these results – although representative for the areas surveyed – correspond to districts that are likely more backward and corrupt than the median district in India.
Khera (2011) highlights heterogeneity across India in embezzlement from public programs while examining diversion of food grains from the TPDS. Comparing state-level offtake for TPDS (i.e. the amount of grains that states obtain from the Food Corporation of India (FCI)) of rice and wheat to NSS survey reports of grains received by beneficiaries from Fair Price Shops (FPS, or ration shops), she finds that the overall rate of diversion in India in 2007-8 was about 44%. Estimates range from basically no diversion in Chhattisgarh, to almost 90% diversion in Bihar. These estimates are likely to be the upper bound of pure leakage, since some of the grains that do not reach beneficiaries may simply be due to losses in transport or spoilage or other mismanagement.
14 India Policy Forum 2014
These estimates are very close to the Government of India’s own estimates of diversion in the TPDS. A report by the Planning Commission (Programme Evaluation Organization, 2005) finds that 58% of food grains issued by the FCI do not reach the poor (Below Poverty Line, or BPL families), which is comparable to the 54% figure that Khera estimates for 2004-5. The report also monetizes the magnitude of the loss and the cost of delivery, calculating that for every Rupee transferred to the poor, the government spent Rs. 3.65. In other words, the poor obtain only 27% of the benefits they are meant to receive.
2.6. Shirking/not showing up to work
This insidious type of corruption involves public sector employees not showing up to work when they are supposed to, or, more broadly, shirking on the job. It is in a way similar to embezzlement, since it basically involves theft of time from the government. However, the causes, consequences, and strategies to combat this form of corruption differ significantly. Absence or shirking on the job is common in the public sector across the world, since disciplining public sector employees proves to be difficult given strong unions and other political economy factors.
The consequences of absence could include long-run harm to human capital – mainly through education and health – in the country. As Chaudhury et al. (2005) point out, in developing countries absent health and education workers basically mean closed hospitals and schools, since there are no substitutes and many of them have single providers. The unpredictability of absence may also discourage users from attempting to access these services in the first place. Moreover, alternatives to public schools and hospitals may be too expensive and/or just as ineffective.
Chaudhury et al. (2005) conducted a representative survey across India to measure absence amongst teachers and health care workers in government schools and health centers. Doing random checks of schools and clinics during working hours, they find that rate of absence of teachers is 25%, health care workers 40%. This compares to 5% in developed countries. Other work corroborates these absence findings in smaller samples: Banerjee et al. (2010a) find 27% teacher absence in Jaunpur district in Uttar Pradesh, and Banerjee, Duflo, and Glennerster (2008) find 54% health care worker absence in Udaipur in Rajasthan. An updated survey conducted by Muralidharan el al. (2014) which went back to the same schools as Chaudhury et al (2005) found that not much had changed: teacher absence rates were still 23% across India.
These absence rates are likely a lower bound, since Chaudhury et al. were conservative in what was counted as an absence: for example, they did not count part-time employees, and took the head of the school/clinic at her word if she said an employee was not supposed to be working. In addition, the authors also find that even when teachers are present, they are teaching only 45% of the time. This is in spite of also being conservative in defining teaching activity to include any time a teacher was in the classroom. Similarly, health care worker absence is compounded by the fact that even when they are present, public doctors treat patients much worse in public clinics than they do in their own private practices (Das and Hammer 2007).
The depressing news continues since Chaudhury et al. also find that absence rates are worse in poorer areas: a doubling of per capita income is correlated with absence rates that are 6 percentage points lower. Health care also suffers: the quality of

Sandip Sukhtankar and Milan Vaishnav 15
care is such that in poor areas, unqualified private doctors tend to perform better than qualified public doctors (Das and Hammer 2007). Further, hiring additional teachers only leads to greater absence: hence effective marginal rates of absence were even greater than average rates (Muralidharan et al. 2014).
The causes of education and health worker absence are fairly straightforward to understand. Given political economy constraints, these civil servants rarely, if ever, face any sort of punishment for shirking. Chaudhury et al found only one instance of an employee firing out of 3000 cases where a teacher was absent. Further, they also find that the more powerful a position, the more likely was the occupant to shirk: for example, doctors were more likely to be absent than nurses, men more likely than women, and head teachers more likely than ordinary teachers.
The consequences of absence are, of course, poor health and education outcomes. For example, while enrollment rates are almost 100% amongst children aged 6-14, only 56% of children in rural India can read a simple story by grade 5. Duflo, Hanna, and Ryan (2012) find that reducing teacher absence from 42% to 21% in rural Rajasthan improved student test scores by 0.17 standard deviations, which is a very large effect in this literature. Finally, there is a large fiscal cost to the government: Muralidharan et al. (2014) estimate this to be $1.5 billion a year, or 60% of the revenues raised by the special education tax.
2.7. Electoral corruption
The final category of corrupt activities we review relates to the electoral domain. We separate this broad category into three components: financial returns to electoral office, election finance, and criminality in politics.
Financial returns to office
Political office is widely perceived to be a highly lucrative proposition in India. More than two decades after the 1991 economic reforms, politicians retain a significant amount of discretionary power to influence resource allocations, contracts, licenses and other government-provided benefits. Indeed, the regulatory intensity of the state remains extremely high in several key growth sectors of the economy, which in turn gives politicians—and the bureaucrats who serve them—abundant opportunity to engage in rent seeking .
Quantifying just how lucrative elected office can be is not an easy task. However, today we at least have some basic sources of data to begin answering this question in a more systematic fashion. In 2003, in response to public interest litigation filed by the Association for Democratic Reforms (ADR), the Supreme Court of India ruled that the Election Commission could mandate that each and every candidate standing for election at the state and national levels must submit and publicly disclose, at the time of nomination, a judicial affidavit detailing their educational qualifications, financial assets and liabilities, and information about pending criminal cases. With the Court’s backing, the ECI framed new guidelines for disclosure, which have improved the level of information ordinary Indians can access about the political class (for a review of the legal foundations of the ruling, see Sen 2012).
With this data in hand, one can compare the assets of re-contesting candidates in order to get some estimate of changes in assets over time. ADR analyzed the financial

16 India Policy Forum 2014
disclosures of state and national incumbent legislators who won elections in the early 2000s and then stood again for re-election several years later. The average wealth of sitting MPs and MLAs increased by 222 percent during their tenure in office (from an average of Rs. 1.8 crore in the first election to Rs. 5.8 crore at the time of re-election) (Sastry 2014, 38). The 2000s were, of course, a period of rapid economic growth for India so one would expect assets to grow at an exceptional rate, especially for the politically connected. Indeed, it appears that the asset growth of leading candidates (including winners as well as losers) grew quite impressively. The average declared wealth of such re-contesting candidates in 2004 was Rs. 1.74 crore, and Rs. 4.08 crore in 2013, an increase of 134% (Ibid). Yet, while re-contesting candidates saw an increase, there was a clear winner’s advantage.
More systematic explorations of the financial rewards to office suggest more modest returns. For instance, Bhavnani (2012) compares the change in winners’ and losers’ self-declared family assets in the country’s two most recent state and national elections, using a regression discontinuity design. The results indicate that the average election winner increased his assets by 4-6 percent a year. He concludes that 4-9 percent of election winners appear “suspect,” since their asset growth is greater than what they would have earned based on their salaries (and perks) as lawmakers. The findings, as the author admits, are somewhat fragile for the entire sample; however, robust results are reported for lawmakers from the BJP.
Fisman et al. (2013) focus on the subset of elections (in 24 states) where both winner and runner-up from the same constituency run in the subsequent election. The authors employ a regression discontinuity design to look at very close elections where the incumbent barely won and then compare the wealth of the two candidates when they have a rematch. Their analysis reveals that incumbents enjoy a “winner’s premium” of 4.5 percent on average (this number is twice as large in more corrupt “BIMARU” states). The additional returns to ministers, and to incumbents who face-off against freshmen legislators, are even higher: 10 and 12 percent, respectively.
Careful econometric analyses suggest the financial returns to elected office are real, but perhaps not as eye-popping as one might expect. Yet, there are reasons to treat these estimates with caution. First, these analyses—obviously—only look at reported income, while we know from criminal investigations and qualitative evidence that many politicians earn significant amounts of unreported (“black”) money. Second, by virtue of the regression discontinuity design (which compares bare winners and losers), the Fisman et al. and Bhavnani studies compare two candidates, both of whom are reasonably well politically connected since they are either first or second place finishers in an election. There are many conditions under which a runner-up in an Indian election may actually have greater access to political power than the winner (for example, if the runner-up’s party wins control of the relevant state government). Finally, the Fisman et al. study explores 24 state elections while Bhavnani only looks at 11. Yet with a larger dataset, Fisman et al. restrict their analyses to politicians’ assets net of liabilities, a questionable decision since access to low-interest loans in India is often conditioned by political access (as amply demonstrated by Cole 2009.
Sandip Sukhtankar and Milan Vaishnav 17
Election finance
Across developed and developing democracies alike, contesting elections has become a costly undertaking. However, one key difference between these two types is the role illicit election funds allegedly play in the latter (Pinto-Duschinsky 2002). In advanced democracies, there are well-established systems of monitoring and accounting for election finance and for prosecuting those involved in alleged improprieties. These systems are far from perfect, as a spate of recent campaign finance scandals from the United Kingdom to the United States reminds us. Notwithstanding these shortcomings, the relative strength of monitoring and accountability regimes in rich democracies likely deters the transfer of illicit funds to a great extent. In developing countries, however, the situation is far more precarious. Scholars working in a variety of countries have reported that illicit campaign finance expenditures often dwarf legal flows. Gingerich (2010) refers to the so-called “rule of ten” often at play in developing countries; this refers to the “notion that actual campaign expenditures may be as large as ten times as those reported to electoral authorities.”
While there is much anecdotal evidence in India regarding the presence of illicit (or “black”) money in elections, there has been little empirical analysis of these flows. This is for one very obvious reason: by definition, flows of black money are opaque. The difficulty of obtaining reliable data on election finance has prompted scholars to find innovative though often indirect methods of quantifying such flows. One such study is Sukhtankar (2012). The author finds evidence of electoral cycles in input prices paid for sugarcane among politically controlled mills in Maharashtra. Specifically, he finds that cane prices paid to farmers by politically controlled mills falls in election years. Sukhtankar claims that sharp drops in cane prices represent mill funds siphoned off to finance politicians’ electoral campaigns; in other words, these funds serve as indirect political contributions. Interestingly, the funds are paid back after elections, with interest so to speak, to farmers conditional on the respective political mill chairman (or his party) winning office.
Another paper in this vein is Kapur and Vaishnav (2013). The motivating premise of their study is that politicians often turn to private firms for illicit election finance in countries like India in sectors where the discretionary powers of the state are large. Firms operating in highly regulated sectors are natural targets as election donors as politicians can exchange policy discretion or regulatory forbearance for campaign contributions.
The authors’ inquiry focuses on the role of the construction sector, which depends heavily on the availability of land, an input that is often tightly controlled by state authorities. Kapur and Vaishnav hypothesize that builders operating in the sector will experience a short-term liquidity crunch as elections approach because of their need to re-route liquid funds to campaigns in the form of election payments. Using a novel monthly-level dataset that captures variation in the state-wise demand for cement—the indispensable ingredient of the modern construction sector—the authors confirm the presence of an electoral cycle in cement consumption in India consistent with their logic. Consistent with their theoretical predictions, the negative shock in cement consumption is more intense for state elections (states have primary regulatory responsibility for land), urban states, and states with especially competitive elections.
Of the themes highlighted in this paper, election finance is arguably in greatest need of further research and exploration. Commentators across the political spectrum
18 India Policy Forum 2014
have recognized its centrality in corruption dynamics in the country. For instance, Mehta (2002) has noted: “The reform, regulation and overhaul of the means by which political parties and candidates finance elections is arguably the single most important institutional challenge facing Indian democracy.” The Economist summarized the issue in the context of the recently completed 2014 general election more poetically: “picture the elections as a dark sea of liquid assets, mostly undocumented cash (and a lot of liquor too), over-spilling the dykes that were meant to keep it in check” (The Economist 2014).
The opacity of election finance, however, presents an obvious obstacle to careful empirical work. Hence, there is a need for devising creative “forensic” approaches; here, scholars of India can study what has proved successful in other environments.8
Criminality
The third subset of studies related to electoral corruption pertains to the nexus of crime and politics in India. The affidavit data described earlier has brought to light the fact that a significant percentage of legislators at the state and national levels contest—and often—win elections while facing criminal cases which are pending before the courts.
Data compiled from ADR suggests three stylized facts about suspected criminals in politics.
First, as of the May 2014 inauguration of the 543 newest members of the 16th Lok Sabha, 34 percent of India’s MPs face pending criminal cases and 20 percent of MPs face charges of a “serious” nature. Similarly, 31 percent of elected MLAs face pending cases (15 percent fall into the serious category). There has been no systematic analysis of panchayats (village governments) and urban local bodies, but there is evidence that local tiers of governance are hardly free of criminality. Based on data collected by the Association for Democratic Reforms, 17 percent and 21 percent of municipal corporators in Mumbai and Delhi, respectively, declared involvement in criminal cases.
Second, the share of elected officials with pending criminal cases has been increasing, rather than decreasing, over time. In 2004, 24 percent of MPs faced criminal cases (12 percent faced serious charges) and this grew to 30 percent in 2009 (15 percent serious) and 34 percent (21 percent serious) in 2014. Similar increases have been seen in many state assemblies, for which we now have over a decade worth of data.
Third, candidates facing cases appear to have an electoral advantage. In the 2004 or the 2009 parliamentary elections, a candidate with no criminal cases pending had—on average—a 7 percent chance of winning a constituency election. Compare this with a candidate facing a criminal charge: he or she had a 22 percent chance of winning. The
8 For instance, Gingerich (2013) takes advantage of a police investigation in Brazil into a illicit campaign spending scheme which took place in the run-up to the elections in the Brazilian state of Minas Gerais in 1998. Based on police reports, which contain detailed bank transactions listing the names of those who received under-the-table election funds, he is able to analyze the allocation of payments to local vote brokers and estimate their effect on election outcomes. Mironov and Zhuravskaya (2014) aim to measure illicit payments by firms to politicians in Russia. The authors find that firms involved in government procurement substantially increase “tunneling” (defined as transfers by legitimate firms to fly-by-night firms established with the purpose of taking cash out of companies) around regional elections. These illicit flows exhibit a political business cycle, in contrast with firms not involved in public procurement.
Sandip Sukhtankar and Milan Vaishnav 19
“win rate” of candidates with serious charges, in turn, is higher than those who have minor charges (Vaishnav 2013).
The empirical literature which tries to understand the electoral marketplace for such politicians is still in its infancy. Nevertheless, there are a number of recent papers that add considerably to our knowledge.
The first set of papers tries to address why political parties might select candidates who are suspected of engaging in criminal acts.
A recent paper by Aidt, Golden and Tiwari (2013) uses data from the universe of candidates contesting the 2004 and 2009 Lok Sabha elections to investigate why political parties give tickets to “tainted” candidates. The authors find that political parties are significantly more likely to nominate suspected criminal candidates in contexts where there is either greater electoral uncertainty or lower levels of literacy (as a proxy for the information environment). However these variables lose significance once state fixed effects are included into the model, suggesting the results are somewhat fragile.
Vaishnav (2012) offers a “rent seeking” explanation for parties’ desire to nominate candidates with criminal charges. His study documents how election costs in India have grown considerably over the years thanks to a growing population, marked increase in the competiveness of elections, and elevated voter expectations of pre-election handouts, among other factors. Parties, which have been declining organizationally, over the same period have grown increasingly reliant on self-financing candidates. Such candidates can not only pay for the costs of campaigning, but they can also pay parties for the privilege of contesting elections as well as subsidize other candidates. Candidates associated with illegal activity, given their ease access to liquid forms of finance, represent a potential self-financing demographic. His work shows that there is a strong correlation between a parliamentary candidate’s personal assets—a good proxy for financial capacity—and the likelihood of election. Criminal candidates, in turn, have a financial advantage over “clean” candidates, controlling for a range of possible confounding factors.9
Dutta and Gupta (2014) have a slightly different explanation, but it too privileges the role of money. The authors present a formal model which assumes that candidates facing criminal charges do face a certain degree of negative stigma amongst the voting population. In other words, voters will—all else equal—be less likely to vote for candidates under criminal scrutiny. However, there are offsetting considerations. Since campaigns are costly, candidates with wealth can draw upon their largesse to win disaffected voters by convincing them of their “innocence.”
Using data from the 2009 Lok Sabha election, Dutta and Gupta produce a number of findings in line with their hypotheses. First, voters are actually willing to penalize candidates with criminal charges. That is, candidates facing criminal charges have a lower vote share than comparable “clean” candidates. Second, the negative effect of criminality on vote share is reduced when there are other candidates in the constituency who face criminal charges. Third, wealthier candidates do better in elections while wealth also offsets the electoral disadvantage criminal candidates face on account of negative stigma. The conclusion then is that parties select criminal
9 A descriptive analysis by Sastry (2014) confirms this association as does a more systematic regression approach by Dutta and Gupta (2014).

20 India Policy Forum 2014
candidates, despite the fact that voters often do not prefer them, because of their financial resources.
The second set of papers looks at the issue from the perspective of voters.
Banerjee and Pande (2009) postulate a link between ethnic polarization and criminality. The authors introduce the concept of “voter ethnicization,” defined as greater voter preference for the party representing his or her ethnic group and derive a model which predicts an “S-shaped” relation with legislator quality. The “quality” dimension is informed by local surveys the authors conducted in the state of Uttar Pradesh on corrupt activities and self-dealing, as well as actual criminal records of politicians (using data from 1980 and 1996). Uttar Pradesh ranks near the top of all Indian states when it comes to the share of elected legislators facing criminal scrutiny. Banerjee and Pande find that “ethnicization” reduces average winner quality for the pro-majority party, while the opposite holds true for the minority party. Overall, the average winner-loser quality gap reduces. These effects increase with greater numerical dominance of the majority but are absent in districts where opposing voter groups are roughly of the same size.
Banerjee et al. (2012) conduct a field experiment, also in Uttar Pradesh, to test the hypothesis that voters support candidates with criminal backgrounds in part because they are more effective in delivering patronage to voters in their constituency. Their findings do not support such logic. Using vignettes that randomly vary the attributes of competing legislative candidates for local, state, and national office, the authors find that voters are less likely to support corrupt or criminal candidates. On the basis of this core finding, the study’s authors suggest that criminal candidates likely do well not because of voters’ preferences for patronage, but due to information asymmetries or the lack of credible candidates with “clean” records.10
On the other hand, Vaishnav (2012) argues that while the “ignorant voter” hypothesis appears plausible in India, there is actually an affirmative case to be made for why voters might elect candidates with criminal backgrounds, which is consistent with well-informed voters. Building on a rich ethnographic literature spanning a number of regional contexts within India (Hansen 2001, Michelutti 2007, Berenschot 2011, Witsoe 2013), Vaishnav argues that in contexts where the rule of law is weak and social divisions are highly salient, politicians often use their criminality as a badge of honor. Thus, criminal politicians often exploit social divisions to build a compelling case that their criminality gives them an advantage in serving the interests of the “in-group” and their allies.
To develop this argument, the author theorizes that criminality will be lower in constituencies constitutionally reserved for Scheduled Castes and Scheduled Tribes. In these constituencies, as opposed to unreserved constituencies, the candidate pool for elected office is restricted to aspirants who belong to one of these minority groups, but the entire electorate is eligible to vote. The diminished salience of ethnic cleavages means that the incentives for parties to engage in multi-ethnic competition over votes are muted. As a result, in reserved constituencies, parties will hesitate to mobilize strictly on ethnic lines and, hence, to field criminal candidates whose popularity rests on
10 There are, of course, concerns of external validity in vignette-style survey experiments. As Barabas and Jerit (2010) note, respondents in natural experiments rarely integrate new information and adjust their political beliefs to the degree they do in survey experiments.

Sandip Sukhtankar and Milan Vaishnav 21
their comparative advantage in doing so. The empirical results, using data on more than 5,000 state assembly elections, confirm this intuition.11
Chauchard (2013) finds that while ethnicity does matter in explaining support for criminal candidates, it is not because voters actually value criminality per se. The author carries out a lab-based vignette-experiment in which voters rated fictional politicians whose defining characteristics (such as ethnicity, party affiliation, alleged criminality) were randomly manipulated. Chauchard’s results indicate that voters actually reliably prefer candidates without criminal records, but often end up voting for criminal candidates because of identity considerations. Because voters prioritize selecting a candidate who shares his or her ethnic identity, he or she will vote for a candidate who is a co-ethnic and happens to be a criminal. Criminality, in Chauchard’s view, is incidental to ethnic concerns.
In sum, the evidence to date on criminality in politics suggests a few broad conclusions. First, parties do appear to knowingly select candidates with criminal records with money serving as an important motivating factor. Second, when it comes to voter incentives, the evidence is mixed. On the one hand, there is weak support for the “ignorant voter” hypothesis. Although Banerjee et al. (2012) advance this argument on the basis of a survey experiment, their study contrasts with other research. In fact, another experimental study by Banerjee et al. (2011) from Delhi finds no impact of information provision on voter responses to criminal candidates. Rather most studies find that voters have some underlying reason to vote for “tainted” candidates, but what precisely that motivation might be is up for grabs. Vaishnav (2012) argues that it has to do with ethnic identity effectively signaling competence. Chauchard (2013) and Banerjee and Pande (2009) find support for an identity politics explanation, but Chauchard and Banerjee et al (2012) suggest it may have to do with a lack of “credible” alternative candidates rather than competence.
3. Evidence from the Press: Scams
The academic work on corruption described above, while fairly extensive by now, strangely has almost no overlap with the headline-grabbing articles which appear in the popular press. These articles are devoted to the myriad scams and scandals that have captured public attention and recently spurred public action. Since most of these scams involve single instances of corruption, it is difficult to do systematic academic research, which may explain the lack of attention paid to them by academics. Nonetheless, building up a dataset of these scams and attempting to see whether there are any common patterns and lessons that emerge may be a fruitful exercise.
We start by simply documenting the biggest public corruption scandals that were uncovered after the year 2000. While there is no precise formula for determining what constitutes a big scandal, we began by scanning lists of “corruption scams”
11 The author also hypothesizes that criminality will be lower in indirectly elected bodies, compared to directly elected bodies, because if parties select indicted candidates because of their ability to credibly represent certain communities, this motivation should be weaker when the electorate is subtracted from the equation. Comparing members of the indirectly elected Rajya Sabha (upper house) to the directly elected Lok Sabha (lower house), he finds that the latter are significantly less likely to face pending criminal cases.
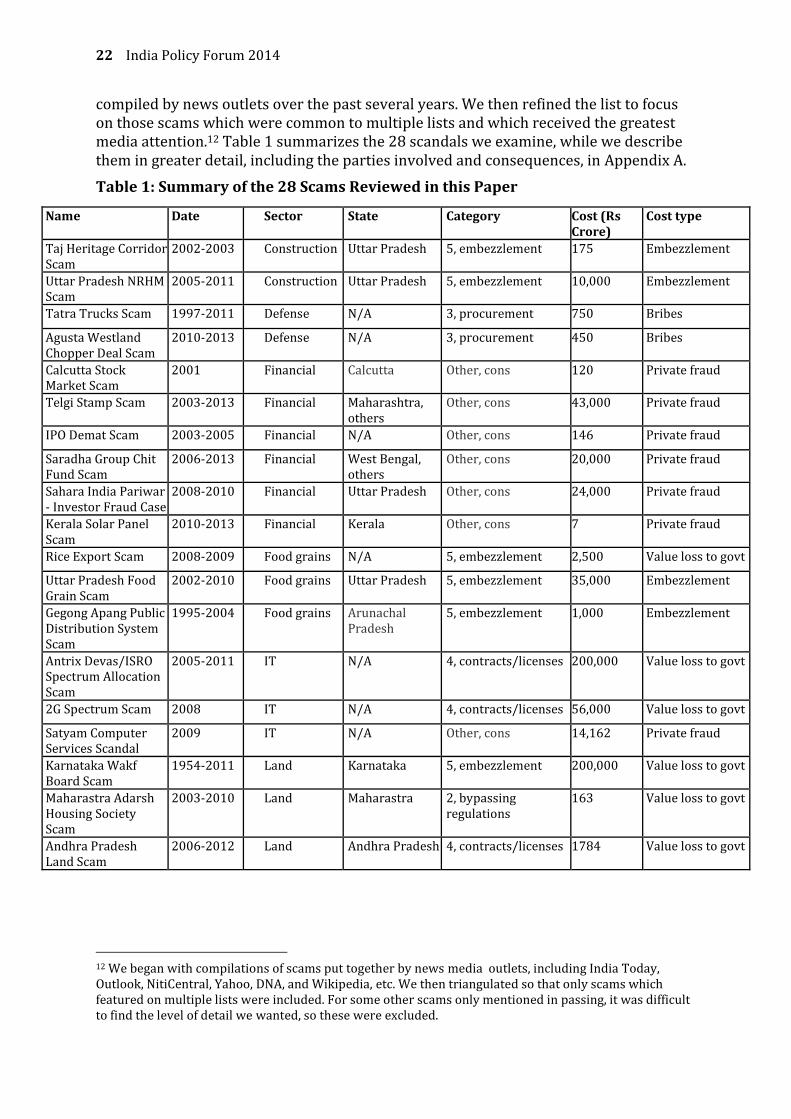
22 India Policy Forum 2014
compiled by news outlets over the past several years. We then refined the list to focus on those scams which were common to multiple lists and which received the greatest media attention.12 Table 1 summarizes the 28 scandals we examine, while we describe them in greater detail, including the parties involved and consequences, in Appendix A.
Table 1: Summary of the 28 Scams Reviewed in this Paper
Name Date Sector State Category Cost (Rs Crore)
Cost type
Taj Heritage Corridor Scam
2002-2003 Construction Uttar Pradesh 5, embezzlement 175 Embezzlement
Uttar Pradesh NRHM Scam
2005-2011 Construction Uttar Pradesh 5, embezzlement 10,000 Embezzlement
Tatra Trucks Scam 1997-2011 Defense N/A 3, procurement 750 Bribes
Agusta Westland Chopper Deal Scam
2010-2013 Defense N/A 3, procurement 450 Bribes
Calcutta Stock Market Scam
2001 Financial Calcutta Other, cons 120 Private fraud
Telgi Stamp Scam 2003-2013 Financial Maharashtra, others
Other, cons 43,000 Private fraud
IPO Demat Scam 2003-2005 Financial N/A Other, cons 146 Private fraud
Saradha Group Chit Fund Scam
2006-2013 Financial West Bengal, others
Other, cons 20,000 Private fraud
Sahara India Pariwar - Investor Fraud Case
2008-2010 Financial Uttar Pradesh Other, cons 24,000 Private fraud
Kerala Solar Panel Scam
2010-2013 Financial Kerala Other, cons 7 Private fraud
Rice Export Scam 2008-2009 Food grains N/A 5, embezzlement 2,500 Value loss to govt
Uttar Pradesh Food Grain Scam
2002-2010 Food grains Uttar Pradesh 5, embezzlement 35,000 Embezzlement
Gegong Apang Public Distribution System Scam
1995-2004 Food grains Arunachal Pradesh
5, embezzlement 1,000 Embezzlement
Antrix Devas/ISRO Spectrum Allocation Scam
2005-2011 IT N/A 4, contracts/licenses 200,000 Value loss to govt
2G Spectrum Scam 2008 IT N/A 4, contracts/licenses 56,000 Value loss to govt
Satyam Computer Services Scandal
2009 IT N/A Other, cons 14,162 Private fraud
Karnataka Wakf Board Scam
1954-2011 Land Karnataka 5, embezzlement 200,000 Value loss to govt
Maharastra Adarsh Housing Society Scam
2003-2010 Land Maharastra 2, bypassing regulations
163 Value loss to govt
Andhra Pradesh Land Scam
2006-2012 Land Andhra Pradesh 4, contracts/licenses 1784 Value loss to govt
12 We began with compilations of scams put together by news media outlets, including India Today, Outlook, NitiCentral, Yahoo, DNA, and Wikipedia, etc. We then triangulated so that only scams which featured on multiple lists were included. For some other scams only mentioned in passing, it was difficult to find the level of detail we wanted, so these were excluded.
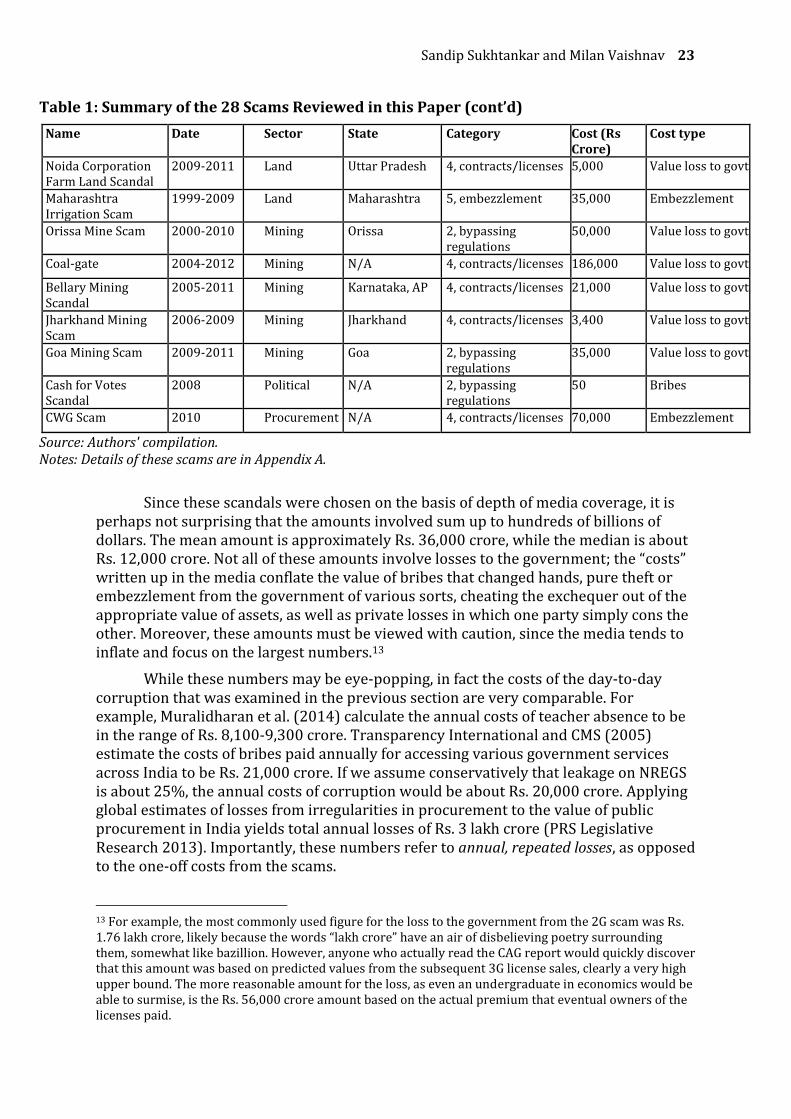
Sandip Sukhtankar and Milan Vaishnav 23
Table 1: Summary of the 28 Scams Reviewed in this Paper (cont’d)
Name Date Sector State Category Cost (Rs Crore)
Cost type
Noida Corporation Farm Land Scandal
2009-2011 Land Uttar Pradesh 4, contracts/licenses 5,000 Value loss to govt
Maharashtra Irrigation Scam
1999-2009 Land Maharashtra 5, embezzlement 35,000 Embezzlement
Orissa Mine Scam 2000-2010 Mining Orissa 2, bypassing regulations
50,000 Value loss to govt
Coal-gate 2004-2012 Mining N/A 4, contracts/licenses 186,000 Value loss to govt
Bellary Mining Scandal
2005-2011 Mining Karnataka, AP 4, contracts/licenses 21,000 Value loss to govt
Jharkhand Mining Scam
2006-2009 Mining Jharkhand 4, contracts/licenses 3,400 Value loss to govt
Goa Mining Scam 2009-2011 Mining Goa 2, bypassing regulations
35,000 Value loss to govt
Cash for Votes Scandal
2008 Political N/A 2, bypassing regulations
50 Bribes
CWG Scam 2010 Procurement N/A 4, contracts/licenses 70,000 Embezzlement
Source: Authors' compilation. Notes: Details of these scams are in Appendix A.
Since these scandals were chosen on the basis of depth of media coverage, it is perhaps not surprising that the amounts involved sum up to hundreds of billions of dollars. The mean amount is approximately Rs. 36,000 crore, while the median is about Rs. 12,000 crore. Not all of these amounts involve losses to the government; the “costs” written up in the media conflate the value of bribes that changed hands, pure theft or embezzlement from the government of various sorts, cheating the exchequer out of the appropriate value of assets, as well as private losses in which one party simply cons the other. Moreover, these amounts must be viewed with caution, since the media tends to inflate and focus on the largest numbers.13
While these numbers may be eye-popping, in fact the costs of the day-to-day corruption that was examined in the previous section are very comparable. For example, Muralidharan et al. (2014) calculate the annual costs of teacher absence to be in the range of Rs. 8,100-9,300 crore. Transparency International and CMS (2005) estimate the costs of bribes paid annually for accessing various government services across India to be Rs. 21,000 crore. If we assume conservatively that leakage on NREGS is about 25%, the annual costs of corruption would be about Rs. 20,000 crore. Applying global estimates of losses from irregularities in procurement to the value of public procurement in India yields total annual losses of Rs. 3 lakh crore (PRS Legislative Research 2013). Importantly, these numbers refer to annual, repeated losses, as opposed to the one-off costs from the scams.
13 For example, the most commonly used figure for the loss to the government from the 2G scam was Rs. 1.76 lakh crore, likely because the words “lakh crore” have an air of disbelieving poetry surrounding them, somewhat like bazillion. However, anyone who actually read the CAG report would quickly discover that this amount was based on predicted values from the subsequent 3G license sales, clearly a very high upper bound. The more reasonable amount for the loss, as even an undergraduate in economics would be able to surmise, is the Rs. 56,000 crore amount based on the actual premium that eventual owners of the licenses paid.
24 India Policy Forum 2014
Further examination of the table reveals some patterns that are likely not very surprising. The mining and land sectors are most commonly represented; all told they account for 35 percent of the total (10 of 28). This is perhaps not surprising as these areas represent obvious sources of rents in the economic sense of the word; they are sectors of the economy where the regulatory intensity of the state is immense and the opportunities for bribes or kickbacks are legion. The values involved are also generally high in these sectors. Many of the scams (6 of 28, or 21 percent) are from the financial services sector and do not neatly fit the definition of corruption as misuse of office by public officials, as they typically involve private parties or entities conning other private parties. In terms of our categories of corruption above, most of the scams involve simple embezzlement or bribes paid to obtain lucrative government contracts or licenses. Perhaps these too are not surprising giving the archaic nature of India’s financial security legal and regulatory framework, well documented by the recent Financial Sector Legislative Reforms Commission (FSLRC) and described by Patnaik and Shah (2014). Indeed, there are likely direct correlations between the creaky regulatory structure, outmoded laws and gaps in consumer protection, and corruption in the financial sector.
Perhaps a bit more insight is gained by examining the details of these scams and, in particular, the consequences for the main parties involved. It appears as though the state is fairly good at taking obvious action upon discovery of the scam: canceling contracts or licenses, starting investigations, and even arresting the main parties involved. When the dust settles, however, the news is quite depressing: the most powerful actors – defined as serving or having served at the level of Chief Minister of a state or above – are never actually found guilty (none out of the 12 cases in our sample).14 The pattern is to arrest involved parties and file a CBI case as soon as the scam breaks, but following up on this is practically impossible in the cases of these big players, and each of them is out on bail. Those with limited political protection – particularly those involved in financial scams defrauding other parties – are much more likely to actually serve jail time, as the experience of Ketan Parekh, Abdul Kareem Telgi, and even Harshad Mehta in the past suggest. Political economy considerations which lead to these enforcement constraints is a theme we will return to in following sections.
The consequences of these scams on the economy are very difficult to predict. The one academic article that examines effects on markets finds no effects on consumers from the much publicized 2G scam, basically because the illegally acquired licenses were then sold off to legitimate telecom operators, at a large cost to the government but not necessarily at the cost of consumers (Sukhtankar 2014).
14 It is true that one former Chief Minister, Lalu Prasad Yadav of Bihar, was recently convicted for his involvement in the “Fodder scam.” This scam does not figure into our list given that it occurred before the year 2000.
Sandip Sukhtankar and Milan Vaishnav 25
4. Strategies and Legislation to Combat Corruption: What Might Work?
We start with a categorization of broad strategies to combat corruption. We use these to categorize the current set of policy reforms, and also examine what evidence there is on the potential effectiveness of each strategy. In each case, we can see if there is something we can learn from the scams as well. We also introduce a very simple framework for understanding and helping predict whether anti-corruption interventions will succeed.
The broad categories are as follows:
1. Information/ bottom up monitoring
2. Technology
3. Financial incentives/ performance pay / efficiency wages
4. Electoral reform/ political incentives
5. Legal reform
We propose a very simple framework for understanding and helping predict whether anti-corruption interventions will succeed. This framework is easiest to illustrate by means of an example. Let’s take the case of the employment program NREGS, which we have encountered earlier. The government wishes to transfer monetary benefits to those rural residents who choose to work under this program. Both the implementation of the program and the transfer of cash works through intermediary officials. These officials thus have the advantage of information with respect to both the government – since they know the number of beneficiaries and how much they have worked – as well as beneficiaries – since they know the level of wages that ought to be paid, how much money has been transferred from the government, and when.
As we have seen, these information asymmetries lead to two types of theft from the labor budget – over-reporting of work done, which hurts the government and taxpayers, and underpayment of wages, which directly hurts beneficiaries. An obvious solution to this situation might be to simply provide information to the other party in the transaction. Unfortunately, though, providing information by itself will not matter unless bargaining power is affected. In this example, if the official controls all the sources of local power, providing information to beneficiaries may prove futile. Providing information to higher-level government agents might help, although this may not be as easy to accomplish and other constraints, like the ability of the government to enforce penalties against its own officials, might bind.
The empirical examples below will make the usefulness of this simple framework clearer.
4.1. Information/ bottom up monitoring
Worldwide, information is seen as a basic pillar of the fight against corruption. According to Transparency International, “access to information and a strong civil

26 India Policy Forum 2014
society are essential for good governance and public accountability.”15 Remarkably, India’s Right to Information Act (RTIA) that was passed in 2005 is ranked as the second best right to information law in the entire world by the Center for Law and Democracy. The universe of eligible laws is not limited to developing countries, or emerging nations, but only to countries which have an existing law on the books. Hence India ranks above every single OECD nation in this regard.16
Of course, having a law on the books is one thing, and implementing it is quite another. India also has a law that guarantees employment for rural dwellers (NREGA) and access to basic education (Right to Education), and—as seen in part 1—their implementation leaves much to be desired. The good news, however, is that two very similar studies suggest encouraging effects of the RTIA on citizens’ ability to obtain public services.
Peisakhin and Pinto (2010) examined the process of obtaining ration cards in one slum in Delhi. The study randomized 86 applicants into four groups: the main treatment group was assisted in preparing RTIA requests, and outcomes of this group were compared to groups who either: a) paid a middleman to obtain cards through (ostensibly) bribing officials; b) presented a letter of support from an NGO; and c) a control group that simply submitted the necessary paperwork. The RTIA request in the intervention asked the relevant official “for information about the status of their application and about the average time for ration card applications in this district.” The letter from the NGO noted that “the application was eligible for a ration card and urged prompt administrative action.”
Remarkably, 94% of applicants in both the bribe and RTIA groups received their ration cards within a year, while only 21% received them in the NGO and control groups. The bribe and RTIA groups also both had much shorter median processing times: 82 days for the bribe, 120 days for the RTIA, and 343 days for the control.
A related experiment compared RTIA requests, bribes, and a control group in the process of registering 121 applicants for a voter ID card, with an extra element which included applicants from a middle class university area in addition to those in a slum in Delhi. Again, the bribe and RTIA groups performed significantly better than the control group, in both poor and middle class areas.
The very small sample sizes and the fact that the studies were done in small urban areas in Delhi means the results must be viewed with caution; for example, Roberts (2010) reports that awareness of the RTIA in urban areas is three times that in rural areas. Moreover, while the results are encouraging, the mechanism through which the RTIA works for these requests is not clear. In particular, it hardly seems like the binding constraint for receiving the service is “information on the status of the application,” and further, penalties for non-compliance with RTIA requests are extremely rare and not very large. Interestingly, the authors themselves speculate that the RTIA requests work “not so much because of the Act’s penalty provisions, which are rarely used, but rather because in India’s ultra-competitive bureaucracy, any blemish on a public servant’s career can negatively affect his chance of promotion.”
15 http://www.transparency.org/whatwedo/activity/action, accessed June 25, 2014. 16 http://www.law-democracy.org/live/wp-content/uploads/2012/08/Chart.pdf, accessed June 25, 2014. The ranking is based on overall score in the categories of Right of Access, Scope, Requesting Procedures, Exceptions and Refusals, Appeals, Sanctions and Protections, and Promotional Measures.
Sandip Sukhtankar and Milan Vaishnav 27
Thus it appears that the RTIA is not so much about information but rather shifting the bargaining power to the applicant, and giving her a threat which she can use credibly to potentially sanction the official. This interpretation fits our framework above, and also helps explain why no other study which provides information to applicants or beneficiaries finds any effect of providing this information, whether in public works or education.
In the case of NREGA, for example, Ravallion et al. (2013) conducted a large scale randomized trial in Bihar to test for the effects of providing information to actual and potential program participants on their rights under the act. Baseline levels of information about and participation in NREGS were very low. While 56% of the rural population was Below the Poverty Line (BPL), only about 10% participated, even though most people surveyed – 5000 rural individuals in 150 villages spread across rural Bihar – heard about NREGS (> 75%). In the control group, only 22% knew how many days they are allowed to work, 32% knew the wage rate, 29% knew about receiving unemployment insurance if work is not provided within 15 days of applying, and almost no one knew that applicants are supposed to get work within 15 days.
To test whether this situation could be remedied, the authors showed a randomly selected treatment group of villages an educational, emotionally-captivating film about NREGS to the village. The intervention did increase knowledge of the program: a 53% increase in knowing about number of days allowed to work, a 36% increase in people who know about wage rate, a 33% increase in knowing about unemployment insurance, and a 70% increase in knowledge of getting work within two weeks. Despite this increase in awareness, however, reported survey outcomes on actual or desired participation, wage rates or days worked remained entirely unchanged. While the NREGA guarantees employment, on average participants said they would like 44 more days of work, so rationing was evident.
These results are also consistent with evidence from Orissa presented in Niehaus and Sukhtankar (2013b). They survey a large sample of listed NREGS participants in 3 districts in Orissa, and ask about days worked and wages received around a time during which the official minimum wage rate increased from Rs. 55 per day to Rs. 70 per day. While over 80% of respondents knew about the wage change, and over 70% could accurately name the new wage, on average almost no one working on NREGS received a wage increase. The only exception to the rule was that villages where an NGO was active received modestly higher wages after the wage change, perhaps because these NGOs helped keep local officials accountable.
Providing information as well as encouraging community-based monitoring was also largely ineffective in other contexts in India. Community-based monitoring is fast becoming a buzzword in the development community around the implementation of public programs (Björkman and Svensson 2009). The enthusiasm derives from the idea that local communities have easier access to information regarding the performance of local government officials, and hence involving these communities in program management might improve the functioning of programs. Worldwide, there are mixed results on the performance of community-based monitoring, with Björkman and Svensson 2009 finding improved health outcomes in Uganda but Olken (2009) finding no effects on public works in Indonesia.
In the context of NREGS, “social audits” have been touted as a means to tackle corruption. The state of Andhra Pradesh (AP) is the leader in implementing these audits,
28 India Policy Forum 2014
in which a team of district and state auditors train local villagers in auditing techniques and together conduct a week-long exercise whereby official expenditure records on NREGS are tracked in villages. At the end of the exercise in each sub-district, a public hearing is held in the presence of NREGS officials as well as local beneficiaries, and complaints and testimonies are read out.
Afridi and Iversen (2013) analyzed social audits in AP by collecting a panel data set on three rounds of social audits in 300 villages across 8 districts over the period 2006-2010. They find that these audits do not really have a deterrent impact on corruption: having an initial audit does not change the number of easy-to-detect irregularities in round two, whereas it actually increases the number of hard-to-detect irregularities. There are no effects on other important program outcomes such as employment generation. The authors suggest that a leading explanation for the lack of effect is that once discovered, official malpractice is rarely punished. Less than 1% of corrupt officials are actually removed from office or face serious action; even mild punishments such as suspensions are meted out in less than 3% of cases; and amazingly officials seem to be able to get away scot-free with their earnings since over 87% of embezzled amounts were not recovered 3-7 years after the audits.
In the rural UP context, village education committees (VECs) – which include parents of children in local schools – are mandated by law to serve as intermediaries between the village and educational authorities. Banerjee et al. (2010a) conducted a randomized trial in 280 villages in Jaunpur district, in which an NGO provided information on the roles and responsibilities of the VECs, invited villagers to create “report cards” on the status of education in villages, and also trained volunteers in teaching basic reading skills to primary school children. None of these treatments were successful in encouraging increased involvement in public schools.
Overall, our assessment is that information and encouragement of community participation on their own will have little effect in addressing corruption. However, putting more bargaining power in the hands of beneficiaries and applicants is more likely to result in greater impact. In this regard, the various “Right to Service” bills which have been passed in many states and are being considered in several others in addition to parliament, if they include effective penalties for misbehaving officials, have the potential to seriously dent corruption in public service delivery. As of January 2012, at least nine states had passed “Right to Service” laws. While the specific provisions of the respective states laws differ, they all guarantee the right to a specified list of services to citizens in a time-bound fashion and institute penalties for government officers who fail to comply (see Raha 2012 for a review).
A central act, The Right of Citizens for Time Bound Delivery of Goods and Services and Grievance Redressal Bill 2011, was introduced and is pending in the Lok Sabha (PRS Legislative Research 2012). This bill in its current form, for example, seems quite promising. It forces public authorities to detail timelines for delivery for all goods and services that it provides, and allows citizens to file complaints if these are not delivered on time, or if they experience misconduct from a government officer of the authority. The bill also mandates the appointment of a Grievance Redressal Officer (GRO) and State and Central Grievance Redressal Commissions, which can judge appeals. Complaints must be addressed within 30 days, and multiple appeals are possible to higher authorities. Most importantly, the bill allows for fines up to Rs. 50,000

Sandip Sukhtankar and Milan Vaishnav 29
on the GRO or officers guilty of misconduct, and also allows some of this fine to be awarded as compensation to the complainant.
These provisions of the bill have the potential to both reduce ability of bureaucrats to arbitrarily hold-up applicants for public services in order to extract bribes, and increase bargaining power of applicants for public services. Of course, it remains to be seen how central and state government authorities and officials respond to the provisions, whether loopholes can be exploited, and whether fines and penalties are actually assessed.
The recent history of the RTIA provides us with some cautionary fodder. A 2010 review suggested that the “use of the law has been constrained by uneven public awareness, poor planning by public authorities, and bureaucratic indifference or hostility” (Roberts 2010). Furthermore, recent attempts have been made to amend the law to reduce the number of entities under its purview, most importantly the Central Bureau for Investigation (CBI) and political parties. While these attempts prove that the act has some bite, actual cases of penalties and sanctions imposed are rare. For instance, several studies (quoted in Roberts 2010) have found that State Information Commissions are often reluctant to levy penalties on non-complying officers since that would unfairly penalize officers who lack training or experience or who have to deal with systemic shortcomings.
A final transparency mechanism, which does not yet exist but is pending parliamentary approval, is a central procurement portal, embedded within the Public Procurement Bill (2012).17 The bill mandates the establishment of a “Central Public Procurement Portal,” which would serve as a repository for materials related to government procurement, such as documents related to pre-qualification, registration and bidding, as well as participation details and final decisions or appeals. While such a move is a good first step, a real breakthrough could be achieved if the government were to consider publishing actual government procurement contracts. Kenny and Karver (2012) have argued that such “Publish What You Buy” provisions can not only reduce corruption but also work to lower the costs of contracting to the benefit of governments, contractors, and citizens.
4.2. Technology
Given the emergence of information technology services as a dynamic sector of the Indian economy, it is no surprise that state and central governments have looked towards technology as a potential silver bullet for tackling corruption. The recently deposed central government embarked on an ambitious initiative – called Aadhaar – to deliver biometrically authenticated unique IDs to all residents of India. Authorities believe that this initiative would revolutionize the delivery of government services, with the Unique ID Authority claiming that, “Aadhaar will empower poor and underprivileged residents in accessing services such as the formal banking system and give them the opportunity to easily avail various other services provided by the Government and the private sector.”18 Former UPA Finance Minister P. Chidambaram
17 The bill is pending before the Lok Sabha. More detail can be found in PRS Legislative Research (2013) 18 http://uidai.gov.in/index.php?option=comcontent&view=article&id=58&Itemid=106, accessed 3 October 2013.

30 India Policy Forum 2014
called it “a game changer for governance.”19 State governments have also embarked on their own initiatives to deliver services, in particular online services for applying for ration cards, certificates of various kinds, obtaining land records, etc (commonly referred to as “e-sewa” initiatives).
The academic evidence on the impact of technology to reduce corruption, however, is somewhat mixed across various sectors. For example, on the e-sewa initiatives, Bussell (2012) writes: “while there was considerable initial enthusiasm to use new technologies, the actual benefits offered to citizens are constrained in many cases by persistent efforts to retain access to a rich source of corruption: the bribes citizens pay to get the services they are promised by the state.” Nonetheless, the studies provide some obvious and clear lessons that can be used to inform future policy. Moreover, the evidence – whether positive or not – fits very well with the framework described above.
A first set of interventions using technology involve attempts to reduce shirking and absence by teachers and health workers. Duflo, Hanna and Ryan (2012) worked with an NGO in Udaipur district in using digital cameras to monitor attendance, along with financial incentives to reduce absence, in single-teacher rural schools run by the NGO. Baseline absence rates of 44% were higher than all-India averages. In the randomly assigned treatment group, teachers were given tamper-proof cameras and asked to have students take date-stamped photos of the teacher and other students at the beginning and end of each school day. This provided proof of attendance, and teacher salaries were based on the number of days attended.
Comparing attendance for teachers who were given cameras and incentives with a control group who did not receive either, the authors found that absence was reduced by 50%. More importantly, teacher attendance actually translated into improved educational outcomes for students: test scores were 0.17 standard deviations higher in the treatment group after a year of the program.
Unfortunately, the promise shown by this intervention has not been replicated in other settings. Banerjee, Duflo, and Glennerster (2008) attempted a similar intervention with nurses in government-run rural health centers, also in Rajasthan. Again, baseline absence rates were very high, at around 60%. In this case, assistant nurse midwives in the treatment group were given locked and password-protected time-stamp machines and asked to stamp cards at various points during the day, again with financial incentives for attendance. The expectations for attendance were very low: the only monitored days were Mondays, and pay was docked only once attendance dipped below 50%.
Initially, the intervention appeared to be successful, as absence rates almost halved. However, soon afterwards the nurses found a way to co-opt the system. Official excuses for absence started going up, and 16 months after the program started, there were no differences between treatment and control group attendance.
A similar program attempted by Dhaliwal and Hanna (2014) in Karnataka also showed the limitations of technology. While initially outcomes improved, eventually the state health system found it increasingly difficult to attract nurses to work at rural
19 http://www.nytimes.com/2013/01/06/world/asia/india-takes-aim-at-poverty-with-cash-transfer-program.html, accessed 3 October 2013.
Sandip Sukhtankar and Milan Vaishnav 31
outposts. This suggests that another constraint is the lack of human capital in rural areas.
One of the main differences between the teacher and health worker studies was that the teachers worked for NGO-run schools, and the NGO was willing to enforce penalties for absence. Government face political economy constraints arising from the power of teachers and health care workers unions and positions in helping local politicians win elections, and hence interventions that succeed in small scale pilots may not easily scale up when run by the government (Acemoglu 2010). Bold et al. (2013), for example, conducted a contract teacher intervention in Kenya where half of the sample was devoted to a trial run by an NGO and the other half run by the government, and find that while outcomes improved under the NGO, they did not under the government. In sum, larger systemic constraints matter.
Other technological incentives, even those run by the government, show more promise. Muralidharan, Niehaus, and Sukhtankar (2014) study the Andhra Pradesh Smartcard initiative, which used biometrically-authenticated Smartcards to make payments under NREGS and Social Security Pensions (SSP) —which makes monthly payments to elderly, widowed, and disabled individuals. Smartcards were a functional precursor to the integration of UID/Aadhaar with these programs. The evaluation was conducted in partnership with the Government of AP using one of the largest randomized controlled trials ever done, and featured a randomized roll out of the program across 19 million beneficiaries, which enabled an empirically rigorous evaluation of the new payments system.
Previously, payments were made in cash to beneficiaries, often by the same officials who implemented these programs. The new system made payments through local customer service providers (CSPs) who were employees of banks contracted by the government to manage payments, and added fingerprint authentication to ensure that actually intended beneficiaries received the money. This large-scale initiative faced both vast implementation challenges and pushback from local officials who stood to lose rents. Despite the best efforts of the government, only about 50% of payments in treatment areas were made via Smartcards after two years.
Nonetheless, the results are extremely promising. The poor gained significantly from the reform, firstly via improvements in the payment processes that reduced time to collect payments and delays in transferring payments. There was also a significant reduction in NREGS and SSP leakage, about 40% for both programs, with most of the effect coming from reductions in overcharging the government for benefits that recipients never received. Despite the reduction in leakage, there was no reduction in access on either program. Smartcards were highly cost effective: time savings to beneficiaries alone exceeded the entire cost of the program for NREGS; further, the reduction in NREGS leakage was nine times greater than the cost of program implementation. And finally, beneficiaries strongly supported the program: 87% of NREGS and 92% of SSP beneficiaries prefer the new payment system over the old one.
These results are highly relevant to understanding the likely impacts of UID-integrated benefit transfers in India and similar programs in the developing world, and suggest that investing in secure authentication and payment infrastructure can significantly enhance “state capacity” to effectively implement a broad range of programs.
32 India Policy Forum 2014
Given our framework, the reasons why this intervention worked become clearer. First, the electronic benefit transfer through CSP bypasses the local officials who are the source of hold-up and asymmetric information, or at least forces them to collude with CSPs. Further, live biometric authentication forces the presence of beneficiaries while collecting money, increasing their bargaining power. Previously, officials could simply collect money on behalf of beneficiaries even when they were not around (or in some cases did not even exist).
Finally, using technology in government procurement also shows some promise. A study by Lewis-Faupel et al. (2013) examines the impact of electronic procurement (henceforth, e-procurement) on public works projects in India and Indonesia. As the authors point out, in expectation, e-procurement addresses three common shortcomings associated with standard procurement practices: information asymmetries, collusion among bidders, and corruption. There is, however, the possibility of negative impacts should there be large variation in access to internet technology or the continued existence of coercive tactics by powerful firms.
In India, the authors examine procurement practices between 2000 and 2006 in the central government rural roads scheme, Pradhan Mantri Gram Sadak Yojana (PMGSY). Although the authors only have observational data, they rely on the phasing in of e-procurement over time, which allows for a difference-in-difference empirical strategy. In both countries, the study finds that e-procurement actually increases the probability of the winning bidder coming from outside of the region where the project is to be implemented. This suggests that e-procurement improves competition in the market given that it reduces the barriers to entry for firms to participate without being physically present.
However, in India the authors found no statistically significant evidence that e-procurement lowered prices paid by the government. They did find declines in Indonesia, although they were modest in size and not statistically significant. When it comes to quality improvements, e-procurement yielded positive gains on at least one measure in India. On the one hand, the authors found no evidence in India of an improvement or reduction in project delays although they found large declines in Indonesia. However, for India they also had access to data on an independent audit on construction quality. E-procurement was responsible or a 13 percent improvement in quality grades compared to projects with standard procurement norms.
In sum, e-procurement did not drive prices down through greater economic competition. It did, however, improve competition by attracting new firms—often from other geographies—which were often of a higher quality. Furthermore, there was a positive impact on the actual quality of road construction, as assessed by an independent quality audit.
Overall, the lessons from technological interventions are similar to those from the information interventions, with one important caveat. Technological interventions that rely on enforcement from higher authorities will necessarily be constrained by political economy considerations, but those that simply bypass middlemen bureaucrats or those that transfer bargaining power to beneficiaries will be more likely to succeed.

Sandip Sukhtankar and Milan Vaishnav 33
4.3. Financial incentives/ performance pay / efficiency wages
While not quite as fashionable as technological interventions, financial incentives are the most straightforward method that one might use to combat corruption. These could include simple bonuses based on outcomes, or penalties if caught being corrupt. Many of the technological interventions described in the previous section are indeed combined with financial incentives, and these studies will not be discussed in this section again. The main lesson from these studies is straightforward: high-powered incentives work, as long as they are enforced.
While these types of incentives for undertaking specific actions may indeed work, there is a potential concern that they may also lead to negative consequences. For example, nurses may now show up to work but put in less effort at work. Teachers paid on the basis of student test scores may “teach to the test” at the expense of “real” learning.
Fortunately, evidence from a large-scale randomized experiment of government teachers in Andhra Pradesh suggests that these types of concerns are perhaps overblown (Muralidharan and Sundaraman 2011). Teachers in 300 government schools in Andhra Pradesh were randomly allocated incentive programs which gave them bonuses of up to three percent of their salary based on the performance of students on tests. After two years, student test scores improved significantly in the subjects whose test results counted for bonuses: math and language. Importantly, however, test scores also improved in subjects whose test results did not count towards bonuses – science and social studies – suggesting that teaching effort spilled over into these subjects. Moreover, results were positive across the distribution of students, suggesting that teachers did not just concentrate on the best or worst students.
In addition to the specific incentives described above, there is a long-standing idea that government officials need to be paid more overall: they are only corrupt because they are so poorly paid and need to supplement their income through illicit activities. More generally, the idea that “efficiency wages” could prevent corruption is very old, going back to at least the seminal work by Becker and Stigler (1974). In practice, however, there is little evidence that such measures will be effective.
Niehaus and Sukhtankar (2013a) indirectly test if efficiency wages matter for corruption, by checking whether increased illicit rents in the future can reduce corruption today. Taking advantage of a change in wages in the NREGS in Orissa that increased the possibility of higher rents to corrupt officials in the future, they find that indeed corruption was significantly lower today in areas that expected more lucrative projects tomorrow. While on the one hand this provides support for the efficiency wage hypothesis, the magnitudes of wage increases necessary to reduce corruption are out of the feasible range: they find that corrupt rents were 100-1100 times official wages.
A corollary to providing disincentives to be corrupt is to provide incentives to uncover corruption, by both protecting and incentivizing whistleblowers. The Whistleblowers Protection Act, however, appears to fall short in this regard. In balancing the rights of potential whistleblowers against the rights of officials to not be harassed, the current provisions seem to tilt towards officials. For example, there is no penalty for victimization of complainants, the Central Vigilance Commission (charged with investigating complaints) has no power to impose penalties, and – unlike the US

34 India Policy Forum 2014
law, for example – there is no provision for the whistleblower to be compensated from any funds recovered as a result of the complaint (PRS Legislative Research 2011).
A final intervention in this category is the introduction of independent, third-party auditing. Duflo et al. (2013) implement a field experiment in Gujarat in which they introduce the random assignment of auditing in two heavily industrial regions of the state with the universe of “audit-eligible” plants. The intervention has several components. First, the researchers randomly assigned a third-party auditor to treatment plants who were paid from a central pool rather than by the firm directly. Second, the researchers verified a random sample of each auditor’s pollution readings with follow-up visits. Finally, halfway through the study, treatment auditors were told that their pay would be linked to the accuracy of their audit reporting.
The treatment resulted in more truthful reports by auditors for treated firms. In terms of actual pollution outcomes, the treatment also succeeded in reducing emissions with the “dirtiest” plants reducing emissions the most. Finally, the authors demonstrate non-experimental evidence that the financial incentives for reporting accuracy—implemented mid-way through the study—had an independent positive effect on reporting quality.
Hence, the introduction of independent “third-party” auditing resulted in more accurate reporting, less “cheating,” and improved environmental outcomes. The random assignment of independent auditors was clearly a key component of the intervention, but equally central is the fact that the auditor was paid from a central pool of funds rather than directly by the audited firm. One could imagine is a scenario in which the two are not de-linked, which could potentially undermine the benefits of a third-party audit.
4.4. Electoral reform/ political incentives
There are two distinct pathways through which policymakers seeking to address criminality in politics can operate. The first is to address the supply of criminal candidates into the electoral domain, while the second is to tackle the demand-side incentives.
To curtail the entry of allegedly criminal candidates in the electoral domain, the Supreme Court issued two important judgments in 2013.
The first found that any MP or MLA currently holding office, if convicted by a court of law (for charges listed under Sections 8(1), 8(2) or 8(3) of the Representation of the People Act, 1951) would be immediately disqualified from the date of conviction (unless he or she obtained a stay on the conviction). Under prior statute, convicted lawmakers could hold on to their seat as long as an appeal on that conviction was pending before the courts. In order to counteract the court’s move, the UPA government quickly introduced a bill in parliament that would nullify the ruling, but it was later forced to withdraw the bill under harsh public criticism. The government also considered promulgating an ordinance to the same effect, but again had to retreat in light of public outrage. The Supreme Court’s order disqualifying convicted legislators has already had some impact, claiming Bihar MP (and former Chief Minister) Lalu Prasad Yadav as its first victim. According to an analysis by ADR, there are 53 members of the 16th Lok Sabha who are at risk of being disqualified and, hence, vacating their seat
Sandip Sukhtankar and Milan Vaishnav 35
should pending cases against them result in a conviction (and should they fail to obtain a stay on that conviction). However, converting charges framed by a court into a conviction is no small task. Of the 76 MPs serving in the 15th Lok Sabha and who faced ongoing criminal action, the average case faced by this group had been pending for seven years (with some cases pending for 25 years or more).
The court also ruled, in a separate judgment, that any candidate who was either in jail or in police custody could not stand for elections (on the logic that such a candidate is not an eligible elector in the election). Political parties across the spectrum alleged that the ruling provided perverse incentives for the government to falsely imprison or detain political opponents. In response, parliament swiftly passed a bill that clarified that that a person does not cease to be an elector even if he or she cannot vote due to police custody or incarceration. This effectively nullified the court’s ruling.
In addition to judicial action on removing convicted legislators, the Election Commission and many good governance campaigners have also suggested preventive action. For instance, the Election Commission of India has formally recommended that candidates against whom charges have been framed by a Court should be disqualified from contesting elections. In order to guard against politically motivated charges, the ECI has suggested two additional caveats: that only cases filed at least six months prior to the election and those involving offences punishable by imprisonment of 5 years or more should be considered (on the premise that cases which meet these criteria are less likely to be subject to political motivation). Odisha MP Jay Panda has introduced a private member bill which, if passed, would subject such politicians to a newly created “fast track” tribunal to handle cases facing politicians. Recently, Prime Minister Modi rhetorically backed the idea, requesting that the Supreme Court set up a judicial mechanism to expedite cases against “any Members of Parliament upon whom an FIR is lodged,” and reach a verdict within one year.
There have also been numerous steps either initiated or proposed to crack down on “black” money in politics (see Sridharan 2006; Gowda and Sridharan 2012 for a review). There is, of course, a documented link between illicit election finance and criminality in politics.
One basic remedy would be to improve the transparency of political party finances, which is sorely lacking. To this end, in June 2013, the Central Information Commission (CIC) ruled that for the purposes of the Right to Information Act, political parties were to be considered “public authorities” and, as a consequence, subject to provisions of the Act. Parliament later introduced a bill to remove political parties from the ambit of the RTI Act, but the bill was not passed during the 15th Lok Sabha. The CIC’s ruling is controversial even for proponents of enhanced transparency, who contend that it is the ECI, not the CIC or the RTI, which should have jurisdiction over the affairs of political parties. For now, the CIC ruling is in force although appeals are pending.
Going forward, the ECI has proposed that it be granted greater authority to regulate political parties. For instance, the ECI has no ability under existing law to de-register political parties who flout democratic norms or who set up parties with the sole purpose of exploiting tax loopholes. One longstanding suggestion, also supported by many civil society organizations, is that political parties submit annual, independent audits of their finances to the ECI for public dissemination. To date, parties have resisted this move.
36 India Policy Forum 2014
A second remedy under consideration is to enhance the ECI’s authorities with respect to election-related disclosures. For instance, the ECI has also been in a pitched legal battle with the Government of India to bring charges against candidates who knowingly file false affidavits detailing election expenditures. The UPA-2 government openly challenged the commission’s power to disqualify a candidate for falsifying election finance filings, although the Supreme Court later ruled in favor of the ECI. The ECI recently framed charges against Ashok Chavan, the former Maharashtra Chief Minister, on these grounds and the proceeding is seen as a test case of the agency’s powers. In order to avoid future legal uncertainty, the ECI has asked that the law be amended to clarify the ECI’s authorities to sanction those who file false disclosures. In a similar vein, the ECI has suggested that “paid news,” the practice of politicians paying journalists for favorable media coverage masquerading as ”news,” be explicitly classified as an “electoral offence” and made punishable under the Representation of the People Act.
All of these proposed reforms deal with reducing the supply of potentially “tainted” politicians into electoral politics. They work by changing the incentives of political parties to give tickets to such politicians, reducing the flow of illicit money in politics, or simply disqualifying politicians from contesting elections or holding office. Yet, there is a “demand” side to the equation as well, which relates to voter incentives and the election of allegedly criminal candidates. None of the remedies described above on the supply side grapple with the basic notion that, at the end of the day, “tainted” legislators would not be in office were it not for voters electing them.
When it comes to voter motivations and support for criminal candidates, there are broadly two schools of thought. The first believes this is an issue about information asymmetries and “ignorant voters.” The second, in contrast, believes that the appeal of criminal candidates is related to their credibility to act as effective representatives. According to this view, voters support such criminal candidates because, rather than in spite, of their criminality.
There are a few studies that have explicitly tested the proposition that improving the awareness of voters through the provision of information reduces support for criminality. Banerjee et al. (2011) conduct an experiment with Delhi slum dwellers in advance of municipal elections in which a local NGO distributed newspapers containing report cards on politicians to randomly selected residents. The report card presented information on the performance of the incumbent legislator and the qualifications of the incumbent and two main challengers. The report card contained information on legislative activism, legislator performance, and expenditures from the incumbent’s local constituency development fund. In addition, the report card contained data, gleaned from candidate affidavits, on educational qualifications, criminal records and financial assets. Relative to control slums, the researchers find that treatment slums (which received the report card) experienced higher voter turnout, reduced vote buying (measured directly through participant observation), and higher vote share for better performing and more qualified incumbents. Interestingly, however, information on criminality seems to have no impact. The results indicate that neither information on the criminality of incumbents nor on that of challengers have any statistically significant impacts on incumbent vote share.
A paper by Banerjee et al. (2010b) reports on a voter mobilization, as opposed to information, campaign in Uttar Pradesh. In a set of randomly selected villages, an NGO
Sandip Sukhtankar and Milan Vaishnav 37
conducted meetings and puppet shows to mobilize voters. In the first treatment, the NGO urged people in the village to vote on Election Day but to do so responsibly by “voting on issues, not on caste.” The second treatment involved an abstract plea, by the same NGO, to vote for “clean politicians.” The treatment imparted the message: “Corrupt politicians steal money set aside for development funds and do nothing for you. Vote for clean politicians that care about your development needs.”
The results of the first treatment indicate that it both has a positive impact on raising voter turnout and also reduces the extent of caste-based voting (as measured by a follow-on survey). The reduction in caste-based voting is linked to a significant decline in support for candidates charged with heinous crimes (although not those deemed to be “corrupt,” as measured by a survey of local journalists). The authors conclude based on this that low-information voters who are urged not to vote on the basis of caste will consider alterative evaluative criteria (such as past criminality). They surmise that support for criminal candidates, then, is a by-product of caste-based voting.
The null result on the corruption measure, however, complicates the picture. The second treatment, urging voters not to elect corrupt candidates, had no impact on voter turnout or vote share of corrupt or criminal candidates. The authors reconcile these divergent findings by arguing that the nonpartisan anti-corruption campaign may have been too abstract and failed to provide sufficient information needed to reshape voter preferences. On the other hand, the anti-caste/pro-development messaging directly addressed an important voter “heuristic”, while simultaneously offering voters a new evaluation criterion (i.e. development).
It should be emphasized that the latter study relies on a voter mobilization, rather than voter information, treatment; and the two are not identical. Voter information had no impact on support for criminal candidates while the anti-caste voter mobilization campaign did have an impact. This latter finding is in line with Chauchard’s (2013) work, which finds that support for criminality is not really support for “criminals” per se, but a by-product of ethnic voting.
The second school of thought treats the issue of criminality in politics not as an information problem but one of criminality signaling credibility. This is consistent with the qualitative and ethnographic literature on criminality in Indian politics.
A recent study by Sircar and Vaishnav (in progress) embeds a list experiment on criminality in an all-India survey of a large sample of Indian citizens. The authors provide respondents in the control group with a serious of innocuous candidate characteristics and ask how many of the characteristics would trouble the respondent. The treatment group receives the same set of statements plus a “sensitive” candidate attribute: “a candidate with serious criminal charges who delivers benefits to you.” Respondents are asked how many statements they agree with, not which ones, which allows the researchers to tease out the “true” response to the sensitive attribute. When asked directly whether they would support a candidate with serious criminal charges but who could deliver benefits, only 26 percent of respondents answered in the affirmative. However, evidence from the list experiment (which circumvents social desirability bias) suggests that the true extent of support is 48 percent. Furthermore, there is a correlation—at the state level—between support for criminality and expressions of caste bias (as measured through a separate list experiment from the same survey).
38 India Policy Forum 2014
The results, then, of addressing the demand side are mixed. On the one hand, the Banerjee et al. (2011) study from Delhi finds that updating voter information on the criminal records of incumbents and challengers has no impact on voter behavior. This is consistent with the literature that downplays the role of information; perhaps telling voters about criminal antecedents is not actually updating their beliefs in a meaningful way. Yet the Banerjee et al. (2009) study from Uttar Pradesh does seem to suggest that while voters may not be susceptible to the provision of factual information on candidate criminality, they might be influenced by a hortatory voter mobilization campaign. The literature reveals that there is clearly a linkage between identity politics and support for criminality; but what remains unresolved is whether this connection is incidental or represents something deeper. In other words, do voters support candidates who are co-ethnics and hence deemed more credible (in which case, criminality is incidental) or is there the credibility of co-ethnicity in some way conditioned by criminality? Clearly, more research is needed on the “demand” side before we can disaggregate these nuanced relationships.
4.5. Legal reform
The final category of anti-corruption remedies involves enacting new laws to curb corrupt activities. There is, indeed, a large legislative agenda—comprised of bills already introduced in parliament—on this score.
As mentioned above, the Right of Citizens for Time Bound Delivery of Goods and Services and Grievance Redressal Bill (2011) seeks to create a mechanism to ensure the timely delivery of publicly provided goods and services to citizens. The Bill requires all public authorities to appoint officers to redress grievances and, if grievances were not redressed within 30 days, there would be financial penalties imposed on the relevant bureaucrat. Many states have set up identical mechanisms at the state-level and so there are some questions about duplication as well as jurisdictional authorities given many goods and services are state subjects and involve state level bureaucrats (PRS Legislative Research 2012). The central bill, and its various state-level incarnations, is meant to address the first category of corruption mentioned in Section II (“Bribes to obtain government services like ration cards/passports”).
The Public Procurement Bill (2012) could help curb abuses in Category 3 (“Kickbacks from procurement in government”) by regulating central government procurement and improving its transparency. The bill establishes, as the default for public procurement, an open competitive bidding process (unless otherwise justified). The bill also mandates the publication of all procurement-related information on a central portal.
The Public Procurement Bill, as well as the Prevention of Corruption (Amendment) Bill (2013) and the Prevention of Bribery of Foreign Public Officials and Officials of Public International Organizations Bill (2011), all have provisions on bribery. For example, the Procurement Bill criminalizes the acceptance of a bribe by a public servant as well as the offering of a bribe or exerting “undue influence” on the procurement process by prospective bidders. The Prevention of Corruption Bill criminalizes the act of bribe giving and expands the definition of bribe taking (which is already illegal under Indian law). The foreign briber makes giving bribes to, or receiving

Sandip Sukhtankar and Milan Vaishnav 39
bribes from, foreign public officials or international public officials a criminal act (PRS Legislative Research 2014).
The idea of criminalizing bribe-giving, long part of the received wisdom has recently become contested. In a well-known paper, Basu (2011) argues that—insofar as harassment bribes are concerned, that is bribes ordinary citizens often have to give in order to receive what they are legally entitled to—the act of bribe giving should be deemed “legitimate.” Basu argues that this will result in a sharp decline in the incidence of bribe giving; the reasoning is actually quite simple. To quote the author: “[O]nce the law is altered in this manner, after the act of bribery is committed; the interests of the bribe giver and the bribe taker will be at divergence. The bribe giver will be willing to cooperate in getting the bribe taker caught. Knowing that this will happen, the bribe taker will be deterred from taking a bribe.”
Basu’s theoretical proposal was experimentally tested in a paper by Abbink et al. (2014), using a lab experiment conducted with university students in India. The authors find that when the bribe giver is provided legal immunity, reporting of bribe demands increases while the demand for bribes declines (compared to a scenario in which both bribe giver and bribe taker are held liable). This core finding is consistent with Basu’s theoretical predictions. The authors, however, extend the analysis in two important ways. They authors test how bribe givers react when bribe takers can retaliate and when the bribe giver’s bribe payment is not refunded (hence eliminating monetary incentives). Their findings suggest that strict financial incentives do not overwhelmingly influence reporting behavior. However, when retaliation is an option, bribe demands and reporting are roughly on par with the baseline case (when both bribe givers and takers are legally liable). The authors conclude based on this that asymmetric liability alone may not reduce corruption. Legitimizing bribe giving must proceed hand in hand with implementing procedures to limit retaliation.
5. Conclusion
The literature on corruption in India is, to put it mildly, voluminous. In this paper, we have focused on those studies that combine analytical rigor with causal analysis and rich sources of data in order to describe the magnitudes, causes, and consequences of corruption using a new rubric for classification; to compare and contrast the types of corruption which have dominated the literature as opposed to the news headlines; and, finally, to highlight the most promising anti-corruption strategies on the anvil.
In an effort to provide guidance to policymakers and other agents of change addressing India’s corruption challenge, we conclude by highlighting five principles that should guide future reform efforts.
First, information provision is an important tool in the toolbox, but, on its own, it is not always an effective anti-graft strategy. Our review of the literature reveals that information works best when accompanied by investments in enhancing the bargaining power of ordinary citizens, improving coordination and collective action, or strengthening the state’s ability to punish impunity. Social audits and information campaigns that uncover malfeasance in a context of weak public sector enforcement
40 India Policy Forum 2014
institutions can have limited impact, as demonstrated by Afridi and Iversen (2013) in their study of social audits in Andhra Pradesh.
In the case of criminals in politics, there is now compelling evidence that the factors which give rise to this nexus are perhaps less related to information asymmetries but instead have more to do with social divisions embedded within India’s weak rule of law society. This is not to say improving the information environment is not a laudable goal; to the contrary, improving the availability of information on criminality in politics has been essential to both diagnosing the challenge as well as forging social pressure. The key take-away, however, is that the absence of information may not the binding constraint.
Second, technological solutions to curb corruption have limited effectiveness unless they are able to bypass the local machinery that hampers status quo solutions. Technological innovations that require higher-level authorities to provide enforcement risk falling prey to the usual principal-agent dilemmas that plague public service delivery. Instead, interventions such as the one involving smart cards in Andhra Pradesh evaluated by Muralidharan, Niehaus, and Sukhtankar (2014), which can transfer bargaining power to citizens and circumvent the broken local state machinery, hold significant promise. To this end, the new NDA government in Delhi has an opportunity to build on the Aadhaar program launched by the prior regime and further marginalize middlemen in service delivery.
Third, there is a sensible and wide-ranging legislative agenda to reduce corruption that the 16th Lok Sabha should pursue with renewed vigor. Bills such as the “Right to Services” and the “Public Procurement” bills contain important provisions that can constrain abuses of government discretion while shifting bargaining power in favor ordinary citizens. To be clear, these bills, as they stand, are imperfect; for instance, the “Right to Services” bill would create a dedicated grievance redressal mechanism in a context where there are legitimate concerns about the multiplicity of grievance redressal mechanisms already in existence (on paper at least if not always in practice). Parliament must debate and discuss these details and forge reasonable compromise.
Reformers should also take heed that as meritorious as these bills may be, passing news laws must be accompanied by a renewed effort to repeal outdated or archaic old ones. Of course, it is natural for agents of change to focus their attention on enacting new laws given the inherent benefits for mobilization; yet such an approach is shortsighted. As Kapur and Vaishnav (2014) argue, in India “the multiplicity and complexity of laws make compliance, deterrence, and effective enforcement difficult and, in many cases, impossible.” Statutes regarding corrupt practices are no exception.
Finally, while the state in India is often perceived to be the problem when it comes to corruption, it is no doubt also part of the solution (Kapur 2010). There is a strong case to be made that the state, particularly the local state, has historically preyed on the aam aadmi rather than worked on its behalf (Pritchett 2009). Yet, there are limits to how much can be achieved to reduce its corruption by circumventing, rather than strengthening, its capacity.
At the end of the day, even the most immaculate laws require effective state institutions to enforce them and judicial officers to adjudicate disputes. Yet in India police vacancy rates hover around 25 percent while existing forces are poorly trained, starved of resources, and the subject of constant political interference. Similar shortcomings plague the judiciary at the same time that the quantum of litigation is

Sandip Sukhtankar and Milan Vaishnav 41
rapidly increasing. The pioneering Right to Information Act gives average Indians greater recourse to redressing grievances than ever before but if government information officers remain in short supply and appeals processes drag on, empowerment could turn into disenchantment.
The anti-corruption agenda in India is massive but the enormity of the task should not dampen the spirits of reformers. The literature is replete with successful examples of logistically simple solutions which can be implemented at minimal cost. While the ability of these solutions to circumvent weak public sector institutions has its limits, the marginal gains justify that we pursue them with alacrity.
__________
42 India Policy Forum 2014
References
Abbink, Klaus, Utteeyo Dasgupta, Lata Gangadharan, and Tarun Jain (2014). “Letting the briber go free: An experiment on mitigating harassment bribes,” Journal of Public Economics, Volume 111, March 2014, Pages 17-28.
Acemoglu, Daron (2010). “Theory, General Equilibrium, and Political Economy in Development Economics,” Journal of Economic Perspectives, 24 (3), 17-32.
Afridi and Iversen (2013). “Social Audits and MGNREGA delivery: Lessons from Andhra Pradesh,” Brookings-NCAER India Policy Forum 2013-2014 (eds. Barry Bosworth, Arvind Panagariya and Shekhar Shah).
Aidt, T, Golden, M.A. and D. Tiwari (2013). “Incumbents and Criminals in the Indian National Legislature,” mimeo, University of California-Los Angeles.
Akhmedov, A., & Zhuravskaya, E. (2004). “Opportunistic political cycles: test in a young democracy setting.” The Quarterly Journal of Economics, 1301-1338.
Ansolabehere, Stephen and James M. Snyder (2003), “Party Control of State government and the Distribution of Public Expenditures.” Mimeo, Departments of Political Science and Economics, Massachusetts Institute of Technology.
Arulampalam, Wiji, Sugato Dasgupta, Amrita Dhillon, and Bhaskar Dutta (2009), "Electoral goals and center-state transfers: A theoretical model and empirical evidence from India." Journal of Development Economics 88(1): 103-119.
Banerjee, Abhijit V. (1997). “A theory of misgovernance,” Quarterly Journal of Economics 112(4), 1289–1332.
Banerjee, A., R. Banerji, E. Duflo, R. Glennerster and S. Khemani (2010a). “Pitfalls of Participatory Programs: Evidence from a Randomized Evaluation in Education in India.” American Economic Journal: Economic Policy, 2(1): 1-30.
Banerjee, A., D. Green, J. Green and R. Pande (2010b). “Can Voters be Primed to Choose Better Legislators? Experimental Evidence from Rural India,” Mimeo, Massachusetts Institute of Technology.
Banerjee, Abhijit, Esther Duflo and Rachel Glennerster (2008). “Putting a Band-Aid on a Corpse: Incentives for Nurses in the Indian Public Health Care System,” Journal of the European Economic Association, vol. 6(2-3), pages 487-500, 04-05.
Banerjee, Abhijit, Rema Hanna, and Sendhil Mullainathan (2013). “Corruption,” Handbook of Organizational Economics, Princeton University Press, 2013.
Banerjee, A., & Somanathan, R. (2007). “The political economy of public goods: Some evidence from India.” Journal of Development Economics, 82(2), 287-314.
Banerjee, A. V. and R. Pande (2009). “Parochial Politics: Ethnic Preferences and Politician Corruption.” Mimeo, Harvard Kennedy School.
Banerjee, A., S. Kumar, R. Pande and F. Su (2011). “Do Informed Voters Make Better Choices? Experimental Evidence from Urban India.” Mimeo, Harvard Kennedy School.
Banerjee, A., D. Green, J. McManus and R. Pande (2012). “Are Poor Voters Indifferent to Whether Elected Leaders are Criminal or Corrupt? A Vignette Experiment in Rural India,” Mimeo, MIT.
Sandip Sukhtankar and Milan Vaishnav 43
Barabas, Jason, and Jennifer Jerit (2010), “Are Survey Experiments Externally Valid?” American Political Science Review 104(2): 226-242.
Bardhan, Pranab K. (1997), “Corruption and development: a review of issues,” Journal of Economic Literature Vol. 35: 1320-1346.
Bardhan, Pranab K., Dilip Mookherjee, and Monica Parra Torrado (2010), “Impact of Political Reservations in West Bengal Local Governments on Anti-Poverty Targeting,” Journal of Globalization and Development 1(1): 1-36.
Basu, Kaushik (2011). “Why, for a Class of Bribes, the Act of Giving a Bribe should be Treated as Legal”. Mimeo, Finance Ministry, Government of India.
Becker, Gary S. and George J. Stigler (1974). “Law Enforcement, Malfeasance, and Compensation of Enforcers,” The Journal of Legal Studies, 3 (1), 1-18.
Berenschot, Ward. (2011). Riot Politics: India's Communal Violence and the Everyday Mediation of the State. London: C. Hurst & Company, Publishers, Limited.
Bertrand, Marianne, Rema Hanna, Simeon Djankov, and Sendhil Mullainathan (2007). “Obtaining a Driving License in India: An Experimental Approach to Studying Corruption,” Quarterly Journal of Economics, November 2007.
Besley, T., Pande, R., & Rao, V. (2005). “Participatory democracy in action: Survey evidence from South India.” Journal of the European Economic Association, 3(2‐3), 648-657.
Besley, T., Pande, R., & Rao, V. (2007). “Just rewards? Local politics and public resource allocation in South India,” Mimeo, London School of Economics and Political Science.
Betancourt, Roger and Suzanne Gleason (2000) “The Allocation of Publicly-Provided Goods to Rural Households in India: On Some Consequences of Caste, Religion, and Democracy.” World Development 28(12):2169–2182.
Bhalotra, Sonia R. et al. (2013), “Religion, Politician Identity and Development Outcomes: Evidence from India,” National Bureau of Economic Research Working Paper 19173.
Bhalotra, S., & Clots-Figueras, I. (2014). “Health and the political agency of women.” American Economic Journal: Economic Policy 6(2), 164-197.
Bhavnani, Rikhil (2012), “Using Asset Disclosures to Study Politicians’ Rents: An Application to India,” Paper presented at World Bank Annual Bank Conference on Development Economics, Washington, DC, May 7-8.
Björkman, Martina and Jakob Svensson (2009). “Power to the People: Evidence from a Randomized Field Experiment on Community-Based Monitoring in Uganda,” The Quarterly Journal of Economics, 124 (2): 735-769.
Bold, Tessa, Mwangi Kimenyi, Germano Mwabu, Alice Ng'ang'a, and Justin
Sandefur (2013). “Interventions and Institutions: Experimental Evidence on Scaling up Education Reforms in Kenya,” Working Paper, Center for Global Development.
Brender, A., & Drazen, A. (2005). “Political budget cycles in new versus established democracies,” Journal of Monetary Economics 52(7): 1271-1295.
Bussell, Jennifer. (2012). Corruption and Reform in India: Public Services in the Digital Age. New York: Cambridge University Press.

44 India Policy Forum 2014
Caselli, F., & Coleman, W. J. (2013). “On the theory of ethnic conflict.” Journal of the European Economic Association 11(1): 161-192.
Chandra, Kanchan. 2004. Why Ethnic Parties Succeed: Patronage and Ethnic Headcounts in India. New York: Cambridge University Press.
Chattopadhyay, R., & Duflo, E. (2004). “Women as policy makers: Evidence from a randomized policy experiment in India.” Econometrica, 72(5), 1409-1443.
Chauchard, Simon (2013), “Why Do Voters Prefer Dynastic Candidates? Evidence From a Vignette-Experiment,” Mimeo, Dartmouth College.
Chaudhuri, Kaushik, and Sugato Dasgupta (2005), “The political determinants of central governments' economic policies in India: an empirical investigation,” Journal of International Development 17(7): 957-978.
Chaudhury, N., J. Hammer, M. Kremer, K. Muralidharan and F. H. Rogers (2006)."Missing in Action: Teacher and Health Worker Absence in Developing Countries.” Journal of Economic Perspectives 20(1): 91-116.
Chen, Jowei (2013), “Voter partisanship and the effect of distributive spending on political participation,” American Journal of Political Science 57(1): 200-217.
Chin, A., & Prakash, N. (2011). “The redistributive effects of political reservation for minorities: Evidence from India,” Journal of Development Economics, 96(2), 265-277.
Clots-Figueras, I. (2011). “Women in politics: Evidence from the Indian States,” Journal of Public Economics, 95(7), 664-690.
Clots-Figueras, I. (2012). “Are Female Leaders Good for Education?” American Economic Journal: Applied Economics, 4(1), 212-244.
Cole, Shawn A. (2009). “Fixing Market Failures or Fixing Elections? Elections, Banks, and
Agricultural Lending in India.” American Economic Journal: Applied Economics 1(1).
Cox, Gary and Mathew McCubbins (1986), “Electoral Politics as a Redistributive Game.” Journal of Politics 48(2):370–389.
Dahlberg, Matz and Eva Johansson. 2002. “On the Vote-Purchasing Behavior of Incumbent Governments.” American Political Science Review 96(1):27–40.
Das, Jishnu and Jeffrey Hammer (2007), “Money for nothing: The dire straits of medical practice in Delhi, India,” Journal of Development Economics 83(1): 1-36.
Diaz-Cayeros, Alberto, Federico Estevez and Beatriz Magaloni (forthcoming), Strategies of Vote Buying: Democracy, Clientelism, and Poverty Relief in Mexico.
Dixit, Avinash and John Londregan (1996), “The Determinants of Success of Special Interests in Redistributive Politics,” Journal of Politics 58(4):1132–1155.
Drazen, Allan, and Marcela Eslava (2010), “Electoral manipulation via voter-friendly spending: Theory and evidence,” Journal of Development Economics 92(1): 39-52.
Duflo, Esther, Rema Hanna, and Stephen Ryan (2012). “Incentives Work: Getting Teachers to Come to School,” American Economic Review, June 2012.
Duflo, Esther Michael Greenstone, Rohini Pande, and Nicholas Ryan (2013), “Truth-telling by Third-party Auditors and the Response of Polluting Firms: Experimental Evidence from India,” The Quarterly Journal of Economics 128 (4): 1499-1545.
Sandip Sukhtankar and Milan Vaishnav 45
Dunning, Thad and Janhavi Nilekani (2013), “Ethnic Quotas and Political Mobilization: Caste, Parties, and Distribution in Indian Village Council,” American Political Science Review 107(1): 35-56.
Dutta, B. and P. Gupta (2014). “How Indian Voters Respond to Candidates with Criminal Charges.” Economic and Political Weekly 49.4.
Golden, Miriam, and Brian Min (2013), “Distributive politics around the world,” Annual Review of Political Science 16: 73-99.
Dhaliwal, Iqbal and Reema Hanna (2014). “Deal with the Devil? The Success and Limitations of Bureaucratic Reform in India” Mimeo, Harvard Kennedy School.
Fearon, James D. (1999). “Why Ethnic Politics and 'Pork' Tend to Go Together,” Conference on Ethnic Politics and Democratic Stability, University of Chicago.
Ferraz, Claudio and Frederico Finan (2011). “Electoral Accountability and Corruption in Local Governments: Evidence from Audit Reports,” American Economic Review, 2011, 101: 1274-1311.
Fisman, Ray, Florian Schulz, and Vikrant Vig (2013), “The Private Returns to Public Office,” Mimeo, Columbia Business School.
Franck, R., & Rainer, I. (2012). “Does the Leader's Ethnicity Matter? Ethnic Favoritism, Education, and Health in Sub-Saharan Africa,” American Political Science Review, 106(02), 294-325.
Gingerich, Daniel (2010). “Dividing the Dirty Dollar: The Allocation and Impact of Illicit Campaign Funds in a Gubernatorial Contest in Brazil,” Mimeo, University of Virginia.
Gingerich, Daniel (forthcoming) “Brokered Politics in Brazil: An Empirical Analysis,” Quarterly Journal of Political Science.
Gowda, M.V. Rajeev and E. Sridharan (2012). “Reforming India’s Party Financing and Election Expenditure Laws.” Election Law Journal 11.2: 226-240.
Hansen, Thomas Blom (2001). Wages of Violence: Naming and Identity in Postcolonial Bombay. Princeton, NJ: Princeton University Press.
Huntington, Samuel (1968). Political Order in Changing Societies,” New Haven: Yale University Press, 1968.
Jensenius, Francesca (2013), “Power, Performance and Bias: Evaluating the Electoral Quotas for Scheduled Castes in India,” PhD dissertation, University of California-Berkeley.
Kapur, Devesh (2010). “Political Economy of the State.” In Niraja Gopal Jayal and Pratap Bhanu Mehta, eds. The Oxford Companion to Politics in India. New Delhi: Oxford University Press.
Kapur, Devesh and Milan Vaishnav (2013). “Quid Pro Quo: Builders, Politicians and Election Finance in India.” Center for Global Development Working Paper 176.
Kapur, Devesh and Milan Vaishnav (2014), “Strengthening Rule of Law,” in Bibek Debroy, Ashley J. Tellis and Reece Trevor, Getting India Back on Track: An Action Agenda for Reform. Washington, DC: Carnegie Endowment for International Peace.

46 India Policy Forum 2014
Kaushik, Arun and Rupayan Pal (2012), “Political Strongholds and Budget Allocation for Developmental Expenditure: Evidence from Indian States, 1971-2005,” Mimeo, Indira Gandhi Institute of Development Research.
Kenny, Charles and Jonathan Karver (2012), “Publish What You Buy: The Case for Routine Publication of Government Contracts,” Center for Global Development Policy Paper, Washington, DC.
Khemani, S. (2004). “Political cycles in a developing economy: effect of elections in the Indian states,” Journal of Development Economics, 73(1), 125-154.
Khemani, Stuti (2007), “Does delegation of fiscal policy to an independent agency make a difference? Evidence from intergovernmental transfers in India,” Journal of Development Economics 82(2): 464-484.
Khera, Reetika (2011). “Trends in Diversion of PDS Grain,” Technical Report 198, Centre for Development Economics, Delhi School of Economics March 2011.
Kramon, E., & Posner, D. N. (2013). “Who benefits from distributive politics? How the outcome one studies affects the answer one gets,” Perspectives on Politics, 11(02), 461-474.
Leff, Nathaniel (1964). “Economic Development through Bureaucratic Corruption," American Behavioural Scientist, 1964, 8, 8-14.
Lewis-Faupel, Sean, Yusuf Neggers, Benjamin A. Olken and Rohini Pande (2013), “Can Electronic Procurement Improve Infrastructure Provision? Evidence from Public Works in India and Indonesia,” Mimeo, Harvard Kennedy School.
Lindbeck, Assar and Joerg Weibull (1987), “Balanced Budget Redistribution and the Outcome of Political Competition,” Public Choice 52(3):273–297.
Lui, Francis (1985). “An Equilibrium Queuing Model of Bribery,” Journal of Political Economy, 1985, 93 (4), 760-81.
Mehta, Pratap Bhanu (2002), “Debating Election Finance,” The Hindu (July 17).
Michelutti, L. (2009). The Vernacularisation of Democracy: Politics, Caste and Religion in India. New Delhi: Routledge India.
Min, B., & Golden, M. (2014). “Electoral cycles in electricity losses in India,” Energy Policy, 65, 619-625.
Muralidharan, Karthik and Venkatesh Sundaraman (2011). “Teacher Performance Pay: Experimental Evidence from India” The Journal of Political Economy, Vol. 119, No. 1, pp. 39-77.
Muralidharan, Karthik (2013), “Priorities for Primary Education Policy in India's 12th Five Year Plan,” India Policy Forum 2012-13 Vol. 9: 1-46.
Muralidharan, Karthik, Paul Niehaus, and Sandip Sukhtankar (2014). “Payments Infrastructure and the Performance of Public Programs: Evidence from Biometric Smartcards in India”, Working paper w19999, National Bureau of Economic Research.
Muralidharan, Karthik, Jishnu Das, Alaka Holla, and Aakash Mohpal. (2014), “The Fiscal Cost of Weak Governance: Evidence from Teacher Absence in India,” Working Paper, University of California, San Diego.

Sandip Sukhtankar and Milan Vaishnav 47
Murphy, Kevin M and Andrei Shleifer, and Robert Vishny, (1991). ”The Allocation of Talent: Implications for Growth,” The Quarterly Journal of Economics, MIT Press, vol. 106(2), pages 503-30, May.
Nichter, Simeon. 2008. “Vote Buying or Turnout Buying? Machine Politics and the Secret Ballot.” American Political Science Review 102(1):19–31.
Niehaus, Paul, Antonia Attanassova, Mariane Bertrand and Sendhil Mullainathan (2013). “Targeting with Agents” American Economic Journal: Economic Policy 5 (1), 2013, pp. 206-238.
Niehaus, Paul and Sandip Sukhtankar (2013a). “Corruption Dynamics: the Golden Goose Effect,” American Economic Journal: Economic Policy, November 2013, 5 (4), 230-69.
Niehaus, Paul and Sandip Sukhtankar (2013b). “The Marginal Rate of Corruption in Public Programs: Evidence from India,” Journal of Public Economics, July 2013, 104, 52-64.
Nordhaus, W. D. (1975). “The political business cycle,” The Review of Economic Studies, 169-190.
Olken, Benjamin A. (2006). “Corruption and the Costs of Redistribution: Micro Evidence from Indonesia,” Journal of Public Economics, May 2006, 90 (4-5), 853-870.
Olken, Benjamin A. (2009), “Corruption Perceptions vs. Corruption Reality,” Journal of Public Economics 93 (7-8), 950-964.
Olken, Benjamin A. and Rohini Pande (2012). “Corruption in Developing Countries,” Annual Review of Economics, 2012, 4 (1).
PwC (2014), “Economic crime: A threat to business globally,” PwC 2014 Global Economic Crime Survey.
Palaniswamy, Nethra and Nandini Krishnan (2008), “Local Politics, Political Institutions, and Public Resource Allocation,” International Food Policy Research Institute Discussion Paper 00834 (December).
Pande, R. (2003). “Can mandated political representation increase policy influence for disadvantaged minorities? Theory and evidence from India,” The American Economic Review, 93(4), 1132-1151.
Pande, Rohini (2007). “Understanding Political Corruption in Low Income Countries.” Handbook of Development Economics, 4 (2007), 3155-3184.
Patnatik. Ila and Ajay Shah (2014), “Reforming India’s Financial System,” Carnegie Paper, Carnegie Endowment for International Peace.
Peisakhin, L. and P. Pinto (2010). “Is transparency an effective anti-corruption strategy? Evidence from a field experiment in India,” Regulation and Governance 4(3): 261–280.
Peisakhin, L. (2012). Transparency and Corruption: Evidence from India. Journal of Law and Economics. 55 1 129-149.
Pinto-Duschinsky, Michael (2002), “Financing Politics: A Global View,” Journal of Democracy 13(4): 69-86.
Pritchett, Lant (2009). “A Review of Edward Luce's In Spite of the Gods: The Strange Rise of Modern India.” Journal of Economic Literature 47(3): 771-780.
48 India Policy Forum 2014
Programme Evaluation Organization (2005). “Performance Evaluation of Targeted Public Distribution System,” Technical Report, Planning Commission, Government of India March 2005.
PRS Legislative Research (2011), “Legislative Brief: The Public Interest Disclosure and Protection to Persons Making the Disclosures Bill, 2010,”January 24.
PRS Legislative Research (2012), “The Right of Citizens for Time Bound Delivery of Goods and
Services and Redressal of their Grievances Bill, 2011,” September 27.
PRS Legislative Research (2013), “Legislative Brief: The Public Procurement Bill, 2012,” September 27.
PRS Legislative Research (2014), “Bill Summary: The Prevention of Corruption (Amendment) Bill, 2013,”February 12.
Raha, Swagata (2012). “State Legislation on Right to Time-Bound Delivery of Service: An Overview,” Policy Brief, Accountability Initiative, Centre for Policy Research (January).
Ravallion, Martin, Dominique van de Walle, Puja Dutta and Rinku Murgai (2013). “Try Telling People their Rights? On Making India’s Largest Antipoverty Program work in India’s Poorest State”, mimeo, World Bank.
Roberts, Alasdair (2010), “A Great and Revolutionary Law? The First Four Years of India’s Right to Information Act,” Public Administration Review 70(6): 925-933.
Rogoff, K., & Sibert, A. (1988). “Elections and macroeconomic policy cycles,” The Review of Economic Studies, 55(1), 1-16.
Rogoff, K. S. (1990). “Equilibrium political budget cycles,” National Bureau of Economic Research Working Paper.
Saez, L., & Sinha, A. (2010). “Political Cycles, Political Institutions and Public Expenditure in India, 1980–2000,” British Journal of Political Science, 40(01), 91-113.
Sastry, Trolochan (2014), “Towards Decriminalisation of Elections and Politics,” Economic and Political Weekly 49(1): 34-41.
Sen, Ronojoy (2012), “Identifying Criminals and Crorepatis in Indian Politics: An Analysis of Two Supreme Court Rulings,” Election Law Journal 11(2): 216-225.
Shleifer, Andrei and Robert W. Vishny (1993), “Corruption,” The Quarterly Journal of Economics 108 (3): 599-617.
Sircar, Neelanjan and Milan Vaishnav (2013), “Core or Swing? The Role of Electoral Context in
Shaping Pork Barrel,” Mimeo, Carnegie Endowment for International Peace,
Sircar, Neelanjan and Milan Vaishnav (in progress), “Support for Criminality and Caste in Indian Politics” mimeo, Carnegie Endowment for International Peace.
Sridharan, E. (2006). “Electoral Finance Reform: The Relevance of International Experience,” in Vikram Chand, ed. Reinventing Public Service Delivery in India. New Delhi: Sage.
Stein, Robert M. and Kenneth N. Bickers. 1994. “Congressional Elections and the Pork Barrel.” Journal of Politics 56(2):377–399.
Sandip Sukhtankar and Milan Vaishnav 49
Stokes, Susan C. 2005. “Perverse Accountability: A Formal Model of Machine Politics with Evidence from Argentina.” American Political Science Review 99(3):315–325.
Stokes, Susan C. et al. (2013), Brokers, Voters, and Clientelism: The Puzzle of Distributive Politics. New York: Cambridge University Press.
Sukhtankar, Sandip (2012). “Sweetening the Deal? Political Connections and Sugar Mills in India” American Economic Journal: Applied Economics, vol 4, no 3, pp 43-63, Jul 2012.
Sukhtankar, Sandip, (2014). “The Impact of Corruption on Consumer Markets: Evidence from the Allocation of 2G Wireless Spectrum in India”, mimeo, Dartmouth College.
The Economist (2014), “Campaign Finance in India: Black Money Power,” Banyan weblog (May 14).
Transparency International and Centre for Media Studies (2005), India Corruption Study 2005. New Delhi: Transparency International India.
Transparency International (2011). Daily Lives and Corruption: Public Opinion in South Asia. South Asia Corruption Barometer.
United Nations Office on Drugs and Crime (2012), India: Probity in Public Procurement. New Delhi: UNODC.
Vaishnav, Milan (2012). “The Merits of Money and “Muscle”: Essays on Criminality, Elections and Democracy in India.” PhD Dissertation. Department of Political Science, Columbia University.
Vaishnav, Milan (2013), “Crime but No Punishment in Indian Elections,” Carnegie Endowment for International Peace.
Witsoe, Jeffrey. (2013). Democracy against Development: Lower-Caste Politics and Political Modernity in Postcolonial India. Chicago: University of Chicago Press.
50 India Policy Forum 2014
Appendices
Appendix A: Details on Scams
A.1. Construction Sector
1. Taj Heritage Corridor Scam
Brief Description: Then-Uttar Pradesh Chief Minister Mayawati allegedly began unsanctioned construction near the Taj Mahal, intended to upgrade tourist facilities. According to the Central Bureau of Investigation (CBI), Mayawati protected multiple party members from prosecution in another case in exchange for support and allegedly embezzled money for the project.
Main accused: Besides Mayawati, those named in the FIR, are her top aide and former state environment minister Nasimuddin Siddiqui, former chief secretary D S Bagga, former principal secretary P L Punia, former principal secretary environment R K Sharma, former environment secretary V K Gupta, former Union Environment Secretary K C Mishra and NPCC chairman N C Bali.
Consequences: The CBI case against Mayawati was dropped but the decision to close the case has been challenged by the Supreme Court.
Cost Rs. Crore: 175
2. Uttar Pradesh NRHM Scam
Brief Description: Top politicians and bureaucrats from Uttar Pradesh allegedly siphoned off large amounts of money from UP’s National Rural Health Mission (NRHM) funds. The money was said to be taken during the upgrading of 134 district hospitals when money was granted to Construction and Design Services, which outsourced the job to a Ghaziabad-based firm which had obtained the tender on the basis of false documents, resulting in poor quality construction and high losses. Several suspect murders followed, raising questions of an attempted cover up of irregularities in UP’s NRHM funds
Main accused: Former UP Minister Baby Singh, Sunil Verma, National Rural Health Mission Project Manager, PK Jain, BN Srivastava, Katar Singh, BN Ram, JK Singh, Naresh Grover, Abhay Kumar Bajpal, Sanjeev Kumar, Saurabh Jain, GK Batra, Virender Goal, Neeraj Upadhyaya, and RK Singh.
In November 2011, Babu Singh Kushwaha, former Minister of Family Welfare in Mayawati's government and Minister of Health Anant Kumar Mishra were forced to resign following media outcry after the killing of the two Chief Medical Officers remain unsolved.
Cost Rs. Crore: 10,000
Sandip Sukhtankar and Milan Vaishnav 51
Defense sector
3. Tatra Trucks Scam
Brief Description: BEML (a public sector undertaking, Bharat Earth Movers Limited)), was vested with the responsibility of supplying the Army with Tatra trucks, which form the basis of the Indian Army’s transport. While defense ministry guidelines strictly mandate that all military equipment should be acquired from the original equipment manufacturer, BEML (in collusion with officials from the Ministry of Defense) allegedly had purchased spare trucks from a broker in London, the Tatra Sipox (UK) Limited (owned by Vectra Group), and selling them to the army. The company had business dealings amounting to Rs. 5000 crores with Tatra Sipox (UK) Limited. In the process, BEML and the Defense Ministry allegedly siphoned off Rs. 750 crores, in the form of bribes and other illicit payments since 1997.
Main accused: Ravinder Rishi (Vectra Group Owner), TVS Shastry and VRS Natrajan (BEML)Ravinder Rishi is facing CBI probe as of February 2014. CBI has questioned other Army, Vetra, and BEML officials.
Cost Rs. Crore: 750
4. Agusta Westland Chopper Deal Scam
Brief Description: Several Indian politicians and military officials were accused of accepting bribes from helicopter manufacturer AgustaWestland in order to win the Rs. 36 billion (US$600 million) 2010 Indian contract for the supply of 12 AgustaWestland AW101 helicopters. Italian prosecutors have alleged that Ahmed Patel (political secretary to Congress President Sonia Gandhi) may have received kickbacks from the deal. A note dating back to March 15, 2008 presented in Italian court also indicates that Congress Party President Sonia Gandhi was the driving force behind the VIP chopper purchase and lists the bribes to be paid.
Main accused: The FIR named 13 persons including: former Indian Air Force Chief Marshal S.P. Tyagi, his three brothers: Juli, Docsa and Sandeep, brother of former Union minister Santosh Bagrodia, Satish Bagrodia, Pratap Aggarwal (Chairman and Managing Director of IDS Infotech). Others said they had strong evidence to state that a relation of the late Andhra Pradesh Chief Minister Dr. YS RajasekharaReddy,Anil Kumar, was involved in the scam. The government cancelled the deal with AgustaWestland in January 2014. CBI has requested to investigate M K Narayanan and Bharat Vir Wanchoo (governor of West Bengal and former national security advisor and ex-governor of Goa and Special Protection Group (SPG) chief, respectively), but the Union Law Ministry rejected this request. CBI has renewed questioning about former IAF chief SP Tyagi.
Cost Rs. Crore: 450
52 India Policy Forum 2014
A.2. Financial sector
5. Calcutta Stock Market Scam
Brief Description: Ketan Parekh used the Calcutta Stock Exchange to con investors by making rapid stock purchases using borrowed money, resulting in the country's worst “payment shortfall crisis.”
Main accused: Dinesh Singhania (CSE Director), Ketan Parekh (stock broker and orchestrator), Ashok Kumar Poddar , Karish Chander Biyani, BV Gaud (former CEO and MD of Stock Holding Corp of India), SN Paul (senior VP of IndusInd Bank), Dinesh Jain (former MD of SREI Securities)
All major players arrested and roughly 300 more suspended. Ketan Parekh, the sole individual convicted, was convicted in 2008 for his involvement in the scam and was debarred from trading in the Indian stock exchanges until 2017.
Cost Rs. Crore: 120
6. Telgi Stamp Scam
Brief Description: Across 18 states for 10 years beginning in 2003, Abdul Karim Telgi printed fake stamp paper. He appointed 300 people as agents who, with the complicity of politicians in Karnataka and Maharashtra, sold the fakes to bulk purchasers, including banks, financial institutions, insurance companies, and share-broking firms.
Main accused: Abdul Kareem Telgi, Ramratan Soni, Sanjay Gaikwad; Telgi was imprisoned in 2007 for life.
Cost Rs. Crore: 43,000
7. IPO Demat Scam
Brief Description: The Securities Exchange Board of India (SEBI) started scanning IPOs launched over 2003, 2004 and 2005 while investigating irregularities in the buying of Yes Bank’s IPO (in 2005) and alleged that individuals were creating thousands of fake benami “demat” accounts to acquire a higher allotment of IPOs (the first sale of a company’s share to public investors) meant for retail investors. The fake investors then transferred their shares to financiers before the stocks entered the stock market who immediately sold them at a much higher price than they would have been listed for.
Main accused: Roopalben Panchal was found to be controlling nearly 15,000 demat accounts.7 were arrested (Dushyant Dalal, Manoj Seksaria, Purushottam Budhwani, Deepak Panchal, Parag Jhaveri, Diren Vora, Manoj Seksaria), but Roopalben Panchal was not.
Cost Rs. Crore: 146
8. Saradha Group Chit Fund Scam
Brief Description: Saradha Group (a group of over 300 Indian companies) was believed to be running a wide variety of collective investment schemes (“chit funds”) in Eastern
Sandip Sukhtankar and Milan Vaishnav 53
India since 2006 that defrauded investors. The group collapsed in April 2013, causing an estimated loss of INR 200–300 billion (US$4–6 billion) to over 1.7 million depositors.
Main accused: Sudipto Sen (Director of Saradha), Debjani Mukherjee (#2 at Saradha), Kunal Ghosh (MP), Srinjoy Bose (MP), Madan Mitra (Transport Minister), Ganesh Dey (assistant to the Finance Minister).
Sudipto Sen and Debjani Mukherjee arrested along with various other Saradha members involved in the ponzi schemes.
Cost Rs. Crore: 20,000
9. Sahara India Pariwar - Investor Fraud Case
Brief Description: Subrata Roy of Sahara India Real Estate and Sahara Housing Investment Corps allegedly deceived investors with a proposed housing project of Rs. 25,000 crore. Security Exchange Board of India (SEBI) ordered Sahara firms to immediately refund the money collected through the sales of optionally fully convertible debentures (OFCD).
Main accused: Subrata Roy (Chairman and Founder of Sahara India Pariwar). Roy was arrested after his company refused to return deposits it had collected to its investors and was denied bail. Sahara was allowed to sell some assets to recoup investor deposits.
Cost Rs. Crore: 24,000
10. Kerala Solar Panel Scam
Brief Description: The Team Solar Energy Company (Team Solar), floated by the main accused Biju Radhakrishnan and Saritha Nair (directors of the company), allegedly collected advance payments from numerous investors by offering to make them business partners, or from customers seeking installation of solar units, but defrauded these individuals after receiving advance payments.
Main accused: Biju Radhakrishnan and Saritha Nair
Five people have been arrested: Saritha Nair, Tenny Joppan (released), Biju Radhakrishnan, Shalu Menon (released), Saritha Nair. Allegations against Kerala CM Oomenn Chandy have been raised concerning his involvement/knowledge of the scam.
Cost Rs. Crore: 7
A.3. Food grains
11. Rice Export Scam
Brief Description: Rice was exported to some African countries despite a government-instituted ban on non-basmati rice export.
Main accused: According to one report, “at least half a dozen of the suspect officials are of joint secretary and above rank, while the total number under scanner is about 20 in three different public sector units.” Some have alleged that Sharad Pawar (Head of Public Distribution Ministry) and Kamal Nath (Head of Commerce and Industry
54 India Policy Forum 2014
Ministry) were also involved. The central government has blocked CBI investigations into the role of several senior government officials.
Cost Rs. Crore: 2,500
12. Gegong Apang Public Distribution System Scam
Brief Description: Gegong Apang, then CM of Arunachal Pradesh, allegedly cleared forged and fraudulent hill transport subsidy bills. States in northeastern India get two forms of reimbursement from the government for transporting food grains: a) reimbursement of the Road Transport Charges for picking up the grains; and b) Hill Transport Subsidy for moving depositing the grains at the distribution centers. “The forgery and fraud took place at two levels: (i) payment of huge sums as reimbursement of Hill Transport Subsidy and Road Transport Charges from the Government of India for transporting PDS items to the state, and (ii) showing delivery of PDS items without actually reaching them to the people" (Sinlung). The 2008 investigation by a Special Investigation Cell of the Arunachal Pradesh state government began after false/inflated bills for procurement and transportation of foodgrain meant for PDS were found a public interest litigation (PIL) suit was brought. Apang claimed the charges were political and that he had been illegally detained.
Main accused: Gegong Apang, Chief Minister of Arunachal Pradesh. Roughly 50 were accused, 30 of whom were arrested.
Apang was arrested in 2010 by a Special Investigation Team (SIT) and was in police custody for 7 days.
Cost Rs. Crore: 1,000
13. Uttar Pradesh Food Grain Scam
Brief Description: Food grain meant for the poor was allegedly diverted from over 30 districts in Uttar Pradesh to the open market and sold abroad. UP CMs Mulayam Singh and Mayawati both launched investigations.
Main accused: Thousands of government officials from the Regional Food Controller’s office and District Rural Development Authority (and private food traders) were thought to be involved. A Special Investigation Team ( SIT), set up by the Mulayam Singh government in 2006, first investigated the case. In 2007, Mayawati authorized a CBI investigation into the matter.
The CBI launched 9 cases which identified roughly 150 government officials and resulted in a district magistrate, six ADM employees and a few district food and supplies officials getting suspended. Nine people were arrested, one of whom was the Chief Finance and Accounts officer of the DRDA. Over 300 FIRs have been made.
Cost Rs. Crore: 200,000
Sandip Sukhtankar and Milan Vaishnav 55
A.4. Information Technology sector
14. Antrix Devas/ISRO Spectrum Allocation Scam
Brief Description: In 2005 the Indian Space Research Organization allegedly covered up the launch of two satellites and sale of S-Band spectrum at very low prices to Devas Multimedia Private Limited, giving them control of high speed mobile telecommunication.
Main accused: ISRO chief G. Madhavan Nair, former scientific secretary A. Bhaskaranarayana, former Antrix managing director K.R. Sridhara Murthy and former senior scientist K.N. Shankara.
The contract was terminated and the four scientists were indicted and blacklisted.
Cost Rs. Crore: 200,000
15. 2G Spectrum Scam
Brief Description: Instead of auctioning 2G spectrum, Union Telecom Minister Andimuthu Raja insisted on a ‘First Come, First Serve’ policy, whereby applicants would be reviewed in the order in which they applied. However, according to charge sheets filed in the case, Raja privately rigged the process to benefit select insiders (allegedly in exchange for kickbacks). All told, 122 licenses were sold at 2001 prices, 85 of which were given to companies deemed ineligible to receive licenses for various reasons. In all, Raja allegedly nixed competitive bidding on a lucrative natural resource, reneged on the official application deadline which subsequently disqualified eligible applicants, leaked information about the new application window, sold licenses at outdated prices, and did so to ineligible companies that bribed him.
Main accused: Telecom Minister Andimuthu Raja, Telecom Chairman Siddharth Behura and Kanimozhi Karunanidhi, daughter of former Tamil Nadu Chief Minister M. Karunanidhi. Both A Raja and Kanimozhi were arrested in 2011. Both are out on bail (Raja after 15 months and Kanimozhi after 5). Both are still under investigation along with 17 other people named in the Enforcement Directorate's chargesheet.
Cost Rs. Crore: 56,000
16. Satyam Computer Services Scandal
Brief Description: Ramalinga Raju, chairman of one of India’s fastest growing IT companies, allegedly falsified sales invoices and forged the company’s fixed deposit documents to redirect large sums of money disguised as salaries, diverting as much as Rs. 20 crore a month by claiming that the company had 53,000 employees when it was actually only 40,000. There were over 400 benami accounts involved.
Main accused: Ramalinga Raju, Suryanarayana Raju, Appalanarasimha Raju, Ramalingam Raju along with 2 other accused of the scandal, had been granted bail from Supreme Court on 4 November 2011 as the CBI failed to file a chargesheet more than 33 months after Ramalinga Raju being arrested.
Cost Rs. Crore: 14,162
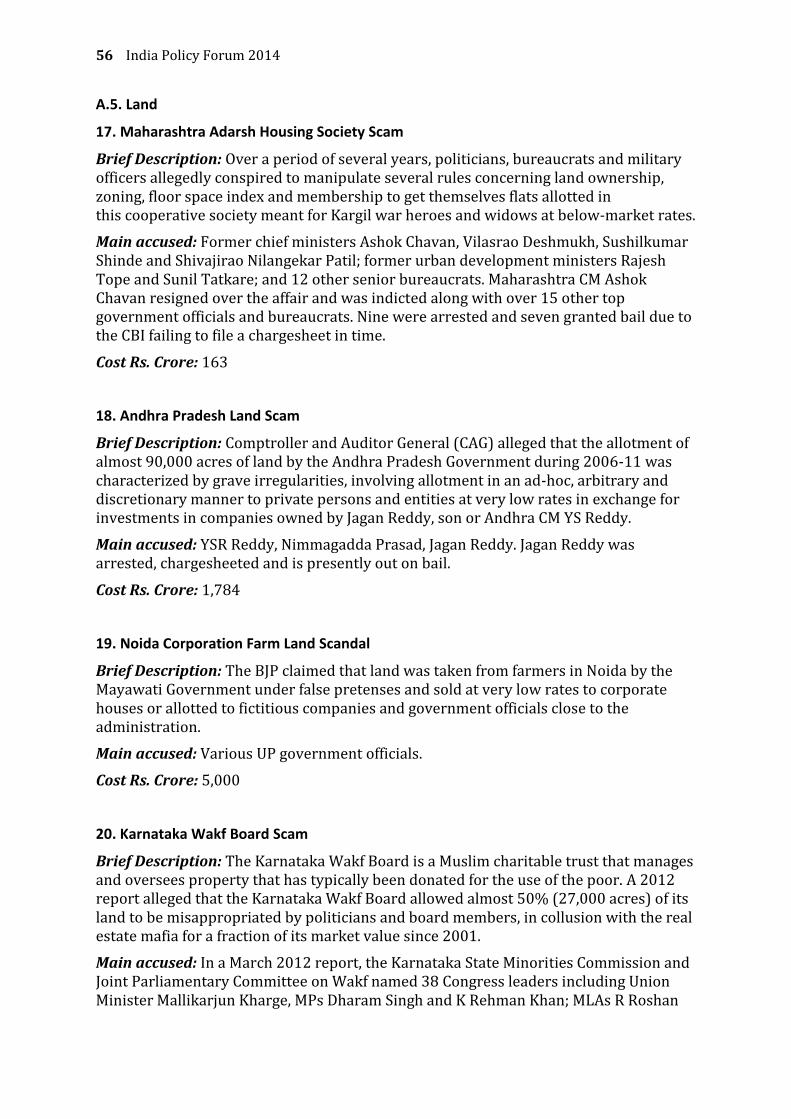
56 India Policy Forum 2014
A.5. Land
17. Maharashtra Adarsh Housing Society Scam
Brief Description: Over a period of several years, politicians, bureaucrats and military officers allegedly conspired to manipulate several rules concerning land ownership, zoning, floor space index and membership to get themselves flats allotted in this cooperative society meant for Kargil war heroes and widows at below-market rates.
Main accused: Former chief ministers Ashok Chavan, Vilasrao Deshmukh, Sushilkumar Shinde and Shivajirao Nilangekar Patil; former urban development ministers Rajesh Tope and Sunil Tatkare; and 12 other senior bureaucrats. Maharashtra CM Ashok Chavan resigned over the affair and was indicted along with over 15 other top government officials and bureaucrats. Nine were arrested and seven granted bail due to the CBI failing to file a chargesheet in time.
Cost Rs. Crore: 163
18. Andhra Pradesh Land Scam
Brief Description: Comptroller and Auditor General (CAG) alleged that the allotment of almost 90,000 acres of land by the Andhra Pradesh Government during 2006-11 was characterized by grave irregularities, involving allotment in an ad-hoc, arbitrary and discretionary manner to private persons and entities at very low rates in exchange for investments in companies owned by Jagan Reddy, son or Andhra CM YS Reddy.
Main accused: YSR Reddy, Nimmagadda Prasad, Jagan Reddy. Jagan Reddy was arrested, chargesheeted and is presently out on bail.
Cost Rs. Crore: 1,784
19. Noida Corporation Farm Land Scandal
Brief Description: The BJP claimed that land was taken from farmers in Noida by the Mayawati Government under false pretenses and sold at very low rates to corporate houses or allotted to fictitious companies and government officials close to the administration.
Main accused: Various UP government officials.
Cost Rs. Crore: 5,000
20. Karnataka Wakf Board Scam
Brief Description: The Karnataka Wakf Board is a Muslim charitable trust that manages and oversees property that has typically been donated for the use of the poor. A 2012 report alleged that the Karnataka Wakf Board allowed almost 50% (27,000 acres) of its land to be misappropriated by politicians and board members, in collusion with the real estate mafia for a fraction of its market value since 2001.
Main accused: In a March 2012 report, the Karnataka State Minorities Commission and Joint Parliamentary Committee on Wakf named 38 Congress leaders including Union Minister Mallikarjun Kharge, MPs Dharam Singh and K Rehman Khan; MLAs R Roshan

Sandip Sukhtankar and Milan Vaishnav 57
Baig, Tanveer Sait, NA Haris, Qamrul Islam; former union minister CK Jaffer Sharief, former MPs Suryavamshi, Iqbal Ahmed Saradgi; and among others Iqbal Ansari, late MS Ansari, and late Azeez Sait, Hindasgeri. The state of Karnataka organized a 5 person panel to review the case.
Cost Rs. Crore: 200,000
21. Maharashtra Irrigation Scam
Brief Description: Between 1999 and 2009, allegedly more than half of the Rs. 70,000 crore spent on over 30 irrigation projects was pocketed by state political leaders. The cost of the irrigation projects was allegedly cleared without proper procedure by Irrigation Minister Ajit Pawar and successor Sunil Tatkare and then the costs of the sanctioned projects were increased (sometimes by over 300%).
Main accused: Ajit Pawar, Sunil Tatkare. According to a government whistleblower who exposed the alleged corruption, many political bosses, irrigation officials and contractors were involved. After a CAG probe was initiated in 2012, Ajit Pawar resigned and was then reinstated after a state government white paper was published that same year that clarified and justified the expense irregularities.
Cost Rs. Crore: 35,000
A.6. Mining sector
22. Orissa Mine Scam
Brief Description: Of the 300 major mines leases in the districts of Keonjhar, Sundargarh and Mayurbhanj, 155 have expired, some as early as the year 2000. 22.80 crore tons were allegedly extracted illegally from the state for almost a decade, ignoring environmental regulations, and money made from illegal mining was used for election campaigns.
Main accused: Naveen Patnaik government and companies including Tata Steel, Aditya Birla group companies, SR Rungta Group. Almost 500 mining licenses were suspended and over 100 companies were fined. Patnaik has been avoiding a CBI investigation by promising to enact a Lokayukta Bill and handle the case internally.
Cost Rs. Crore: 50,000
23. Goa Mining Scam
Brief Description: From 2009-2011, 15 million metric tons of ore were allegedly extracted illegally and without environmental clearances.
Main accused: Arvind Loliekar, former Director of Mines and Geology; Digambar Kamat, former chief minister and minister of mines; Pratapsinh Rane, former CM. The Supreme Court banned iron ore mining in Goa in 2012, but lifted with ban with a cap of 20 million tons in April of 2014. Loliekar and 6 others arrested.
Cost Rs. Crore: 35,000
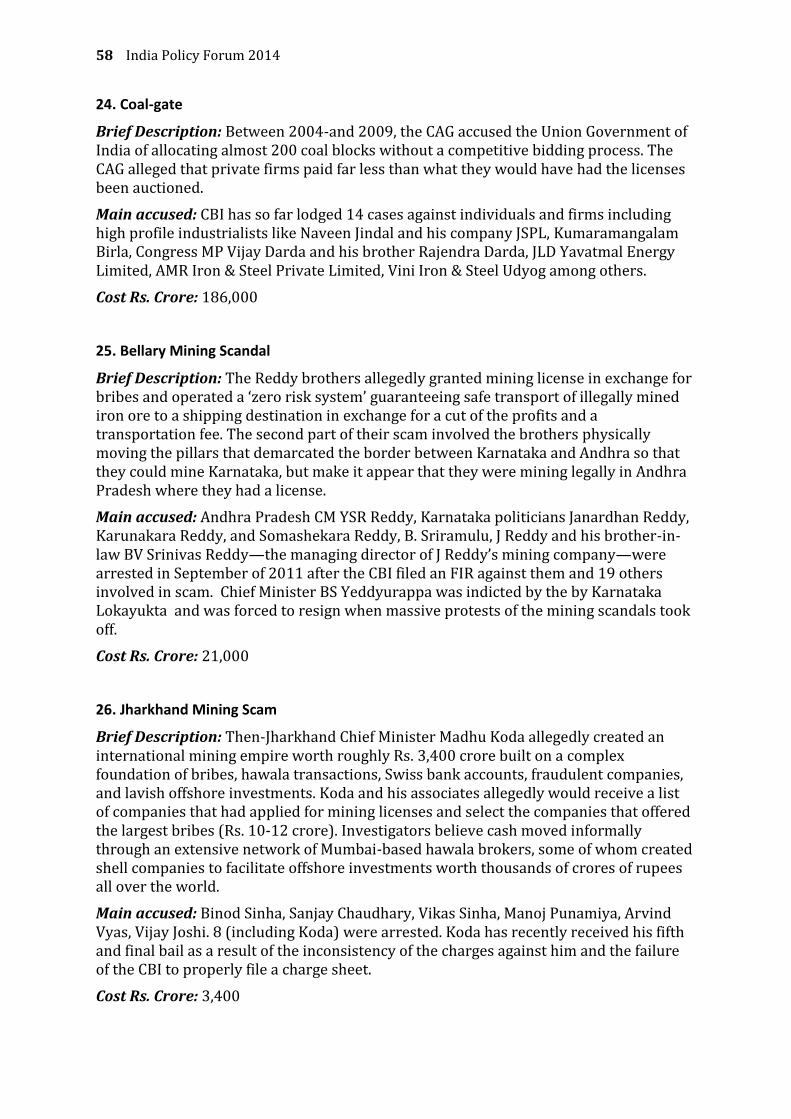
58 India Policy Forum 2014
24. Coal-gate
Brief Description: Between 2004-and 2009, the CAG accused the Union Government of India of allocating almost 200 coal blocks without a competitive bidding process. The CAG alleged that private firms paid far less than what they would have had the licenses been auctioned.
Main accused: CBI has so far lodged 14 cases against individuals and firms including high profile industrialists like Naveen Jindal and his company JSPL, Kumaramangalam Birla, Congress MP Vijay Darda and his brother Rajendra Darda, JLD Yavatmal Energy Limited, AMR Iron & Steel Private Limited, Vini Iron & Steel Udyog among others.
Cost Rs. Crore: 186,000
25. Bellary Mining Scandal
Brief Description: The Reddy brothers allegedly granted mining license in exchange for bribes and operated a ‘zero risk system’ guaranteeing safe transport of illegally mined iron ore to a shipping destination in exchange for a cut of the profits and a transportation fee. The second part of their scam involved the brothers physically moving the pillars that demarcated the border between Karnataka and Andhra so that they could mine Karnataka, but make it appear that they were mining legally in Andhra Pradesh where they had a license.
Main accused: Andhra Pradesh CM YSR Reddy, Karnataka politicians Janardhan Reddy, Karunakara Reddy, and Somashekara Reddy, B. Sriramulu, J Reddy and his brother-in-law BV Srinivas Reddy—the managing director of J Reddy’s mining company—were arrested in September of 2011 after the CBI filed an FIR against them and 19 others involved in scam. Chief Minister BS Yeddyurappa was indicted by the by Karnataka Lokayukta and was forced to resign when massive protests of the mining scandals took off.
Cost Rs. Crore: 21,000
26. Jharkhand Mining Scam
Brief Description: Then-Jharkhand Chief Minister Madhu Koda allegedly created an international mining empire worth roughly Rs. 3,400 crore built on a complex foundation of bribes, hawala transactions, Swiss bank accounts, fraudulent companies, and lavish offshore investments. Koda and his associates allegedly would receive a list of companies that had applied for mining licenses and select the companies that offered the largest bribes (Rs. 10-12 crore). Investigators believe cash moved informally through an extensive network of Mumbai-based hawala brokers, some of whom created shell companies to facilitate offshore investments worth thousands of crores of rupees all over the world.
Main accused: Binod Sinha, Sanjay Chaudhary, Vikas Sinha, Manoj Punamiya, Arvind Vyas, Vijay Joshi. 8 (including Koda) were arrested. Koda has recently received his fifth and final bail as a result of the inconsistency of the charges against him and the failure of the CBI to properly file a charge sheet.
Cost Rs. Crore: 3,400
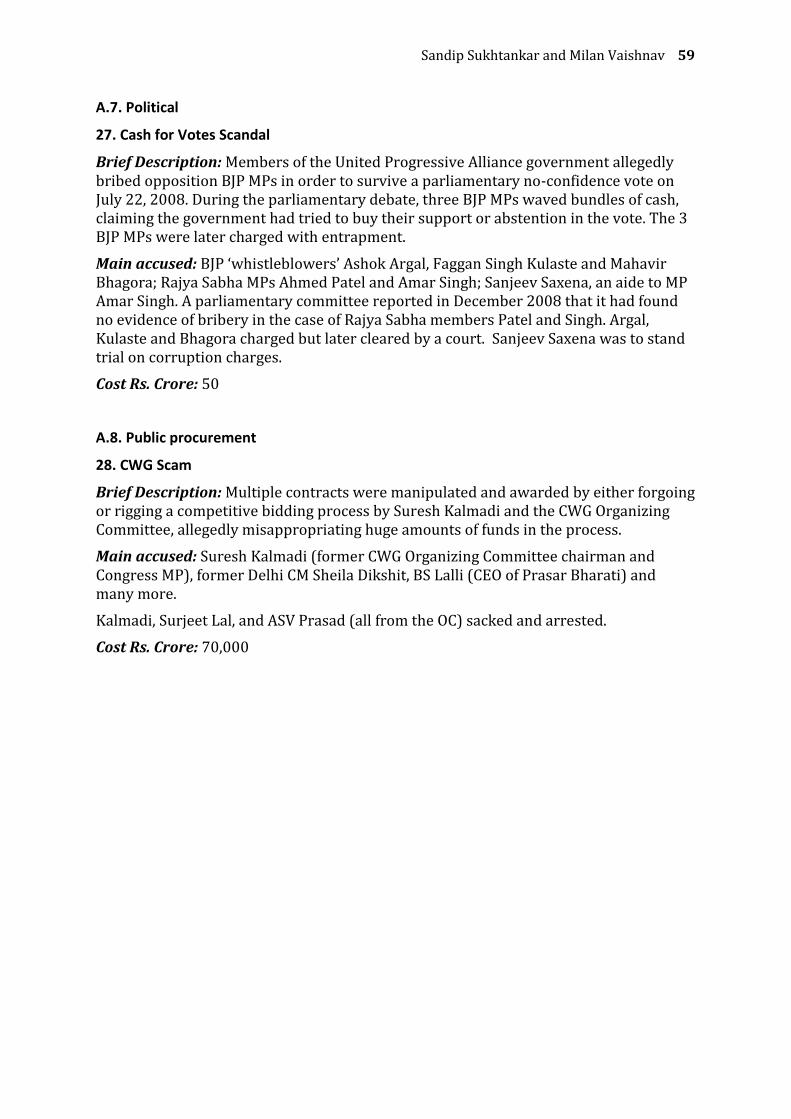
Sandip Sukhtankar and Milan Vaishnav 59
A.7. Political
27. Cash for Votes Scandal
Brief Description: Members of the United Progressive Alliance government allegedly bribed opposition BJP MPs in order to survive a parliamentary no-confidence vote on July 22, 2008. During the parliamentary debate, three BJP MPs waved bundles of cash, claiming the government had tried to buy their support or abstention in the vote. The 3 BJP MPs were later charged with entrapment.
Main accused: BJP ‘whistleblowers’ Ashok Argal, Faggan Singh Kulaste and Mahavir Bhagora; Rajya Sabha MPs Ahmed Patel and Amar Singh; Sanjeev Saxena, an aide to MP Amar Singh. A parliamentary committee reported in December 2008 that it had found no evidence of bribery in the case of Rajya Sabha members Patel and Singh. Argal, Kulaste and Bhagora charged but later cleared by a court. Sanjeev Saxena was to stand trial on corruption charges.
Cost Rs. Crore: 50
A.8. Public procurement
28. CWG Scam
Brief Description: Multiple contracts were manipulated and awarded by either forgoing or rigging a competitive bidding process by Suresh Kalmadi and the CWG Organizing Committee, allegedly misappropriating huge amounts of funds in the process.
Main accused: Suresh Kalmadi (former CWG Organizing Committee chairman and Congress MP), former Delhi CM Sheila Dikshit, BS Lalli (CEO of Prasar Bharati) and many more.
Kalmadi, Surjeet Lal, and ASV Prasad (all from the OC) sacked and arrested.
Cost Rs. Crore: 70,000
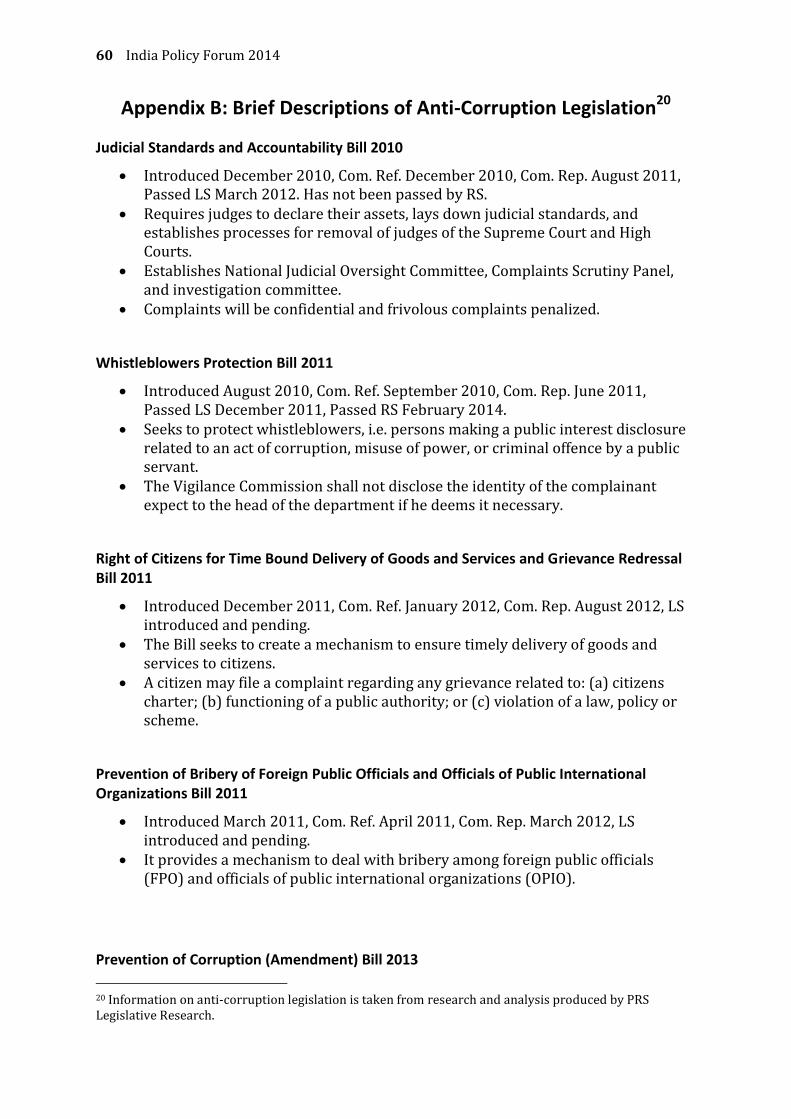
60 India Policy Forum 2014
Appendix B: Brief Descriptions of Anti-Corruption Legislation20
Judicial Standards and Accountability Bill 2010
Introduced December 2010, Com. Ref. December 2010, Com. Rep. August 2011, Passed LS March 2012. Has not been passed by RS.
Requires judges to declare their assets, lays down judicial standards, and establishes processes for removal of judges of the Supreme Court and High Courts.
Establishes National Judicial Oversight Committee, Complaints Scrutiny Panel, and investigation committee.
Complaints will be confidential and frivolous complaints penalized.
Whistleblowers Protection Bill 2011
Introduced August 2010, Com. Ref. September 2010, Com. Rep. June 2011, Passed LS December 2011, Passed RS February 2014.
Seeks to protect whistleblowers, i.e. persons making a public interest disclosure related to an act of corruption, misuse of power, or criminal offence by a public servant.
The Vigilance Commission shall not disclose the identity of the complainant expect to the head of the department if he deems it necessary.
Right of Citizens for Time Bound Delivery of Goods and Services and Grievance Redressal Bill 2011
Introduced December 2011, Com. Ref. January 2012, Com. Rep. August 2012, LS introduced and pending.
The Bill seeks to create a mechanism to ensure timely delivery of goods and services to citizens.
A citizen may file a complaint regarding any grievance related to: (a) citizens charter; (b) functioning of a public authority; or (c) violation of a law, policy or scheme.
Prevention of Bribery of Foreign Public Officials and Officials of Public International Organizations Bill 2011
Introduced March 2011, Com. Ref. April 2011, Com. Rep. March 2012, LS introduced and pending.
It provides a mechanism to deal with bribery among foreign public officials (FPO) and officials of public international organizations (OPIO).
Prevention of Corruption (Amendment) Bill 2013
20 Information on anti-corruption legislation is taken from research and analysis produced by PRS Legislative Research.
Sandip Sukhtankar and Milan Vaishnav 61
Introduced August 2013, Com. Ref. August 2013, Com. Rep. February 2014, RS introduced and pending. No status for LS.
The Bill makes the giving of a bribe an offence, enlarges the definition of taking a bribe and covers commercial organizations.
Public Procurement Bill 2012
Introduced May 2012, Com. Ref. May 2012, Com. Rep. within 3 months, LS introduced and pending.
Seeks to regulate and ensure transparency in procurement by the central government and its entities.
Exempts procurements for disaster management, for security or strategic purposes, and those below Rs. 50 lakh.


NCAER | National Council of Applied Economic Research 11 IP Estate, New Delhi 110002
Tel: +91-11-23379861–63, www.ncaer.org
NCAER | Quality . Relevance . Impact