Embed Size (px)
Citation preview
1
Keywords: offshore wind power connection, low-frequency AC, fractional frequency AC, HVDC
Abstract Low frequency AC (LFAC) has been proposed as a means to
avoid some of the large converter station costs of high voltage DC (HVDC) while delivering some of the benefits in terms of better line or cable utilization and its technical feasibility has been established. It is said to offer a lower costs than HVDC or conventional high voltage AC (HVAC) for a range of intermediate distances, with HVDC becoming cheaper over long distances. However, the basis for identifying the distance range and extent of cost saving has not been established. Here, cost estimate methodologies are extended for LFAC. A difficulty is the absence of commercial schemes that can provide practical examples of costs. In this paper, costs are broken down into constituent terms and estimates are made from the most similar equipment from other schemes. The capacity limits and power losses associated with subsea cables are analyzed for low frequency cases. For a given power transfer and for each distance, a choice of operating voltage, cable size and number of parallel circuits is made in order to find the lowest route cost. This yields cost as a function of distance that is a non-linear and discontinuous function. The cost curves for LFAC are compared with HVDC and HVAC options. The results for current cost estimates show that LFAC has a range of route length over which it is the lowest cost option and but this range narrows and eventually ceases to exist for higher power transfer ratings.
1 Introduction
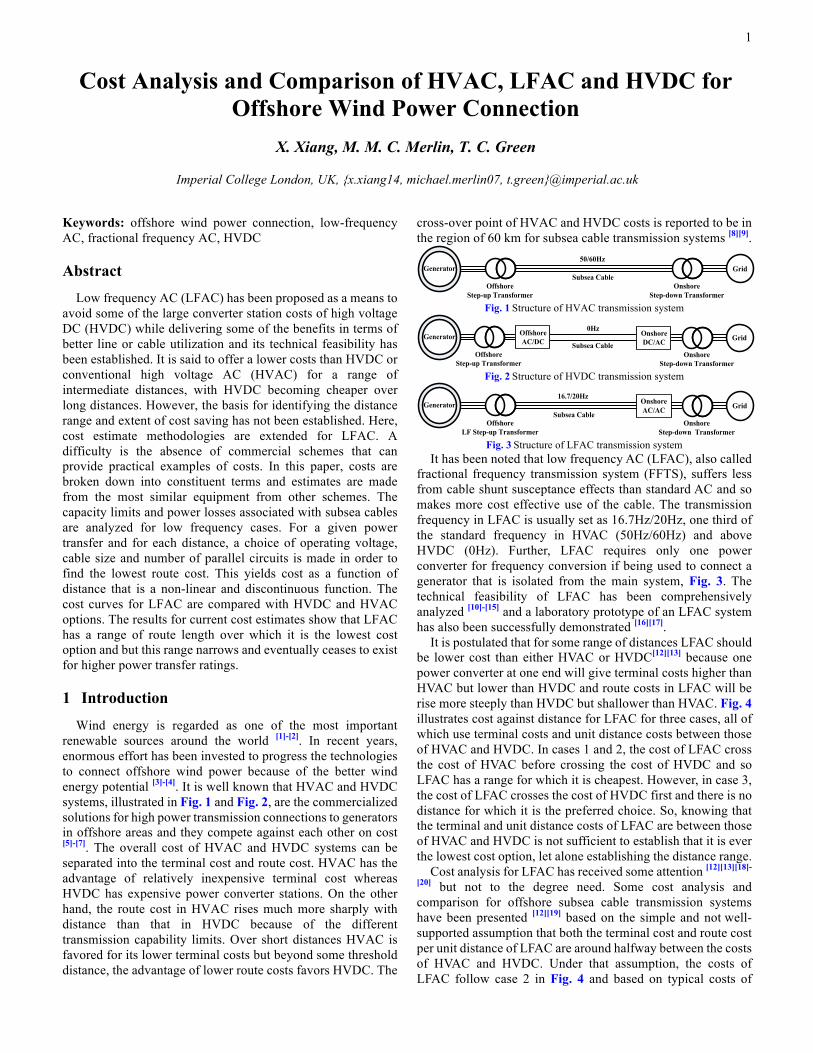
Wind energy is regarded as one of the most important renewable sources around the world [1]-[2]. In recent years, enormous effort has been invested to progress the technologies to connect offshore wind power because of the better wind energy potential [3]-[4]. It is well known that HVAC and HVDC systems, illustrated in Fig. 1 and Fig. 2, are the commercialized solutions for high power transmission connections to generators in offshore areas and they compete against each other on cost [5]-[7]. The overall cost of HVAC and HVDC systems can be separated into the terminal cost and route cost. HVAC has the advantage of relatively inexpensive terminal cost whereas HVDC has expensive power converter stations. On the other hand, the route cost in HVAC rises much more sharply with distance than that in HVDC because of the different transmission capability limits. Over short distances HVAC is favored for its lower terminal costs but beyond some threshold distance, the advantage of lower route costs favors HVDC. The
cross-over point of HVAC and HVDC costs is reported to be in the region of 60 km for subsea cable transmission systems [8][9].
Fig. 1 Structure of HVAC transmission system
Fig. 2 Structure of HVDC transmission system
Fig. 3 Structure of LFAC transmission system
It has been noted that low frequency AC (LFAC), also called fractional frequency transmission system (FFTS), suffers less from cable shunt susceptance effects than standard AC and so makes more cost effective use of the cable. The transmission frequency in LFAC is usually set as 16.7Hz/20Hz, one third of the standard frequency in HVAC (50Hz/60Hz) and above HVDC (0Hz). Further, LFAC requires only one power converter for frequency conversion if being used to connect a generator that is isolated from the main system, Fig. 3. The technical feasibility of LFAC has been comprehensively analyzed [10]-[15] and a laboratory prototype of an LFAC system has also been successfully demonstrated [16][17].
It is postulated that for some range of distances LFAC should be lower cost than either HVAC or HVDC[12][13] because one power converter at one end will give terminal costs higher than HVAC but lower than HVDC and route costs in LFAC will be rise more steeply than HVDC but shallower than HVAC. Fig. 4 illustrates cost against distance for LFAC for three cases, all of which use terminal costs and unit distance costs between those of HVAC and HVDC. In cases 1 and 2, the cost of LFAC cross the cost of HVAC before crossing the cost of HVDC and so LFAC has a range for which it is cheapest. However, in case 3, the cost of LFAC crosses the cost of HVDC first and there is no distance for which it is the preferred choice. So, knowing that the terminal and unit distance costs of LFAC are between those of HVAC and HVDC is not sufficient to establish that it is ever the lowest cost option, let alone establishing the distance range.
Cost analysis for LFAC has received some attention [12][13][18]-
[20] but not to the degree need. Some cost analysis and comparison for offshore subsea cable transmission systems have been presented [12][19] based on the simple and not well-supported assumption that both the terminal cost and route cost per unit distance of LFAC are around halfway between the costs of HVAC and HVDC. Under that assumption, the costs of LFAC follow case 2 in Fig. 4 and based on typical costs of
Offshore Step-up Transformer
50/60HzGridGenerator
Onshore Step-down Transformer
Subsea Cable
0HzOffshore AC/DC
Offshore Step-up Transformer
Grid
Onshore Step-down Transformer
OnshoreDC/AC
GeneratorSubsea Cable
Offshore LF Step-up Transformer
16.7/20HzGrid
Onshore
Step-down Transformer
OnshoreAC/AC
GeneratorSubsea Cable
Cost Analysis and Comparison of HVAC, LFAC and HVDC for Offshore Wind Power Connection
X. Xiang, M. M. C. Merlin, T. C. Green
Imperial College London, UK, {x.xiang14, michael.merlin07, t.green}@imperial.ac.uk

2
HVAC and HVDC, the cost-effective range for cable-based LFAC in an offshore wind application would be about 30km-150km. However, this simple approximation should be questioned since there are reasons to believe that the offshore platform for an LF transformer and an onshore AC/AC HV power converter would be greater than this mid-point. Meanwhile, although a cable operated at 16.7Hz requires less reactive current than at 50 Hz, the AC voltage waveform is subject to a peak/effective ratio underutilization compared to DC and so route costs are unlikely to be the midpoint either. Further, a simple constant cost per unit distance is known to be only an approximation of cost that is closer to being quadratic.
Fig. 4 Three basic possibilities Fig. 5 Relationships between different for LFAC cost kinds of costs
This paper sets out to analyze the costs of LFAC in enough detail to identify the cross-over points for its costs with HVAC and HVDC and to identify the cost-effective range of LFAC from the best available data. The cost estimation algorithm compares, for each distance, different choices of operating voltage and choices of numbers of parallel cables in order to meet the specified power transfer at minimum cost for that technology. This yields costs that are a non-linear and discontinuous function of distance. In Section 2, the major factors in cost analysis are outlined in general, and the cost-effective range comparison for cable-based offshore wind farms (COWF) connection is discussed in detail in Section 3, which is the main body of this paper. The conclusions are drawn in Section 4, and future work is illustrated in the last Section.
2 Major Factors in Cost Analysis
A comprehensive cost analysis for transmission routes is complex to conduct in detail in analytical form. It needs to take many factors into consideration, such as the capital cost, maintenance cost, power losses, equipment reliability and so on. For a new approach like LFAC, this analysis is more difficult to complete because there are no commercial LFAC projects that have established design limits and yielded cost data. To make this analysis feasible, some minor factors need be neglected and sources of cost data from comparable individual equipment items should be sought.
For HVAC and HVDC systems, several cost estimation methods have been reported [21]-[25] that can serve as a starting point for this analysis. Cost data suitable for use in these methods have been reported for some commercial transmission projects [8][9][26]-[28]. It is common to separate out the capital cost (CC) and the capitalized cost of power losses (LC) as the major factors within the overall system cost. Table I lists the costs of each of HVAC, HVDC and LFAC under the headings of CC and LC. These items will be analyzed in detail in next Sections.
Table I Main capital cost and power losses cost in HVAC, LFAC and HVDC CC LC HVAC
Offshore step-up transformer plant and platform (compound). Cables and compensation. Onshore step-down transformer plant and compound.
Offshore transformer losses. Cables losses. Onshore transformer losses.
LFAC
Offshore LF step-up transformer plant and platform (compound). Cables and compensation. Onshore AC/AC converter station plant including valves, transformers and filters.
Offshore LF transformer losses Cables losses. Onshore AC/AC converter losses.
HVDC
Offshore converter station plant and platform (compound) including valves, transformers and filters. Cables. Onshore converter station plant including valves, transformers and filters.
Offshore AC/DC converter losses. Cables losses. Onshore DC/AC converter losses.
3 Cost-effective Range Analysis
For subsea cable based offshore wind farms (COWF) connection, voltage-sourced converter HVDC (VSC-HVDC) is chosen as the DC option in this paper for analysis and comparison.
The overall cost (C) of a transmission system can be separated into CC and LC but also into the terminal cost (TC) which is independent of distance and route cost (RC) which is a function of distance. Fig. 5 illustrates this decomposition and a further decomposition into terminal capital cost (TCC), terminal losses cost (TLC), route capital cost (RCC) and route power losses cost (RLC). Interpreting Table I costs for COWF in terms of Fig. 5 yields that the TCC consists of the offshore platform and plant cost (OPPC) and onshore plant cost (OPC) and the RCC consists of the cable cost (CBC) and compensation cost (QC). The cost analysis of each part in Fig. 5 will be introduced in the following parts respectively.
3.1 Cost Analysis in HVAC and VSC-HVDC
The estimations for OPPC and OPC, (1)-(4), follow the empirical formulas in commercial projects report [26], and the relevant variable description and assumptions are summarized in Appendix A.1.
[1 ( 2)] ( ) 5 0.045HVAC HVAC T T T T ST TOPPC FC dc n fc pc n S S= + + − ⋅ + ⋅ ⋅ = + (1) 0.75130.02621HVAC TOPC S= (2)
[1 ( 2)] 25 0.11HVDC HVDC C C C SC TOPPC FC dc n c n S S= + + − ⋅ ⋅ ⋅ = + (3) 0.08148HVDC TOPC S= (4)
To calculate the cable cost and compensation cost in HVAC, cable transmission capability needs be analyzed first. In subsea cable transmission, parallel capacitive susceptance is the major parameter limiting active power transmission due to the close proximity of sea water. The reactive power, QC, produced by capacitive charging current, can be expressed as
2 2C n n cQ V f C lπ= ⋅ ⋅ (5) To provide more space for active power current and therefore
expand cable transmission capability, an economic option is to distribute compensation power evenly at both ends of cables. With this configuration, cable transmission capability, PC, could be given by (6), and the compensation cost in HVAC, QCHVAC, can be indicated as (7).
Distance
HVDC (0HZ)
HVAC (50/60Hz)LFAC 3C
ost
LFAC 2
LFAC 1
HVAC terminal
HVDC terminalHVAC route
HVDC route
LFAC terminal
LFAC route

3
2 2 2 2 2 2 21( ) ( 3 ) ( 2 )2 2C
C C off C n ssn n n cQP S Q S V I V f C lπ= − = − = ⋅ − ⋅ ⋅ ⋅ (6)
20.02 2HVAC off on n n cQC Q OFC Q ONC V f C lπ= ⋅ + ⋅ = ⋅ ⋅ ⋅ (7) The relevant parameters of some common cables in HVAC
are listed in Appendix Table I, and the cable cost in HVAC, CBCHVAC, can be calculated by
HVAC c c cCBC t l nc= ⋅ ⋅ (8) The cables cost in VSC-HVDC option have substantial
advantages over AC solutions (HVAC and LFAC), since DC voltage waveform is not subject to a peak/effective ratio underutilization. For the same cable physical conditions, the transmission capability ratio of DC cables to AC cables can be given by
max
max
2 2 2 2 2= 13 3 3
DC ndc ndc nac nac
AC nac nac nac nac
P V I V IP V I pf V I pf
−
−
⋅ ⋅= = ≈
⋅ ⋅ ⋅ ⋅ (9)
In (9), it can be seen that, for a given power transfer, DC option need only two polar cables while AC solutions need three. The cable cost in VSC-HVDC would be much smaller than that in AC options. If the reactive power and skin effect are taken into calculation, this advantage could be more distinct. The specific parameters of some common HVDC cables are listed in Appendix Table II, and (8) can be also used to calculate the cable cost in VSC-HVDC system.
With (1)-(4) (7) and (8), the main capital cost of HVAC and VSC-HVDC can be expressed as (10) and (11)
HVAC HVAC HVAC HVAC HVACCC OPPC OPC QC CBC= + + + 0.7513 25 0.045 0.02621 0.02 2T T n n c c c cS S V f C l t l ncπ= + + + ⋅ ⋅ ⋅ + ⋅ ⋅ (10)
HVDC HVDC HVDC HVDCCC OPPC OPC CBC= + + 25 0.11 0.08148T T c c cS S t l nc= + + + ⋅ ⋅ (11) The power losses cost (LC) in transmission system is an
accumulative cost related to operation time, Top, and energy price, Eop. The terminal power losses cost, TLCHVAC, and route power losses cost, RLCHVAC, in HVAC are given by (12)-(14) [26]
(1 )offHVAC T offt op opTLC S pf T Eη δ= ⋅ ⋅ − ⋅ ⋅ ⋅ (12) 2
33
T offtHVAC c c c op op
c n
S pfRLC r l nc T E
nc V
ηδ
⎛ ⎞⋅ ⋅= ⋅ ⋅ ⋅ ⋅ ⋅⎜ ⎟⎜ ⎟⋅⎝ ⎠
(13)
2
[ 3 ] (1 )3
T offtonHVAC T offt c c c ont op op
c n
S pfTLC S pf r l nc T E
nc V
ηη η δ
⎛ ⎞⋅ ⋅= ⋅ ⋅ − ⋅ ⋅ ⋅ − ⋅ ⋅ ⋅⎜ ⎟⎜ ⎟⋅⎝ ⎠
(14)
Under the value assumptions in Appendix A.1, the power losses cost of HVAC, LCHVAC, can be simplified as (15). And with some adjustments for efficiency parameters, the power losses cost of VSC-HVDC are given by (16).
0.00911 1.51767HVAC offHVAC HVAC onHVAC TLC TLC RLC TLC S= + + = + ⋅ 2 2
0.994 0.9940.00911 [0.994 ]T T
c c c T c c cc n c n
S Sr l nc S r l ncnc V nc V
⎛ ⎞ ⎛ ⎞⋅ ⋅ + ⋅ − ⋅ ⋅⎜ ⎟ ⎜ ⎟
⋅ ⋅⎝ ⎠ ⎝ ⎠(15)
0.02610 3.03534HVDC offHVAC HVAC onHVAC TLC TLC RLC TLC S= + + = + ⋅ 2 2
0.9828 0.98280.02747 [0.9828 ]T T
c c c T c c cc n c n
S Sr l nc S r l ncnc V nc V
⎛ ⎞ ⎛ ⎞⋅ ⋅ + ⋅ − ⋅ ⋅⎜ ⎟ ⎜ ⎟
⋅ ⋅⎝ ⎠ ⎝ ⎠(16)
The overall cost of HVAC and VSC-HVDC can be obtained as (17) and (18)
0.75135 0.045 0.02621HVAC HVAC HVAC T T c c cC CC LC S S t l nc= + = + + + ⋅ ⋅
22 0.994
0.02 2 0.00911 1.51767 Tn n c T c c c
c n
SV f C l S r l ncnc V
π⎛ ⎞
+ ⋅ ⋅ ⋅ + + ⋅ ⋅ ⋅⎜ ⎟⋅⎝ ⎠
20.994
0.00911 [0.994 ]TT c c c
c n
SS r l ncnc V
⎛ ⎞+ ⋅ − ⋅ ⋅⎜ ⎟
⋅⎝ ⎠ (17)
25 0.11 0.08148 0.02610 3.03534HVDC T T c c c TC S S t l nc S= + + + ⋅ ⋅ + + ⋅ 2 2
0.9828 0.98280.02747 [0.9828 ]T T
c c c T c c cc n c n
S Sr l nc S r l ncnc V nc V
⎛ ⎞ ⎛ ⎞⋅ ⋅ + ⋅ − ⋅ ⋅⎜ ⎟ ⎜ ⎟
⋅ ⋅⎝ ⎠ ⎝ ⎠(18)
3.2 Cost Analysis in LFAC
Since there is still no commercial LFAC transmission to date, the offshore platform and plant cost, OPPCLFAC, onshore plant cost, OPCLFAC, power losses cost, LCLFAC, and cable parameters in LFAC need be made from the most similar equipment from HVAC and VSC-HVDC actual projects[21][24][26].
First of all, the LF step-up transformers, theoretically, should be three times larger of that in HVAC. But considering that the performance of many operation factors, such as heat dissipation, voltage isolation, system reliability and so on, could be improved with equipment volume increasing, the practical weight, volume and cost of this LF transformer could be decreased to about twice of the standard transformers at best condition[12][18][20][29], where the platform fixed cost keeps the same with HVAC situation, and the platform and plant variable costs increase to twice. Thus, the offshore platform and plant cost in LFAC, OPPCLFAC, can be estimated by
[1 ( 2)] (2 2 ) 5 0.09LFAC LFAC T T T T ST TOPPC FC dc n fc pc n S S= + + − ⋅ + ⋅ ⋅ = + (19) Secondly, the topologies of onshore AC/AC converter station
in LFAC could have several options, such as clycloconverter, back to back Modular Multilevel Converter (MMC), matrix converter and so on[13][30]-[33], but all of these topologies need more active switches and reactive components than their one DC/AC counterpart[13][33]. Thus, the lowest LFAC onshore plant cost and its power losses cost, would be not less than a LCC-HVDC onshore option. Its capital cost is given by (20)[21]
0.05926LFAC LCC HVDC TOPC OPC S−≥ = (20) Further, according to (5), it can be seen that the reactive
power produced by charging current is proportional to transmission frequency. As a result, the required offshore and onshore compensation power in LFAC will be theoretically one third of that in HVAC, and (7) can be still used for the compensation cost calculation in LFAC. Thanks to the one third charging current and lower skin effect, the cables in LFAC transmission could have stronger transmission capability than that in HVAC. The unit price of cable in LFAC is assumed to be same with HVAC. Based on the simulation and experimental data[12][16][18], the electrical parameters of some common cables in LFAC are presented in Appendix Table III, and (8) can also be used to estimate the cable cost in LFAC.
As for transformer power losses cost, despite the fact that the volume of LF transformer would be at least two times larger than standard one, the core losses per unit could be reduced thanks to the one third frequency. Based on the analysis in [34], the efficiency of LF transformer would be very close to standard transformer. Thus, the power losses cost of LFAC, LCLFAC, can be simplified as (21) with some efficient assumptions in Appendix A.1.
4
20.994
0.00911 1.51767 0.01331TLFAC T c c c
c n
SLC S r l ncnc V
⎛ ⎞= + ⋅ ⋅ ⋅ + ⋅⎜ ⎟
⋅⎝ ⎠
20.994
[0.994 ]TT c c c
c n
SS r l ncnc V
⎛ ⎞− ⋅ ⋅⎜ ⎟
⋅⎝ ⎠ (21)
Combining (7) (8) and (19)-(21), the overall cost of LFAC, CLFAC, can be written as (22)
225 0.09 0.05926 0.02 2LFAC T T n n c c c cC S S V f C l t l ncπ= + + + ⋅ ⋅ ⋅ + ⋅ ⋅ 2
0.9940.00911 1.51767 0.01331 [0.994T
T c c c Tc n
SS r l nc Snc V
⎛ ⎞+ + ⋅ ⋅ ⋅ + ⋅ −⎜ ⎟
⋅⎝ ⎠
20.994
]Tc c c
c n
S r l ncnc V
⎛ ⎞⋅ ⋅⎜ ⎟
⋅⎝ ⎠ (22)
3.3 Case Study for Lower Power Rating
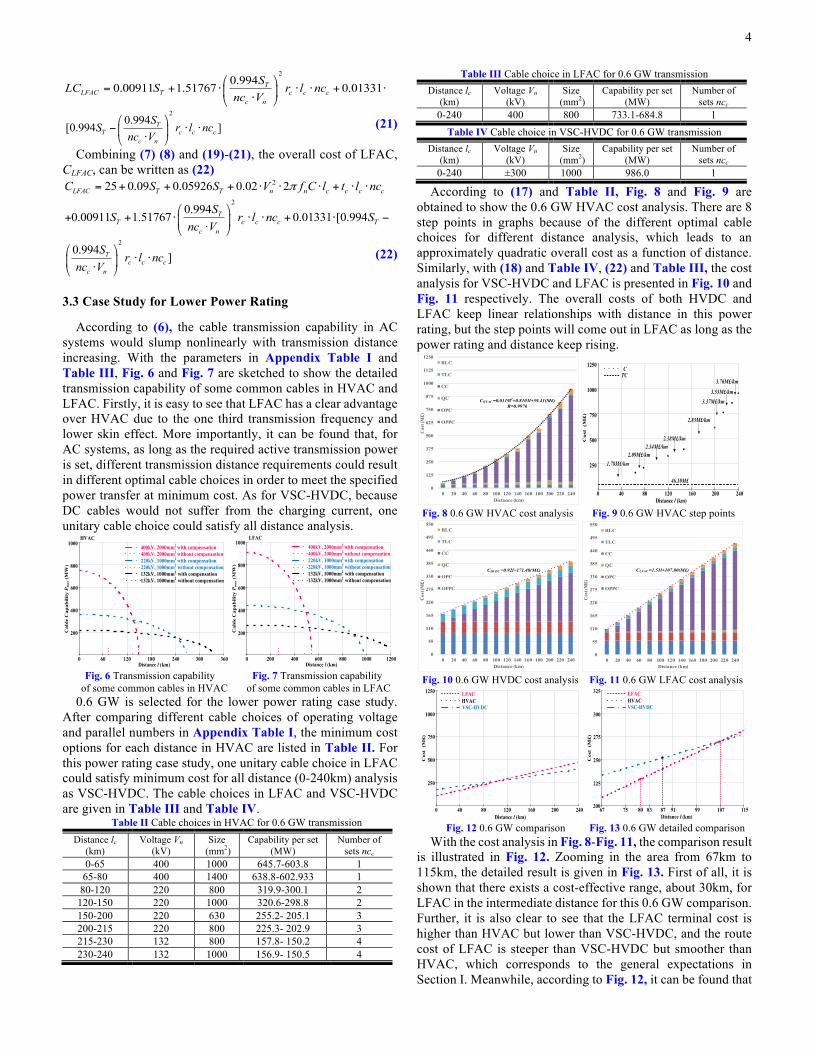
According to (6), the cable transmission capability in AC systems would slump nonlinearly with transmission distance increasing. With the parameters in Appendix Table I and Table III, Fig. 6 and Fig. 7 are sketched to show the detailed transmission capability of some common cables in HVAC and LFAC. Firstly, it is easy to see that LFAC has a clear advantage over HVAC due to the one third transmission frequency and lower skin effect. More importantly, it can be found that, for AC systems, as long as the required active transmission power is set, different transmission distance requirements could result in different optimal cable choices in order to meet the specified power transfer at minimum cost. As for VSC-HVDC, because DC cables would not suffer from the charging current, one unitary cable choice could satisfy all distance analysis.
Fig. 6 Transmission capability Fig. 7 Transmission capability of some common cables in HVAC of some common cables in LFAC
0.6 GW is selected for the lower power rating case study. After comparing different cable choices of operating voltage and parallel numbers in Appendix Table I, the minimum cost options for each distance in HVAC are listed in Table II. For this power rating case study, one unitary cable choice in LFAC could satisfy minimum cost for all distance (0-240km) analysis as VSC-HVDC. The cable choices in LFAC and VSC-HVDC are given in Table III and Table IV.
Table II Cable choices in HVAC for 0.6 GW transmission Distance lc
(km) Voltage Vn
(kV) Size
(mm2) Capability per set
(MW) Number of
sets ncc 0-65 400 1000 645.7-603.8 1
65-80 400 1400 638.8-602.933 1 80-120 220 800 319.9-300.1 2
120-150 220 1000 320.6-298.8 2 150-200 220 630 255.2- 205.1 3 200-215 220 800 225.3- 202.9 3 215-230 132 800 157.8- 150.2 4 230-240 132 1000 156.9- 150.5 4
Table III Cable choice in LFAC for 0.6 GW transmission Distance lc
(km) Voltage Vn
(kV) Size
(mm2) Capability per set
(MW) Number of
sets ncc 0-240 400 800 733.1-684.8 1
Table IV Cable choice in VSC-HVDC for 0.6 GW transmission Distance lc
(km) Voltage Vn
(kV) Size
(mm2) Capability per set
(MW) Number of
sets ncc 0-240 ±300 1000 986.0 1
According to (17) and Table II, Fig. 8 and Fig. 9 are obtained to show the 0.6 GW HVAC cost analysis. There are 8 step points in graphs because of the different optimal cable choices for different distance analysis, which leads to an approximately quadratic overall cost as a function of distance. Similarly, with (18) and Table IV, (22) and Table III, the cost analysis for VSC-HVDC and LFAC is presented in Fig. 10 and Fig. 11 respectively. The overall costs of both HVDC and LFAC keep linear relationships with distance in this power rating, but the step points will come out in LFAC as long as the power rating and distance keep rising.
Fig. 8 0.6 GW HVAC cost analysis Fig. 9 0.6 GW HVAC step points
Fig. 10 0.6 GW HVDC cost analysis Fig. 11 0.6 GW LFAC cost analysis
Fig. 12 0.6 GW comparison Fig. 13 0.6 GW detailed comparison
With the cost analysis in Fig. 8-Fig. 11, the comparison result is illustrated in Fig. 12. Zooming in the area from 67km to 115km, the detailed result is given in Fig. 13. First of all, it is shown that there exists a cost-effective range, about 30km, for LFAC in the intermediate distance for this 0.6 GW comparison. Further, it is also clear to see that the LFAC terminal cost is higher than HVAC but lower than VSC-HVDC, and the route cost of LFAC is steeper than VSC-HVDC but smoother than HVAC, which corresponds to the general expectations in Section I. Meanwhile, according to Fig. 12, it can be found that
Distance l (km)
Cab
le C
apab
ility
Pm
ax (
MW
)
HVAC
120 18060 240 300 3600
200
800
400
600
1000400kV, 2000mm2 with compensation400kV, 2000mm2 without compensation220kV, 1000mm2 with compensation220kV, 1000mm2 without compensation132kV, 1000mm2 with compensation132kV, 1000mm2 without compensation
LFAC400kV, 2000mm2 with compensation400kV, 2000mm2 without compensation220kV, 1000mm2 with compensation220kV, 1000mm2 without compensation132kV, 1000mm2 with compensation132kV, 1000mm2 without compensation
Distance l (km)
Cab
le C
apab
ility
Pm
ax (
MW
)
400 600200 800 1000 12000
200
800
400
600
1000
0
125
250
375
500
625
750
875
1000
1125
1250
0 20 40 60 80 100 120 140 160 180 200 220 240
Cos
t (M
£)
Distance (km)
RLC
TLC
CC
QC
OPC
OPPC
CHVAC =0.0119l2+0.8103l+59.41(M£)R=0.9976
CTC
46.10M£
1.78M£/km2.09M£/km
2.34M£/km2.38M£/km
2.83M£/km
3.37M£/km3.53M£/km3.76M£/km
Distance l (km)
Cos
t (
M£)
80 12040 160 200 2400
250
1000
500
750
1250
0
55
110
165
220
275
330
385
440
495
550
0 20 40 60 80 100 120 140 160 180 200 220 240
Cos
t (M
£)
Distance (km)
RLC
TLC
CC
QC
OPC
OPPC
CHVDC =0.92l+171.48(M£)
0
55
110
165
220
275
330
385
440
495
550
0 20 40 60 80 100 120 140 160 180 200 220 240
Cos
t (M
£)
Distance (km)
RLC
TLC
CC
QC
OPC
OPPC
CLFAC =1.51l+107.80(M£)
HVACVSC-HVDC
Distance l (km)
Cos
t (
M£)
LFAC
80 12040 160 200 2400
250
1000
500
750
1250
80
87
HVACVSC-HVDC
Distance l (km)
Cos
t (
M£)
LFAC
83 9175 99 107 115
225
300
250
275
325
67200

5
in this power rating, both the terminal cost and route cost per unit distance of LFAC approximately lie halfway between HVAC and VSC-HVDC when distance is shorter than 100km. The cross-over points of LFAC with HVAC and VSC-HVDC are 80km and 107km respectively, and VSC-HVDC and HVAC break-even point is 87km. The cost comparison result in this lower power case study is closest to case 2 in Fig. 4.
3.4. Case Study for Higher Power Rating
Fig. 14 1.4 GW HVAC cost analysis Fig. 15 1.4 GW HVAC step points
Fig. 16 1.4 GW HVDC cost analysis Fig. 17 1.4 GW LFAC cost analysis
Fig. 18 1.4 GW comparison Fig. 19 1.4 GW detailed comparison
In the higher power rating case study, 1.4 GW is chosen for detailed analysis. The individual cost analysis is sketched in Fig. 14-Fig. 17. It can be seen that the overall cost of HVAC still shows a nearly quadratic relationship with distance, and the first step point in LFAC appears when distance grows to 200km, making its overall cost become a non-linear function of distance as HVAC. With the results in Fig. 14-Fig. 17, Fig. 18 and Fig. 19 are obtained to illustrate the comparison results among these three options. It is shown that there is already no cost-effective range for LFAC in this 1.4 GW comparison. The terminal cost of LFAC is closer to VSC-HVDC but the route cost is more inclined to HVAC. The starting point of LFAC cost is near VSC-HVDC, but the cost rises sharply as HVAC with distance growing. According to Fig. 14- Fig. 17, this situation in LFAC can be explained by the expensive high power AC/AC converter station and LF transformer, which almost approach the terminal cost of VSC-HVDC, and the high cost AC cable structure is also just slightly lower than HVAC. In the higher
power and higher voltage comparison, DC cables shows more decisive advantages over AC options both in cable cost and transmission capability. The break-even point of HVAC and VSC-HVDC is about 70km. After this distance, DC seems to be the only option in these three options. Case 3 in Fig. 4 is the best hypothesis for the cost comparison result in this higher power rating case study.
4 Conclusion
In order to identify the cross-over points of LFAC costs with HVAC and HVDC and to explore the extent of LFAC cost-effective ranges, some cost estimate methodologies are extended in this paper to make the cost analysis and comparison for these three options more feasible and reliable.
The cost estimates for each constituent terms in LFAC are from the most similar equipment from HVAC and VSC-HVDC commercial projects, and thus it increases the reliability and accuracy of the final comparison results. Meanwhile, the cost estimation algorithm compares all common cable choices in order to guarantee the minimum cost for each distance analysis. A number of cost analysis and comparison results are presented in case studies. It indicates that LFAC has some cost-effective ranges between HVAC and HVDC thanks to the inherent benefits, but these ranges gradually narrows and eventually ceases to exist with transmission power increasing, since DC system could demonstrate more clear advantage over AC options in the higher power higher voltage transmission. In addition, the results also show that, with different conductor choices for different range analysis, the overall cost of AC system is developed as a quadratic relationship with distance rather than the simple linear one.
Appendix
A.1 Assumptions List Variable Description Assumption Value FCHVAC HVAC offshore transformer platform fixed cost 5M£ dc Cost factor for a different number (≥2) of transformers, converters 0.2 nT, nC Number of transformers, converters per offshore platform 2 fcT HVAC offshore transformer platform variable cost 0.020 M£/MVA pcT HVAC offshore transformer plant variable cost 0.025 M£/MVA fn Transmission frequency lc,lo Cable, OHL transmission distance SST HVAC single transformer power rating ST Transmission power rating Qoff, Qon Offshore, onshore compensation power ncc,nco Number of cable, OHL parallel circuits OFC Offshore compensation cost per unit 0.025 M£/MVAr ONC Onshore compensation cost per unit 0.015M£/MVAr Vndc, Indc DC cable nominal voltage, current Vnac, Inac AC cable nominal voltage, current pf Power factor 1 ηofft, ηont Efficiency of HVAC offshore, onshore transformers 99.4% Top Total operation hours 365×24×15 δ Loss load factor 0.231 Eop Energy price per unit 50 £/MWh FCHVAC VSC-HVDC offshore converter station platform fixed cost 25 M£ cC VSC-HVDC offshore converter station variable cost 0.11 M£/MVA SSC VSC-HVDC single converter power rating ηoffr Efficiency of VSC-HVDC offshore rectifier station 98.28%
ηoni Efficiency of VSC-HVDC onshore inverter station 98.19% ηonLCC Efficiency of LCC-HVDC onshore inverter station 99.12%
ηonacac Efficiency of LFAC onshore AC/AC converter station 99.12%
0
250
500
750
1000
1250
1500
1750
2000
2250
2500
0 20 40 60 80 100 120 140 160 180 200 220 240
Cos
t (M
£)
Distance (km)
RLC
TLC
CC
QC
OPC
OPPC
CHVAC =0.0306l2+0.9835l+165.8(M£)R=0.9945
CTC
99.49M£
4.53M£/km4.72M£/km
5.03M£/km
5.23M£/km5.51M£/km5.60M£/km
6.47M£/km
7.45M£/km
8.44M£/km8.73M£/km
Distance l (km)
Cos
t (
M£)
80 12040 160 200 2400
500
2000
1000
1500
2500
0
125
250
375
500
625
750
875
1000
1125
1250
0 20 40 60 80 100 120 140 160 180 200 220 240
Cos
t (M
£)
Distance (km)
RLC
TLC
CC
QC
OPC
OPPCCHVDC =1.36l+366.78(M£)
0
125
250
375
500
625
750
875
1000
1125
1250
0 20 40 60 80 100 120 140 160 180 200 220 240
Cos
t (M
£)
Distance (km)
RLC
TLC
CC
QC
OPC
OPPC
CLFAC1 =3.08l+244.88(M£)
CLFAC2 =3.35l+244.88(M£)
HVACVSC-HVDC
Distance l (km)
Cos
t (
M£)
LFAC
80 12040 160 200 2400
500
2000
1000
1500
2500
71
7473
HVACVSC-HVDC
Distance l (km)
Cos
t (
M£)
LFAC
72 7569 160 200 24066
445
505
465
485
525
425

6
A.2 Cable Parameters [26] Appendix Table I Electrical parameters of some common cables in HVAC
Voltage (kV)
Size (mm2)
Resistance (mΩ/km) Capacitance
C (nF/km)
Steady state rating
Cable cost per set
tc (k£/km)
Voltage Vn (kV)
Size (mm2)
Resistance rc (mΩ/km)
Steady state current Issn (A)
132
630 39.5 209 818 685 800 32.4 217 888 795
1000 27.5 238 949 860
220
500 48.9 136 732 815 630 39.1 151 808 850 800 31.9 163 879 975
1000 27.0 177 942 1000
400
800 31.4 130 870 1400 1000 26.5 140 932 1550 1200 22.1 170 986 1700 1400 18.9 180 1015 1850 1600 16.6 190 1036 2000 2000 13.2 200 1078 2150
Appendix Table II Electrical parameters of some common VSC-HVDC cables Voltage Vn (kV)
Size (mm2)
Resistance rc (mΩ/km)
Steady state rating (MVA)
Cables cost per set tc (k£/km)
Steady state current Issn (A)
±150
1000 22.4 1644 670 1200 19.2 1791 730 1400 16.5 1962 785 1600 14.4 2123 840 2000 11.5 2407 900
±300
1000 22.4 1644 855 1200 19.2 1791 940 1400 16.5 1962 1015 1600 14.4 2123 1090 2000 11.5 2407 1175
Appendix Table III Electrical parameters of some common cables in LFAC
Voltage (kV)
Size (mm2)
Resistance (mΩ/km) Capacitance
C (nF/km)
Steady state rating
Cable cost per set
tc (k£/km)
Voltage Vn (kV)
Size (mm2)
Resistance rc (mΩ/km)
Steady state current Issn (A)
132
630 26.2 209 995 685 800 21.5 217 1080 795
1000 18.2 238 1154 860
220
500 32.4 136 890 815 630 25.9 151 982 850 800 21.1 163 1069 975
1000 17.9 177 1145 1000
400
800 20.8 130 1058 1400 1000 17.5 140 1133 1550 1200 14.6 170 1199 1700 1400 12.5 180 1234 1850 1600 11.0 190 1260 2000 2000 8.7 200 1310 2150
References [1] Global Wind Energy Outlook, 2014 [Online]. Available:
http://www.gwec.net/wp-content/uploads/2014/10/GWEO2014_WEB.pdf [2] T. Ackermann, Wind Power in Power Systems, 2nd ed., 2012. [3] M. Liserre, R. Cárdenas, M. Molinas, and J. Rodríguez, “Overview of
multi-MW wind turbines and wind parks,” IEEE Trans. Ind. Electron., vol. 58, no. 4, pp. 1081–1095, Apr. 2011.
[4] X. Yang, Y. Song, G. Wang, and M. Wang, “A comprehensive review on the development of sustainable energy strategy and implementation in China,” IEEE Trans. Sustain. Energy, vol. 1, no. 2, pp. 57–65, Jul. 2010.
[5] S.Rao, EHV-AC, HVDC Transmission and Distribution Engineering, 1st ed., Khanna Publishers, 2013.
[6] M. Aredes, R. Dias, A. Aquino, C. Portela, and E. Watanabe, “Going the distance,” IEEE Ind. Electron. Mag., vol. 5, no. 1, pp. 36–48, Mar. 2011.
[7] S. Cole and R. Belmans, “Transmission of bulk power,” IEEE Ind. Electron. Mag., vol. 3, no. 3, pp. 19–24, Sep. 2009.
[8] M. Bahrman, B. Johnson, “The ABCs of HVDC transmission technologies,” IEEE Power Energy Mag., vol. 5, no. 2, pp. 32–44, Mar 2007.
[9] Alstom Grid, HVDC: Connecting to the Future, Alstom Publishers, 2010. [10] X. Wang, X. Wang, “Feasibility study of fractional frequency transmission
system,” IEEE Trans. Power Syst., vol. 11, no. 2, pp. 962–967, May 1996. [11] T. Funaki, K. Matsuura, “Feasibility of the low frequency AC
transmission,” in Proc. IEEE Winter Meeting’00, 2000, pp. 2693–2698. [12] A. Meliopoulos, D. Aliprantis, Y. Cho, H. Chen, “Low Frequency
Transmission for Wind Farm Power”, Tech. rep. for PSERC, Oct 2012. [13] J. Ruddy, R. Meere, T. O’Donnell, “Low Frequency AC transmission for
offshore wind power: A review”, Renew. Sustain. Energy Rev., vol. 56, pp. 75–86, Apr. 2016.
[14] T. Ngo, M. Lwin, and S. Santoso, “Steady-State Analysis and Performance of Low Frequency AC Transmission Lines,” IEEE Trans. Power Syst., pp. 1-8, 2015.
[15] H. Chen, M. Johnson, and D. Aliprantis, “Low-frequency ac transmission for offshore wind power,” IEEE Trans. Power Del., vol. 28, no. 4, pp. 2236–2244, Oct. 2013.
[16] X. Wang, C. Cao, and Z. Zhou , “Experiment on fractional frequency transmission system,” IEEE Trans. Power Syst., vol. 21, no. 1, pp. 372–377, Feb. 2006.
[17] X. Wang, X. Wei, Y. Meng, “Experiment on Grid-Connection Process of Wind Turbines in Fractional Frequency Wind Power System”. IEEE Trans. Energy Convers., vol. 30, no. 1, pp. 22-31, March 2015.
[18] W. Fischer, R. Braun, and I. Erlich, “Low frequency high voltage offshore grid for transmission of renewable power,” in Proc. IEEE PES ISGT’12, 2012, pp. 1–6.
[19] N. Qin, S. You, Z. Xu, and V. Akhmatov, “Offshore wind farm connection with low frequency AC transmission technology,” in Proc. IEEE PES General Meeting’09, 2009, pp.1-8.
[20] X. Wang, Y. Teng, L. Ning, Y. Meng, Z. Xu. “Feasibility of integrating large wind farm via Fractional Frequency Transmission System a case study”, Int Trans Electr. Energy Syst., vol. 24, pp. 64–74, 2014.
[21] L. Lazaridis, “Economic comparison of HVAC and HVDC solutions for large offshore wind farms under special consideration of reliability,” Master thesis, Royal Institute of Technology, 2005.
[22] S. Lundberg, “Wind farm configuration and energy efficiency studies. Series DC versus AC layouts,” Ph.D. dissertation, Chalmers Univ. Technol., Dec. 2006.
[23] M. Parker, O. Anaya-Lara, “Cost and losses associated with offshore wind farm collection networks which centralise the turbine power electronic converters,” IET Renew. Power Gener. vol. 7, no. 4, pp. 390–400, 2013.
[24] M. Dicorato, G. Forte, M. Pisani, and M. Trovato, “Guidelines for assessment of investment cost for offshore wind generation,” Renew. Energy, vol. 36, no. 8, pp. 2043–2051, 2011.
[25] N. Negra, J. Todorovic, and T. Ackermann, “Loss evaluation of HVAC and HVDC transmission solutions for large offshore wind farms,” Electr. Power Syst. Res., vol. 76, no. 11, pp. 916–927, 2006.
[26] P. Djapic, G. Strbac, “Cost benefit methodology for optimal design of offshore transmission systems”, Tech. rep. for Berr, July, 2008.
[27] S. Krohn, P. Morthorst, S. Awerbuch, “The Economics of Wind Energy”, Tech. rep. from European Wind Energy Association (EWEA), Mar. 2009.
[28] ABB, “Middletown–Norwalk Transmission Project”, Tech. Rep., 2004. [29] P. Wyllie, Y. Tang, L. Ran, T. Yang, J. Yu. “Low Frequency AC
Transmission-Elements of a Design for Wind Farm Connection”, in Proc. IET ACDC’15, 2015, pp. 1–5.
[30] M. Glinka and R. Marquardt, “A new ac/ac multilevel converter family,” IEEE Trans. Ind. Electron., vol. 52, no. 3, pp. 662–669, Jun. 2005.
[31] Y. Miura, T. Mizutani, M. Ito, and T. Ise, “Modular multilevel matrix converter for low frequency ac transmission,” in Proc. IEEE PEDS’13, 2013, pp. 1079–1084.
[32] H. Akagi, “Classification, terminology, and application of the modular multilevel cascade converter (MMCC),” IEEE Trans. Power Electronics, vol. 26, no.11, pp. 3119-3130. Nov 2011.
[33] I. Erlich, F. Shewarega, H. Wrede and W. Fischer, “Low frequency AC for offshore wind power transmission–prospects and challenges,” in Proc. IET ACDC’15, 2015, pp. 1–7.
[34] T. Luth, M. Merlin, T. Green, F. Hassan, and C. Barker, “High-frequency operation of a dc/ac/dc system for hvdc applications,” IEEE Trans. Power Electron., vol. 29, no. 8, pp. 4107–4115, Aug. 2014.


![Damping the Oscillation in an HVDC/HVAC System with a ...research.iaun.ac.ir/pd/moradian/pdfs/PaperC_3309.pdf · parallel-connected HVAC and HVDC systems [1]. This model is based](https://img.pdfslide.net/doc/110x75/5ae9b7d37f8b9a585f8b663c/damping-the-oscillation-in-an-hvdchvac-system-with-a-hvac-and-hvdc-systems.jpg)


![416-2012 LFAC 4th Report (Cover) (Original) reports/LFAC/LFAC-4.pdf · ]Xnaq∂mw tIcf \nbak` tem°¬ ^≠v A°u≠vkv IΩn‰n (2011-2014) \memaXv dnt∏m¿´v (2012 am¿®v amkw](https://img.pdfslide.net/doc/110x75/5fd6781ee1ce832c3b5ce2db/416-2012-lfac-4th-report-cover-original-reportslfaclfac-4pdf-xnaqamw.jpg)