Embed Size (px)
Citation preview
Available online at www.ijapie.org
International journal of advanced production and industrial engineering
IJAPIE-2017-07-316, Vol 2 (3), 27-38
IJAPIE Connecting
Science & Technology withManagement.
A Journal for all
Products &Processes.
Cost Analysis With Improving Efficiency in Mechanical Kinetic Energy
Recovery System
Raghvendra Gautam*, Vipin Khandelwal, Vipul Nigam, Vivek Gemini , Vivek Dev
( Delhi Technological University, Delhi, India)
*Email: [email protected]
| IJAPIE | ISSN: 2455–8419 | www.ijapie.org | Vol. 2 | Issue. 3 | 2017 | 27 |
Abstract : The main objective of this paper is to design a Flywheel Based Kinetic Energy Recovery System for storing the kinetic
energy of a vehicle otherwise lost during braking and transmitting this stored energy to the drive train when the vehicle accelerates.
The rising fuel prices along with increased CO2 and NOx emissions prompted us to look into this area of research. This paper
provides a basic structure of the system and a driver program for the whole system. This research also studies the energy feasibility,
improvement in fuel efficiency and cost feasibility of the whole system. DS Solidworks has been used for designing the model.
MATLAB has been used for formulation of plots on Fuel Consumption. The driver program has been formulated on JAVA.
Improvement in fuel efficiency has been calculated for a drive cycle for Pune City.
Keywords : Flywheel Based Kinetic Energy Recovery System, Energy Feasibility, Improvement In Fuel Efficiency, Cost
Feasibility, Drive Cycle, Control System.
List of symbols :
m Mass of flywheel
I Moment of Inertia of Flywheel
r Radius of flywheel
ω Angular Velocity
v Peripheral Velocity
E Energy Stored In Flywheel
ρ Density of material of flywheel
ϭy Yield Strength Of flywheel
ϭh Hoop Stress in flywheel
M Mass of Vehicle
V Speed of Vehicle
Ev Energy of Vehicle
k Energy Coefficient
We Work done by Engine
Cf Calorific Value of fuel
mf Mass of fuel used
η Efficiency of Engine
D Diameter of flywheel
N Rotation Speed
T Thickness of flywheel
We Engine Work
I. MOTIVATION
Fossil fuels are consumed as a primary energy source in
transportation and industry. Currently, India consumes 4.16
million barrels of oil per day. Despite predictions that India
will exhaust its supply of oil in forty years, the demand is on
the increase, and is predicted to continue increasing, because
of the ever increasing population and demand for mobility.
The increasing demand of fuel to meet these needs inevitably
causes a rising of oil price [1].
India continued to increase its CO2 emissions to 2.47 billion
tonnes in 2015, which was 5.1% more than in 2014. This
growth rate is similar to the one observed for 2013 and 2007,
and a little below the average growth rate of 6.8% for the
2006–2015 period [2].
Price hike in fuel along with dwindling natural sources of
fossil fuels along with high Carbon Dioxide emissions are
reasons for adopting systems which save fuel in commercial
vehicles.
II. INTRODUCTION
Flywheel based Kinetic Energy Recovery Systems is a new
avenue in the vast field of Regenerative Braking.
Regenerative braking is the phenomena of storing the energy
(for reuse later) which is otherwise lost to the surrounding (in
the form of heat and sound) when brakes are applied [3].
The concept for the Flybrid flywheel Kinetic Energy
Recovery System (KERS) was originally developed by Jon
Hilton and his team when he was technical director of the
. Raghvendra Gautam et al.,
International Journal of Advanced Production and Industrial Engineering
| IJAPIE | ISSN: 2455–8419 | www.ijapie.org | Vol. 2 | Issue. 3 | 2017 | 28 |
engine division at Renault F1 in 2006. It is now being
brought to market by Silverstone based Flybrid Systems [4].
Every regenerative braking system requires 4 components.
1. An energy storage unit, i.e. flywheel.
2. A unit for engaging and disengaging the system with
main drive train, i.e. hydraulic clutch.
3. A governing unit to maintain a gradual supply of
energy during extraction, i.e. CVT.
4. A unit to monitor the whole system, i.e. control
system.
When brakes are applied in a car, kinetic energy of the
vehicle is dissipated in the heat energy produced in calipers
while braking. However, this kinetic energy of the vehicle
can be reused if a mechanism is provided to store this energy.
In a flywheel based KERS system, when the brake pedal is
pressed, a clutch engages with the flywheel system via a
CVT. The flywheel starts storing energy till it achieves a
constant rpm, this will reduce the speed of the vehicle and at
this point the flywheel gets disengaged from the drive train.
Now the calipers act and bring the car to rest. Now as the car
is idling, the flywheel rotates at a constant rpm.
When the brake pedal is released now, instead of coupling
with the engine, the drive train gets engaged to the flywheel
with the action of the friction clutch on the CVT.
The flywheel starts dissipating energy now, via the CVT to
clutch to the drive shaft. The flywheel dissipates energy and
its angular velocity keeps on decreasing. This decreasing
velocity can not be transferred to the axle directly. CVT
performs the function of a governor and provides a gradually
increasing energy supply to the drive shaft, hence driving the
car. Engine doesn’t put effort during this time and the
flywheel starts the car. This way engine work is reduced, and
fuel efficiency and mileage of the system increases [5,6].
Flywheel based systems have been used in Formula Cars
since 2009. Recently many transmission and gear box
manufacturers have started looking into this technology.
Torotrak, a UK based company has adopted this technology
and developed a system for buses, ships and other LMVs.
Their variation of this technology is called Flybrid and is now
being used in trucks manufactured by Ashok Leyland [7].
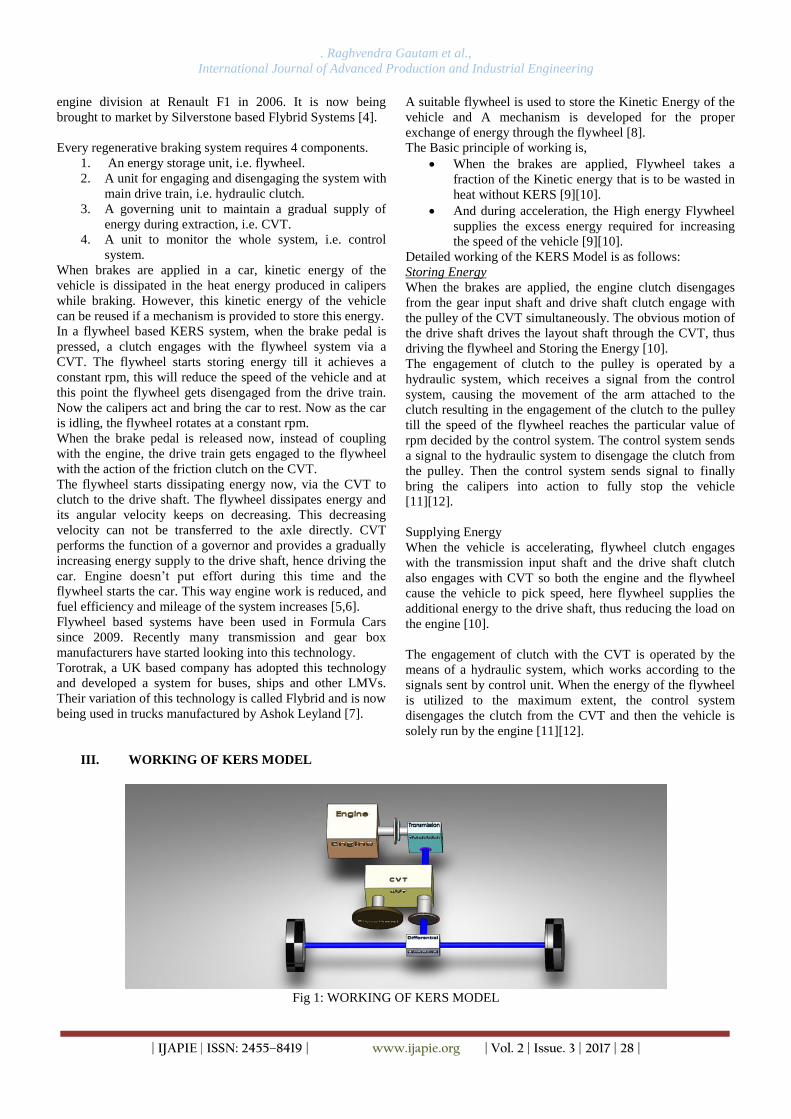
III. WORKING OF KERS MODEL
A suitable flywheel is used to store the Kinetic Energy of the
vehicle and A mechanism is developed for the proper
exchange of energy through the flywheel [8].
The Basic principle of working is,
When the brakes are applied, Flywheel takes a
fraction of the Kinetic energy that is to be wasted in
heat without KERS [9][10].
And during acceleration, the High energy Flywheel
supplies the excess energy required for increasing
the speed of the vehicle [9][10].
Detailed working of the KERS Model is as follows:
Storing Energy
When the brakes are applied, the engine clutch disengages
from the gear input shaft and drive shaft clutch engage with
the pulley of the CVT simultaneously. The obvious motion of
the drive shaft drives the layout shaft through the CVT, thus
driving the flywheel and Storing the Energy [10].
The engagement of clutch to the pulley is operated by a
hydraulic system, which receives a signal from the control
system, causing the movement of the arm attached to the
clutch resulting in the engagement of the clutch to the pulley
till the speed of the flywheel reaches the particular value of
rpm decided by the control system. The control system sends
a signal to the hydraulic system to disengage the clutch from
the pulley. Then the control system sends signal to finally
bring the calipers into action to fully stop the vehicle
[11][12].
Supplying Energy
When the vehicle is accelerating, flywheel clutch engages
with the transmission input shaft and the drive shaft clutch
also engages with CVT so both the engine and the flywheel
cause the vehicle to pick speed, here flywheel supplies the
additional energy to the drive shaft, thus reducing the load on
the engine [10].
The engagement of clutch with the CVT is operated by the
means of a hydraulic system, which works according to the
signals sent by control unit. When the energy of the flywheel
is utilized to the maximum extent, the control system
disengages the clutch from the CVT and then the vehicle is
solely run by the engine [11][12].
Fig 1: WORKING OF KERS MODEL

. Raghvendra Gautam et al.,
International Journal of Advanced Production and Industrial Engineering
| IJAPIE | ISSN: 2455–8419 | www.ijapie.org | Vol. 2 | Issue. 3 | 2017 | 29 |
IV. ANALYSIS
1. The Flywheel is an energy storage device.
2. It stores energy in the form of kinetic energy.
3. It can store this energy without dissipation
because of its large inertia.
Ideally if a flywheel were made of rigid, incompressible,
non-deforming material it could store an infinite amount of
kinetic energy. This cannot be done in the actual case as
stresses are generated in the flywheel on rotation due to the
centrifugal force. These stresses deform the flywheel and
cause permanent failure when the hoop stress of flywheel
exceeds the yield strength of the flywheel.
Hoop Stress
Hoop stress is the circumferential stress induced in the
flywheel rim.
It is given by,
Ϭh=ρω2r
2 (i)
Or
Ϭh=ρv2 (ii)
Energy Stored in the Flywheel
The maximum energy that can be stored in the flywheel is
limited by the hoop stress exceeding beyond the yield
strength of material of flywheel.
Kinetic Energy stored in flywheel is given by,
E=⅟2 Iω2 (iii)
Now, technically speaking, Moment of Inertia I, depends on
moment of inertia of rim, hub and spokes of the flywheel.
Since, mass of flywheel is mostly concentrated on the rim,
the moment of inertia due to hubs and spokes can be
neglected.
Therefore, for the rim,
I=mr2 (iv)
Putting value of I in (iii)
E=⅟2mv2 (v)
And using (ii)
v2=Ϭh/ρ (vi)
E=⅟2mϬh/ρ (vii)
Factor Of Safety
Table 1: Materials
Material Name ρ
(gm/cc)
Ϭy(Mpa) Energy (kJ)
Aluminum 7075
T651
2.8 469 33.5m
Titanium Ti-6Al-4V,
STA
4.43 965 43.6m
Steel 4340, QT 7.7 1500 38.9m
AS4 carbo / epoxy 1.61 2111 262.2m
IM7 carbon / epoxy 1.61 2589 321.6m
IM9 carbon / epoxy 1.62 2993 369.5m
In normal operation and Flybrid Technology developed by
Torotrak, the permissible value of hoop stress is [13],
Ϭh= 0.40Ϭy (ix)
That is the factor of safety is kept 2.5 [13].
This is kept as such because if the factor of safety were to be
kept 1,
1. Flywheel would be on the verge of cracking and
peripheral velocity will be very high.
2. CVT will not be able to provide proper speed
reduction.
Therefore, from (viii) and (ix), Energy Stored in flywheel is
E=⅟2 m(0.40)(Ϭy/ρ) (x)
Now, therefore Energy stored in flywheel depends on the
material of flywheel and mass of flywheel.
Material of Flywheel
As can be seen from the equation for energy stored in the
flywheel, energy stored will be high for high Ϭy and low
density.
Table 1: Flywheel Material Properties [14]
The materials chosen for study are:-
1. Aluminum 7075 T651
2. Steel 4340, QT
3. AS4 carbon / epoxy
Mass Analysis
From (x) it can be seen that energy stored in flywheel is a
linear function with mass of flywheel and is directly
proportional to it, i.e. as mass of flywheel increases, energy
stored in flywheel increases.
E=km (xi)
Where k is a constant depending on the material of the
flywheel.
k=⅟2 (0.40)(Ϭy/ρ) (xii)
Case 1- No KERS used
Vehicle of mass, M reaches velocity, V in time, t.
All the energy of the vehicle is in the form of Kinetic Energy.
Ev=½MV2 (xiii)
There is only one source of energy, the engine.
We=η Cfmf (xiv)
Applying Energy Conservation,
Ev=We (xv)
Now, from (xiii), (xiv), (xv).
½MV2= η Cfmf (xvi)
And
mf=(½MV2)/ η Cf (xvii)
Case 2-KERS used
A vehicle of mass, M with a KERS system of mass, m
reaches velocity V in time, t. It starts from rest with
maximum permissible energy stored in flywheel.
All the energy in the vehicle is in the form of kinetic energy.
Ev=½(M+m)V2 (xviii)
There are 2 sources of energy powering the vehicle, the
engine and the KERS system.
E=km (xix)
We= η Cfmf (xx)
Applying Energy Conservation,
Ev=We+E (xxi)
Now, from (xix), (xx), (xxi)
½(M+m)V2-km= η Cfmf (xxii)
. Raghvendra Gautam et al.,
International Journal of Advanced Production and Industrial Engineering
| IJAPIE | ISSN: 2455–8419 | www.ijapie.org | Vol. 2 | Issue. 3 | 2017 | 30 |
And
mf=[m{(V2/2)-k}+ ½MV
2]/ η Cf (xxiii)
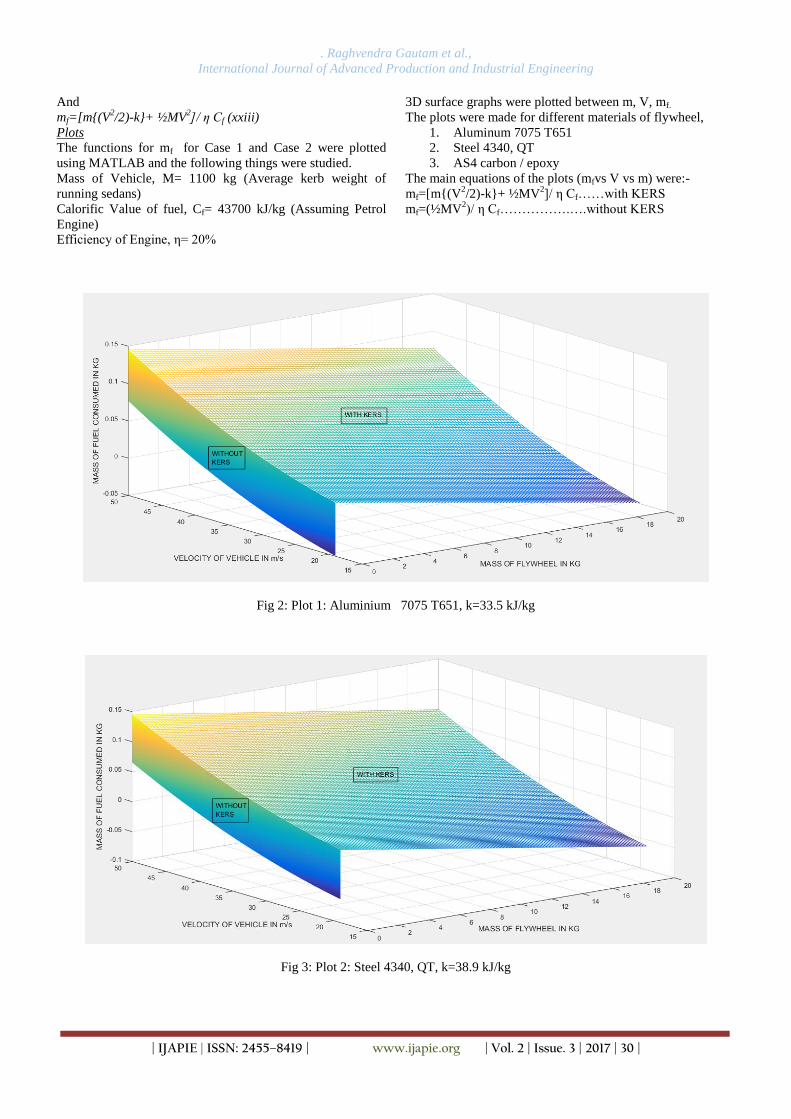
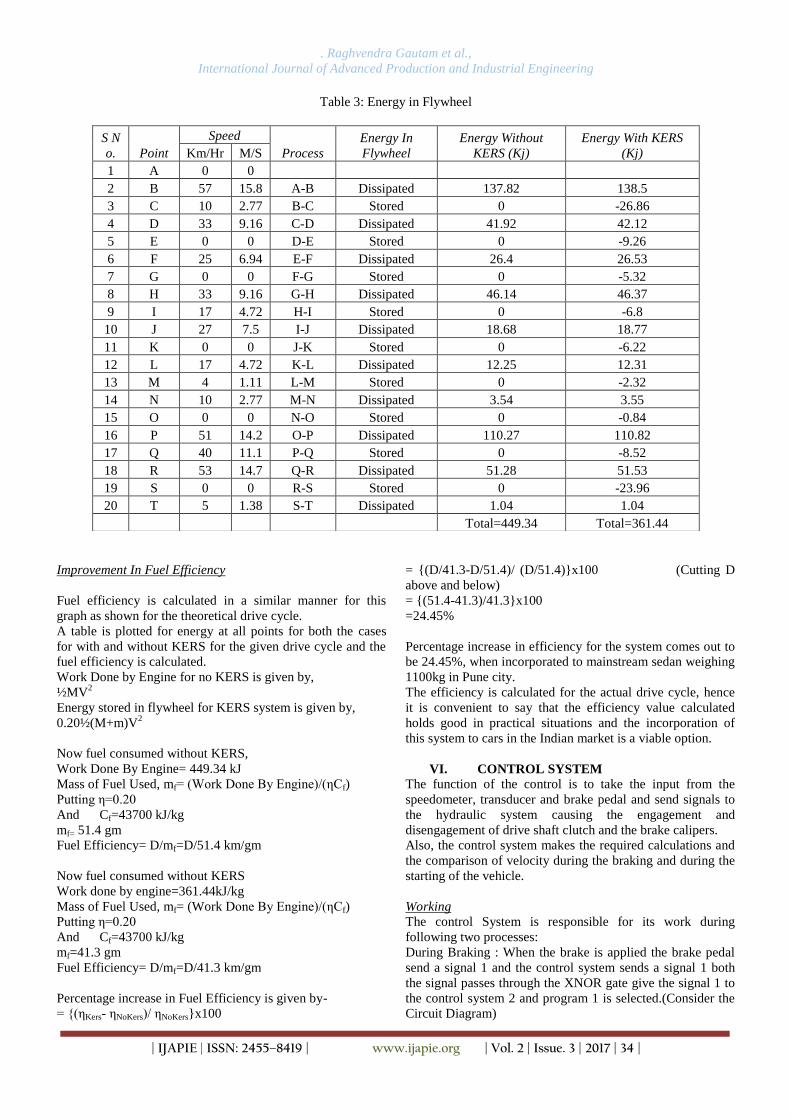
Plots
The functions for mf for Case 1 and Case 2 were plotted
using MATLAB and the following things were studied.
Mass of Vehicle, M= 1100 kg (Average kerb weight of
running sedans)
Calorific Value of fuel, Cf= 43700 kJ/kg (Assuming Petrol
Engine)
Efficiency of Engine, η= 20%
3D surface graphs were plotted between m, V, mf.
The plots were made for different materials of flywheel,
1. Aluminum 7075 T651
2. Steel 4340, QT
3. AS4 carbon / epoxy
The main equations of the plots (mfvs V vs m) were:-
mf=[m{(V2/2)-k}+ ½MV
2]/ η Cf……with KERS
mf=(½MV2)/ η Cf…………….….without KERS
Fig 2: Plot 1: Aluminium 7075 T651, k=33.5 kJ/kg
Fig 3: Plot 2: Steel 4340, QT, k=38.9 kJ/kg

. Raghvendra Gautam et al.,
International Journal of Advanced Production and Industrial Engineering
| IJAPIE | ISSN: 2455–8419 | www.ijapie.org | Vol. 2 | Issue. 3 | 2017 | 31 |
Fig 4: Plot 3: AS4 Carbon/Epoxy, k=262.2 kJ/kg
The WITH KERS surface for mf has a negative slope with
respect to mass of flywheel.
Hence, as mass of flywheel increases, fuel consumption
decreases, this is because energy stored in flywheel is directly
proportional to its mass.
Mass of flywheel cannot be more than 10kg, as force
required by clutch to press against the CVT will have to be
larger than 50kgwt to make this flywheel move. This is not
possible as the force applied on pedal by human multiplied
by mechanical advantage of a oil ram system, will have to be
larger than 50kgwt. A man can apply maximum force on
pedal equal to half his weight and the average weight of an
Indian driver is 80kg. Hence, he can only apply 40kgwt force
[15].
Hence, the weight of the flywheel is to be so selected such
that, force required to actuate clutch is small for the drivers
comfort, the flywheel energy is also sufficient, axial loads are
small etc.
Our system is closest in design to the Flybrid manufactured
by Torotrak.
The Flybrid system has been successful in foreign markets
and has been safely applied to hybrid vehicles. The mass of
flywheel in the Flybrid was 6kg, which was decided after
taking into account all the above constraints [16].
Hence, the mass of the flywheel decided for our system is
6kg.
m=6kg
Plot 4: mass of fuel v/s speed for m= 6kg
Fig 5: Graph plotted for V
This graph was plotted for
V=19.08-50m/s
That is 68km/hr to 180km/hr
The range was so chosen as the maximum permissible energy
in a flywheel corresponds to 68km/hr vehicle speed and
180km/hr [17] is the top speed of mainstream Indian sedans.
Dimension Calculation
From (ix) and (vi)
v=(0.40Ϭy/ρ)½
(xxiv)
There is an upper limit on ω due to mechanical constraints on
CVT.
Maximum permissible ω for the CVT in place is 20,000rpm
[18].
v= πDN/60 (xxv)
D= 60v/ πN (xxvi)
Given N=20,000rpm
ρ=m/volume (xxvii)
Volume=πD2T/4 (xxviii)

. Raghvendra Gautam et al.,
International Journal of Advanced Production and Industrial Engineering
| IJAPIE | ISSN: 2455–8419 | www.ijapie.org | Vol. 2 | Issue. 3 | 2017 | 32 |
Table 2: Dimensions of Flywheel for materials
Name
of
Materi
al
Periph
eral
Velocit
y,v
(m/s)
Dens
ity
(kg/
m3)
mf
(k
g)
Volu
me of
Flywh
eel
(m3)
Diam
eter
(cm)
Thickn
ess
(cm)
Alumi
num
7075
T651
258.84 2800 6 0.002
14
24.7 4.7
Steel
4340,
QT
278.92 7700 6 0.000
77
26.6 1.3
AS4
carbon
/ epoxy
724.15 1610 6 0.003
72
69.1 0.99
From the table it can be seen that the diameter required for
AS4 Carbon is the largest and equal to about 70cm.
The KERS system to be used needs to be compact, as can be
seen from the design, the flywheel is in very compact
cohesion with the drive shaft, CVT.
Hence, it is not possible to accommodate a flywheel of 70cm
diameter in the KERS system, hence AS4 Carbon cannot be
used.
The materials, we have chosen for our KERS system are-
1. Aluminum 7075 T651
2. Steel 4340, QT
Energy Analysis
Energy analysis requires a step by step study of energy flow
in the system.
The following things need to be defined before proceeding
further.
Critical Speed, Vc- This is that speed of the vehicle which
gives it a Kinetic Energy equal to maximum kinetic energy
permissible in the flywheel.
½(M+m)Vc2=km (xxix)
Also, putting value of k
½(M+m)(0.20)Vc2=⅟2 m(0.40)(Ϭy/ρ) (xxx)
Therefore,
Vc= [2(Ϭy/ρ)m/(M+m)]0.5
(xxxi)
For Aluminium, it is 153.46 km/hr.
For Steel it is 165.37 km/hr
The KERS system works in the following manner.
Case 1- Vehicle starting from rest, no energy stored in the
flywheel.
The vehicle of mass, (M+m) starts from rest and engine does
work in bringing the vehicle to a velocity V.
Kinetic Energy of the car is given by,
½(M+m)V2 (xxxii)
Case 2- Vehicle undergoes braking and comes to rest.
Now some fraction of energy is stored in flywheel, and other
part is dissipated in the calipers.
This fraction is kept 20% of initial kinetic energy for given
Indian drive cycle for proper braking of the vehicle. This
fraction is altered by altering moment of inertia of drive train.
Hence, energy stored in flywheel due to braking is
0.20½(M+m)V2 (xxxiii)
Case 3-When vehicle starts from rest and reaches velocity V1,
with energy stored in the flywheel.
Energy stored in flywheel due to braking is
0.20½(M+m)V2 (xxxiv)
Now, final energy of vehicle,
½(M+m)V12= 0.20½(M+m)V
2+Engine Work
Engine Work is given by,
½(M+m)V12-0.20½(M+m)V
2 (xxxv)
Case 4-When vehicle is started from 0 and taken to a
velocity, V
And V>153.46 km/hr for Aluminium
And V>165.37 km/hr for Steel,
The energy stored in the flywheel on braking vehicle to 0 is
the maximum permissible energy in the flywheel and is given
by-
⅟2 m(0.40)(Ϭy/ρ) (xxxvi)
And is 201 kJ for Aluminium.
And is 233.4 kJ for Steel.
The rest of the excess energy is dissipated in the calipers,
while the energy in the flywheel is stored for the next
acceleration cycle.
Assumptions
1. There is no drag force.
2. Force due to rolling friction is negligible.
3. Clutch is always on full engagement.
4. No slip condition for clutch and CVT.
5. No mechanical losses.
6. No losses in the form of heat.
7. Engine is never switched off.
V. IMPROVEMENT IN FUEL EFFICIENCY
The main purpose of the Flywheel based KERS system is to
regenerate energy and use this to drive the vehicle. This will
help in improving the fuel efficiency of the vehicle.
Fuel Efficiency in automotive study is defined as how far a
vehicle can travel per unit of fuel. It is also called fuel
economy or mileage.
Fuel Efficiency/Mileage depends on the drive cycle of an
area.
Drive Cycle
Drive Cycle is the plot of vehicle speed vs time.
It gives the behavior of a vehicle in city roads.
A driver moves faster on open roads and has a lot of start
stop cycles in traffic congested areas.
A finite value of fuel efficiency cannot be derived for a given
vehicle. It always depends on the drive cycle [19].
Actual Drive Cycle
The drive cycle used is one given for Pune City. Pune city is
an important urban center in Maharashtra and a rapidly
growing metropolis of the country with highest two-wheelers.
With introduction of thousands of vehicles per month, the
traffic congestion in the city is increasing alarmingly. As a
consequence, average speeds on the city roads are greatly
impaired and range between 15 km/h and 35 km/h.
Extensive, time and speed data from five major roads
measuring approximately about 55 km from Pune city was
collected and the drive cycle plotted [20].

. Raghvendra Gautam et al.,
International Journal of Advanced Production and Industrial Engineering
| IJAPIE | ISSN: 2455–8419 | www.ijapie.org | Vol. 2 | Issue. 3 | 2017 | 33 |
Fig 6:Drive Cycle 1: Drive Cycle For Pune City [21]
Fig 7: Drive Cycle 2: Drive Cycle For Pune City With Area Under Study
The period taken for study of fuel efficiency is taken enclosed in the red area. From 751 to 1151 seconds on the drive cycle
plot.
Fig 8: Area under study
. Raghvendra Gautam et al.,
International Journal of Advanced Production and Industrial Engineering
| IJAPIE | ISSN: 2455–8419 | www.ijapie.org | Vol. 2 | Issue. 3 | 2017 | 34 |
Table 3: Energy in Flywheel
S N
o. Point
Speed
Process
Energy In
Flywheel
Energy Without
KERS (Kj)
Energy With KERS
(Kj) Km/Hr M/S
1 A 0 0
2 B 57 15.8 A-B Dissipated 137.82 138.5
3 C 10 2.77 B-C Stored 0 -26.86
4 D 33 9.16 C-D Dissipated 41.92 42.12
5 E 0 0 D-E Stored 0 -9.26
6 F 25 6.94 E-F Dissipated 26.4 26.53
7 G 0 0 F-G Stored 0 -5.32
8 H 33 9.16 G-H Dissipated 46.14 46.37
9 I 17 4.72 H-I Stored 0 -6.8
10 J 27 7.5 I-J Dissipated 18.68 18.77
11 K 0 0 J-K Stored 0 -6.22
12 L 17 4.72 K-L Dissipated 12.25 12.31
13 M 4 1.11 L-M Stored 0 -2.32
14 N 10 2.77 M-N Dissipated 3.54 3.55
15 O 0 0 N-O Stored 0 -0.84
16 P 51 14.2 O-P Dissipated 110.27 110.82
17 Q 40 11.1 P-Q Stored 0 -8.52
18 R 53 14.7 Q-R Dissipated 51.28 51.53
19 S 0 0 R-S Stored 0 -23.96
20 T 5 1.38 S-T Dissipated 1.04 1.04
Total=449.34 Total=361.44
Improvement In Fuel Efficiency
Fuel efficiency is calculated in a similar manner for this
graph as shown for the theoretical drive cycle.
A table is plotted for energy at all points for both the cases
for with and without KERS for the given drive cycle and the
fuel efficiency is calculated.
Work Done by Engine for no KERS is given by,
½MV2
Energy stored in flywheel for KERS system is given by,
0.20½(M+m)V2
Now fuel consumed without KERS,
Work Done By Engine= 449.34 kJ
Mass of Fuel Used, mf= (Work Done By Engine)/(ηCf)
Putting η=0.20
And Cf=43700 kJ/kg
mf= 51.4 gm
Fuel Efficiency= D/mf=D/51.4 km/gm
Now fuel consumed without KERS
Work done by engine=361.44kJ/kg
Mass of Fuel Used, mf= (Work Done By Engine)/(ηCf)
Putting η=0.20
And Cf=43700 kJ/kg
mf=41.3 gm
Fuel Efficiency= D/mf=D/41.3 km/gm
Percentage increase in Fuel Efficiency is given by-
= {(ηKers- ηNoKers)/ ηNoKers}x100
= {(D/41.3-D/51.4)/ (D/51.4)}x100 (Cutting D
above and below)
= {(51.4-41.3)/41.3}x100
=24.45%
Percentage increase in efficiency for the system comes out to
be 24.45%, when incorporated to mainstream sedan weighing
1100kg in Pune city.
The efficiency is calculated for the actual drive cycle, hence
it is convenient to say that the efficiency value calculated
holds good in practical situations and the incorporation of
this system to cars in the Indian market is a viable option.
VI. CONTROL SYSTEM
The function of the control is to take the input from the
speedometer, transducer and brake pedal and send signals to
the hydraulic system causing the engagement and
disengagement of drive shaft clutch and the brake calipers.
Also, the control system makes the required calculations and
the comparison of velocity during the braking and during the
starting of the vehicle.
Working
The control System is responsible for its work during
following two processes:
During Braking : When the brake is applied the brake pedal
send a signal 1 and the control system sends a signal 1 both
the signal passes through the XNOR gate give the signal 1 to
the control system 2 and program 1 is selected.(Consider the
Circuit Diagram)

. Raghvendra Gautam et al.,
International Journal of Advanced Production and Industrial Engineering
| IJAPIE | ISSN: 2455–8419 | www.ijapie.org | Vol. 2 | Issue. 3 | 2017 | 35 |
During Starting :When the brake pedal is released it give
signal 0 to the control system and control system 1 provide
signal 0 to the XNOR gate and XNOR gate gives signal 1 to
the control system 2 and the program 2 get selected.
Fig 9: Control System Logic Circuit
Diagram
During Braking
Case1: when the 20% of total energy is less than Emax
Fig 10: Control system during braking
Equation to be followed:
½mv2=½Iῳ
2 + energy dissipated in calipers
½Iῳ2 =0.20 ½mv
2
• When speed of the flywheel is less than that of
required speed as calculated by the control system
considering 20% of the total energy to be store in
the flywheel clutch remain engaged to the CVT.
• As the speed of the flywheel becomes equal to the
required speed the clutch get disengaged and
calipers comes into action to bring the vehicle to
rest.
Case2: when the 20% of total energy is more or equal to Emax
Fig 11: Control system during braking
• When the speed of the vehicle is such that the 20%
of the total energy is greater than Emax then flywheel
stored only Emax and remaining energy dissipated in
the calipers.
• So when speed of flywheel is less than the vmax i.e.
speed of flywheel when it stores Emax energy, clutch
remains engaged with CVT
• When the speed of flywheel becomes equals to
vmaxthe clutch gets disengaged from CVT.
During Starting
Fig 12: During release of brake

. Raghvendra Gautam et al.,
International Journal of Advanced Production and Industrial Engineering
| IJAPIE | ISSN: 2455–8419 | www.ijapie.org | Vol. 2 | Issue. 3 | 2017 | 36 |
• The flywheel will provide its energy to drive shaft
so that the vehicle can easily get started
• the clutch will remain engaged to the CVT till the
vehicle reach to required velocity VR which is equal
to the velocity of the vehicle when it utilizes the full
energy of the flywheel in accordance to the given
equation:
½Iῳ2 = ½mvR
2
Hence VR can be calculated.
• When the speed of the vehicle becomes equal to the
required velocity VR the clutch get disengaged from
the CVT and then the vehicle is solely run by the
engine only.
VIII. COST FEASIBILITY STUDY
Cost feasibility study is done to calculate the total cost of
KERS and the amount of money saved by using KERS
system. Cost study has been done into 3 stages-
1. Estimating the cost for the whole KERS system
assembly.
2. Estimating the Annual Saving in running cost of a
mainstream sedan in India.
Calculating the time of return of initial cost and the gain after
recovering initial cost of KERS.
Flywheel power and CO2 produced in an engine is also
studied.
Cost Estimation
Cost of buying and assembling of different parts of KERS
system is calculated. Components considered in cost
calculation are
1. Mechanical Components -Flywheel, linkages,
clutch, drive shaft, CVT/Torque Converter etc.
2. Electronic Components -Control system
components-Microprocessors, green boards,
Internal Circuitry, basic circuit
components(resistances, wires, capacitors, 3 pin
transformers)
3. Mounts and Casings -Steel mounts, flywheel
casing etc.
4. Bearings and Miscellaneous Components Cost-
Bearings, screws etc.
5. Assembly -Welding, Soldering, Logistics and
travel cost.
Table 4: Cost of Components [a,b,c]
S
No.
Component
group
Component Cost
in
rupees
Source
1 Mechanical Flywheel 4000 Instructables
Torque
converter 15075 Ebay
Clutch plate 3600 Amazon
Clutch cable 350 Local
Shaft 4400 Amazon
2 Electonics
Speed sensor 325 India Electricals
Microprocessor 500 Raspberry
3
Bearings Clutch release
bearings 450 Amazon
Shaft bearings 300 Local
4
Miscellaneous
and assembly Miscellaneous 15000 Logistics
Total cost 44000
Here the total cost of Flywheel Based KERS system comes
out to be Rs 44000.
Annual Saving In Running Cost
This data is collected by driving the cars in actual urban and
highway conditions in and around a typical Indian metro city.
This is calculated based on the assumption that the vehicle is
being driven for 1000km a month, 50% on highways and
50% on city roads. The cost of diesel is taken Rs65 and that
of petrol Rs 72 (the current price in Mumbai, Maharashtra)
Table 5: Petrol Cars Performance [d]
S
No.
Petrol cars City
mileage (kpl)
Highway
mileage (kpl)
Cost per
month (in Rs)
1 Tata Nano
15.1 20.6 5144
2 Maruti Alto
13.3 17.8 5177
3 Hyundai Eon
13.7 17.2 5211
4 Datson go
12.8 17.9 5442
5
Maruti
Wagon R 12.4 17 5161
6 Alto k10
14 17 5653
7 Hyundai i10
12 16.3 5460
9
Ford
Ecosport 1.0 11.8 17 5405
10
Maruti Swift
Petrol 12.6 17 4481
Table 6: Diesel Cars Performance [e]
S
No.
Diesel cars City
mileage (kpl)
Highway
mileage (kpl)
Cost per
month (in rs)
1 Hyundai Xcent 16.2 20.3 3561
2 Honda Amaze 15.2 20.8 3611
3 Chevrolet Beat 16 19.1 3703
4
Hyundai
Grand i10
15.4 19.6 3714
5 Tata Indigo 15.3 19.6 3724
6 Tata Indica 15.3 19.3 3757
7 Maruti Suzuki Swift Desire
14.6 19.8 3779
8 Nissan Micra 14.6 19.5 3812
9
Maruti Suzuki
Swift
14.6 19.5 3812
10 Ritz 14.6 19.3 3834
This additional data taken from UNEP concurs with the data
given by Maruti Suzuki India Limited.
Table 7: Average annual mileage of cars in 2 Cities [f]
City Cars (km)
Delhi 12804 +- 349
Vishakhapatnam 12199 +- 435

. Raghvendra Gautam et al.,
International Journal of Advanced Production and Industrial Engineering
| IJAPIE | ISSN: 2455–8419 | www.ijapie.org | Vol. 2 | Issue. 3 | 2017 | 37 |
From the data obtained,
Average running cost per month of petrol cars = Rs 5268.9
Average running cost per month in diesel cars = Rs 3730.7
Net average cost of cars = Rs 8999.6/2 = Rs 4500
So, this is the average monthly cost of a car in India.
Now, fuel efficiency of Car with KERS= 25%
So, amount of cost saved per month = 25% of
4500 = Rs 1125
Therefore by using the Flywheel based KERS system we can
save upto Rs 1125 per month.
Annual saving in running cost = Rs (1125)x(12) = Rs
13500
Return Over The Years
In this phase, the return period and savings on running cost
are calculated for KERS system car.
Graphs have been plotted for Cost versus time and final
difference in costs is calculated.
From cost estimation,
Total cost of assembling the system = Rs 44000
Extra price paid by the customer for a Flywheel KERS car =
Rs 44000
From annual reduction in running cost,
Amount saved annually as calculated above = Rs 13500
Time taken to recover the initial cost = Rs 44000/13500 =
3.25 years In India, a petrol car can be run for only 15 years according
to the Law laid down. This is done keeping in regard the
pollution emissions.
Hence, money saved over 15 years due to addition of KERS
based system is given by
(Total Time-Return Period)x(Annual Saving)
(15-3.25)x13500= Rs 158625
Here we compare the cost of car with time for a car with and
without KERS system
Taking the example of Maruti Suzuki Swift Dzire.
Initial price for petrol car = Rs 5.4 lakh
Fuel cost per month = Rs 4481
Engine oil cost for average of 5000 km = Rs 4000
For 1 month, as the car travel 1000 km, so monthly cost of
engine oil = Rs 4000÷5
Now a plot of graph between the cost and time will have the
equation,
Taking y axis for coat and X axis for months, then
y(X) = 540000 + 4481x + 4000x/5
Now if we install a KERS system in the car, then
Initial fixed cost = Rs 5.4 lakh + 44 thousand
Cost of fuel per month = Rs 3360.75
Now, if we install a KERS system then expenses of gear box
oil will add in the expenses
Therefore, for 1 month expenses of engine oil = Rs 2×
4000÷5
Equation is,
y(X) = 540000 + 44000 + 3360.75x + 2×4000x/5
Plotting a graph for the 2 curves will give the breaking point ,
after which KERS car will give profit to the customer.
Table 8: Flywheel Power v/s CO2 Produced [g] Flybrid Power (kw)
IC Engine Power (kw)
Amount of co2 in Grams per km
15 120 130
45 80 110
60 70 95
80 50 75
100 30 50
Fig 13: Plot 5: Rupees v/s Months plotted on MATLAB
From the car it can be seen that, time taken for return of
initial cost is 39.27 months, that is 3 years 3 months.
Savings in 15 years is 1.576 lakhs.
Amount of Pollutants Reduced By Using Flywheel Based
KERS
Taking the example of MARUTI SUZUKI WAGONR car
Average distance covered by car in 1 month = 1000km
Average mileage of car = 14.7kpl
Amount of petrol used = 1000/14.7 = 69.027 litre
Now fuel saved by using the KERS system = 25%of 68.027 =
17 litre
Now, 1 litre of petrol produce CO2 = 2.3kg
Amount of CO2 in 17 litre of petrol = 2.3 X 17 = 39.1kg
So this is the amount of CO2 that is reduced by using a
flywheel in Wagon R.
CONCLUSION
A lot of areas were studied under this topic. The main
headings were:
1. A model for the system was made on DS Solidworks.
The model was a basic block model, and it helped in
getting an in depth and deep knowledge of the
construction and working of the Flywheel based KERS
system.
2. An energy study and various analyses were done for
the system. Mass of the flywheel was calculated to be
6kgs after graph plot and study using MATLAB.

. Raghvendra Gautam et al.,
International Journal of Advanced Production and Industrial Engineering
| IJAPIE | ISSN: 2455–8419 | www.ijapie.org | Vol. 2 | Issue. 3 | 2017 | 38 |
Dimensioning was also done for the flywheel in this section.
An energy analysis was also done, for the different cases
arising while running this system. Fuel efficiency analysis
was done for a theoretical drive cycle and an actual drive
cycle for Pune City. Improvement in fuel efficiency due to
incorporation of the system came out to be 24.45%, a
substantial amount, advocating the addition of this system to
commercial vehicles in the Indian Subcontinent.
3. A control system was designed for the system for
monitoring the clutch actuation and governing the
whole system. A logic circuit diagram was made for
the control system and a driver program for the control
system was made on JAVA. Two programs were made,
one for the case of braking and the other for
accelerating after braking. The outputs are given and
the code has been attached as well.
4. Finally a cost study was done. In this the cost
feasibility of the system was confirmed. It was found
out that the system has an initial assembly cost of
Rs44000. This cost is gained back in 3.25 years by
saving on the running cost of fuel. Also, at the end of
15 years, the profit obtained was calculated to be
Rs157000, deeming this project a success.
REFERENCES
[1]Dunn, Candace. "U.S. Energy Information Administration - EIA
- Independent Statistics and Analysis." India is increasingly
dependent on imported fossil fuels as demand continues to rise -
Today in Energy - U.S. Energy Information Administration (EIA).
N.p., n.d. Web. 07 Jan. 2017.
[2]IEA. "CO2 Emissions from Fuel Combustion 2016." CO2
Emissions from Fuel Combustion (2016): 30-31. Web.
[3]Chibulka J., “Kinetic Energy Recovery system by means of
Flywheel Energy storage device,” Advanced Engineering, vol. 3,
issue 1, pp.27-38, 2009.
[4]Leggett, Dave. "Interview with Jon Hilton – Flybrid
Systems." ProActive Magazine. ProActive Magazine, 20 Aug. 2013.
Web. 07 Feb. 2017.
[5]Chicurel R., Lara P., “Control of a Hybrid Propulsion
System,”Instrumentation and Development, vol.3, issue 6, pp. 3-7,
2009.
[6]Berkel, Koos Van, Theo Hofman, Bas Vroemen, and Maarten
Steinbuch. "Optimal energy management for a flywheel-based
hybrid vehicle." Proceedings of the 2011 American Control
Conference (2011): 5255-256. Web.
[7]Deakin, Andrew J. "High performance and low CO2 from a
Flybrid® mechanical kinetic energy recovery
system." FlybridByTorotrak (2014): 4-5. Web.
[8]"Flywheel." Wikipedia. Wikimedia Foundation, 29 Mar. 2017.
Web. 07 Apr. 2017.
[9]Dholakiya Utsav , and Patel Mitesh. "Kinetic Energy Recovery
System." International Journal of Engineering Development and
Research ISSN: 2321 - 9939 Volume 3.Issue 4 (2015): 1029-033.
Print.
[10]Raj. "Kinetic Energy Recovery System – How it Works."
MechGuru. N.p., n.d. Web. Sept. & oct. 2016.
[11]Johnston, Valerie. "How a Hydraulic Clutch System Works."
YourMechanic Advice. N.p., 01 Dec. 2015. Web. 08 Sept. 2016.
[12]"Hydraulic Braking System (Automobile)." Whatwhenhow RSS.
N.p., n.d. Web. 8 Sept. 2016.
[13]Knichel, T. ”Durable and high torque flywheel based hybrid
systems for commercial vehicles.” 11th International CTI
Symposium, 2012.
[14]Hansen, James G.R., and David U. O'Kain. "An Assessment of
Flywheel High Power Energy Storage Technology for Hybrid
Vehicles." Oak Ridge National Laboratory (2011): 10-11. Web.
[15]Gillespie, T. D. Fundamentals of vehicle dynamics. Warrendale,
PA: Society of Automotive Engineers, 1992. Print.
[16]Hilton, J. Flywheel Hybrid as an alternative to Electric Vehicles.
ATZ Worldwide, April 2012, Volume 114
[17]"Speed limits in India." Wikipedia. Wikimedia Foundation, 20
Feb. 2017. Web. 22 Feb. 2017
[18]Hansen, James G.R., and David U. O'Kain. "An Assessment of
Flywheel High Power Energy Storage Technology for Hybrid
Vehicles." Oak Ridge National Laboratory (2011): 18-19. Web.
[19]Shah, Varsha , Patel Prateish, and Patel Sagar. "Measurement of
Real Time Drive Cycle for Indian Roads and Estimation of
Component Sizing for HEV using LABVIEW." World Academy of
Science, Engineering and Technology International Journal of
Computer, Electrical, Automation, Control and Information
Engineering 5.10 (2011): 1-2. Web.
[20Kamble, Sanghapriya H., Tom V. Mathew, and G. K. Sharma.
"Development of real-world driving cycle: Case study of Pune,
India." Central Institute of Road Transport, Pune, India.
Department of Civil Engineering, Indian Institute of Technology
Bombay (n.d.): 134-35. Web.
[21]Kamble, Sanghapriya H., Tom V. Mathew, and G. K. Sharma.
"Development of real-world driving cycle: Case study of Pune,
India." Central Institute of Road Transport, Pune, India.
Department of Civil Engineering, Indian Institute of Technology
Bombay (n.d.): 137. Web.
[22]"LUK Stock Car Clutch & Pressure Plate Unit-Toyota Innova
Type 4 (2014-2015)."Amazon.in: Car & Motorbike. N.p., n.d. Web.
22 Mar. 2017.
[23]"Clutch Release Bearing PRB-06." Amazon.in: Car &
Motorbike. N.p., n.d. Web. 22 Mar. 2017.
[24]"40 Series 1" Driver Driven Go Kart Torque Converter Kit
Manco Comet 203785,." EBay. N.p., n.d. Web. 22 Mar. 2017.
[25]Ghalla, Siddhant. "Top 10 fuel efficient petrol cars in
India." Autocar India. Autocar India, 21 May 2014. Web. 08 Feb.
2017.
[26]"Top 10 Fuel Efficient Diesel Cars in India." Autocar India.
N.p., n.d. Web. 22 Mar. 2017.
[27]Chandok, Rahul. "Three Cities' Study." New.unep.org. UNEP,
n.d. Web.
[28]Knichel, T. Durable and high torque flywheel based hybrid
systems for commercial vehicles. 11th International CTI
Symposium, 2012.