Embed Size (px)
Citation preview
Available online at www.ijapie.org
International Journal of Advanced
Production and Industrial Engineering
IJAPIE-SI-IDCM 602 (2017) 04–11
Special Issue on
INNOVATIVE DESIGN
&
COMPUTATIONAL
MODELLING
Analysis on Drag Reduction of Bluff Body using Dimples
Shabir Grover1,*
, B.B.Arora1, Vaibhav Khanna
1, Tushar Kaushik
1, Akhilesh Arora
1
1Department of Mechanical Engineering, Delhi Technological University, New Delhi-110042, India.
Email: [email protected]
| IJAPIE | ISSN: 2455–8419 | www.ijapie.org | Inn Des & Com Mod | Sp.Issue| 2017 | 4 |
Abstract : A comparative study based on numerical modelling of airflow over a smooth generic bluff body against a dimpled one
has been taken up in the present study using a reformed CFD FLUENT code. The investigation of flow is carried out using an Ahmed
body, 25 degrees rear slant with dimples incorporated on its top as well as rear slant surface with specifications, AR equal to 6.25,
and diameter (Ф) 25mm. The turbulent characteristics of the air stream were examined using the reliable two equation k-ɛ model.
For an enhanced study of adverse pressure gradients near surfaces, a non-equilibrium state was assumed for the wall interface. All
in all, the simulation results show that a drag reduction of 0.3% was obtained by employing dimples with elliptical profile.
Keywords: Reynolds number, Turbulent flow, Flow separation, Drag Coefficient, Dimples, Form Drag
I. INTRODUCTION
Nowadays, the rapid diminution of fossil fuels has posed a
tremendous challenge for designers and engineers working in
the automotive field to develop more fuel efficient vehicles.
Implementing modifications to the exterior form of the
vehicles has become paramount to decrease the drag force
acting on them thereby, minimizing fuel consumption and
maximizing efficiency.
Moreover, the ever increasing worries about ecological
concerns over the past two decades, as well as the recent
emergence of the energy crisis have accelerated this
endeavour of drag reduction.
It has been established that for a medium sized European car,
the aerodynamic drag force accounts for nearly 80% of the
total road resistance at a 100 km/hr cruise speed. [16]
[19]
Where is the non-dimensional drag coefficient; A is the
projected frontal area of the vehicle and ⍴ is the density of
the surrounding air and is the Drag force acting on the
body.
Drag reduction attained through controlling air flow effects
over a surface seems to be an answer to the above problems.
Experimentally, this procedure of drag reduction and the
development of the methods to control it were first carried
out. But due to the higher costs involved in fabrication of
wind tunnels and the inaccuracies achieved in similarity
matching, experimental methods are proving to be unfeasible.
Nowadays, the analysis of an engineering system relies
heavily on computer-based solution algorithms which utilize
numerical techniques to obtain approximate solutions for the
governing partial differential equations (PDE).
Computational fluid dynamics (CFD) has emerged as one
such essential tool, which is more than widely employed in
the automotive industry. Due to the massive advances in
computational power, the time and costs required to carry out
simulations have reduced significantly.
There has been several work carried out in the past for
drag reduction using both active and passive flow control
devices. Although, active flow devices have shown greater
improvement in efficiency and performance during all phases
of operation, but passive flow control devices have proved
themselves to be more desirable due to their greater
reliability, short profile and no external energy requirement.
Active flow control, on the other hand, involves addition of
energy or momentum to the system in a regulated manner and
has shown a tendency to increase the complexity and weight
of the system drastically.
One such passive method is the use of dimples as a means for
increasing surface roughness to reduce drag. Previous work
has shown that the total drag force experienced by a generic
bluff body is a combination of pressure drag and skin friction
drag in which the former predominates the latter. The
application of dimples on golf balls has shown that dimpled
golf balls have a lower coefficient of drag, than non-
dimpled ones, which is due to the delaying of the flow
separation at the rear end. Thus, the dimpled golf balls are
able to travel relatively longer distances. This favourable
reduction in drag is caused by the dimples on its surface
which “trip” the boundary layer to transition from laminar to
turbulent flow, whose mechanism is similar to vortex
generators. This happens because turbulent flow stays
attached for a longer period due to the greater component of
momentum in the direction of flow and this delays flow
separation. This delay in flow separation decreases form
Shabir Grover et al.,
International Journal of Advanced Production and Industrial Engineering
| IJAPIE | ISSN: 2455–8419 | www.ijapie.org | Inn Des & Com Mod | Sp.Issue| 2017 | 5 |
drag, which in turn leads to a decrease in the total drag force
acting on it. Total drag force is composed of form drag and
drag due to skin friction.
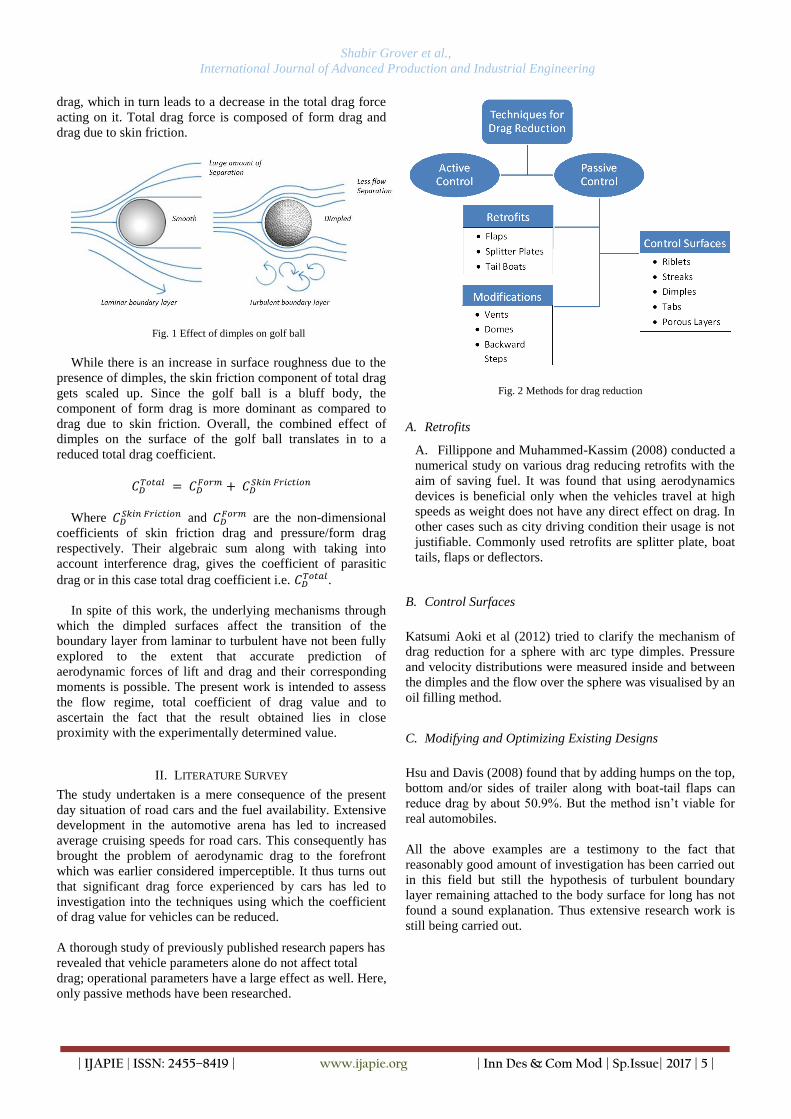
Fig. 1 Effect of dimples on golf ball
While there is an increase in surface roughness due to the
presence of dimples, the skin friction component of total drag
gets scaled up. Since the golf ball is a bluff body, the
component of form drag is more dominant as compared to
drag due to skin friction. Overall, the combined effect of
dimples on the surface of the golf ball translates in to a
reduced total drag coefficient.
Where and
are the non-dimensional
coefficients of skin friction drag and pressure/form drag
respectively. Their algebraic sum along with taking into
account interference drag, gives the coefficient of parasitic
drag or in this case total drag coefficient i.e. .
In spite of this work, the underlying mechanisms through
which the dimpled surfaces affect the transition of the
boundary layer from laminar to turbulent have not been fully
explored to the extent that accurate prediction of
aerodynamic forces of lift and drag and their corresponding
moments is possible. The present work is intended to assess
the flow regime, total coefficient of drag value and to
ascertain the fact that the result obtained lies in close
proximity with the experimentally determined value.
II. LITERATURE SURVEY
The study undertaken is a mere consequence of the present
day situation of road cars and the fuel availability. Extensive
development in the automotive arena has led to increased
average cruising speeds for road cars. This consequently has
brought the problem of aerodynamic drag to the forefront
which was earlier considered imperceptible. It thus turns out
that significant drag force experienced by cars has led to
investigation into the techniques using which the coefficient
of drag value for vehicles can be reduced.
A thorough study of previously published research papers has
revealed that vehicle parameters alone do not affect total
drag; operational parameters have a large effect as well. Here,
only passive methods have been researched.
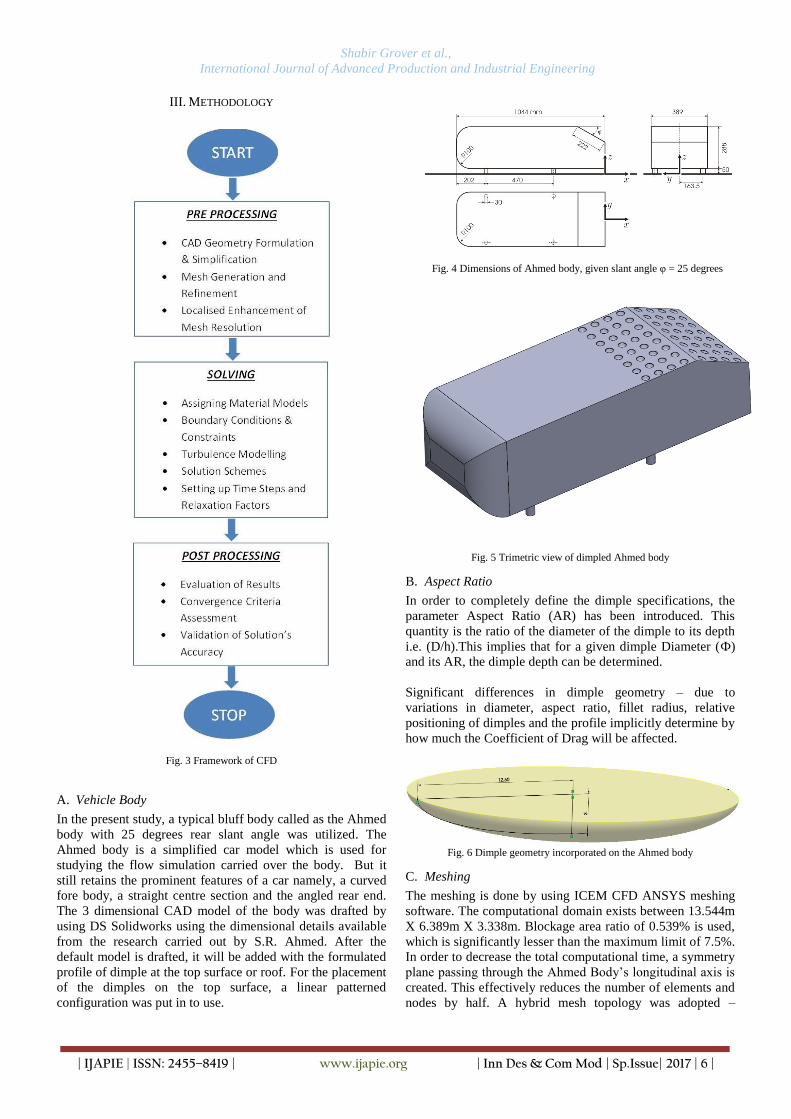
Fig. 2 Methods for drag reduction
A. Retrofits
A. Fillippone and Muhammed-Kassim (2008) conducted a
numerical study on various drag reducing retrofits with the
aim of saving fuel. It was found that using aerodynamics
devices is beneficial only when the vehicles travel at high
speeds as weight does not have any direct effect on drag. In
other cases such as city driving condition their usage is not
justifiable. Commonly used retrofits are splitter plate, boat
tails, flaps or deflectors.
B. Control Surfaces
Katsumi Aoki et al (2012) tried to clarify the mechanism of
drag reduction for a sphere with arc type dimples. Pressure
and velocity distributions were measured inside and between
the dimples and the flow over the sphere was visualised by an
oil filling method.
C. Modifying and Optimizing Existing Designs
Hsu and Davis (2008) found that by adding humps on the top,
bottom and/or sides of trailer along with boat-tail flaps can
reduce drag by about 50.9%. But the method isn’t viable for
real automobiles.
All the above examples are a testimony to the fact that
reasonably good amount of investigation has been carried out
in this field but still the hypothesis of turbulent boundary
layer remaining attached to the body surface for long has not
found a sound explanation. Thus extensive research work is
still being carried out.
Shabir Grover et al.,
International Journal of Advanced Production and Industrial Engineering
| IJAPIE | ISSN: 2455–8419 | www.ijapie.org | Inn Des & Com Mod | Sp.Issue| 2017 | 6 |
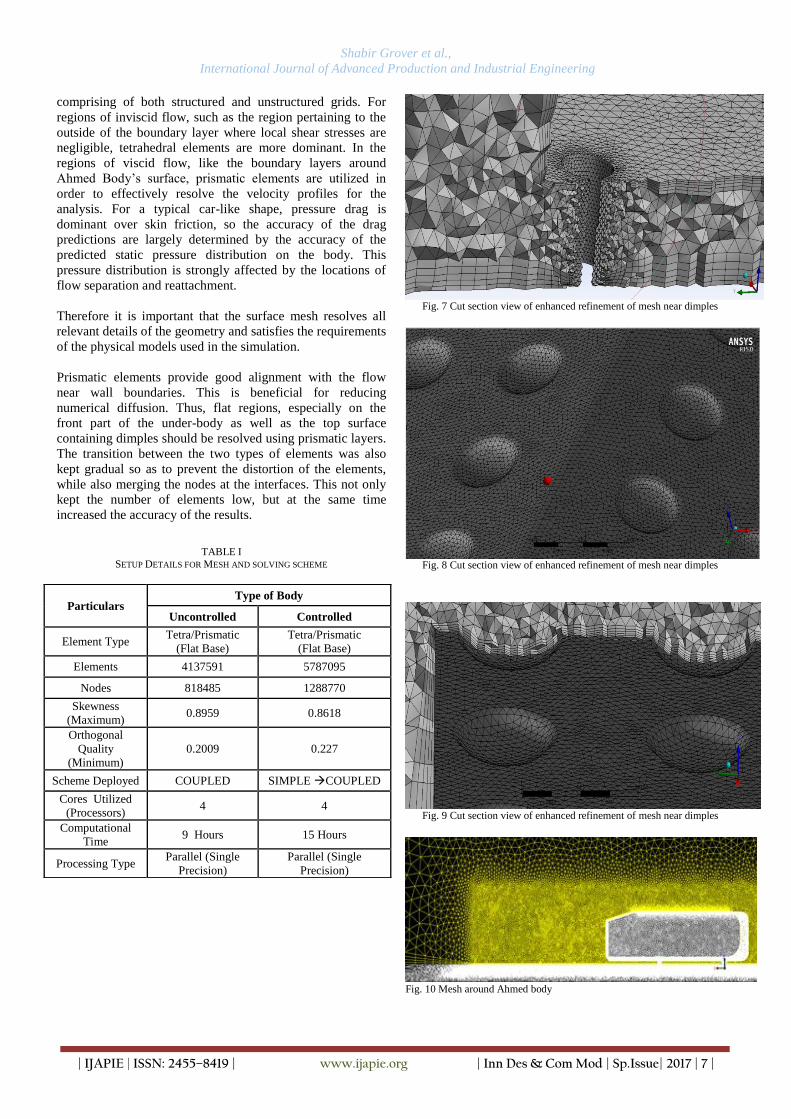
III. METHODOLOGY
Fig. 3 Framework of CFD
A. Vehicle Body
In the present study, a typical bluff body called as the Ahmed
body with 25 degrees rear slant angle was utilized. The
Ahmed body is a simplified car model which is used for
studying the flow simulation carried over the body. But it
still retains the prominent features of a car namely, a curved
fore body, a straight centre section and the angled rear end.
The 3 dimensional CAD model of the body was drafted by
using DS Solidworks using the dimensional details available
from the research carried out by S.R. Ahmed. After the
default model is drafted, it will be added with the formulated
profile of dimple at the top surface or roof. For the placement
of the dimples on the top surface, a linear patterned
configuration was put in to use.
Fig. 4 Dimensions of Ahmed body, given slant angle φ = 25 degrees
Fig. 5 Trimetric view of dimpled Ahmed body
B. Aspect Ratio
In order to completely define the dimple specifications, the
parameter Aspect Ratio (AR) has been introduced. This
quantity is the ratio of the diameter of the dimple to its depth
i.e. (D/h).This implies that for a given dimple Diameter (Ф)
and its AR, the dimple depth can be determined.
Significant differences in dimple geometry – due to
variations in diameter, aspect ratio, fillet radius, relative
positioning of dimples and the profile implicitly determine by
how much the Coefficient of Drag will be affected.
Fig. 6 Dimple geometry incorporated on the Ahmed body
C. Meshing
The meshing is done by using ICEM CFD ANSYS meshing
software. The computational domain exists between 13.544m
X 6.389m X 3.338m. Blockage area ratio of 0.539% is used,
which is significantly lesser than the maximum limit of 7.5%.
In order to decrease the total computational time, a symmetry
plane passing through the Ahmed Body’s longitudinal axis is
created. This effectively reduces the number of elements and
nodes by half. A hybrid mesh topology was adopted –
Shabir Grover et al.,
International Journal of Advanced Production and Industrial Engineering
| IJAPIE | ISSN: 2455–8419 | www.ijapie.org | Inn Des & Com Mod | Sp.Issue| 2017 | 7 |
comprising of both structured and unstructured grids. For
regions of inviscid flow, such as the region pertaining to the
outside of the boundary layer where local shear stresses are
negligible, tetrahedral elements are more dominant. In the
regions of viscid flow, like the boundary layers around
Ahmed Body’s surface, prismatic elements are utilized in
order to effectively resolve the velocity profiles for the
analysis. For a typical car-like shape, pressure drag is
dominant over skin friction, so the accuracy of the drag
predictions are largely determined by the accuracy of the
predicted static pressure distribution on the body. This
pressure distribution is strongly affected by the locations of
flow separation and reattachment.
Therefore it is important that the surface mesh resolves all
relevant details of the geometry and satisfies the requirements
of the physical models used in the simulation.
Prismatic elements provide good alignment with the flow
near wall boundaries. This is beneficial for reducing
numerical diffusion. Thus, flat regions, especially on the
front part of the under-body as well as the top surface
containing dimples should be resolved using prismatic layers.
The transition between the two types of elements was also
kept gradual so as to prevent the distortion of the elements,
while also merging the nodes at the interfaces. This not only
kept the number of elements low, but at the same time
increased the accuracy of the results.
TABLE I
SETUP DETAILS FOR MESH AND SOLVING SCHEME
Fig. 7 Cut section view of enhanced refinement of mesh near dimples
Fig. 8 Cut section view of enhanced refinement of mesh near dimples
Fig. 9 Cut section view of enhanced refinement of mesh near dimples
Fig. 10 Mesh around Ahmed body
Particulars Type of Body
Uncontrolled Controlled
Element Type Tetra/Prismatic
(Flat Base)
Tetra/Prismatic
(Flat Base)
Elements 4137591 5787095
Nodes 818485 1288770
Skewness
(Maximum) 0.8959 0.8618
Orthogonal
Quality
(Minimum)
0.2009 0.227
Scheme Deployed COUPLED SIMPLE COUPLED
Cores Utilized
(Processors) 4 4
Computational
Time 9 Hours 15 Hours
Processing Type Parallel (Single
Precision)
Parallel (Single
Precision)
Shabir Grover et al.,
International Journal of Advanced Production and Industrial Engineering
| IJAPIE | ISSN: 2455–8419 | www.ijapie.org | Inn Des & Com Mod | Sp.Issue| 2017 | 8 |
D. Turbulence Model
In this paper, the turbulence model chosen was a realizable k-
model with non-equilibrium wall functions. This was done
due to its robustness and high degree of versatility, which
tends to produce accurate solutions. Also the computational
time required for performing Large Eddy Simulation (LES)
was proving to be infeasible as compared to Reynolds
Averaged Navier-Stokes (RANS) model. Similarly, Direct
Numerical Simulation (DNS) would’ve required a grid with
an enormously high level of mesh resolution. All of the
above reasons led to the selection of RANS equations with
the k- turbulence model. It comprises of two transport
equations to represent the turbulent properties of the flow.
The first transport variable is the kinetic energy term, k. It is
the variable to determine the turbulent energy production.
( )
( )
[(
)
] +
+
The second transport variable is the turbulent dissipation
term, . It is the variable to determine the scales of the
turbulence.
( ) +
( )
[(
)
] + –
√ +
+
In the equations above, is the generation of turbulence
kinetic energy due to the mean velocity gradients. is the
generation of turbulence kinetic energy due to buoyancy.
is the contribution of the fluctuating dilatation in
compressible turbulence to the overall dissipation rate. and
and re constants and turbulent Prandtl numbers for k
and respectively. and are user defined source terms.
E. Governing Equations [20]
1) Continuity Equation:
( )
2) Conservation of Momentum in x –direction:
( )
( )
( )
( )
3)
( )
( [
])
( [
])
4) Conservation of Momentum in y –direction:
( )
( )
( )
( )
( [
])
( )
( [
])
5) Conservation of Momentum in z –direction:
( )
( )
( )
( )
( [
])
( [
])
(
)
F. Boundary Conditions
In this work, the free stream velocity has been set to 40 m/s at
the inlet (with a turbulence intensity of 1%), related to the
overall length of the model that gives the Reynolds number
as;
=
=
= 2.86 6
Where is the density of air; is the flow velocity; L is the
characteristic length of the car model; is the coefficient of
dynamic viscosity of air.
The pressure outlet is maintained at a gauge pressure of 0 Bar
with 5% turbulence intensity at the exit.
In case of the mid-plane which is parallel to the longitudinal
axis of the Ahmed Body and passes through the geometric
centre, it was kept as a symmetry plane, which eased up the
calculation time required for the simulation.
No slip conditions as applicable on the surfaces of the body,
along with zero shear stresses acting on the walls of the fluid
domain or the control volume were taken into consideration.
Reference values were computed from the velocity inlet with
respect to the global/absolute co-ordinate system.
Shabir Grover et al.,
International Journal of Advanced Production and Industrial Engineering
| IJAPIE | ISSN: 2455–8419 | www.ijapie.org | Inn Des & Com Mod | Sp.Issue| 2017 | 9 |
IV. SETUP
Parallel processing was employed for finding out the
solution up to single precision. A total of four threads were
run simultaneously to carry out the simulations.
Upon defining the conditions in the setup instead of
Density based, Pressure Based Navier Stokes (PBNS) was
utilised (gravitational effects neglected). Originally, PBNS
was used for working with incompressible flows, also since
the maximum velocity in the flow-field will be less than
Mach number 0.3, relative density changes will be less than 5
per cent. Another reason is that the convergence in density
based heavily depends upon several factors since density is
derived from the equation of continuity, whereas the state
equation is used to obtain the values of pressure.
The solution scheme employed is the coupled scheme for
the entire iterations of the uncontrolled (non-dimpled) case
while for the controlled case the solution was initially solved
using the simple scheme (first order upwind) so as to ensure a
decreasing trend for continuity. Later after about 1200
iterations the solving scheme was shifted to the coupled
scheme (second order upwind), which takes second order
approximations for solving the turbulent kinetic energy and
dissipation terms i.e. k and for ultimately solving the drag
value.
Hybrid initialisation was used. The convergence criteria
were kept up to e-5
. This gives considerably accurate
solutions.
Also oscillation of continuity provided an indicator that
the result was converged.
Fig. 11 Cd convergence history for the non-dimpled Ahmed body
V. RESULTS
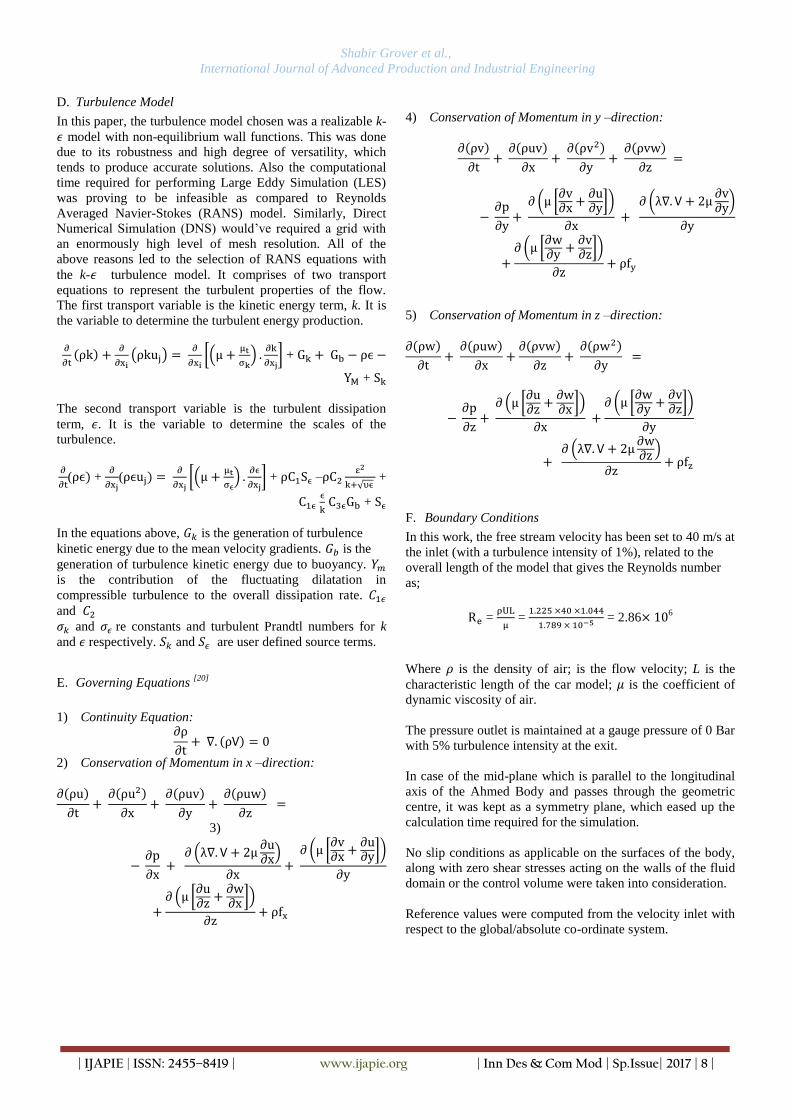
A. Static Pressure Contour
Figures 11 and 12 depict the distribution of static pressure
over the grooved surfaces. The static pressure at velocity inlet
and the pressure outlet of the domain is taken to be 0 Bar
(gauge pressure). Although its distribution over the surface is
rather uniform for almost the entire surface expect a few
regions which are of specific interest. As the flow passes over
the leading edge of the slant face it accelerates thereby
reducing the static pressure value all along the edge. Also,
along the direction of flow the periphery of the dimples
reflect a greenish ting showing that the pressure value has
mellowed down at those points. This phenomenon is
observed due to acceleration in the flow both upstream as
well as downstream of the dimple as it encounters the
depression, thus creating a low pressure region just around
the periphery of the dimple. This pressure differential is
higher in the longitudinal direction of flow. Another fact
worth mentioning is that the intensity of the low pressure
increases as we move towards the outer end/edge of the body.
This is due to the stream-wise counter rotating vortices which
are formed because of the low pressure prevailing on the
slant surface compared to side face. The axis of the vortices
so formed is along the direction of the slant.
Fig. 12 A surface plot showing the static pressure variation on the top surface and the leading edge of the slant surface
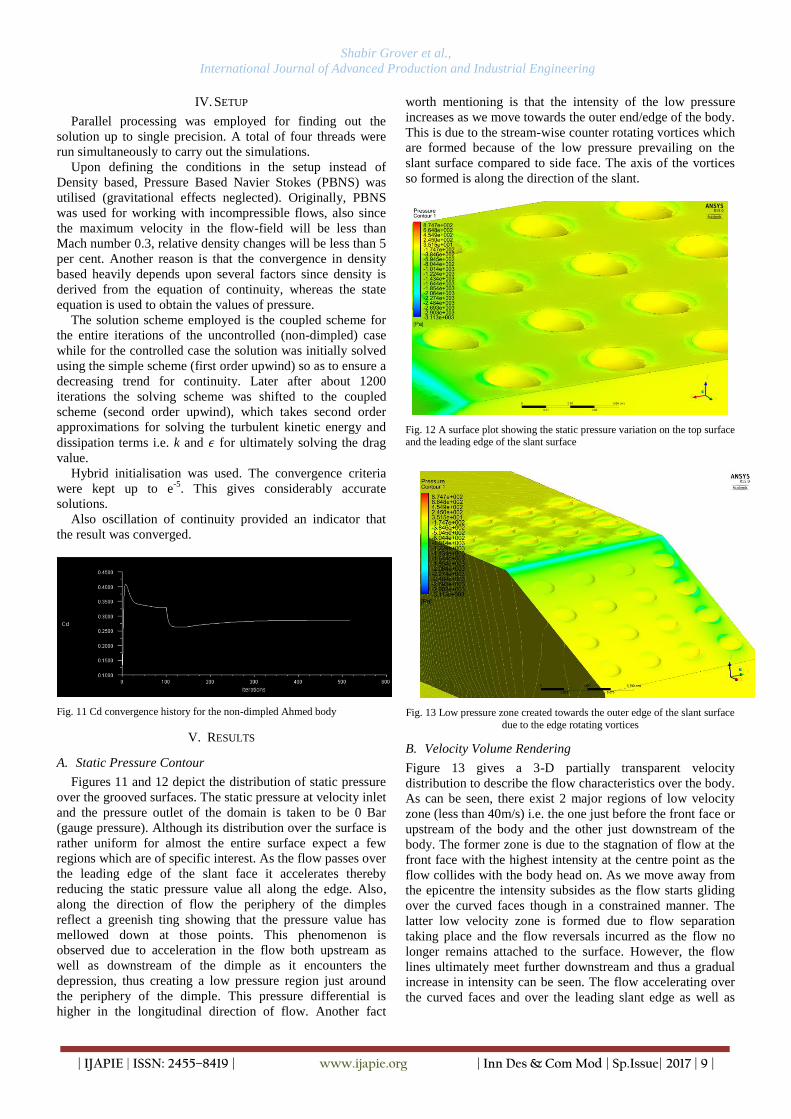
Fig. 13 Low pressure zone created towards the outer edge of the slant surface
due to the edge rotating vortices
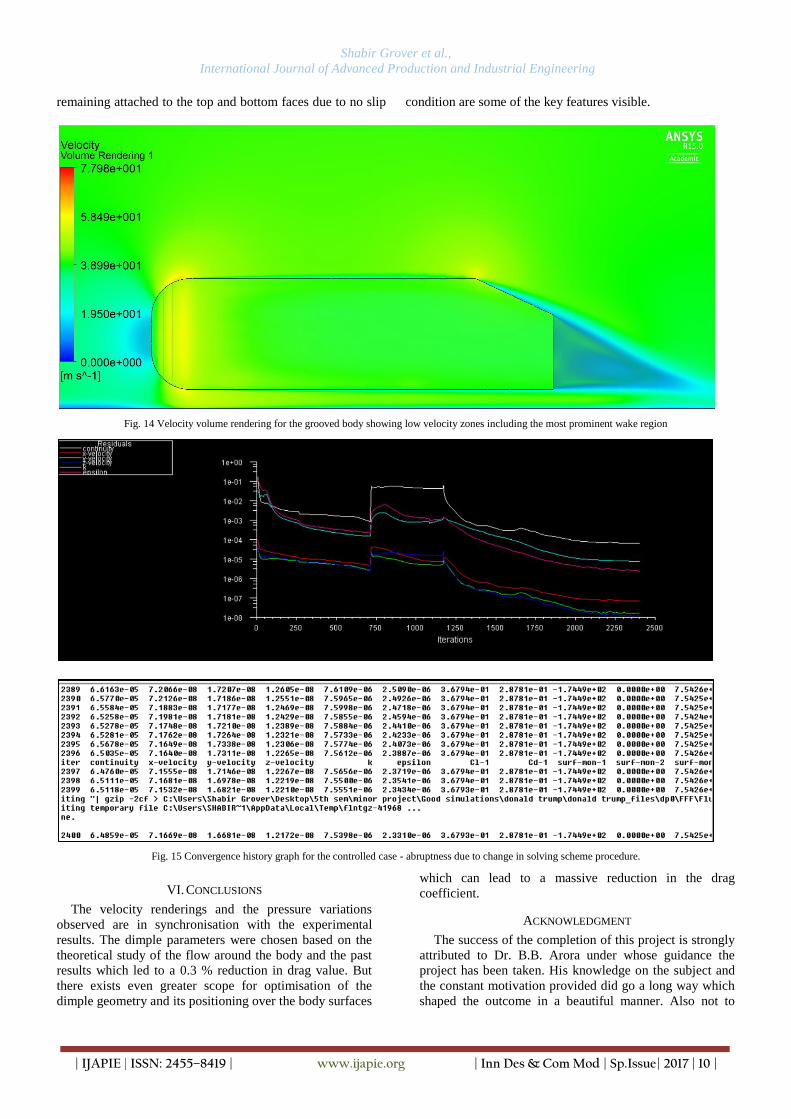
B. Velocity Volume Rendering
Figure 13 gives a 3-D partially transparent velocity
distribution to describe the flow characteristics over the body.
As can be seen, there exist 2 major regions of low velocity
zone (less than 40m/s) i.e. the one just before the front face or
upstream of the body and the other just downstream of the
body. The former zone is due to the stagnation of flow at the
front face with the highest intensity at the centre point as the
flow collides with the body head on. As we move away from
the epicentre the intensity subsides as the flow starts gliding
over the curved faces though in a constrained manner. The
latter low velocity zone is formed due to flow separation
taking place and the flow reversals incurred as the flow no
longer remains attached to the surface. However, the flow
lines ultimately meet further downstream and thus a gradual
increase in intensity can be seen. The flow accelerating over
the curved faces and over the leading slant edge as well as
Shabir Grover et al.,
International Journal of Advanced Production and Industrial Engineering
| IJAPIE | ISSN: 2455–8419 | www.ijapie.org | Inn Des & Com Mod | Sp.Issue| 2017 | 10 |
remaining attached to the top and bottom faces due to no slip condition are some of the key features visible.
Fig. 14 Velocity volume rendering for the grooved body showing low velocity zones including the most prominent wake region
Fig. 15 Convergence history graph for the controlled case - abruptness due to change in solving scheme procedure.
VI. CONCLUSIONS
The velocity renderings and the pressure variations
observed are in synchronisation with the experimental
results. The dimple parameters were chosen based on the
theoretical study of the flow around the body and the past
results which led to a 0.3 % reduction in drag value. But
there exists even greater scope for optimisation of the
dimple geometry and its positioning over the body surfaces
which can lead to a massive reduction in the drag
coefficient.
ACKNOWLEDGMENT
The success of the completion of this project is strongly
attributed to Dr. B.B. Arora under whose guidance the
project has been taken. His knowledge on the subject and
the constant motivation provided did go a long way which
shaped the outcome in a beautiful manner. Also not to
Shabir Grover et al.,
International Journal of Advanced Production and Industrial Engineering
| IJAPIE | ISSN: 2455–8419 | www.ijapie.org | Inn Des & Com Mod | Sp.Issue| 2017 | 11 |
forget the constant support provided by the parents, by the
lab assistant, by our class peers and the blessings of the
Almighty.
REFERENCES
[1] Hsu, F.-H., Davis, R. L., Drag reduction of tractor-trailers
using optimized add-on devices, Journal. Fluids
Engineering, 132(8), 084504. doi:10.1115/1.4001587
[2] C. K. Chear, S. S. Dol, Vehicle Aerodynamics: Drag
Reduction by Surface Dimples, International Journal of
Mechanical, Aerospace, Industrial, Mechatronic and
Manufacturing Engineering Vol: 9, No: 1, 2015.
[3] S. F. Wong, S. S. Dol, Simulation study on vehicle drag
reduction, International Journal of Mechanical, Aerospace,
Industrial, Mechatronic and Manufacturing Engineering
Vol:10, No:3, 2016
[4] Katsumi Aoki, Koji Muto, Hiroo Okanaga, Mechanism of
Drag Reduction by Dimple Structures on a Sphere, Journal
of Fluid Science and Technology Vol. 7, No. 1, 2012.
[5] Seong-Ho Seo, Chung-Do Nam, Cheol-Hyun Hong, Drag
Reduction of a Bluff Body by Grooves Laid Out by Design
of Experiment, Journal of Fluids Engineering, Nov. 2013,
Vol. 135 / 111202-1.
[6] Laurent Dumas, Optimization and Computational Fluid
Dynamics, pp 191-215, Springer Berlin Heidelberg
Germany, 2008.
[7] Alaman Altaf, Ashraf A. Omar and Waqar Asrar, Review
of Passive Drag Reduction Tecniques for Bluff Road
Vehicles, IIUM Engineering Journal, Vol. 15, No. 1, 2014.
[8] Marco Lanfrit, Best practice guidelines for handling
Automotive External Aerodynamics with FLUENT, Fluent
Deutschland GmbH Germany.
[9] Mohamed-Kassim and Filippone, A. “Fuel savings on a
heavy vehicle via aerodynamic drag reduction”,
Transportation Research Part D Vol.15. pp 275-285.
(2010).
[10] Chainani. A and Perera. N, CFD Investigation of Airflow
on a Model Radio Control Race Car, WCE 2008 Vol II,
July 2 - 4, 2008, London, U.K.
[11] Yeung, W. W. H. and Parkinson, G. V., Analysis and
Modeling of Pressure Recovery for Separated Reattaching
Flows, ASME Journal of Fluids Engineering, Vol. 126, No.
3, pp. 355–361, 2004.
[12] Manoj Kumar, Arora, B. B. and Subhashis Maji, “Analysis
of flow separation in wide angle annular diffusers,”
International Journal of Applied Engineering Research,
Vol.5, No.20. (2010) pp. 3419-3428, ISSN 0973-4562
[13] B. B. Arora, Manoj Kumar and Subhashis Maji, “Study of
Inlet conditions on Diffuser Performance,” International
Journal of Theoretical and applied Mechanics, Vol.5, No.2.
(2010) pp. 201-221, ISSN 09736085.
[14] Noor, M. M., Wandel, Andrew P. and Yusaf, Talal, “Detail
guide for CFD on the simulation of Biogas combustion in
bluff body mild burner,” International Conference on
Mechanical Engineering Research (ICMER2013), 1-3 July
2013
[15] Yiping Wang, Cheng Wu, Gangfeng Tan and Yadong
Deng, “Reduction in the aerodynamic drag around a
generic vehicle by using a non-smooth surface”, Journal of
Automobile Engineering.
[16] Wolf-Heinrich Hucho, “Aerodynamics of Road Vehicles”,
SAE International, 1998.
[17] Joseph Katz, “Race Car Aerodynamics: Designing for
Speed”, 1995.
[18] Ahmed, S.R., Ramm, R., Faltin, G. : Some salient features
of the time averaged ground vehicle wake, SAE Paper
840300 (1984)
[19] Yunus A. Çengel, John M. Cimbala, “Fluid Mechanics:
Fundamentals and Applications”, 2006.
[20] John D. Anderson, Jr. “Computational Fluid Dynamics:
The Basics with Applocations”, 1995


![Inflammatory cardiomyopathy: A review and meta-analysis of … · 2020. 8. 4. · (iDCM) [1], and it is the leading cause of non-ischemic heart failure (HF), accounting for nearly](https://img.pdfslide.net/doc/110x75/609faf0247009238422cb632/inflammatory-cardiomyopathy-a-review-and-meta-analysis-of-2020-8-4-idcm.jpg)