Embed Size (px)
Citation preview
Benefits and costs of altering microfinance systems in Bangladesh
COST-BENEFIT ANALYSIS OF TRADITIONAL VERSUS FLEXIBLE MICROFINANCE IN BANGLADESH
DR. SUBIR BAIRAGI, AGRICULTURAL ECONOMIST, INSTITUTE OF POLICY AND SOCIAL SCIENCES, AND POST-DOCTORAL FELLOW, INTERNATIONAL RICE RESEARCH INSTITUTE.DR. WASEL BIN SHADAT, EXECUTIVE DIRECTOR, INSTITUTE OF POLICY AND SOCIAL SCIENCES AND LECTURER IN ECONOMETRICS, ECONOMICS, UNIVERSITY OF MANCHESTER.

Cost-Benefit Analysis of Traditional Versus Flexible Microfinance in Bangladesh
Bangladesh Priorities
Dr. Subir Bairagi Agricultural Economist, Institute of Policy and Social Sciences, and Post-doctoral fellow, International Rice Research Institute
Dr Wasel Bin Shadat Executive Director, Institute of Policy and Social Sciences, and Lecturer in Econometrics and Economics University of Manchester
© 2016 Copenhagen Consensus Center [email protected] www.copenhagenconsensus.com This work has been produced as a part of the Bangladesh Priorities project, a collaboration between Copenhagen Consensus Center and BRAC Research and Evaluation Department. The Bangladesh Priorities project was made possible by a generous grant from the C&A Foundation. Some rights reserved
This work is available under the Creative Commons Attribution 4.0 International license (CC BY 4.0). Under the Creative Commons Attribution license, you are free to copy, distribute, transmit, and adapt this work, including for commercial purposes, under the following conditions:
Attribution Please cite the work as follows: #AUTHOR NAME#, #PAPER TITLE#, Bangladesh Priorities, Copenhagen Consensus Center, 2016. License: Creative Commons Attribution CC BY 4.0.
Third-party-content Copenhagen Consensus Center does not necessarily own each component of the content contained within the work. If you wish to re-use a component of the work, it is your responsibility to determine whether permission is needed for that re-use and to obtain permission from the copyright owner. Examples of components can include, but are not limited to, tables, figures, or images.
Abstract Even though traditional microfinance has made an impact on Bangladeshi society to some extent, it is
difficult to define the degree of impact of microfinance on the “ultra poor” because of prevailing
rigidity in the system. In the literature, to make microfinance more effective, introducing more
flexibility has been (widely) suggested as one of the smart interventions. This paper estimates the
social benefits of an introduction of flexibility into the repayment system when borrowers are granted
a grace period during the lean period and compared it with the equilibrium benefits from the
traditional microfinance, using the NPV and BCR measures. The 2015 present value of the future net
benefits is estimated to be between $4 and $51 billion under the flexible microfinance, depending on
the discount rates, benefit coefficient, and the rate of credit adoption. Social benefits for the
traditional microfinance are estimated to be between $5 and $52 billion. The BCR for flexible
microcredit is estimated to be between 1.93 and 2.60, while for traditional microcredit it is between
1.31 and 2.09. The welfare gains to the borrowers due to the introduction of flexible microcredit are
significantly higher compared to that of the traditional microcredit. We thus conclude that there is a
potential of creating a new flexible microcredit market in Bangladesh.
Keywords: Microfinance, Bangladesh, Benefit Cost Ratio (BCR), flexible microfinance, Net Present
Value (NPV).
Acronyms ASA Association for Social Advancement BCR Benefit-Cost Ratio BRAC Bangladesh Rural Advancement Committee CDF Credit Development Forum DID Difference-in-Difference DWI Disciplined Weekly Instalment EI Equal Amount of Each Instalment FMF Flexible Microfinance FP Fixed Repayment Period GB Grameen Bank GDP Gross Domestic Product GL Group Liability InM Institute of Microfinance IRR Internal Rate of Return MFIs Microfinance Institutions NPV Net Present Value PKSF Palli Karma-Sahayak Foundation PV Present Value RCT Randomized Control Trial TMF Traditional Microfinance
ABSTRACT ........................................................................................................................................................ 1
ACRONYMS ...................................................................................................................................................... 2
I. INTRODUCTION ............................................................................................................................................ 4
II. METHODOLOGY ........................................................................................................................................... 4
II.1 METHODS TO ESTIMATE COSTS-BENEFITS OF AN INTERVENTION .................................................................................. 4
II.1.1 Intervention-1: introduction to the traditional microcredit .................................................................. 4
II.1.2 Intervention-2: introduction to flexible microfinance ........................................................................... 5
II.2 MEASURING COSTS AND BENEFITS ........................................................................................................................ 7
II.2.1 Net Present Value (NPV) ....................................................................................................................... 7
II.2.1 Benefit Cost Ratio (BCR) ........................................................................................................................ 7
II.2.2 Adoption path of microcredit ................................................................................................................ 8
II.2.3 Sensitivity Analysis ................................................................................................................................ 8
III. RESULTS AND DISCUSSIONS ........................................................................................................................ 8
III.1 INTERVENTION-1: INTRODUCTION TO TRADITIONAL MICROFINANCE ............................................................................ 8
III.2 Intervention-2: introduction to flexible microfinance ........................................................................... 12
IV. CONCLUSIONS .......................................................................................................................................... 14
REFERENCES ................................................................................................................................................... 15
ANNEX ........................................................................................................................................................... 20
I. Introduction Microcredit market in Bangladesh has expanded significantly and has been sustainably in operation
during the last three decades. It has also substituted the informal moneylending market in rural
Bangladesh, to a great extent (Islam et al. 2013). Professor Muhammad Yunus’s Grameen Bank has
pioneered this market model, which has expanded all over the world. As of 31 December 2014, some
693-licensed microfinance institutions (MFIs) are in operation, disbursing approximately $8.4 billion
(Tk.647 billion) to their 34 million active borrowers (CDF, 2015). Note that approximately 20-25% of
total microcredit market is captured by the Grameen Bank (GB) alone, while two other giant
microfinance institutions, Bangladesh Rural Advancement Committee (BRAC) and Association for
Social Advancement (ASA), together capture another 30-40% of market share1 (Bairagi, 2014 and CDF,
2015).
The nature and extent of microcredit market have changed over time (MFIs’ goal switched from a
“welfare paradigm” to “rent-seeking paradigm”). A large number of for-profit microfinance
institutions (MFIs)2 have entered into the market and increased their economy of scale owing to the
long-run sustainability and operational efficiencies (Yuge, 2011; Rishad, 2012). Moreover, non-profit
MFIs have started to make a profit to compete with the for-profit MFIs. Bairagi and Azzam (2014)
analysed the profit of GB and found that the profit situates approximately 3% above marginal cost,
which is considerably dwarfed by commercial MFIs (97% to 165% above marginal cost, calculated
based on the estimates of the commercial MFIs in 73 countries (Assaf et al., 2013). A distribution of
profit margin of Bangladesh’s MFIs is presented in Annex Figure 1, which shows that about 75% of
MFIs’ profit margins3 are in between 1% and 85%. However, most of MFIs’ profit margins lie between
5% and 25%. This profit margin, surplus gain to the producers (MFIs), has increased as the microcredit
market in Bangladesh expanded.
Microfinance contributed to the national economy approximately 10.4% of gross domestic product
(GDP) in 2012 (Raihan et al., 2012). It generates about 250,000 jobs for the economy, of which about
58% are directly related to microfinance (CDF, 2015). It is well documented that “less poor” borrowers,
who have continuous income flows, have gained welfare from microcredit. Microcredit increases
income and consumption, generating employment opportunities, empowering women, and ensuring
1These shares are based on number of active borrowers, disbursement loan, and loan outstanding. 2Dr. Muhammad Yunus, Nobel Peace Prize winner in 2006, wrote in a New York Times article title “Sacrificing Microcredit for
Megaprofits” that he never imagined one day commercial microfinance would rise (Yunus 2013, Bairagi and Azzam 2014). 3The Mix Market reports the detailed information of only 77 for-profit and non-profit microfinance organizations.
food security.4 Microfinance as an anti-poverty tool has also greatly captured the public imagination
of the international development community.
Critics such as Meyer (2002), however, have raised the question about the microfinance model by
asking whether “one-size is fit for all”, bringing a critical prism to the “magic of microcredit”.
Scepticism about microcredit revolves around three major spectrums: (i) are vulnerable beneficiaries
benefiting from microfinance? (Morduch, 1998; Roodman and Morduch, 2009 and 2013; Banerjee et
al., 2009; Pitt, 2011), (ii) are poorer borrowers trapped in a vicious debt circle? (Islam et al. 2013), and
(iii) has microfinance lost its moral compass? (Hulme and Maitrot, 2014). Banerjee et al. (2015) also
echoed the same criticism. To examine the effectiveness of microcredit, six randomized evaluations
of microfinance in six countries (Bosnia and Herzegovina, Ethiopia, India, Mexico, Mongolia, and
Morocco) were reviewed in their paper, which found that while microcredit sometimes leads to an
increase in business activity, the effect on average business profits is much more muted. There is no
effect on consumption over a period of one to three years. In other words, better access to microcredit
does not seem to generate sustained consumption gains.
In the case of Bangladesh, most previous studies claimed that there is a positive effect of microcredit
on borrowers’ outcomes. To examine the impact of microcredit, Pitt and Khandker, PK’s, (1998)
attempted to measure the impact of microcredit on consumption (Schroeder 2014). Using quasi-
experimental data, they found that microcredit increases households’ consumption. A similar study
by Khandker (2005) also came to the same conclusion. However, using the same dataset as PK (1998),
Morduch (1999) found no impact on consumption. Chemin (2008), using the same data, found a
positive, but lower than PK (1998) but greater than Morduch (1999), effect of microfinance on
expenditure per capita, supply of labour, and level of school enrolment for boys and girls. Schroeder
(2014) claimed that effect of microcredit might be more effective than he previously thought. He
estimated that an increase of 1% in the amount borrowed, from the GB and similar institutions, would
increase per capita household consumption by 0.18-0.21%. Employing a dynamic model with panel
survey data spanning over 20 years, Khandker and Samad (2014) found that this elasticity would range
between -0.022 and 0.018%. They concluded that microfinance increases income and expenditure,
the labour supply, non-land asset, and net worth as well as boys’ and girls’ schooling. It was also found
that it reduces poverty.
4Hossain 1984, 1988; Hume and Mosley 1996; Pitt et al. 1999; Pitt etal. 2006; Pitt et al. 2014; Khandhker 1998, 2003, 2005;
Zaman 2004; Khandakeret al. 2010;MRA 2010;Osmani 2012;Sharmin 2014; Wadud 2013;Chemin 2008; Pakrashiet al. 2014;
Rahman 2007.
It is widely reported that the traditional microcredit market suffers from a set of problems, such as
high interest rates, overlapping loans, insufficient repayment time, less attention to ultra poor,
unfavourable loan product characteristics, delinquency and default rates, and others (Yuge, 2011;
Zaman, 2013; Mokhtar et al., 2012; Meyer, 2002)). The rigidity in the contract of microfinance has
been identified as one of the critical underlying problem (Field et al., 2009, Karlan and Mullainathan,
2009). Yuge (2011) pointed out that these problems of traditional microcredit could have been
addressed if flexibility was allowed in the system (traditional microcredit to flexible microcredit),
which might play the key role of a welfare improvement policy. Note that several studies have
proposed different strategies of flexibility in microfinance and tested its impact theoretically and
empirically 5 on borrowers and implementers (i.e., MFIs). Previous research studies on flexible
microfinance show that borrowers/consumers surplus may increase, though implementers may be
worse off6. In this regard it is worth mentioning Tsukada (2012), who showed that flexibility of lending
contract has both benefits and costs. Field and Pande (2008) found that in India a more flexible
schedule (weekly to monthly) could reduce transaction costs significantly without increasing client
default rate. In Bangladesh, Shonchoy and Kurosaki (2014) found that granting a temporary
moratorium to repayments during the Monga period had positive impact on food consumption. They
also found statistically insignificantly difference between the traditional and flexible default rates.
Therefore it is of our interest to examine potential welfare impact of flexible microfinance in
Bangladesh. To the best of our knowledge, there is no study that has attempted to estimate the
aggregate welfare (in terms of monetary benefits) to Bangladesh from traditional microfinance and/or
flexible microfinance. In this paper, therefore, we provide an empirical estimate of benefits and costs
for traditional microfinance in Bangladesh that will provide a benchmark for comparison. Secondly,
we estimate the potential net benefits of granting a grace period, which would bring flexibility to the
traditional microfinance, to the borrowers during the lean business season.
The rest of the paper is organized as follows: Section II discusses the conceptual framework and
methodological issues related to the two interventions under consideration, namely the traditional
microfinance and the flexible microfinance (grace period in repayment during lean business period).
Section III presents the results and discussion, while Section IV concludes. All tables and figures are
relegated to the Appendix.
5Field and Pande 2009; Czura et al. 2011; Feigenberg et al. 2011;Gine and Karlan 2011; Laureti and Hamp 2011; Yuge 2011;
Tsukada 2012; Field et al. 2012; Field et al. 2013; Weber and Musshoff 2013; Weber et al. 2014; Labie et al. 2013. 6Labie (2013) provided an excellent review on flexible microfinance.
II. Methodology
II.1 Methods to estimate costs-benefits of an intervention
II.1.1 Intervention-1: introduction to the traditional microcredit
Social benefits
Due to the introduction of traditional microfinance (TMF) market, benefits to society can be modelled
by assuming that microfinance institutions act as a profit maximiser and offer homogeneous product,
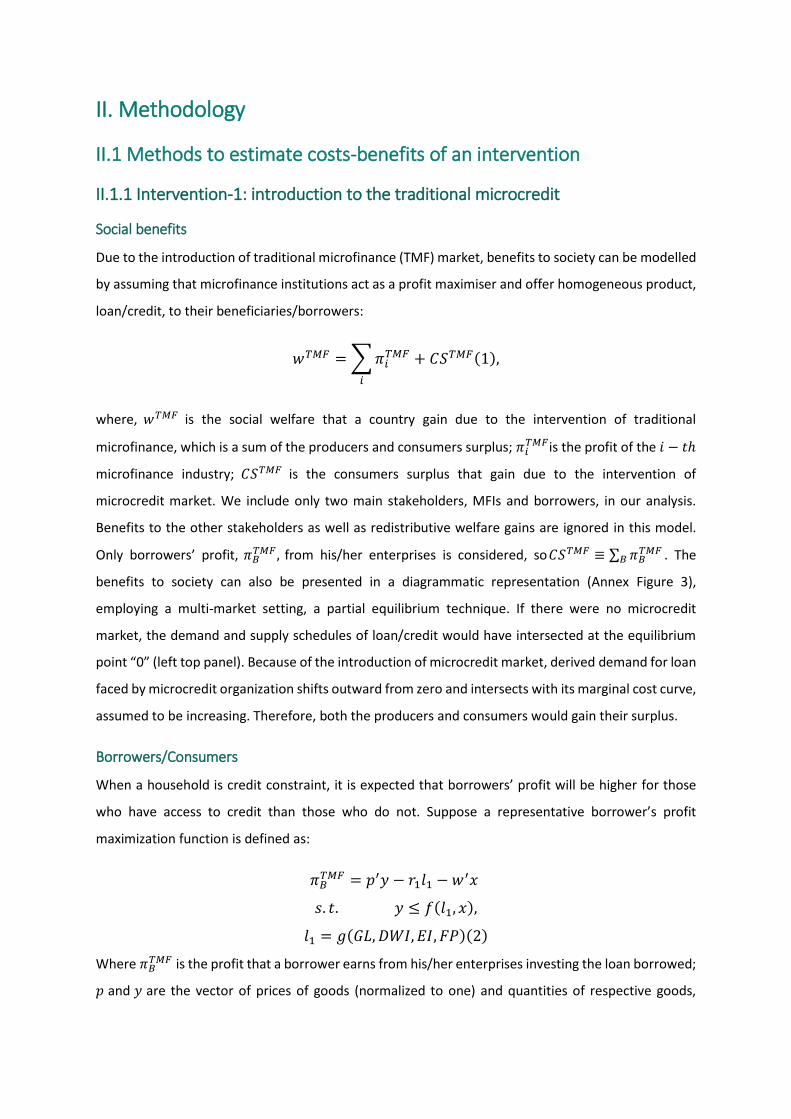
loan/credit, to their beneficiaries/borrowers:
𝑤𝑇𝑀𝐹 = ∑ 𝜋𝑖𝑇𝑀𝐹
𝑖
+ 𝐶𝑆𝑇𝑀𝐹(1),
where, 𝑤𝑇𝑀𝐹 is the social welfare that a country gain due to the intervention of traditional
microfinance, which is a sum of the producers and consumers surplus; 𝜋𝑖𝑇𝑀𝐹is the profit of the 𝑖 − 𝑡ℎ
microfinance industry; 𝐶𝑆𝑇𝑀𝐹 is the consumers surplus that gain due to the intervention of
microcredit market. We include only two main stakeholders, MFIs and borrowers, in our analysis.
Benefits to the other stakeholders as well as redistributive welfare gains are ignored in this model.
Only borrowers’ profit, 𝜋𝐵𝑇𝑀𝐹 , from his/her enterprises is considered, so𝐶𝑆𝑇𝑀𝐹 ≡ ∑ 𝜋𝐵
𝑇𝑀𝐹𝐵 . The
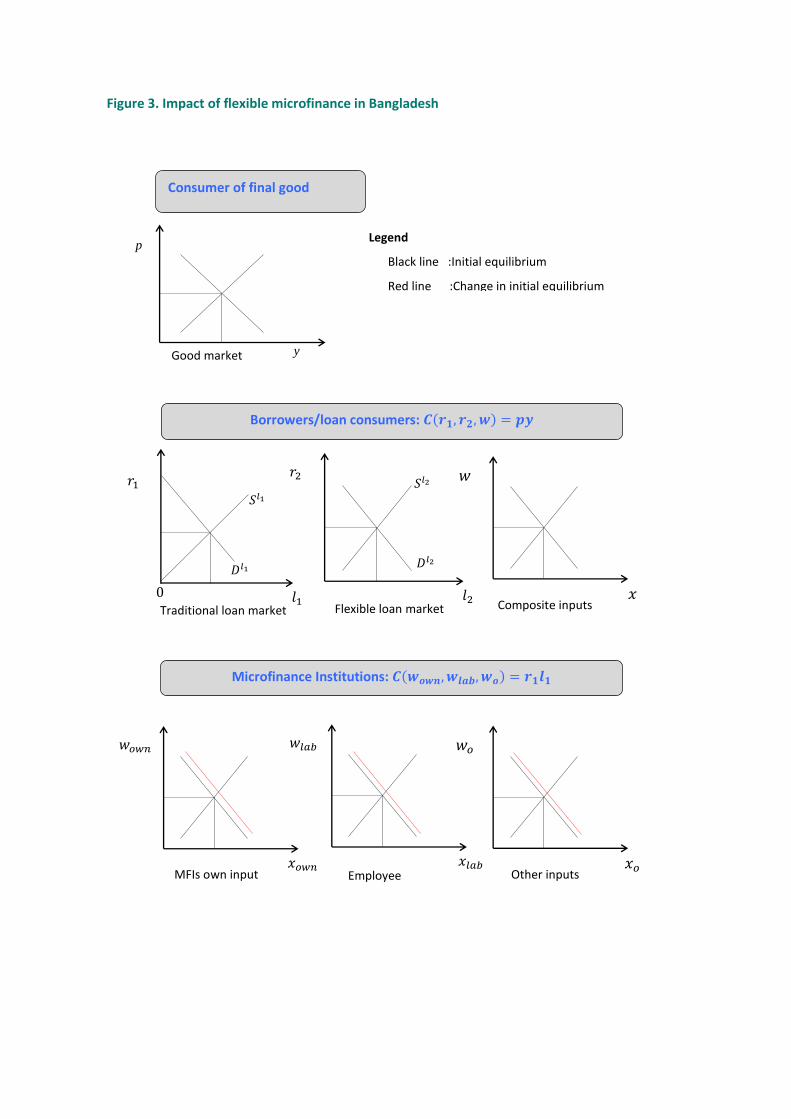
benefits to society can also be presented in a diagrammatic representation (Annex Figure 3),
employing a multi-market setting, a partial equilibrium technique. If there were no microcredit
market, the demand and supply schedules of loan/credit would have intersected at the equilibrium
point “0” (left top panel). Because of the introduction of microcredit market, derived demand for loan
faced by microcredit organization shifts outward from zero and intersects with its marginal cost curve,
assumed to be increasing. Therefore, both the producers and consumers would gain their surplus.
Borrowers/Consumers
When a household is credit constraint, it is expected that borrowers’ profit will be higher for those
who have access to credit than those who do not. Suppose a representative borrower’s profit
maximization function is defined as:
𝜋𝐵𝑇𝑀𝐹 = 𝑝′𝑦 − 𝑟1𝑙1 − 𝑤′𝑥
𝑠. 𝑡. 𝑦 ≤ 𝑓(𝑙1, 𝑥),
𝑙1 = 𝑔(𝐺𝐿, 𝐷𝑊𝐼, 𝐸𝐼, 𝐹𝑃)(2)
Where 𝜋𝐵𝑇𝑀𝐹 is the profit that a borrower earns from his/her enterprises investing the loan borrowed;
𝑝 and 𝑦 are the vector of prices of goods (normalized to one) and quantities of respective goods,
respectively; 𝑟1 is the interest rate paid to the implementer and 𝑙1 is the amount of borrowing; 𝑥 and
𝑤 are the vector of traditional productive inputs (i.e. land, labour, capital, and others) and their prices,
respectively. The loan is also a function of group liability (GL), frequent/disciplined weekly instalment
(DWI), equal amount of each instalment (EI), and fixed repayment period (FP). Note that a portion of
each repayment amount is deposited to the borrowers’ savings account.
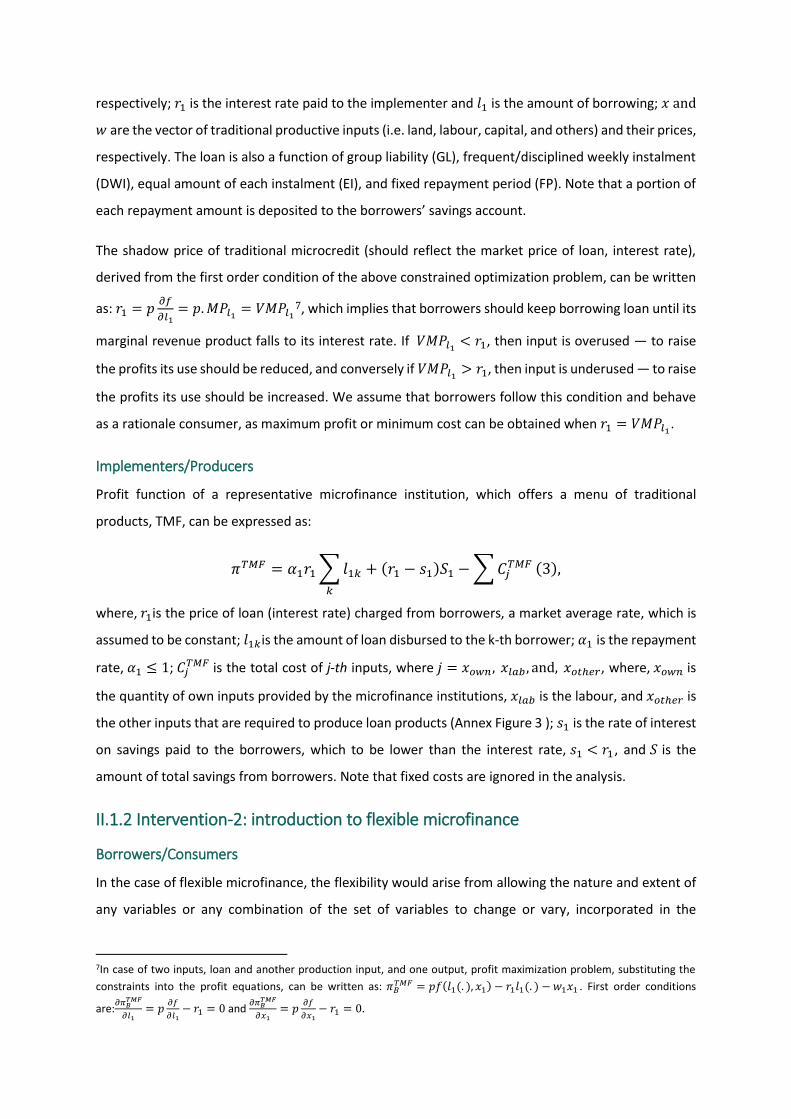
The shadow price of traditional microcredit (should reflect the market price of loan, interest rate),
derived from the first order condition of the above constrained optimization problem, can be written
as: 𝑟1 = 𝑝𝜕𝑓
𝜕𝑙1= 𝑝. 𝑀𝑃𝑙1
= 𝑉𝑀𝑃𝑙17, which implies that borrowers should keep borrowing loan until its
marginal revenue product falls to its interest rate. If 𝑉𝑀𝑃𝑙1< 𝑟1, then input is overused — to raise
the profits its use should be reduced, and conversely if 𝑉𝑀𝑃𝑙1> 𝑟1, then input is underused — to raise
the profits its use should be increased. We assume that borrowers follow this condition and behave
as a rationale consumer, as maximum profit or minimum cost can be obtained when 𝑟1 = 𝑉𝑀𝑃𝑙1.
Implementers/Producers
Profit function of a representative microfinance institution, which offers a menu of traditional
products, TMF, can be expressed as:
𝜋𝑇𝑀𝐹 = 𝛼1𝑟1 ∑ 𝑙1𝑘
𝑘
+ (𝑟1 − 𝑠1)𝑆1 − ∑ 𝐶𝑗𝑇𝑀𝐹 (3),
where, 𝑟1is the price of loan (interest rate) charged from borrowers, a market average rate, which is
assumed to be constant; 𝑙1𝑘is the amount of loan disbursed to the k-th borrower; 𝛼1 is the repayment
rate, 𝛼1 ≤ 1; 𝐶𝑗𝑇𝑀𝐹 is the total cost of j-th inputs, where 𝑗 = 𝑥𝑜𝑤𝑛 , 𝑥𝑙𝑎𝑏 , and, 𝑥𝑜𝑡ℎ𝑒𝑟, where, 𝑥𝑜𝑤𝑛 is
the quantity of own inputs provided by the microfinance institutions, 𝑥𝑙𝑎𝑏 is the labour, and 𝑥𝑜𝑡ℎ𝑒𝑟 is
the other inputs that are required to produce loan products (Annex Figure 3 ); 𝑠1 is the rate of interest
on savings paid to the borrowers, which to be lower than the interest rate, 𝑠1 < 𝑟1 , and 𝑆 is the
amount of total savings from borrowers. Note that fixed costs are ignored in the analysis.
II.1.2 Intervention-2: introduction to flexible microfinance
Borrowers/Consumers
In the case of flexible microfinance, the flexibility would arise from allowing the nature and extent of
any variables or any combination of the set of variables to change or vary, incorporated in the
7In case of two inputs, loan and another production input, and one output, profit maximization problem, substituting the
constraints into the profit equations, can be written as: 𝜋𝐵𝑇𝑀𝐹 = 𝑝𝑓(𝑙1(. ), 𝑥1) − 𝑟1𝑙1(. ) − 𝑤1𝑥1 . First order conditions
are:𝜕𝜋𝐵
𝑇𝑀𝐹
𝜕𝑙1= 𝑝
𝜕𝑓
𝜕𝑙1− 𝑟1 = 0 and
𝜕𝜋𝐵𝑇𝑀𝐹
𝜕𝑥1= 𝑝
𝜕𝑓
𝜕𝑥1− 𝑟1 = 0.
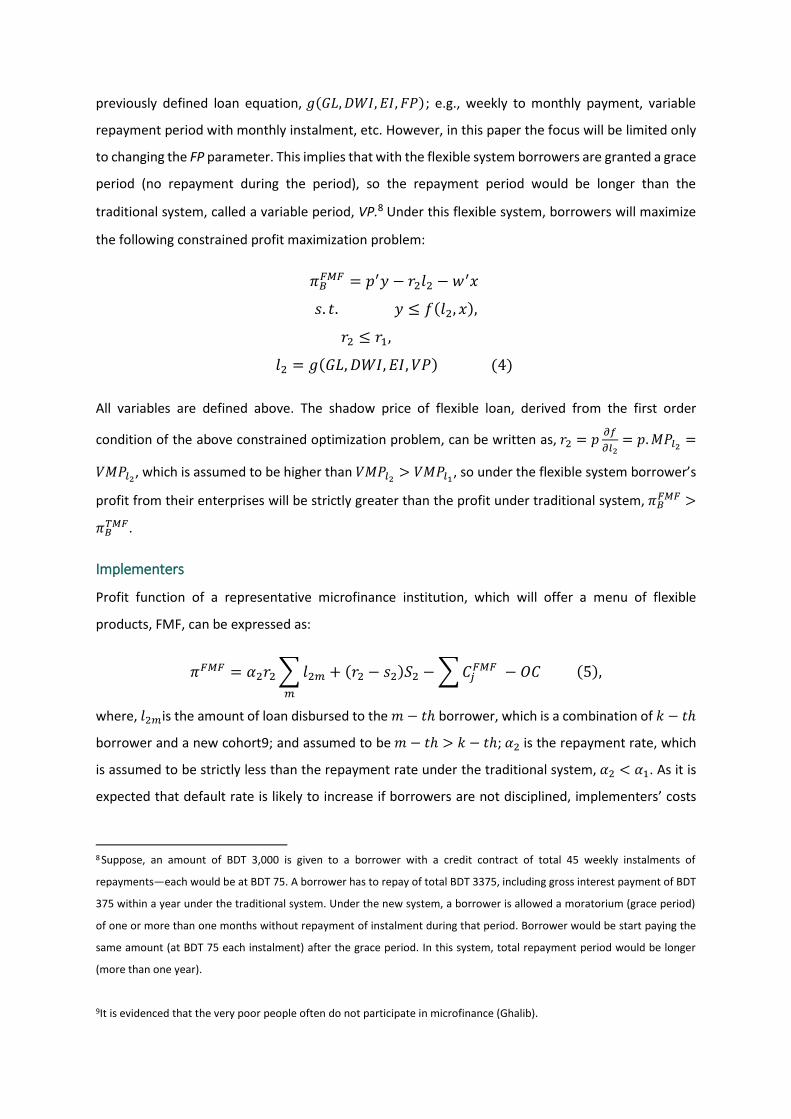
previously defined loan equation, 𝑔(𝐺𝐿, 𝐷𝑊𝐼, 𝐸𝐼, 𝐹𝑃); e.g., weekly to monthly payment, variable
repayment period with monthly instalment, etc. However, in this paper the focus will be limited only
to changing the FP parameter. This implies that with the flexible system borrowers are granted a grace
period (no repayment during the period), so the repayment period would be longer than the
traditional system, called a variable period, VP.8 Under this flexible system, borrowers will maximize
the following constrained profit maximization problem:
𝜋𝐵𝐹𝑀𝐹 = 𝑝′𝑦 − 𝑟2𝑙2 − 𝑤′𝑥
𝑠. 𝑡. 𝑦 ≤ 𝑓(𝑙2, 𝑥),
𝑟2 ≤ 𝑟1,
𝑙2 = 𝑔(𝐺𝐿, 𝐷𝑊𝐼, 𝐸𝐼, 𝑉𝑃) (4)
All variables are defined above. The shadow price of flexible loan, derived from the first order
condition of the above constrained optimization problem, can be written as, 𝑟2 = 𝑝𝜕𝑓
𝜕𝑙2= 𝑝. 𝑀𝑃𝑙2
=
𝑉𝑀𝑃𝑙2, which is assumed to be higher than 𝑉𝑀𝑃𝑙2
> 𝑉𝑀𝑃𝑙1, so under the flexible system borrower’s
profit from their enterprises will be strictly greater than the profit under traditional system, 𝜋𝐵𝐹𝑀𝐹 >
𝜋𝐵𝑇𝑀𝐹.
Implementers
Profit function of a representative microfinance institution, which will offer a menu of flexible
products, FMF, can be expressed as:
𝜋𝐹𝑀𝐹 = 𝛼2𝑟2 ∑ 𝑙2𝑚
𝑚
+ (𝑟2 − 𝑠2)𝑆2 − ∑ 𝐶𝑗𝐹𝑀𝐹 − 𝑂𝐶 (5),
where, 𝑙2𝑚is the amount of loan disbursed to the 𝑚 − 𝑡ℎ borrower, which is a combination of 𝑘 − 𝑡ℎ
borrower and a new cohort9; and assumed to be 𝑚 − 𝑡ℎ > 𝑘 − 𝑡ℎ; 𝛼2 is the repayment rate, which
is assumed to be strictly less than the repayment rate under the traditional system, 𝛼2 < 𝛼1. As it is
expected that default rate is likely to increase if borrowers are not disciplined, implementers’ costs
8 Suppose, an amount of BDT 3,000 is given to a borrower with a credit contract of total 45 weekly instalments of
repayments—each would be at BDT 75. A borrower has to repay of total BDT 3375, including gross interest payment of BDT
375 within a year under the traditional system. Under the new system, a borrower is allowed a moratorium (grace period)
of one or more than one months without repayment of instalment during that period. Borrower would be start paying the
same amount (at BDT 75 each instalment) after the grace period. In this system, total repayment period would be longer
(more than one year).
9It is evidenced that the very poor people often do not participate in microfinance (Ghalib).
under flexible system would be higher than traditional system, 𝐶𝑗𝐹𝑀𝐹 > 𝐶𝑗
𝑇𝑀𝐹 . In other words,
implementers’ interest income would be lower under the flexible system; 𝑂𝐶 is the opportunity cost
of waiting the grace period, which is a time value of money. All other variables are defined before.
Considering these assumptions, profit of implementers under flexible system might be higher or lower
than the existing microcredit system. Social benefits due to the flexible microfinance might also be
higher or lower than the traditional system.
II.2 Measuring Costs and Benefits There are three widely used measures of evaluating the payoff of any investment that can be found
in the literature, namely (i) Net Present Value (NPV), (ii) Benefit-Cost Ratio (BCR), and (iii) Internal Rate
of Return (IRR). We apply the BCR, suggested by the Copenhagen Consensus Centre, and NPV
measures to evaluate the social welfare (pay off) due to the introduction of traditional versus flexible
microfinance market in Bangladesh.
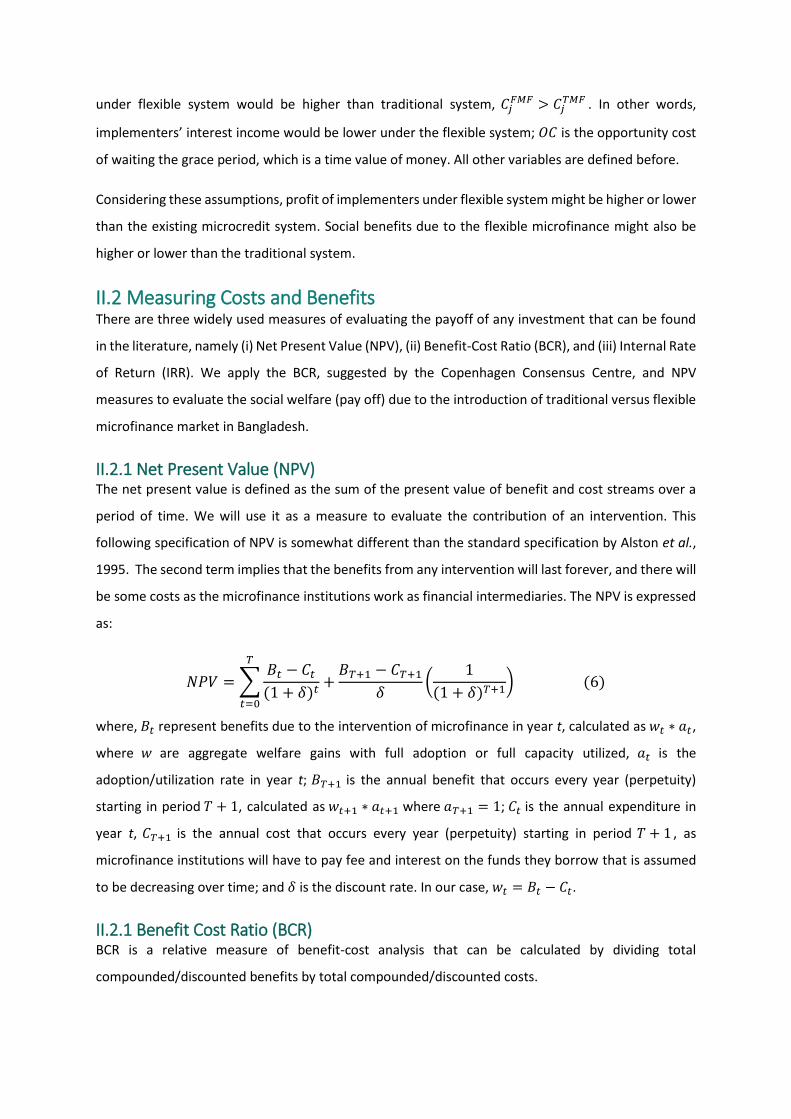
II.2.1 Net Present Value (NPV) The net present value is defined as the sum of the present value of benefit and cost streams over a
period of time. We will use it as a measure to evaluate the contribution of an intervention. This
following specification of NPV is somewhat different than the standard specification by Alston et al.,
1995. The second term implies that the benefits from any intervention will last forever, and there will
be some costs as the microfinance institutions work as financial intermediaries. The NPV is expressed
as:
𝑁𝑃𝑉 = ∑𝐵𝑡 − 𝐶𝑡
(1 + 𝛿)𝑡
𝑇
𝑡=0
+𝐵𝑇+1 − 𝐶𝑇+1
𝛿(
1
(1 + 𝛿)𝑇+1) (6)
where, 𝐵𝑡 represent benefits due to the intervention of microfinance in year t, calculated as 𝑤𝑡 ∗ 𝑎𝑡,
where 𝑤 are aggregate welfare gains with full adoption or full capacity utilized, 𝑎𝑡 is the
adoption/utilization rate in year t; 𝐵𝑇+1 is the annual benefit that occurs every year (perpetuity)
starting in period 𝑇 + 1, calculated as 𝑤𝑡+1 ∗ 𝑎𝑡+1 where 𝑎𝑇+1 = 1; 𝐶𝑡 is the annual expenditure in
year t, 𝐶𝑇+1 is the annual cost that occurs every year (perpetuity) starting in period 𝑇 + 1 , as
microfinance institutions will have to pay fee and interest on the funds they borrow that is assumed
to be decreasing over time; and 𝛿 is the discount rate. In our case, 𝑤𝑡 = 𝐵𝑡 − 𝐶𝑡.
II.2.1 Benefit Cost Ratio (BCR) BCR is a relative measure of benefit-cost analysis that can be calculated by dividing total
compounded/discounted benefits by total compounded/discounted costs.
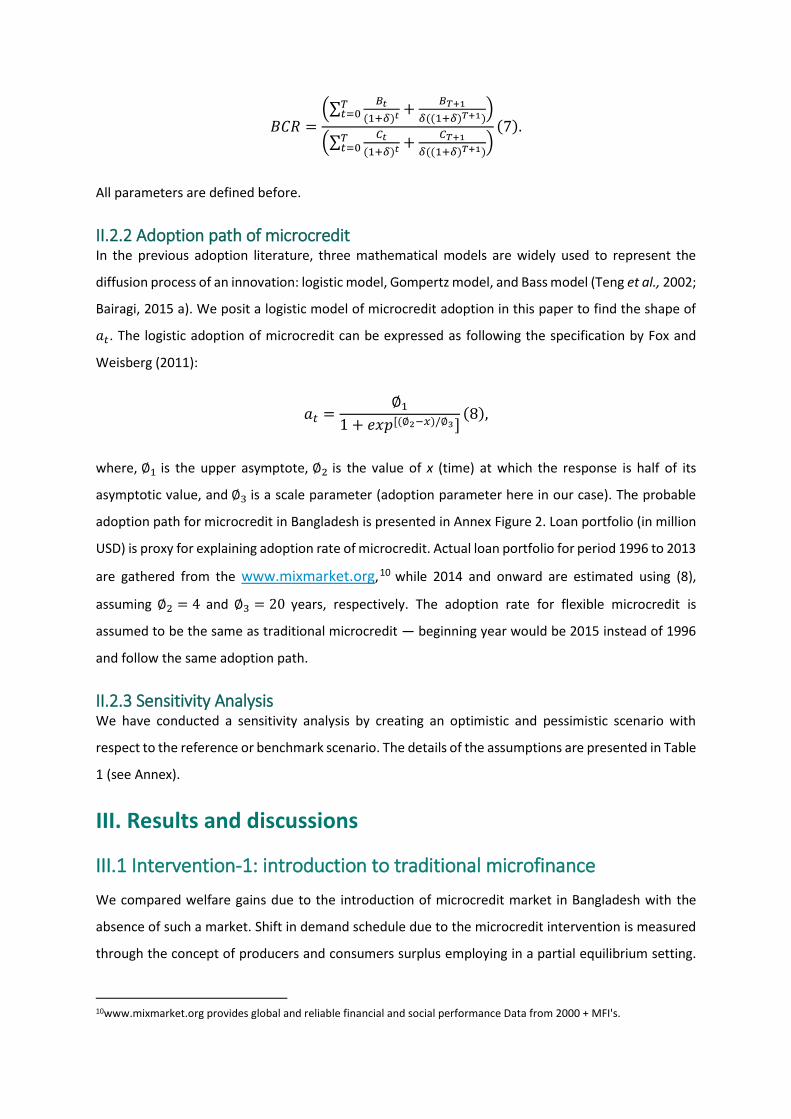
𝐵𝐶𝑅 =(∑
𝐵𝑡
(1+𝛿)𝑡𝑇𝑡=0 +
𝐵𝑇+1
𝛿((1+𝛿)𝑇+1))
(∑𝐶𝑡
(1+𝛿)𝑡𝑇𝑡=0 +
𝐶𝑇+1
𝛿((1+𝛿)𝑇+1))
(7).
All parameters are defined before.
II.2.2 Adoption path of microcredit In the previous adoption literature, three mathematical models are widely used to represent the
diffusion process of an innovation: logistic model, Gompertz model, and Bass model (Teng et al., 2002;
Bairagi, 2015 a). We posit a logistic model of microcredit adoption in this paper to find the shape of
𝑎𝑡. The logistic adoption of microcredit can be expressed as following the specification by Fox and
Weisberg (2011):
𝑎𝑡 =∅1
1 + 𝑒𝑥𝑝[(∅2−𝑥)/∅3](8),
where, ∅1 is the upper asymptote, ∅2 is the value of x (time) at which the response is half of its
asymptotic value, and ∅3 is a scale parameter (adoption parameter here in our case). The probable
adoption path for microcredit in Bangladesh is presented in Annex Figure 2. Loan portfolio (in million
USD) is proxy for explaining adoption rate of microcredit. Actual loan portfolio for period 1996 to 2013
are gathered from the www.mixmarket.org,10 while 2014 and onward are estimated using (8),
assuming ∅2 = 4 and ∅3 = 20 years, respectively. The adoption rate for flexible microcredit is
assumed to be the same as traditional microcredit — beginning year would be 2015 instead of 1996
and follow the same adoption path.
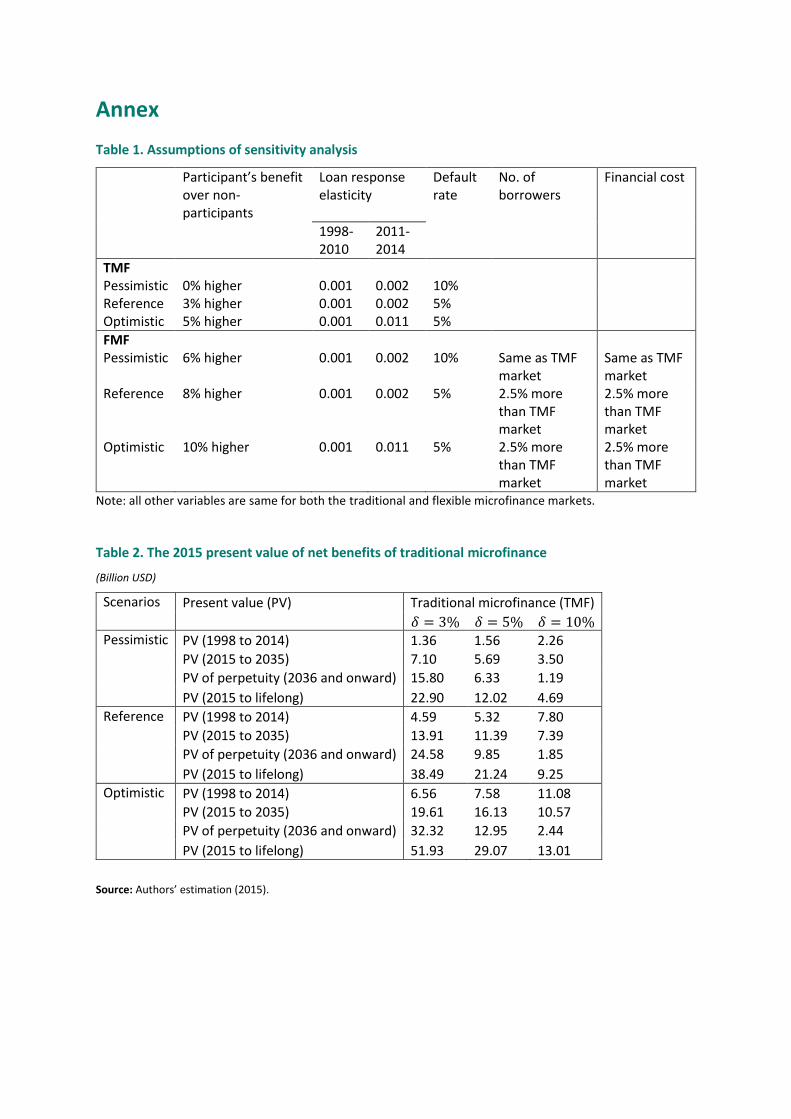
II.2.3 Sensitivity Analysis We have conducted a sensitivity analysis by creating an optimistic and pessimistic scenario with
respect to the reference or benchmark scenario. The details of the assumptions are presented in Table
1 (see Annex).
III. Results and discussions
III.1 Intervention-1: introduction to traditional microfinance
We compared welfare gains due to the introduction of microcredit market in Bangladesh with the
absence of such a market. Shift in demand schedule due to the microcredit intervention is measured
through the concept of producers and consumers surplus employing in a partial equilibrium setting.
10www.mixmarket.org provides global and reliable financial and social performance Data from 2000 + MFI's.
Theoretically, the concept of the “returns to own inputs” can be employed to measure producers’
surplus. Hence, surplus to MFIs’ can be realized from its own inputs markets; similarly borrowers’
surplus from either land or labour markets depending on what inputs they own (Annex Figure 3).
Benefits to the borrowers
Estimating benefits to the borrowers, we assume perfect competitive market or zero profit condition,
𝜋𝐵𝑇𝑀𝐹 = 0. Hence, their surplus would be returns to their own inputs that are used to produce an
output bundles. In Bangladesh, cost shares of land and labour to revenue income for producing rice
are 35% and 31%, respectively (estimates based on 20 empirical studies during 1994 to 2014 period
by Bairagi, 2015b). It is assumed that microcredit participants invest the loan borrowed from the
microfinance institutions for productive purposes. The targeted microcredit beneficiaries in
Bangladesh are small or marginal farmers and business entrepreneurs. If they own land, their surplus
would be returns to their land; if they invest their labour for productive purposes, then their surplus
would be returns to their labour. As the shares of land and labour for rice cultivation are almost the
same, we use a common rate of revenue share of 30% to estimate the returns to
borrowers/microcredit participants’ own inputs. Surplus to microcredit participants would be: 𝑅𝐵𝑂𝐼 =
0.3 ∗ 𝐼, where 𝐼 is the borrowers’ household income, 𝐼 ≡ 𝑝𝑦. Household income from the enterprises
is calculated as: 𝐼 = 𝑃𝐶𝐼 ∗ 𝐹𝑆, where PCI is per capita income, and FS is the average family size, which
is assumed to be 4.5.11 Production costs are assumed to be the same for both the participants and
non-participants.12
Benefits to the microcredit participants are calculated as: 𝐵𝐵𝑇𝑀𝐹 = 𝑅𝐵
𝑂𝐼 − 𝑅𝑁𝐵𝑂𝐼 . Chemin (2008)
estimated that microcredit participants spend 3% more than the non-participants, which is lower than
PK’s (1998) estimates but greater than Murduch (1999) estimates. We used Chemin’s (2008) estimate,
assuming income equals consumption, to calculate the benefits for participants over non-participants,
as the reference point. Non-participants’ returns to own inputs are: 𝑅𝑁𝐵𝑂𝐼 =
𝑅𝐵𝑂𝐼
1.03, consequently,
𝐵𝐵𝑇𝑀𝐹 = 𝑅𝐵
𝑂𝐼 −𝑅𝐵
𝑂𝐼
1.03. Aggregate benefit to microcredit participants over non-participants are estimated
as: 𝐵𝑇𝑀𝐹 = 𝐵𝐵𝑇𝑀𝐹 ∗ 𝑁, where, 𝑁 is the number of female borrowers, gathered from the MIXMARKET
(2005).
11According to HEIS 2005 (Household Expenditure and Income Survey by BBS), national average household size in Bangladesh
is 4.85. 12To estimate the loan cost, 𝑟𝑙, average interest rate is assumed, which is though a crude assumption. Note that the interest
rates of microcredit vary widely among the microfinance institutions in Bangladesh (Mahmud and Khalily 2008, cited in
Bairagi 2014). MFIs’ revenue income per borrower, gathered from MIXMARKET (2015), is considered as loan cost for
borrowers. Other production costs are estimated as: 𝐼 − 𝑟𝑙 − 𝑅𝐵𝑂𝐼 => 0.7 ∗ 𝐼 − 𝑟𝑙.
Plugging in all the above functions into the aggregate benefit function, we came up with the following
equation, which is defined as borrowers net-benefits function due to microcredit:
𝐵𝑇𝑀𝐹 = (0.009
1.03) 𝑃𝐶𝐼 ∗ 𝐹𝑆 ∗ 𝑁 (9)
All variables are defined before. 13 A flow of income for 1998 to 2013 period is estimated given the
loan response elasticities and amount of loans disbursed during these years. Per capita income for
fiscal years 1998-99 and 2010-11 were gathered from Khandker and Samad (2014) — $126 and $187
(in nominal dollars), respectively. They estimated 10 functional specifications to find the loan response
to income, consumption, and other outcome variables. They found the loan response elasticities14
ranged between -0.022 and 0.018 (five of 30 were negative signed). Roodman and Morduch (2009)
bootstrapped the PK (1998) estimator based on their data and found the loan response elasticity to
consumption to be between -0.04 and -0.06. In our analysis, we used 0.001 for 1998-99 to 2008-09
period and 0.002 for 2010-11 to 2012-13 period to estimate the levels of per capita income. This will
constitute the reference per capita income flows. We estimated change in loan using the annual data
on loan portfolio, gathered from the MIXMARKET (2015).
Benefits to the microfinance institutions
The microfinance institutions earn income as interest and fee that are collected from the borrowers,
called financial revenue. The MIXMARKET reports financial revenues by MFIs after deducting the
amount of default loan. We used year-wise (1996 to 2013) aggregate financial revenue after adjusting
it with GDP deflators by the World Bank. Note that the cumulative repayment rates of most of the
MFIs in Bangladesh are above 95% (Charitonenko and Rahman 2002). In other words, default rate is
less than 5%.
Costs to the microfinance institutions
Three types of costs that the microfinance institutions face are considered in our analysis: (i) financial
expenses (interest and fees they repay to sources of funds or donors), (ii) operating expenses
(personnel expense, depreciation and amortization, and administrative expense and (iii) impairment
loss.15 Year-wise costs by microfinance institutions are gathered from the MIXMARKET (2015). These
costs for 1998-2013 periods by microfinance institutions are gathered from the MIXMARKET (2015).
13An example is given: For 2014, the estimated benefits to the microcredit participants, using (9), would be $97 billion
(=[(0.009/1.03)187*4.5*13.2]). In 2014, total number of active female borrowers was 13.2 million. 14𝜇 = 𝑑𝑙𝑛 𝑃𝐶𝐼 𝑑𝑙𝑛 𝑙⁄ , which implies the percentage change in income due to a percentage increase in loan amount. 15This is a non-cash expense calculated as a percentage of the value of the loan portfolio that is at risk of default. The
definition can also be found at http://www.mixmarket.org/about/faqs/glossary.
The data show that on an average operating cost accrues approximately 40% to the revenue income,
followed by financial cost (31%), and impairment cost (7%).
To estimate future cash flows (2014 to 2035 period), we use this following method. Revenue income
realized when adoption reach to 100% is estimated using the ratio of average (2011-2013) revenue to
adoption rate16. The estimated revenue income is then used to obtain the flows of revenue incomes
for 2014 to 2034 periods multiplying by the adoption profile with it. Estimating future flows of costs,
assuming decreasing average cost, we multiply cost shares to the estimated flows of revenue incomes.
Average (2011-2013) cost to revenue share, 0.8, is used for the first ten years’, while 0.7 is used for
second ten years. For 2034 and onwards 0.6 is used to estimate flows of costs, as operating cost is
assumed to be constant since adoption rate approaches to around 90%. Cash flows are then
discounted with three different social discount rates (3%, 5%, and 10%) to estimate the net present
values.
The results show that the 2015 present value of compounded net benefits from the traditional
microcredit market in Bangladesh for 1998-2014 period is estimated to be between 1.5 billion and
11.0 billion US dollars, depending on the discount rates, rate of microcredit participants’ net-benefit
over non-participants’ benefit, default rates, and the loan response elasticity (Table 2). The
contribution to society would have been even larger if we were to estimate the life-long benefits
because of the intervention of microcredit market, assuming benefits from microcredit to society will
last forever. We assume that current adoption rate of credit is about 32%. We estimated a flow of
benefits and costs for 2015 to 2035, using an estimated adoption path—fully adoption would be
realized in 2035 (Annex Figure 2). For onward 2036, we estimated the present value of perpetuity. We
also estimated the net present value for 2015-lifelong period (discounted), to be between 5 and 52
billion US dollars, which will be compared with the estimated present value from flexible microfinance.
Net-benefits are disaggregated at the stakeholders’ level and presented in Table 5. The esimtated
2015 net-benefits to the microcredit participants are estimated between 0-23 billion US dollars,
depending on the assumptions in Table 1. While 5-25 billion US dollars are estimated for microfinance
institutions in Bangladesh.
The benefit-cost ratio (BCR) is also estimated for the traditional microfinance, which we found to be
between 1.32 and 2.09 (Table 4). Sinha et al. (2008) estimated the cost-benefit for BRAC’s CFPR
program and found it to be between 3.12 and 6.23, depending on discount rates as well as span of
16 Suppose, the borrowers’ benefit for 2013 is 130 million USD. The estimated adoption rate of that year is
0.38. For 2035, when adoption reach to 100%, benefit to borrower is estimated as 130
0.38.
benefit years. Aghion and Morduch (2005) cited Khandker (2003) estimates of cost-benefit ratio of
Grameen’s effectiveness, which was 1.57; 2.59 to 3.53 for the microfinance programme of BRAC. The
benefit-cost ratio of BRAC’s ultra-poor program is found to be 5.4 if life-long benefit years are
considered (Bandiera, undated). It should be mentioned here that the redistributive effect,
empowerment impact and many aspects of complex social benefits have not been considered in our
estimation. Possible inclusion of these factors, which is beyond the scope of this paper, would certainly
inflate the BCRs of traditional microfinance. The estimated BCRs could have been even larger, if the
benefits to all MFIs were to be included in the analysis. As mentioned above, we only included the
information of 77 MFIs in Bangladesh, which are reported by the MIXMARKET.
III.2 Intervention-2: introduction to flexible microfinance Competition among microfinance institutions (MFIs) in Bangladesh has increased over time (Khandker
and Samad, 2014; Ashraf, 2014; and Ferdous and Uddin, 2010, cited in Zohir, 2014). However, as
previously mentioned, three giants (GB, BRAC, and ASA) capture approximately 50-65% of total
market share. These MFIs have already started to offer the heterogeneous products as well as flex-
term loan to exert the market power. The main target group of the flex-term loan is the ultra poor
households. Some of the noticeable flex-programs are offering monthly repayment instead of weekly
((BRAC's ultra-poor program, and PKSF's PRIME17 (Khandker et al. 2013)). Since 2008, the PRIME
program has been implementing flexible microcredit through 16 PKSF’s partner organizations. The
products that they offer are flexible microcredit and emergency loans. As of June 2013, the cumulative
amount of 123 million US dollars (Tk. 9.644 billion) flexible microcredit has been disbursed to 512
thousands borrowers of 50 Upazilas in Bangladesh (PKSF 2014). The Institute of Microfinance (InM,
2012) evaluated the effectiveness of PRIME intervention after four years of that program’s
implementation. They found, using the difference-in-difference (DID) technique, that the annual
income of the PRIME participants had increased about 8.3% in 2010 compared to the benchmark
households. In our analysis, benefit to the participants of flexible microcredit is considered 8% higher
than the non-participants’ benefit, called the reference benefit.
Shonchoy and Kurosaki (2014) conducted a randomized control trial (RCT) experiment applying a
temporary moratorium to repayments during the designated Monga period in Bangladesh. The
authors treated it with an inflexible traditional microcredit. The results showed that borrowers with
flexible microcredit had positive impact on food consumption after one year of intervention. However,
there is no evidence of statistically significant difference between the traditional (10%) and flexible
(11-12%) default rates. Field et al. (2014) reported that granting grace period might increase default
17Programmed Initiatives for Monga Eradication.
rates. They conducted an experimental design to examine the effect of introducing two-month grace
period on business outcome. They found that household income increased 17%, but default rate
increased too, from 2% to 10%. Weber et al. (2014) found that the delinquency rates were significantly
different between seasonal farmers with flexible repayments schedules and non-farmers. Therefore,
we considered MFIs’ revenue forgone due to the additional default rate, 10% is considered for a
pessimistic case.
Flexible microfinance will be more attractive to the existing as well as new (the very poor) consumers.
So the number of borrowers will increase because of flexibility (Wright, 2001; Woller, 2002). Weber
et al. (2014) found the inclusion of small farmers in Madagascar was possible with flexible
microfinance. Because of flexible microfinance in Bangladesh, the derived demand for loan will shift
outwards, which means that more loans will be disbursed/supplied compared to the traditional
market. We assume approximately an addition of 2.5% new consumers will enter the microcredit
market (Table1). Consequently, total amount of loan disbursement will increase; so will MFIs’ profit.
However, their financial expenses might increase. The financial cost is assumed to be increasing at
2.5% under the flexible system than the traditional system. Estimating additional benefits to the
implementers, we multiply the current benefits of implementers by the increased numbers of
borrowers.
Because of the introduction of the grace period, MFIs have to wait longer to get the return of principal
along with interests than without grace period. So there is an opportunity cost of waiting in the grace
period. However, implementers can save some costs related to loan collections, as loan collectors do
not have to visit the field to collect loan during the grace period. Both these benefits and costs are
minimal, and are neglected in our analysis.
The results show that under the flexible microcredit regime (2015 to life-long) potential welfare gains
to the society are almost the same as the welfare gains under the traditional microcredit regime (2015-
life-long). However, flex borrowers benefit significantly more than under the traditional microcredit
system. The 2015 present value due to the intervention of flexible microfinance is estimated to be
between 4 billion and 51 billion US dollars (Table 3), depending on the discount rates, rate of credit
adoption, as well as other assumptions in Table 1. Potential net-benefits to the flex borrower are
estimated to be 3-36 billion US dollars. It is worth mentioning that discounted life-long net-benefit of
flex loan borrowers are significantly higher than MFIs’ net-benefit. We also found that the estimated
benefit-cost ratio for flexible microcredit is between 1.93 and 2.60 (Table 3), which is about 25-45%
higher than the benefit-cost ratio for the traditional microcredit.
IV. Conclusions
This paper estimates the social benefits of the intervention of traditional microcredit, and compared
it with the benefits from introducing of flexible microcredit (borrowers are granted a grace period
during the lean period under traditional microcredit system). The NPV and BCR measures are applied
to compare the net benefits estimated with different social discount rates (3%, 5%, and 10%) as well
as three different scenarios in Table 1. We posit a logistic pattern of credit adoption path—full
adoption is assumed to be realized within 40 years. Both the traditional and flexible microcredit follow
the same adoption path. It is assumed that the net benefits from microcredit will last forever.
Our analysis reveals that under the flexible microcredit regime potential welfare gains to society are
almost the same as the welfare gains under the traditional microcredit regime. However, flex
borrowers would benefit significantly more than under traditional microcredit regime. The estimated
present value of net benefits is between 17 billion and 59 billion US dollars under flexible microcredit,
depending on the discount rates, rate of credit adoption, as well as the assumptions in Table 1. In
contrast, the net benefits for the traditional microcredit are estimated to be between 5 billion and 52
billion US dollars. The benefit-cost ratio for flexible microcredit is estimated to be between 1.93 and
2.60 while for traditional microcredit it is to be between 1.32 and 2.09. Therefore, creating a new
flexible microcredit market in Bangladesh for the very poor (a new cohort) as well as the existing
borrowers would be beneficial for the country. Microfinance institutions might think of introducing a
menu of flexible products in the market. However, a detailed cost-benefit analysis of each flexible
program is required.
References
Aghion, B.A., and J. Morduch (2005). The Economics of Microfinance. The MIT Press, Cambridge, Massachusetts, London, England. Alston, J.M., G.W. Norton, and P.G. Pardey. 1998. Science under scarcity: Principles and practice for agricultural research evaluation and priority setting. Wallingford, UK: CAB International. Ashraf, M.A. (2014) Understanding the Nature of Dropouts in MFIs: Evidence from Rural Bangladesh. European Journal of Business and Management, Vol.6 (7): 62-70. Assefa, E., Hermes, N. and Meesters, A. (2013) Competition and the performance of Microfinance Institutions, Applied Financial Economics, 23, 767–82. Baiiragi, S. (2014) Productivity and Efficiency of Microfinance Institutions (MFIs) in Bangladesh. MPRA Paper 67917, University Library of Munich. Bairagi, S. (2015 a). Ex-ante Economic Assessment of Research: High Omega-3 Soybean Oil for Mariculture. Unpublished PhD Thesis, Department of Agricultural Economics, University of Nebraska-Lincoln. Bairagi, S. (2015 b). Welfare Impact of Import Duty in Rice Market of Bangladesh. Paper was prepared for to present the 2016 AAEA annual meeting. Bairagi, S. and A. Azzam (2014) Does the Grameen Bank Exert Market Power Over Borrowers? Applied Economics Letter 21:866-869. Bandiera, O., M (undated). BRAC’s Ultra-Poor Programme: Graduation in the Longer Term. Available
at: http://www.theigc.org/wp-content/uploads/2015/08/bandieraIGC-7y.pdf Banerjee, A, E.Duflo, R.Glennerster, and C.Kinnan. (2009) "The Miracle of Microfinance? Evidence from a randomized evaluation." Working paper. Banerjee, A., D. Karlan, and J. Zinman. (2015). Six Randomized Evaluations of Microcredit: Introduction and Further Steps. American Economic Journal: Applied Economics, Vol. 7(1): 1–21. CDF (2015) Bangladesh Microfinance Statistics 2014-15. Dhaka: Credit Development Forum (CDF). Charitonenko, S. and S.M. Rahman (2002).Commercialization of Microfinance in Bangladesh. Manila: Asian Development Bank. Philippines. Chemin, M. (2008) The Benefits and Costs of Microfinance: Evidence from Bangladesh. Journal of Development Studies, 44 (4): 463-484. Czura, K., D. Karlan, and S. Mullainathan (2011). Does Flexibility in Microfinance Pay Off? Evidence from a Randomized Evaluation in Rural India. Working Paper, Goethe University Frankfurt. Feigenberg, B., E. Field, and R. Pande (2011) The Economic Returns to Social Interaction: Experimental Evidence from Microfinance. Harvard University. Ferdous, F. and Uddin, G. M. (2010). Microfinance. First News, 8 August: 36 – 47.
Field, E. and R. Pande, (2008). Repayment Frequency and Default in Micro-Finance: Evidence from India. Journal of the European Economic Association. Vol. 6 (2-3): 501-509. Field, E., A. Holland, and R. Pande (2014). Microfinance: Point of Promise. Available at:
http://www.hks.harvard.edu/fs/rpande/papers/microcredit_chapter_2014_09_12_2.pdf (accessed 12 March 2016). Field,E., R.Pande, and J. Papp, (2009). Does Microfinance Repayment Flexibility Affect Entrepreneurial Behavior and Loan Default? Field, E., R. Pande, J. Papp, and N. Rigol (2013). Does the Classis Microfinance Model Discourage Entrepreneurship Among the Poor? Experimental Evidence from India. American Economic Review, 103(6): 2196-2226. Field, E., R. Pande, J. Papp, and Y.J. Park (2012). Repayment Flexibility Can Reduce Financial Stress: A Randomized Control Trials with Microfinance Clients In India. PLoS One, Vol. 7(9). Fox, J., and S. Weisberg. 2011. An R Companion to Applied Regression, second edition, Thousand Oaks, California: SAGE Publication Inc. Gine, X., and D. Karlan (2011) Group versus Individual Liability: Short and Long Term Evidence from Philippine Microcredit Lending Groups. Economic Growth Centre, Yale University, New Haven, CT, USA. Hossain, M. 1984: “Credit for the Rural Poor, The experience of Grameen Bank in Bangladesh, Research Monograph No. 4, BIDS, Dhaka. Hossain, M. 1988: Credit for Alleviation of Rural poverty: The Grameen Bank in Bangladesh’, Research Report 65, International Food Policy Research Institute, Washington, D.C. Hulme, D., and P. Mosley (1996). Finance Against Poverty. Routledge, London. InM. (2012). Effectiveness for PRIME Interventions in Greater Rangpur at the Household Level and Institutional Level: A Longitudinal Approach. Dhaka: Institute of Microfinance (InM). Islam, A., C.N.H. Nguyen, and R. Smyth. 2013. Does microcredit change informal lending in village economies? Evidence from Bangladesh. Karlan, D. and S. Mullainathan (2009). Is Microfinance Too Rigid? VoxEU December 2007. Khandker, S. R. 2003, Micro-finance and Poverty: Evidence Using Panel Data from Bangladesh, World Bank Policy Research Working Paper 2945. Khandker, S.R. and H.A. Samad (2014). Dynamic Effect of Microcredit in Bangladesh. Policy Research Working Paper, No. 6821.The World Bank. Khandker, S.R., B. Khalily,and H. Samad, (2010). "Vulnerability to Seasonal Hunger and Its Mitigation in Northwest Bangladesh," Working Papers 4, Institute of Microfinance (InM).
Khandker, S.R., M.A. B. Khalily, and H. A. Samad. (2013) Seasonal Hunger and Its Mitigation in Northwest Bangladesh. The World Bank. Khandker, Shahidur R. (2005). Microfinance and Poverty: Evidence Using Panel Data from Bangladesh. The World Bank Economic Review, 19(2), 263-286. Laurreti, C. and M. Hamp. (2011). Innovative Flexible Products in Microfinance. Savings and Development Vol. 35 (1): 97-129. Lebei, M., C. laureti, and A. Szafarz. (2013) Flexible Products in Microfinance: Overcoming the Demand-Supply Mismatch. Meyer, R.L. 2002. The Demand for Flexible Microfinance Products: Lessons from Bangladesh. Journal of International Development, Vol. 14 (3). Mokhtar, S.H., G. Nartea, and C. Gan. (2012). Determinants of microcredit loans repayment problem among microfinance borrowers in Malaysia. International Journal of Business and Social Research, Vol. 2 (7): 33-45. Morduch, J. (1999) "The Microfinance Promise." Journal of Economic Literature Vol. 37: 1569-1614. Morduch, J. 1998. “Does Microfinance Really Help the Poor? New Evidence from Flagship Programs in Bangladesh” (mimeo). MRA (2010), NGO-MFIs in Bangladesh, Vol. 7, Microcredit Regulatory Authority, Dhaka, Bangladesh. Osmani, S.R. (2012) Asset Accumulation and Poverty Dynamics in Rural Bangladesh: The Role of Microcredit. Working Paper No. 11, Institute of Microfinance, Dhaka. Pakrashi, D., C. Maitra, and A. Islam. 2014. Microcredit Program Participation and Household Food Security in Rural Bangladesh. Available at:
http://www.isid.ac.in/~epu/acegd2014/papers/DebayanPakrashi.pdf Pitt, M. M. 1999. “Reply to Jonathan Morduch's 'Does Microfinance Really Help the Poor? New Evidence from Flagship Programs in Bangladesh'.” (mimeo). Pitt, M. M. 2011. Response to Roodman and Morduch’s “The Impact of Microcredit on the Poor in Bangladesh: Revisiting the Evidence.” Brown University. Pitt, M. M. 2014, “Re-Re-Reply to “The Impact of Microcredit on the Poor in Bangladesh: Revisiting the Evidence”. World Bank Policy Research Working Paper No. 6801. Pitt, M. M. and S. R. Khandker. 1998. “The Impact of Group-based Credit Programs on Poor Households in Bangladesh: Does the Gender of Participants Matter?” Journal of Political Economy, 106 (June): 958-996. Pitt, M. M., S. R. Khandker, and J. Cartwright. 2006. “Empowering Women with Micro Finance: Evidence from Bangladesh,” Economic Development and Cultural Change, Vol. 54 (4): 791-831. PKSF (2014). Annual Progress Report: PRIME and LIFT 2012-13. Dhaka: Palli Karma-Sahayak Foundation (PKSF).
Rahman, S. 2007. The Impact of Microcredit on Poverty and Women’s Empowerment: A Case Study of Bangladesh. PhD Thesis, Submitted to the School of Economics and Finance, College of Law and Business, University of Western Sydney. Raihan, S., S.R. Osmani, and M.A. Baqui Khalily (2015).Contribution of Microfinance to the Gross Domestic Product (GDP) of Bangladesh. InM Working Paper, No. 44. Dhaka: Institute of Microfinance. Rishad, S. S. (2012) Do Profit Incentives Matter in Microfinance Programs? MRA 2016. List of Licenced MFIs as of 31 December’2015. Available at:
http://www.mra.gov.bd/images/Licensed_NGO_MFIs/le311215.pdf (accessed on 27 January 2016). Roodman, D. and J. Morduch. (2009). The Impact of Microcredit on the Poor in Bangladesh: Revisiting the Evidence. Revised in 2011. Available at:
http://www.cgdev.org/files/1422302_file_Roodman_Morduch_Bangladesh_2.pdf Roodman, D. and J. Morduch. (2013). The Impact of Microcredit on the Poor in Bangladesh: Revisiting the Evidence. The Journal of Development Studies, Vol. 50(4): 583-604. Schroeder, Elizabeth (2014) The Impact of Microcredit Borrowing on Household Consumption in Bangladesh. Mimeo, Georgetown University Economics Department. Shonchoy and Kurosaki (2014). Impact of Seasonality-adjusted Flexible Microcredit on Repayment and Food Consumption: Experimental Evidence from Rural Bangladesh. IDE Discussion Paper No. 460. Japan: Institute of Developing Economies. Sinha, S., J. Gidwani, and N.C. Das. (2008). Cost-benefit Analysis of CFPR. Dhaka: Bangladesh Rural Advancement Committee (BRAC). Teng, J.T.C., V. Grover, and W. Guttler. 2002. Information Technology Innovations: General Diffusion Patterns and its Relationship to Innovation Characteristics. IEEE Transaction on Engineering Management 49(1): 13–27. Tsukada, K. (2012). Microfinance Revisited: Towards a More Flexible Lending Contracts, Ch. 2. In Abu Shonchoy ed., Seasonality Adjusted Flexible Micro-Credit: An Randomized Experiment in Bangladesh, Interim Report, Chosakenkeu Hokokusho, IDE-JETRO 2012. Wadud, A. (2013). "Impact of Microcredit on Agricultural Farm Performance and Food Security in Bangladesh," Working Papers 14, Institute of Microfinance (InM). Weber, R., and O. Musshoff. (2013). Can Flexible Microfinance Loans Improve Credit Access for Farmers? Agricultural Finance Review, Vol. 73 (2): 255-271. Weber, R., O. Mushoff, and M. Petrick. (2014). How Flexible Repayment Schedules Affect Credit Risk in Agricultural Microfinance. Discussion Paper, No. 1404.Department fur Agrarökonomie und Rurale Entwicklung, Georg-August Universität Göttingen. Woller, G. 2002. “From Market Failure to Marketing Failure: Market Orientation as the Key to Deep Outreach in Microfinance.” Journal of International Development 4: 305-324.
Wright, G.A.N. 2001. “Dropouts and Graduates: Lessons from Bangladesh.” Microbanking Bulletin 6: 14-16. Yuge, Y. (2011) The Current Situation of Microfinance in Bangladesh: A Growing Concern about Overlapping Loan Problems – From a Field Visit to Rajshahi and Comilla. Student Research Series, March 2011, The Fletchers School, Tufts University. Yunus, M. (2013) Sacrificing microcredit for mega profits, New York Times (1 January). Available at
http://www.nytimes.com/2011/01/15/opinion/15yunus.html?_r=0 (accessed 19 November 2015). Zaman, H. (2004).Microfinance in Bangladesh: Growth, Achievements, and Lessons. The World Bank. Zaman, M. (2013).Achievement and Problems of Microfinance of Two Leading MFIs in Bangladesh: A Case Study of GB and ASA. ASA University Review, Vol. 7 (2): 183-198.
Annex
Table 1. Assumptions of sensitivity analysis
Participant’s benefit over non-participants
Loan response elasticity
Default rate
No. of borrowers
Financial cost
1998-2010
2011- 2014
TMF Pessimistic 0% higher 0.001 0.002 10% Reference 3% higher 0.001 0.002 5% Optimistic 5% higher 0.001 0.011 5%
FMF Pessimistic 6% higher 0.001 0.002 10% Same as TMF
market Same as TMF market
Reference 8% higher 0.001 0.002 5% 2.5% more than TMF market
2.5% more than TMF market
Optimistic 10% higher 0.001 0.011 5% 2.5% more than TMF market
2.5% more than TMF market
Note: all other variables are same for both the traditional and flexible microfinance markets.
Table 2. The 2015 present value of net benefits of traditional microfinance
(Billion USD)
Scenarios Present value (PV) Traditional microfinance (TMF) 𝛿 = 3% 𝛿 = 5% 𝛿 = 10% Pessimistic PV (1998 to 2014) 1.36 1.56 2.26 PV (2015 to 2035) 7.10 5.69 3.50 PV of perpetuity (2036 and onward) 15.80 6.33 1.19 PV (2015 to lifelong) 22.90 12.02 4.69
Reference PV (1998 to 2014) 4.59 5.32 7.80 PV (2015 to 2035) 13.91 11.39 7.39 PV of perpetuity (2036 and onward) 24.58 9.85 1.85 PV (2015 to lifelong) 38.49 21.24 9.25
Optimistic PV (1998 to 2014) 6.56 7.58 11.08 PV (2015 to 2035) 19.61 16.13 10.57 PV of perpetuity (2036 and onward) 32.32 12.95 2.44 PV (2015 to lifelong) 51.93 29.07 13.01
Source: Authors’ estimation (2015).
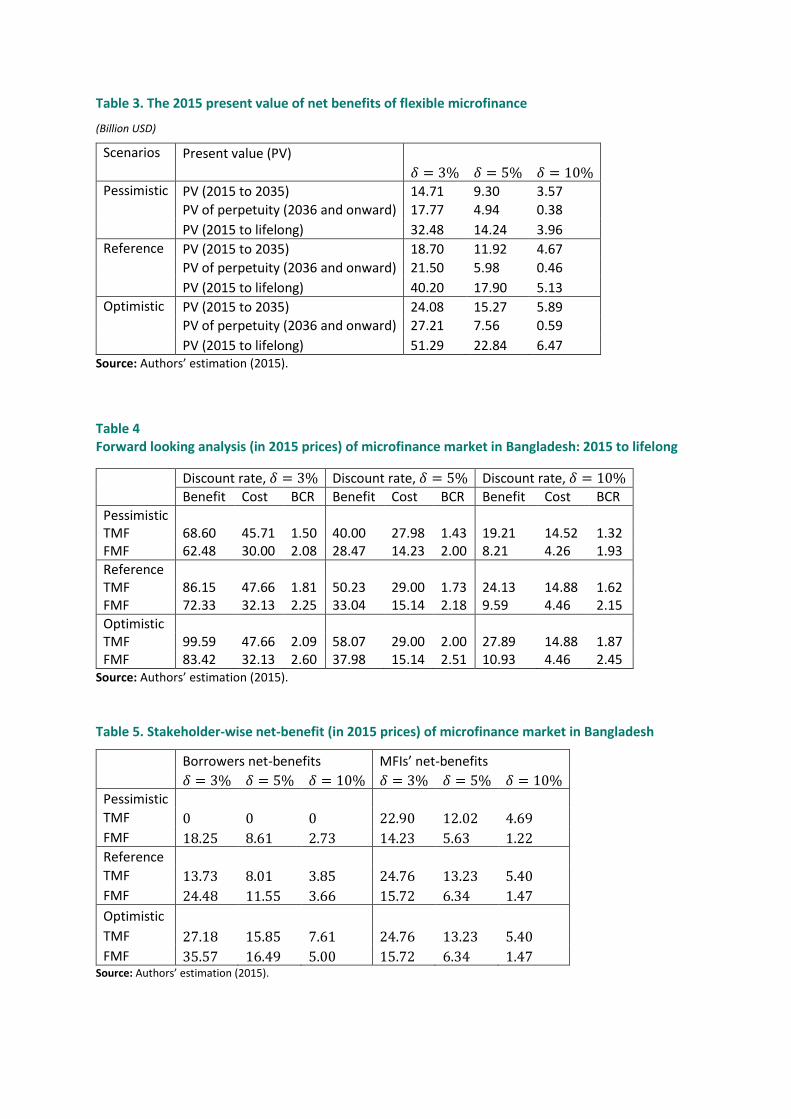
Table 3. The 2015 present value of net benefits of flexible microfinance
(Billion USD)
Scenarios Present value (PV) 𝛿 = 3% 𝛿 = 5% 𝛿 = 10% Pessimistic PV (2015 to 2035) 14.71 9.30 3.57 PV of perpetuity (2036 and onward) 17.77 4.94 0.38 PV (2015 to lifelong) 32.48 14.24 3.96
Reference PV (2015 to 2035) 18.70 11.92 4.67 PV of perpetuity (2036 and onward) 21.50 5.98 0.46 PV (2015 to lifelong) 40.20 17.90 5.13
Optimistic PV (2015 to 2035) 24.08 15.27 5.89 PV of perpetuity (2036 and onward) 27.21 7.56 0.59 PV (2015 to lifelong) 51.29 22.84 6.47
Source: Authors’ estimation (2015).
Table 4 Forward looking analysis (in 2015 prices) of microfinance market in Bangladesh: 2015 to lifelong
Discount rate, 𝛿 = 3% Discount rate, 𝛿 = 5% Discount rate, 𝛿 = 10%
Benefit Cost BCR Benefit Cost BCR Benefit Cost BCR
Pessimistic TMF 68.60 45.71 1.50 40.00 27.98 1.43 19.21 14.52 1.32 FMF 62.48 30.00 2.08 28.47 14.23 2.00 8.21 4.26 1.93
Reference TMF 86.15 47.66 1.81 50.23 29.00 1.73 24.13 14.88 1.62 FMF 72.33 32.13 2.25 33.04 15.14 2.18 9.59 4.46 2.15
Optimistic TMF 99.59 47.66 2.09 58.07 29.00 2.00 27.89 14.88 1.87 FMF 83.42 32.13 2.60 37.98 15.14 2.51 10.93 4.46 2.45
Source: Authors’ estimation (2015).
Table 5. Stakeholder-wise net-benefit (in 2015 prices) of microfinance market in Bangladesh
Borrowers net-benefits MFIs’ net-benefits
𝛿 = 3% 𝛿 = 5% 𝛿 = 10% 𝛿 = 3% 𝛿 = 5% 𝛿 = 10% Pessimistic
TMF 0 0 0 22.90 12.02 4.69
FMF 18.25 8.61 2.73 14.23 5.63 1.22 Reference
TMF 13.73 8.01 3.85 24.76 13.23 5.40
FMF 24.48 11.55 3.66 15.72 6.34 1.47
Optimistic
TMF 27.18 15.85 7.61 24.76 13.23 5.40
FMF 35.57 16.49 5.00 15.72 6.34 1.47 Source: Authors’ estimation (2015).
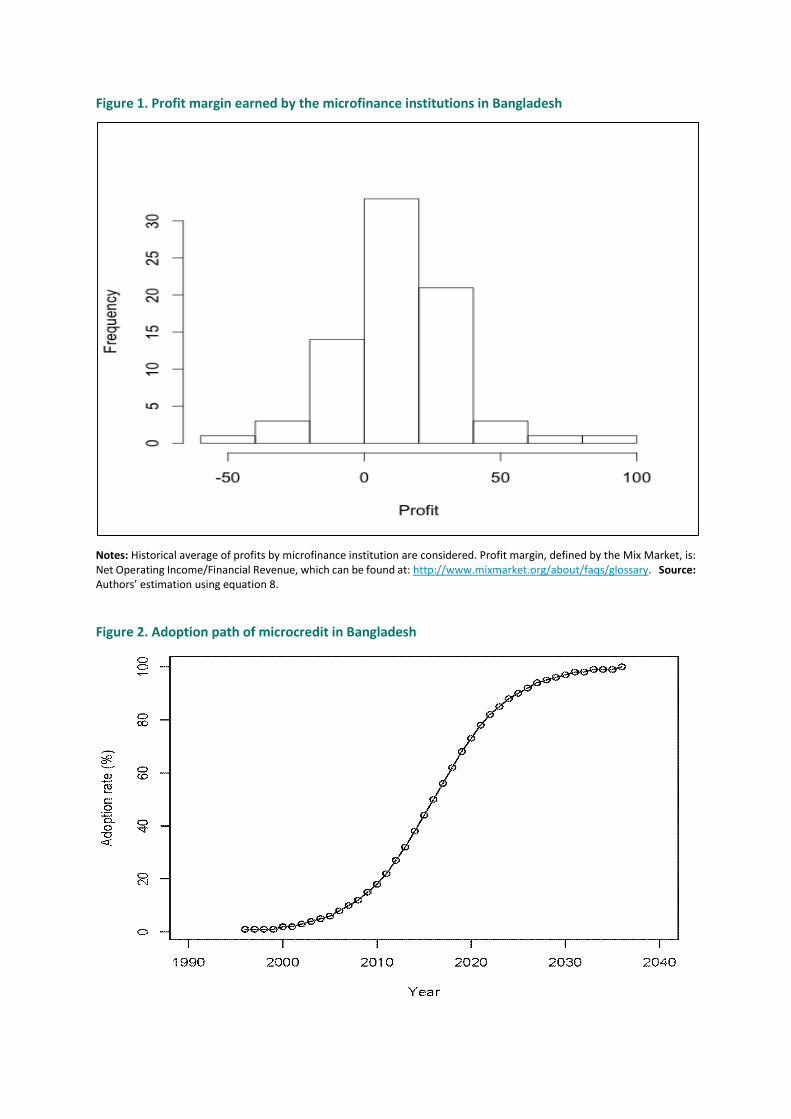
Figure 1. Profit margin earned by the microfinance institutions in Bangladesh
Notes: Historical average of profits by microfinance institution are considered. Profit margin, defined by the Mix Market, is: Net Operating Income/Financial Revenue, which can be found at: http://www.mixmarket.org/about/faqs/glossary. Source: Authors’ estimation using equation 8.
Figure 2. Adoption path of microcredit in Bangladesh
Microfinance Institutions: 𝑪(𝒘𝒐𝒘𝒏, 𝒘𝒍𝒂𝒃, 𝒘𝒐) = 𝒓𝟏𝒍𝟏
𝑥𝑜𝑤𝑛
𝑤𝑜𝑤𝑛
MFIs own input 𝑥𝑙𝑎𝑏
𝑤𝑙𝑎𝑏
Employee 𝑥𝑜
𝑤𝑜
Other inputs
Legend
Black line :Initial equilibrium
Red line :Change in initial equilibrium
Borrowers/loan consumers: 𝑪(𝒓𝟏, 𝒓𝟐, 𝒘) = 𝒑𝒚
𝑙1
𝑟1
Traditional loan market
0
𝑆𝑙1
𝐷𝑙1
𝑙2
𝑟2
Flexible loan market
𝑆𝑙2
𝐷𝑙2
𝑥
𝑤
Composite inputs
y
p
Good market
Consumer of final good
Figure 3. Impact of flexible microfinance in Bangladesh


© Copenhagen Consensus Center 2016
Bangladesh, like most nations, faces a large number of challenges. What should be the top priorities for policy makers, international donors, NGOs and businesses? With limited resources and time, it is crucial that focus is informed by what will do the most good for each taka spent. The Bangladesh Priorities project, a collaboration between Copenhagen Consensus and BRAC, works with stakeholders across Bangladesh to find, analyze, rank and disseminate the best solutions for the country. We engage Bangladeshis from all parts of society, through readers of newspapers, along with NGOs, decision makers, sector experts and businesses to propose the best solutions. We have commissioned some of the best economists from Bangladesh and the world to calculate the social, environmental and economic costs and benefits of these proposals. This research will help set priorities for the country through a nationwide conversation about what the smart - and not-so-smart - solutions are for Bangladesh's future.
For more information vis it w ww .Bangladesh -Prior it ies.com
C O P E N H A G E N C O N S E N S U S C E N T E R Copenhagen Consensus Center is a think tank that investigates and publishes the best policies and investment opportunities based on social good (measured in dollars, but also incorporating e.g. welfare, health and environmental protection) for every dollar spent. The Copenhagen Consensus was conceived to address a fundamental, but overlooked topic in international development: In a world with limited budgets and attention spans, we need to find effective ways to do the most good for the most people. The Copenhagen Consensus works with 300+ of the world's top economists including 7 Nobel Laureates to prioritize solutions to the world's biggest problems, on the basis of data and cost-benefit analysis.