Embed Size (px)
Citation preview
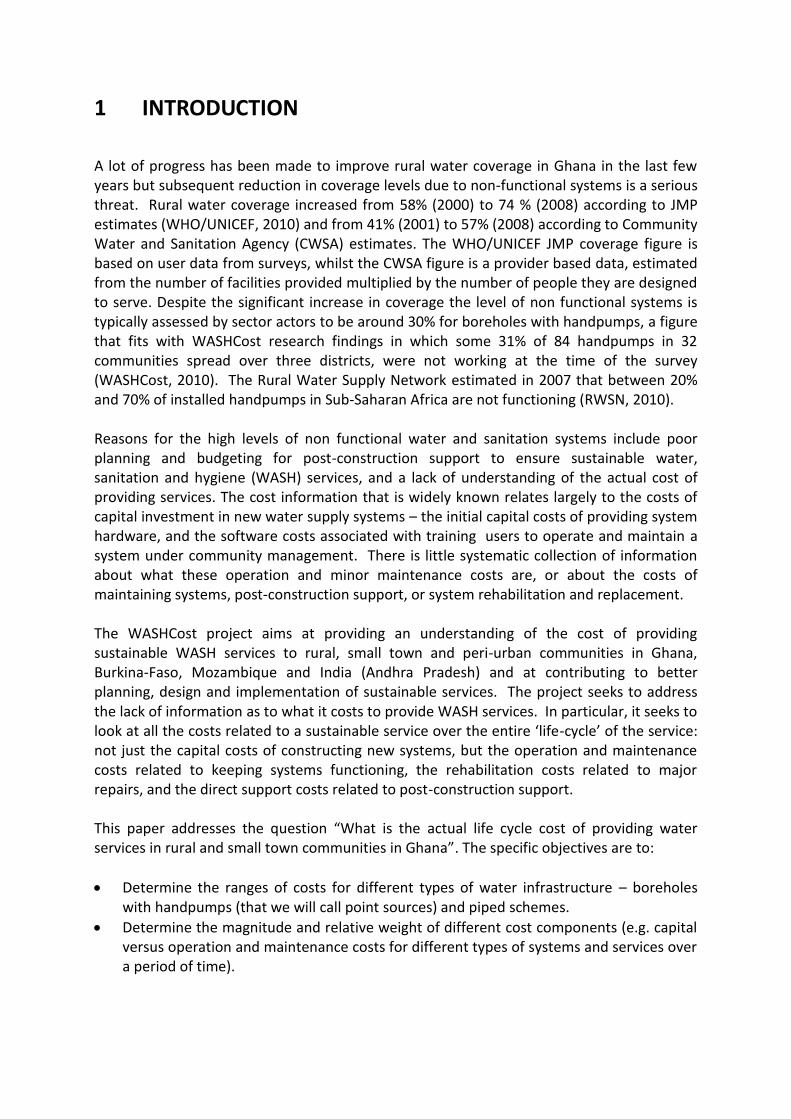
IRC Symposium 2010 Pumps, Pipes and Promises
Cost of delivering water services in rural areas
and small towns in Ghana
Nyarko K. B., Dwumfour-Asare, B., Appiah-Effah, E. and Moriarty, P.
Abstract
This study used the life-cycle costs approach (LCCA) to quantify the cost of delivering water services in rural areas and small towns in Ghana. Data was collected on capital expenditure (CapEx), which is initial capital investment cost of the water systems, operations and minor maintenance expenditure (OpEx) and capital maintenance (major repairs and rehabilitation) expenditure (CapManEx) on seventy six (76) boreholes fitted with handpumps and 17 small town piped systems drawn from five out of the ten regions in Ghana. Data was also collected on direct support costs connected with planning and installing the system (ExDS)
The magnitude and relative magnitude of the cost components are discussed for the boreholes fitted with handpumps (water point source – or WPS) and small town piped systems. The average annual cost (CapEx, OpEx, CapManEx, and ExDS) for delivering water services from small town piped water systems ranges from US$ 10 to 14 per capita per year while that for water point sources is about US$ 4 per capita per year. The study revealed that CapEx per capita for the piped water systems is twice that of the boreholes with handpumps when a design population of 300 is used. However, for piped schemes, the OpEx per capita increases by a factor of ten (10) and CapManEx by a factor of 100 compared to a borehole with a handpump. The cost of water per m3 delivered by the water point source ranges from US$ 0.01 to 0.14 whilst that for the small towns water systems ranges from USD 0.05 to USD 1.51.
The study also revealed the lack of attention to operational and minor maintenance and capital maintenance for both the borehole with handpump and the piped schemes resulting in significant levels of non-functional systems. The study recommends that cost information on OpEx and CapManEx should be used in planning and implementation to ensure that water service delivery in rural areas and small towns in Ghana is sustainable.
Keywords
Life cycle cost approach, rural, small town, water services, capital expenditure, operations and minor maintenance expenditure, capital maintenance expenditure, piped system,
handpump, point source
1 INTRODUCTION
A lot of progress has been made to improve rural water coverage in Ghana in the last few years but subsequent reduction in coverage levels due to non-functional systems is a serious threat. Rural water coverage increased from 58% (2000) to 74 % (2008) according to JMP estimates (WHO/UNICEF, 2010) and from 41% (2001) to 57% (2008) according to Community Water and Sanitation Agency (CWSA) estimates. The WHO/UNICEF JMP coverage figure is based on user data from surveys, whilst the CWSA figure is a provider based data, estimated from the number of facilities provided multiplied by the number of people they are designed to serve. Despite the significant increase in coverage the level of non functional systems is typically assessed by sector actors to be around 30% for boreholes with handpumps, a figure that fits with WASHCost research findings in which some 31% of 84 handpumps in 32 communities spread over three districts, were not working at the time of the survey (WASHCost, 2010). The Rural Water Supply Network estimated in 2007 that between 20% and 70% of installed handpumps in Sub-Saharan Africa are not functioning (RWSN, 2010). Reasons for the high levels of non functional water and sanitation systems include poor planning and budgeting for post-construction support to ensure sustainable water, sanitation and hygiene (WASH) services, and a lack of understanding of the actual cost of providing services. The cost information that is widely known relates largely to the costs of capital investment in new water supply systems – the initial capital costs of providing system hardware, and the software costs associated with training users to operate and maintain a system under community management. There is little systematic collection of information about what these operation and minor maintenance costs are, or about the costs of maintaining systems, post-construction support, or system rehabilitation and replacement. The WASHCost project aims at providing an understanding of the cost of providing sustainable WASH services to rural, small town and peri-urban communities in Ghana, Burkina-Faso, Mozambique and India (Andhra Pradesh) and at contributing to better planning, design and implementation of sustainable services. The project seeks to address the lack of information as to what it costs to provide WASH services. In particular, it seeks to look at all the costs related to a sustainable service over the entire ‘life-cycle’ of the service: not just the capital costs of constructing new systems, but the operation and maintenance costs related to keeping systems functioning, the rehabilitation costs related to major repairs, and the direct support costs related to post-construction support. This paper addresses the question “What is the actual life cycle cost of providing water services in rural and small town communities in Ghana”. The specific objectives are to:
Determine the ranges of costs for different types of water infrastructure – boreholes with handpumps (that we will call point sources) and piped schemes.
Determine the magnitude and relative weight of different cost components (e.g. capital versus operation and maintenance costs for different types of systems and services over a period of time).
The paper is organised into four sections, including this introduction. Section Two outlines the selection of the study areas and methodology. Section Three examines the costs of providing water services for the two main technologies: boreholes with handpumps (point sources) and small town piped water systems. Section Four summarises the findings and makes some policy suggestions.
2 METHODOLOGY This section first describes how the study areas were selected at the various levels (regions, district and communities). Subsequently the framework for analysing the cost of providing
water services is described using the life cycle cost approach (LCCA).
2.1 Selection of study area
The data for this study was obtained from sub-national levels, specifically the regional, district and community levels. Regions and districts were selected based on the following criteria:
Hydrogeological and hydro-climatic conditions to maximise diversity: to study different
costs for different technologies and different service levels for different hydrogeological
and climatic areas.
The presence of different Development Partners or decentralised government bodies with different implementation projects for improved water supply services and sanitation, maximising both data availability and interest in the outcomes.
The presence of different approaches by development partners/government in the implementation of projects to allow for identification of the drivers that influence the cost of service delivery.
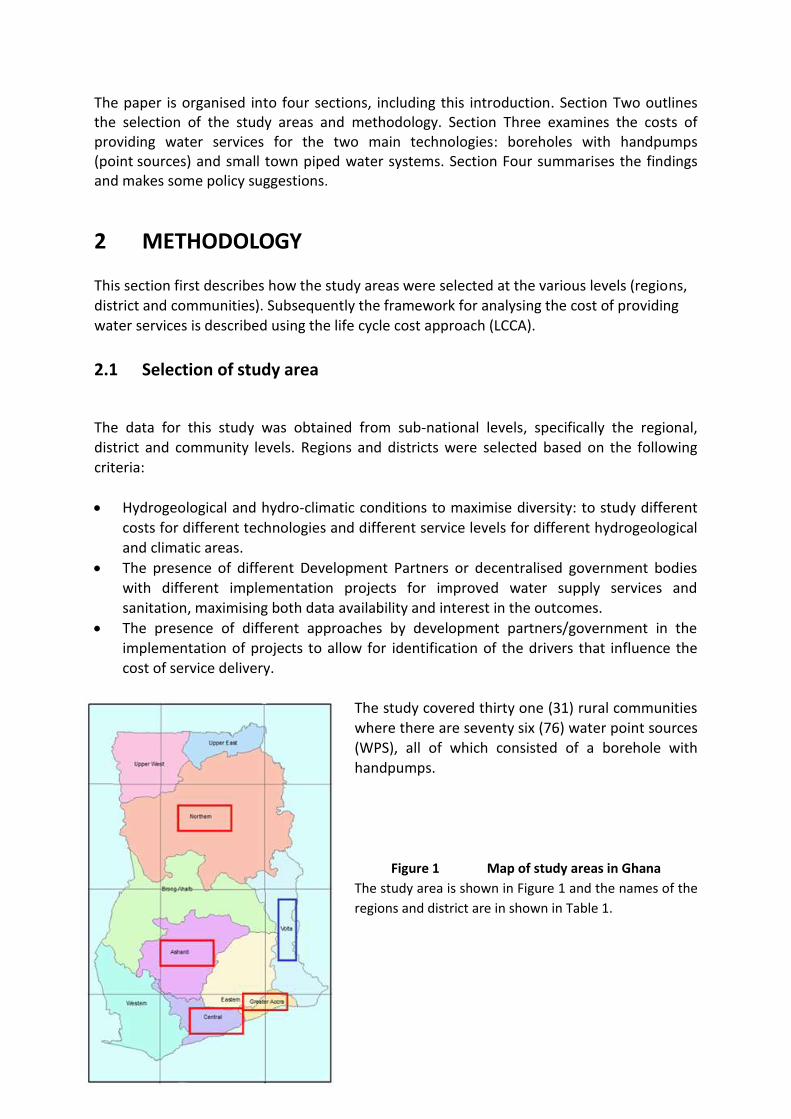
The study covered thirty one (31) rural communities where there are seventy six (76) water point sources (WPS), all of which consisted of a borehole with
handpumps.
Figure 1 Map of study areas in Ghana
The study area is shown in Figure 1 and the names of the
regions and district are in shown in Table 1.
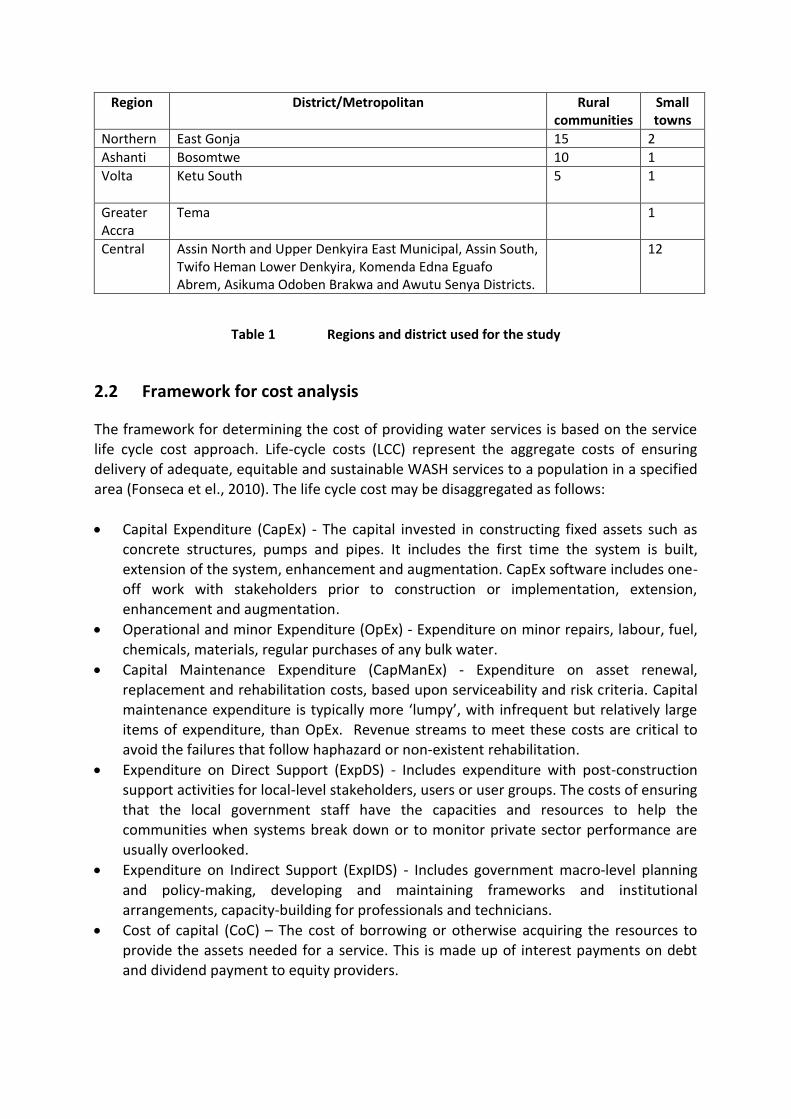
Region District/Metropolitan Rural communities
Small towns
Northern East Gonja 15 2
Ashanti Bosomtwe 10 1
Volta Ketu South 5 1
Greater Accra
Tema 1
Central Assin North and Upper Denkyira East Municipal, Assin South, Twifo Heman Lower Denkyira, Komenda Edna Eguafo Abrem, Asikuma Odoben Brakwa and Awutu Senya Districts.
12
Table 1 Regions and district used for the study
2.2 Framework for cost analysis
The framework for determining the cost of providing water services is based on the service
life cycle cost approach. Life-cycle costs (LCC) represent the aggregate costs of ensuring delivery of adequate, equitable and sustainable WASH services to a population in a specified area (Fonseca et el., 2010). The life cycle cost may be disaggregated as follows:
Capital Expenditure (CapEx) - The capital invested in constructing fixed assets such as
concrete structures, pumps and pipes. It includes the first time the system is built, extension of the system, enhancement and augmentation. CapEx software includes one-off work with stakeholders prior to construction or implementation, extension, enhancement and augmentation.
Operational and minor Expenditure (OpEx) - Expenditure on minor repairs, labour, fuel,
chemicals, materials, regular purchases of any bulk water.
Capital Maintenance Expenditure (CapManEx) - Expenditure on asset renewal,
replacement and rehabilitation costs, based upon serviceability and risk criteria. Capital maintenance expenditure is typically more ‘lumpy’, with infrequent but relatively large items of expenditure, than OpEx. Revenue streams to meet these costs are critical to avoid the failures that follow haphazard or non-existent rehabilitation.
Expenditure on Direct Support (ExpDS) - Includes expenditure with post-construction support activities for local-level stakeholders, users or user groups. The costs of ensuring that the local government staff have the capacities and resources to help the communities when systems break down or to monitor private sector performance are usually overlooked.
Expenditure on Indirect Support (ExpIDS) - Includes government macro-level planning
and policy-making, developing and maintaining frameworks and institutional arrangements, capacity-building for professionals and technicians.
Cost of capital (CoC) – The cost of borrowing or otherwise acquiring the resources to provide the assets needed for a service. This is made up of interest payments on debt and dividend payment to equity providers.
In this paper, only CapEx, OpEx, CapManEx and ExpDS have been considered. Data on the cost of capital (CoC) was not considered as information on it was not available in the regions and districts. The various cost elements were disaggregated into CapEx, OpEx, CapManEx, ExpDs and adjusted to current values (2008) using GDP deflators obtained from the World Databank (World Bank Group, 2010) and to US Dollars using the average 2008 exchange rate (1USD$=Ghc 1.06). Current CapEx was converted to per capita costs using the design population and actual population. CapManEx is summed over the years and converted to current values and is annualised using the actual life of the system. OpEx is spent annually and we have taken the average of the years for which data are available after bringing them to the current value.
Often OpEx is available for the current year only or, at best, the last three years. The OpEx and CapManEx were also converted to the annual per capita cost using the design population and actual population.
3 RESULTS
This section presents the results and analysis of the study. The cost has been disaggregated into the following components (CapEx, OpEx, CapManEx and ExpDS) for the two main technologies, water point sources (boreholes with handpumps) and small town piped schemes, which represent two different levels of service. These are the basic and
intermediate service levels defined by CWSA as follows:
Basic level of service (WPS): Water facility works 95% or more of the time in a year and
delivers at least 20 litres per capita per day (l/c/d) within 500m for 300 users per point source (CWSA, 2005).
Intermediate levels of service is a mixture of: o House connections that are designed to deliver 60 l/c/d: for 20 per cent of the
population. o Standpipes – that work 95% or more of the time in a year and deliver at least 20
l/c/d within 500m for 300 users per spout: for 80 % of the population.
In measuring the overall service level provided, ‘crowding’ is considered together with reliability, where crowding means that more people use a system than it is designed for. Service level is thus based on the number of people using a facility that has been working 95% or more of the time in the last year. The cost was measured as CapEx per capita, CapManEx per capita, OpEx per capita per year and finally cost of water per m3 for the two technologies.
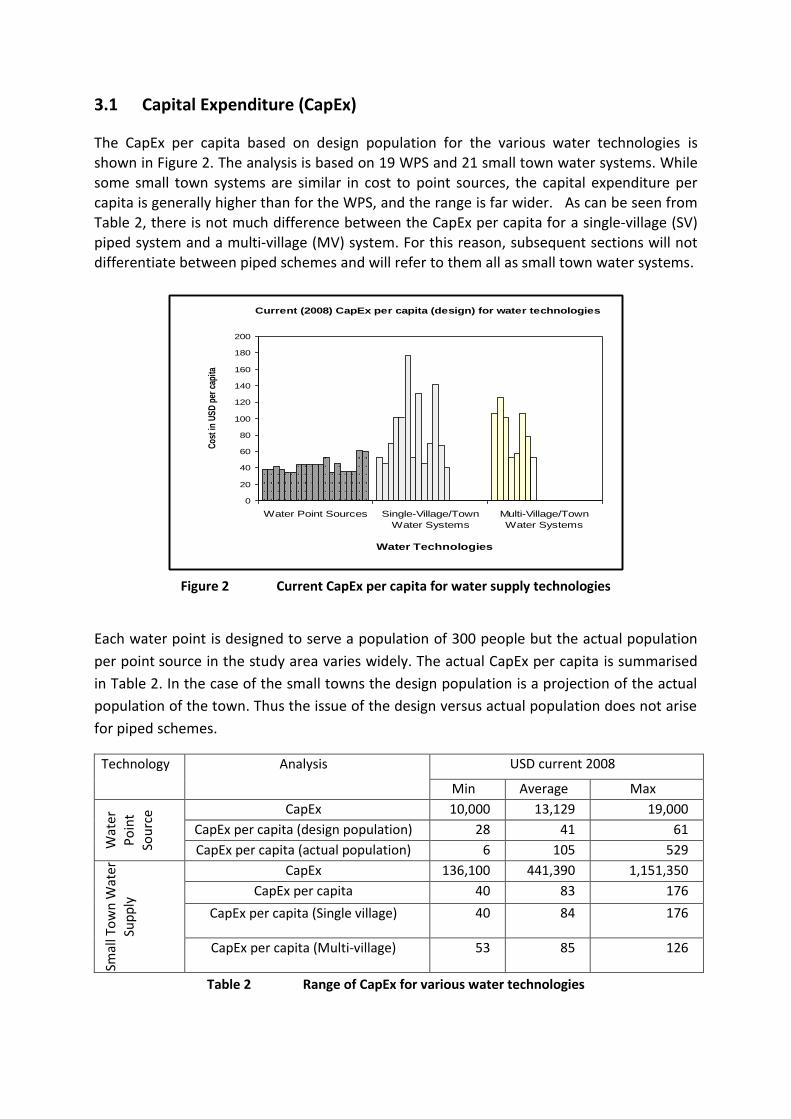
3.1 Capital Expenditure (CapEx)
The CapEx per capita based on design population for the various water technologies is shown in Figure 2. The analysis is based on 19 WPS and 21 small town water systems. While some small town systems are similar in cost to point sources, the capital expenditure per capita is generally higher than for the WPS, and the range is far wider. As can be seen from Table 2, there is not much difference between the CapEx per capita for a single-village (SV) piped system and a multi-village (MV) system. For this reason, subsequent sections will not differentiate between piped schemes and will refer to them all as small town water systems.
Current (2008) CapEx per capita (design) for water technologies
0
20
40
60
80
100
120
140
160
180
200
Water Point Sources Single-Village/Town
Water Systems
Multi-Village/Town
Water Systems
Water Technologies
Cos
t in
US
D p
er c
apita
Figure 2 Current CapEx per capita for water supply technologies
Each water point is designed to serve a population of 300 people but the actual population
per point source in the study area varies widely. The actual CapEx per capita is summarised
in Table 2. In the case of the small towns the design population is a projection of the actual
population of the town. Thus the issue of the design versus actual population does not arise
for piped schemes.
Technology Analysis USD current 2008
Min Average Max
Wat
er
Po
int
Sou
rce CapEx 10,000 13,129 19,000
CapEx per capita (design population) 28 41 61
CapEx per capita (actual population) 6 105 529
Smal
l To
wn
Wat
er
Sup
ply
CapEx 136,100 441,390 1,151,350
CapEx per capita 40 83 176
CapEx per capita (Single village) 40 84 176
CapEx per capita (Multi-village) 53 85 126
Table 2 Range of CapEx for various water technologies
The implication is that the average cost of capital expenditure per capita to provide a small town water system is twice that of the water point source when the design population of 300 is used (US$ 83 per capita against US$ 41). But the actual population of rural communities who are using the point sources varies widely from the 300 design figure – in some places the point sources are crowded and in others they are used by far fewer than 300 people (as low as 25). As a result, the actual CapEx per person for the water point sources in rural areas shows a wide range from US$ 6 to US$ 529, meaning that in some cases the CapEx per capita for the water point far exceeds the maximum of US$ 176 for the piped schemes. Indeed, the average per capita cost based on the actual population using point sources is US$ 105 about 25% higher than the average per capita costs for the piped schemes (US$ 83).
The impact of the number of people using a point source on service levels may not always be obvious. The lowest CapEx per capita in the study occurred in Kafaba No. 2 in East Gonja where the community with a population of 1,812 people has only one water point source. The large number of people using this WPS, makes the Kafaba service sub-standard with respect to crowding, and therefore, according to the WASHCost criteria (Moriarty et al, 2010), sub-standard overall. However, all inhabitants are within 500m of the WPS and only 10 per cent of inhabitants receive less than 20 l/c/d. The maximum CapEx per capita occurred in Lafamado in East Gonja where a small community with a population of 25 people has its own WPS resulting in a very high CapEx per capita. Clearly, the community at Lafamado is over-served with respect to ‘crowding’. However, 11 of the 25 people (44%)
have to travel more than 500m to reach the water point and, in a perhaps related statistic, 22 % of inhabitants received less than 20 l/c/d.
3.2 Operational and minor maintenance Expenditure (OpEx)
The operations and minor maintenance Expenditure (OpEx) was measured as actual
expenditure on the water systems. The analysis of OpEx for each year was adjusted to year
2008 using GDP deflators. The annual OpEx was determined as the average of the annual
OpEx for the years the systems had operated. The range of OpEx for the water technologies
are summarised in Table 3 based on 39 data points from water point sources and 7 data
points from small town water systems.
Technology Analysis
USD
Min Average Max
Wat
er
Po
int
Sou
rces
Annual OpEx per WPS 0 36 289
OpEx per capita per year (design pop) 0.05 0.13 0.96
OpEx per capita per year (actual pop) 0 0.13 1.33
Smal
l To
wn
Wat
er
Syst
ems Annual OpEx 18 12,000 54,243
OpEx per capita per year
0.5
2.1
8.3
Table 3 OpEx ranges for water point sources
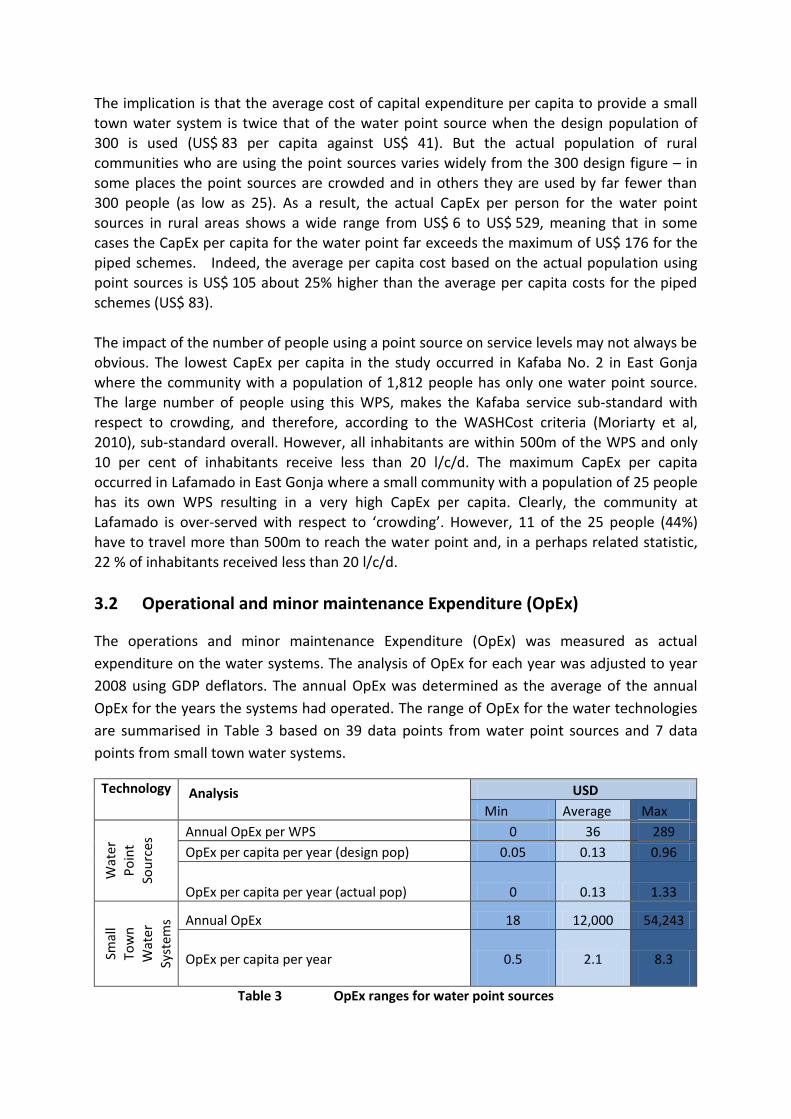
The operations and minor maintenance expenditure per capita per year based on the design
population of the WPS and the STWS is shown in Figure 3 below.
Annual OpEx per capita (design) of water supply technologies
0
0.5
1
1.5
2
2.5
3
Water Point Sources Small Town Water Systems
Water Supply Technologies
Op
Ex
in U
SD
per
cap
ita/y
r
Figure 3 Annual OpEx per capita of water systems
OpEx for piped schemes is generally higher for point sources. Almost all (38 out of 39) point
sources have OpEx less than US$ 0.5 per capita/yr; the exception being one WPS with a relatively high OpEx of US$ 1 per capita/yr, which serves a high population of 1,200 with no alternative source. It is used intensively and, as it is the only source of water, the community attends to all operational and minor maintenance activities in a timely manner. In the case of the small towns the range of OpEx is from US$ 0.49 to US$ 8.28 per capita per year with an average of US$ 2.1. The detailed ranges for OpEx for both the point sources and the small town systems are shown in Table 3. The OpEx for the small town systems is relatively high compared to that for point sources. The implication of choosing a small town piped system is to increase the OpEx per capita by
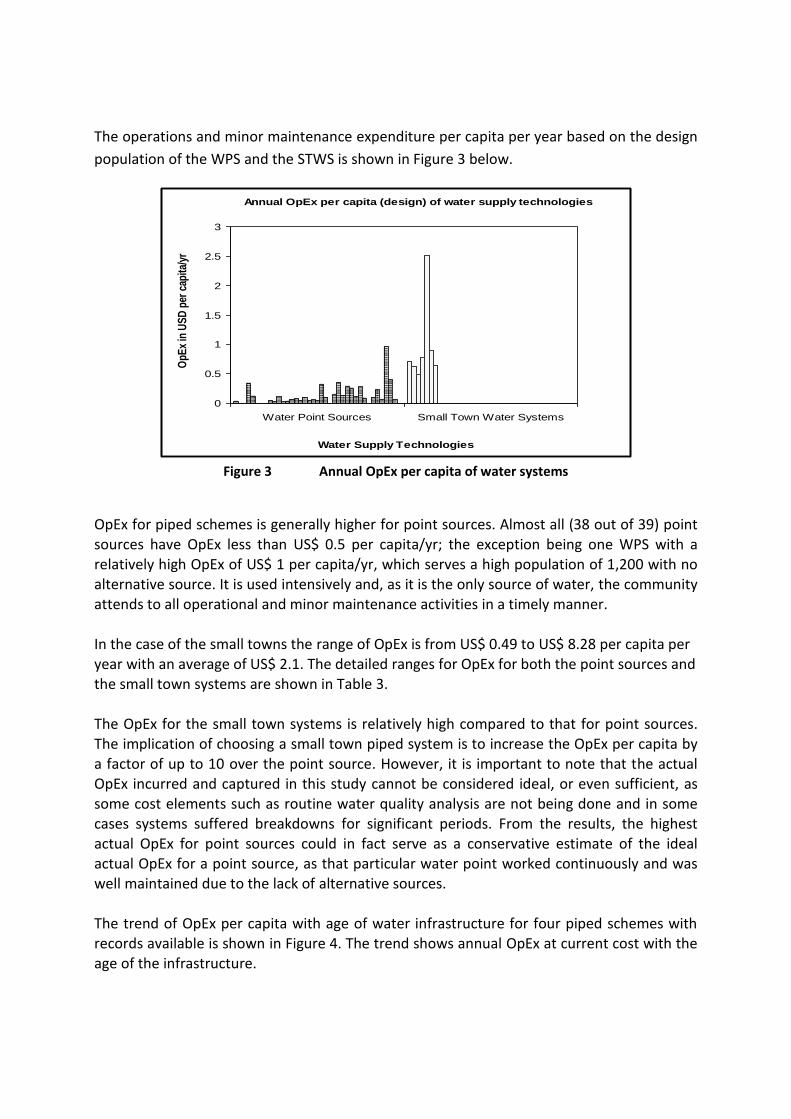
a factor of up to 10 over the point source. However, it is important to note that the actual OpEx incurred and captured in this study cannot be considered ideal, or even sufficient, as some cost elements such as routine water quality analysis are not being done and in some cases systems suffered breakdowns for significant periods. From the results, the highest actual OpEx for point sources could in fact serve as a conservative estimate of the ideal actual OpEx for a point source, as that particular water point worked continuously and was well maintained due to the lack of alternative sources. The trend of OpEx per capita with age of water infrastructure for four piped schemes with records available is shown in Figure 4. The trend shows annual OpEx at current cost with the age of the infrastructure.
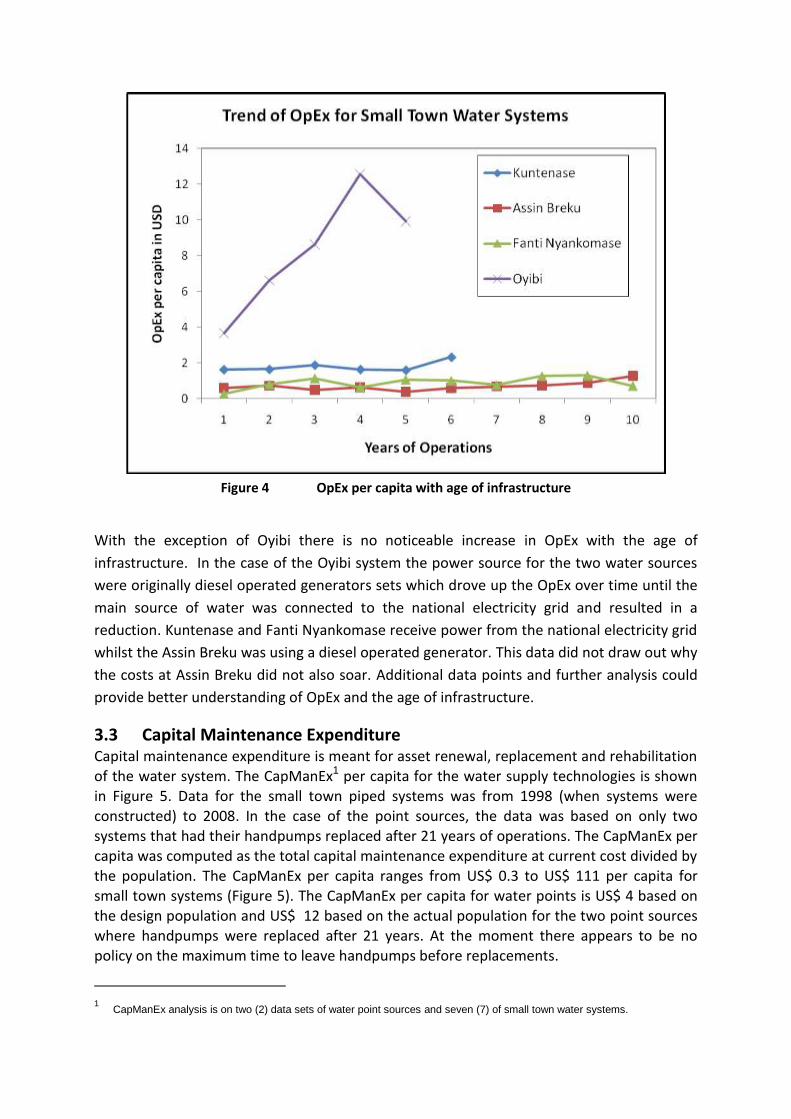
Figure 4 OpEx per capita with age of infrastructure
With the exception of Oyibi there is no noticeable increase in OpEx with the age of
infrastructure. In the case of the Oyibi system the power source for the two water sources
were originally diesel operated generators sets which drove up the OpEx over time until the
main source of water was connected to the national electricity grid and resulted in a
reduction. Kuntenase and Fanti Nyankomase receive power from the national electricity grid
whilst the Assin Breku was using a diesel operated generator. This data did not draw out why
the costs at Assin Breku did not also soar. Additional data points and further analysis could
provide better understanding of OpEx and the age of infrastructure.
3.3 Capital Maintenance Expenditure Capital maintenance expenditure is meant for asset renewal, replacement and rehabilitation of the water system. The CapManEx1 per capita for the water supply technologies is shown in Figure 5. Data for the small town piped systems was from 1998 (when systems were constructed) to 2008. In the case of the point sources, the data was based on only two systems that had their handpumps replaced after 21 years of operations. The CapManEx per capita was computed as the total capital maintenance expenditure at current cost divided by the population. The CapManEx per capita ranges from US$ 0.3 to US$ 111 per capita for small town systems (Figure 5). The CapManEx per capita for water points is US$ 4 based on the design population and US$ 12 based on the actual population for the two point sources where handpumps were replaced after 21 years. At the moment there appears to be no policy on the maximum time to leave handpumps before replacements.
1 CapManEx analysis is on two (2) data sets of water point sources and seven (7) of small town water systems.
CapManEx of Water Systems
-
20.00
40.00
60.00
80.00
100.00
120.00
Small Town Water Systems Water Point Sources
Water Systems
Co
st in
US
D p
er c
apit
a
Figure 5 CapManEx per capital for the water systems
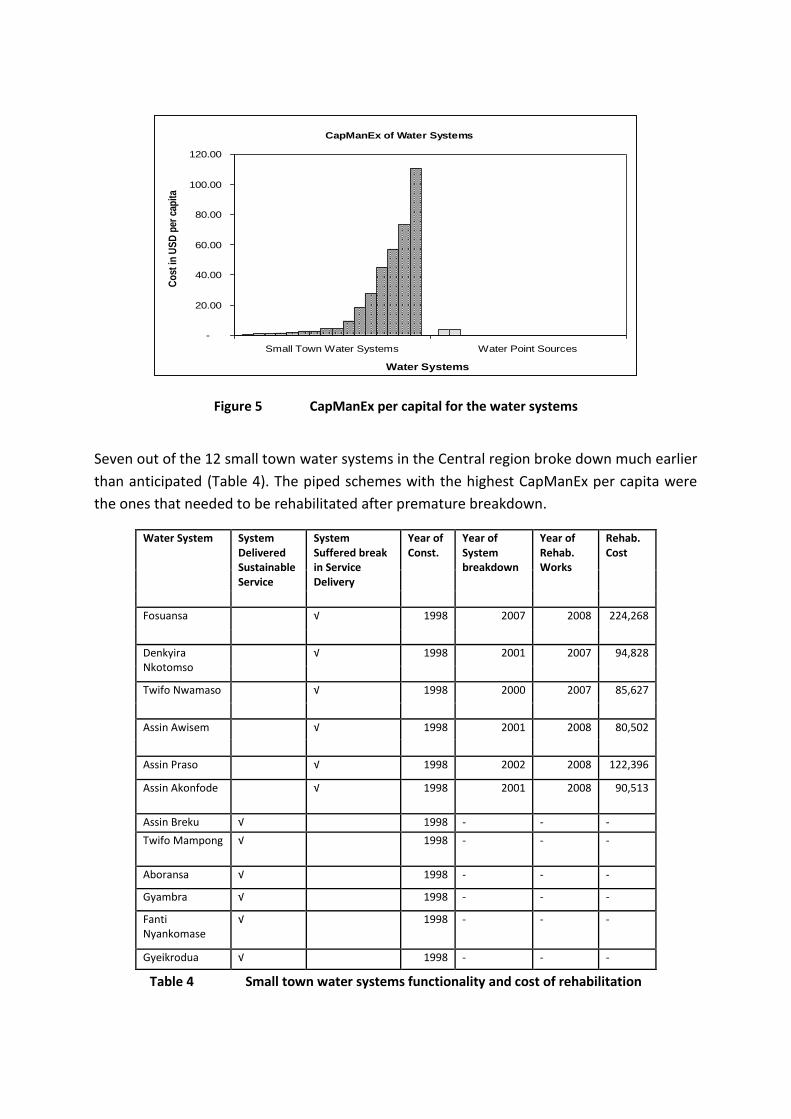
Seven out of the 12 small town water systems in the Central region broke down much earlier
than anticipated (Table 4). The piped schemes with the highest CapManEx per capita were
the ones that needed to be rehabilitated after premature breakdown.
Water System System Delivered Sustainable Service
System Suffered break in Service Delivery
Year of Const.
Year of System breakdown
Year of Rehab. Works
Rehab. Cost
Fosuansa √ 1998 2007 2008 224,268
Denkyira Nkotomso
√ 1998 2001 2007 94,828
Twifo Nwamaso √ 1998 2000 2007 85,627
Assin Awisem √ 1998 2001 2008 80,502
Assin Praso √ 1998 2002 2008 122,396
Assin Akonfode √ 1998 2001 2008 90,513
Assin Breku √ 1998 - - -
Twifo Mampong √ 1998 - - -
Aboransa √ 1998 - - -
Gyambra √ 1998 - - -
Fanti Nyankomase
√ 1998 - - -
Gyeikrodua √ 1998 - - -
Table 4 Small town water systems functionality and cost of rehabilitation
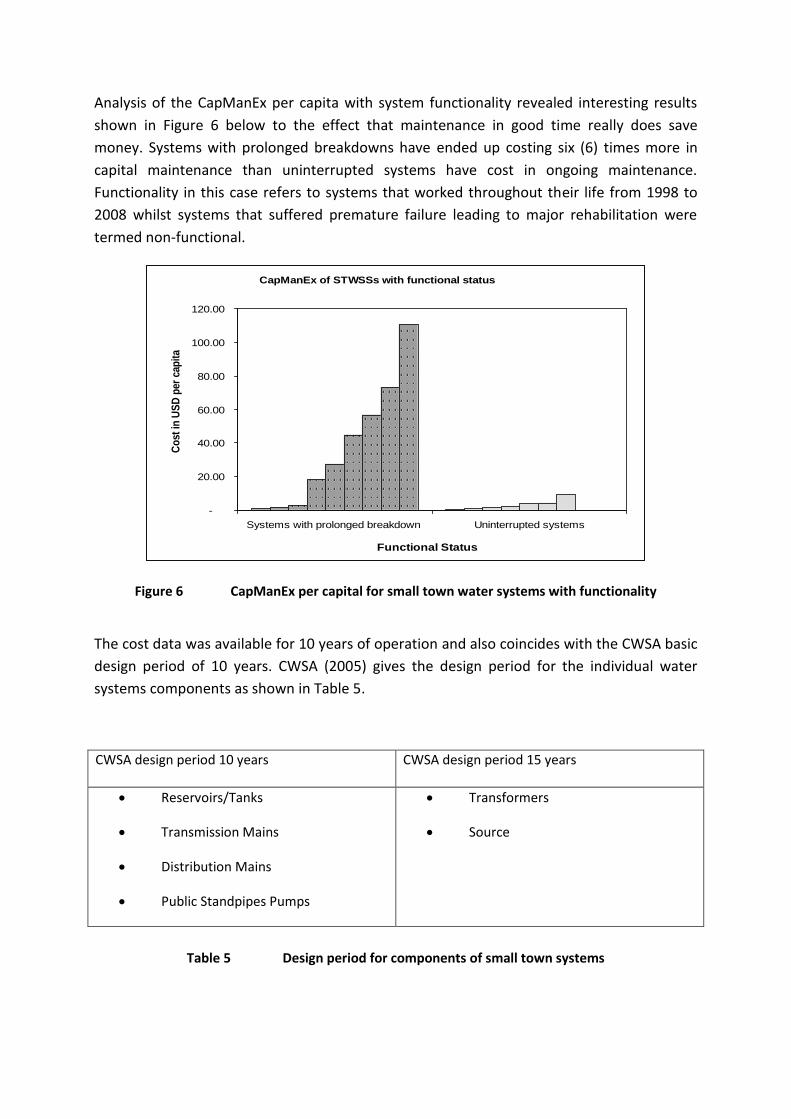
Analysis of the CapManEx per capita with system functionality revealed interesting results
shown in Figure 6 below to the effect that maintenance in good time really does save
money. Systems with prolonged breakdowns have ended up costing six (6) times more in
capital maintenance than uninterrupted systems have cost in ongoing maintenance.
Functionality in this case refers to systems that worked throughout their life from 1998 to
2008 whilst systems that suffered premature failure leading to major rehabilitation were
termed non-functional.
CapManEx of STWSSs with functional status
-
20.00
40.00
60.00
80.00
100.00
120.00
Systems with prolonged breakdown Uninterrupted systems
Functional Status
Co
st in
US
D p
er c
apit
a
Figure 6 CapManEx per capital for small town water systems with functionality
The cost data was available for 10 years of operation and also coincides with the CWSA basic
design period of 10 years. CWSA (2005) gives the design period for the individual water
systems components as shown in Table 5.
CWSA design period 10 years CWSA design period 15 years
Reservoirs/Tanks
Transmission Mains
Distribution Mains
Public Standpipes Pumps
Transformers
Source
Table 5 Design period for components of small town systems

This does not mean that after 10 years all key components should be replaced. The results show that systems that suffered prolonged breakdowns incurred relatively large CapManEx per capita. It was also realised that CapManEx was mainly in response to major breakdown as witnessed in the systems that broke down. All the three small town piped systems powered by solar failed because problems related to the solar panels could not be addressed at the community level. Technical challenges related to the water sources (surface water source, poor yielding borehole) were also cited as reasons contributing to system failures. Small town systems that relied on surface water had problems with the intake. The lack of mechanisms to address the technical challenges (including funds to pay for the services)
contributed to the breakdown of the water service delivery. Failure to address these problems on time led to major rehabilitation that required huge investment to restore the water service delivery later. CapManEx was also annualised by dividing the total CapManEx at current costs by the age of the water facility, which in this case was ten years for piped schemes and 21 years for the point sources. The results of CapManEx for the various technologies in the different forms are summarised in Table 6 below.
Analysis CapManEx per capita CapManEx per capita per year
Min Average Max Min Average Max
WPS (USD) actual pop 12 12 12 0.1 0.1 0.1
WPS (USD) -design pop 4 4 4 0.4 0.4 0.4
Small town piped systems (USD) 0.3 22 111 0.1 3 11
Small town systems working (USD) 0 3 9 0 1 2
STWS long break in service (USD) 1 37 111 0 4 11
Table 6 Range of CapManEx for water systems
The results for small town systems show a range between US$ 0.1 and US$ 11 per capita/yr, while that of point courses is US$ 0.1 per capita/yr based on the cost of replacing handpumps at two water points sources. The replacement of handpumps, which is the main capital maintenance expenditure for points sources, does not occur in a systematic manner. Out of the 76 WPS in the study area, only 2 handpumps were found to have been replaced after 21 years of working, one having been installed by an NGO and the other by a CWSA facilitated project. These replacements were not planned but became possible because of an NGO presence. There are handpumps more than 30 years old in the study areas for both functional and non functional systems.
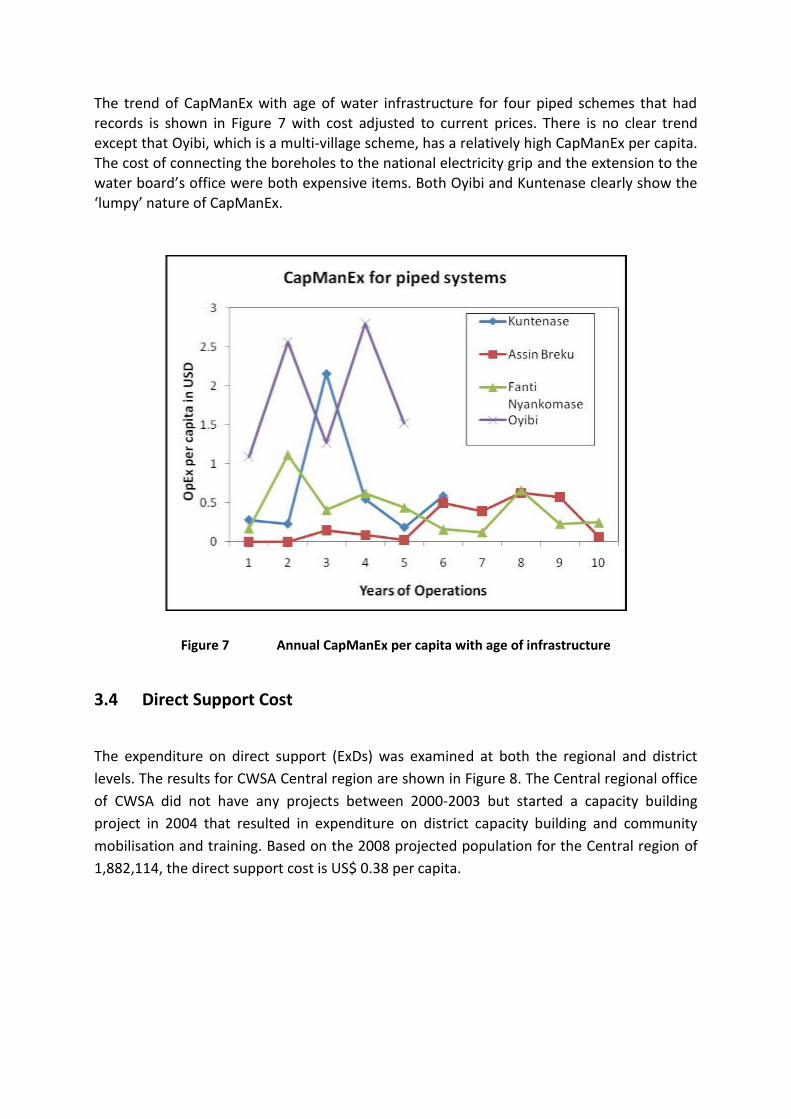
The trend of CapManEx with age of water infrastructure for four piped schemes that had records is shown in Figure 7 with cost adjusted to current prices. There is no clear trend except that Oyibi, which is a multi-village scheme, has a relatively high CapManEx per capita. The cost of connecting the boreholes to the national electricity grip and the extension to the water board’s office were both expensive items. Both Oyibi and Kuntenase clearly show the ‘lumpy’ nature of CapManEx.
Figure 7 Annual CapManEx per capita with age of infrastructure
3.4 Direct Support Cost
The expenditure on direct support (ExDs) was examined at both the regional and district
levels. The results for CWSA Central region are shown in Figure 8. The Central regional office
of CWSA did not have any projects between 2000-2003 but started a capacity building
project in 2004 that resulted in expenditure on district capacity building and community
mobilisation and training. Based on the 2008 projected population for the Central region of
1,882,114, the direct support cost is US$ 0.38 per capita.
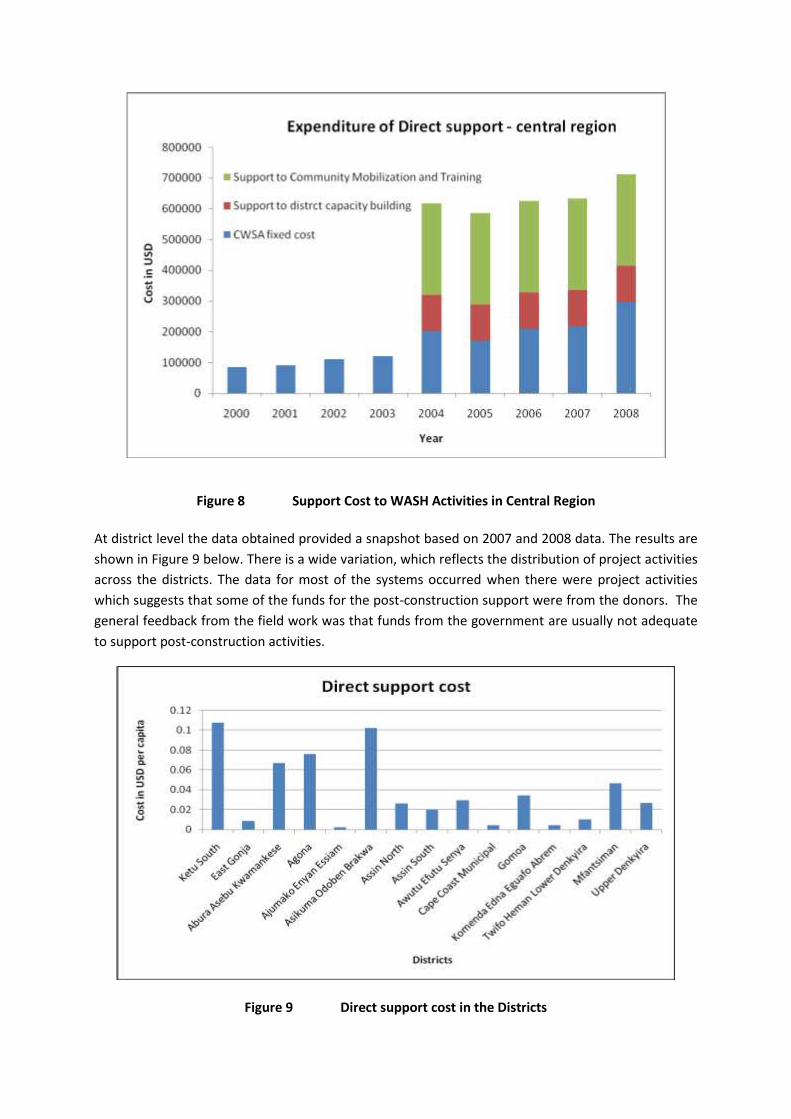
Figure 8 Support Cost to WASH Activities in Central Region
At district level the data obtained provided a snapshot based on 2007 and 2008 data. The results are
shown in Figure 9 below. There is a wide variation, which reflects the distribution of project activities
across the districts. The data for most of the systems occurred when there were project activities
which suggests that some of the funds for the post-construction support were from the donors. The
general feedback from the field work was that funds from the government are usually not adequate
to support post-construction activities.
Figure 9 Direct support cost in the Districts
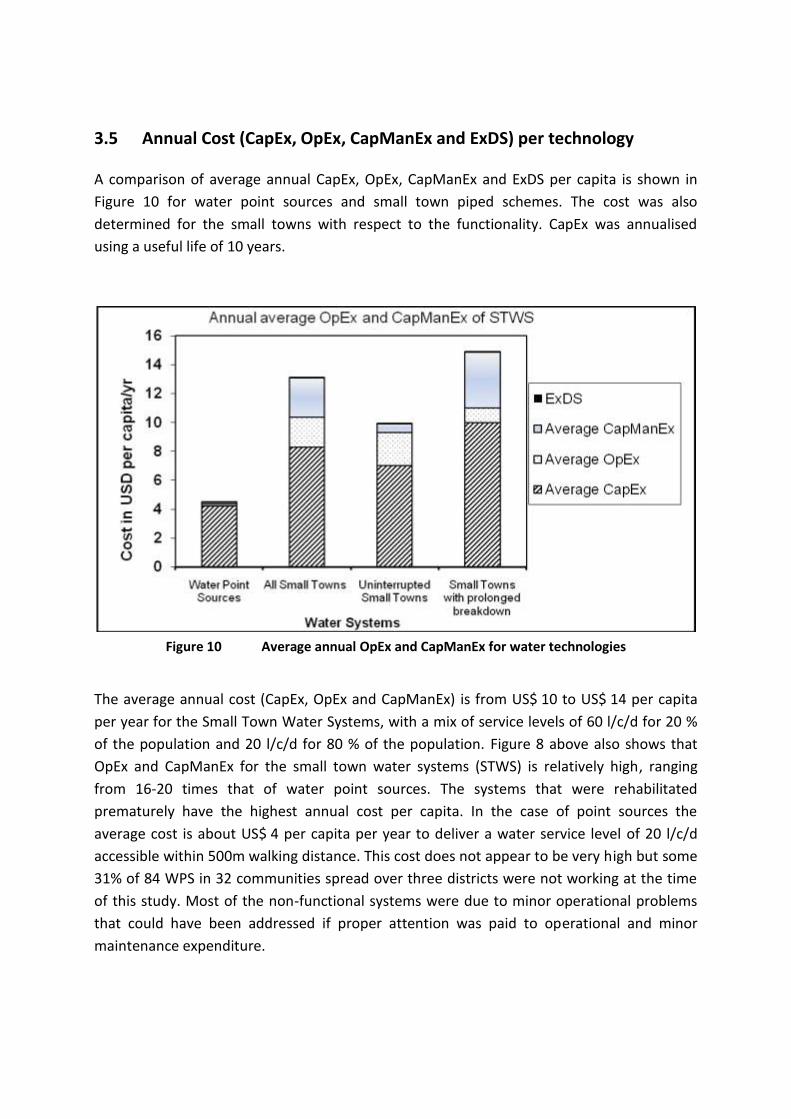
3.5 Annual Cost (CapEx, OpEx, CapManEx and ExDS) per technology
A comparison of average annual CapEx, OpEx, CapManEx and ExDS per capita is shown in
Figure 10 for water point sources and small town piped schemes. The cost was also
determined for the small towns with respect to the functionality. CapEx was annualised
using a useful life of 10 years.
Figure 10 Average annual OpEx and CapManEx for water technologies
The average annual cost (CapEx, OpEx and CapManEx) is from US$ 10 to US$ 14 per capita
per year for the Small Town Water Systems, with a mix of service levels of 60 l/c/d for 20 %
of the population and 20 l/c/d for 80 % of the population. Figure 8 above also shows that
OpEx and CapManEx for the small town water systems (STWS) is relatively high, ranging
from 16-20 times that of water point sources. The systems that were rehabilitated
prematurely have the highest annual cost per capita. In the case of point sources the
average cost is about US$ 4 per capita per year to deliver a water service level of 20 l/c/d
accessible within 500m walking distance. This cost does not appear to be very high but some
31% of 84 WPS in 32 communities spread over three districts were not working at the time
of this study. Most of the non-functional systems were due to minor operational problems
that could have been addressed if proper attention was paid to operational and minor
maintenance expenditure.
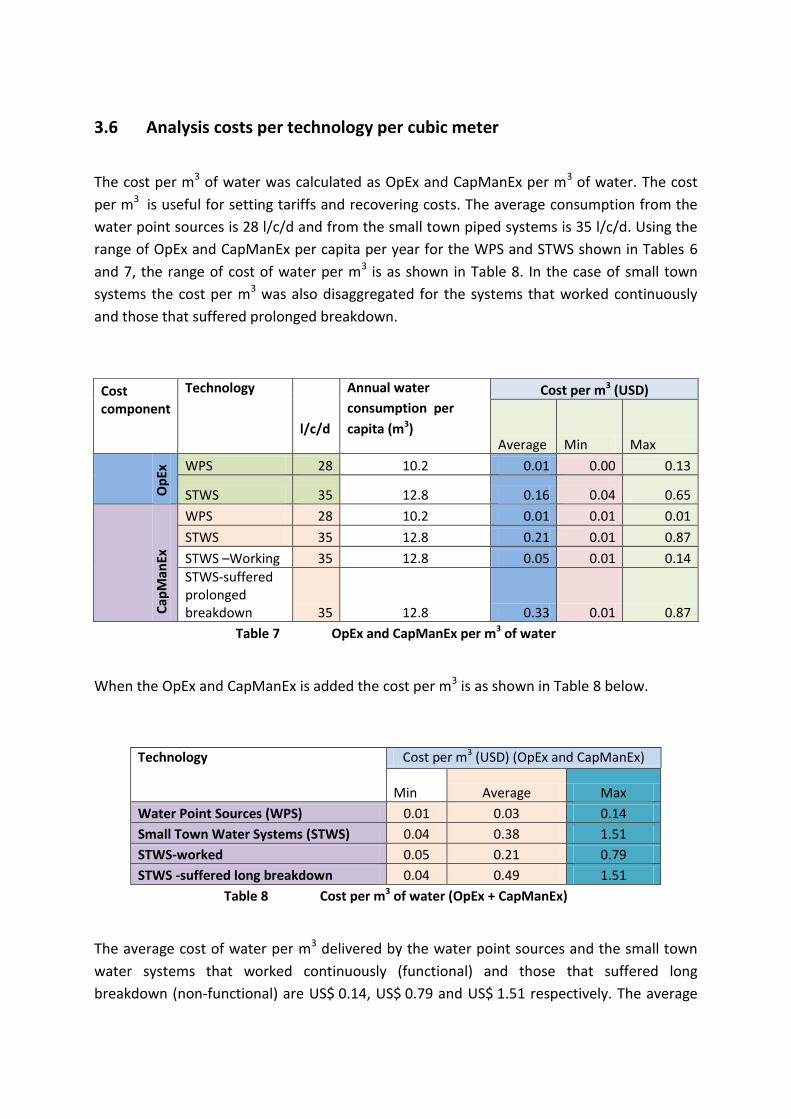
3.6 Analysis costs per technology per cubic meter
The cost per m3 of water was calculated as OpEx and CapManEx per m3 of water. The cost
per m3 is useful for setting tariffs and recovering costs. The average consumption from the
water point sources is 28 l/c/d and from the small town piped systems is 35 l/c/d. Using the
range of OpEx and CapManEx per capita per year for the WPS and STWS shown in Tables 6
and 7, the range of cost of water per m3 is as shown in Table 8. In the case of small town
systems the cost per m3 was also disaggregated for the systems that worked continuously
and those that suffered prolonged breakdown.
Table 7 OpEx and CapManEx per m3 of water
When the OpEx and CapManEx is added the cost per m3 is as shown in Table 8 below.
Technology
Cost per m3 (USD) (OpEx and CapManEx)
Min Average Max
Water Point Sources (WPS) 0.01 0.03 0.14
Small Town Water Systems (STWS) 0.04 0.38 1.51
STWS-worked 0.05 0.21 0.79
STWS -suffered long breakdown 0.04 0.49 1.51
Table 8 Cost per m3 of water (OpEx + CapManEx)
The average cost of water per m3 delivered by the water point sources and the small town
water systems that worked continuously (functional) and those that suffered long
breakdown (non-functional) are US$ 0.14, US$ 0.79 and US$ 1.51 respectively. The average
Cost component
Technology
l/c/d
Annual water
consumption per
capita (m3)
Cost per m3 (USD)
Average Min Max
Op
Ex WPS 28 10.2 0.01 0.00 0.13
STWS 35 12.8 0.16 0.04 0.65
Cap
Man
Ex
WPS 28 10.2 0.01 0.01 0.01
STWS 35 12.8 0.21 0.01 0.87
STWS –Working 35 12.8 0.05 0.01 0.14
STWS-suffered prolonged breakdown 35 12.8 0.33 0.01 0.87

cost for the small towns systems is relatively high even though the small town water systems
are designed to deliver the same level of service as the water point sources to 80% of the
population.
4 CONCLUSION
The life cycle cost method produces robust and easily comparable figures for the cost of providing rural and small town water services. The CapEx per capita based on the design
population ranges from US$ 28-61 for providing water point systems (boreholes with handpumps) and US$ 40-176 per capita for providing small town piped systems. However, in practice the actual population served by the water points is very different from the design norms (which is not the case for the piped schemes) making the actual CapEx per capita range from US$ 5-529 per capita served. In some case the actual CapEx per capita for the borehole with handpump is higher than for the piped schemes. The cost of water per m3 delivered by the point sources ranges from US$ 0.01 to US$ 0.14, and that for small town systems ranges from US$ 0.05 to US$ 1.51. The average annual cost (CapEx, OpEx and CapManEx) for delivering water services from the small towns piped scheme is from US$ 8 to US$ 11 per capita per year while that for water point sources is
about US$ 4 per capita per year. The implications of a choice of piped schemes over boreholes with handpump means CapEx per capita will double (based on design population), OpEx will increase by a factor of ten and CapManEx by a factor of 100. The cost of the water per m3 will also increase by a factor of ten. In practice the research suggests that the costs per capita are already higher for point source systems than the design population suggests.
The study also revealed that, in practice, there is a serious lack of attention to ongoing operational and minor maintenance and capital maintenance for both water points with handpumps and piped systems. This is shown by the significant levels of non-functioning
systems. The corollary is that it is probably the upper ends of the ranges for OpEx and CapManEx that provide a ‘true’ indication of the costs of providing sustainable services. In summary, the following recommendations are made, based on this study:
District Water and Sanitation Plans (DWSP) should clearly plan and budget for CapEx, OpEx,
CapManEx and ExpIS costs for all proposed technological and service level options
The Community Water and Sanitation Agency should provide guidance for the routine
replacement of handpumps as a key part of capital maintenance expenditure for rural water
service delivery.
5 REFERENCES
CWSA, 2004. Small Towns Sector Policy, Design Guidelines. Community Water and Sanitation Agency,
Ministry of Works and Housing Ghana. Government of Ghana.
CWSA, 2005. Small Communities Water and Sanitation Sector Policy, Design Guidelines. Community
Water and Sanitation Agency, Ministry of Works and Housing Ghana. Government of Ghana.
Fonseca, C. et al., 2010. Life-Cycle Costs Approach: Glossary and Cost Components. Briefing Note 1,
IRC International Water and Sanitation Centre, The Hague, The Netherlands. Available at
http://www.washcost.info/page/75 [Accessed 2 November 2010].
Moriarty, P. et al., 2010. Ladders for assessing and costing water service delivery. WASHCost Working
Paper 2, IRC International Water and Sanitation Centre, The Hague, The Netherlands.
http://www.washcost.info/page/753 [Accessed 2 November 2010].
RWSN, 2010. Handpump Data. Rural Water Supply Network. Available from
http://www.rwsn.ch/prarticle.2005-10-25.9856177177/prarticle.2005-10-
26.9228452953/prarticle.2009-03-09.1365462467 [Accessed 2 November 2010].
WASHCost Ghana Survey, 2010. Awaiting publication.
WHO/UNICEF, 2010. Joint Monitoring Programme for Water Supply and Sanitation (2010) Estimates
for the use of Drinking Water Sources in Ghana. World Health Organization & United Nations
Children’s Fund.
Available online at http://wssinfo.org/resources/documents.html?type=country_files [Accessed 2
November 2010].
World Bank Group, 2010. World Development Indicators (WDI). Available from:
http://data.worldbank.org/data-catalog [Accessed 2 November 2010].
6 CONTACT DETAILS
Kwame Nkrumah University of Science and Technology
Kumasi, Ghana
Department of Civil Engineering
K. Nyarko [email protected]
B. Dwumfour-Asare [email protected]
E. Appiah-Effah [email protected]
IRC International Water and Sanitation Centure
The Hague, The Netherlands
P. Moriary [email protected]
7 APPENDIX
7.1 Cost formulae
The procedure for adjusting past cost information to current cost is using CapEx as an
example is as follows:
2008
CyCapEx (2008)year current CapEx toGDPI
GDPDICy, or
GDPDM CyCapEx (2008)year current CapEx to
Where:
CyCapEx = CapEx in the construction year (cy)
CyGDPDI = GDP Deflator Index for the construction year of the facility
2008GDPI = GDP Deflator Index for the current year, 2008
GDPDM = GDP Deflator Multiplier to convert CyCapEx to current year (2008) prices
The annual Capital Maintenance expenditure per capita was computed as follows:
PY 2008CapManEx
capitaper CapManEx Annual,
Where:
2008CapManEx = Cumulative CapManEx in the current year (2008) price
Y = age of the facility up to the current year (2008) P = population of users which could be the design or actual The average annual operational cost per facility was computed as:
Average annual operational cost, GDPDy
N
y
yav MOpExN
1
1 OpEx
Where:
avOpEx = average annual OpEx
yOpEx = OpEx in a particular year, y
GDPDyM = GDP Deflator Multiplier to convert yOpEx to current year (2008) price
N
y 1
= sum of the product of OpExy in a particular year (y) and the GDP Deflator Multiplier to
current price N = number of recurrent cost years starting from first, second, etc. ( Nyyy ...,2,1 ).
y = various years when recurrent cost (including zero cost) were incurred ( Nyyy ...,2,1 )

7.2 Acronyms
CapEx Capital Expenditure
CapManEx Capital Maintenance Expenditure
CoC Cost of capital
CWSA Community Water and Sanitation Agency
DA District Assemblies
DWSP District Water and Sanitation Plans
DWST District Water and Sanitation Team
ExpDS Expenditure on Direct Support
GDP Gross domestic product
LCC Life-cycle costs
LCCA Life-cycle costs approach
MV Multi-village
NCWSP National Community Water and Sanitation Programme
O&M Operation and (minor) Maintenance
RWST Regional Water and Sanitation Team
OpEx Operating and Minor Maintenance Expenditure
SV Single Village
STWS Small Towns Water Systems
WASH Water, Sanitation and Hygiene
WHO World Health Organization
WPS Water Point Sources
WSDB Water and Sanitation Development Board